Embed Size (px)
Citation preview
1. INTRODUCTION As it is well known that, sails are instruments that use the wind to propel a vessel in water. A vessel can sail at different angles to the wind by trimming. The wind has four different effects on a sailboat. First of all, the wind drives the boat ahead and laterally, it heels the boat over, and lastly, turns it around, according to the balance of her sails, distribution of weight. The proper handling of sails and rudder enables the sailor to utilize these effects of the wind that she/he may sail her/his boat in any direction. The performance of a sailboat depends on aerodynamics and hydrodynamics forces affected the sailboat. Figure 1 shows the important forces for a sailboat. The upper image in Figure 1 shows the movement direction of the sailboat. In this figure the angles between sail beam and aerodynamics/hydrodynamics forces are clearly seen. Bending moment due to aerodynamics forces, deadweight and lifting forces are balanced with uprighting moment. This performance index is dependent on both the speed of the boat and the true sailing course, which in turn are dependent on the aerodynamic and hydrodynamic forces produced by the sails and the hull. In general, the windward performance of the boat can be improved by reducing the resistance of the hull and the drag of the sails. However changes in the aerodynamic and hydrodynamic forces alter the equilibrium of the sail boat which then has to adjust its speed. Hence, the design of sailing yachts has to be carried out in an environment where the analysis and design procedures for the sails and the hull are integrated to realize a meaningful overall design. When a hull navigates in sea there will be drag and lift. There are two theories to explain the phenomenon of lift over the top of an airfoil. These are Bernoulli and Euler theories.
COMPUTATIONAL ANALYSIS OF WIND VELOCITY AND DIRECTION EFFECTS ON A SAIL
Seyfettin Bayraktar, Y.Hakan Özdemir, Tamer Yılmaz,
Yildiz Technical University Mechanical Engineering Faculty
Dept. of Naval Architecture and Marine Engineering, İstanbul, TURKIYE
SUMMARY In this paper, flow characteristics around a sail and its performance are taken into account. Drag and lift coefficients for different wind angles are obtained by using computational fluid dynamics (CFD). The sail geometry is generated by using of SAILCUT and mesh structure formed in a preprocessor GAMBIT. Numerical analyses are carried out by using a commercial CFD package of FLUENT which uses finite volume method as discretisation scheme. The working domain is s three-dimensional and the flow is taken as fully turbulent. Keywords: sail, naval architecture, CFD, marine engineering
When the boat sails into the wind, the bow is pointed into the apparent wind, which is the vector resolution of the true wind and the boat course. The sail in the wind acts as an airfoil and the hull in the water acts as a hydrofoil, so there are two sets of forces acting on a sailboat: Aerodynamic and hydrodynamic. Helvacıoğlu and Insel [1] obtained aerodynamic sail data from a towing tank tests and they used these experimental data to investigate the effect of heel angle and leeway angle on the resistance and sideforce generated by the hull. They concluded that the effect of heel is generally increasing the resistance, but no conclusions on the behavior of resistance increment could be drawn from their experiments. As it is reported sideforce is proportional to the leeway angle. Decrease of sideforce can be observed if separation is encountered. Induced resistance is proportional to leeway angle, or square of the sideforce. Richards and Mallinson [2] performed a computational study to investigate the wind flow around a mainsail and a spinnaker by using a body fitted grid that is fitted to the sail shapes provided by a sail design programme. A simpler straight flow situation has been used to investigate the flow interactions between the sails and it is found that while under some situations this interaction is significant, under normal sailing situations the interaction is quite small. It is shown that the thrust and side force coefficients with twisted flow are similar to those with straight flow if referenced to the masthead apparent wind speed and direction. Gray [3] presented a study to show how air flows around a sail and to explain why a dinghy is able to move towards the wind rather than be blown backwards. He also illustrates the effects of altering the angle of the sail, using different sail shapes and using a rig consisting of two sails.
Session A 151

Figure 1 Forces on a sailing yacht [4].
Session A 152

From his experiments it can be seen that a boat is able to sail into the wind with an aerofoil shaped sail set at 250 to 300 to the wind direction because of the forces created by the different pressures on either side of the sail. Too large a curve at the front of the sail reduces the efficiency of the rig because the angle between the wind and the direction of travel is increased. Smaller sail increases the area of the rig and so increases the pressure difference, giving greater boat speed. Richards et al. [5] investigated drag and lift forces to maximize the trust by trimming the spinner especially for typical America’s Cup class yachts. They stated that the normal downwind apparent wind angles are between 900 and 1350 in winds over 5 m/s. Under such conditions the thrust is maximized by trimming the spinnaker to give its maximum lift and the mainsail to provide approximately equal amounts of lift and drag. It is therefore concluded that America’s Cup downwind sails need to act both as vertical wings and horizontal parachutes. Viscous flows around sail-like rigid wings are calculated by using a CFD tool and analyzed experimentally by Yoo and Kim [6]. Lift, drag and thrust forces are estimated for various conditions of gap distance between the two sails and the center of effort of the sail system are obtained. Wind tunnel experiments are also carried out to measure aerodynamic forces acting on the sail system and to validate the computation. It is found that the combination of two sails produces the lift force larger than the sum of that produced separately by each sail and the gap distance between the two sails is an important factor to determine total lift and thrust. They concluded that it is quite certain that CFD can be a very powerful and useful tool for the aero- and hydrodynamic performance prediction of sailing yacht in basic design stage. Clauss and Heissen [7] analyzed the flying shape of a mainsail and a jib by using CFD and they concluded that at greater apparent wind angles the flow was not stationary. This study deals with occurred aerodynamics forces due to different wind angles and velocities. During the computational analysis the sail is considered as a rigid body. The analyses are performed for three different wind velocity; 5, 7.5 and 10 knot, respectively. For each velocity value, the effect of wind angles are investigated from 00 to 900 by 7.50 increments. A complimentary series of computational studies has been conducted to help understand the effect of angle between the sail and the wind direction and velocity values.
2. MATHEMATICAL MODEL In this simulation, the sail under consideration is generated by SAILCUT package. As a general knowledge, parts of a sail are given in Fig. 3 and the main dimensions are summarized in Table 1. The geometry of the sail can be defined by other parameters to produce realistic and actual operating conditions. For the each section of sails, typical parameters such as chord length, camber and mast angles are selected as
given in Table 1 and the remaining surface of the sails between the sections are interpolated from the information on each sections.
Table 1 Main dimensions of the sail
Luff Length (m) 8 Luff Round (m) 0.1 Luff Round Position (%) 50 Foot Length (m) 3.935 Foot Round (m) 0.17 Gaff Length (m) 0.2 Gaff Round (m) 0 Gaff Angle (deg) 60 Leech Length (m) 8.416 Leech Roach) (m 0.2 Leech Roach Position (%) 60 Sail Area (m2) 18.63
Fig. 2 shows the attack angle between the sail and the wind velocity. In this study these angles are varied from 50 to 900 by 50 increments for three different wind velocity, 5 knot, 7.5 knot and 10 knot.
Figure 2 Angle between the sail and the wind direction.
Discretization of the flow equations requires the subdivision of the computational domain into a grid of sufficiently small cells as shown in Fig.4a. This figure shows the structured grid for the sail and whole working domain. Although unstructured grid provides more flexibility in geometry and grid generation, this type of grid requires more cells and so it is more costly [7]. The sail under investigation is located in a rectangular domain as shown in Fig. 4a. In this figure the generated grid system for rectangular domain covered the sail as shown in Figure 4b. All the grid system for CFD calculation is generated by using GAMBIT pre-processor of FLUENT. Totally 998000 hexahedral mesh elements are used for rectangular domain. The flow is considered as 3-dimensional and fully turbulent. The sail itself is specified as wall type and surfaces of the whole domain considered as wall, too. Uniform velocity, turbulent kinetic energy and its dissipation rate are given at the inlet of the domain, while pressure outlet is specified at the outlet. The solver considered here uses finite volume method as discretization scheme. The flow is steady, incompressible, and three-dimensional. As turbulence closure Standard k-ε (SKE) turbulence model with standard wall-function is used. The k-ε turbulence model is one of several two-
Session A 153

equation models that have developed over the years. It is probably the most widely and thoroughly tested of them all. As it is well known that SKE is a semi-empirical model based on model transport equations for the turbulence kinetic energy,k (Eq.1) and its dissipation ε, (Eq. 2
,
( )Pr
i t
i i k i
T k p
u kk kt x x x
G S
ρ μρ μ
μ ρε
⎡ ⎤⎛ ⎞∂∂ ∂+ = +⎢⎜ ⎟∂ ∂ ∂ ∂⎢⎝ ⎠⎣− +
∂+⎥
⎥⎦ (1)
( )1 2 ,
( )Pr
i T
i i i
T p
ut x x x
C G C Sk
ε
ε
ρ ε μρε εμ
ε μ ρε
⎡ ⎤⎛ ⎞∂∂ ∂+ = +⎢ ⎥⎜ ⎟∂ ∂ ∂ ∂⎢ ⎥⎝ ⎠⎣ ⎦
− +
∂+ (2)
where C1 and C2 are additional dimensionless model constants; Prk and Pre are the turbulent Prandtl numbers for kinetic energy and dissipation, respectively; Sk,p and Se,p are source terms for the kinetic energy and turbulent dissipation; and the turbulent production rate (G) is defined in Eq. 3:
2
1
23
ji i
j i j j J
i J
T J j
uu uGx x x x x
u ukx x
ρ ρρ
ρμ
⎛ ⎞∂∂ ∂ ∂ ∂= + −⎜ ⎟⎜ ⎟∂ ∂ ∂ ∂ ∂⎝ ⎠⎛ ⎞∂ ∂
+⎜ ⎟∂ ∂⎝ ⎠
− (3)
The carrier objects are designed to satisfy minimum drag and maximum forces. The angle between the chord
and the freestream is called as attack angle as shown in Figure 3. Lift (L) and drag (D) depend on this angle and velocity. The drag and lift coefficients are calculated as follows (Eq. 4 and Eq. 5).
212
LLCV Aρ
= (4)
212
DDCV Aρ
= (5)
Obtained Drag and lift forces are showed in Fig. 7. The optimum working value of a carrier object can be determined by analyze CL/CD ratio. The pressure resistance is defined as the difference between the maximum pressure field and the minimum pressure field at the detachment region. This pressure resistance is then added to the viscous resistance and has the higher value than the viscous resistance in general. So a resistance of an object can be defined as in Eq. 6:
viscousDpressureDD CCC ,, += (6)
(a) (b)
Figure 3 Main definitions for a sail.
3. RESULTS AND MAIN FINDINGS The main purpose of this study is to show the optimum wind direction angle and the wind velocity value for a sailboat. To achieve these goals some computational analysis are performed on a personal computer of 1.6 GHz core with 2.256 GB RAM. After nine work days running some results are obtained as shown in Fig.6 and Fig. 7.
Session A 154

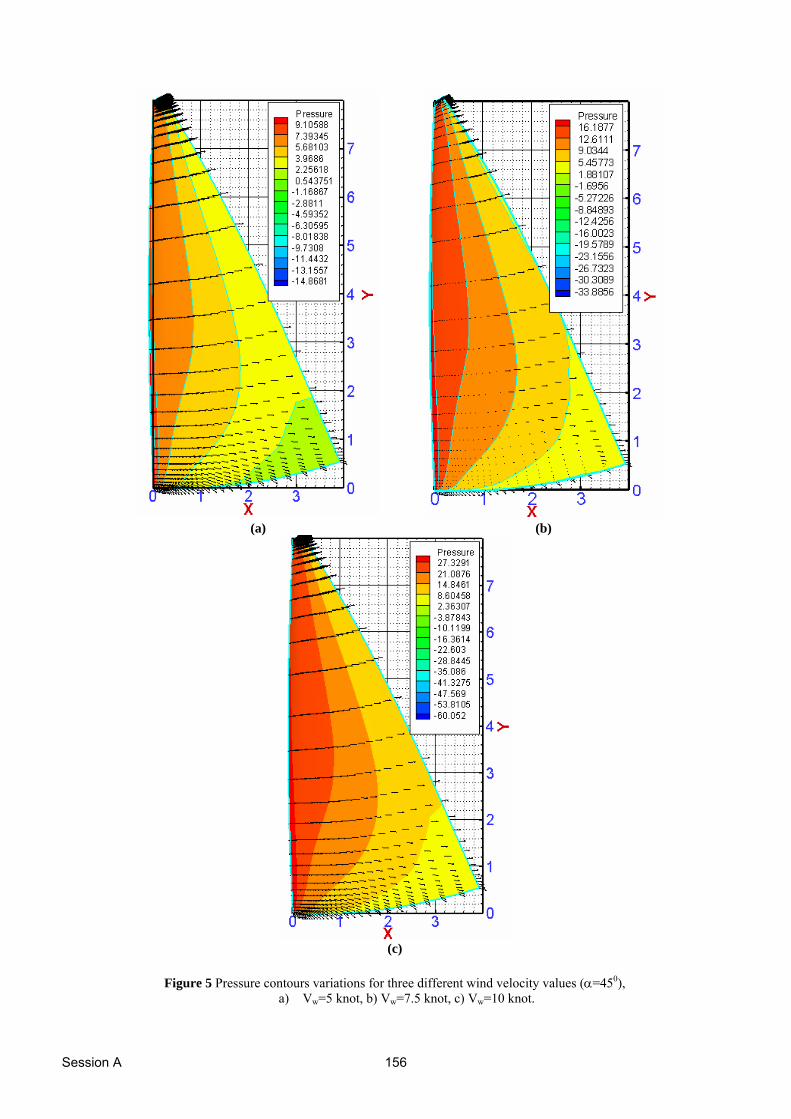
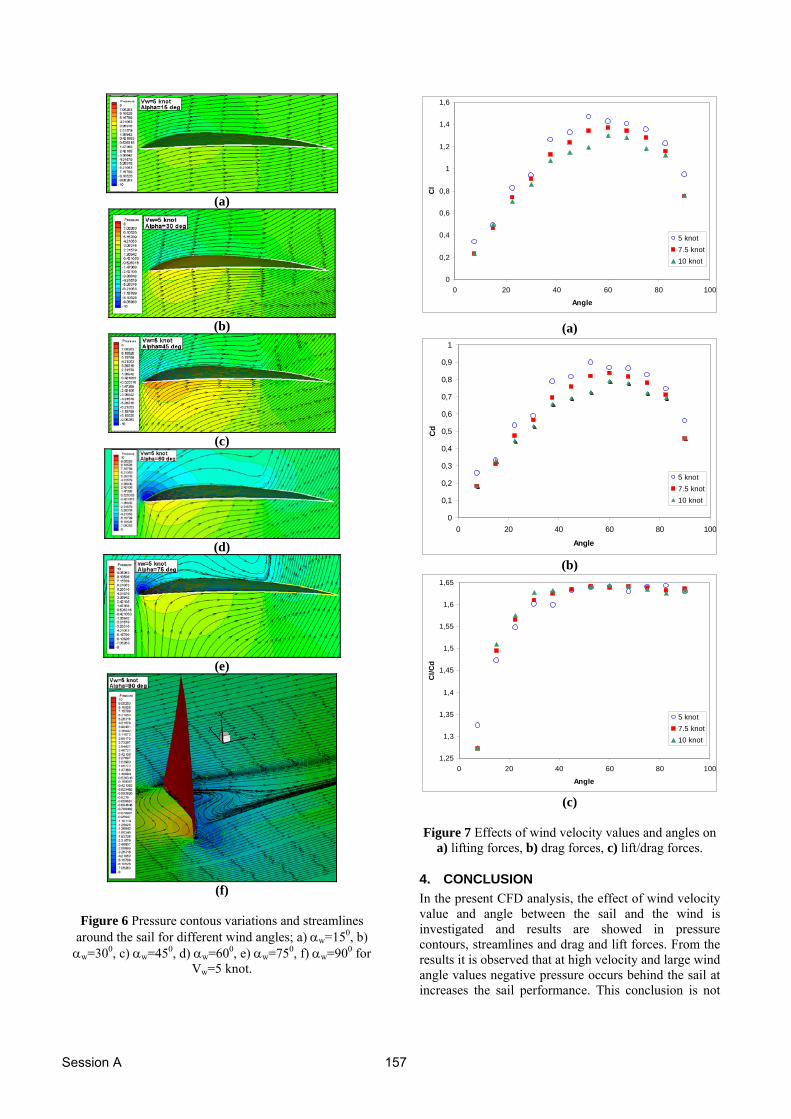
Figure 5 shows the pressure contours variations and embedded velocity vectors for three different wind velocity values, Vw=5 knot,7.5 knot and 10 at the sail for αw=450. As can be seen from these figures, when the wind velocity increases from 5 knot to 7.5 knot, positive and negative pressure values on the sail surfaces increase as well. Fig. 6 shows the pressure contours variations and streamlines around the sail at the height of y=4m. These figures are presented for wind velocity value of 5 knot and αw=150-900. As can be clearly seen that when the angle between the sail and the wind is getting higher the corruption in the streamlines are getting more. At the same time the pressure behind the sail is decreased even more, increasing the lift. This means a boat can sail faster. When angles increases a vortex develops behind the leading edge and the boat has to be steered away from the wind to maintain a smooth airflow. At the small angles there is no any recirculation observed while at the higher angles especially at αw=900, there is a big recirculation region behind the sail.
(a) (b)
Figure 4 Computational domain and generated mesh structure for the a) whole domain b) sail.
Streamlines and pressure contours variation around the sail for αw=900 is showed in Figure 6f from a different point of view. At this situation the sail faced with the wind perpendicularly and acts as an obstacle. The coming flow (air) is separated around the sail and lead to a circulation region. The pressure behind the sail gets the highest value. The effects of the wind velocity and wind angle values on the drag and lift forces can be seen in Figure 7. In these figures it is observed that both the drag and lift forces rises to approximately αw=530 and after that point both drag and lift forces reduces. The increments and decays in drag and lift forces occur for all velocity values. While wind velocity value changed from 5 knots to 7.5 knots and then to 10 knots, drag and lift forces increase, as well. Figure 7 shows CL/CD ratio for three different wind velocity and angles form 00 to 900. In this figure it can be observed that at higher wind velocity the sail has the highest CL/CD ratio till to αw=530. After that angle high velocity gives the best ratio for the sail performance.
Session A 155
(a) (b)
(c)
Figure 5 Pressure contours variations for three different wind velocity values (α=450), a) Vw=5 knot, b) Vw=7.5 knot, c) Vw=10 knot.
Session A 156
(a)
(b)
(c)
(d)
(e)
(f)
Figure 6 Pressure contous variations and streamlines
around the sail for different wind angles; a) αw=150, b) αw=300, c) αw=450, d) αw=600, e) αw=750, f) αw=900 for
Vw=5 knot.
0
0,2
0,4
0,6
0,8
1
1,2
1,4
1,6
0 20 40 60 80
Angle
Cl
100
5 knot7.5 knot10 knot
(a)
0
0,1
0,2
0,3
0,4
0,5
0,6
0,7
0,8
0,9
1
0 20 40 60 80
Angle
Cd
100
5 knot7.5 knot10 knot
(b)
1,25
1,3
1,35
1,4
1,45
1,5
1,55
1,6
1,65
0 20 40 60 80
Angle
Cl/C
d
100
5 knot7.5 knot10 knot
(c) Figure 7 Effects of wind velocity values and angles on
a) lifting forces, b) drag forces, c) lift/drag forces.
4. CONCLUSION In the present CFD analysis, the effect of wind velocity value and angle between the sail and the wind is investigated and results are showed in pressure contours, streamlines and drag and lift forces. From the results it is observed that at high velocity and large wind angle values negative pressure occurs behind the sail at increases the sail performance. This conclusion is not
Session A 157
valid after the wind angle of about 530. After that point drag/lift ratio decreases.
5. REFERENCES 1. Helvacioglu, S., Insel, M., “Sailing Yacht
Performance: The Effects of Heel Angle and Leeway Angle of Resistance and Sideforce”, 1. International Yachting Conference, October, 1995.Cesme, TURKIYE.
2. Richard, P.J., Mallinson, G.D., “The Use of Computational Modeling in a Study of Downwind Sail”, the PHONEIX Journal 13 (3), 225-242, 2000 and 8th Int. PHONEIX Users Conference, Luxemburg, 16-20 May, 2000.
3. Gray, R. P., “Investigation of the airflow around a
sail", Pyh. Educ. 21, 1986.
4. Yılmaz, T., “Yat Tasarımı”, Birsen Yayınevi, 2006. 5. Richards, P. J., Johnson, A., Stanton, A.,
“America’s Cup downwind sails-vertical wings or horizontal parachutes?” Journal of Wind Engineering and Industrial Aerodynamics 89, 1565-1577, 2001.
6. Yoo, J., Kim, H.T., “Computational and
Experimental Study on the Performance of Sails of a Yacht” Ocean Engineering 33, 1322-1342, 2006.
7. Clauss, G., Heisen, W., “CFD Analysis on the
Flying Shape of Modern Yacht Sails”, 12th Int. Congress of the Int. Maritime Assoc. of the Mediterranean, 26-30 September, 2005, Lisbon, Portugal
Session A 158