Embed Size (px)
Citation preview
Dr.-Ing. Roland SchmehlPropulsion and Aerothermodynamics Division
Wärmetechnisches SeminarLehrstuhl für Wärme- und Stoffübertragung,
RWTH Aachen, 12. Juli 2007
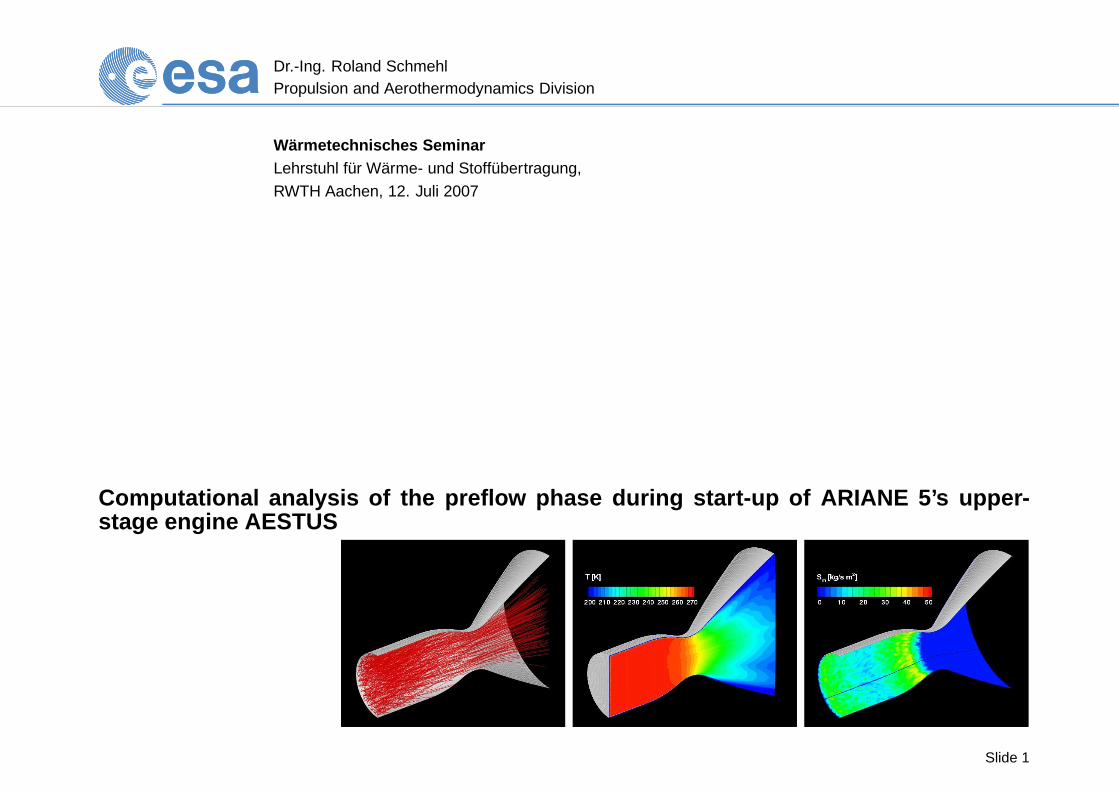
Computational analysis of the preflow phase during start-up of ARIANE 5’s upper-stage engine AESTUS
Slide 1
Dr.-Ing. Roland SchmehlPropulsion and Aerothermodynamics Division Outline
1. Ariane 5 and flight 142 anomaly
2. Upper stage ignition
3. Thermophysical properties of propellants
4. Computational approach
5. Development of physical models
6. 3D-Flowfield simulation and analysis
7. Parametric variation of injection temperature
8. Parametric variation of initial size spectrum
9. Conclusions and Outlook
Slide 2
Dr.-Ing. Roland SchmehlPropulsion and Aerothermodynamics Division
Introduction
Ariane 5 fact sheet
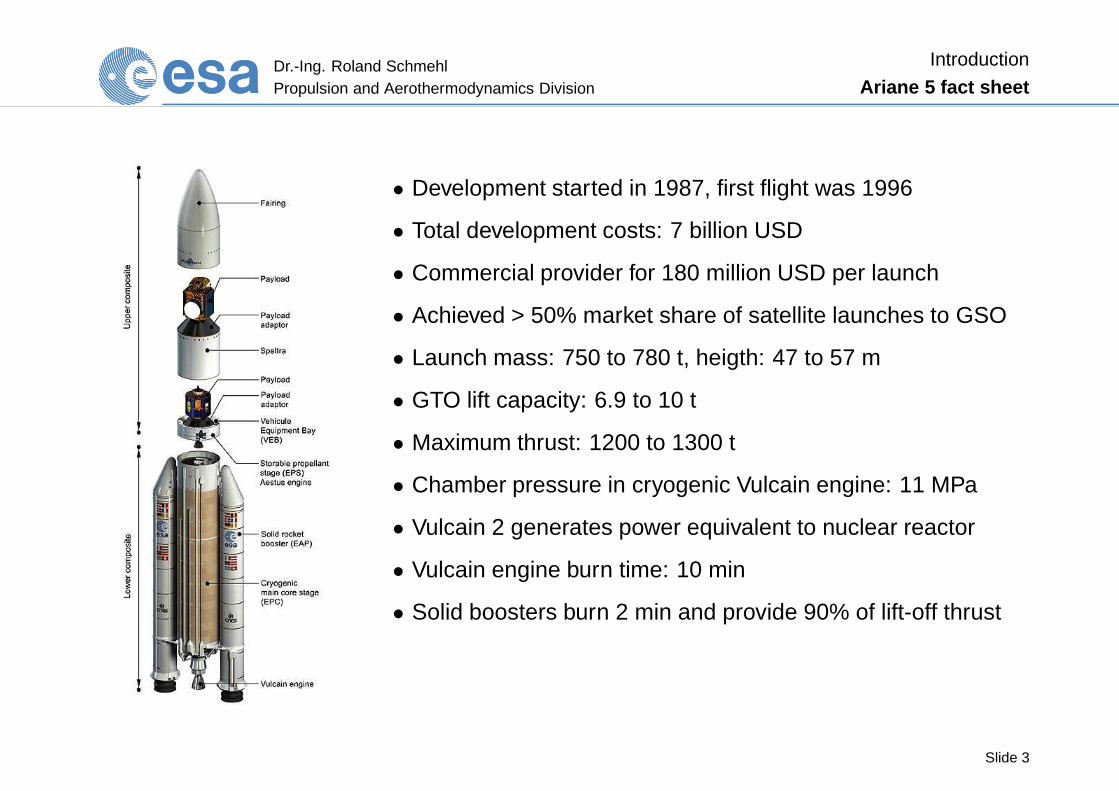
• Development started in 1987, first flight was 1996
• Total development costs: 7 billion USD
• Commercial provider for 180 million USD per launch
• Achieved > 50% market share of satellite launches to GSO
• Launch mass: 750 to 780 t, heigth: 47 to 57 m
• GTO lift capacity: 6.9 to 10 t
• Maximum thrust: 1200 to 1300 t
• Chamber pressure in cryogenic Vulcain engine: 11 MPa
• Vulcain 2 generates power equivalent to nuclear reactor
• Vulcain engine burn time: 10 min
• Solid boosters burn 2 min and provide 90% of lift-off thrust
Slide 3
Dr.-Ing. Roland SchmehlPropulsion and Aerothermodynamics Division
Introduction
Ariane flight 142
ˆ
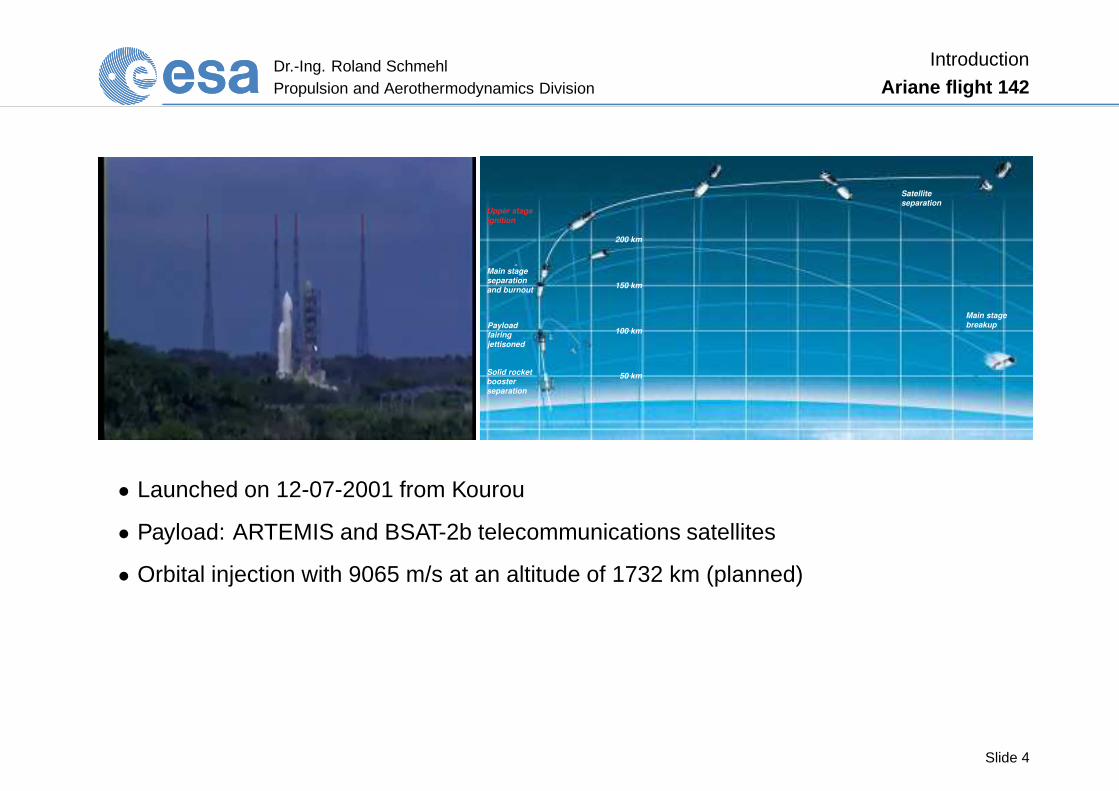
Upper stageignition
Main stageseparation and burnout
Payloadfairingjettisoned
Solid rocketboosterseparation
50 km
100 km
150 km
200 km
Satelliteseparation
Main stagebreakup
• Launched on 12-07-2001 from Kourou
• Payload: ARTEMIS and BSAT-2b telecommunications satellites
• Orbital injection with 9065 m/s at an altitude of 1732 km (planned)
Slide 4
Dr.-Ing. Roland SchmehlPropulsion and Aerothermodynamics Division
Introduction
Flight 142 anomaly
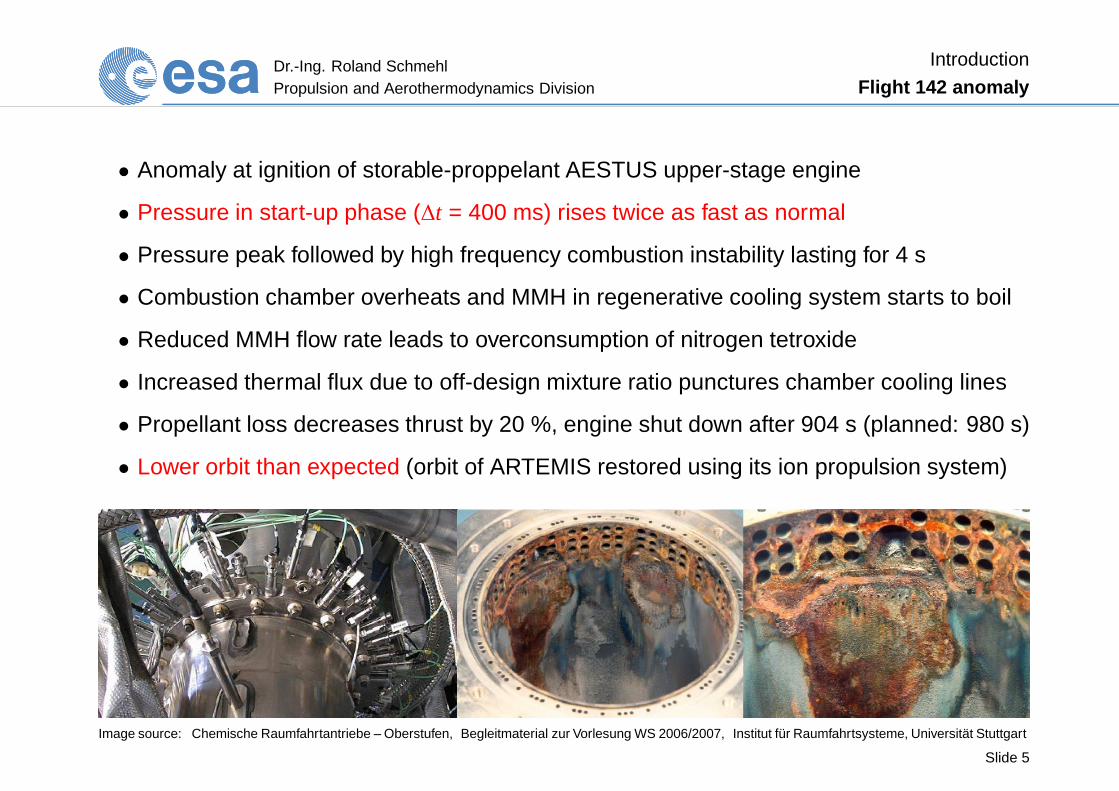
• Anomaly at ignition of storable-proppelant AESTUS upper-stage engine
• Pressure in start-up phase (∆t = 400 ms) rises twice as fast as normal
• Pressure peak followed by high frequency combustion instability lasting for 4 s
• Combustion chamber overheats and MMH in regenerative cooling system starts to boil
• Reduced MMH flow rate leads to overconsumption of nitrogen tetroxide
• Increased thermal flux due to off-design mixture ratio punctures chamber cooling lines
• Propellant loss decreases thrust by 20 %, engine shut down after 904 s (planned: 980 s)
• Lower orbit than expected (orbit of ARTEMIS restored using its ion propulsion system)
Image source: Chemische Raumfahrtantriebe – Oberstufen, Begleitmaterial zur Vorlesung WS 2006/2007, Institut für Raumfahrtsysteme, Universität Stuttgart
Slide 5
Dr.-Ing. Roland SchmehlPropulsion and Aerothermodynamics Division
Introduction
Central question
What was the reason for the fast pressure rise in the combusti on chamber?
• Propellant thermodynamics?
• Flow dynamics (is preflow phase long enough, ...)?
• Combustion chemistry (pre-ignition reaction products, nitric acid, ...)?
• Pre-ignition accumulation of propellant (condensation, ...)?
• Dynamic coupling of internal hydraulic circuits and supply lines?
• Pressure dependence of mixture preparation (pressure-swirl type atomizers)?
Slide 6
Dr.-Ing. Roland SchmehlPropulsion and Aerothermodynamics Division
Introduction
Project framework
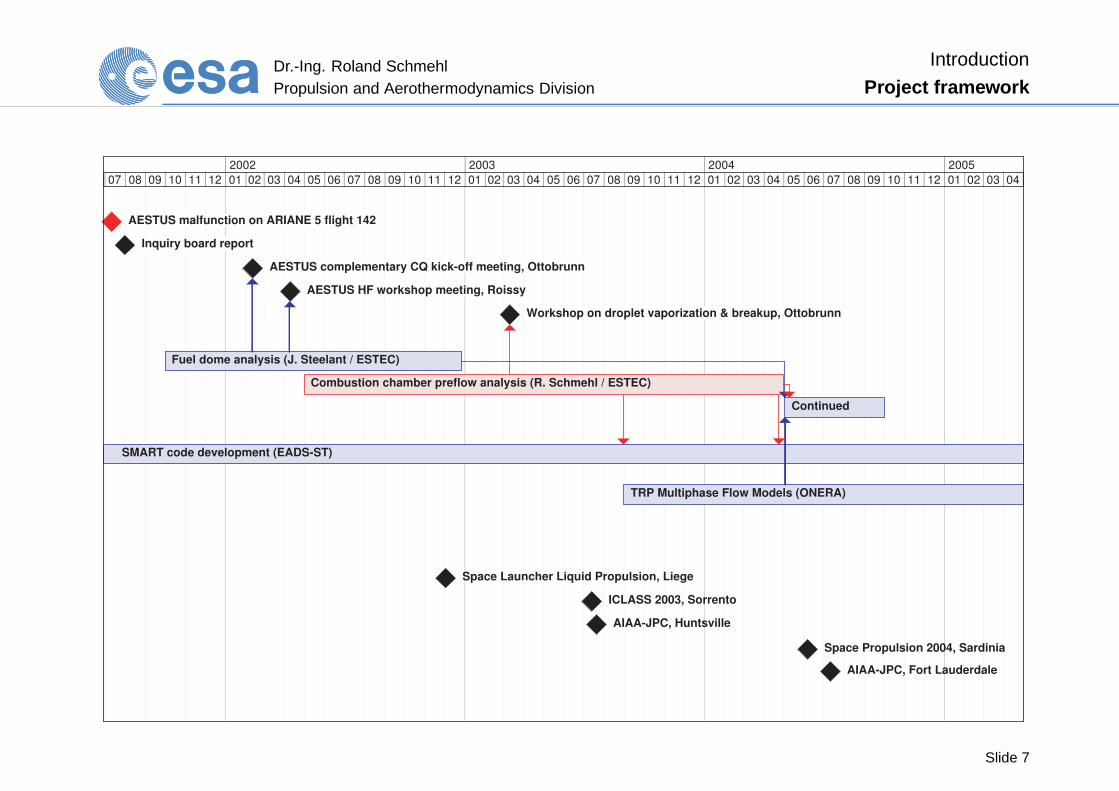
AESTUS malfunction on ARIANE 5 flight 142
Inquiry board report
AESTUS complementary CQ kick-off meeting, Ottobrunn
AESTUS HF workshop meeting, Roissy
Workshop on droplet vaporization & breakup, Ottobrunn
Fuel dome analysis (J. Steelant / ESTEC)
Combustion chamber preflow analysis (R. Schmehl / ESTEC)
Continued
SMART code development (EADS-ST)
TRP Multiphase Flow Models (ONERA)
Space Launcher Liquid Propulsion, Liege
ICLASS 2003, Sorrento
AIAA-JPC, Huntsville
Space Propulsion 2004, Sardinia
07 08 09 10 11 12 01 02 03 04 05 06 07 08 09 10 11 12 01 02 03 04 05 06 07 08 09 10 11 12 01 02 03 04 05 06 07 08 09 10 11 12 01 02 03 04
2002 2003 2004 2005
AIAA-JPC, Fort Lauderdale
Slide 7
Dr.-Ing. Roland SchmehlPropulsion and Aerothermodynamics Division
Upper stage ignition
AESTUS engine fact sheet
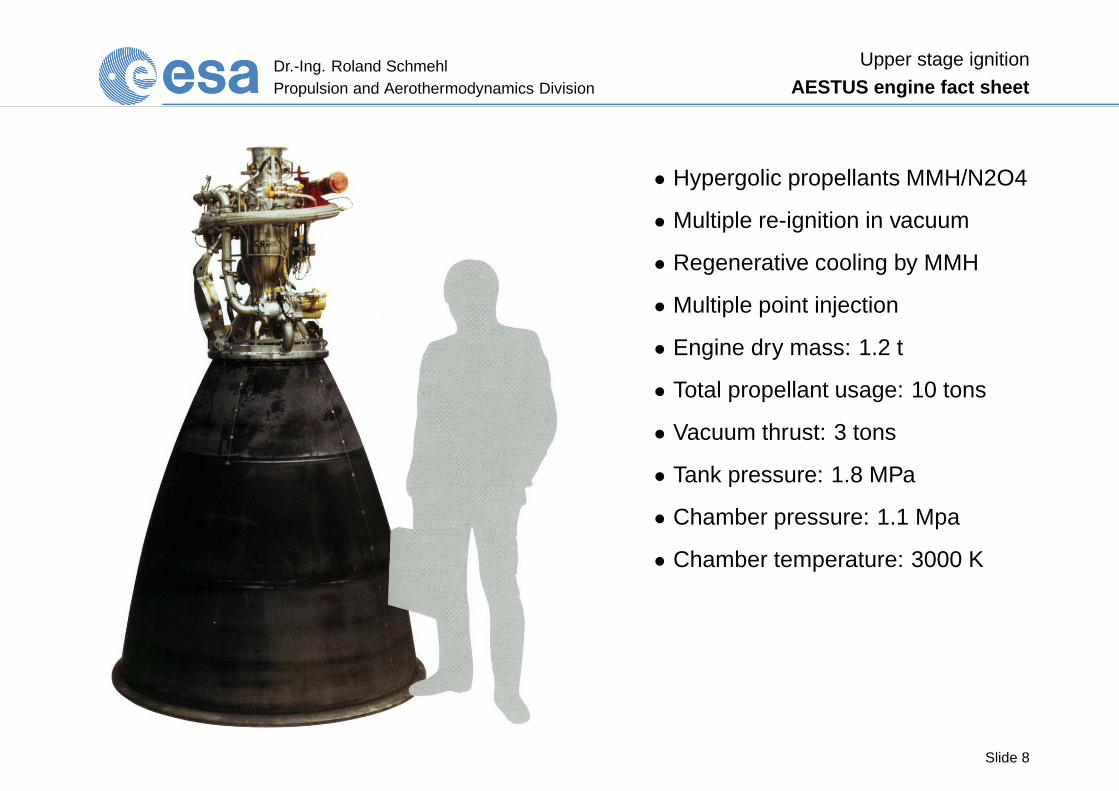
• Hypergolic propellants MMH/N2O4
• Multiple re-ignition in vacuum
• Regenerative cooling by MMH
• Multiple point injection
• Engine dry mass: 1.2 t
• Total propellant usage: 10 tons
• Vacuum thrust: 3 tons
• Tank pressure: 1.8 MPa
• Chamber pressure: 1.1 Mpa
• Chamber temperature: 3000 K
Slide 8
Dr.-Ing. Roland SchmehlPropulsion and Aerothermodynamics Division
Upper stage ignition
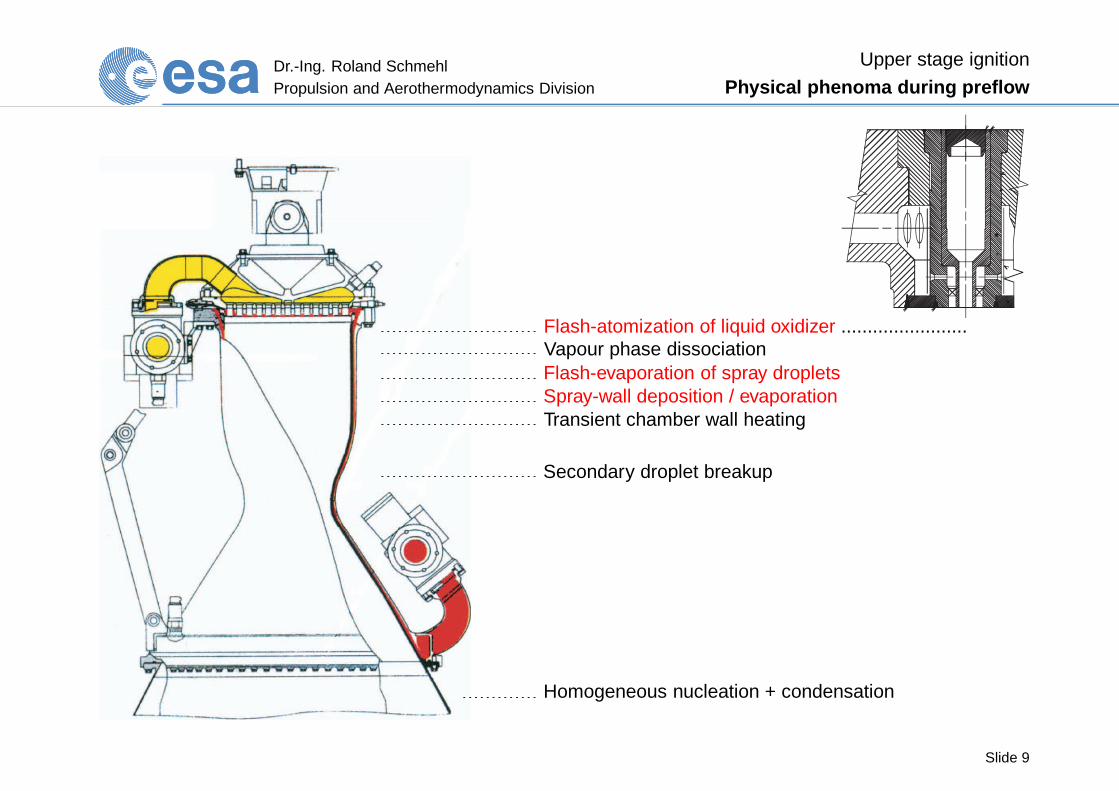
Physical phenoma during preflow
Flash-atomization of liquid oxidizer ........................Vapour phase dissociationFlash-evaporation of spray dropletsSpray-wall deposition / evaporationTransient chamber wall heating
Secondary droplet breakup
Homogeneous nucleation + condensation
Slide 9
Dr.-Ing. Roland SchmehlPropulsion and Aerothermodynamics Division
Upper stage ignition
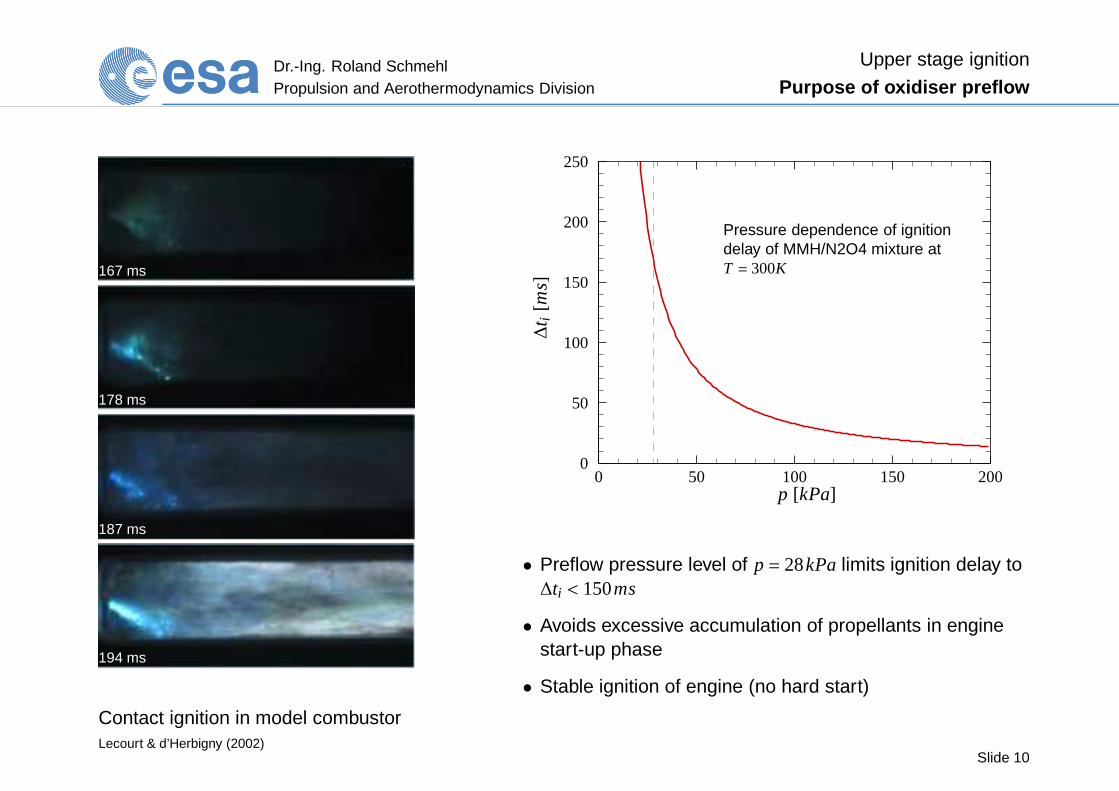
Purpose of oxidiser preflow
167 ms
178 ms
187 ms
194 ms
Contact ignition in model combustorLecourt & d’Herbigny (2002)
0 50 100 150 2000
50
100
150
200
250
∆t i
[ms]
p [kPa]
Pressure dependence of ignitiondelay of MMH/N2O4 mixture atT = 300K
• Preflow pressure level of p = 28kPa limits ignition delay to∆ti < 150ms
• Avoids excessive accumulation of propellants in enginestart-up phase
• Stable ignition of engine (no hard start)
Slide 10
Dr.-Ing. Roland SchmehlPropulsion and Aerothermodynamics Division
Upper stage ignition
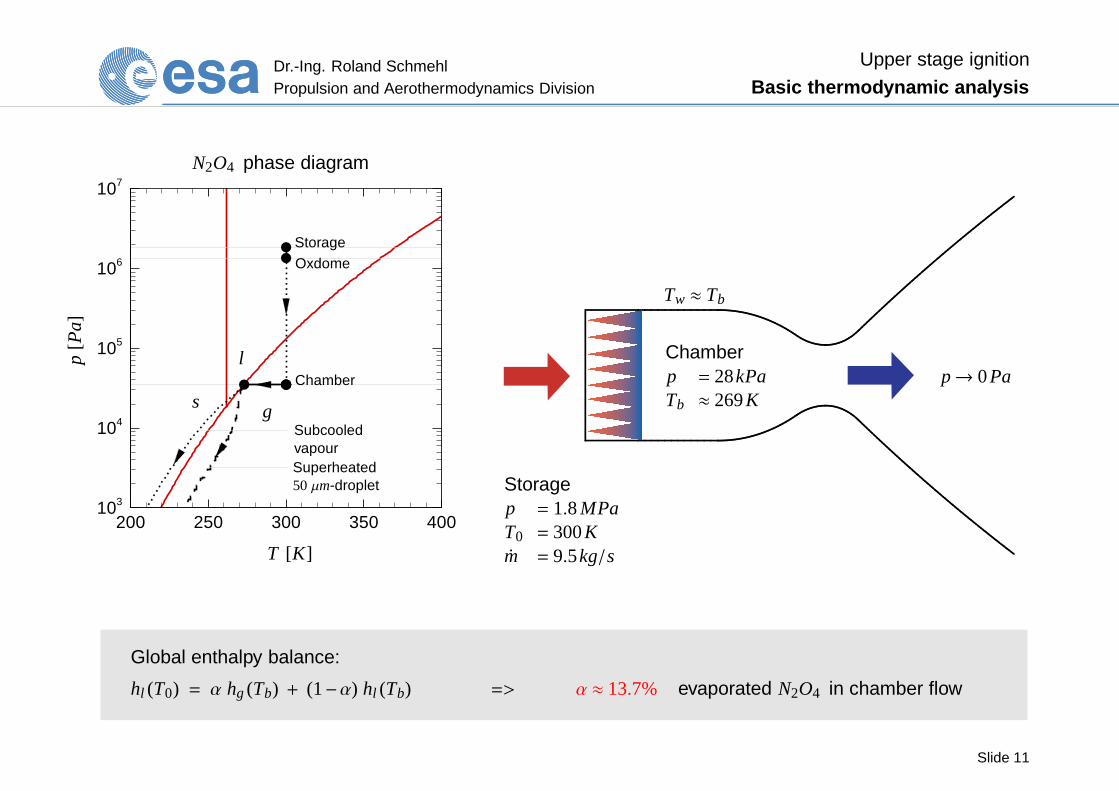
Basic thermodynamic analysis
200 250 300 350 400103
104
105
106
107
T [K]
p[P
a]
s
l
g
N2O4 phase diagram
Storage
Chamber
Oxdome
SubcooledvapourSuperheated50 µm-droplet
Storagep = 1.8MPaT0 = 300Km = 9.5kg/s
Chamberp = 28kPaTb ≈ 269K
p→ 0Pa
Tw ≈ Tb
Global enthalpy balance:
hl (T0) = α hg (Tb) + (1−α) hl (Tb) => α ≈ 13.7% evaporated N2O4 in chamber flow
Slide 11
Dr.-Ing. Roland SchmehlPropulsion and Aerothermodynamics Division
Propellant properties
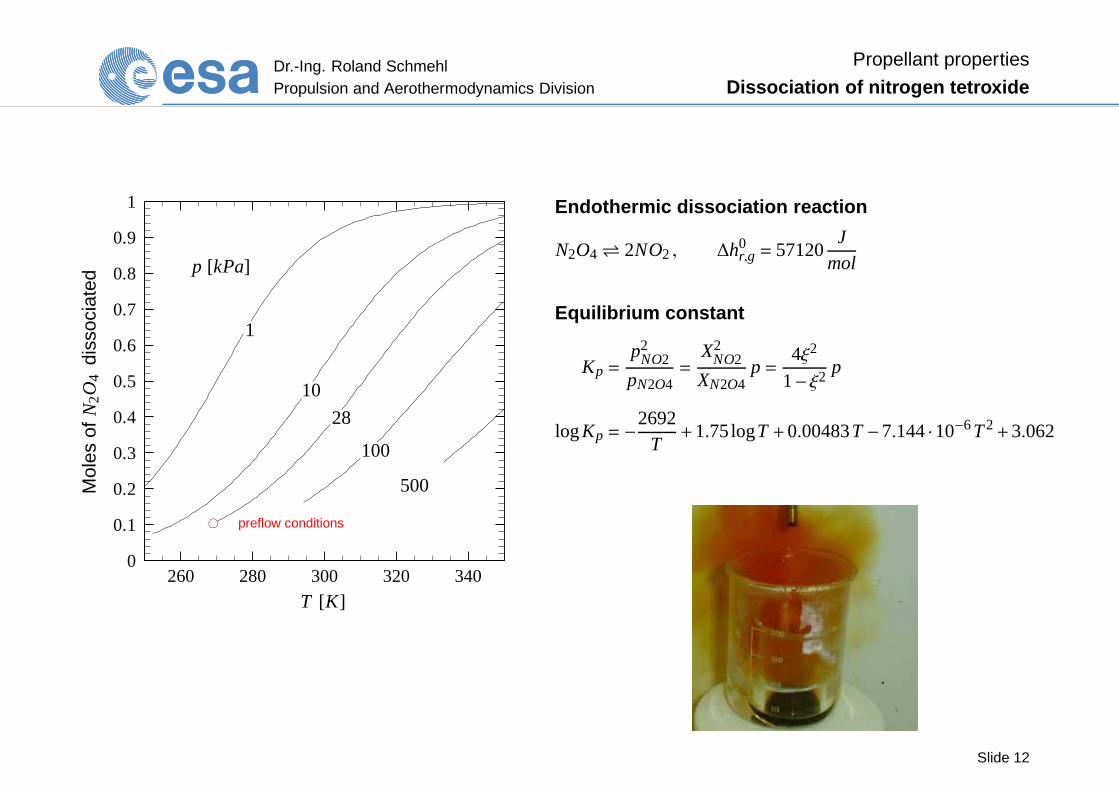
Dissociation of nitrogen tetroxide
260 280 300 320 3400
0.1
0.2
0.3
0.4
0.5
0.6
0.7
0.8
0.9
1
T [K]
Mol
esof
N2O
4di
ssoc
iate
d
500
100
28
10
1
p [kPa]
preflow conditions
Endothermic dissociation reaction
N2O4⇋ 2NO2 , ∆h0r,g = 57120
Jmol
Equilibrium constant
Kp =p2
NO2
pN2O4=
X2NO2
XN2O4p =
4ξ2
1− ξ2p
logKp = −2692
T+1.75logT +0.00483T −7.144·10−6T2
+3.062
Slide 12
Dr.-Ing. Roland SchmehlPropulsion and Aerothermodynamics Division
Propellant properties
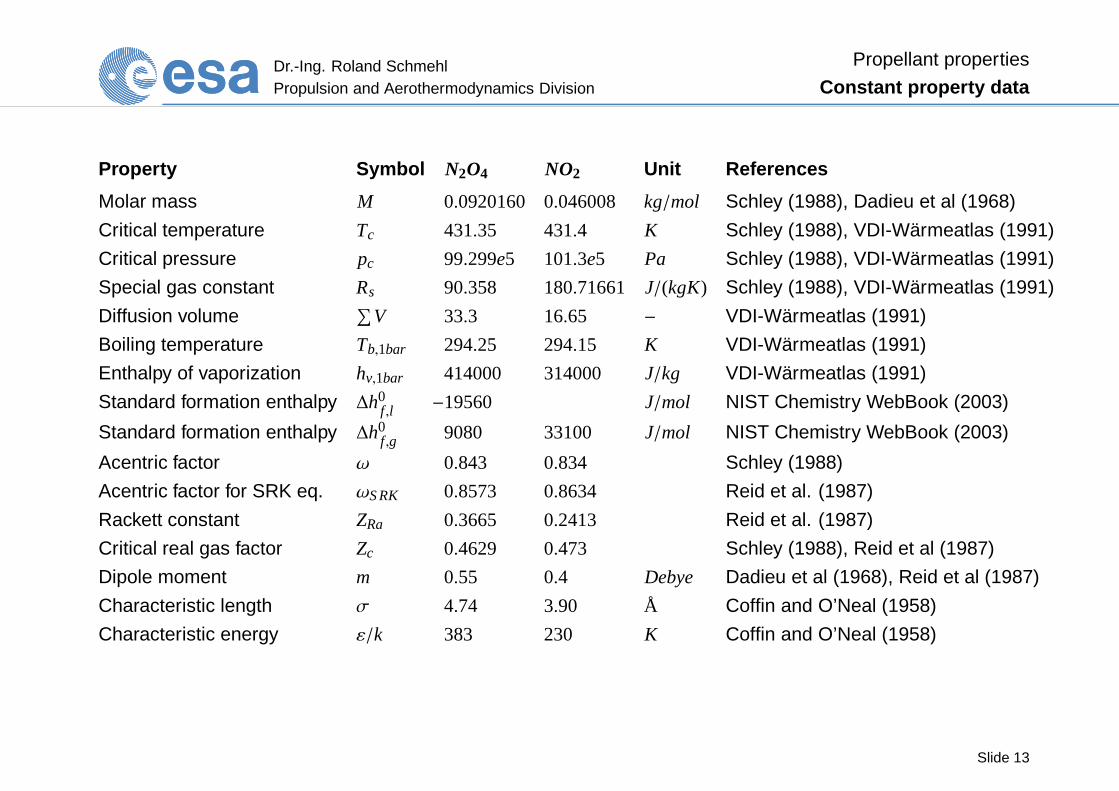
Constant property data
Property Symbol N2O4 NO2 Unit References
Molar mass M 0.0920160 0.046008 kg/mol Schley (1988), Dadieu et al (1968)
Critical temperature Tc 431.35 431.4 K Schley (1988), VDI-Wärmeatlas (1991)
Critical pressure pc 99.299e5 101.3e5 Pa Schley (1988), VDI-Wärmeatlas (1991)
Special gas constant Rs 90.358 180.71661 J/(kgK) Schley (1988), VDI-Wärmeatlas (1991)
Diffusion volume∑
V 33.3 16.65 − VDI-Wärmeatlas (1991)
Boiling temperature Tb,1bar 294.25 294.15 K VDI-Wärmeatlas (1991)
Enthalpy of vaporization hv,1bar 414000 314000 J/kg VDI-Wärmeatlas (1991)
Standard formation enthalpy ∆h0f ,l −19560 J/mol NIST Chemistry WebBook (2003)
Standard formation enthalpy ∆h0f ,g 9080 33100 J/mol NIST Chemistry WebBook (2003)
Acentric factor ω 0.843 0.834 Schley (1988)
Acentric factor for SRK eq. ωS RK 0.8573 0.8634 Reid et al. (1987)
Rackett constant ZRa 0.3665 0.2413 Reid et al. (1987)
Critical real gas factor Zc 0.4629 0.473 Schley (1988), Reid et al (1987)
Dipole moment m 0.55 0.4 Debye Dadieu et al (1968), Reid et al (1987)
Characteristic length σ 4.74 3.90 Å Coffin and O’Neal (1958)
Characteristic energy ε/k 383 230 K Coffin and O’Neal (1958)
Slide 13
Dr.-Ing. Roland SchmehlPropulsion and Aerothermodynamics Division
Propellant properties
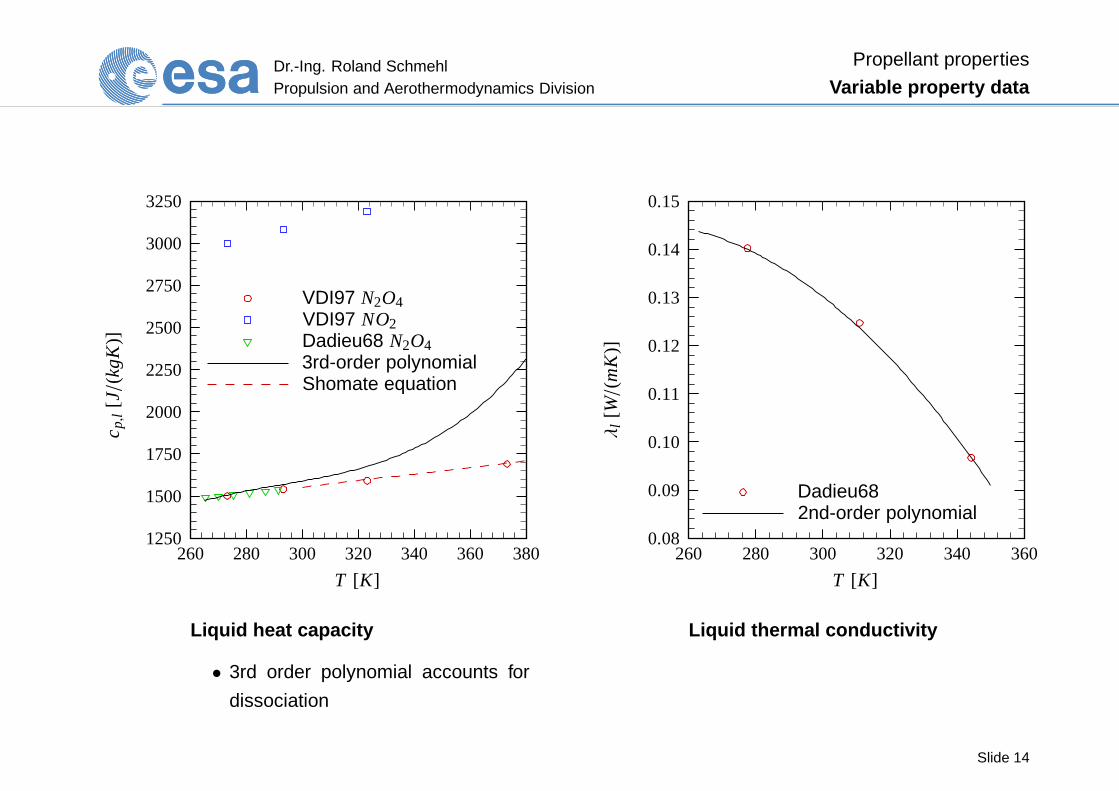
Variable property data
260 280 300 320 340 360 3801250
1500
1750
2000
2250
2500
2750
3000
3250
T [K]
c p,l
[J/(k
gK)]
VDI97 N2O4VDI97 NO2Dadieu68 N2O43rd-order polynomialShomate equation
Liquid heat capacity
• 3rd order polynomial accounts for
dissociation
260 280 300 320 340 3600.08
0.09
0.10
0.11
0.12
0.13
0.14
0.15
T [K]
λl[W/(m
K)]
Dadieu682nd-order polynomial
Liquid thermal conductivity
Slide 14
Dr.-Ing. Roland SchmehlPropulsion and Aerothermodynamics Division
Propellant properties
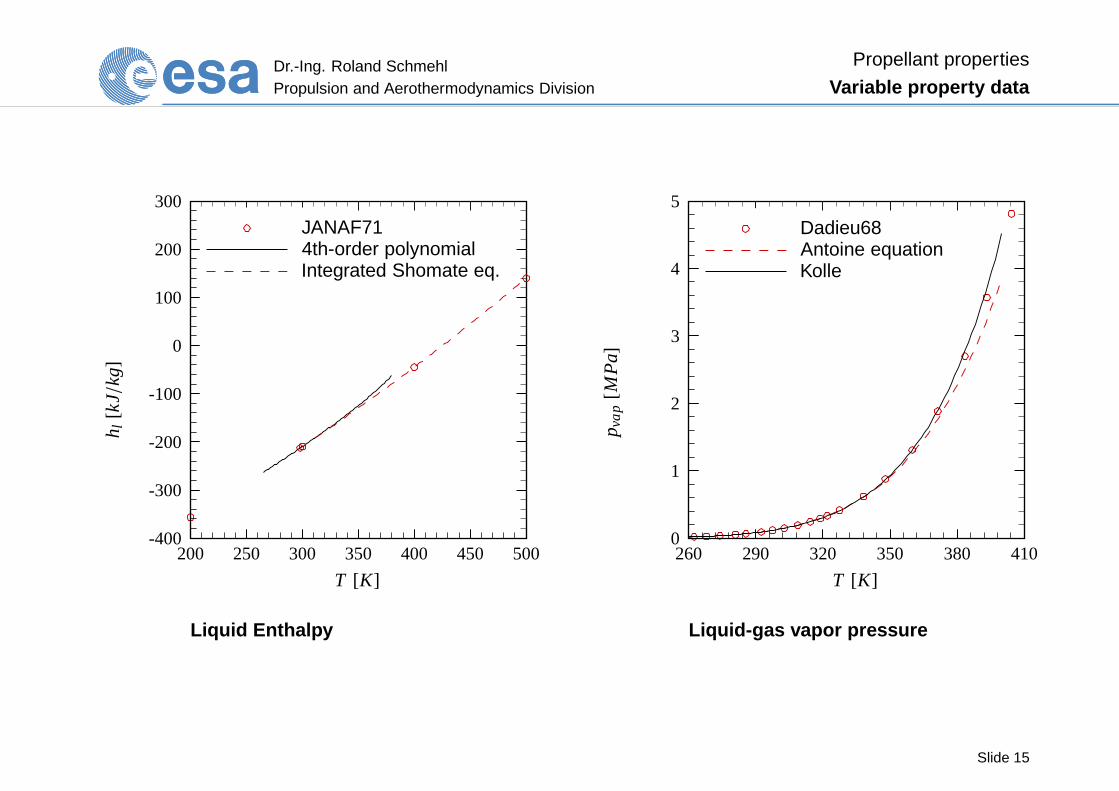
Variable property data
200 250 300 350 400 450 500-400
-300
-200
-100
0
100
200
300
T [K]
h l[k
J/kg
]
JANAF714th-order polynomialIntegrated Shomate eq.
Liquid Enthalpy
260 290 320 350 380 4100
1
2
3
4
5
T [K]
p va
p[M
Pa]
Dadieu68Antoine equationKolle
Liquid-gas vapor pressure
Slide 15
Dr.-Ing. Roland SchmehlPropulsion and Aerothermodynamics Division
Propellant properties
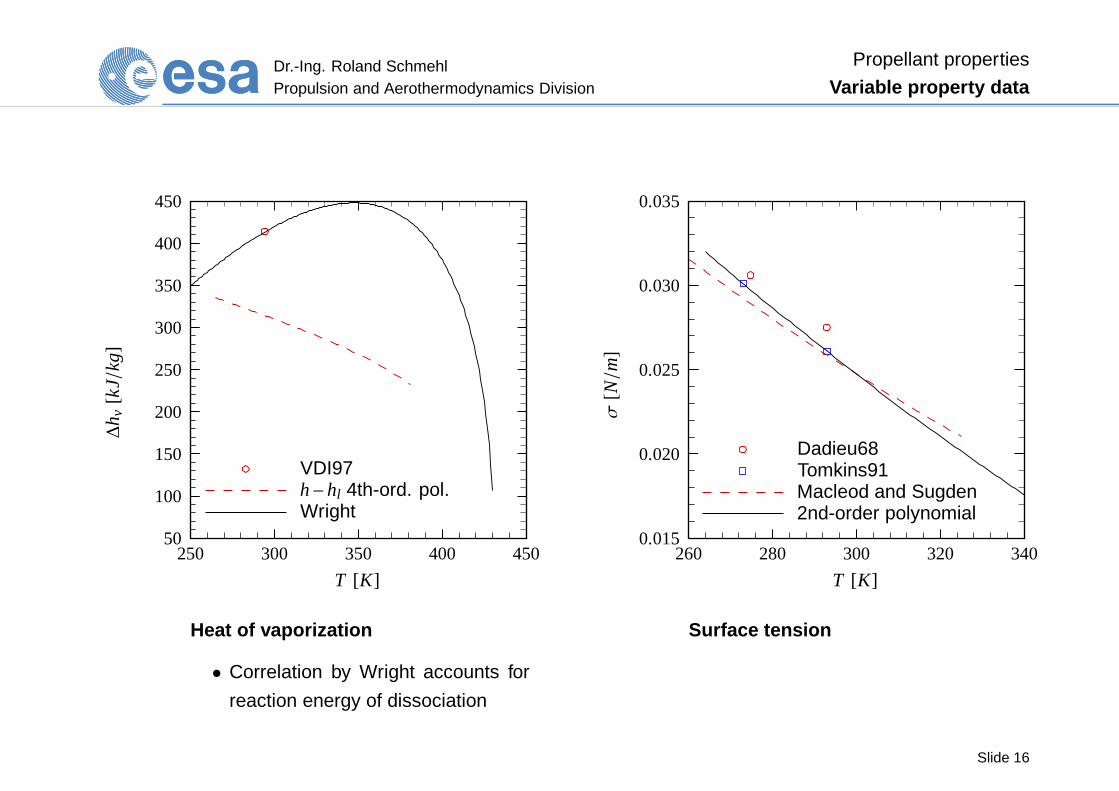
Variable property data
250 300 350 400 45050
100
150
200
250
300
350
400
450
T [K]
∆h v
[kJ/
kg]
VDI97h−hl 4th-ord. pol.Wright
Heat of vaporization
• Correlation by Wright accounts for
reaction energy of dissociation
260 280 300 320 3400.015
0.020
0.025
0.030
0.035
T [K]
σ[N/m
]
Dadieu68Tomkins91Macleod and Sugden2nd-order polynomial
Surface tension
Slide 16
Dr.-Ing. Roland SchmehlPropulsion and Aerothermodynamics Division
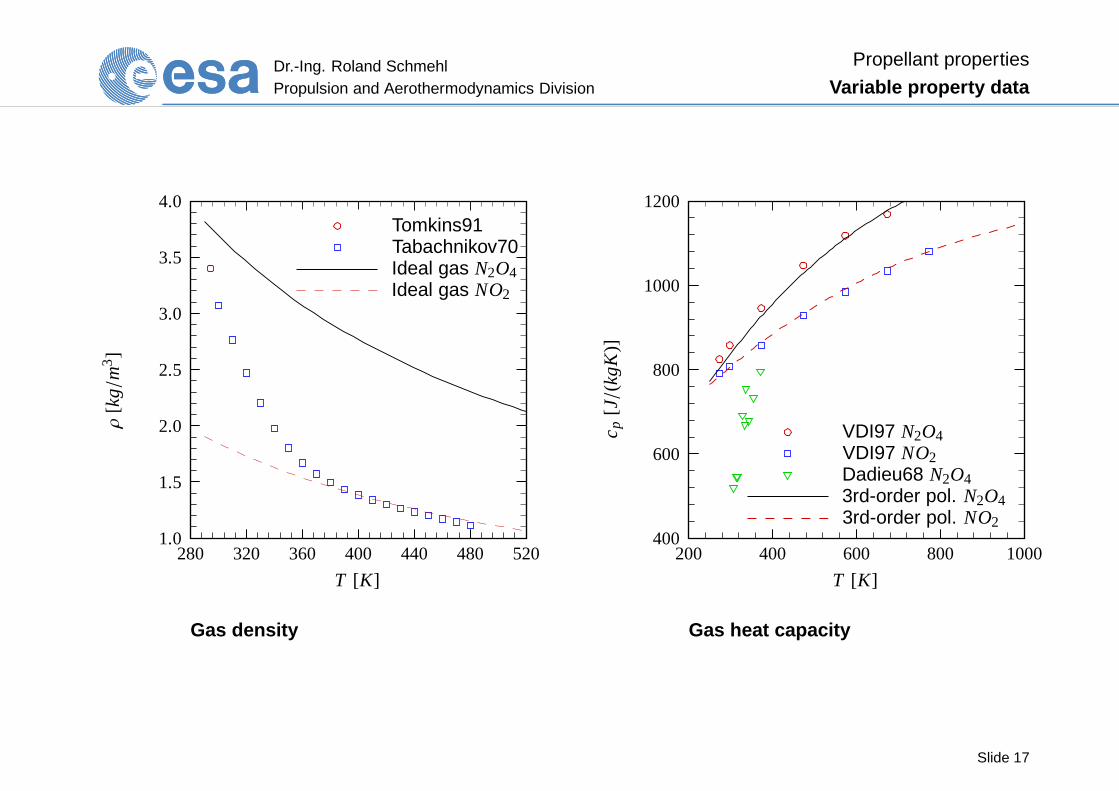
Propellant properties
Variable property data
280 320 360 400 440 480 5201.0
1.5
2.0
2.5
3.0
3.5
4.0
T [K]
ρ[k
g/m
3 ]
Tomkins91Tabachnikov70Ideal gas N2O4Ideal gas NO2
Gas density
200 400 600 800 1000400
600
800
1000
1200
T [K]
c p[J/(k
gK)]
VDI97 N2O4VDI97 NO2Dadieu68 N2O43rd-order pol. N2O43rd-order pol. NO2
Gas heat capacity
Slide 17

Dr.-Ing. Roland SchmehlPropulsion and Aerothermodynamics Division
Propellant properties
Variable property data
250 300 350 400 450 5001E-05
2E-05
3E-05
T [K]
µ[k
g/(m
s)]
AirLiquide762nd-order polynomial
Gas dynamic viscosity
250 350 450 550 6500.00
0.04
0.08
0.12
0.16
0.20
T [K]
λ[W/(m
K)]
Dadieu68AirLiquide76Bilyk74VDI97 NO2linearlinear CNES
Gas thermal conductivity
• Data by Bilyk (1974) accouts for re-
action energy of dissociation
Slide 18

Dr.-Ing. Roland SchmehlPropulsion and Aerothermodynamics Division
Propellant properties
Variable property data
250 500 750 10000
100
200
300
400
500
600
700
800
900
T [K]
h[k
J/kg
]
JANAF714th-order polynomial
Gas enthalpy
Conclusions:
• All relevant thermopysical property data
available
• Data covers mechanical and thermal
flow phenomena
• Data also accounts for spontaneous dis-
sociation
Slide 19
Dr.-Ing. Roland SchmehlPropulsion and Aerothermodynamics Division
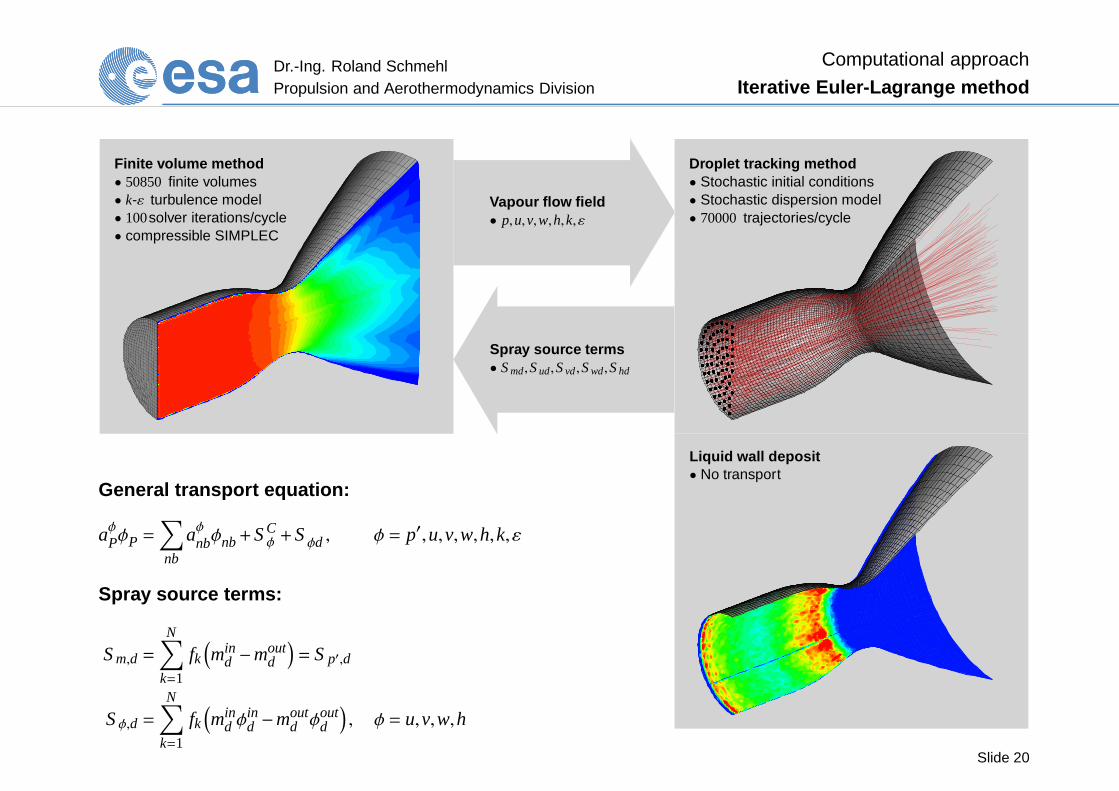
Computational approach
Iterative Euler-Lagrange method
Vapour flow field• p,u,v,w,h,k, ε
Spray source terms• S md,S ud,S vd,S wd,S hd
Finite volume method• 50850 finite volumes• k-ε turbulence model• 100solver iterations/cycle• compressible SIMPLEC
Droplet tracking method• Stochastic initial conditions• Stochastic dispersion model• 70000 trajectories/cycle
Liquid wall deposit• No transport
General transport equation:
aφPφP =∑
nb
aφnbφnb+S Cφ +S φd , φ = p′,u,v,w,h,k,ε
Spray source terms:
S m,d =
N∑
k=1
fk(
mind −mout
d
)
= S p′,d
S φ,d =N∑
k=1
fk(
mind φ
ind −mout
d φoutd
)
, φ = u,v,w,h
Slide 20
Dr.-Ing. Roland SchmehlPropulsion and Aerothermodynamics Division
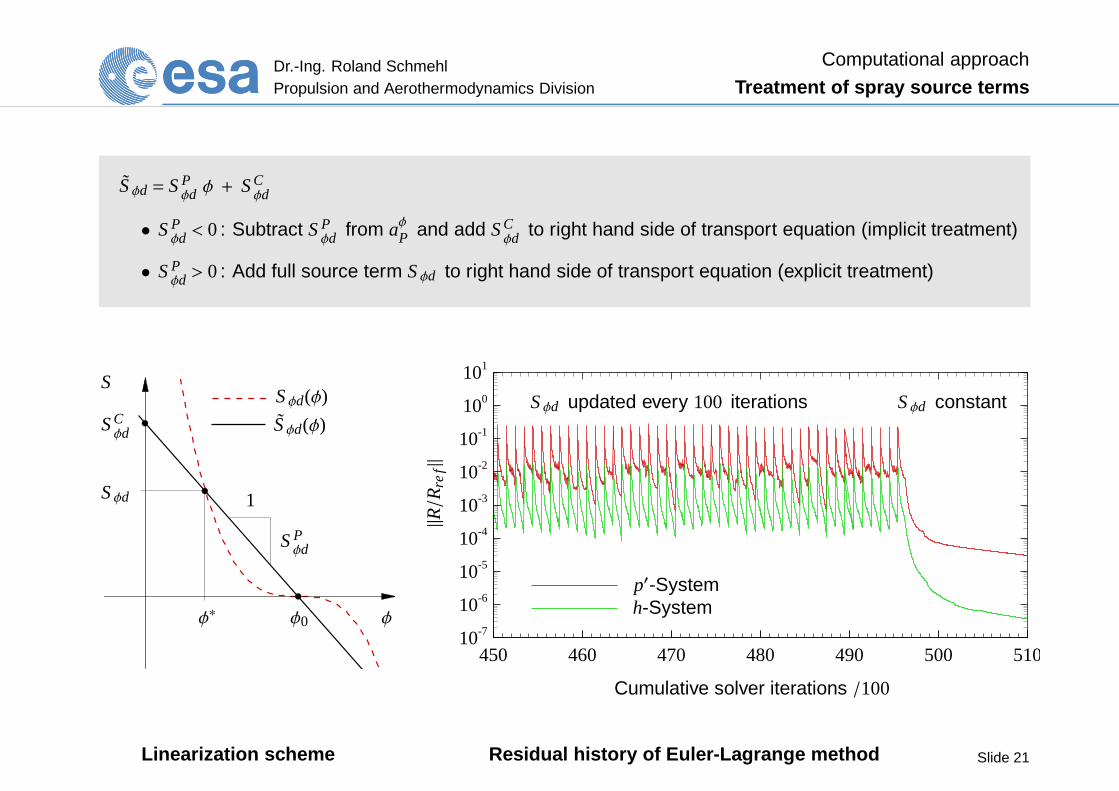
Computational approach
Treatment of spray source terms
S φd = S Pφd φ + S C
φd
• S Pφd < 0 : Subtract S P
φd from aφP and add S Cφd to right hand side of transport equation (implicit treatment)
• S Pφd > 0 : Add full source term S φd to right hand side of transport equation (explicit treatment)
φ0φ∗
S φd
S Cφd
φ
SS φd(φ)
S φd(φ)
S Pφd
1
Linearization scheme
450 460 470 480 490 500 51010-7
10-6
10-5
10-4
10-3
10-2
10-1
100
101
Cumulative solver iterations /100
||R/R
ref||
p′-Systemh-System
S φd updated every 100 iterations S φd constant
Residual history of Euler-Lagrange method Slide 21
Dr.-Ing. Roland SchmehlPropulsion and Aerothermodynamics Division
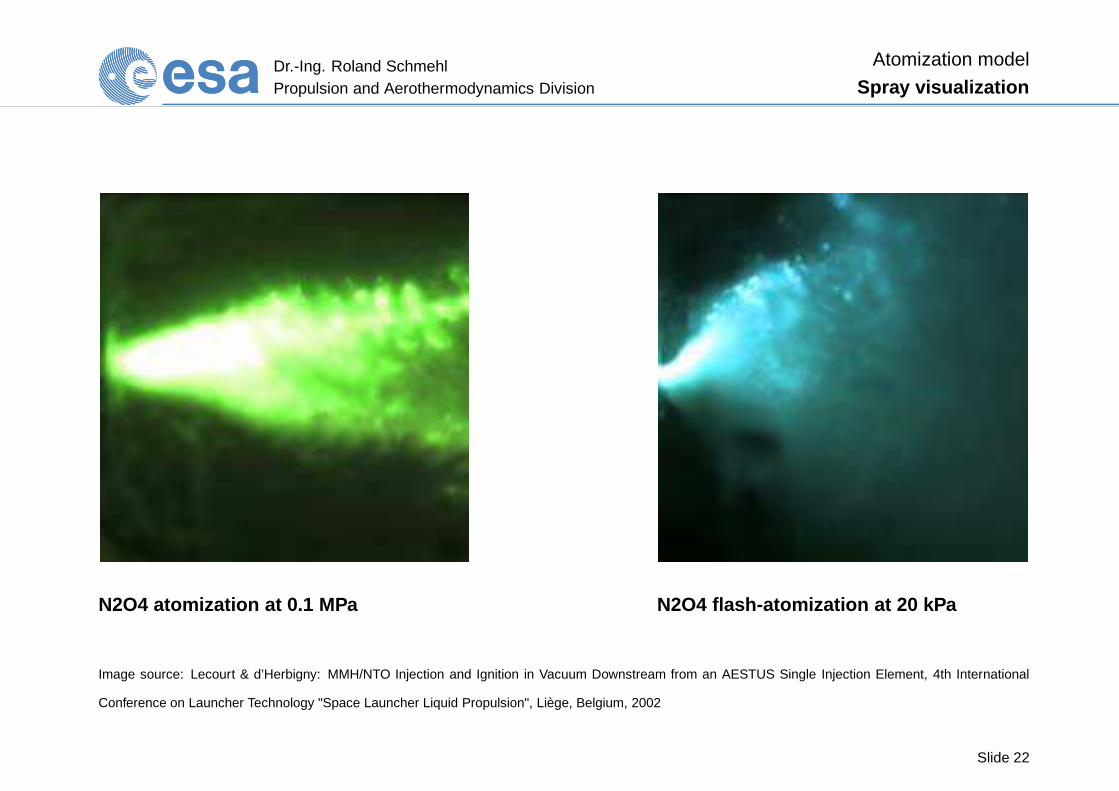
Atomization model
Spray visualization
N2O4 atomization at 0.1 MPa N2O4 flash-atomization at 20 kPa
Image source: Lecourt & d’Herbigny: MMH/NTO Injection and Ignition in Vacuum Downstream from an AESTUS Single Injection Element, 4th International
Conference on Launcher Technology "Space Launcher Liquid Propulsion", Liège, Belgium, 2002
Slide 22
Dr.-Ing. Roland SchmehlPropulsion and Aerothermodynamics Division
Atomization model
Single injector
θmax
0 100 200 30
D63 D32
50 31.2
100 62.4
150 91.7 Dro
plet
volu
me
D [µm] 100 200 300
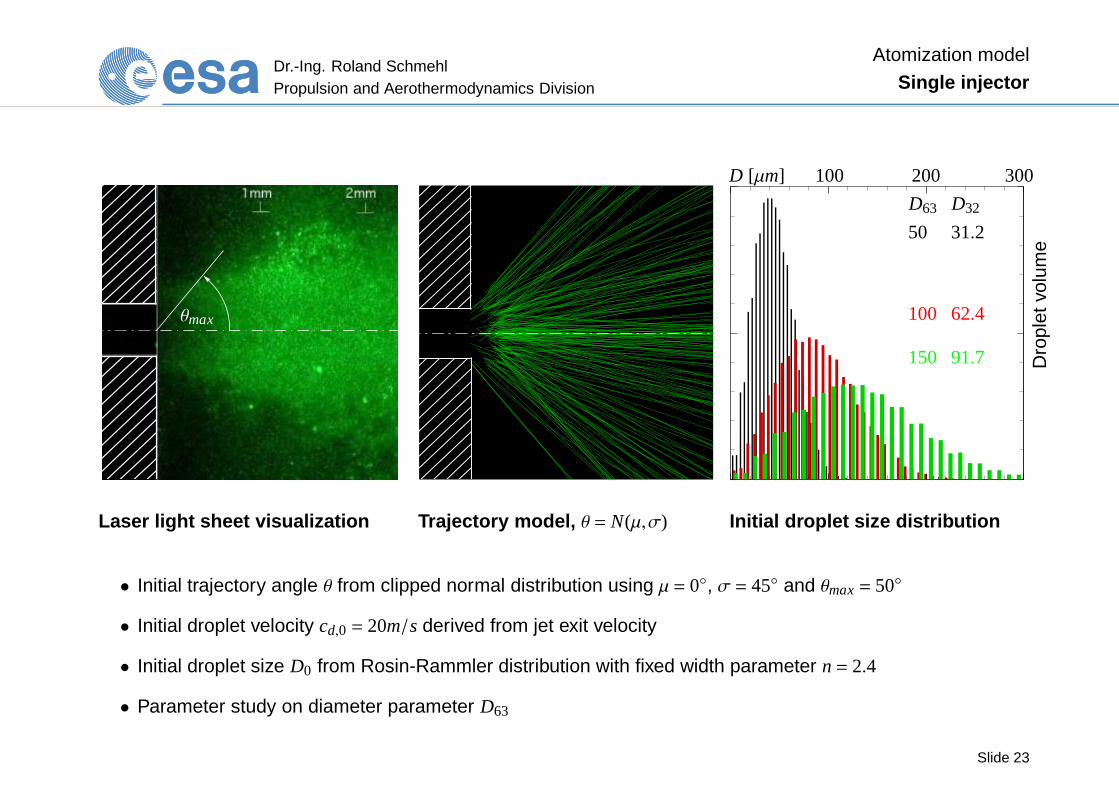
Laser light sheet visualization Trajectory model, θ = N(µ,σ) Initial droplet size distribution
• Initial trajectory angle θ from clipped normal distribution using µ = 0◦, σ = 45◦ and θmax = 50◦
• Initial droplet velocity cd,0 = 20m/s derived from jet exit velocity
• Initial droplet size D0 from Rosin-Rammler distribution with fixed width parameter n = 2.4
• Parameter study on diameter parameter D63
Slide 23
Dr.-Ing. Roland SchmehlPropulsion and Aerothermodynamics Division
Atomization model
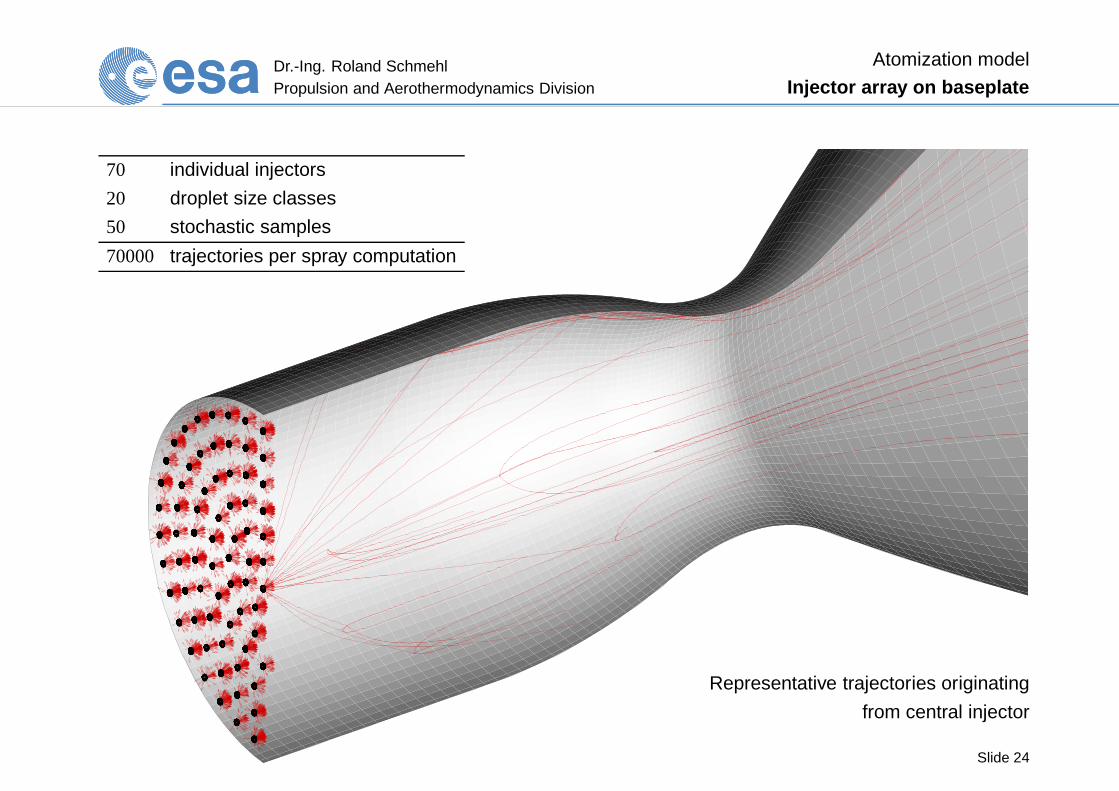
Injector array on baseplate
70 individual injectors
20 droplet size classes
50 stochastic samples
70000 trajectories per spray computation
Representative trajectories originating
from central injector
Slide 24
Dr.-Ing. Roland SchmehlPropulsion and Aerothermodynamics Division
Flash-evaporation model
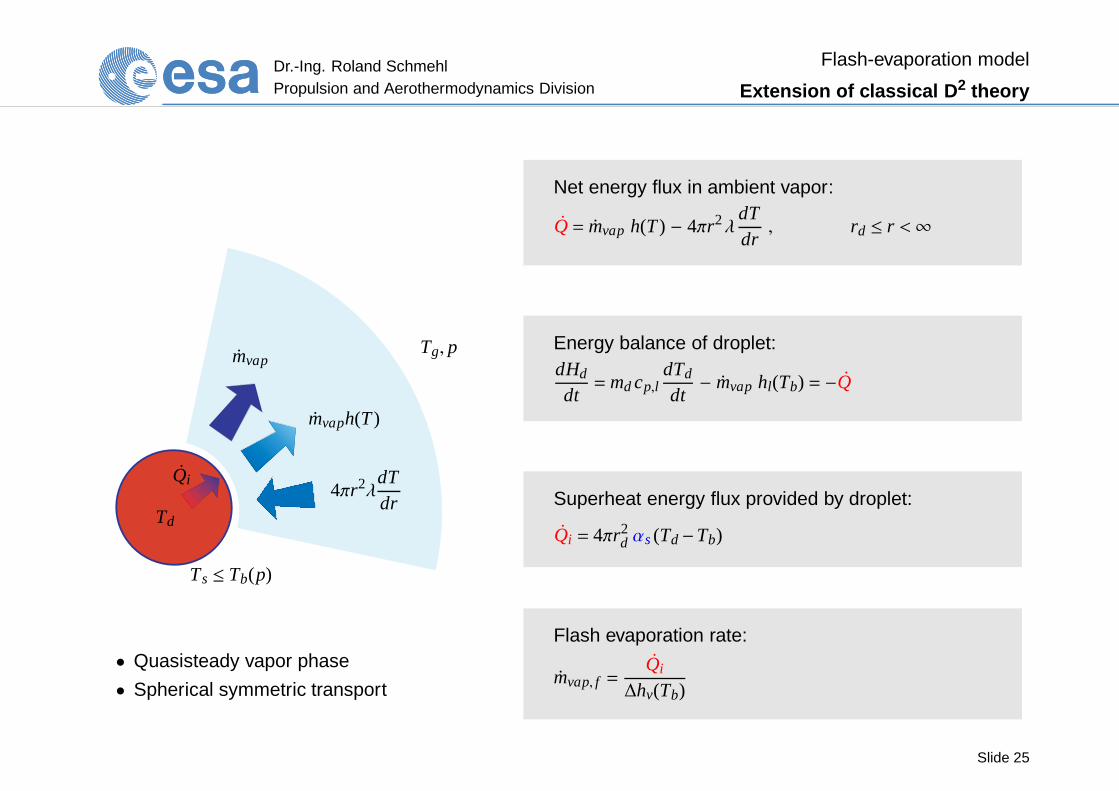
Extension of classical D 2 theory
mvap
mvaph(T )
4πr2λdTdr
Td
Ts ≤ Tb(p)
Tg, p
Qi
• Quasisteady vapor phase
• Spherical symmetric transport
Net energy flux in ambient vapor:
Q = mvap h(T ) − 4πr2λdTdr, rd ≤ r <∞
Energy balance of droplet:dHd
dt= md cp,l
dTd
dt− mvap hl(Tb) = −Q
Superheat energy flux provided by droplet:
Qi = 4πr2d αs (Td −Tb)
Flash evaporation rate:
mvap, f =Qi
∆hv(Tb)
Slide 25

Dr.-Ing. Roland SchmehlPropulsion and Aerothermodynamics Division
Flash-evaporation model
Model equations
Total evaporation rate (implicit formulation):
mvap = 2πrd Nu∗λre f
cp,re fln
1+BT
1−mvap, f
mvap
, BT =cp,re f (Tg−Tb)
∆hv
Convective correction (Frössling 1938, Aggarwal & Peng 1995):
Nu∗ = 2 + 0.552 Re12 Pr
13 , Re= ρ∞crelD/µre f , Pr= µre f cp,re f /λre f
Model balance equations:
dmd
dt= −mvap ,
dTd
dt=
[
mvap − 4πr2dαs
cp,l
]
Td −Tb
md
Slide 26
Dr.-Ing. Roland SchmehlPropulsion and Aerothermodynamics Division
Flash-evaporation model
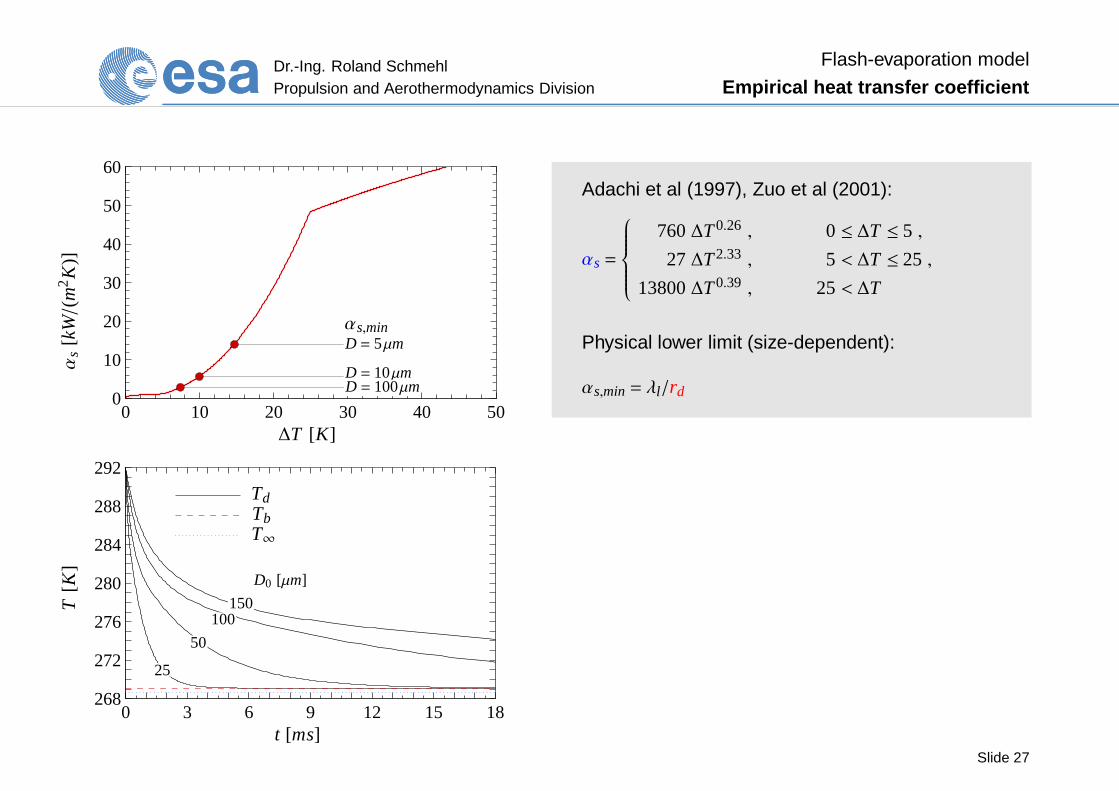
Empirical heat transfer coefficient
0 10 20 30 40 500
10
20
30
40
50
60
∆T [K]
αs
[kW/(m
2K
)]
αs,minD = 5µm
D = 10µmD = 100µm
0 3 6 9 12 15 18268
272
276
280
284
288
292
25
50
100150
D0 [µm]
TdTbT∞
t [ms]
T[K
]
Adachi et al (1997), Zuo et al (2001):
αs =
760∆T0.26 , 0 ≤ ∆T ≤ 5 ,
27∆T2.33 , 5 < ∆T ≤ 25 ,
13800∆T0.39 , 25< ∆T
Physical lower limit (size-dependent):
αs,min = λl/rd
Slide 27
Dr.-Ing. Roland SchmehlPropulsion and Aerothermodynamics Division
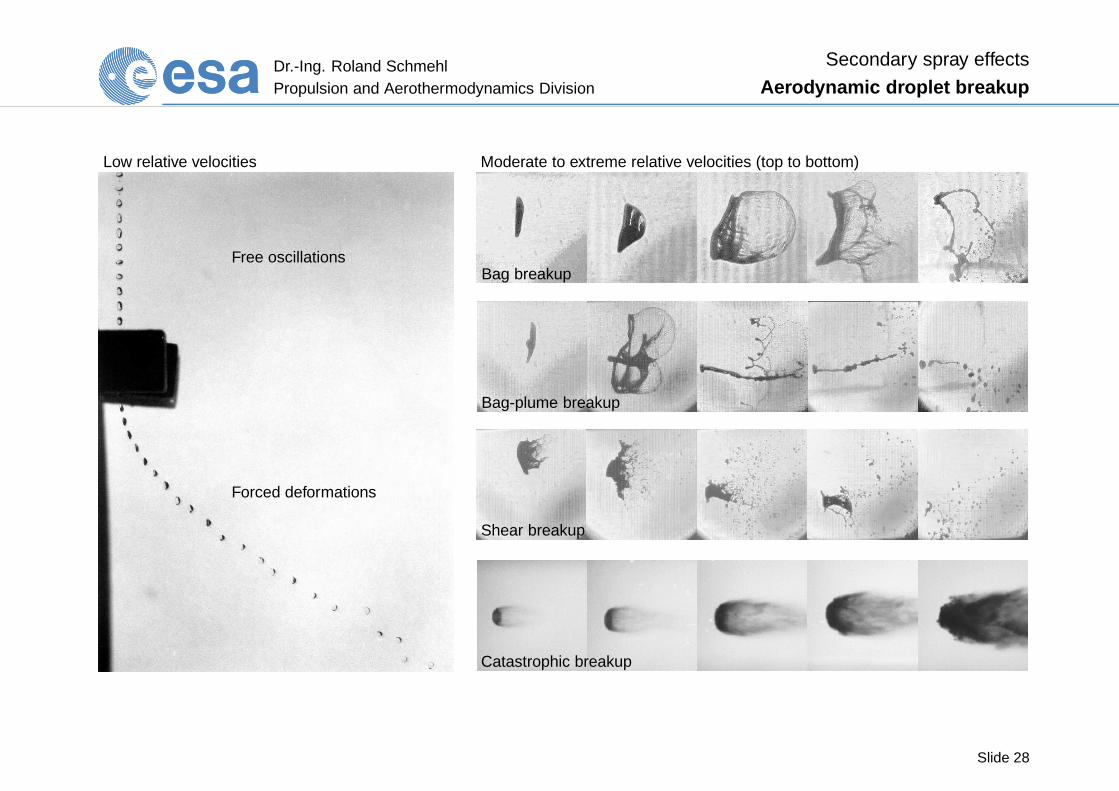
Secondary spray effects
Aerodynamic droplet breakup
Low relative velocities
Free oscillations
Forced deformations
Moderate to extreme relative velocities (top to bottom)
Bag breakup
Bag-plume breakup
Shear breakup
Catastrophic breakup
Slide 28
Dr.-Ing. Roland SchmehlPropulsion and Aerothermodynamics Division
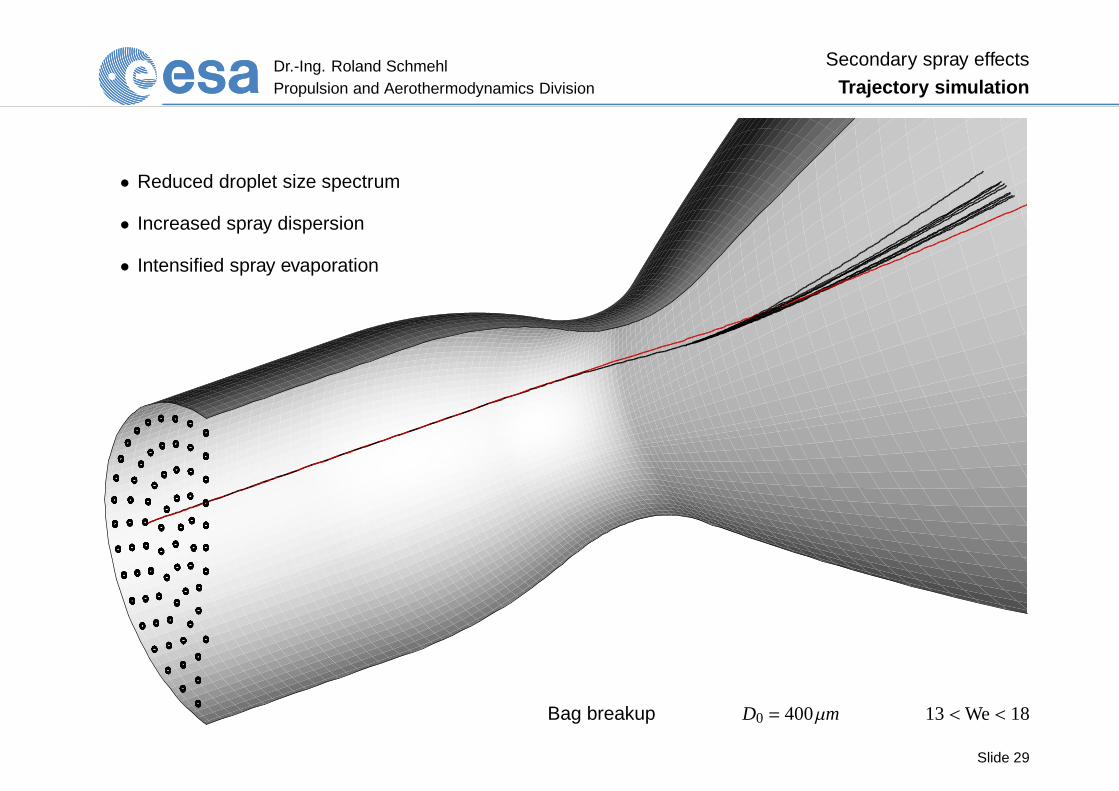
Secondary spray effects
Trajectory simulation
• Reduced droplet size spectrum
• Increased spray dispersion
• Intensified spray evaporation
Bag breakup D0 = 400µm 13<We< 18
Slide 29
Dr.-Ing. Roland SchmehlPropulsion and Aerothermodynamics Division
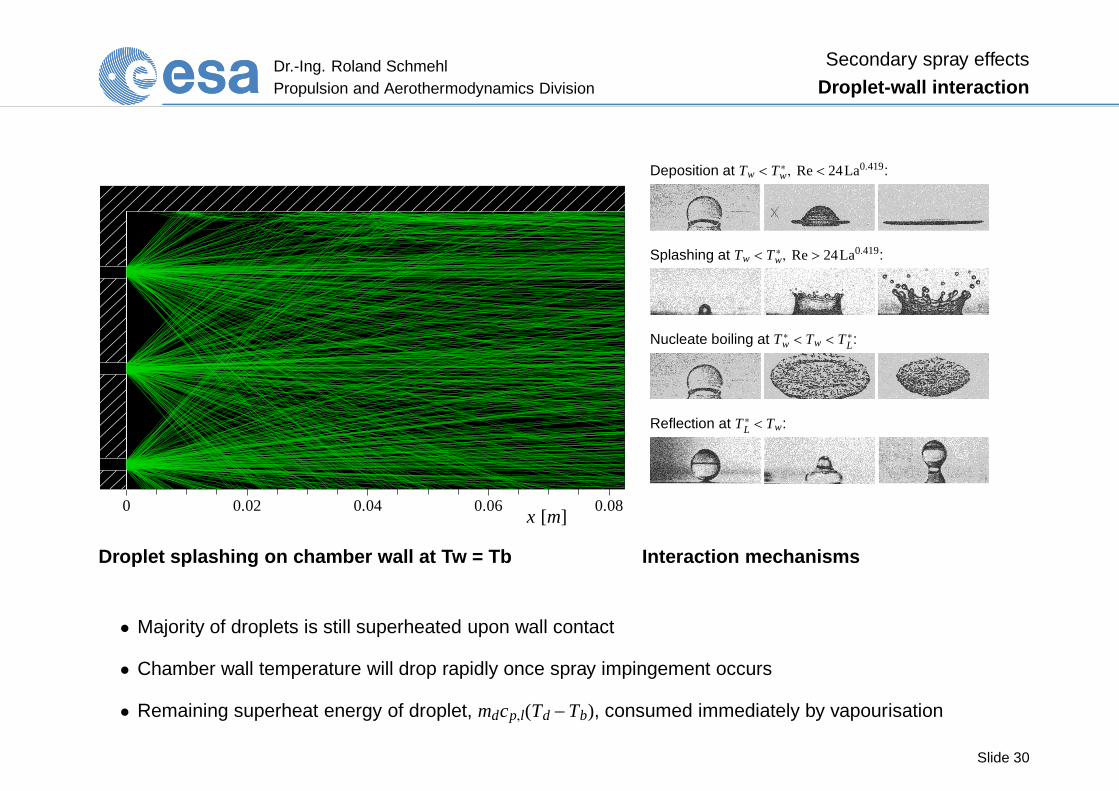
Secondary spray effects
Droplet-wall interaction
0 0.02 0.04 0.06 0.08x [m]
Deposition at Tw < T ∗w, Re< 24La0.419:
Splashing at Tw < T ∗w, Re> 24La0.419:
Nucleate boiling at T ∗w < Tw < T ∗L:
Reflection at T ∗L < Tw:
Droplet splashing on chamber wall at Tw = Tb Interaction mech anisms
• Majority of droplets is still superheated upon wall contact
• Chamber wall temperature will drop rapidly once spray impingement occurs
• Remaining superheat energy of droplet, mdcp,l(Td −Tb), consumed immediately by vapourisation
Slide 30
Dr.-Ing. Roland SchmehlPropulsion and Aerothermodynamics Division
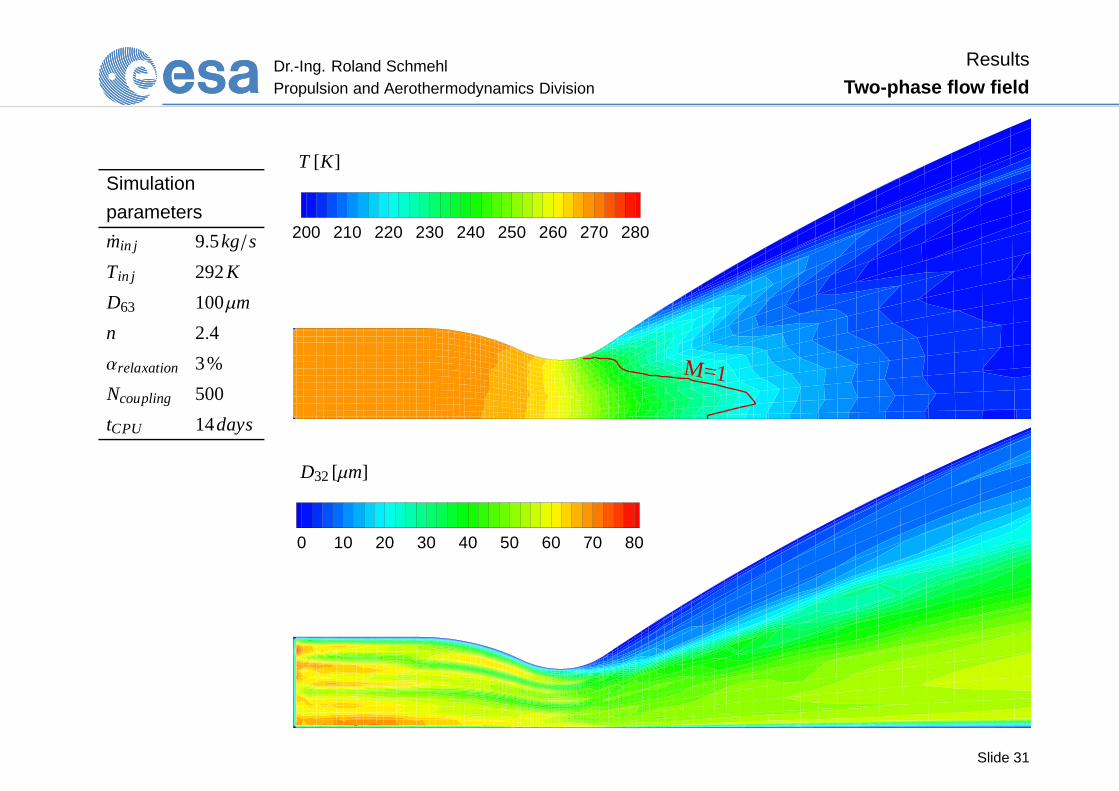
Results
Two-phase flow field
Simulation
parameters
min j 9.5kg/s
Tin j 292K
D63 100µm
n 2.4
αrelaxation 3%
Ncoupling 500
tCPU 14days
200 210 220 230 240 250 260 270 280
M=1
T [K]
0 10 20 30 40 50 60 70 80
D32[µm]
Slide 31
Dr.-Ing. Roland SchmehlPropulsion and Aerothermodynamics Division
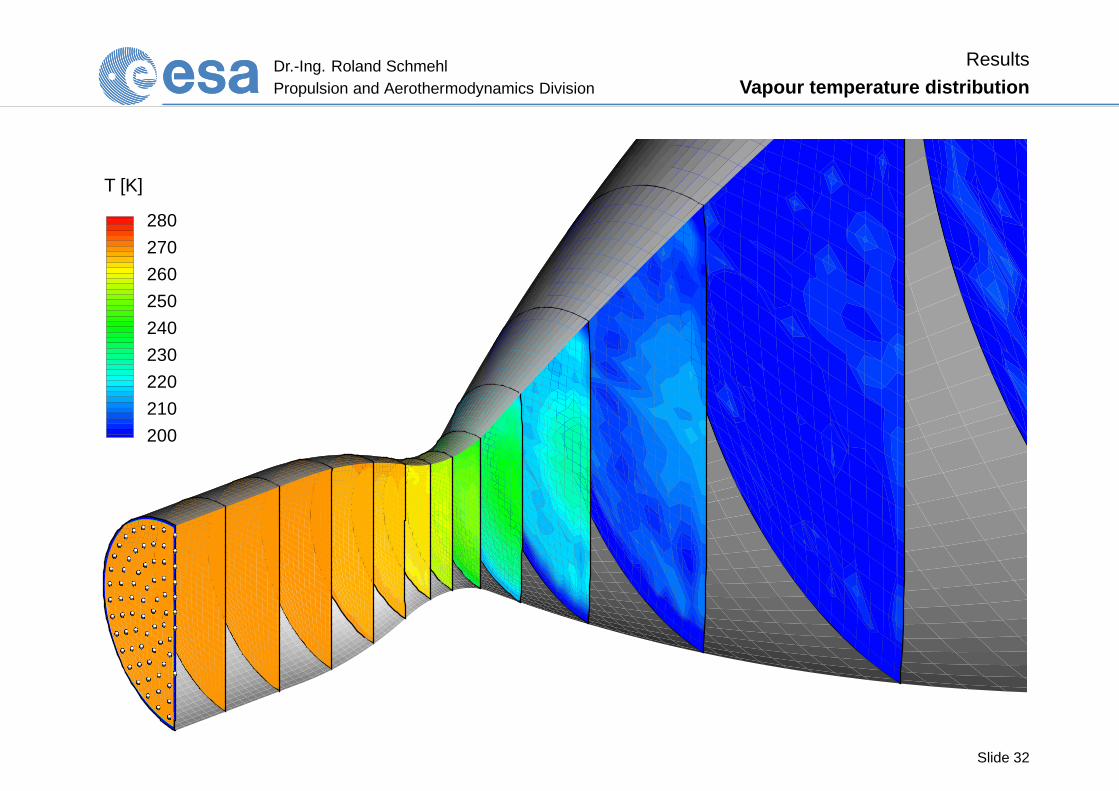
Results
Vapour temperature distribution
280
270
260
250
240
230
220
210
200
T [K]
Slide 32
Dr.-Ing. Roland SchmehlPropulsion and Aerothermodynamics Division
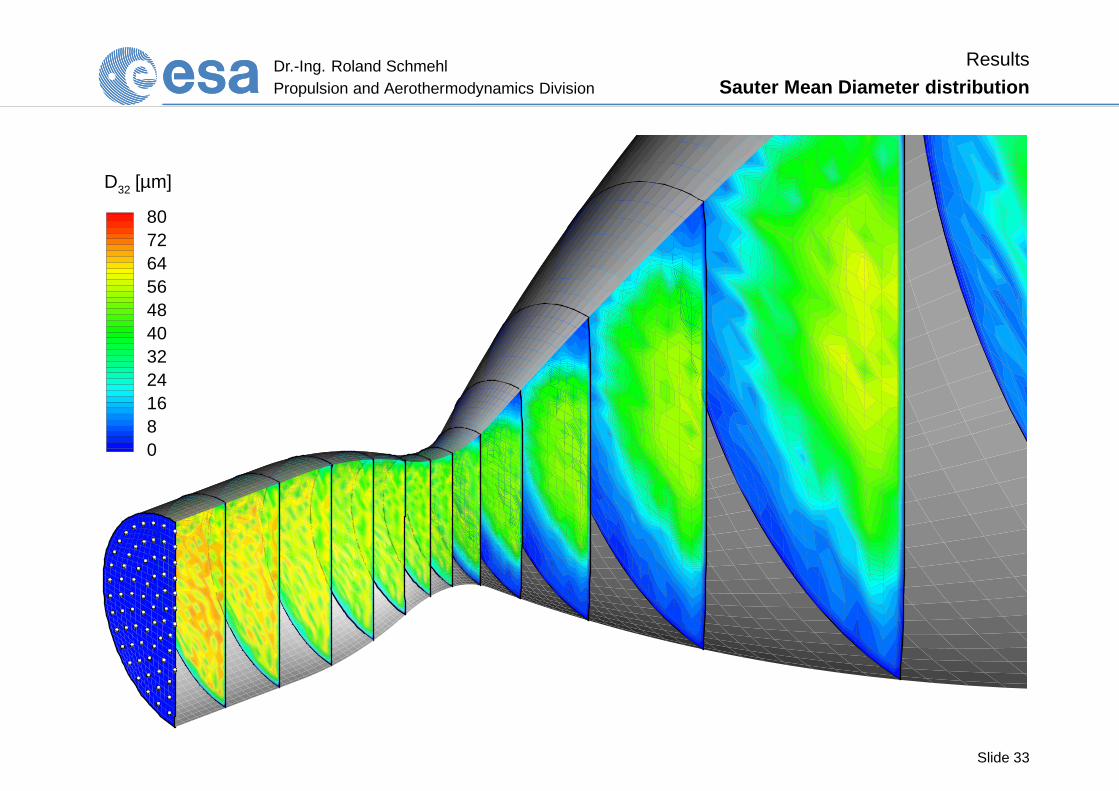
Results
Sauter Mean Diameter distribution
80726456484032241680
D32 [µm]
Slide 33

Dr.-Ing. Roland SchmehlPropulsion and Aerothermodynamics Division
Results
Spray deposit on chamber and nozzle wall
0 0.1 0.2 0.3 0.4 0.5 0.60
0.1
0.2
0.3
x [m]
mN
TO,l
[kg/
s]
Cylindrical part Convergent part Total deposit Total injection
m [kg/s] 2.273 2.534 5.155 9.500
m [kg] after 160ms 0.364 0.405 0.825 1.520
Slide 34

Dr.-Ing. Roland SchmehlPropulsion and Aerothermodynamics Division
Results
Effect of injection temperature
275 280 285 290 295 300260
265
270
275
280
285
Tstat @ thermocouple TTC12
Simulation - equilibrium Tw ≈ Tstat
Simulation - isothermal Tw = Tin j
Comparison indicates cooling of chamber wall
surface during preflow from Tin j to Tstat
Tst
at[K
]
Tin j [K]Slide 35
Dr.-Ing. Roland SchmehlPropulsion and Aerothermodynamics Division
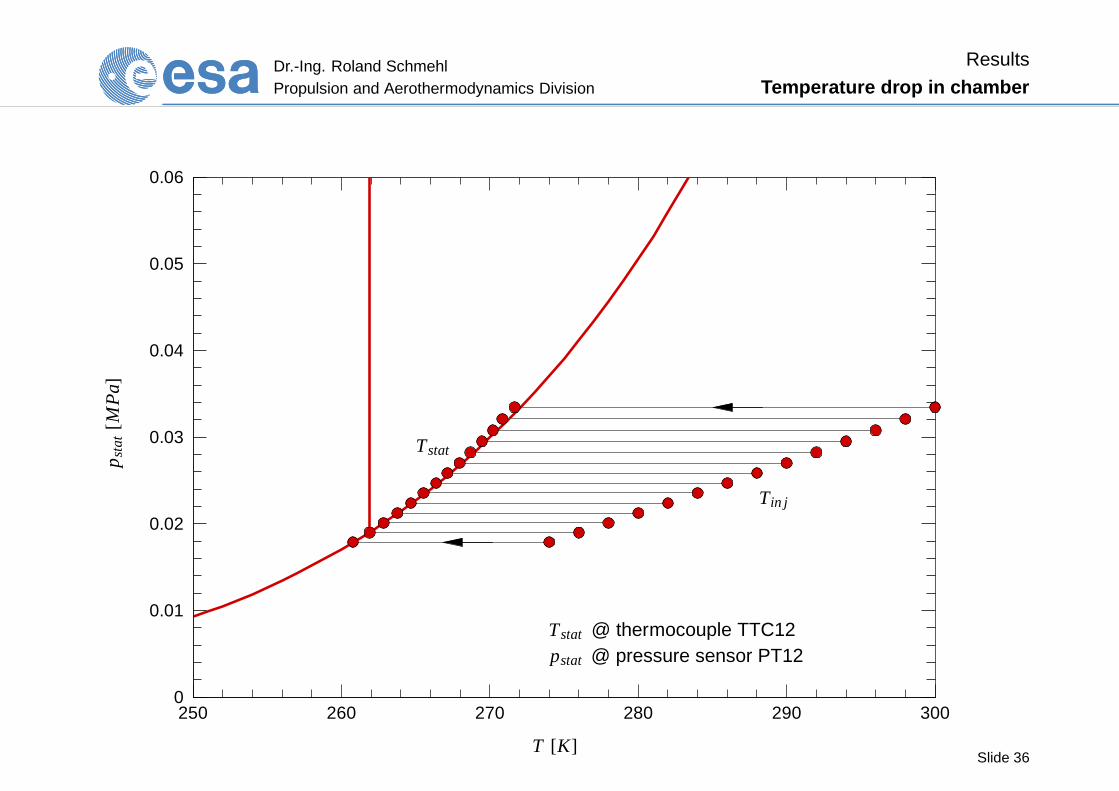
Results
Temperature drop in chamber
250 260 270 280 290 3000
0.01
0.02
0.03
0.04
0.05
0.06
Tstat @ thermocouple TTC12pstat @ pressure sensor PT12
Tstat
Tin j
T [K]
p sta
t[M
Pa]
Slide 36
Dr.-Ing. Roland SchmehlPropulsion and Aerothermodynamics Division
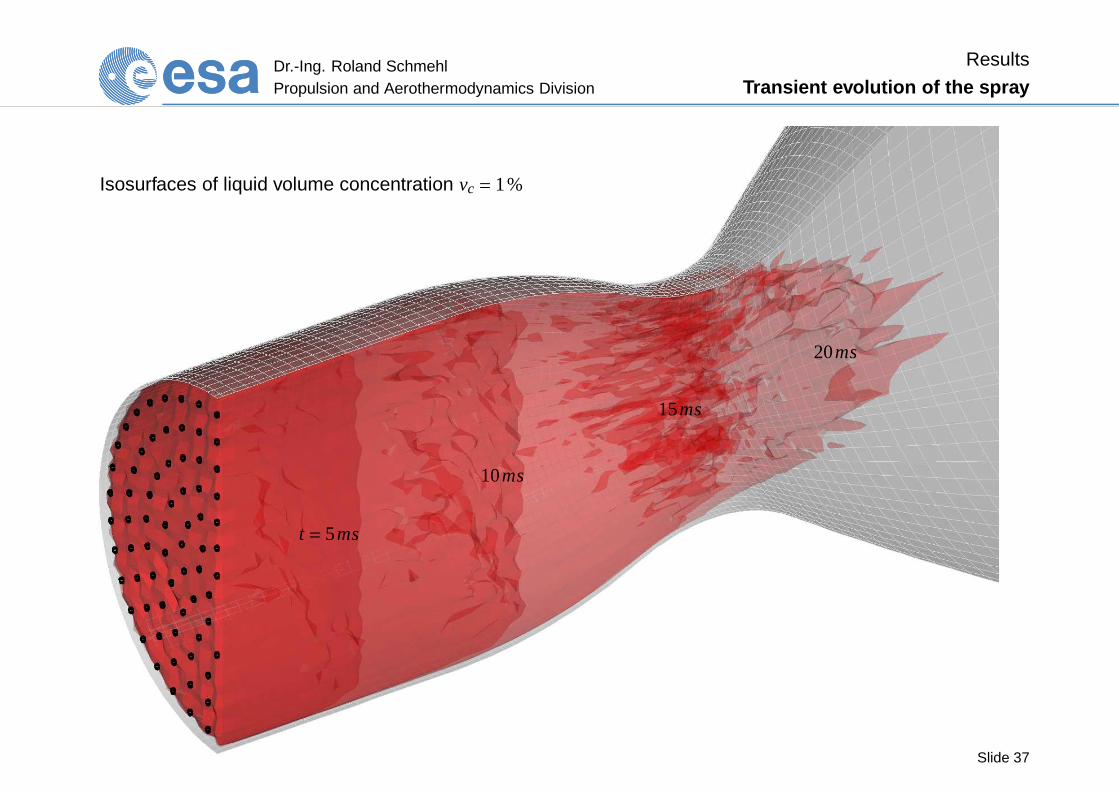
Results
Transient evolution of the spray
Isosurfaces of liquid volume concentration vc = 1%
t = 5ms
10ms
15ms
20ms
Slide 37
Dr.-Ing. Roland SchmehlPropulsion and Aerothermodynamics Division
Results
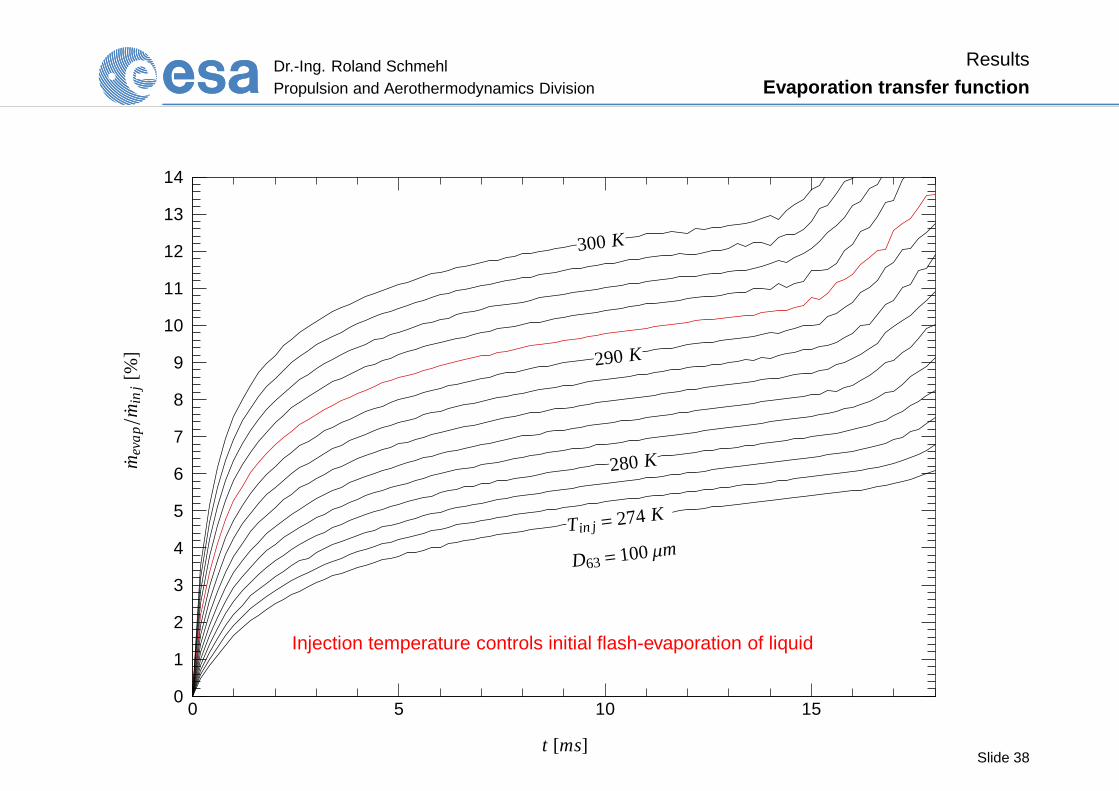
Evaporation transfer function
0 5 10 150
1
2
3
4
5
6
7
8
9
10
11
12
13
14
mev
ap/m
inj[%
]
t [ms]
Injection temperature controls initial flash-evaporation of liquid
Tin j = 274K
D63= 100µm
280 K
290 K
300 K
Slide 38

Dr.-Ing. Roland SchmehlPropulsion and Aerothermodynamics Division
Results
Mean droplet size along axis
0 0.1 0.2 0.3 0.4 0.5 0.60
10
20
30
40
50
60
70
80
90
100
D63,0 = 50µm
100µm
150µm
Size reduction due to
secondary breakup
x [m]
D32
[µm
]
Slide 39
Dr.-Ing. Roland SchmehlPropulsion and Aerothermodynamics Division
Results
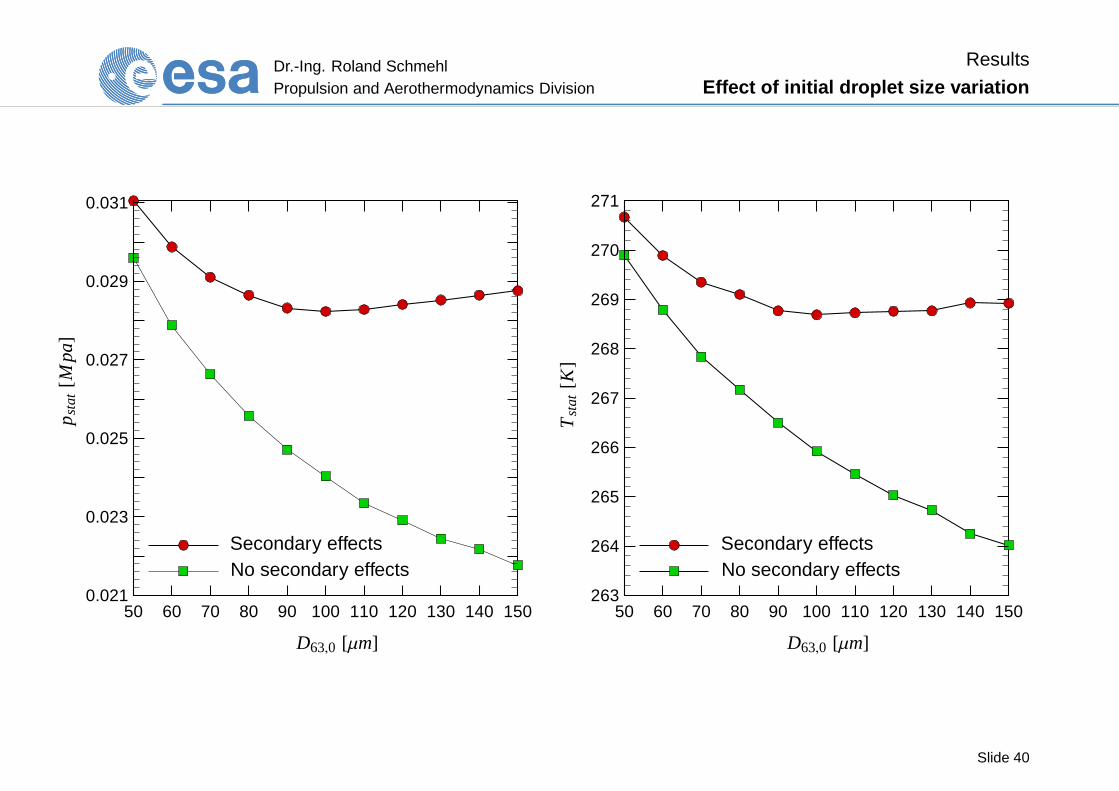
Effect of initial droplet size variation
50 60 70 80 90 100 110 120 130 140 1500.021
0.023
0.025
0.027
0.029
0.031
p sta
t[M
pa]
D63,0 [µm]
Secondary effectsNo secondary effects
50 60 70 80 90 100 110 120 130 140 150263
264
265
266
267
268
269
270
271
Tst
at[K
]
D63,0 [µm]
Secondary effectsNo secondary effects
Slide 40
Dr.-Ing. Roland SchmehlPropulsion and Aerothermodynamics Division
Results
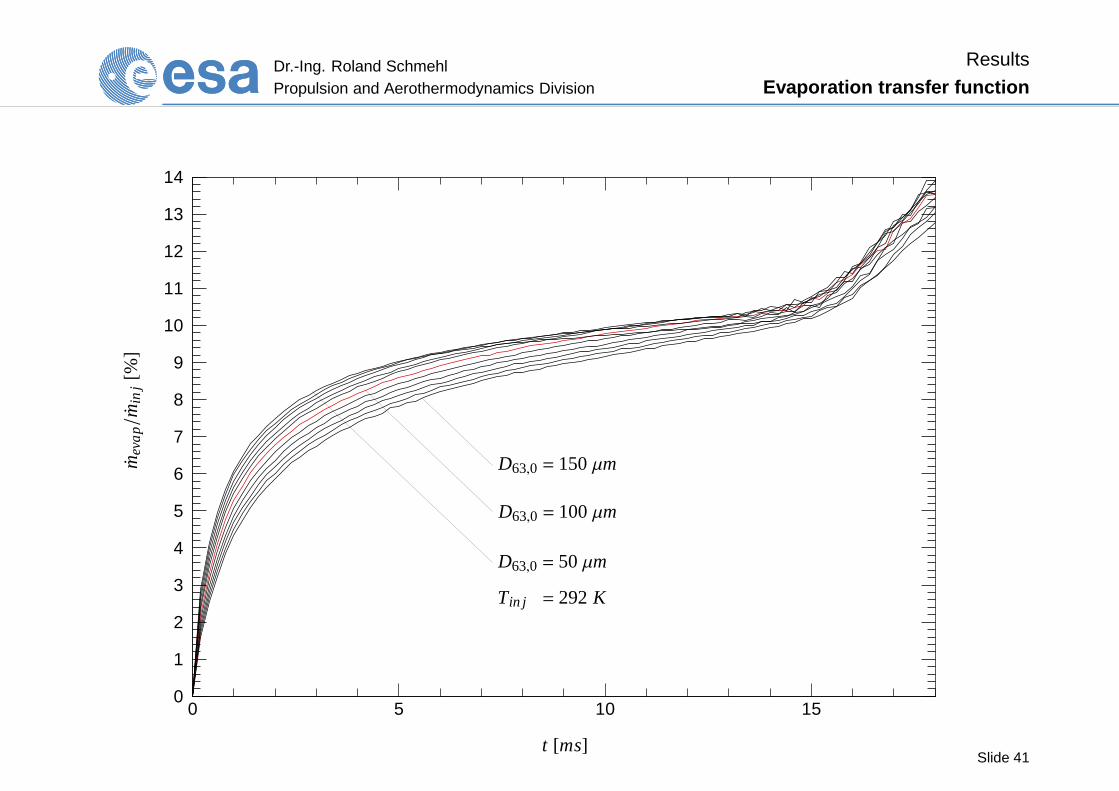
Evaporation transfer function
0 5 10 150
1
2
3
4
5
6
7
8
9
10
11
12
13
14
mev
ap/m
inj[%
]
t [ms]
D63,0 = 150µm
D63,0 = 100µm
D63,0 = 50µm
Tin j = 292K
Slide 41
Dr.-Ing. Roland SchmehlPropulsion and Aerothermodynamics Division
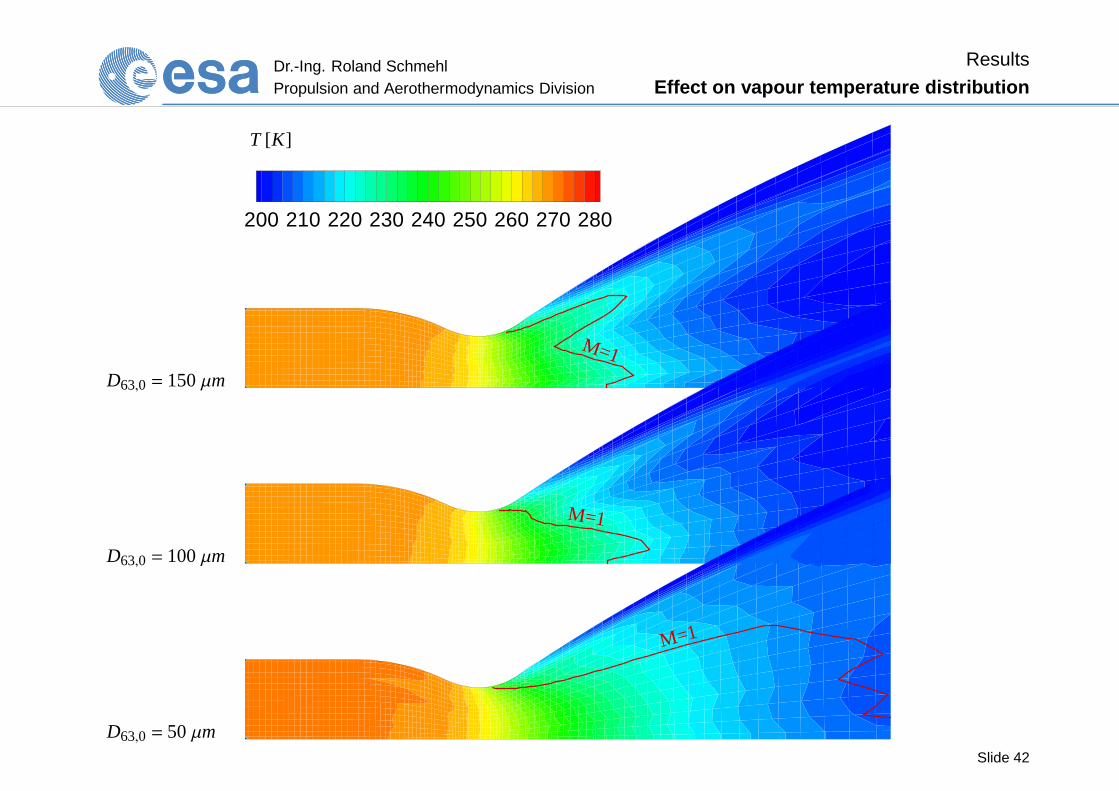
Results
Effect on vapour temperature distribution
D63,0 = 150µm
200 210 220 230 240 250 260 270 280
M=1
T [K]
D63,0 = 100µm
M=1
D63,0 = 50 µm
M=1
Slide 42
Dr.-Ing. Roland SchmehlPropulsion and Aerothermodynamics Division
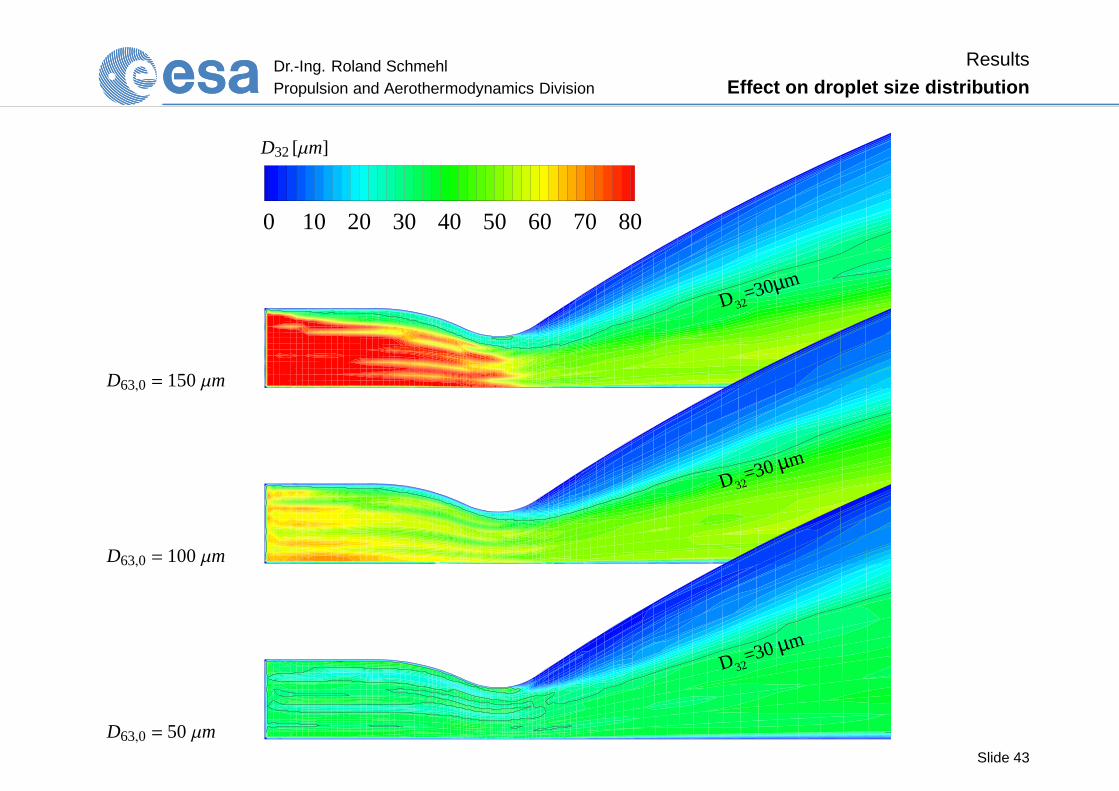
Results
Effect on droplet size distribution
D63,0 = 150µm
0 10 20 30 40 50 60 70 80
D32=30µm
D32[µm]
D63,0 = 100µm
D32=30µm
D63,0 = 50 µm
D32=30 µm
Slide 43
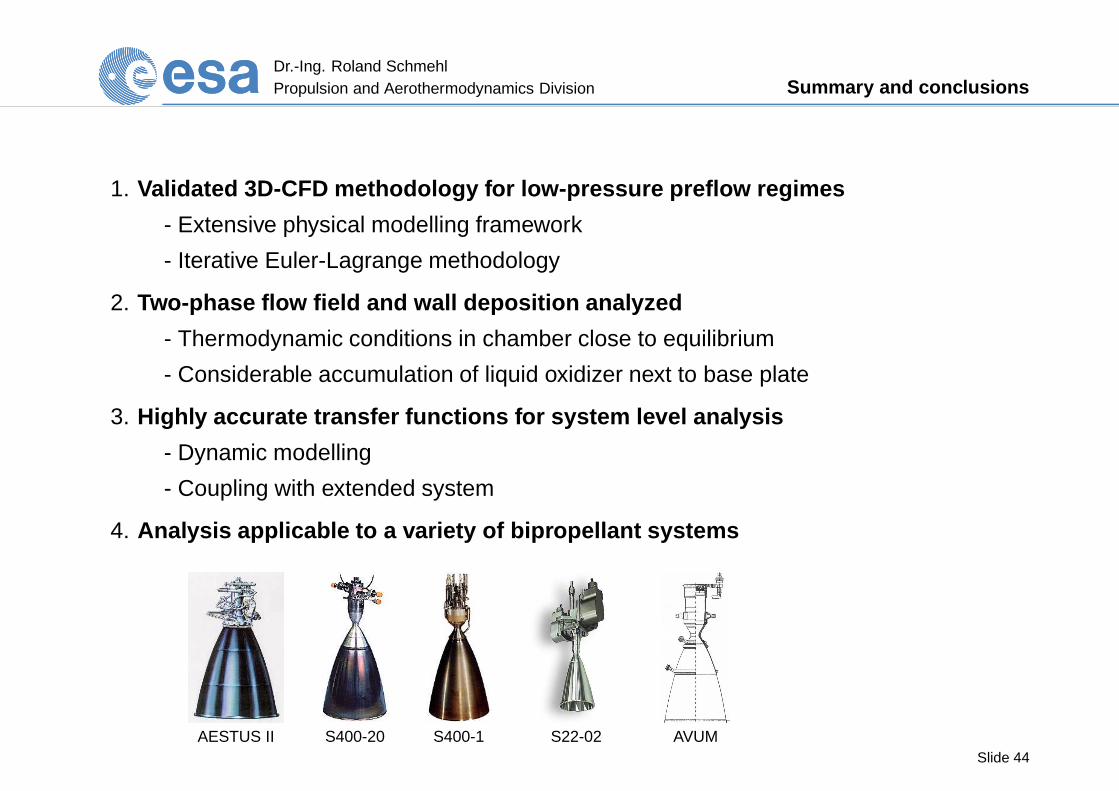
Dr.-Ing. Roland SchmehlPropulsion and Aerothermodynamics Division Summary and conclusions
1. Validated 3D-CFD methodology for low-pressure preflow regi mes
- Extensive physical modelling framework
- Iterative Euler-Lagrange methodology
2. Two-phase flow field and wall deposition analyzed
- Thermodynamic conditions in chamber close to equilibrium
- Considerable accumulation of liquid oxidizer next to base plate
3. Highly accurate transfer functions for system level analys is
- Dynamic modelling
- Coupling with extended system
4. Analysis applicable to a variety of bipropellant systems
AESTUS II S400-20 S400-1 S22-02 AVUMSlide 44
Dr.-Ing. Roland SchmehlPropulsion and Aerothermodynamics Division Vacancy at ESTEC-ESA
What: ESA Internal Research Fellowship
Where: Propulsion and Aerothermodynamics Division, ESTEC-ESA, Noordwijk
When: ASAP
Duration: 2 years
Topic: Combustion modelling with emphasis on ignition delay
Who: PhD researchers (with or without final degree)
Contact: Roland [email protected]@propulsion.esa.int
Slide 45