Embed Size (px)
Citation preview
Computational analyses of transcriptomic datareveal the dynamic organization of theEscherichia coli chromosome underdifferent conditionsQin Ma1, Yanbin Yin2, Mark A. Schell1, Han Zhang3, Guojun Li1,4 and Ying Xu1,5,6,*
1Computational Systems Biology Laboratory, Department of Biochemistry and Molecular Biology and Instituteof Bioinformatics, University of Georgia, Athens, GA 30602, USA, 2Department of Biological Sciences, NorthernIllinois University, DeKalb, IL 60115-2857, USA, 3Department of Automation and Intelligent Science, College ofInformation Technical Science, Nankai University, Tianjin 300071, China, 4School of Mathematics, ShandongUniversity, Jinan 250100, China, 5The BioEnergy Science Center, USA and 6College of Computer Science andTechnology, Jilin University, Changchun, Jilin 130012, China
Received December 6, 2012; Revised March 20, 2013; Accepted March 21, 2013
ABSTRACT
The circular chromosome of Escherichia coli hasbeen suggested to fold into a collection of sequen-tially consecutive domains, genes in each of whichtend to be co-expressed. It has also been suggestedthat such domains, forming a partition of thegenome, are dynamic with respect to the physio-logical conditions. However, little is known aboutwhich DNA segments of the E. coli genome formthese domains and what determines the boundariesof these domain segments. We present a computa-tional model here to partition the circular genomeinto consecutive segments, theoretically suggestiveof the physically folded supercoiled domains, alongwith a method for predicting such domains underspecified conditions. Our model is based on ahypothesis that the genome of E. coli is partitionedinto a set of folding domains so that the totalnumber of unfoldings of these domains in thefolded chromosome is minimized, where a domainis unfolded when a biological pathway, consisting ofgenes encoded in this DNA segment, is beingactivated transcriptionally. Based on this hypoth-esis, we have predicted seven distinct sets of suchdomains along the E. coli genome for seven physio-logical conditions, namely exponential growth, sta-tionary growth, anaerobiosis, heat shock, oxidative
stress, nitrogen limitation and SOS responses.These predicted folding domains are highly stablestatistically and are generally consistent withthe experimental data of DNA binding sites ofthe nucleoid-associated proteins that assist thefolding of these domains, as well as genome-scaleprotein occupancy profiles, hence supporting ourproposed model. Our study established for the firsttime a strong link between a folded E. coli chromo-somal structure and the encoded biologicalpathways and their activation frequencies.
INTRODUCTION
It was discovered in 1970s that the Escherichia colichromosome is organized into a collection of consecutiveplectonemic DNA loops, each having its two ends con-nected with each other by binding with nucleoid-associated proteins (NAPs) (1,2). Each of such loops,also called a ‘supercoiled domain’ or simply ‘supercoil’,ranges between 10 and 100 kb in sequence length (3) andfolds independent of the other loops into a negativelycoiled conformation. It has been speculated that thefolded chromosomal structure is dynamic (4), and thedomain boundaries are distributed along the genome ina seemingly random manner (5). Imaging data haverevealed that the folded conformation of the E. colichromosome changes in response to the changingcellular and environmental conditions (6). For instance,
*To whom correspondence should be addressed. Tel: +1 706 542 9779; Fax: +1 706 542 9751; Email: [email protected]
The authors wish it to be known that, in their opinion, the first two authors should be regarded as joint First Authors.
5594–5603 Nucleic Acids Research, 2013, Vol. 41, No. 11 Published online 17 April 2013doi:10.1093/nar/gkt261
� The Author(s) 2013. Published by Oxford University Press.This is an Open Access article distributed under the terms of the Creative Commons Attribution Non-Commercial License (http://creativecommons.org/licenses/by-nc/3.0/), which permits non-commercial re-use, distribution, and reproduction in any medium, provided the original work is properly cited. For commercialre-use, please contact [email protected]
Dow
nloaded from https://academ
ic.oup.com/nar/article/41/11/5594/2411323 by U
niversity of Bologna user on 15 Decem
ber 2021

the chromosome has substantially more supercoils duringthe exponential growth than during the stationary phase,suggesting that the physical organization of the chromo-some may play a role in the regulation of gene expression(7,8). Interestingly, some of the NAPs, which can bendor bridge DNAs, are also transcription factors such asH-NS, FIS and IHF, providing further evidence aboutthe possible links between chromosomal folding and tran-scription regulation.
The advent andmaturation of various experimental tech-niques such as ‘CHIP-sequencing’ (9–12) techniques foridentification of the DNA-binding sites of NAPs and the‘chromatin conformation capture’ techniques (13–15) haveclearly accelerated the study of the folded chromosomalstructures, but mostly of eukaryotic organisms. As ofnow, only limited data on the folded E. coli chromosomalstructures have been collected mostly focused on thebinding of NAPs on the DNA. One recent study on bacter-ial chromosomes usinghigh-resolutionmicroscope revealedthat H-NSs may play a more important role in bacterialchromosomal organization than the other NAPs (16).
A number of computational studies have also beencarried out with the goal of understanding the foldedstructures of bacterial chromosomes. For instance,analyses of E. coli ‘omic’ data have revealed periodicitiesalong the genome of co-expressed genes (4,17), as well asof co-evolved genes (18) and cis-regulatory elements(19,20), all seemingly related to the supercoils in thefolded chromosomal structure. A model for the localarrangement of the E. coli chromosomal loci has beenproposed based mostly on the geometric consideration(21). In addition, studies have been carried out aimingto capture the relationship among the loop domainsbased on a confinement and entropic repulsion model aswell as the information about transcription regulationnetworks (22). While these studies have provided hintsabout possible links between sequence level signals andthe folded chromosomal structures, none of them haveestablished a clear definition of the individual foldingdomains with detailed boundary information, not tomention their dynamic nature with respect to differentphysiological conditions.
We have recently discovered that operons of more fre-quently activated pathways tend to group into fewersequential clusters in a bacterial genome (23), and specif-ically they tend to minimize the overall genomic spreadamong the consecutive operons of the same metabolicand regulatory pathway (24,25) across all the pathways.One possible explanation of this discovery is that theE. coli chromosome is organized into consecutivedomains that minimize the total number of the unfoldingof these domains during the life cycle of the organism,where such a domain is unfolded when a biologicalpathway, consisting of genes encoded in this DNAsegment, is being activated transcriptionally; here we usethe total number of unfolding to approximate the totalenergy needed to unfold the relevant folded domains.This hypothesis has been strongly supported by ourrecent study of the global genomic arrangement of bacter-ial operons (23). Based on this hypothesis, we have pre-dicted seven distinct sets of folding domains of the E. coli
genome under seven different physiological conditions: ex-ponential growth, stationary phase, anaerobiosis, heatshock, oxidative stress, nitrogen limitation and SOS re-sponses. We found that (i) the predicted sets of foldingdomains are highly stable with respect to perturbationsto the gene-expression data used to make the prediction;(ii) they are generally consistent with the limited experi-mental data on the folded supercoil structures collectedunder the exponential and stationary growth conditions;and (iii) their boundaries are consistent with the availableNAP-binding sites and genome-scale protein occupancydata, hence supporting our prediction. We believe thatthis study provides an effective framework for elucidationof the chromosomal organization, its dynamic nature andits functional relationship to transcription regulation ofE. coli and other bacteria.
MATERIALS AND METHODS
Data acquisition
We retrieved the genes encoding the 347 metabolicpathways of E. coli K12 from EcoCyc (26), and the ex-pression data from the M3D database (27), which containgenome-scale expression data of E. coli collected under466 conditions. In all, 527 cis-regulatory binding sites ofsix NAPs (Fis, H-NS, HU, IHF, Lrp and StpA) in theE. coli genome were downloaded from RegulonDB (28),and 537 binding regions of H-NS under stationary growthconditions are downloaded from (9). In addition, 253highly expressed genes were obtained from HEG-DB(29), and 272 extensive protein occupancy domains(EPODs) of the E. coli genome are downloaded from (30).
Identification of the M3D growth condition groupsassociated with different folded structuresof the chromosome
Based on the knowledge that the E. coli chromosome foldsinto different conformations during the exponential andstationary growths, we expect that under some othergrowth conditions, the chromosome may fold into alter-nate conformations to facilitate the efficient activation ofthe genes for pathways required for each such class ofgrowth conditions. For each folded structure engenderedunder certain growth conditions, we anticipate that thereshould be a set of gene responses consistent across theseconditions. We call each such class of conditions as aM3D growth condition (MGC) group, and this set ofgenes as its ‘marker genes’. The determination of eachset of marker genes is made based on literature research(31–38) and our understanding of different growth condi-tions (see Supplementary Method S1). The detailedgene list for each of the seven conditions is given inSupplementary Table S1.We have used the following procedure to identify the
MGC group for each growth condition, collectivelydenoted as C, along with the associated gene-expressiondata in M3D. Let G denote the entire gene set of E. coliand Gq � G be a list of specified marker genes whoseactivations we suspect should require a distinct foldedstructure of the chromosome, with Gj j and Gq
�� ��
Nucleic Acids Research, 2013, Vol. 41, No. 11 5595
Dow
nloaded from https://academ
ic.oup.com/nar/article/41/11/5594/2411323 by U
niversity of Bologna user on 15 Decem
ber 2021
representing the number of genes in G and Gq, respect-ively. Also let A ¼ faijgjGj�jCj denote the whole M3Ddataset, with aij representing the expression value ofgene i under condition j and Cj j representing the numberof conditions in the M3D dataset, and A0 ¼ fa0ijgm�n be a0/1 matrix, with a0ij being 1 if aij is among the highest(or the lowest depending on specific applications) 25%of the values in fai1, ai2, . . . , aing, otherwise 0, wherefai1, ai2, . . . , aing is the ith row of matrix A, i.e. the expres-sion levels of gene i under all the conditions. Our goal isto identify MGCs as maximal subsets of C under whichthe majority of the marker genes in each Gq are highlyexpressed, i.e. their corresponding values in A0 being 1.Specifically, we define
MGCq ¼ j
����P
i2Gqa0ij
Gq
�� �� 2 0:8, 1½ �, 1 � j � n
( )
for each given Gq. In case an MGCq is empty, we will goback to adjust the threshold in ½0:8, 1� so each MGCq is anon-empty set.
Prediction of the folding domains for each MGC group
Our main hypothesis (see ‘Introduction’ section) impliesthat (i) the genome of E. coli is partitioned into a set of con-tiguous domains, each independently folded into a compactstructure in the folded chromosome; and (ii) under differ-ent growth conditions, the chromosome forms differentsets of such folding domains, where the domain regionsare so determined that minimizes the total number of un-folding of the folded domains to make their genes tran-scriptionally accessible when needed. Based on these, wehave made a computational prediction of the domainboundaries along the genome by formulating the problemas a constrained optimization problem below.Based on the published literature, we assume that the
folding domains range L=10kb and U=100 kb inlength (3), and the domain boundaries can be only ininter-operonic regions. So our problem formulation isto find a partition of the E. coli K12 circular genome sothat the following objective function is minimized:
OFpathway ¼ OF1+�OF2 ð1Þ
with
OF1 ¼XNi¼1
fiti ð2Þ
and
OF2 ¼XNi¼1
fiXMj¼1
!ij ð3Þ
where M is the number of to-be-identified foldingdomains; OF1 is the number of unfolding of the predicteddomains to make the relevant pathways transcriptionallyaccessible (we assume that each domain will refold afterthe transcription of its relevant genes is all done so theunfolding is needed again when its genes need to betranscribed later); N is the number of known metabolic
pathways encoded in the organism; fi represents the acti-vation frequency of the ith pathway, estimated from thegene expression data in M3D using the method given in(24); ti is the number of predicted folding domains thathave genes encoding the ith pathway and OF2 approxi-mates the unfolding energy ‘wasted’ on unfolding thefolded domains under the current condition (here weassume that (i) the effort (or energy) in unfolding afolding domain is proportional to the number ofoperons it contains; and (ii) the energy wasted is propor-tional to the number of operons contained in the domainbut not involved in the pathway being activated under thecurrent condition). For the jth domain (j 2 ½1,M�) contain-ing sj operons, sij is the number of operons in thejth domain and in the ith pathway; !ij =0 if sij =0, other-wise !ij ¼ sj� sij; � is a scaling factor whose value can beadjusted with its default value set at 1.
We noted that the pathway information alone does notconstrain the domain prediction problem to a satisfactorylevel, making the problem a highly under-constrained op-timization problem with a large number of solutions;hence, we included co-expression data as an additionalconstraint to further constrain the prediction problem.Intuitively we expect that genes in the same foldingdomain should be co-expressed more frequently thangenes not in the same domain. We therefore developedthe following objective term OFexpression over domainboundaries (xj, yjÞ, with xj and yj being two adjacentgenes separated by an inter-operonic region, representingthe last and the first gene of the to-be-identified jth and(j+1)th folding domains under the current growth condi-tion, respectively:
OFexpression ¼XMj¼1
L xj, yj� �
ð4Þ
where L() is designed to measure the overall co-expres-sion level among gene pairs across each domain boundaryxj, yj� �
, which can be determined as to find a set of M genepairs xj, yj
� �as potential domain boundaries soPM
j¼1 L xj, yj� �
is minimized,
L x, yð Þ ¼XX,Yð Þ are coexpressed
dX � dx, dY � dydY � dX � 20K
nX,Y � SðpX, pYÞffiffiffiffiffiffiffiffiffiffiffiffiffiffiffiffiffiffiffiffiffiffiffiffiffiffiffiffiffiffiffiffiffiffiffiffiffiffiffiffiffiffiffiffiffiffiffiffiffiffiffiffiffiffiffiðdx � dX+1Þ � ðdY � dy+1Þ
p !
ð5Þ
whereM> 0 is to be determined through solving this mini-mization problem; dx represents the genomic locationof gene x; X,Yð Þ denotes all the gene pairs across theinter-genic region between genes x and y with distance�20 kb; pX and pY are vectors of expression levels ofX and Y under the current growth condition; nX,Y is thenumber of MGCs under which X and Y are co-expressed;and SðÞ is the Spearman rank correlation coefficient (39).
Now our enhanced formulation of the domain identifi-cation problem is defined as ‘to find a partition of thegiven circular genome to minimize the following’
AOF S,Eð Þ ¼ OF1+�OF2+�OFexpression ð6Þ
5596 Nucleic Acids Research, 2013, Vol. 41, No. 11
Dow
nloaded from https://academ
ic.oup.com/nar/article/41/11/5594/2411323 by U
niversity of Bologna user on 15 Decem
ber 2021
where S and E represent the first and the last inter-operonic regions of the genome, respectively.
This optimization problem can be solved using adynamic programming approach. Specifically, we havethe following recursive relationship, which can be provedwithout a substantial effort:
AOF S, ið Þ ¼ minj2½i�U, i�L�
½AOF S, jð Þ+AOF j, ið Þ� ð7Þ
which gives rise to a straightforward dynamic programm-ing algorithm for solving this optimization problem, andfurther gives rise to the predicted domain boundariesunder the specified growth conditions.
Measuring distance between two sets of predictedfolding domains
To assess the prediction performance of the above algo-rithm, we need a capability to estimate the distancebetween two different sets of predicted folding domains(i.e. the distance between two different genomic parti-tions). Consider two sets of predicted domain boundaries(each represented as a set of inter-operonic regions), B1
and B2, of the same (circular) genome. Let I ¼ B1 \B2 and
U ¼ B1 [B2 represent the intersection and union of B1
and B2, respectively. Note that the distance between B1
and B2 should be 0 if I and U are identical. The larger thedifference between I and U is, the larger the distancebetween B1 and B2 should be. In defining the distance,we consider that the distance between B1 and B2 islarger when boundaries in U� I are more spread outacross the genome when jU� Ij is fixed. Let fxig1�i�jIjand fyjg1�j�jUj denote the sets of predicted boundaries of
I and U, respectively, ordered clockwise along the circulargenome starting at the origin of replication, and x0ðy0Þ andx Ij j+1ðy Uj j+1Þ be the origin of replication. For any two con-secutive boundaries in I, xi and xi+1, the number ofboundaries in U� I between xi and xi+1 is denoted as
dðxi, xi+1Þ so the average value is � ¼
PjIj
i¼0dðxi, xi+1Þ
Ij j+1 ¼jU�IjIj j+1 .
Clearly the larger the jxi ¼ argfd xi, xi+1ð Þ � �gj value is,the more spread out across the genome the boundariesin U� I are. We define the distance between B1 and B2 as
S ¼ 1�jIj
Uj j
� ��jxi ¼ argfd xi, xi+1ð Þ � �gj
jIjði ¼ 0, 1, . . . , Ij jÞ
ð8Þ
We can see that the more similar two genomic partitionsare, the smaller the distance will be.
RESULTS
Generation of MGC groups
Knowing that the E. coli chromosome folds into differentstructures during exponential growth and stationarygrowth (1), we identified the subset of the 466 growthconditions in M3D associated with each of these twogrowth phases. Specifically, we used the expression levels
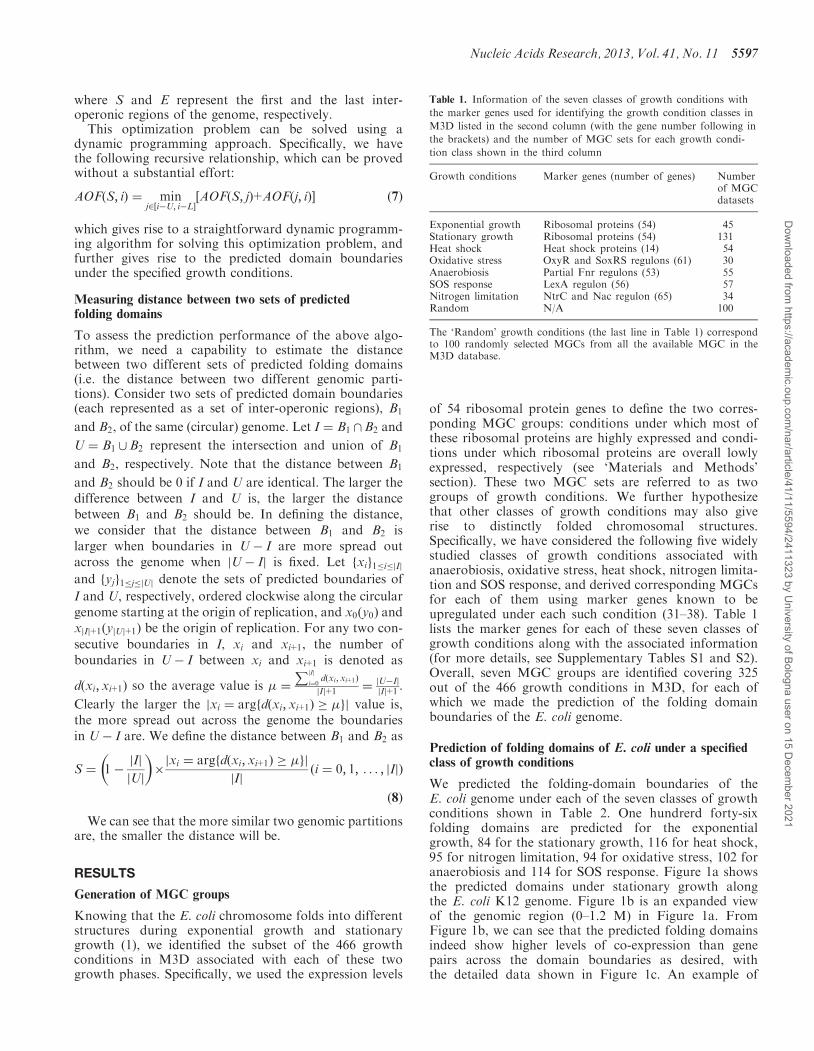
of 54 ribosomal protein genes to define the two corres-ponding MGC groups: conditions under which most ofthese ribosomal proteins are highly expressed and condi-tions under which ribosomal proteins are overall lowlyexpressed, respectively (see ‘Materials and Methods’section). These two MGC sets are referred to as twogroups of growth conditions. We further hypothesizethat other classes of growth conditions may also giverise to distinctly folded chromosomal structures.Specifically, we have considered the following five widelystudied classes of growth conditions associated withanaerobiosis, oxidative stress, heat shock, nitrogen limita-tion and SOS response, and derived corresponding MGCsfor each of them using marker genes known to beupregulated under each such condition (31–38). Table 1lists the marker genes for each of these seven classes ofgrowth conditions along with the associated information(for more details, see Supplementary Tables S1 and S2).Overall, seven MGC groups are identified covering 325out of the 466 growth conditions in M3D, for each ofwhich we made the prediction of the folding domainboundaries of the E. coli genome.
Prediction of folding domains of E. coli under a specifiedclass of growth conditions
We predicted the folding-domain boundaries of theE. coli genome under each of the seven classes of growthconditions shown in Table 2. One hundrerd forty-sixfolding domains are predicted for the exponentialgrowth, 84 for the stationary growth, 116 for heat shock,95 for nitrogen limitation, 94 for oxidative stress, 102 foranaerobiosis and 114 for SOS response. Figure 1a showsthe predicted domains under stationary growth alongthe E. coli K12 genome. Figure 1b is an expanded viewof the genomic region (0–1.2 M) in Figure 1a. FromFigure 1b, we can see that the predicted folding domainsindeed show higher levels of co-expression than genepairs across the domain boundaries as desired, withthe detailed data shown in Figure 1c. An example of
Table 1. Information of the seven classes of growth conditions with
the marker genes used for identifying the growth condition classes in
M3D listed in the second column (with the gene number following in
the brackets) and the number of MGC sets for each growth condi-
tion class shown in the third column
Growth conditions Marker genes (number of genes) Numberof MGCdatasets
Exponential growth Ribosomal proteins (54) 45Stationary growth Ribosomal proteins (54) 131Heat shock Heat shock proteins (14) 54Oxidative stress OxyR and SoxRS regulons (61) 30Anaerobiosis Partial Fnr regulons (53) 55SOS response LexA regulon (56) 57Nitrogen limitation NtrC and Nac regulon (65) 34Random N/A 100
The ‘Random’ growth conditions (the last line in Table 1) correspondto 100 randomly selected MGCs from all the available MGC in theM3D database.
Nucleic Acids Research, 2013, Vol. 41, No. 11 5597
Dow
nloaded from https://academ
ic.oup.com/nar/article/41/11/5594/2411323 by U
niversity of Bologna user on 15 Decem
ber 2021
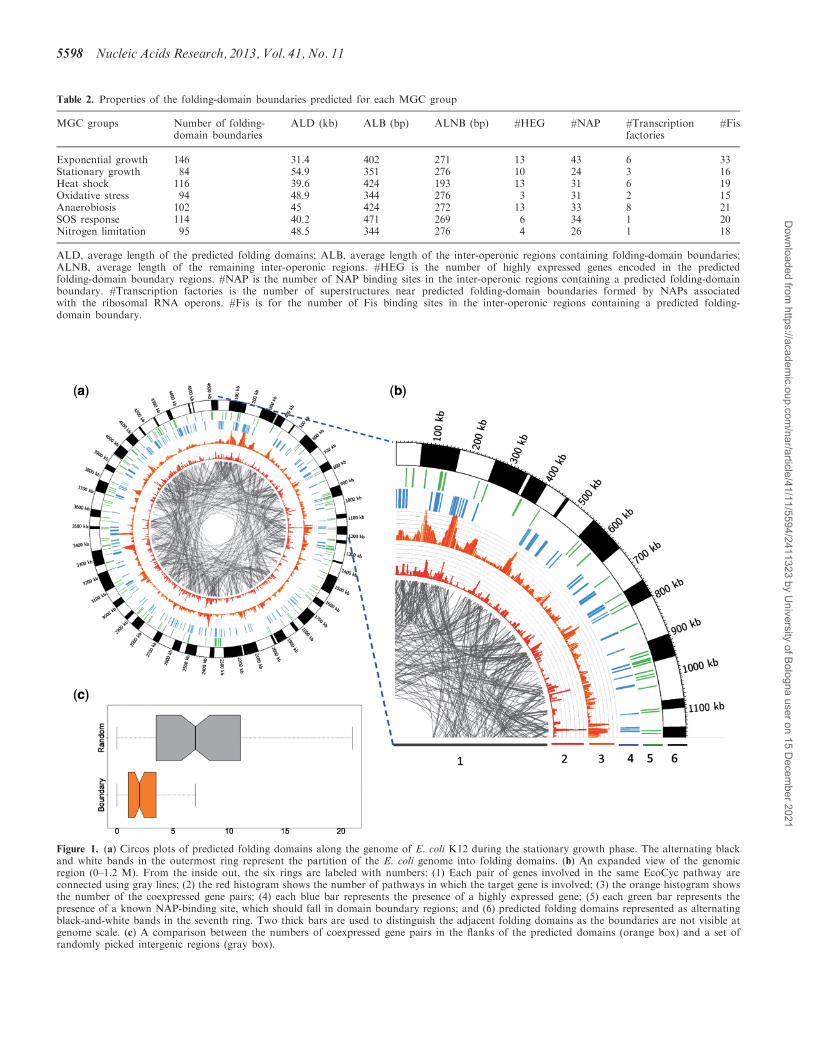
Figure 1. (a) Circos plots of predicted folding domains along the genome of E. coli K12 during the stationary growth phase. The alternating blackand white bands in the outermost ring represent the partition of the E. coli genome into folding domains. (b) An expanded view of the genomicregion (0–1.2 M). From the inside out, the six rings are labeled with numbers: (1) Each pair of genes involved in the same EcoCyc pathway areconnected using gray lines; (2) the red histogram shows the number of pathways in which the target gene is involved; (3) the orange histogram showsthe number of the coexpressed gene pairs; (4) each blue bar represents the presence of a highly expressed gene; (5) each green bar represents thepresence of a known NAP-binding site, which should fall in domain boundary regions; and (6) predicted folding domains represented as alternatingblack-and-white bands in the seventh ring. Two thick bars are used to distinguish the adjacent folding domains as the boundaries are not visible atgenome scale. (c) A comparison between the numbers of coexpressed gene pairs in the flanks of the predicted domains (orange box) and a set ofrandomly picked intergenic regions (gray box).
Table 2. Properties of the folding-domain boundaries predicted for each MGC group
MGC groups Number of folding-domain boundaries
ALD (kb) ALB (bp) ALNB (bp) #HEG #NAP #Transcriptionfactories
#Fis
Exponential growth 146 31.4 402 271 13 43 6 33Stationary growth 84 54.9 351 276 10 24 3 16Heat shock 116 39.6 424 193 13 31 6 19Oxidative stress 94 48.9 344 276 3 31 2 15Anaerobiosis 102 45 424 272 13 33 8 21SOS response 114 40.2 471 269 6 34 1 20Nitrogen limitation 95 48.5 344 276 4 26 1 18
ALD, average length of the predicted folding domains; ALB, average length of the inter-operonic regions containing folding-domain boundaries;ALNB, average length of the remaining inter-operonic regions. #HEG is the number of highly expressed genes encoded in the predictedfolding-domain boundary regions. #NAP is the number of NAP binding sites in the inter-operonic regions containing a predicted folding-domainboundary. #Transcription factories is the number of superstructures near predicted folding-domain boundaries formed by NAPs associatedwith the ribosomal RNA operons. #Fis is for the number of Fis binding sites in the inter-operonic regions containing a predicted folding-domain boundary.
5598 Nucleic Acids Research, 2013, Vol. 41, No. 11
Dow
nloaded from https://academ
ic.oup.com/nar/article/41/11/5594/2411323 by U
niversity of Bologna user on 15 Decem
ber 2021

the predicted domains and associated co-expressiondata can be found in Supplementary Example S1 andSupplementary Table S3.
Overall, 409 out of 2367 inter-operonic regions in theE. coli genome (40) serve as a boundary of at least one pre-dicted domain (B), while the remaining 1958 do not (NB).We also noted that 45.3% of the predicted boundaries areshared by at least two MGC groups and 23.5% by at leastthree MGC groups. The detailed boundary informationof the predicted domains, along with other related infor-mation is given in Supplementary Table S4.
Stability of the predicted folding-domain boundaries
As there are no large-scale experimental data collected onthe folded E. coli chromosomal structures to valid ourprediction, we have to assess the reliability of the predictedfolding domains mostly computationally. Specifically, wehave assessed the stability of each predicted set of domainsby perturbing the gene expression dataset used to makethe prediction. The approach was to replace a fractionof the used MGC set by the same number of unrelatedconditions randomly selected from the remaining growthconditions out of the 466 in M3D. We would expect thata correctly predicted set of folding domains should behighly consistent and reproducible, whereas randomly orincorrectly predicted domains should not.
We used the following procedure, along with thedistance measure defined in ‘Materials and Methods’section, to assess the prediction stability. Let C be thecondition set used to predict a set of folding domains.We randomly selected 50% of the conditions from C,denoted it as S1 and let S2 contain 25% of conditionsrandomly selected from C and the same number of con-ditions randomly selected from the remaining portion ofthe 466 conditions after removing C. We then predictedthe set of folding domains under conditions C, S1 and S2,denoting the three sets of predicted domains as P, P1 and
P2, respectively. We performed such predictions 1000times for each C corresponding each condition classgiven in Table 2 and calculated the distance distributionsbetween P and P1 and between P and P2. Figure 2 showsthe box plots of the two distributions for each of the sevenclasses of conditions, plus a randomly selected conditionset C out of 466, with the same number of conditions tothat of the above. We can clearly see that the distancebetween P and P1 is significantly smaller than thatbetween P and P2 (all achieving Wilcoxon test P< 2.2e-9, shown in Figure 2) for all the seven condition sets, andthere is virtually no difference for the random set. Hence,we can conclude that each predicted folding-domainset based on any of the seven classes of conditions ishighly statistically significant compared with domainspredicted based on randomly selected conditions, hencesuggesting the strong biological significance of the pre-dicted domains.
Functional inference of genes located close to thepredicted folding-domain boundaries
We have examined the predicted domains to check if geneslocated close to the domain boundaries may have distinctcharacteristics compared with other genes. We noted thatsuch genes tend to have higher GC content and higher ex-pression levels than the other genes. Specifically, we havecalculated the P-value of the Wilcoxon test with the nullhypothesis that such genes having no higher GC contentand expression values than the other genes, which gives riseto P< 0.05 for the test. See Supplementary Figure S1 forthe detailed information. Interestingly, previous studieshave shown that there is a positive correlation betweenthe expression value and GC content (41), providing anindirect evidence supporting our observation.We have also performed a gene ontology ‘biological
process’ (42) enrichment analysis on genes flanking thepredicted folding-domain boundaries using DAVID (43).
Figure 2. Boxplots showing stabilities of the predicted folding domains (exponential growth and heat shock) based on the selected MGC set versus arandomly selected MGC set as defined in the main text. The comparison among the other five pairs of predicted domain sets is shown in the leftupper corner. Each box with lighter gray level represents the distance distribution between the domains predicted using the selected MGCs anddomains predicted using half of the selected MGCs, and each box with darker gray level is defined similarly but against domains predicted based onrandomly selected MGCs, where the y-axis is the distance axis. The Wilcoxon test P-values for each pair of distributions are shown in the top ofboxes of each corresponding set of predicted folding domains.
Nucleic Acids Research, 2013, Vol. 41, No. 11 5599
Dow
nloaded from https://academ
ic.oup.com/nar/article/41/11/5594/2411323 by U
niversity of Bologna user on 15 Decem
ber 2021
Our result indicates that some genes involved in nitrogenand sulfur metabolisms are enriched for five of the sevenclasses of conditions (except for anaerobiosis and oxida-tive stress). For instance, 76 out of the 494 genes flankingthe domain boundaries during the exponential growth areinvolved in nitrogen, purine and amino acid metabolisms.In particular, this set of genes contains those encodingbiosynthesis pathways of spermidine from glutamate,arginine degradation, nitrogen and sulfur assimilation,as well as proline and purine biosynthesis. The enrichmentof these genes suggests that these genes are activelytranscribed, which is consistent with our observation
made in Supplementary Figure S1b that genes flankingthe domain boundaries tend to express at higher levelsthan the other genes.
Comparisons among the seven sets of predicted domains
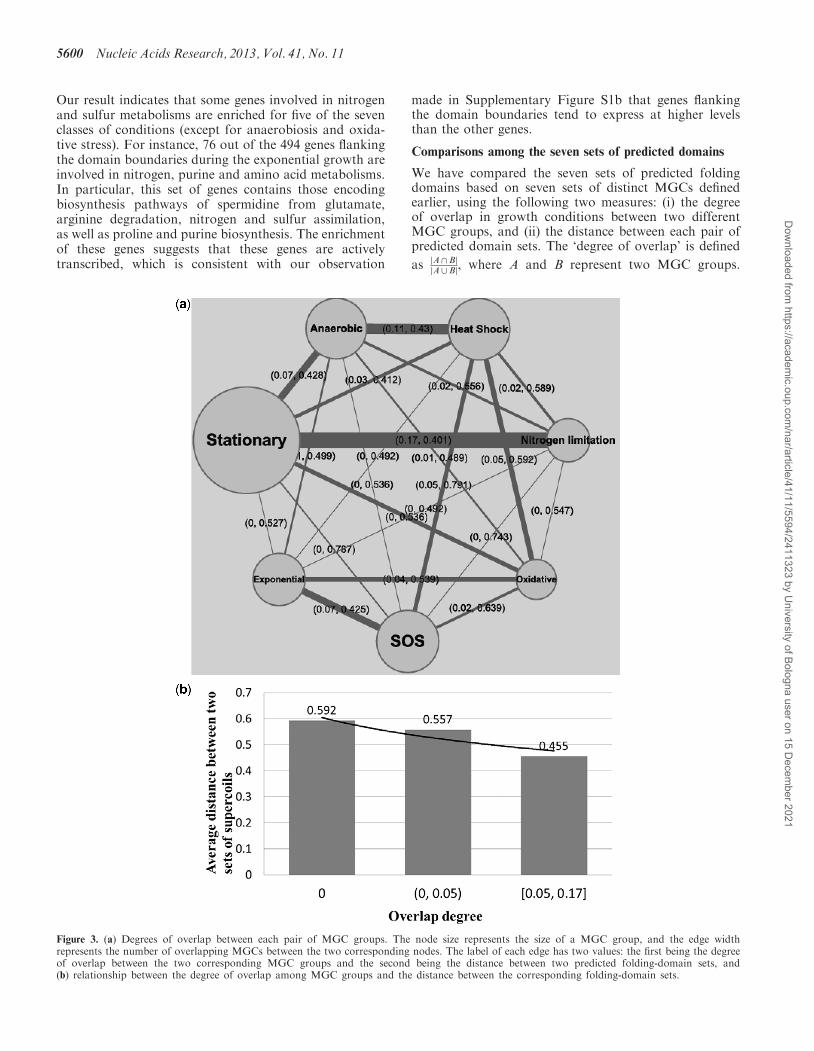
We have compared the seven sets of predicted foldingdomains based on seven sets of distinct MGCs definedearlier, using the following two measures: (i) the degreeof overlap in growth conditions between two differentMGC groups, and (ii) the distance between each pair ofpredicted domain sets. The ‘degree of overlap’ is defined
as A\Bj j
jA[Bj, where A and B represent two MGC groups.
Figure 3. (a) Degrees of overlap between each pair of MGC groups. The node size represents the size of a MGC group, and the edge widthrepresents the number of overlapping MGCs between the two corresponding nodes. The label of each edge has two values: the first being the degreeof overlap between the two corresponding MGC groups and the second being the distance between two predicted folding-domain sets, and(b) relationship between the degree of overlap among MGC groups and the distance between the corresponding folding-domain sets.
5600 Nucleic Acids Research, 2013, Vol. 41, No. 11
Dow
nloaded from https://academ
ic.oup.com/nar/article/41/11/5594/2411323 by U
niversity of Bologna user on 15 Decem
ber 2021

First, we noted that>90% (19 out ofC72 ¼ 21) of theMGC
group pairs have the degree of overlap scores <0.1,indicating that the seven classes of MGCs are largely inde-pendent of each other. As expected, a higher level ofoverlaps between two classes of MGCs tends to give riseto smaller distances between their predicted folding-domain sets, as shown in Figure 3b. For instance, thetwo classes of MGCs, stationary growth and nitrogen limi-tation, have the highest degree of overlap at 0.17 as shownin Figure 3a and also have the smallest distance, 0.401,between their predicted folding-domain sets among allthe pairwise comparisons. This is not unexpected becausein stationary phase, cells stop multiplying exponentially inpart owing to limitation of some essential nutrients.Another two sets of domains with a small distance, 0.43,are under anaerobiosis and heat shock. Their correspond-ing MGC groups have the second largest degree of overlap0.11. There are no overlapping MGCs between the classesof stationary growth and SOS response at all, and theyhave a relatively large distance at 0.787.
Comparison between domain boundaries andexperimental data
Using an in vivo protein occupancy experiment, 272 EPODsof the E. coli chromosome have been identified in (30). TheEPODs are enriched with NAP-binding sites (see details inSupplementary Table S5) and play an important role in thefolding of the E. coli chromosome. These domains can begrouped into two classes: the transcriptionally silent class(tsEPODs) and the highly expressed class (heEPODs). The151 tsEPODs are located across the genome apparentlyrandomly and has proved to have bigger influence on theorganizational architecture of the folded E. coli chromo-some than the heEPODs (30), totaling 121. In addition, wehave also retrieved 537 H-NS binding regions under thestationary growth condition from (9), knowing that H-NSs play a key role in the formation of supercoil structuresin the folded E. coli chromosome (16). These H-NS bindingregions can be classified to long H-NS (loH-NSs) andshort H-NS binding regions (shH-NSs), with the longerH-NSs wrapping around larger segments of the E. colichromosome. We have compared the predicted folding-domain boundaries under the stationary growth condition[stationary folding domains (sFDs)] with these EPODs andH-NS binding regions as follows.
Let A denote all the inter-operonic regions in E. coligenome, and B be the subset of A that has been computa-tionally predicted by our algorithm;C denotes the subset ofA, which is experimentally identified. We use the followingP-value calculation to assess the statistical significanceof the level of coincidence between B and C. Specifically,if our prediction B is random, then the probability of B andC sharing exactly m inter-operonic regions is
pA mjB,Cð Þ ¼
jCjm
� �Aj j � jCjjBj �m
� �jAjjBj
� �
where jXj denotes the number of elements in X andm= jB\Cj. Hence, the P-value in respect to the assump-tion is pA x � mjB,Cð Þ, denotedasPA B,Cð Þ.We note that the P-values PA(sFDs, EPODs)
and PA(sFDs,tsEPODs) are both <0.05, butPA(sFDs,heEPODs) is not. Between sFDs and the H-NS binding regions, PA(sFDs,H-NSs) andPA(sFDs,loH-NSs) are <0.05 but PA(sFDs,shH-NSs) isnot (see Table 3). These results indicate that our pre-dicted folding domains have substantial overlaps withEPODs and H-NS–binding regions, and they tend tohave higher level of overlap with the tsEPODs andloH-NSs, which are known to cast bigger influenceon the folded chromosomal structures than heEPODsand shH-NSs. As a comparison, we have randomlypicked a set of inter-operonic regions as potentialdomain boundaries and done the same calculation onsFDs, the P-values are consistently higher than thosecalculated using predicted domain boundaries as shownin Table 3.
DISCUSSION
Predicted folding domains underexponential and stationary growth conditionsare generally consistent with the availableexperimental data
We have noted from Table 2 that the numbers of foldingdomains predicted under the exponential growth and thestationary growth conditions are generally consistentwith the experimentally observed number of supercoilsusing electron microscopy (1). Specifically, the dataindicate that the folded chromosomal structure has sub-stantially more supercoils during the exponential growththan those during the stationary growth phase, which isconsistent with our predicted numbers of foldingdomains under the two conditions, 146 versus 84. Andsome Fis-binding sites are exposed more frequentlyduring the exponential growth than during the stationarygrowth, consistent with our predicted numbers 33 versus16. In addition, there are more transcription factoriesoperating during the exponential growth than duringthe stationary growth, consistent with the numbers 6versus 3 based on our prediction, where a ‘transcriptionfactory’ is defined as a spatially confined aggregation ofRNA polymerase, transcription factors and NAPs innucleoid (44). The detailed calculation of these numbersbased on our predictions is given in Table 2.
Table 3. Statistical significance of correlation coefficient between
predicted domain boundaries and EPODs and H-NS binding
regions
EPODs tsEPODs heEPODs H-NSs loH-NSs shH-NSs
sFDs 3.8e-03* 2.6e-02* 6.4e-02 1.1e-02* 4.1e-02* 8.3e-02Randomset
4.2e-01 2.3e-01 6.1e-01 9.7e-02 9.2e-02 5.4e-01
*P< 0.05.
Nucleic Acids Research, 2013, Vol. 41, No. 11 5601
Dow
nloaded from https://academ
ic.oup.com/nar/article/41/11/5594/2411323 by U
niversity of Bologna user on 15 Decem
ber 2021
Sequence features indicate a strong link between thepredicted folding domains and supercoils in thefolded chromosome
We have noted that the average length of the inter-operonic regions in B is 414 bp, which is significantlylonger than the average length of NB, 250 bp (see‘Materials and Methods’ section). This clearly makessense as NAPs are expected to bind near the supercoilboundaries and hence require extra space in the binding-site containing inter-operonic regions (detailed compari-sons can be found in Supplementary Figure S2). Thehigher expression levels of genes flanking the folding-domain boundaries (Supplementary Figure S1b) suggestthat these genes are more actively transcribed comparedwith those in the internal portions of the folding domains.Hence, we speculate that the active transcription of genesflanking the boundaries might be accompanied by pushingthe coiling toward the center of the supercoiled domains,hence making the middle portions of the supercoilsmore tightly coiled than the boundary regions, andreducing their accessibility by the RNA polymerases andthe transcription levels.
Potential limitations of our predicted MGCs
For each of the seven physiological conditions, its set ofmarker genes is manually collected from the publishedstudies on the seven conditions. While the seven identifiedsubsets of conditions are biologically meaningful andstatistically significant, the marker genes are not selectedin a systematic manner and hence could have limited theeffectiveness of our method. To examine this issue, we havecarried out a de novo biclustering (45,46) of the expressiondata of E. coli in M3D and obtained 17 condition clusterswith high statistical significance (shown in SupplementaryTable S6). Out of these 17 clusters, six have low a degree ofoverlap with the seven MGC groups (<0.15), indicatingthat these subsets of conditions, not covered by currentseven MGC groups, may correspond to certain physio-logical conditions that have not been systematicallystudied, and hence warrants further studies. We plan tocarry a detailed and systematic analysis of the 17 biclustersto identify their corresponding physiological conditions aswell as their potentially corresponding folded chromo-somal structures of E. coli K12.
CONCLUDING REMARK
We have predicted a distinct set of folding domains ofthe E. coli K12 chromosome for each of seven sets ofgrowth conditions based on the gene-expression data inM3D, the most comprehensive gene-expression dataset onE. coli, along with pathway information from EcoCyc.These predicted domains are highly stable with respectto perturbations to the expression data based on whichthe prediction is made. They also show good agreementwith the available E. coli folded chromosomal structuredata, including experimental observation and high-throughput NAP-binding regions. The results of the com-putation and analysis provided strong evidence supportingour main hypothesis that operons encoding E. coli
metabolic pathways are arranged along the genome thattends to minimize the total effort, measured using thenumber of total unfolding of the folded domains, tomake the genes of the needed pathways transcriptionallyaccessible. We believe that this study provides a frame-work for studying the functional constraints cast on thegenomic organization of operons in E. coli and bacteria ingeneral. We fully expect that the same study can beapplied to other bacterial genomes, for which substantialamounts of gene-expression data collected under multipleconditions are available. Such predicted folding-domainboundaries, when fully validated by and applied in con-junction with the information derived from the emergingchromosome conformation capture techniques, couldprove to be essential to understanding the detailed regu-lation mechanisms of transcription relating to dynamicsupercoiling, as well as the general principles that governthe genomic locations of operons (24,25).
The program used to generate the data used in thisarticle was written in ANSI C and tested using GCC(version 4.1.2) on Linux. The source code is availableat: http://code.google.com/p/supercoil/.
SUPPLEMENTARY DATA
Supplementary Data are available at NAR Online:Supplementary Tables 1–6, Supplementary Figures 1 and 2,Supplementary Method 1, Supplementary Example 1 andSupplementary References [1,3,6–8,13–16,47].
ACKNOWLEDGEMENTS
Y.X. conceived the basic idea and planned the project.Q.M. developed the software and carried out the experi-ments. Y.Y. and Q.M. analyzed the data and wrote themanuscript. M.S. proposed several good suggestions forthe ‘Results’ section in the view of biology. G.L. designedand polished the algorithm. H.Z. contributed to the geneexpression analysis. All authors edited the manuscript andapproved the final manuscript.
FUNDING
National Science Foundation (#NSF DEB-0830024 andNSF MCB-0958172) (in part); the US Department ofEnergy’s BioEnergy Science Center (BESC) grant throughthe Office of Biological and Environmental Research. TheBioEnergy Science Center is a U.S. Department of EnergyBioenergy Research Center supported by the Office ofBiological and Environmental Research in the DOEOffice of Science. Funding for open access charge: USDepartment of Energy’s BioEnergy ScienceCenter (BESC).
Conflict of interest statement. None declared.
REFERENCES
1. Dillon,S.C. and Dorman,C.J. (2010) Bacterial nucleoid-associatedproteins, nucleoid structure and gene expression. Nat. Rev.Microbiol., 8, 185–195.
5602 Nucleic Acids Research, 2013, Vol. 41, No. 11
Dow
nloaded from https://academ
ic.oup.com/nar/article/41/11/5594/2411323 by U
niversity of Bologna user on 15 Decem
ber 2021
2. Benza,V.G., Bassetti,B., Dorfman,K.D., Scolari,V.F., Bromek,K.,Cicuta,P. and Lagomarsino,M.C. (2012) Physical descriptions ofthe bacterial nucleoid at large scales, and their biologicalimplications. Rep. Prog. Phys., 75, 076602.
3. Noom,M.C., Navarre,W.W., Oshima,T., Wuite,G.J. andDame,R.T. (2007) H-NS promotes looped domain formation inthe bacterial chromosome. Curr. Biol., 17, R913–R914.
4. Postow,L., Hardy,C.D., Arsuaga,J. and Cozzarelli,N.R. (2004)Topological domain structure of the Escherichia coli chromosome.Genes Dev., 18, 1766–1779.
5. Luijsterburg,M.S., Noom,M.C., Wuite,G.J. and Dame,R.T. (2006)The architectural role of nucleoid-associated proteins in theorganization of bacterial chromatin: a molecular perspective.J. Struct. Biol., 156, 262–272.
6. Stein,R.A., Deng,S. and Higgins,N.P. (2005) Measuringchromosome dynamics on different time scales using resolvaseswith varying half-lives. Mol. Microbiol., 56, 1049–1061.
7. Rocha,E.P. (2008) The organization of the bacterial genome.Annu. Rev. Genet., 42, 211–233.
8. Browning,D.F., Grainger,D.C. and Busby,S.J. (2010) Effects ofnucleoid-associated proteins on bacterial chromosome structureand gene expression. Curr. Opin. Microbiol., 13, 773–780.
9. Kahramanoglou,C., Seshasayee,A.S., Prieto,A.I., Ibberson,D.,Schmidt,S., Zimmermann,J., Benes,V., Fraser,G.M. andLuscombe,N.M. (2011) Direct and indirect effects of H-NS andFis on global gene expression control in Escherichia coli. NucleicAcids Res., 39, 2073–2091.
10. Grainger,D.C., Aiba,H., Hurd,D., Browning,D.F. and Busby,S.J.(2007) Transcription factor distribution in Escherichia coli: studieswith FNR protein. Nucleic Acids Res., 35, 269–278.
11. Grainger,D.C., Hurd,D., Goldberg,M.D. and Busby,S.J. (2006)Association of nucleoid proteins with coding and non-codingsegments of the Escherichia coli genome. Nucleic Acids Res., 34,4642–4652.
12. Prieto,A.I., Kahramanoglou,C., Ali,R.M., Fraser,G.M.,Seshasayee,A.S. and Luscombe,N.M. (2012) Genomic analysis ofDNA binding and gene regulation by homologous nucleoid-associated proteins IHF and HU in Escherichia coli K12.Nucleic Acids Res., 40, 3524–3537.
13. Simonis,M., Klous,P., Splinter,E., Moshkin,Y., Willemsen,R., deWit,E., van Steensel,B. and de Laat,W. (2006) Nuclearorganization of active and inactive chromatin domains uncoveredby chromosome conformation capture-on-chip (4C). Nat. Genet.,38, 1348–1354.
14. Dekker,J., Rippe,K., Dekker,M. and Kleckner,N. (2002)Capturing chromosome conformation. Science, 295, 1306–1311.
15. Zhao,Z., Tavoosidana,G., Sjolinder,M., Gondor,A., Mariano,P.,Wang,S., Kanduri,C., Lezcano,M., Sandhu,K.S., Singh,U. et al.(2006) Circular chromosome conformation capture (4C) uncoversextensive networks of epigenetically regulated intra- andinterchromosomal interactions. Nat. Genet., 38, 1341–1347.
16. Wang,W., Li,G.W., Chen,C., Xie,X.S. and Zhuang,X. (2011)Chromosome organization by a nucleoid-associated protein in livebacteria. Science, 333, 1445–1449.
17. Deng,S., Stein,R.A. and Higgins,N.P. (2005) Organization ofsupercoil domains and their reorganization by transcription. Mol.Microbiol., 57, 1511–1521.
18. Wright,M.A., Kharchenko,P., Church,G.M. and Segre,D. (2007)Chromosomal periodicity of evolutionarily conserved gene pairs.Proc. Natl Acad. Sci. USA, 104, 10559–10564.
19. Kepes,F. (2004) Periodic transcriptional organization of theE. coli genome. J. Mol. Biol., 340, 957–964.
20. Jeong,K.S., Ahn,J. and Khodursky,A.B. (2004) Spatial patterns oftranscriptional activity in the chromosome of Escherichia coli.Genome Biol., 5, R86.
21. Buenemann,M. and Lenz,P. (2011) Geometrical ordering of DNAin bacteria. Commun. Integr. Biol., 4, 291–293.
22. Fritsche,M., Li,S., Heermann,D.W. and Wiggins,P.A. (2012)A model for Escherichia coli chromosome packaging supportstranscription factor-induced DNA domain formation. NucleicAcids Res., 40, 972–980.
23. Ma,Q. and Ying,X. (2013) Global genomic arrangement ofbacterial genes is closely tied with the total transcriptionalefficiency. Genomics Proteomics Bioinformatics, 11, 66–71.
24. Yin,Y., Zhang,H., Olman,V. and Xu,Y. (2010) Genomicarrangement of bacterial operons is constrained by biologicalpathways encoded in the genome. Proc. Natl Acad. Sci. USA,107, 6310–6315.
25. Zhang,H., Yin,Y., Olman,V. and Xu,Y. (2012) Genomicarrangement of regulons in bacterial genomes. PLoS One, 7, e29496.
26. Karp,P.D., Riley,M., Saier,M., Paulsen,I.T., Collado-Vides,J.,Paley,S.M., Pellegrini-Toole,A., Bonavides,C. and Gama-Castro,S.(2002) The EcoCyc Database. Nucleic Acids Res., 30, 56–58.
27. Faith,J.J., Driscoll,M.E., Fusaro,V.A., Cosgrove,E.J., Hayete,B.,Juhn,F.S., Schneider,S.J. and Gardner,T.S. (2008) Many MicrobeMicroarrays Database: uniformly normalized Affymetrixcompendia with structured experimental metadata. Nucleic AcidsRes., 36, D866–D870.
28. Gama-Castro,S., Salgado,H., Peralta-Gil,M., Santos-Zavaleta,A.,Muniz-Rascado,L., Solano-Lira,H., Jimenez-Jacinto,V., Weiss,V.,Garcia-Sotelo,J.S., Lopez-Fuentes,A. et al. RegulonDB version7.0: transcriptional regulation of Escherichia coli K-12 integratedwithin genetic sensory response units (Gensor Units). NucleicAcids Res., 39, D98–D105.
29. Puigbo,P., Romeu,A. and Garcia-Vallve,S. (2008) HEG-DB: adatabase of predicted highly expressed genes in prokaryoticcomplete genomes under translational selection. Nucleic AcidsRes., 36, D524–D527.
30. Vora,T., Hottes,A.K. and Tavazoie,S. (2009) Protein occupancylandscape of a bacterial genome. Mol. Cell, 35, 247–253.
31. Lindquist,S. and Craig,E.A. (1988) The heat-shock proteins.Annu. Rev. Genet., 22, 631–677.
32. De Maio,A. (1999) Heat shock proteins: facts, thoughts, anddreams. Shock, 11, 1–12.
33. Tolla,D.A. and Savageau,M.A. (2010) Regulation of aerobic-to-anaerobic transitions by the FNR cycle in Escherichia coli.J. Mol. Biol., 397, 893–905.
34. Kang,Y., Weber,K.D., Qiu,Y., Kiley,P.J. and Blattner,F.R. (2005)Genome-wide expression analysis indicates that FNR ofEscherichia coli K-12 regulates a large number of genes ofunknown function. J. Bacteriol., 187, 1135–1160.
35. Cabiscol,E., Tamarit,J. and Ros,J. (2000) Oxidative stress inbacteria and protein damage by reactive oxygen species. Int.Microbiol., 3, 3–8.
36. Michel,B. (2005) After 30 years of study, the bacterial SOSresponse still surprises us. PLoS Biol., 3, e255.
37. Ninfa,A.J., Jiang,P., Atkinson,M.R. and Peliska,J.A. (2000)Integration of antagonistic signals in the regulation of nitrogenassimilation in Escherichia coli. Curr. Top. Cell. Regul., 36, 31–75.
38. Muse,W.B. and Bender,R.A. (1998) The nac (nitrogen assimilationcontrol) gene from Escherichia coli. J. Bacteriol., 180, 1166–1173.
39. Kharchenko,P., Church,G.M. and Vitkup,D. (2005) Expressiondynamics of a cellular metabolic network. Mol. Syst. Biol., 1,2005.0016.
40. Mao,F., Dam,P., Chou,J., Olman,V. and Xu,Y. (2009) DOOR: adatabase for prokaryotic operons. Nucleic Acids Res., 37,D459–D463.
41. Kudla,G., Lipinski,L., Caffin,F., Helwak,A. and Zylicz,M. (2006)High guanine and cytosine content increases mRNA levels inmammalian cells. PLoS Biol., 4, e180.
42. Gene Ontology Consortium. (2010) The Gene Ontology in 2010:extensions and refinements. Nucleic Acids Res., 38, D331–D335.
43. Huang da,W., Sherman,B.T. and Lempicki,R.A. (2009)Bioinformatics enrichment tools: paths toward the comprehensivefunctional analysis of large gene lists. Nucleic Acids Res., 37, 1–13.
44. Cook,P.R. (2009) A model for all genomes: the role oftranscription factories. J. Mol. Biol., 395, 1–10.
45. Li,G., Ma,Q., Tang,H., Paterson,A.H. and Xu,Y. (2009) QUBIC:a qualitative biclustering algorithm for analyses of geneexpression data. Nucleic Acids Res., 37, e101.
46. Zhou,F., Ma,Q., Li,G. and Xu,Y. (2012) QServer: a biclusteringserver for prediction and assessment of co-expressed gene clusters.PLoS One, 7, e32660.
47. Li,G., Liu,B., Ma,Q. and Xu,Y. (2011) A new framework foridentifying cis-regulatory motifs in prokaryotes. Nucleic AcidsRes., 39, e42.
Nucleic Acids Research, 2013, Vol. 41, No. 11 5603
Dow
nloaded from https://academ
ic.oup.com/nar/article/41/11/5594/2411323 by U
niversity of Bologna user on 15 Decem
ber 2021