Embed Size (px)
Citation preview

COMPUTATION STUDIES OF VACANCY AND VOID DEFECTS INTERACTIONS IN POLYCRYSTALLINE UO2
By
TSU-WU CHIANG
A DISSERTATION PRESENTED TO THE GRADUATE SCHOOL OF THE UNIVERSITY OF FLORIDA IN PARTIAL FULFILLMENT
OF THE REQUIREMENTS FOR THE DEGREE OF DOCTOR OF PHILOSOPHY
UNIVERSITY OF FLORIDA
2014

© 2014 Tsu-Wu Chiang

To my family

4
ACKNOWLEDGMENTS
First, I would like to express my deepest thank to Prof. Simon Phillpot for his
support throughout my Ph.D. study. His passion for science and teaching are great help
to me. His patience and constant discussion with me is also great support to me.
Without it, I could not imagine I could work through my study. I also want to thank Prof.
Susan Sinnott. Her expertise in the material science and many of her suggestion really
impress to me. I also want to thank Dr. Alex Chernatynskiy. I will never forget the
countless discussion between us. He always gives me many suggestions to help me in
my Ph.D. study. I also appreciate to my committee members Prof. Michele Manuel,
Prof. Yong Yang, and Prof. Youping Chen for their advice.
I also would like to dedicate this dissertation to all of the SINPOT group members
who give me the wonderful and joyful research environment. I must also thank my
family for their encouragement and support. I also appreciate to their respect on every
decision I made. Finally, I would like to thank everyone who ever participate to my life in
University of Florida. They make my life rich and joyful.

5
TABLE OF CONTENTS page
ACKNOWLEDGMENTS ............................................................................................ 4
LIST OF TABLES ...................................................................................................... 7
LIST OF FIGURES .................................................................................................... 8
ABSTRACT ............................................................................................................. 11
CHAPTER
1 INTRODUCTION .............................................................................................. 13
Nuclear Energy ................................................................................................. 13 Fuel in Nuclear Reactor .................................................................................... 13
Defects from Sintering Process .................................................................. 14 Defects from Nuclear Reaction ................................................................... 15 Defects from Fuel Decays .......................................................................... 16
Defects Interaction ............................................................................................ 18 Void Nucleation .......................................................................................... 19 Void Interaction with a Grain Boundary ...................................................... 19 Evolution of Void-grain Boundary Complex ................................................ 20
Objective ........................................................................................................... 20
2 DEFECTS IN UO2 AND SIMULATION METHODOLOGY ................................ 26
Background ....................................................................................................... 26 Vacancy Defects in UO2 ................................................................................... 26 Voids in UO2 ..................................................................................................... 28 Grain Boundaries in UO2 .................................................................................. 29 Molecular Dynamics.......................................................................................... 30
3 VOID NUCLEATION IN UO2 ............................................................................. 42
Void Nucleation Process, Ostwald Ripening and Coalescence Mechanism ..... 42 Overall Microstructure and Nucleation Energy Evolution .................................. 44 Energy Evolution during Void Nucleation .......................................................... 45 Interaction between Voids ................................................................................. 47 Voids Formation and Growth in Atomic Level View .......................................... 50 Void Behavior in Different Time Periods ........................................................... 53 Summary .......................................................................................................... 55
4 INTERACTION BETWEEN VOIDS AND GRAIN BOUNDARIES IN UO2 ......... 72
Migration of Voids and Grain Boundaries ......................................................... 72

6
Thermal Fluctuation of GB ................................................................................ 74 GB Migration in UO2 ......................................................................................... 77 Pinning of the GB to the Void ............................................................................ 79 Evolution of the GB-Void Complex ................................................................... 81 Summary .......................................................................................................... 83
5 KINETIC EVOLUTION OF VOID NUCLEATION ON GRAIN BOUNDARIES ... 97
Defect Complexity in Polycrystalline UO2 ......................................................... 97 Overall Defect Evolution ................................................................................... 99 Vacancy Segregation ...................................................................................... 100 GB Attraction by Voids and Vacancies ........................................................... 102 Dependence of defect evolution on defect density ......................................... 103
Vacancy Dissolves into GB ...................................................................... 103 From Dissolution to Nucleation ................................................................. 104 From Nucleation to Interconnection .......................................................... 105
Schematic of the Overall Evolution ................................................................. 106 Summary ........................................................................................................ 107
6 ANALYSIS OF ZIRCONIUM SURFACE OXIDIZATION ................................. 121
Background ..................................................................................................... 121 Density Functional Theory .............................................................................. 123 Computational Details ..................................................................................... 126 Oxygen Migration in Bulk ................................................................................ 129 Migration into (0001) and {10�̅�0} Surfaces ..................................................... 130 Discussion ...................................................................................................... 132
7 CONCLUSIONS ............................................................................................. 142
LIST OF REFERENCES ....................................................................................... 144
BIOGRAPHICAL SKETCH .................................................................................... 152

7
LIST OF TABLES
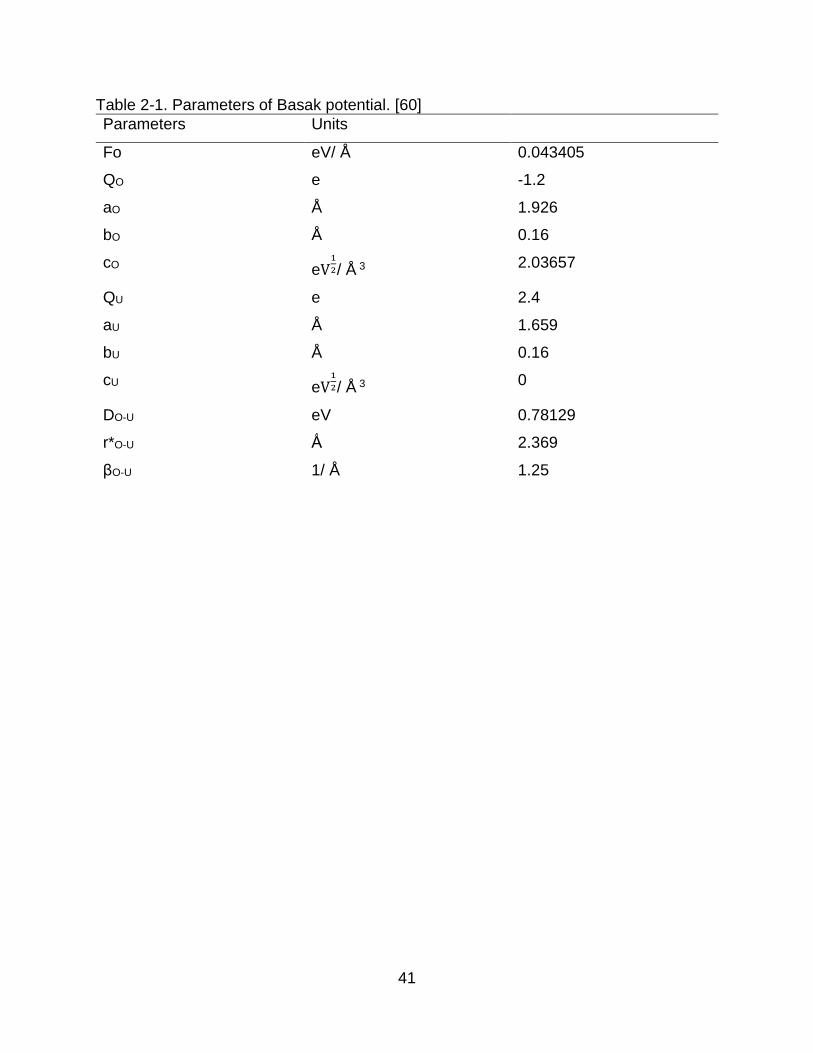
Table page 2-1 Parameters of Basak potential. .................................................................... 41
6-1 Energy barriers for oxygen diffusion in Zr……………………………............141

8
LIST OF FIGURES
Figure page 1-1 Defects inside a UO2 pellet. . ........................................................................ 21
1-2 Defects in UO2 fuel after sintering at 1773 K. ............................................... 22
1-3 UO2 pellet void size growth under sintering at 1773K. ................................. 23
1-4 A schematic of a void pinned with a grain boundary. .................................... 24
1-5 Structure evolution of void-GB defect complex. ........................................... 25
2-1 Illustration of a U vacancy in UO2 fluorite structure. ..................................... 35
2-2 A Schottky trio in UO2 oriented along [111]. ................................................. 36
2-3 An illustration of an atom/vacancy migration path and its energy barrier (Em). .............................................................................................................. 37
2-4 Illustration of a void in UO2 solid. .................................................................. 38
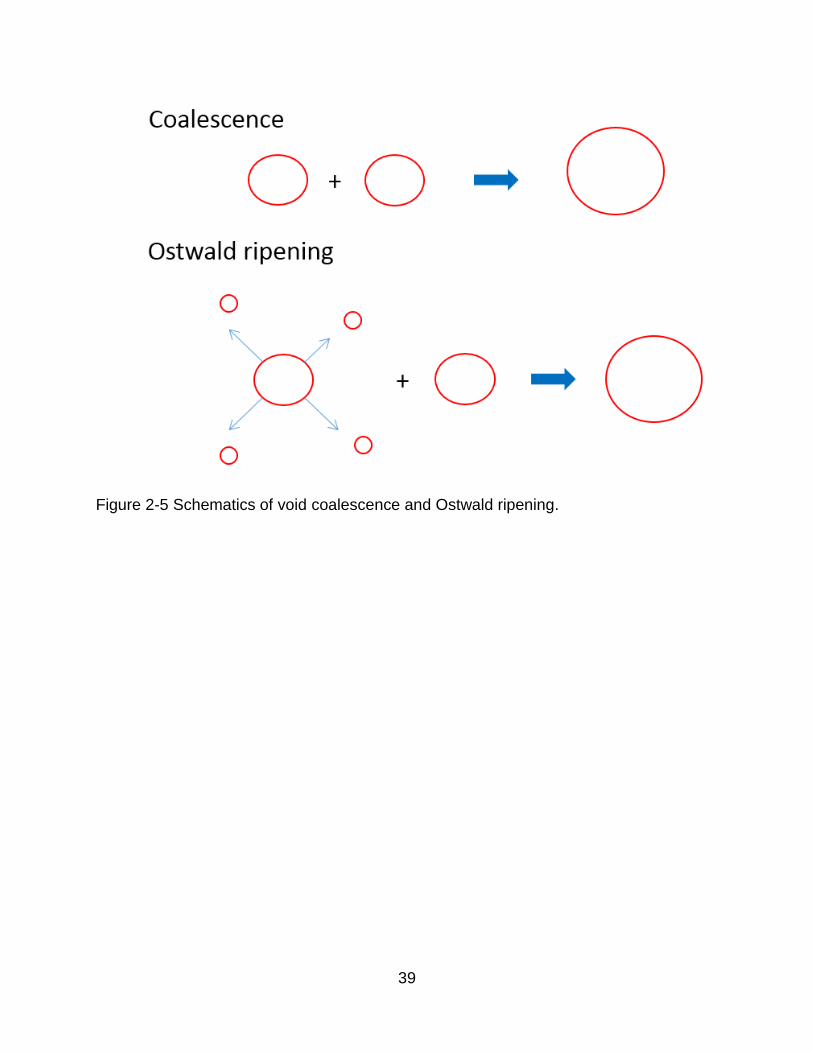
2-5 Schematics of void coalescence and Ostwald ripening. ............................... 39
2-6 Void migration mechanisms. ........................................................................ 40
3-1 A void is nucleated by Schottky defect combination at 2800 K. .................... 57
3-2 The relationship between void defect energy, Evoid, and the number of Schottky defects. .......................................................................................... 58
3-3 Interaction between two voids. ..................................................................... 59
3-4 Two pair of voids with different surface configurations. ................................ 60
3-5 Two voids defects in UO2. ............................................................................ 61
3-6 Defect evolution. ........................................................................................... 62
3-7 Vacancies combine, leading to the nucleation of small voids. ..................... 63
3-8 A U interstitial in the UO2. ............................................................................. 64
3-9 Snapshots from the MD simulations that illustrate void coalescence. .......... 65
3-10 The example of void dissolution. ................................................................... 66
3-11 A void grows through Ostwald ripening. ....................................................... 67

9
3-12 The behavior of different voids. .................................................................... 68
3-13 A void grows on one side while another void simultaneously shrinks on the other side. ..................................................................................................... 69
3-14 Void growth through Ostwald ripening (A – B), and coalescence (B – C). .... 70
3-15 Schematic of the void nucleation process. Both coalescence and Ostwald ripening mechanisms take place iteratively and contribute to void growth. .. 71
4-1 Schematic of the simulated system which includes two GBs........................ 85
4-2 The relationship between vacancy motion and GB migration. ..................... 86
4-3 The position of the GB center relative to its initial (t = 0) location at 2800 K and 3100 K. .................................................................................................. 87
4-4 MSD of uranium atoms in the GB region at various temperatures................ 88
4-5 View down the <100> tilt axis of the GB. ...................................................... 89
4-6 The distance between the center of the GB (red squares) and GB edge (blue circles) and void leading edge. ..................................................................... 90
4-7 The evolution of the void and GB at T = 3100 K. ......................................... 91
4-8 Coordination of U atoms in the defect region. .............................................. 92
4-9 Evolution of GB and void complex at 2800 K. .............................................. 93
4-10 Snapshots the void dissolution into the GB through vacancy diffusion. ........ 94
4-11 The void dissolution process as a function of temperature. ......................... 95
4-12 Number of vacancies in the void as a function of time. ................................. 96
5-1 Single plane view (100) of the initial structure of the polycrystalline UO2 system with vacancies. ............................................................................... 109
5-2 Snapshots of void nucleation in polycrystalline UO2. ................................. 110
5-3 The percentage of voids in the GB. ............................................................ 111
5-4 Segregation energy profile of a vacancy to the tilt grain boundary. ............ 112
5-5 An example of UO2 grain boundary. ........................................................... 113
5-6 GB migration by attraction to voids and vacancies. ................................... 114

10
5-7 Evolution of GB-vacancy interactions in system with 5% vacancy density. 115
5-8 Void nucleation on a GB. ............................................................................ 116
5-9 An example of void in GB. .......................................................................... 117
5-10 Void nucleation at a GB (D = 10%). ............................................................ 118
5-11 Rates of void nucleation at GBs in various vacancy densities. ................... 119
5-12 Schematic of early stage grain boundary nucleated reaction. .................... 120
6-1 Possible oxygen interstitial sites in Zr. ........................................................ 134
6-2 Schematic of basal surface and prism surface in HCP Zr. ......................... 135
6-3 Oxygen interstitial sites on (0001) basal surface. ....................................... 136
6-4 Oxygen interstitial sites on the prism surface. ............................................ 137
6-5 Images in NEB calculation. ......................................................................... 138
6-6 The lowest energy path for oxygen migration into the basal surface of Zr. . 139
6-7 The lowest energy path for oxygen migration into the prism surfaces of Zr. ............................................................................................................... 140

11
Abstract of Dissertation Presented to the Graduate School of the University of Florida in Partial Fulfillment of the Requirements for the Degree of Doctor of Philosophy
COMPUTATION STUDIES OF VACANCY AND VOID DEFECTS INTERACTIONS IN
POLYCRYSTALLINE UO2
By
Tsu-Wu Chiang
August 2014
Chair: Simon R. Phillpot Major: Materials Science and Engineering
This dissertation uses atomic-level simulations to analyze void nucleation from
isolated vacancies, the interactions of voids with a grain boundary (GB), and the
evolution of void nucleation on a GB in UO2, the ubiquitous fuel material for light water
reactors. The atomic-level mechanisms and the energetics associated with these
processes are characterized. Simulations are performed at high temperature to
accelerate the dynamical processes. Evaluation of the energetics shows that isolated
defects, voids and GB interact through elastic and electrostatic forces. Void growth
mechanisms, Ostwald ripening and coalescence are identified and characterized. A
kinetic evolution map of void growth is developed. GB migration towards to the void is
predicted to take place. Both GB pinning to the void and void dissolution at the GB take
place. Vacancy accumulation at GBs is observed both when vacancies migrate into a
GB and when a GB migrates to void/vacancies. The profile of the vacancy-GB
segregation energy explains the GB-vacancies attraction behavior. The GB-void
complex at various vacancy densities is also discussed to elucidate the GB nucleation
evolution from dissolution, nucleation, and interconnection.

12
In addition to UO2, this dissertation also addresses oxidation of Zr. Density
functional theory calculations are used to analyze the energy barriers for oxygen
migration into the basal and prismatic surfaces of zirconium. The migration energy
barriers between each octahedral site and tetrahedral site in the basal surface, prism
surface, and bulk are determined. The lowest penetration paths of these two surface are
also identified and a possible mechanism for the anisotropy in the oxidation of Zr
surfaces is identified.

13
CHAPTER 1 INTRODUCTION
Nuclear Energy
The fast growth in the world economy, technology and population results in a
high demand for energy. Nuclear energy is one source of this energy. According to a
2012 International Atomic Energy Agency report [1], 5.7% of energy worldwide currently
comes from nuclear power, which is a six times greater proportion than in 1973. Nuclear
energy produces 12.9% of all electric power in 2012 worldwide. In France, three-
quarters of total electricity comes from nuclear power [1]. The growth in demand for
nuclear power come from both an overall increase in energy consumption and from
concerns about fossil fuels. In particular, global climate change has become an
important scientific and political issue in recent years. The reduction of greenhouse gas
production is an important objective in many countries and for many industries. The high
carbon emissions of fossils fuel such as natural gas, oil and coal make nuclear energy
an attractive alternative energy source in many respects [2, 3]. Nevertheless, the
accidents that have taken place in the nuclear industry are worrisome [4, 5]. There have
been three particularly prominent nuclear power plant accidents: the Three Mile Island
accident, the Chernobyl disaster and the Fukushima Daiichi disaster. Each of these
accidents has had an unforgettable impact. To avoid future nuclear accidents,
improvements in our knowledge of nuclear energy are required.
Fuel in Nuclear Reactor
The fuel used in most nuclear reactors, and in the entire US commercial fleet, is
uranium dioxide (UO2) [6, 7]. During the burnup process, defects are generated inside

14
the UO2 and interact with each other, see Figure 1-1 [8]; these defects negatively affect
key fuel performance metrics, such as thermal conductivity, mechanical integrity, and
service lifetime. As previous studies have shown, the UO2 pellet has many
microstructural defects [8-10]. To develop a deeper understanding of fuel performance,
defects in UO2 have been widely discussed.
Defects from Sintering Process
Developing an understanding of defects in UO2 is a complex problem. At the
beginning of life, before being placed in the reactor, there are already many defects in
the UO2 fuel arising from the fuel manufacturing process. In particular, sintering is a key
manufacturing step. In sintering, small particles are treated at high temperature and
pressure to compact them into the desired shape. During this process, the high
temperature drives diffusion of the particles surfaces. This surface diffusion allows
particles to coalesce by eliminating the particle surface area between coalescing
particles and lowering the surface free energy. Numerous grain boundaries (GBs) are
formed during sintering as the particles coalesce. Due to the irregular shapes of the
particles, there can also be many intergranular voids in the system. Experiment yielded
pellets sintered at 1573 K with 96.6% of the theoretical density of 10.96 g/cm3 [11]. The
elevated temperature used in the sintering process leads to high GB mobility and to
grain growth. At the same time, GB motion can leave behind intragranular voids [6].
Moreover, thermal energy can induce the thermal emission of vacancies from those
intragranular voids [6]. Thus the original UO2 fuel is full of GBs, vacancies and voids, as
illustrated by Figure 1-2 [11].

15
Defects from Nuclear Reaction
Many new defects are generated during burn-up in the reactor through elastic
scattering, Compton scattering by electrons, and nuclear fission [7, 12, 13]. There are
two elastic scattering processes; resonant scattering and potential scattering. In
resonant elastic scattering, the target nucleus absorbs the impacting neutron, and emits
another neutron. In potential scattering the incident neutron isn’t absorbed into the
target nucleus, but is simply scattered away. Hence, this reaction is similar to the
collision of two rigid bodies. In both of these elastic scattering processes, the target
nucleus doesn’t change after the collision. As a result, in elastic scattering, momentum
and kinetic energy are conserved in the center of momentum frame. However, a part of
energy is transferred from the incident particle to the target nucleus. This energy
transfer allows the target atom to be displaced from its lattice, leaving a vacancy behind.
This atom is called the primary knock-on atom or PKA [6]. In addition, elastic scattering
can impart high energy to electrons or protons [14]. These high energy particles can
then lead to the recoil of other atoms [6]. Compton scattering by electrons is different
from elastic scattering in that energy is absorbed by the target nucleus which jumps to
an excited state. The nucleus is usually unstable in this excited state and decays back
to the ground state by gamma ray emission. Although these gamma rays can be
sufficiently energetic that they can induce occasional point defects in UO2 fuel [15], their
influence is not significant.
Nuclear fission is the primary source of nuclear energy. In generally, in nuclear
fission a nucleus divides into two fragments and one or more neutrons [7, 12, 13]. For
instance, the following equation shows one of the nuclear fission reactions in 235U:

16
n01 + U92
235 = Cs55140 + Rb37
93 + n03 (1-1)
Through this and similar reactions many chemically different fission fragments are
produced. [16]. Some of those fissions are unstable, such as 140La which further decays
into other isotopes, and some of them are stable, such as 91Y. These fission fragments
can be viewed as new chemical defects in the UO2 matrix. The uranium fission into two
products can leave a vacancy behind, because these fragments usually have high
kinetic energy (10~100 keV). These fragments can collide with a lattice atom as PKAs
and become the main source of radiation defects. The PKA can move a long distance
through the lattice until most of its kinetic energy transmitted into the lattice. It can also
result in a cascade of atoms collisions and many atoms displaced from their original
lattice sites as further recoil atoms. An atom displaced from its lattice site leaves a
vacancy behind, and either settles into the lattice as an interstitial or occupies another
vacant site. These vacancies and interstitial defects can form Frenkel defects, which
can evolve into defect clusters such as di-clusters or cuboctahedral clusters[17].
Moreover, these defects can aggregate to form large scale voids which can further grow
by gathering additional vacancies. Other defects, such as GBs, can also aggregate with
these vacancies, forming GB/void complexes. Hence, even though the point defects are
small, they can lead to large scale (µm ~ mm) defects in the fuel pellet.
Defects from Fuel Decays
In addition to nuclear fission, the radioactive decay of fission product in UO2
pellet can also lead to the generation of additional defects. There are three main

17
energetic products of nuclear decays: alpha particles (4He nuclei), beta particles
(electrons or positrons), and gamma rays (high energy photons).
In radioactive heavy isotopes such as 234U, the nuclear force is not able to
maintain the stability of the nuclear. An alpha particle (particle contains two protons and
two neutrons) is emitted from the nucleus:
U92234 = Th90
230 + He24 (1-2)
Thus through alpha decay, the uranium atom is transmuted into a thorium atom. The
alpha particle (4He) in this decay is emitted with 4.15 - 4.2 MeV of kinetic energy [7].
The alpha particle usually has a micron-scale flight distance and produces ~350 point
defects [18]. In addition, the recoil of the fission product nucleus (230Th) can create as
many as ~2000 point defects[18]. Hence, one alpha decay can generate thousands of
point defects.
Beta decay is the process by which a neutron transforms into a proton or a
proton transforms into a neutron. If a nucleus has too many neutrons or protons, beta
decay can stabilize the nucleus. Depending on the emitted particle, the beta decay is
denoted beta plus (emission of a positron) or beta minus (emission of an electron). For
instance, a beta minus decay is expressed as:
Co 2760 = Ni28
60 + β- + e (1-3)
where e is the electron neutrino. As Eq. 1-3 shows, beta decay changes the atomic
number, transmuting one element into another. In this example, the kinetic energy of the
beta particle is ~2.8 MeV. It also leads to point defect generation in a manner similar to
alpha decay.
18
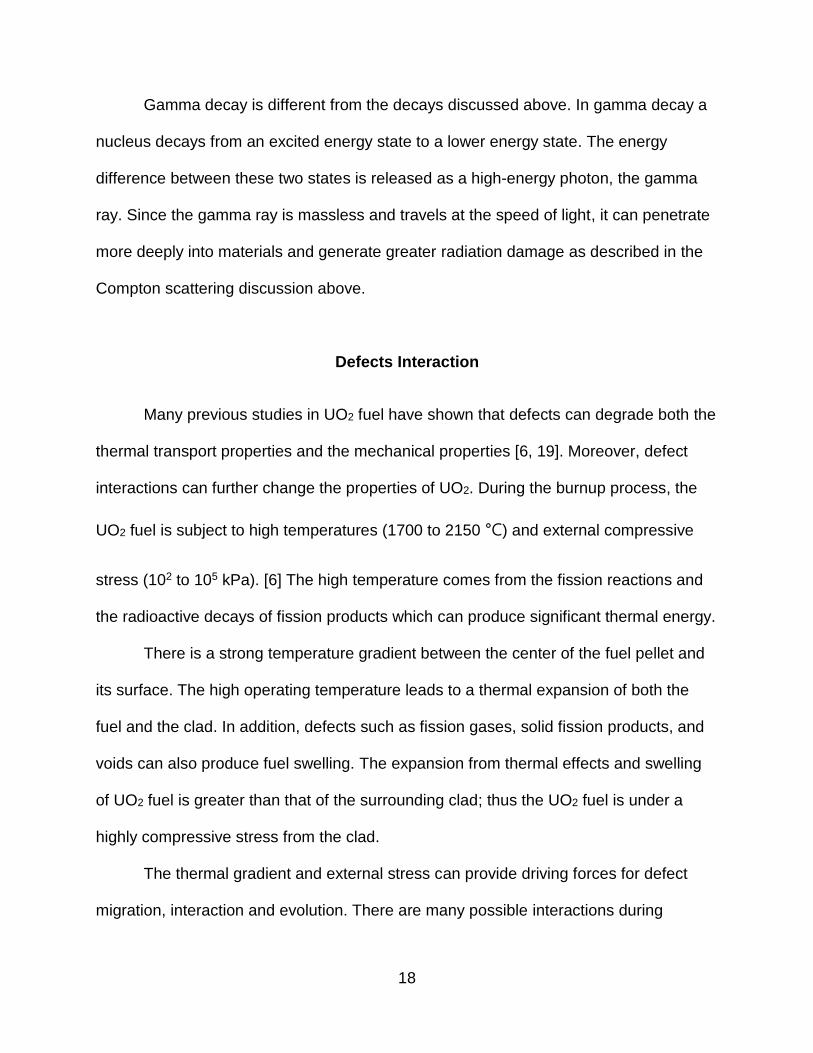
Gamma decay is different from the decays discussed above. In gamma decay a
nucleus decays from an excited energy state to a lower energy state. The energy
difference between these two states is released as a high-energy photon, the gamma
ray. Since the gamma ray is massless and travels at the speed of light, it can penetrate
more deeply into materials and generate greater radiation damage as described in the
Compton scattering discussion above.
Defects Interaction
Many previous studies in UO2 fuel have shown that defects can degrade both the
thermal transport properties and the mechanical properties [6, 19]. Moreover, defect
interactions can further change the properties of UO2. During the burnup process, the
UO2 fuel is subject to high temperatures (1700 to 2150 °C) and external compressive
stress (102 to 105 kPa). [6] The high temperature comes from the fission reactions and
the radioactive decays of fission products which can produce significant thermal energy.
There is a strong temperature gradient between the center of the fuel pellet and
its surface. The high operating temperature leads to a thermal expansion of both the
fuel and the clad. In addition, defects such as fission gases, solid fission products, and
voids can also produce fuel swelling. The expansion from thermal effects and swelling
of UO2 fuel is greater than that of the surrounding clad; thus the UO2 fuel is under a
highly compressive stress from the clad.
The thermal gradient and external stress can provide driving forces for defect
migration, interaction and evolution. There are many possible interactions during

19
burnup. Of particular relevance for this work are void nucleation from vacancies, void
pinning at GBs, and void aggregation to form rapid diffusion paths.
Void Nucleation
Under operating conditions, the high environment temperature provides
vacancies with enough kinetic energy to migrate. This fast bulk diffusion allows
vacancies to combine and nucleate into voids. As Figure 1-3 [11] shows, the voids in
UO2 pellet keep growing at these high temperatures.
After voids form, fission products such as helium and xenon can migrate into
them to form bubbles [8]. Voids/bubbles inside the UO2 can degrade the thermal
conductivity, which makes thermal management of UO2 fuel difficult [20]. Thus there are
a number of studies focusing on void/bubble formation, growth [8], or migration [21].
Void Interaction with a Grain Boundary
As discussed above, the high temperature and stress environment drive
void/bubble migration. Since the UO2 pellet is a polycrystalline structure, these
migrating voids can interact with GBs. Previous studies indicated that the GBs can
apply a force to the void/bubble which can pin it, as Figure 1-4 [6] shows. The force of
interaction varies with the contact angle between void and GB [6]. Thus as the void or
grain boundary migrates, the interaction force changes. This directly influences the
defect migration and the subsequent defect evolution.

20
Evolution of Void-grain Boundary Complex
Studies of void–GB complexes also predict their energetics and the nucleation
rate [22, 23]. The void prefers to nucleate at a triple joint [22]. In addition, after a void
pins at a GB, it does not necessarily remain stable. Rather, voids can connect with each
other to form long-range diffusion paths which allows fission product release [24]. Figure
1-5 shows the evolution of a defect complex from isolated bubbles to interconnected
bubbles to a tunnel network. [25] Hence, the structure of this defect complex evolves
dynamically.
Objective
As discussed above, the structure of UO2 fuel is extremely complex due to the
many types of defects and the dynamic defect interactions. While there are many
studies of defect interactions, atomic-level understanding of those interactions is still not
well developed. To understand the atomic level information of these behaviors and to
provide the insights needed to predict microstructural evolution, in this dissertation, we
perform molecular dynamics simulations to analyze these defects interactions.
Specifically, this dissertation describes three specific phenomena: after an introduction
to defects in UO2 and the methods used in Chapter 2, void nucleation is discussed in
bulk UO2 in Chapter 3, void interactions at GBs in Chapter 4, and the evolution of void-
GB complexes in Chapter 5. In addition to UO2 fuel, the oxidation of zirconium based
clad will be discussed in Chapter 6. Chapter 7 contains the conclusions.

21
Figure 1-1. Defects inside a UO2 pellet [8]. This image displays large intergranular voids/bubbles, small intragranular voids/bubbles, and grain boundaries. Reprinted from S. Kashibe, K. Une, K. Nogita, J. Nucl. Mater., 206 (1993) 22-34. Copyright 1993, with permission from Elsevier.

22
Figure 1-2. Defects in UO2 fuel after sintering at 1773 K for (A) 0.1 hours and (B) 20 hours [11]. Reprinted from K.W. Song, Y.W. Lee, M.S. Yang, D.-S. Sohn, Y.H. Kang, J. Nucl. Mater, 209 (1994) 263-269. Copyright 1994, with permission from Elsevier.
A
B

23
Figure 1-3. UO2 pellet void size growth under sintering at 1773K [11]. Reprinted from K.W. Song, Y.W. Lee, M.S. Yang, D.-S. Sohn, Y.H. Kang, J. Nucl. Mater, 209 (1994) 263-269. Copyright 1994, with permission from Elsevier.

24
Figure 1-4. A schematic of a void pinned with a grain boundary.

25
Figure 1-5. Structure evolution of void-GB defect complex shows the defect complex growth process. Reprinted from R.J. White, M.O. Tucker, J. Nucl. Mater., 118 (1983) 1-38. Copyright 1983, with permission from Elsevier
26
CHAPTER 2 DEFECTS IN UO2 AND SIMULATION METHODOLOGY
Background
Many types of defect exist in the UO2 pellet [6]. Such defects significantly
influence both the thermal and mechanical properties. It is scientifically interesting to
analyze these defects and their interactions. We believe it will be possible to design a
better UO2 fuel by understanding the behaviors of these defects. As discussed in
Chapter 1, many structural defects are produced during the burnup process. These
defects are complex, making it difficult to analyze all of them simultaneously. Thus, it is
necessary to analyze individual defect behaviors in isolation. Four types of structural
defects can be classified according to their spatial dimensions; zero dimensional defects
such as interstitials and vacancies, one dimensional defects such as dislocations, two
dimensional defects such as grain boundaries and stacking faults, and three
dimensional defects such as voids, bubbles, and precipitate clusters. In this study we
focus on defect interactions and the resulting structural evolution. Specifically, this work
focuses on the analysis of vacancies, voids, grain boundaries and their interactions.
Vacancy Defects in UO2
A vacancy is an atom missing from a single crystal lattice site, as illustrated for
the UO2 fluorite structure in Figure 2-1. Vacancies can evolve into larger scale defects
such as vacancy clusters and voids. In addition, a vacancy can collect fission gas such
as Xe, He, or Kr to form a vacancy-fission cluster [6]. Thus vacancies can potentially be
the source of voids and gas bubbles.

27
There are many sources of vacancies in a UO2 pellet. As mentioned in Chapter
1, the sintering process during manufacture produces vacancies, and uranium atoms
undergo fission which can produce uranium vacancies. Moreover, in accord with
thermodynamics, there will be an intrinsic concentration of vacancies, which increases
exponentially with temperature [26].
Vacancies in ionic crystals such as UO2 are more complex than in metallic
materials due to the vacancy charge. A missing cation (U4+) or anion (O2-) can influence
the local charge neutrality. There are two kind of point defect combination which could
avoid this problem. They are the Frenkel pair defect and the Schottky trio. In a Frenkel
pair, there is one vacancy combined with one interstitial of the same element. In UO2
the recombination of vacancy and interstitial can take place [17]. Hence, this defect can
be easily healed. In the charge neutral Schottky trio, the defect is formed by
combination of a U4+ vacancy and two O2- vacancies, see Figure 2-2. Unlike the Frenkel
pair, this defect cannot be healed by cation and anion recombination; thus, throughout
this dissertation vacancies are introduced as Schottky defects. The specific properties
of Schottky defects are related to the detailed atomic configuration, as will be discussed
in Chapter 3.
The mechanism of vacancy migration involves an atom jumping out its lattice
site, leaving a vacancy behind, and moving into a vacancy site or an interstitial site.
During migration, atoms need to overcome the energy barrier which arises from the
breaking bonds with its neighbors. This is the activation energy for vacancy migration,
as Figure 2-3 illustrates. There are two main mechanisms for the atom migration
process in UO2 during burn up. The first process is a high energy particle (atom, alpha

28
particle, beta particle, and gamma rays) which can knock atoms off their lattice sites: the
primary knock on atom (PKA) mentioned in Chapter 1. The second process is thermal
energy: the high-temperature induced thermal diffusion rate can be expressed by the
Arrhenius equation:
D = D0 exp (−Em
KT) (2-1)
where D0 is the temperature independent pre-exponential term, Em is the activation
energy, K is Boltzmann constant, and T is temperature. This dissertation focuses on
vacancy diffusion at high temperature to isolate the problem in the thermal induced
microstructure evolution rather to than dynamics driven by composition gradients or by a
PKA mechanism.
Voids in UO2
A void is a 3-dimensional defect, as Figure 2-4 shows. Voids in UO2 are undesirable
because they can lead to degradation of the thermal conductivity performance [20],
mechanical behavior and fracture strength [6]. Moreover, voids can gather fission gases
or solid fission products, leading to swelling of the UO2 pellet [27].
Because of their detrimental properties, it is important to study the behavior of voids in
UO2. Void growth generally takes place through one of two different routes: coalescence
and Ostwald ripening. Figure 2-5 illustrates these two mechanisms. In the coalescence
process, voids migrate to meet each other, then combine. The process of Ostwald
ripening is more complex. Initially a vacancy is emitted from one void, which then
deposits onto another void. After this has happened repeatedly, one void grows while the
other void shrinks. Both of these mechanisms will be discussed in Chapter 3.

29
As discussed in Chapter 1, during operation the UO2 fuel is at high temperature.
This thermal energy can produce void migration, as has been observed in previous
experimental and simulation studies in UO2 [6, 28, 29]. Specifically, there are three
possible void migration processes [6, 28]. First, the void can migrate through atomic
diffusion along the void surface from one end to the other. Second, void migration can
take place through vacancy diffusion through the bulk. In this process, vacancies are
emitted from one end of the void surface into the bulk lattice. These emitted vacancies
then deposit onto the other end of the void which leads to void migration. Third, the void
migration can take place through void dissolution and condensation in a process similar
to Ostwald ripening. These three migration mechanisms are illustrated in Figure 2-6.
Grain Boundaries in UO2
As mentioned in Chapter 1, the manufacture of polycrystalline UO2 involves a
sintering process. The GBs formed during sintering play an important role in determining
the pellet properties, not only alone, but also through interaction with other defects. For
instance, the thermal conductivity can be influenced by GBs, as elucidated in a previous
study [30]. Previous experimental [6, 8, 24] and simulation [31, 32] studies have also
shown that GBs can act as defect sinks or sources for voids/bubbles. If impurities
segregate to the GB, a second phase can form. In addition, the mobility of the GB can
control the rate of grain growth [33]. Thus analysis of GBs is of great interest.
Many previous studies have identified GB migration mechanisms by experiment [6,
34-39] or simulation [40-43]. First, a GB can migrate through self-fluctuations [40, 41]: at
high temperatures atoms along the GB make random jumps, allowing the position of the
GB to fluctuate. Second, the GB can be driven by an external driving force such as a

30
stress gradient [42, 43], electric field [39] or temperature gradient [37]. These driving
forces can give atoms in the two grains different energies, such that the GB migrates to
swallow up the higher energy grain. Third, the GB can be dragged by impurities or
voids/bubbles [34-36, 44]. Under operating conditions, the UO2 pellet is under both
temperature and stress gradients. There are also many impurities and voids/bubbles
inside the UO2 pellet. Thus the GB migration process can be expected to be complex. To
better understand this behavior, the effects of GB fluctuations and GB dragging by voids
will be discussed in this dissertation.
Molecular Dynamics
Computational methods are well suited to capturing defect behavior and
properties in UO2 [17, 21, 28, 31, 45, 46]. In contrast to experiments, depending on the
specific technique used, simulation is able to capture the continuous structural evolution
over picosecond timescales (10-12 s), and to provide information at the atomic level.
Many different computational methodologies have been developed to analyze different
material problems. Generally they can be distinguished by the time and length scale at
which they operate. In this work, defects in UO2 pellet can vary on the nm scale. The
time scale of their evolution can be correspondingly fast: ps to ns (10-9 s). Molecular
Dynamics (MD) simulation is ideal for capturing this small-scale and fast evolution. MD
simulation has been widely used in studies of various UO2 defects, including
voids/bubbles [21, 32], grain boundaries [28, 47, 48], and point defects [17, 49, 50].
Since the initial microstructure can be completely defined in an MD simulation, it is
possible to simulate individual defects or small groups of defects in a manner that is
much more controlled than can be achieved experimentally.
31
Briefly, MD simulation [51] predicts atomic motion by solving Newton’s second law :
F⃑ = ma⃑ =dr⃑ 2
dt2 (2-2)
where F⃑ is the force on the atom; m is the mass of the atom; a⃑ is the atom’s acceleration.
The force F⃑ on each atom can be accessed through its potential energy V:
F⃑ = −∇V (2-3)
The potential energy is calculated through the specific interatomic potential used to
describe the interatomic interactions in the MD simulation.
To solve the equations of motion computationally, many algorithms have been used,
including the Verlet integration [52], the Runge–Kutta method [53], and the constraint
algorithm [54]. The Verlet integration scheme is used as an example to explain the
prediction of the atomic motion. An atom’s location at time t+∆t time can be predicted by
Newton’s equation using a Taylor expansion which, to second order, can be expressed
as:
r (t + ∆t) = r (t) + v⃑ (t)∆t +a⃑ (t)
2∆t2 (2-4)
Similarly, the atoms location at time 𝑡 − ∆t time can be expressed as:
r (t − ∆t) = r (t) − v⃑ (t)∆t +a⃑ (t)
2∆t2 (2-5)
Combining Equations 2-4 and 2-5, gives:
r (t + ∆t) = 2r (t) − r (t − ∆t) + a⃑ (t)∆t2 (2-6)
Thus, this algorithm can easily predict an atom’s location computationally.
In simulation, the temperature can be calculated in terms of the atoms kinetic
energy as:

32
1
2mv2 =
3
2KT (2-7)
where K is the Boltzmann’s constant and T is the temperature. The simplest way to
adjust or maintain the temperature is velocity rescaling which is a special case of
Berendsen thermostat algorithm [55]. According to Eq. 2.4, the temperature is calculated
from the atom velocity. The system temperature can be adjusted by changing the velocity
of atoms according to:
V = V0√T ⁄ T0 (2-8)
where v is the velocity, T is the actual temperature and T0 is the target temperature. In
this way, the temperature in the MD simulation can be adjusted. Throughout the MD
simulations in this work, this method is used to control the temperature. There are other
algorithms that have been used as thermostats, including the Nosé-Hoover thermostat
[56], the Andersen thermostat [57], and Langevin dynamics [58].
An interatomic potential is essential for the MD simulation. Physically, there are
many different types of interatomic bonding. Covalent, ionic and metallic bonding are
considered to be primary bonding, while van der Waals and hydrogen bonding are
considered to be secondary bonding. In MD simulation, these bonding types are
described by specific interatomic potentials, V. Since the potential is used to express
the material properties, it is important to choose the potential to accurately reproduce
the interatomic bonding. A large number of potentials have been developed to describe
the dominantly ionic interactions in UO2 [49]. In most cases the interactions are
represented by Columbic interactions plus a Buckingham type potential [59]. The
general form is expressed as:

33
𝑉𝑖𝑗(𝑟) =𝑞𝑖𝑞𝑗𝑒
2
4𝜋𝜀0𝑟2+ 𝐴 exp (
𝑎𝑖+𝑎𝑗−𝑟
𝑏𝑖+𝑏𝑗) −
𝐶
𝑟6 (2-9)
where the first term represents the Coulomb interactions. The second and third terms
constitute the Buckingham potentials, with the second term capturing the repulsion
between the electronic cores, while the third term is the Van der Waals attraction. In this
potential, q is the charge of the atom, r is the distance between atoms. The variables A
and C define the short-ranged interactions.
The Buckingham type potential does not include terms to characterize the partially
covalent character of U-O bonds. To describe the covalent bonds, an additional Morse
term has been introduced in some UO2 potentials [59]. The full potential can then be
expressed as:
𝑉𝑖𝑗(𝑟) =𝑞𝑖𝑞𝑗𝑒
2
4𝜋𝜀0𝑟2+ 𝐴 exp (
𝑎𝑖+𝑎𝑗−𝑟
𝑏𝑖+𝑏𝑗) −
𝐶
𝑟6+ 𝐷𝑖𝑗 {[1 − exp (𝛽𝑖𝑗(𝑟 − 𝑟𝑖𝑗
∗ ))] − 1} (2-10)
Throughout this dissertation, the empirical Basak rigid-ion potential [60] is used to
describe the interatomic interactions. The Basak potential includes Buckingham and
Morse interactions to describe the short-ranged and partially covalent character of the U-
O bonds [49]. The Basak potential uses Coulomb’s Law to describe the electrostatic
interactions; here Coulomb sums are performed with the charge-neutralized direct-
summation method [61]. Its parameters are shown in Table 2-1 [60].
This potential reproduces the properties of UO2 quite well at high temperature, and
has been used previously to investigate defects in UO2 [17, 21, 28, 48]. The zero-
temperature lattice constant is predicted to be 5.454 Å [49], which is consistent with the
experimental value of 5.47 Å [62]. The melting temperature is Tm = 3450 K [60] which is
in reasonable agreement with the experimental melting point of 3100 K. The oxygen

34
sublattice melting point is 2200 K, which is also in reasonable agreement with the
experimental value of 2600 K [63]. In this dissertation, a cut off radius of 1.98 a0 is used
(i.e., 1.079nm, where the zero-temperature lattice parameter is a0 = 0.545 nm).
Through this dissertation, simulations are performed at high temperature (> 0.8 Tm),
such that significant defect movement takes place over the MD time scale (ns). Previous
studies using the Basak potential and similar types of rigid-ion potentials indicate that
uranium ion diffusion takes place on MD time scales for T > 2500 K [21, 28, 32]. This
temperature is much higher than the operating temperature of the actual fuel; however,
previous studies have shown that this temperature does not influence the overall
evolution of the UO2 system, but does greatly speed up all kinetic processes [21, 28].
Although this temperature is also higher than the oxygen sublattice melting temperature,
this is not problematic because previous simulations [28, 32, 64] showed that the uranium
FCC sublattice is still stable through the O sublattice melting. Moreover, even at T = 3000
K, oxygen atoms still occupy the oxygen sites [28], and there was no significant impact
on the UO2 structure. The chief effect of the high temperature should only be to
accelerate the dynamics. In this high temperature environment, we predict that vacancy,
void and GB motions and interactions will take place.
The AtomEye [65] software package is used for visualization in this dissertation: it can
display the coordination number and potential energy of each atom. [65]

35
Figure 2-1. Illustration of a U vacancy in UO2 fluorite structure. The large blue circle indicates the location of U, while the small red circle indicates the location of the oxygen. The dashed circle indicates the location of a U vacancy.

36
Figure 2-2. A Schottky trio in UO2 oriented along [111].

37
Figure 2-3. An illustration of an atom/vacancy migration path and its energy barrier (Em).
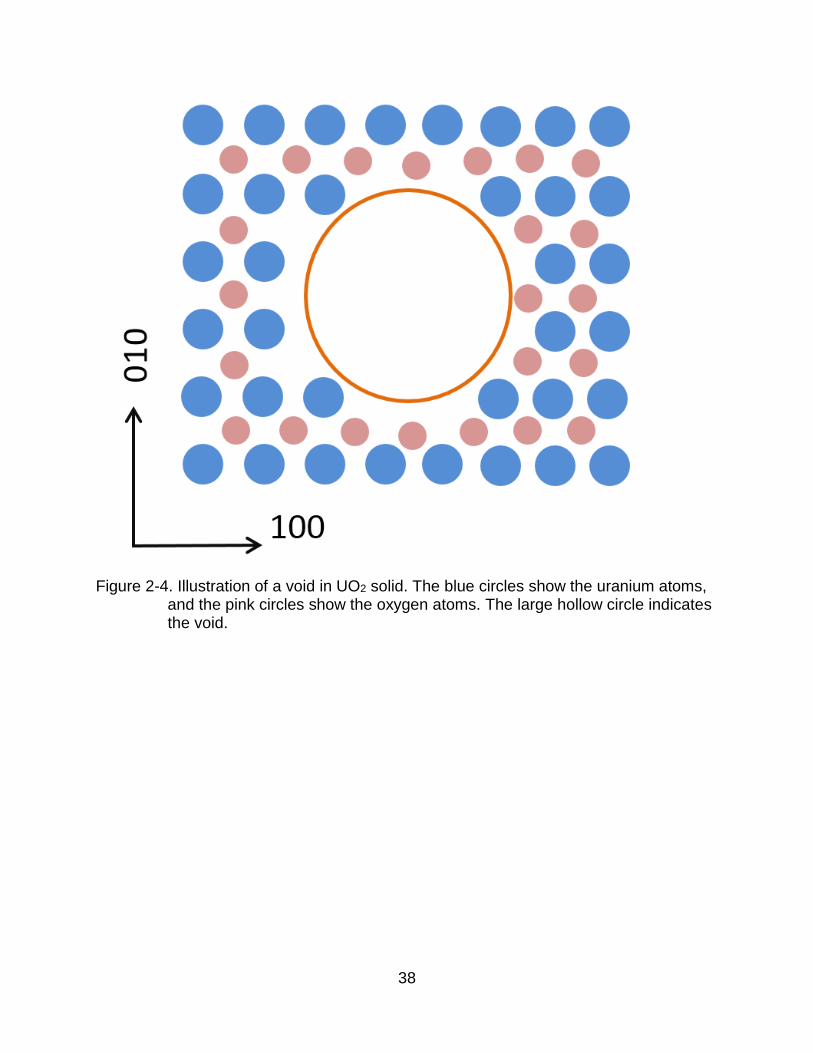
38
Figure 2-4. Illustration of a void in UO2 solid. The blue circles show the uranium atoms, and the pink circles show the oxygen atoms. The large hollow circle indicates the void.
39
Figure 2-5 Schematics of void coalescence and Ostwald ripening.

40
Figure 2-6. Void migration mechanisms. A) Atoms diffuse along void surface lead to void migration. B) Vacancy diffuse from void surface through the bulk, with deposition on the other side of the void surface. C) A void emits vacancies which condense to another void. Blue arrows demonstrate the net direction of atom or vacancy diffusion. The red arrow in A) and B) indicate the net migration direction.
A B
41
Table 2-1. Parameters of Basak potential. [60]
Parameters Units
Fo eV/ Å 0.043405
QO e -1.2
aO Å 1.926
bO Å 0.16
cO eV1
2/ Å 3 2.03657
QU e 2.4
aU Å 1.659
bU Å 0.16
cU eV1
2/ Å 3 0
DO-U eV 0.78129
r*O-U Ǻ 2.369
βO-U 1/ Å 1.25

This chapter is based on T. W. Chiang, A. Chernatynskiy, S. B. Sinnott, S. R. Phillpot, “Void nucleation in UO2 by molecular dynamics simulation”, Journal of Nuclear Materials. (Under review).
43
CHAPTER 3 VOID NUCLEATION IN UO2
Vacancies exist in the UO2 pellet, produced either during the sintering process
[11], or as a result of uranium fission during burn-up [6]. Some of these vacancies
condense into voids, which can then fill with fission gases to produce bubbles [6, 8, 66].
Such void generation is important because the voids and fission gas accumulation
cause swelling that can eventually compromise the thermal transport properties [67, 68]
and the mechanical properties [10, 69] of the fuel. Furthermore, these voids can interact
with other structural defects such as dislocations and grain boundaries [8, 64], further
modifying the physical and structural properties of the UO2. It is thus important to
understand the behavior and evolution of voids and bubbles, both individually and
collectively. In this work, we focus on the initial stages of void nucleation by vacancy
condensation in bulk structures.
Void Nucleation Process, Ostwald Ripening and Coalescence Mechanism
It is well-known that there is significant vacancy migration at high temperatures in UO2
[6, 8, 21]. During the migration process, vacancies interact and produce voids, as many
experimental studies have shown [8, 70]. While much work has focused on the behavior of
extant voids and bubbles [21, 71, 72], there is little understanding of the processes by
which they develop. Experimental data indicate that there are two main void growth
mechanisms: coalescence by void/vacancy diffusion [73-75], and Ostwald ripening through
the dissolution of one void into vacancies, then re-deposition onto another void [75-77].
43
Consequently, mesoscale simulations by phase-field methods [78], Potts models, and
kinetic Monte Carlo simulations [79] that include one simple mechanism cannot fully
explain the complex void growth behavior. Moreover, these methods do not provide
atomic-level resolution. Here, we use molecular dynamic (MD) simulations of a bulk UO2
system containing significant concentrations of vacancies to provide atomic-level
information on the mechanisms associated with the initial stages of the void formation
process.
All simulations in this chapter are performed on bulk UO2. The rectilinear
simulation cell of ~35,000 ions has dimensions of 65 nm x 98 nm x 147 nm at T = 0 K;
three–dimensional periodic boundary conditions are applied. To accelerate vacancy
diffusion, the simulations are performed at high temperature, T= 2800 K. As we
mentioned in Chapter 2 this temperature is much higher than the operating temperature
of fuel; however, previous studies showed while this high temperature does not
influence the overall evolution of UO2 systems, it does greatly speed up all kinetic
processes [21, 28] such that they are observable on the MD time scale. The structure is
heated gradually to the working temperature at constant pressure (NPT ensemble) over
0.3 ns (600,000 MD time step of 0.5 fs), which is a short enough time step for good
energy conservation in test simulations in the NVE ensemble [21, 28]).
The O and U Frenkel defect formation energies for the Basak potential in different
defect configurations are 4.8–6.0 eV and 12.4–17.0 eV [49], respectively, compared to the
experimental values of 3.6–3.9 eV and 9.5–12.6 eV [49]. Thus, the equilibrium
concentration of the O and U Frenkel defect at this temperature should be approximately 5
x 10-6 and 5 x 10-24; consistent with this, we do not see spontaneous formation of Frenkel

44
defects in our simulations. Once the structure reaches the working temperature, the
structure is annealed for 0.1 ns to reduce the stresses to 10-3 eV/Å2. The simulation cell
dimensions and volume are then fixed to avoid the shrinkage of the system after the point
defects are added. Schottky defects are then introduced into the structure with a vacancy
defect density of 10 %, similar to the concentration used in previous simulations of voids in
UO2 and irradiated metals [32, 80]. To avoid initial diffusionless vacancy clustering, the
shortest distance between any two uranium vacancies is initially set to be no less than one
lattice parameter. After introducing vacancies, the structure is annealed at the desired
temperature for 2 ns.
Overall Microstructure and Nucleation Energy Evolution
Vacancy diffusion and vacancy aggregation are necessary for void nucleation.
We have tested several structures with different random initial vacancy configurations,
as indicated in Figure 3-1A. In particular, Figure 3-1 shows the vacancy nucleation
process over 2 ns at 2800 K in a representative bulk UO2 structure with 10 % vacancy
concentration; the other five simulations at the same concentration with different initial
defect configurations yield similar results. The snapshots in Figure 3-1A, 3-1B and 3-1C
show only the uranium ions in a single atomic place; Figure 1d shows only the oxygen
ions. The activation energy for uranium migration is more than five times that of the
oxygen migration energy [49]. Previous studies also calculated the self-diffusion
activation energy from the mean square displacement (MSD) [21, 28]. They found the
activation energy in uranium ion is 1.6~2.0 times greater than that of the oxygen ion.
Thus the oxygen mobility is high, and the defect evolution process is controlled by slow
uranium diffusion [21, 28, 64]. The structure of the voids in Figure 3-1C and 3-1D are

45
essentially identical, indicating that the melting of the oxygen sublattice does not
influence their shape. Hence, we need only analyze the U–sublattice, which maintains a
high level of order throughout the simulations.
After 0.25 ns, Figure 3-1D, vacancies have begun to diffuse and combine,
nucleating small voids. After 2 ns, the system has a number of well–separated stable
voids, as indicated in Figure 3-1C and 3-1D; however, there are still a few vacancies
that have not aggregated into voids. This result is similar to the results of a previous MD
simulation study [32], which showed that void nucleation and growth occurs widely in
UO2. Moreover, it is consistent with previous simulations of void nucleation in UO2 [79],
and void nucleation/growth behavior in irradiated metals [80].
Energy Evolution during Void Nucleation
In order to understand this void behavior, we use molecular statics calculations to
track the evolution of the structural energy through the nucleation process without the
complications of the thermal vibrations. To mimic the void nucleation process, we
construct a set of void structures by manually removing Schottky defects one by one. To
reliably determine the defect energy, we make these defect structures highly symmetric,
with the smallest possible electric dipole, quadrupole or higher order moments. Due to
the need to preserve local charge neutrality, it is difficult to make all voids completely
symmetric; thus the energies determined here should only be considered best
estimates.
We examine the formation energy of these voids, Eform = Evoid - n*Esch, where
Evoid is the defect energy of the void of n Schottky trios and Esch is the energy of an
individual Schottky defect. There are several different possible configurations for

46
individual Schottky defects, each with a different formation energy [49]. Here we use the
lowest Schottky defects energy (Esch = 5.4 eV) as the reference. As noted by Govers et
al., vacancy defect structures such as Schottky trios can attract each other [49]. Indeed,
Figure 3-2 indicates that the defect energy of the void (Evoid) normalized by the number
of Schottky defects (N), decreases monotonically as the number of vacancies
increases. This indicates that void growth occurs without a nucleation barrier, which is
consistent with the dynamics seen in Figure 3-1. The behavior of the Eform as a function
of the number of Schottky defects in the void can be understood in terms of the surface
and volume energy contributions. Adding additional Schottkys to the void lowers the
energy of the system by Esch by eliminating the defect from the bulk: this is a negative
volume–energy contribution. A larger void will have a larger surface area and thus
greater Evoid: this is a positive surface-energy contribution. The first contribution is the
same whether a single Schottky defect accretes to a small void or a large void.
However, the surface area, A, increases only as ~V2/3 as the volume of the void
increases. For small voids, therefore, the surface energy contribution is comparable to
the volume term, but becomes negligible for very large voids. Indeed, the plot on Figure
3-2 flattens out as number of voids increases. The size of the system, however, is not
large enough to observe an asymptotic behavior to -Esch.
The above analysis considers the potential energy only. Unfortunately there is no
straightforward way to determine the free energy of the system; thus this analysis does
not include the entropic contribution, which would tend to disfavor the condensation of
isolated voids into vacancies. To estimate the free energy contribution from the
configuration entropy, we use ideal solution theory [26] as following.

47
∆s = −NK[𝑋𝐴ln 𝑋𝐴 +𝑋𝐵ln 𝑋𝐵] (3-1)
∆G = −T∆S (3-2)
Where the N is the number of objects, K is Boltzmann constant, XA and XB are fractions
of components A and B.
Corresponding to a 10 % defect concentration, we compare the system with 36 U
vacancies and 72 O vacancies (equivalent to 36 Schottky defects that have coalesced
into a single void) with the system containing one single void condensed from these
defects. The void volume is equal to 2.4% of system volume. The entropic contribution
to the free energy of the systems with isolated voids, which would tend to lead to void
dissolution, is ~24 eV at 2800 K which is of much lower magnitude than the structure
energy contribution ~-130 eV. Thus the free energy can be expected to drive void
formation at all temperatures.
Interaction between Voids
To further characterize the void coalescence behavior, we examine the
interaction between voids. Specifically, we construct pairs of voids with the same radii
and separate them by various distances within the lattice in a molecular statics
simulation. For all the structures considered, we allow the void shape to equilibrate. The
total numbers of Schottky defects in each void is 19 (r = 0.6 nm), 43 (r = 0.75 nm) and
86 (r = 1.0 nm).
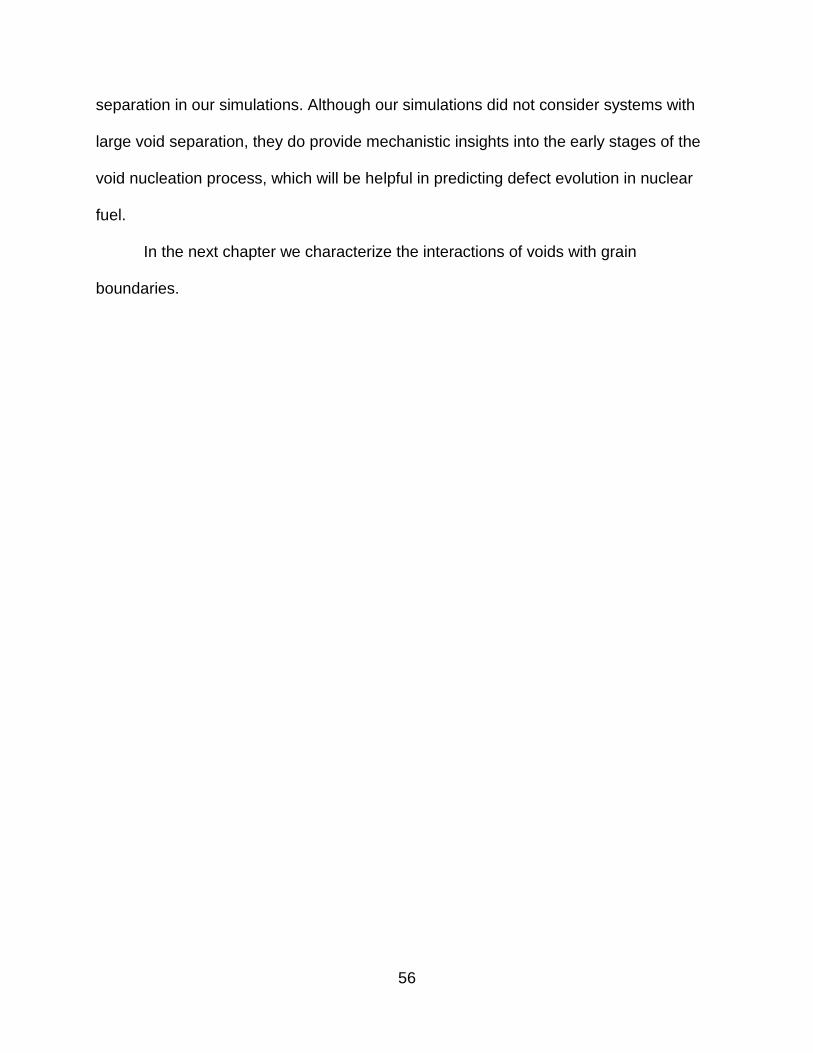
Figure 3-3 shows the total energy of the voids as a function of separation. Before
the voids make contact, there is no significant change in the energy. Following
48
contraction, the energy decreases dramatically (due to the decrease of the total surface
area) until two voids fully fuse together, at which point the total energy is minimized.
However, the weak void interaction before contact is also important. The inset to
Figure 3-3 illustrates the power law dependence on the void separation, R, for the r =
0.75 nm voids. As the voids approach each other, the system energy decreases
indicating void attraction. Such an elastic interaction among inclusions was analyzed by
Eshelby [81] who determined the elastic field of an elastic body stays in a solid matrix.
An elastic theory study by Johnson et al. suggests that there is an attraction energy
between two spherical precipitates which drops off as R-6 (for R ≥ 3) [82], where R is the
ratio of void separation to void radii. Our simulation results for the r=0.75 nm gives a
dependence of the interaction energy of R-4.9±0.1. We can consider this as reasonable
agreement because the elastic solution is valid for large separations [82, 83], while in
our simulations the separation between voids is relatively short (R = 0–3.6), which can
be expected to lead to deviations from the elastic solution.
The elastic solution does not take the electrostatic interactions into account,
which can be potentially expected to be large, possibly even dominating the elastic
interactions. To examine these interactions, we examine the voids in Figure 3-4A and 3-
4b, which have the same size and shape and consist of the same number of Schottky
defects. The only difference between the two is the arrangements of the oxygen atoms
on the void surfaces, resulting in different electric dipoles on the voids, which lead to
different electrostatic interactions, as previous studies have shown [84-86]. For the
voids in Figure 3-4A, the system energy decreases by 2.8 eV as the distance decrease
from 4.2 nm to 1.95 nm which is similar to Figure 3-3. By contrast, for the voids in

49
Figure 3-4B the system energy increases by 12.6 eV over the same distance. That is,
the electrostatic repulsion dominates the elastic attraction. Thus the softening of the
interaction in the inset to Figure 3-3 compared to the predicted R-6 interaction might also
be attributable, at least in part, to the electrostatic environments. Of course, at high
temperatures, the high mobility of oxygen ions on the internal surface of the void can be
expected allow a surface configuration that mitigates this shape effect.
As the number of Schottky defects in the void increases, it is possible to make
more and more isotropic voids with smaller and smaller electric dipole moments. Hence
the influence from the electrostatic interaction at high temperatures should be smaller
for large voids than small voids. However, because the voids in our system are very
small (r ≤ 1 nm), their anisotropy results in a non-negligible electrostatic interaction
between two voids in both our MD simulations and the lattice statics calculations.
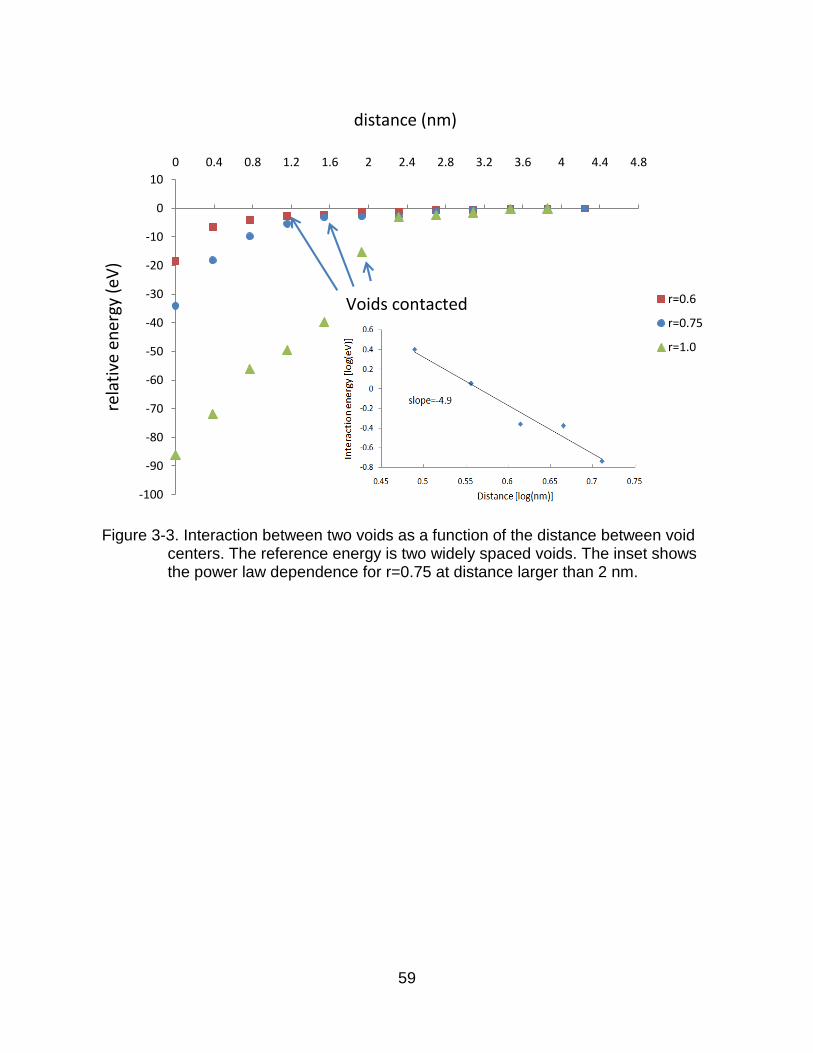
To characterize the void interactions at the atomic level, we examine the
potential energy of each atom in a structure. The example in Figure 3-5 clearly
illustrates that the atoms in the region between two voids have a higher potential energy
than the atoms in the regions far away from voids. General physical principles suggest
that there is a driving force for atoms to move from regions of higher potential energy to
regions of lower potential energy; that is, away from the region between the voids. This
energy reduction takes place by diffusion over the internal surface of the void. This
attractive microscopic interaction can also be considered in terms of the stresses on the
system. A previous MD simulation study of voids in UO2 by Desai et al. [21] indicated
that a void has an associated compressive region around it. We thus expect the region

50
between the two voids should be under the largest compressive stress in the structure,
again a signature of driving force to drive the atoms out of this region [87].
Voids Formation and Growth in Atomic Level View
The simulation results in the previous section predict that voids grow under
thermal annealing, which is consistent with experimental results [8, 10, 88]. However,
the atomic-level processes associated with void growth are still not well understood; we
thus address them in this section. To characterize the evolution of the vacancy–void
complex, we record the time evolution of the total number of vacancies and voids at
2800 K. To remove any effects of the specific initial conditions, we construct five
different initial configurations with the same vacancy density. The main difference
among the various systems is the precise locations of the voids. As expected, all of
these systems evolve in a similar manner: in each case the total number of voids grows
continuously while the total numbers of free vacancies decreases.
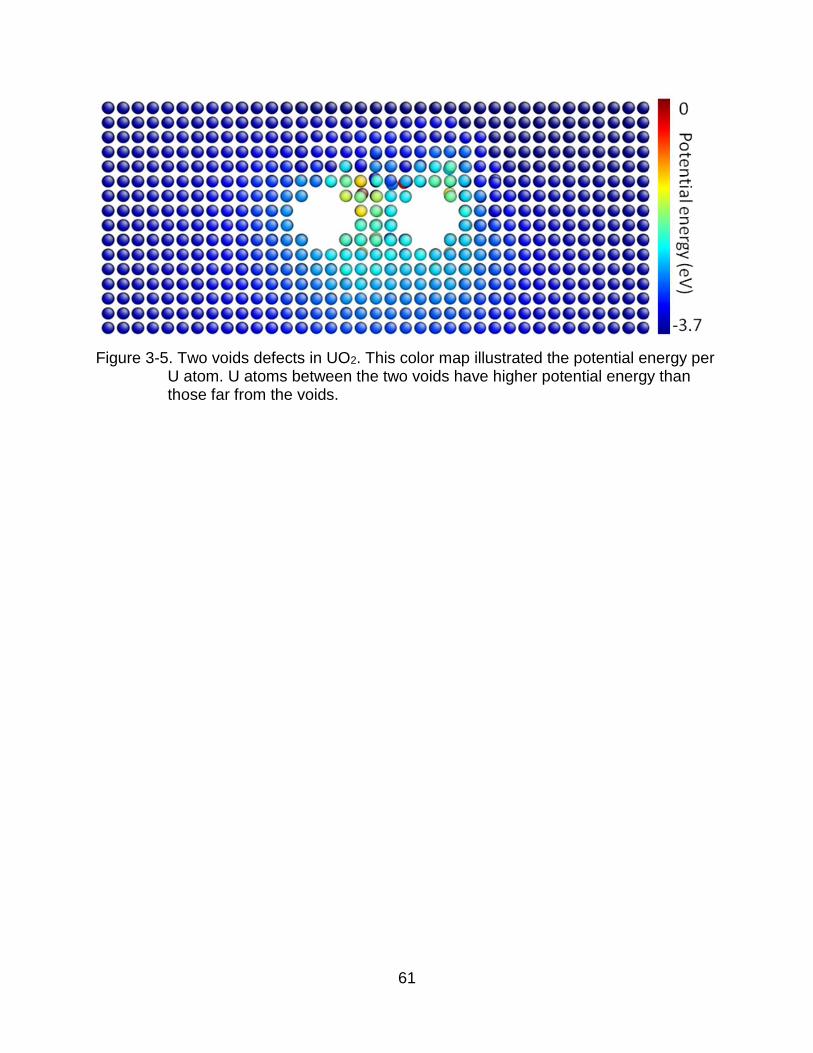
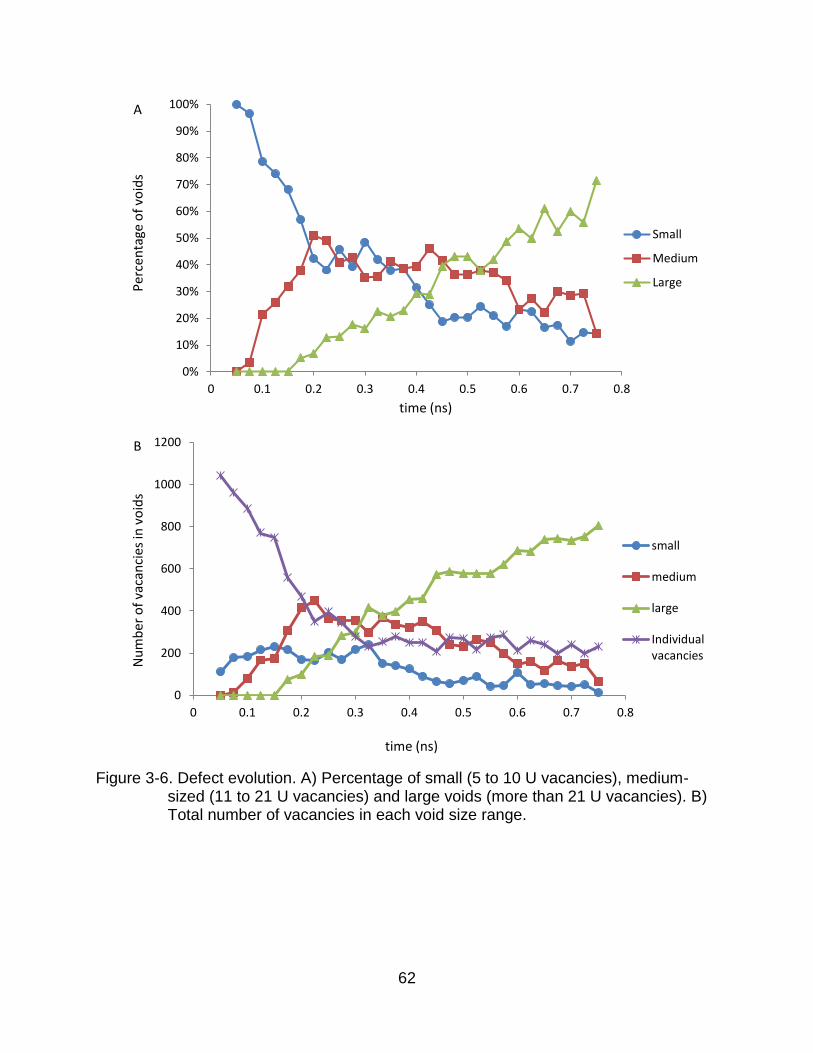
Figure 3-6 shows the evolution in void sizes for one typical simulation. The void
size is characterized in terms of the total number of connected vacant U sites. We
consider two vacancies to be connected if the distance between them is less than 4 Å,
which is close to the shortest distance between two U atoms in UO2. We define three
void sizes: small voids (5 to 10 U vacancies), medium-sized voids (11 to 21 U
vacancies), and large voids (more than 21 U vacancies). We find that these three voids
size scales can help us to easily visualize the system’s evolution. The structures of
voids with 2 to 4 vacancies change so rapidly that it is not meaningful to consider them
as well-defined entities.
At early times (t < 0.1 ns), the number of small voids increases very rapidly, as
isolated defects combine with each other, as indicated in Figure 3-6. Vacancies diffuse

51
through the structure; once two U vacancies meet (and the requisite number of rapidly
moving oxygen vacancies cluster with them) they combine to form a complex of defect
clusters, as Figure 3-7 illustrates. This takes place throughout the system, until most of
remaining isolated single Schottky trios are widely separated. We also find that a few U
atoms can jump to an interstitial site to generate a new vacancy, as Figure 3-8
illustrates. Thus the migration process of U not only involves interstitial migration but
also an interstitialcy mechanism.
After t = 0.3 ns, new voids continue to form in the system. At the same time,
medium-sized and large voids begin to form from small voids. Some voids grow by
absorbing free vacancies that are diffusing through the system (n < 5). Other voids grow
by void coalescence, as many previous studies in UO2 have discussed [73-75]. A
previous simulation study discussed how the void migration velocity depends on the
external driving force [21]. In the absence of an external driving force, however, the void
is almost immobile on the time scale of classical MD simulations. An illustrative example
is a small void cluster (10 vacancies) after 2 ns at 2800 K where, although there is
vacancy emission and re-absorption, no void migration takes place. However, there are
mechanisms for diffusion of U atoms: Figure 3-9 shows an example of U atoms
migrating along two void surfaces leading to void coalescence. Such diffusion has been
seen in previous simulation studies of U atoms along grain boundaries defects [28, 64].
Moreover, as discussed above, atoms between the voids surfaces are under a driving
force out of this region, leading to vacancy migration. Thus, it is can be expected that U
atoms migration will take place in such a system as this which contains a large number
of vacancies and voids.

52
During this annealing, voids can not only coalesce with other voids/vacancies but
can also emit vacancies, as illustrated in Figure 3-10. This thermal vacancy emission
behavior has been discussed previously [89]. Moreover, previous simulation studies in
UO2 [28, 64] also found that U atom self-diffusion could take place in defect regions at
high temperature on the MD time scale. Because the system in this study contains a
large number of defects, it is not surprising that U atom diffusion can lead to vacancy
emission. In addition, we find that void splitting usually takes place for small and/or
irregularly-shaped voids because such voids have more surface area and a higher
surface energy than spherical voids.
The specific atomic arrangement of the vacancies in the Schottky defect can
affect the defect energy. To take the example of a Schottky trio, the energy of a
compact arrangement is 10 eV lower than that of a more extended structure. Likewise,
vacancy emission from an irregularly shaped void may be easier than from a spherical
void. As is well known, the surface energy depends on the total area of surface. A
spherical shape void of the same volume has less surface area than an irregularly
shaped void. Thus, the irregularly-shaped void should be less stable. Figure 3-10 as an
example of a small, irregularly-shaped void emitting vacancies into the bulk. Some of
these vacancies can then migrate and absorb onto other voids. This is the well-known
Ostwald ripening process [75-77]. In Figure 3-11, atoms on the surface of the void on
the left migrate to the void on the right with corresponding vacancy migration in the
opposite direction. As a result, the left void grows while the right void shrinks.
As Figure 3-6 shows, voids continue to grow from small to medium to large. Over
the same time period, the number of isolated vacancies becomes fewer and fewer,

53
making the generation of new voids more and more difficult. Thus the number of small
voids decreases. The process is similar for medium-sized voids, though delayed in time:
coalescence of small voids and accretion lead to the generation of medium-sized voids;
at a later time these combine into large voids at which time the process of medium-size
void formation largely shuts down. Towards the end of the simulation the structure is
thus dominated by large, stable, immobile voids.
Void Behavior in Different Time Periods
Figure 3-6 provides information about the void growth process. In order to further
characterize void growth through coalescence/Ostwald ripening mechanisms, in Figure
3-12 we track void behavior during three different time periods (t = 0.15–0.25 ns, t =
0.4–0.5 ns and t = 0.6–0.7 ns). We focus on three defect behaviors: void growth, void
shrinkage, and void stability with no significant change in void size. If the volume
changes in small, medium and large voids are less than 20 %, 15 % and 10 %
respectively, we define them as stable. Vacancy emission is necessary for Ostwald
ripening, so we can use void dissolution as a measure of Ostwald ripening. It is difficult
to actually track the process because vacancy emission and adsorption can take place
in the same void at the same time. For instance, the void in Figure 3-13 loses a vacancy
on the top and gains another vacancy on the bottom. We therefore use void growth and
shrinkage to indicate the relative importance of void splitting and absorption.
Specifically, void growth indicates that there is more absorption than dissolution while
void shrinkage indicates the opposite.
In the early stage of evolution, shown in Figure 3-12, the system is very unstable
with void shrinkage and growth taking place frequently. Over 60 % of voids grow in this

54
period, because the system contains large numbers of mobile Schottky defects which
accrete to the voids. However, during this period only about 10 % of voids shrink. Thus,
this time period is characterized by more coalescence than Ostwald ripening.
In the middle period, as Figure 3-6 illustrates, the structure is dominated by
medium-sized and large voids. The system is now more mature, with more than 50 % of
voids not changing size significantly. There are two reasons for this. First, there are
fewer isolated vacancies; second, there are fewer irregularly shaped voids. During this
period, void growth still dominates void shrinkage. Hence coalescence is still more
frequent than Ostwald ripening. However, in this period the void growth process is
complex, with multiple active mechanisms. For instance, as Figure 3-14 illustrates,
initially atoms 1 and 2 migrate to the bottom void, increasing the size of the top void
growth and decreasing the size of the bottom void. At the same time, atom 3 migrates to
the left void and increases the size of the bottom void. After this Ostwald ripening
process, these two voids are closer to each other. Ultimately, the voids coalesce, as
Figure 3-14C indicates. Thus, the Ostwald ripening can also enable void coalescence.
After 0.7 ns, see Figure 3-13, the system is dominated by large voids and the
system is relatively static because most vacancies have already had enough time to
become part of a void. Ostwald ripening is infrequent and makes void growth slow.
Moreover, most of the voids are far away from each other, making further coalescence
rare.
To explore the effect of the initial configuration, we examined five systems with
different initial structure configuration. In the early stages an average of 65.4% of small
voids grow, with a standard deviation of 4.3 %, which indicates that all results are

55
similar; this is shown in Figure 3-12. However, the early stage average for large voids is
9.2 % with a standard deviation of 6.6 %. This large deviation results from the fact that
there are few large voids and different initial configurations. Moreover, it could be
expected that different initial configurations influence the detailed evolution. For
instance, a system in which the vacancies are close to each other can be expected to
grow more quickly than if the vacancies are far apart. However, we find that the
evolution of different configurations are qualitatively identical and statistically very
similar.
As Figure 3-6 and 3-13 indicate, vacancy and void evolution is a complex
process. During this process, both coalescence and Ostwald ripening take place
simultaneously and cooperatively, as indicated in Figure 3-15.
Summary
In this chapter, we have examined void nucleation and growth in UO2. Even
though the temperature considered in the simulations is higher than the operating
service conditions, the mechanisms of void nucleation and evolution should be similar at
all temperatures making the mechanisms predicted here broadly relevant.
Our results show that the void growth takes place through a combination of
coalescence and Ostwald ripening. During our simulations, coalescence is more
frequent than Ostwald ripening; this is consistent with the previous void growth map
study by Perryman and Goodhew in UO2 [75]. Furthermore, they also indicated that as
the distance between voids increases the rate of coalescence declines and the rate of
Ostwald ripening increases. In this study, however, the rate of coalescence is greater
than that of Ostwald ripening. This difference arises because of the small void
56
separation in our simulations. Although our simulations did not consider systems with
large void separation, they do provide mechanistic insights into the early stages of the
void nucleation process, which will be helpful in predicting defect evolution in nuclear
fuel.
In the next chapter we characterize the interactions of voids with grain
boundaries.

57
Figure 3-1. A void is nucleated by Schottky defect combination at 2800 K. In A – C, only uranium ions are shown, while in d only oxygen ions are shown.
(c) 2 ns (d) 2 ns
(b) 0.25 ns (a) 0 ns B
C
B
A
D
B

58
Figure 3-2. The relationship between void defect energy, Evoid, and the number of Schottky defects.
0
0.5
1
1.5
2
2.5
3
3.5
4
4.5
5
0 5 10 15 20 25 30 35 40
Number of Schottky defects in Void (N)
(eV)
59
Figure 3-3. Interaction between two voids as a function of the distance between void centers. The reference energy is two widely spaced voids. The inset shows the power law dependence for r=0.75 at distance larger than 2 nm.
-100
-90
-80
-70
-60
-50
-40
-30
-20
-10
0
10
0 0.4 0.8 1.2 1.6 2 2.4 2.8 3.2 3.6 4 4.4 4.8
distance (nm)
r=0.6
r=0.75
r=1.0
rela
tive
en
ergy
(eV
)
Voids contacted

60
Figure 3-4. Two pair of voids with different surface configurations and hence different electrostatic interactions. The large circle indicates the U atoms, and the small circles indicate O atoms.
A
B
61
Figure 3-5. Two voids defects in UO2. This color map illustrated the potential energy per U atom. U atoms between the two voids have higher potential energy than those far from the voids.
62
Figure 3-6. Defect evolution. A) Percentage of small (5 to 10 U vacancies), medium-sized (11 to 21 U vacancies) and large voids (more than 21 U vacancies). B) Total number of vacancies in each void size range.
0%
10%
20%
30%
40%
50%
60%
70%
80%
90%
100%
0 0.1 0.2 0.3 0.4 0.5 0.6 0.7 0.8
Small
Medium
Large
time (ns)
Per
cen
tage
of
void
s
A
0
200
400
600
800
1000
1200
0 0.1 0.2 0.3 0.4 0.5 0.6 0.7 0.8
small
medium
large
Individualvacancies
time (ns)
Nu
mb
er o
f va
can
cies
in v
oid
s
B

63
Figure 3-7. Vacancies combine, leading to the nucleation of small voids in the structure. A) At the beginning of the simulation the system is dominated by isolated vacancies. B) After 0.3ns, a small and irregular void has formed. There are 10 U vacancies in this small void.
A
C
B
B
B
C
B
B

64
Figure 3-8. A U interstitial in the UO2. The numbers indicate the specific atom in the structure to indicate atoms location. Atom 4 moves from an FCC site into an interstitial site.
A
C
B
B
B
C
B
B

65
Figure 3-9. Snapshots from the MD simulations that illustrate void coalescence. The arrows indicate the direction of atoms movement. After 0.1 ns (from t = 0.5 ns to t = 0.6 ns) of thermal annealing, atoms between two voids move along the void surface causing two isolated voids to coalesce.
A
C
B
B
B
C
B
B

66
Figure 3-10. The example of void dissolution. A) A void with an irregular shape. B) After a short period, this void dissolves.
A
C
B
B
B
C
B
B

67
Figure 3-11. A void grows through Ostwald ripening. Atoms on the left void surface migrate to the void on the right (see, for example, atom number 1), which make the vacancies migrate from the right void to the left void.
A
C
B
B
B
C
B
B

68
Figure 3-12. The behavior of different voids at three time periods of time = 0.15–0.25, 0.4–0.5, and 0.7–0.8 ns. The error bar shows the standard deviations.
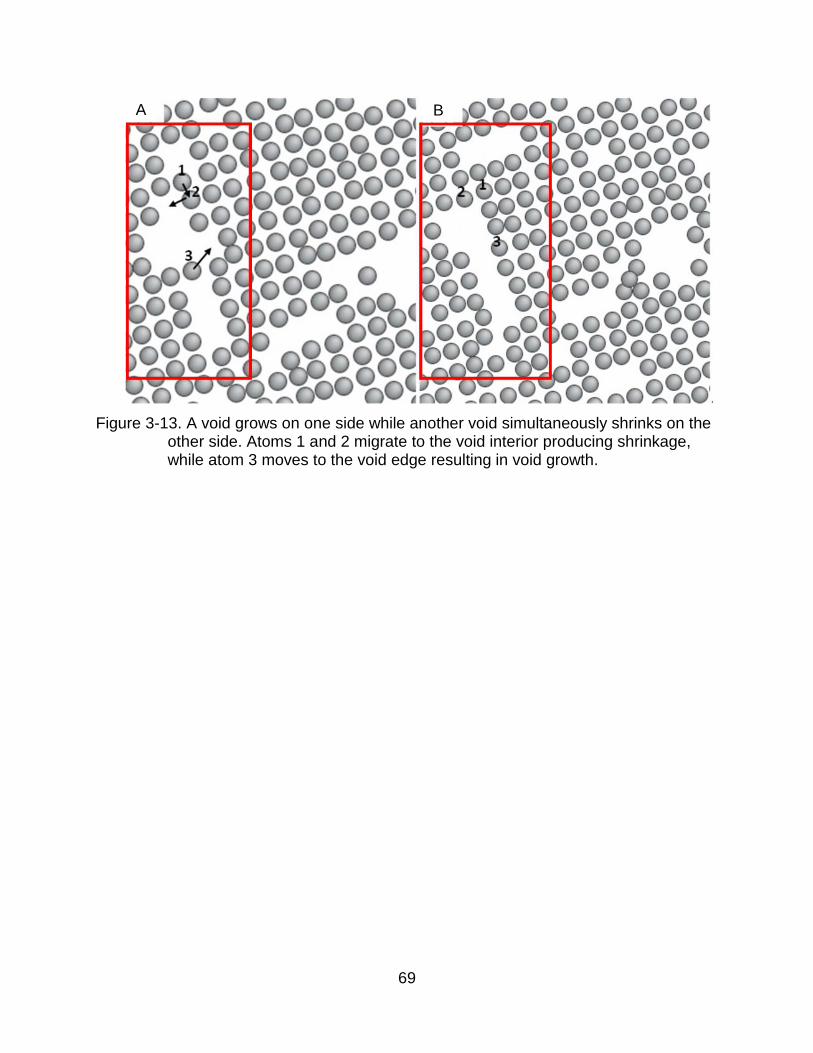
69
Figure 3-13. A void grows on one side while another void simultaneously shrinks on the other side. Atoms 1 and 2 migrate to the void interior producing shrinkage, while atom 3 moves to the void edge resulting in void growth.
A
C
B
B
B
C
B
B

70
Figure 3-14.Void growth through Ostwald ripening (A – B), and coalescence (B – C).
A
C
B
B
B
C
B
B
C
C
B
B
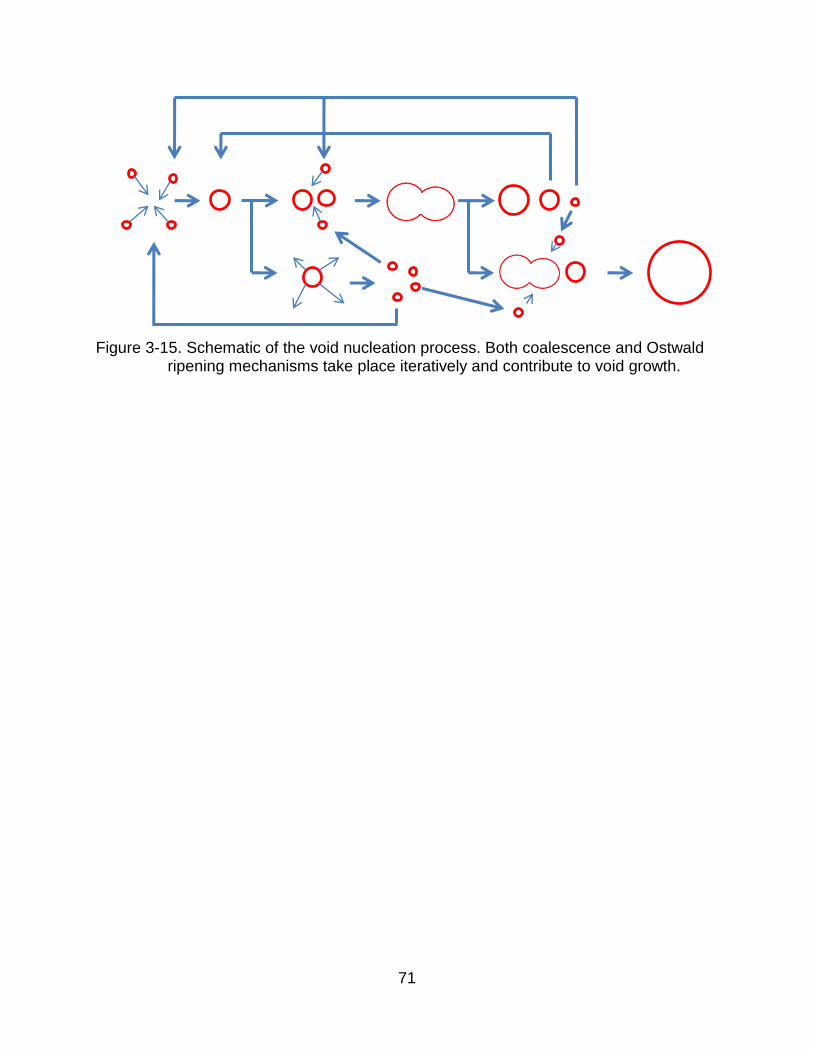
71
Figure 3-15. Schematic of the void nucleation process. Both coalescence and Ostwald ripening mechanisms take place iteratively and contribute to void growth.

This chapter is based on T. W. Chiang, A. Chernatynskiy, S. B. Sinnott, S. R. Phillpot, “Interaction between voids and grain boundaries in UO2 by molecular-dynamics simulation”, Journal of Nuclear Materials, 448, 53-61 (2014).
73
CHAPTER 4 INTERACTION BETWEEN VOIDS AND GRAIN BOUNDARIES IN UO2
During the burn-up process the concentration of defects in the crystal lattice
increases dramatically [6, 8, 66, 90]. Interactions between different types of defects are
also crucial to their overall microstructural evolution. Defect interactions can be
complex; for instance, an experimental study in UO2 [91] indicated that if a void is small
and close enough to a GB, vacancies emitted from the void can be trapped by the GB,
leading to void dissolution. Additional studies have focused on interactions between
defects, including dislocations with GBs [92], and point defect with GBs [93]. There have
also been simulation studies of the interaction of Xe gas with GBs [31, 32]. However,
the evolution of UO2 microstructure during void-GB interactions and the associated
mechanisms have not been elucidated. Here, we therefore focus on examining the
interaction between GBs and voids, because it is known experimentally [90] that voids
segregate to GB boundaries. In particular, if a sufficient amount of free volume from a
void dissolves into a GB, the GB structure will change [24], with concomitant changes in
materials properties.
Migration of Voids and Grain Boundaries
For the GB-void interaction to take place, the migration of one or both defects is
necessary. Experiments indicate that void migration in UO2 can be driven at high
temperature by a temperature gradient and the associated thermoelastic stress [29]. In
addition, simulations on various materials have shown that external stress [43] or

73
thermal fluctuations [41] can lead to GB migration; experiments on ceramic materials
such as MgO and Al2O3 show that GB migration can be influenced by voids [44]. In
particular, a void can impose a force on the GB, thereby influencing its motion.
Furthermore, the atomistic mechanisms responsible for the migration of voids and GBs
have also been examined; simulations by Desai et al. indicated that void migration in
UO2 involves ion diffusion along the void surface [21]. Simulations by Rickman et al.
[40] and Schönfelder et al. [43] predicted that GB migration in an fcc metal involves GB
disordering followed by reordering at a different position.
In this chapter, all simulations are performed for the (310) Σ5 =
36.87°symmetric tilt GB in UO2, which not only has been used in atomic-scale
simulations in a number of other contexts [47, 48], but is also one of the most widely
observed Coincident Site Lattice (CSL) GBs in UO2 [48]. The GB energy is calculated
to be 1.65 J/m2 which is similar to the literature value of 1.58 J/m2 for the same potential
[10]. The small difference can be attributed to the different simulation cells. In this study
we have two voids in two grains which are close to grain boundaries. To make the initial
conditions on these two GB-void complexes as similar as possible, the structures are
highly symmetric. Thus, it is different to the structure in Ref [48], in which the structure
is asymmetric.
Throughout this study, a 3D periodic bicrystal structure is used; the simulation
cell thus contains two crystallographically identical grain boundaries. The simulation cell
has dimensions of approximately 4.4 x 9.7 x 47.7 nm at 0 K. A spherical void is
introduced into each grain by removing stoichiometric charge-neutral UO2 units in the
grain interiors, as illustrated in Figure 4-1. Specifically, 68 stoichiometric units are

74
removed to form each void, with a resulting void diameter of ~1.8 nm. Simulations on
structures with two different initial separations between the void’s leading edge and the
GB, z = 0.9 nm and z = 1.2 nm which are equivalent to 9 and 11 (310) planes, are
analyzed. In a real material, at any instant most voids are far from GBs; however, as the
voids and GBs move, numerous GB-void interactions can be expected to take place; it
is this interaction that we focus on. It is thus not of great importance that the number
density of voids in our system (1024/m3) is close to ten times larger than the
experimental density [8], nor that we initiate our simulations with the voids and GBs
close to each other.
The two simulation conditions used differ in the temperature and the initial
separation of the GB from the void, z. For T = 2800 K the GB-void separation is initially
z = 0.9 nm, while, for T = 3100 K, z = 1.2 nm. The initial structures are heated up
gradually; after reaching zero stress at the desired temperature, the simulation box
dimensions and volume are fixed for the rest of the simulation. The total simulation time
is 1.25 ns, which is sufficient to enable significant GB-void interaction. We find that 2800
K is the lowest temperature at which there are significant interactions on the ns
timescale; all processes are accelerated at 3100 K, allowing us to place the void a
greater distance from the GB.
Thermal Fluctuation of GB
It is important to establish that GB-void interactions can be observed over the
time scale available to the MD simulations. Because these simulations are performed in
the temperature regime in which the oxygen sub-lattice has melted, the evolution of the

75
system is essentially determined by the much lower mobility of the uranium ions [21].
Therefore, to characterize the evolution of the defect structure, in all the following
structural figures only the U atoms are displayed, unless specifically noted.
In order to make the GB and void interact, one defect must migrate to another.
As we know, the GBs can move through the thermal fluctuation previously seen in
simulations of metals [40, 94]. To better understand this fluctuation, we perform a
simulation on a bicrystal system without voids; as Figure 4-2A and 4-2B indicate, the
GB fluctuates. As previous simulation studies in fcc metals [40, 94] showed, GB motion
involves vacancy migration. Similar processes are predicted in UO2. A vacancy
(indicated by the red circle) moves from the right grain in Figure 4-2A to the left grain in
Figure 4-2B by the movement of a uranium atom in the opposite direction. The net
effect of this small amount of atomic motion, which does not involve atoms crossing any
substantial energy barriers, is an effective local fluctuation in the position of a region of
the GB. Since the GB structure includes a number of regions of low density, these atom
movements in the GB profile take place at several different places along the boundary.
As Figure 4-2A and 4-2b demonstrate, these fluctuations in the position of the GB are
the result of numerous individual atom/vacancy jump processes that lead to the
predicted complex, rapidly evolving, non-planar GB structure. These fluctuations are
transient in nature because of the high temperature and the absence of a driving force
for GB migration.
In order to further characterize these fluctuations, we record the position of the
center of the GB along the z direction as a function of time in Figure4-1. Even though
there is some ambiguity as to how exactly to assign the GB position, and only a single

76
point is tracked, Figure 4-3 clearly demonstrates that there is no net GB migration and
that the magnitude of the fluctuations of the GB increases with the simulation
temperature. To quantify this, the root-mean-square fluctuations in Figure 4-3, are 0.12
nm and 0.31 nm at 2800 K and 3100 K, respectively.
Atomic mobility in the GB region determines both the ability of the GB position to
fluctuate and the amplitude of the fluctuations. To characterize this atomic mobility, we
calculate the mean squared displacements (MSD) in three directions (MSDx, MSDy,
MSDz) using the standard equation:
MSDx =1
NΣi=1
N (xi(t) − xi(0))2 (4-1)
and similarly for MSDy and MSDz. An atom is defined as mobile only if its net displacement
is more than 0.5a0 during the lifetime of the simulation. This selects out the atoms in the
GB regions; bulk U atoms rarely move such large distances. In the GB region, vacancies
do not diffuse equally in the three spatial directions. Specifically, diffusion is fastest along
the tilt axis (the x-direction in Figure 4-1), with a diffusion constant of 4.23 10-11 m2s-1 at
T=2800 K and an activation energy of Q=2.12 eV. The diffusion constant in the y-direction,
the non-tilt axis within the GB, is 2.39 10-11m2s-1 and activation energy, Q=2.65 eV, which
is about 60% of the value along the tilt axis. Finally, the diffusion constant into and out of
the GB is lower yet, only 1.77 10-11m2s-1 and activation energy, Q=3.31 eV. Together,
these values indicate that the ions diffuse most rapidly along the tilt axis, which is
consistent with fast pipe diffusion in ceramic materials observed both from experiment [95]
and simulation [96].To demonstrate the relationship between temperature and atom
diffusivity, we calculate the spatially-averaged diffusion constant. Figure 4-4 shows the
MSD result for mobile U atoms in the GB region from 2700 K to 3100 K, with the inset

77
illustrating an Arrhenius plot of the diffusion coefficient. If only mobile atoms are considered
then D=2.9x10⁻¹¹ m2s-1at 2800 K and the activation energy is Q=2.48 eV. These values
differ from those computed by Desai et al. [28] using the same potential (D = 1.51 x 10⁻¹¹
m2s-1 at 2800 K, Q=3.50 eV) because they included not only mobile atoms (atoms along
the GB), but also immobile atoms (atoms in the grain interiors) in their MSD calculations.
We also found that there are more ions involved in the faster GB diffusion as the
temperature increases; the width of GB region thus increases also. This is consistent with
the result from the study by Vincent-Aublant et al. [45] which defined the GB region by
potential energy.
GB Migration in UO2
Having identified the fluctuations in the GB structure in Figure4-2 as intrinsic GB
behavior, we now examine the system with a GB/void defect complex. Figure 4-5 shows
snapshots of the evolution at 2800 K. This and subsequent figures illustrate one (100)
plane of uranium atoms through the equator of the spherical void. The initial structure is
provided in Figure 4-5A. After 0.1 ns, Figure 4-5B, the GB is no longer straight; rather a
small region of the GB has moved in the direction indicated by the arrow. After 0.2 ns, in
Figure 4-5C, this part of the GB has now moved in the opposite direction; such GB
fluctuations are frequent, as discussed above. In Figure 4-5D, a region of GB directly
facing the void has now moved towards the void, and the GB and void are beginning to
overlap. This GB migration of 0.9 nm is much larger than the maximum fluctuation
distance that we observed in Figure 4-5C at 2800 K (0.3 nm) and thus cannot be
attributed solely to thermal fluctuations. There thus must be a driving force from the void
that leads to the GB migration. We analyze the further evolution of this structure below.

78
In order to analyze the migration process by which the GB approaches the void, we
record the movement of two distinct parts of the GB. We define the part of the GB region
that directly faces the void as the GB ‘center’, and the part of the GB that is furthest away
from the void (at the top and bottom of the periodic simulation cell) as the GB ‘edge’. Of
course, this definition is not unique since if a larger simulation cell were used, the GB edge
would be even further from the void; nevertheless, we will find this analysis useful. As
Figure 4-6 illustrates, the locations of the GB center and GB edge fluctuate randomly when
the GB is some distance away from the void: (t = 0 - 0.25 ns for 2800 K and t = 0 - 0.9 ns
for 3100 K). Once, the distance between the GB center and void is less than ~0.6 nm (at t
= 0.25 ns and t = 0.9 ns, respectively), the GB center accelerates rapidly towards the void
and becomes pinned, as indicated in Figure 4-5D. After this pinning, the GB edge
continues to move steadily towards the void until the GB straightens and passes through
the center of the void, as shown in Figure 4-5E and F. This process is nearly the same at
both temperatures, with the only difference caused by the higher temperature allowing
larger amplitude GB fluctuations. As a result, the GB can be placed further away from the
void (1.2 nm vs. 0.9 nm) at the higher temperature, and still reach the void during the
lifetime (1.25 ns) of the simulation.
While at 2800 K the GB is pinned to the void, at 3100 K the void dissolves into
the GB, as illustrated in Figure 4-7B. Figure 4-7c shows that the void totally dissolves
into the GB, and that the GB becomes curved, which is attributed to difference in the
migration speeds of the GB edge and GB center, as Figure 4-6 showed. The dissolution
of the void removes the pinning force on the GB; as a result the GB straightens; this
time however, the center of the GB moves rather than the edge of the GB. The final
79
structure is provided in Figure 4-7D. To verify that this dissolution is a thermal process,
we further heat the 2800 K system after the end of the simulation (Figure 4-5F) to 3100
K. Again, the void dissolves into the GB; the dissolution mechanism is discussed below.
Pinning of the GB to the Void
Interestingly, in none of our simulations at either temperature does the GB move
through the void. Once the GB interacts with the void at 2800 K, as Figure 4-5D
indicated, the GB is pinned. In order to analyze this pinning behavior we perform
molecular statics simulations on structures with different GB-void separations. Such
static simulations allow the bonding between oxygen and uranium atoms to be
examined in detail, which is difficult to do at high temperature because of the disorder
from the melted oxygen sublattice. In all of these structures, the system dimensions,
void radius, and total number of atoms removed are the same as in the 2800 K MD
simulations. Each structure is quenched at T = 0 K for 200,000 steps; the final
structures are analyzed in terms of the difference in energy with respect to the widely
separated void and GB, and in the miscoordination of the U atoms with respect to their
O neighbors. In the perfect crystal each U atom has 8 O neighbors and the U–O bond
length is 0.24nm [49]; we thus define a U–O bond as being present if a U–O separation
is less than 0.3 nm (i.e., 1.25 times the equilibrium bond length).
Figure 4-8 illustrates the change in the number of miscoordinated atoms and the
change in the defect energy as a function of the GB-void separation. As expected, we
find that structures with fewer miscoordinated atoms have lower total energies. These
static calculations directly show that (a) the energy of the system is lowest when the GB
is centered at the void; (b) the energy only decreases significantly once z < 0.5–0.6

80
nm; and (c) this energy minimum corresponds to a structure in which there are the least
number of miscoordinated atoms. Figure 4-8A, 4-8B, and 4-8C illustrates the location of
the miscoordinated U atoms in the defect region. It is clear that as the GB approaches
the void (moving from Figure 4-8C to 4-8A) the total number of miscoordinated U atoms
decreases. This decrease in energy has two contributions. First, as the distance
between the GB and the void decreases, the U atoms at the edge of the void facing the
GB appear to change their coordination from a mix of 5-fold, 6-fold and 7-fold
coordinated to mostly 7-fold coordinated. This is illustrated by the mostly purple spheres
(U atoms with coordination of seven) in the selected region in Figure 4-8b. Second, after
the void is pinned at the GB, a portion of the GB is effectively eliminated thus reducing
the number of the miscoordinated U atoms, as indicated in Figure 4-8a. This decrease
in turn stabilizes the structure and pins the void.
After the GB is pinned to the void, as in Figure 4-5D, there is a driving force for
the edge of the GB to continue to migrate to reduce the GB area, thereby decreasing its
energy. Thus, after the center of the GB pins at the void, the unpinned GB edges
continue to move until they catch up with the GB center, as was the case in Figure 4-5F.
This process involves the atoms/vacancies at the GB edge continuing to jump
randomly, leading to fluctuations in the location of the GB, but biased in the direction
that ultimately leads to the straightening of the GB. As we continue to anneal the
structure at 2800 K, we find that the void shape continues to change due to surface
diffusion, as seen in a previous simulation study [21]. Finally the structure becomes
more symmetric, as illustrated in Figure 4-5F.

81
Evolution of the GB-Void Complex
As mentioned above, we find that once the GB reaches the void, the system
behavior at 2800 K and 3100 K is quite different. At 2800 K, even though the shape of
the void changes continuously, the void still maintains its integrity throughout the
simulation. By contrast, at 3100 K the void fully dissolves into the GB. Here, we discuss
the difference in GB-void complex configuration evolution between these two behaviors.
Figure 4-9 indicates the void pinning process at 2800 K. The GB approaches the
void from the right side in Figure 4-9A. Figure 4-9B is an intermediate structure in which
surface diffusion within the void leads to further embedding of the void into the GB. In
Figure 4-9C, the void now essentially straddles the GB, with the two regions on either
side corresponding to perfect crystal. The net effect is that the structure of the void has
not changed much, but a large area of the GB has been eliminated, thereby reducing
the energy of the system considerably. This void-GB pinning structure is consistent with
observations in a number of experimental studies [8, 19, 90, 97].
At 3100 K the void dissolves into the GB. To characterize the defect energetics
associated with this process, we build two systems and use lattice statics calculations to
compare their potential energies at 0 K. The first system has a void pinned at the GB,
as in Figure 4-5F; the second has the same GB, but with the vacancies randomly
distributed within the GB region. The total number of vacancies in these two systems is
the same as in the GB-void interaction simulations. To ensure that the result is not
dependent on the particular configuration of the vacancies, we built several realizations
of the random distribution of vacancies in the GB. These systems were then quenched
until the deviation of force and energy converged (smaller than 10-3eV/ Å and 10-5 eV,
respectively). We find that systems in which the vacancies are spread through the GB

82
have a lower energy than the system in which the void is pinned at the GB. It thus
appears that the GB-void complex in our system is only kinetically rather than
thermodynamically stable. This energy analysis is consistent with the experimental
study by Vaidya [36], which pointed out that void dissolution should be favorable
because it could completely eliminate the void surface, and hence surface energy. Figs.
4-10A to 4-10C provide the process of void dissolution at 3100 K, by which the
vacancies in the void redistribute along the GB.
To further characterize the void dissolution process, we take structures similar to
Figure 4-5F and anneal them at temperatures from 2800 K to 3100 K for 2.5 ns. Figure
4-11A to 4-11c illustrate the process of void dissolution at 2800 K, 2900 K and 3000 K.
In Figure 4-11Ato 4-11c, the void cannot easily dissolve into the GB at 2800 K. After
1.25 ns of annealing the void becomes smaller, but it still remains in the GB region. At
2900 K, the void dissolves into the GB after 1.5 ns, as indicated in Figure 4-11F. The
dissolution behavior is similar to that which occurs at 2800 K, but is accelerated. In
Figure 4-11G the vacancies in the GB-void region jump rapidly at 3000 K. After 0.25 ns,
Figure 4-11I, the void completely dissolves. To further verify the void dissolution
mechanisms, we quantify the void dissolution process at these four temperatures in
Figure 4-12 by recording the time dependence of the void size, defined in terms of the
number of connected vacant U sites. As expected, the higher temperature leads to
faster dynamics and correspondingly faster void dissolution. Moreover, the lines in
Figure 4-12 curve slightly downward, indicating an acceleration of the dissolution rate as
the void shrinks. As shown in Figure 4-11, as the void shrinks, more and more of the
surface is in the GB core. Thus the acceleration of the dissolution rate is likely a result

83
of the faster atomic diffusion in the GB core than in the bulk. As a result, the void
dissolution rate depends on both temperature and structure.
Summary
In this chapter, we have characterized the interaction of a void with a GB in UO2
structure by MD simulation. Our energy analysis by molecular statics simulation verified
that this interaction is consistent with an energetically driven process, the timescale for
which is determined by the available thermal energy. We found that the motion of a GB
to and the pinning by the void is consistent with decreases in the number of
miscoordinated atoms and the defect energy. It is also consistent with experimental
studies by Parthasarathy et al. [34, 35] which suggested that in ceramic materials,
impurities can drive GB migration leading to recrystallization. Specifically, they indicated
that the energy of the system decreases as the GB entered the impurity region,
providing a driving force in a single direction. This is similar to our prediction that the GB
will move towards the void to lower the system energy. After pinning, the GB edge
continuously moved toward the void, thereby causing it to straighten. The behavior of
this defect complex is also consistent with numerous experimental studies that showed
that GBs act as defect sinks that absorb free volume [8, 98, 99]. While our MD
simulations were performed at very high temperatures, molecular statics simulations
indicate that small voids in the grain boundaries are thermodynamically unstable.
Moreover, we predict that void dissolution takes place through vacancy migration along
the GB. Since vacancy diffusion does take place at lower temperatures, albeit much
more slowly, we expect their dissolution at lower temperature to occur as well, although
on a longer time-scale. In the very different context of austenitic stainless-steel, features

84
of the pore-GB interactions were also observed experimentally [36] under ion irradiation.
In that work, voids were implicated in assisting GB migration by exactly the same
mechanisms: namely, a migrating GB dissolves a void it encounters along the way and
leaves behind a void-denuded zone. Thus, there are more voids in front of the GB than
behind it, providing a continuous driving force for GB migration. Parthasarathy et al. [34,
35] further suggested that the decrease in surface energy could be one of the driving
forces that assist GB migration, which is consistent with our findings. Since a void-
assisted GB migration mechanism is predicted in our MD simulations, this scenario
might be accessible in UO2, and it might influence the recrystallization process in
polycrystalline UO2. Void dissolution has been observed experimentally for several
different materials [36, 91, 100]. However, there are also studies that showed that voids
can pin at a GB rather than dissolve into it. A review by White and Tucker [24]
concludes that the shape of the void/bubble and GB complex undergoes continuous
evolution. It also showed that the total free volume inside the GB influences the GB-void
complex structure. These conclusions are consistent with our predictions for UO2.

85
Figure 4-1. Schematic of the simulated system which includes two (310) Σ5 =36.87° tilt
GBs and two spherical voids. The initial distance between GB and void is z.
The initial z used in this study are 0.9 nm and 1.2 nm, corresponding to 9 and 11 (310) planes.
∆z
Grain boundary
Void
z
x
y Grain boundary center
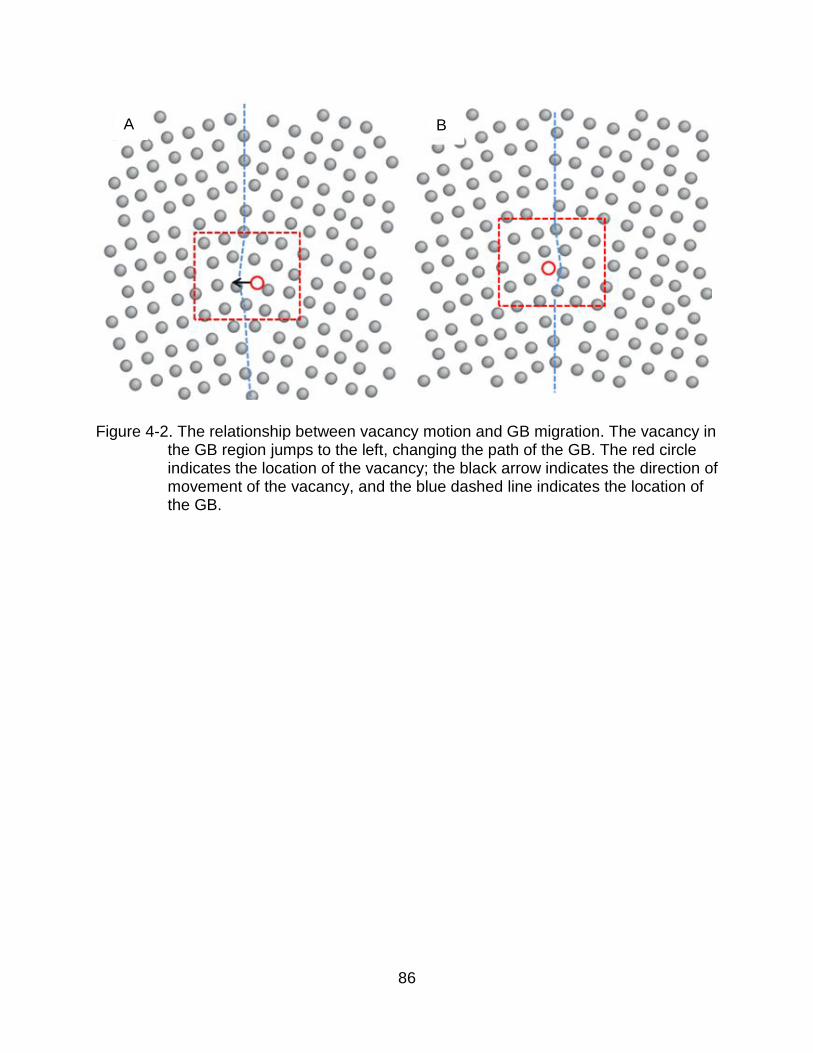
86
Figure 4-2. The relationship between vacancy motion and GB migration. The vacancy in the GB region jumps to the left, changing the path of the GB. The red circle indicates the location of the vacancy; the black arrow indicates the direction of movement of the vacancy, and the blue dashed line indicates the location of the GB.
A
C
B
B
B
C
B
B
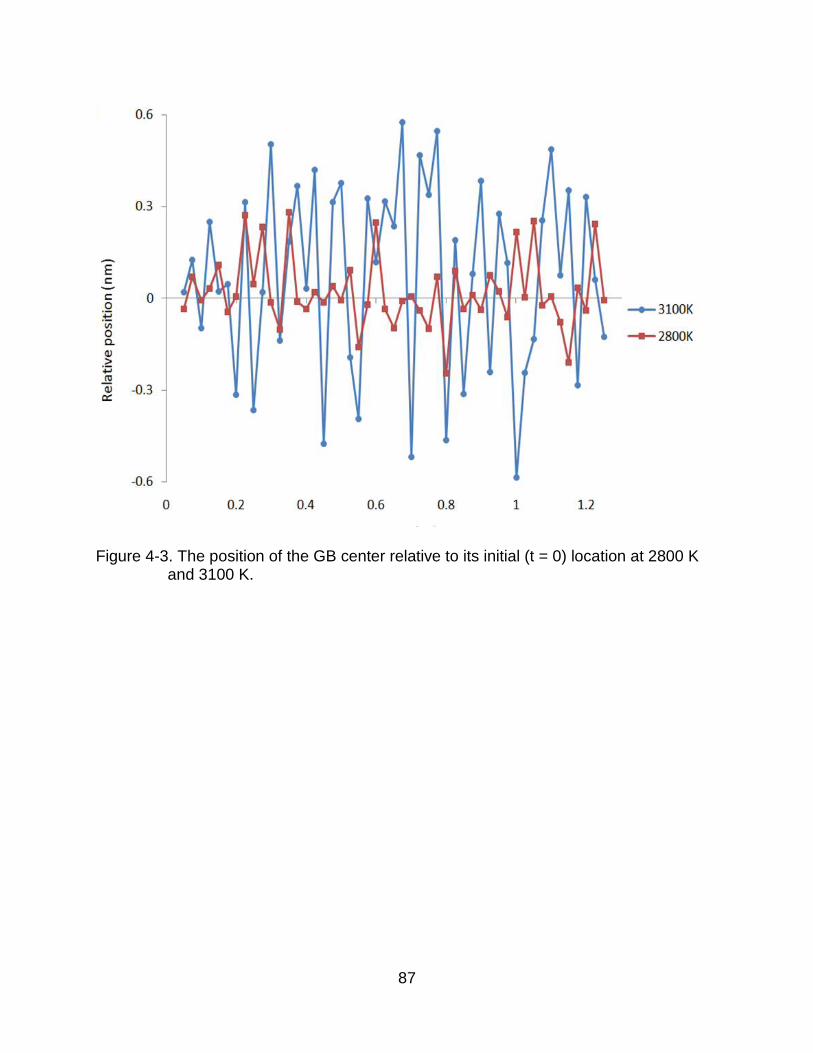
87
Figure 4-3. The position of the GB center relative to its initial (t = 0) location at 2800 K and 3100 K.

88
Figure 4-4. MSD of uranium atoms in the GB region at various temperatures. Arrhenius plot (inset) shows the self-diffusion of uranium atoms in the GB region.
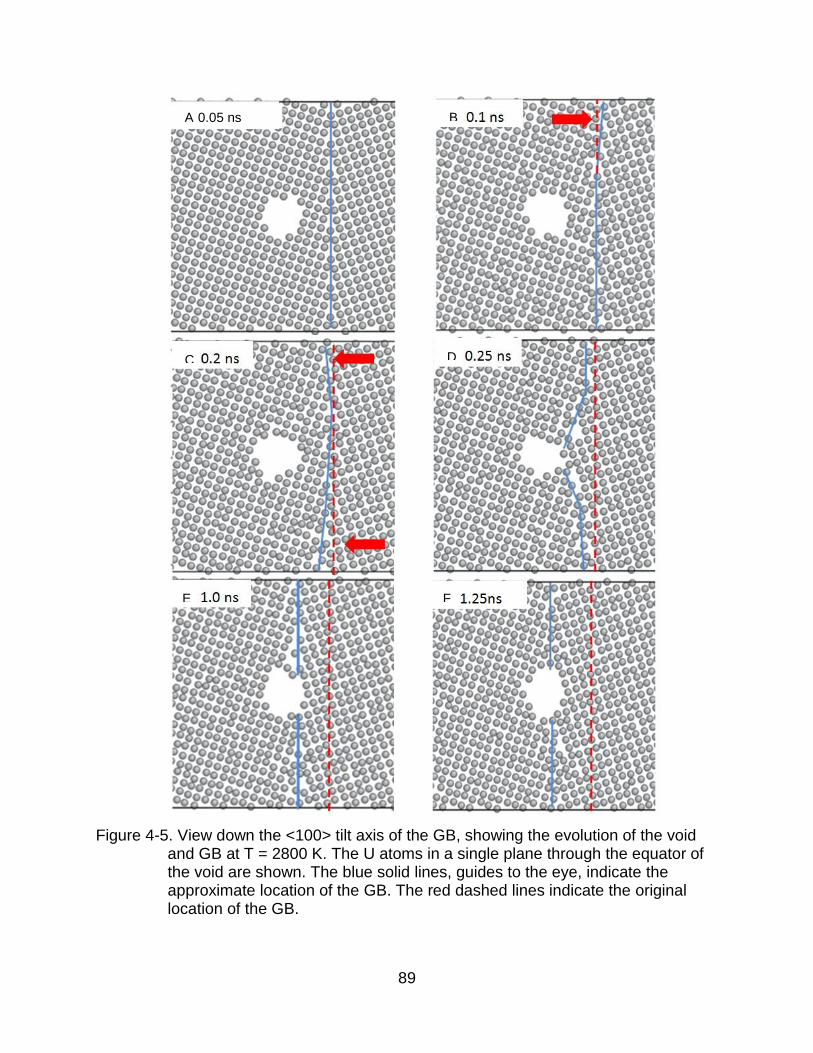
89
Figure 4-5. View down the <100> tilt axis of the GB, showing the evolution of the void and GB at T = 2800 K. The U atoms in a single plane through the equator of the void are shown. The blue solid lines, guides to the eye, indicate the approximate location of the GB. The red dashed lines indicate the original location of the GB.
B
C
B
B
A 0.05 ns
C
C
B
B
D
C
B
B
E
C
C
B
B
C
B
B
F
C
C
B
B
C
B
B
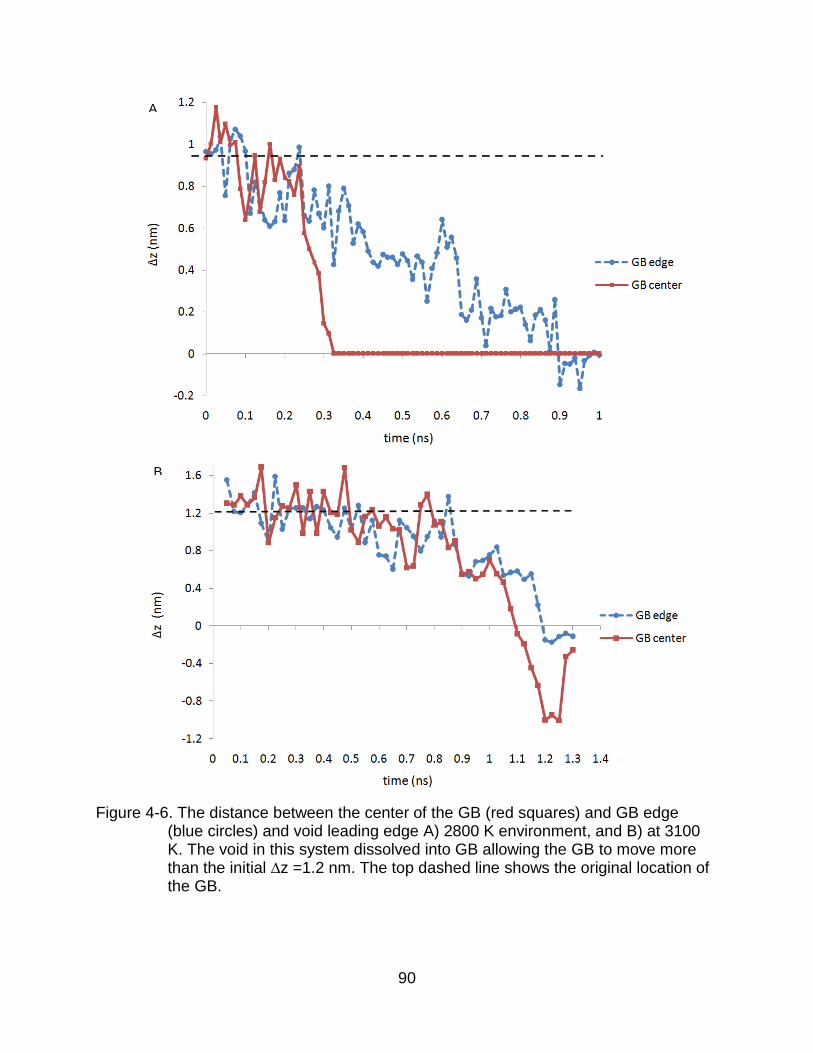
90
Figure 4-6. The distance between the center of the GB (red squares) and GB edge (blue circles) and void leading edge A) 2800 K environment, and B) at 3100 K. The void in this system dissolved into GB allowing the GB to move more than the initial ∆z =1.2 nm. The top dashed line shows the original location of the GB.
B
C
C
B
B
C
B
B
A
C
C
B
B
C
B
B

91
Figure 4-7. The evolution of the void and GB at T = 3100 K. The blue line indicates the approximate location of the GB, and the red arrow indicates the GB movement direction. The red dashed line indicates the original location of the GB.
C
C
C
B
B
C
B
B
D
C
C
B
B
C
B
B
A
C
C
B
B
C
B
B
B
C
C
B
B
C
B
B

92
Figure 4-8. Coordination of U atoms in the defect region. The maximum coordination numbers in these three structures is 8 as it is in the bulk structure. For better visualization, only the U atoms with fewer than 8 neighbors are rendered. The colors have the following meaning: red = 5, brown= 6, purple =7. Change in defect energy and change in number of broken bonds as the GB approaches the void, both relative to the value when the GB is at the center of the void. The structure in Figure 4-8A is the reference point for energy and number of broken bonds, since it has the lowest energy. The arrow indicates the relationship among structure, defect energy and number of broken bonds.
A
C C
C
B
B
C
B
B
C
C
B
B
C
B
B
B
C
C
B
B
C
B
B
C
C
C
B
B
C
B
B
D
C
C
B
B
C
B
B

93
Figure 4-9. Evolution of GB and void complex at 2800 K.
A
C
C
B
B
C
B
B
B
C
C
B
B
C
B
B
C
C
C
B
B
C
B
B

94
Figure 4-10. Snapshots the void dissolution into the GB through vacancy diffusion at 3100 K.

95
Figure 4-11. The void dissolution process as a function of temperature. The temperature is 2800 K A, B and C, 2900 K D, E and F, and 3000 K G, H and I.
A
C
C
B
B
C
B
B
B
C
C
B
B
C
B
B
C
C
C
B
B
C
B
B
D
C
C
B
B
C
B
B
E
C
C
B
B
C
B
B
F
C
C
B
B
C
B
B
G
C
C
B
B
C
B
B
H
C
C
B
B
C
B
B
I
C
C
B
B
C
B
B

96
Figure 4-12. Number of vacancies in the void as a function of time at 4 different temperatures.
0
10
20
30
40
50
60
70
80
0 0.5 1 1.5 2 2.5
3100K
3000K
2900K
2800K
Nu
mb
ero
f U
vac
anci
es in
th
e vo
id
time (ns)

97
CHAPTER 5 KINETIC EVOLUTION OF VOID NUCLEATION ON GRAIN BOUNDARIES
As discussed in Chapter 1, void nucleation and interconnection of voids on grain
boundaries (GBs) are important in UO2 since the interconnected voids can constitute a
path to release the fission gas. However, the kinetic evolution of void nucleation on GBs
is not fully understood. Here we use the molecular dynamics simulations to analyze the
atomic level void processes involved in nucleation of voids on GBs.
Defect Complexity in Polycrystalline UO2
During the burn-up process, the high working temperature provides vacancies
the thermal energy to migrate through the pellet. Through the random walk process
vacancies can interact, then combine to form larger scale voids [8, 88]. During the
vacancy and void diffusion process, a GB has the ability to trap the free volume
(vacancy and void) as a defect sink [101]. After a significant amount of free volume
accumulates at the GB, a void-GB complex forms. As these voids grow, they can
interact with each other and evolve to form connected paths along the GB [99], through
which fission gases can be released [102]. Thus, the kinetic evolution of these defect
complexes directly influences gas release and has a significant impact on fuel
performance. There are numerous studies on analyzing the complex of a void/bubble
with a GB. For instance, a review from White et al. discussed the irradiation condition
and temperature that could directly influence the gas release network formation speed
[103]. Veshchunov and Tarasov found that the temperature could directly dominate the
time needed for the voids to link up to form a void network on the GB [104]. Moreover,
many studies have focused on modeling in terms of void density, volume and others

98
variable in GB to predict the gas release behavior [105, 106]. In those studies, they
elucidated the relationship between gas releases/porosity and various burnups and
temperatures. There have also been studies which provide information on void evolution
and the development of an interconnected path for fission gases [24, 102]. These
studies indicated that the shape of void-GB is repeated as it grows from isolated voids
to interconnected path to isolated voids. Theory studies on GB nucleation also
discussed the energy of GB nucleation [22] and GB nucleation rates [23]. However,
defect interactions are fast and the length scale associated with defects is very small
making them difficult to investigate experimentally. Hence, the kinetic evolution of
vacancies, voids and void-GB complexes are still not well understood at the atomic
level. Previous chapters focused on the void nucleation in bulk and GB-void interaction.
This chapter focuses on the void nucleation on GBs and their structural evolution as
they accumulate more and more vacancies/voids.
Specifically, a polycrystalline UO2 system is introduced. There are 6 grains in this
structure and each grain is essentially of the same size. 3D boundary conditions are
used throughout this study and the box size of the polycrystalline system structure is 55
nm x 300 nm x 510 nm at 0 K, see Figure 5-1.There are a total of 611,000 atoms in the
supercell. The simulation temperature is 2800 K, which is approximately 0.7 - 0.8 Tm for
the Basak potential. As discussed in Chapters 3 and 4, the evolution of the system at
this high temperature should be qualitatively similar to that at lower operating
temperatures, [21, 28] except that ion diffusion will be faster.

99
To reach the desired temperature, the structure is gradually heated up to the working
temperature at constant pressure (NPT ensemble). After the heating process, the
dimensions and volume of the simulation cell are fixed for the subsequent evolution of the
system, as was used in Chapters 3 and 4.
As discussed in Chapter 3, the Schottky defect energy is 5.4 eV; thus at
operating temperature the equilibrium concentration of Schottky defects in this system
can be expected to be 1.2 x10⁻⁵. Thus, about seven thermally formed Schottky defects
can be expected to exist in this structure; such a low concentration cannot significantly
influence the outcome of the simulation. Schottky defects are then introduced by
removing an appropriate number of ions, so as to preserve the stoichiometry. We find
that a density of 10% vacancies allows void nucleation to take place in our MD system.
Figure 5-1 shows the initial structure in which vacancies are introduced in a
polycrystalline UO2 system. After introducing the Schottky defects, the system is
annealed at 2800 K for 2 ns.
Overall Defect Evolution
To enable void nucleation on the GBs it important for there to be vacancy
diffusion to GBs, and then vacancy combination. Figure 5-2 shows the void nucleation
process at 2800 K over the entire 2 ns time period for the initial structure showed in
Figure 5-1. As in earlier chapters, these snapshots only show the uranium ions because
the mobility of the uranium ion is less than the oxygen ion mobility; thus void nucleation
depends on the slower uranium ion diffusion.
During thermal treatment, the initially randomly scattered vacancies diffuse,
meet each other, and then nucleate voids. Figure 5-2A (t = 0.5 ns) shows a largely

100
random arrangement of voids in the bulk, with few voids on the GBs. To quantify the
evolution of voids on GB, we calculate the total number of vacancies on the GB, as we
did in Chapters 3 and 4, then the ratio to the total amount of vacancies in system. The
results in Figure 5-3 indicate that the fraction of vacancies at the GB grows
monotonically during this process. Moreover, it also shows that this increase is not
complete linear, but contains some rapid growth periods with more than 2% growth over
a single interval in time. This strongly suggest that there may be more than one growth
mechanism, as we discuss below.
In addition, we find that during this process of void growth on the GBs, there are
many fluctuations in GB plane, especially in Figure 5-2B and 5-2C. As discussed in
Chapter 4, it is energetically favorable for the GB to be straight. Because deviations in
the linearity of GBs increase its energy, it must be subject to a driving force. As
discussed in Chapter 4, vacancies and voids can provide a driving force to attract GBs
and lead to bending of the GB. In this study, there are numerous vacancies and voids to
attract the GBs and to bend them. However, after a while (less than 0.5 ns), most of the
GBs are straight again as shown in Figure 5-2D. This is consistent with the results in
Chapter 4 that the GB will straighten itself to minimize its energy.
Vacancy Segregation
As is well known, GBs can act as sinks to vacancies. It is thus not surprising that
free volume can accumulate at the GB. Hence there must be a driving force for
vacancies to move into the GB region.
To characterize the driving force, we follow the study of Hong et al., in which the
segregation of Cr to a single crystallographically well-defined UO2 GB was analyzed to

101
determine the vacancy segregation energy. [107] Specifically, we build a pure Σ5
bicrystal UO2 structure containing a single Schottky defect - one U vacancy and two O
vacancies. To avoid any influence of the O vacancies on other defects, the oxygen
vacancies are placed far away from the GB and the U vacancy. We determine the
segregation energy of the uranium vacancy to the GB as a function of distance from the
GB. It is clear from Figure 5-4 that the U vacancy segregates to the GB. We also find
that when the U vacancy is close to the GB, the segregation energy does not decrease
monotonically, which is similar to the result of Hong et al. for the segregation of Cr to the
same GB [107]. Nevertheless, the distance (∆X) has a different meeting for U. For
example, Figure 5-5 shows an ideal UO2 GB structure, with 3 U atoms identified. The
∆XA is not only the distance between atom A and the GB but also the distance between
atom A and an oxygen atom; ∆XB is the distance between atom B and the vacancy,
while ∆XC is the distance between atom C and the U atom. The previous study [107] by
Hong et al. also found that the local structure configuration and charge can significantly
influence the energy profile. As van Brutzel and Vincent-Aublant showed, many uranium
vacancies can move to the GB [47], and these vacancies can repel other uranium
vacancies [49]. Thus we determine the uranium vacancy repulsion energy by analyzing
a system contains two vacancies with a variety of separations to understand the charge
influence on energy profile as shown in the insert of Figure 5-4. For example, in Figure
5-5, the atom B has shorter ∆X than atom C, but the distance between atom B and a
vacancy in GB is less than that between atom C and a vacancy in GB. The shorter
distance results in the uranium vacancy in atom B’s location having a higher defect
energy than it atom C’s location. Since the U vacancy in atom B’s location is closer to

102
the vacancy in the GB, and these two vacancy repel each other. According results in
Figure 5-4, the highest repulsive energy between two vacancies is less than 5 eV,
consistent with the inset to Figure 5-4.
The profile shows that the uranium vacancies tend to segregate to the GB. As a
previous study indicated the uranium vacancy prefers to combine with oxygen
vacancies to form the Schottky trios [49]. Thus after a uranium vacancy reaches the GB,
the uranium vacancy can continue to absorb other oxygen vacancies. Moreover, as
mentioned in Chapter 3, even though vacancies with the same charge repel each other,
Schottky trios attract [49]; thus they can nucleate voids on the GB. This is consistent
with the results in Figure 5-3 that the voids continue to move towards and are captured
by the GBs.
GB Attraction by Voids and Vacancies
We discussed in Chapter 4 how the void/vacancy can pin to the GB. We also
showed that after a part of the GB is pinned to the void, the rest of GB can move toward
to the vacancy/void. If the distance between void and GB is small enough (for instance
less than 1.2nm in 2800 K), this stabilization behavior makes the GB move toward to
voids to reach a stable state. After the GB and void interaction, some of the voids
dissolve into GB but, as discussed in the next section, others do not. Figure 5-6 shows
an example of a GB-void interaction in which a GB moves from right (Figure 5-6A) to left
(Figure 5-6B), presumably due to the GB-void/vacancy attraction.
A mobile GB has a greater ability to absorb voids because as it moves, it sweeps
up voids in its path. This result is consistent with a previous experimental study in an ion
irradiated metal [36], in which GB migration leads to a denuded zone in its wake.

103
Comparing to the result in Figure 5-3, there are a jumps in the vacancy concentration at
the GB. These steps indicate events in which voids are absorbed by GBs moving
towards them. Once the GB meets a nearby void, it can punch vacancies out, leading to
the step growth in Figure 5-3. Thereby, the free volume at the GB comes from both
vacancies which move into the GB and voids absorbed by a migrating GB.
Dependence of defect evolution on defect density
According the above results, after vacancies move to the GB, void nucleation can
take place and the void can pin to the GB. We can thus consider the GB nucleation
reaction as a continuous process, in which vacancies continue to be trapped by the GB,
thereby increasing the vacancies density on GB and leading to a GB-void complex. To
realize this evolution in detail, we build a set of (310) Σ5 36.87° bicrystal structures with
vacancy densities from 5% to 10%. To show the defect complex at each stage, here we
show results for bicrystal structures with 5%, 7% and 10% vacancy density.
Vacancy Dissolves into GB
Figure 5.7A to 5-7C are snapshots of the 5% vacancy density structure. After
thermal annealing, the vacancies migrate to the GBs, thereby making the GB less
compact than its original structure. However, there is no void nucleation and pinning in
the GB region. This is different from the result in Figure 5-2 and in experimental studies,
in which GBs act as sinks for voids. Comparing the images in Figure 5-7A to 5-7C, we
find that vacancies migrate along the GBs. This result is consistent with a previous
simulation study [28] and with our work in Chapter 4, which showed that U ions can
easily diffuse along a GB at high temperature. Furthermore, the tendency to segregation
pins the vacancies. According to this result, a 5% vacancy concentration does not

104
provide enough vacancies to nucleate voids, at least on the MD time scale. This result
is also consistent with the results in Chapter 4: after a void interacts with GB, it can
dissolve into the GB, decreasing the total defect energy.
From Dissolution to Nucleation
For an initial vacancy density of 7%, voids nucleate on the GB. Figure 5-8A
shows that after 1.5 ns, a small void resides in the GB. The total number of vacancies
residing in the GB is more than in the 5% system. These vacancies make the GB
structure less stable. Comparing to Figure 5-7B and 5-7C, Figure 5-8A shows that a
small length of the GB has been broken by the void. Since there are more vacancies in
Figure 5-8 than in Figure 5-7, it is not surprising that the vacancies break a larger area,
forming free surface along the GB. In the bulk, the ideal void shape would be a sphere.
However, in analogy to wetting, in this system the shape can be analyzed in terms the
GB energy and surface energy as [22]:
cos θ =𝛾𝐺𝐵
2𝛾𝑠𝑢𝑟𝑓𝑎𝑐𝑒 (5-1)
Where, the is the angle of the ellipse void, γGB is the GB defect, and γsurface is the
surface energy. Using the values of γGB =1.65 J/M2 and γsurface= 2.49 J/M2 this predicts a
void angle of 71°. If the void cannot display this lowest energy surface, then according to
Eq. 6-1, the value of cos would be higher; that is would be smaller and the void would
be more elliptical. However, in simulations the void too small to be able to determine a true
shape. Rather the void aligns with the (310) Σ5 GB texture.
We track the evolution of this void, and we find that the void partially splits into
small voids and vacancies, as seen in Figure 5-8B. This is similar to what we observed
in Chapter 3 where a vacancy could easily split from a small and irregularly void under
105
thermal annealing. We find that these re-dissolved voids/vacancies can recombine to
form another void, as shown in Figure 5-8C. The net effect of this can be considered as
a random void migration process along the GB. As mentioned in Chapters 2 and 3,
voids can migrate through void dissolution and condensation [6, 21], which is similar to
the Ostwald ripening void growth process [77]. Because small free volumes can migrate
more rapidly than large free volumes, [21] once the void dissolves, the vacancies
migrate faster. Moreover, the ion diffusion in the GB region is much faster than in bulk
[28]; thus, it is reasonable that the void migration can easily take place along the GB, as
seen in Fig 5-8. As a result, the GB provides a route for rapid vacancy/void migration.
From Nucleation to Interconnection
In the 10 % vacancy density system, a void formed at the GB becomes even
bigger, as Figure 5.10A shows. After 1.2 ns of thermal annealing, Figure 5.10B, there
are two voids at the GB; these two voids are larger than in the corresponding voids in
Figure 5-8A. These larger voids are more stable than the void in Figure 5-8A, as was
discussed in Chapter 3. Thus these voids do not dissolve as they do in Figure 5-8B.
Because the migration of larger voids is slower, these voids don’t randomly migrate
along the GB on the MD time scale. We also find that the shapes of these voids evolve
through void surface diffusion, which allows ion migration along the surface, as
indicated in Chapter 3 [21]. For instance, at t = 1.5 ns, Figure 5-10C shows that the
upper void not only keeps growing but also changes from an approximately spherical
shape to a more lenticular shape. In addition, these voids meet each other and
interconnect via void coalescence. Finally they become a single connected void at t = 2
ns, as shown in Figure 5-10D. This process of void interconnection and coalescence is

106
physically quite reasonable, and is consistent with the results in in Chapter 3, which
indicated that voids prefer to combine to eliminate their total surface area and surface
energy.
Schematic of the Overall Evolution
As in Chapter 3, to avoid the influence from the initial arrangement of the
vacancies and establish the trend in the evolution of the defect complexes, we test five
different structures for each vacancy density form 5% to 10%. The thermal processing is
identical in each case, and the temperature is also 2800 K. Figure 5-11 compares the
results for all these systems. For a defect density of 5%, there are no voids on the GBs
in any of the structures during the 2 ns of the simulations. In structures with 6% defect
density, void nucleation takes place on the GB in only one structure. For a defect
density of 7%, voids form on the GBs in four of the five structures. For defect densities
over 7%, all five structures have voids on the GB. This result is consistent with the
snapshots shown in Figure 5-7 to 5-10 in that the GB nucleation process involves
dissolution, nucleation, and interconnection.
During the burn-up of UO2 in a reactor, the vacancy density will increase
gradually. We could thus consider the evolution of GB nucleation as a continuous
process from dissolution, to nucleation and thence to interconnection. Figure 5-12
attempts to capture the whole process of the defect complex evolution. This defect
complex evolution is consistent with the previous studies [22-24] which discussed the
progress of void and GB that void nucleation, growth and interlinking. In the beginning
few vacancies dissolve into GB. These vacancies move randomly and migrate along the
GB because of the faster ion diffusion in the GB region. After enough vacancies are
absorbed by the GB, small voids nucleate. These small voids can migrate easily

107
through dissolution and re-combination, in a manner similar to Ostwald ripening. The
migration can take place continuously until the void size is large enough that it won’t
easily dissolve into the system. The large void will continue to accumulate vacancies
and to grow. After these voids grow and come close to each other, they can coalesce.
Finally, large interconnected voids form on the GB. Even though the coalescence and
Ostwald ripening in GB-void complex is different form in the bulk, both are important to
at the GBs.
Summary
In this study, molecular dynamics simulations followed the evolution of early
stage void nucleation on GBs in UO2. We found that there are two mechanisms by
which GBs absorb vacancies. First, the tendency to vacancy and grain boundary
segregation drives vacancies to move into the GB. This is consistent with previous
experimental [6, 8, 24] and simulation [31, 32] studies that GBs can act as defect sinks.
Second, vacancies and voids attract a GB, allowing the GB to sweep up free volume as
it moves. This is also consistent with the result in Chapter 4.
In this simulation, the evolution of vacancy, void and GB complex is a serial
process. It is also consistent with a previous experimental study [24] that showed the
defect complex changes continuously. In that study, the voids interconnected, as we
found in this study. Moreover, we found that the coalescence and Ostwald ripening
mechanisms operate on voids at GB in a similar manner to voids in the bulk. The key
difference is that the ion diffusion along the GB is much faster than in bulk, which is also
consistent with a previous simulation study [28].
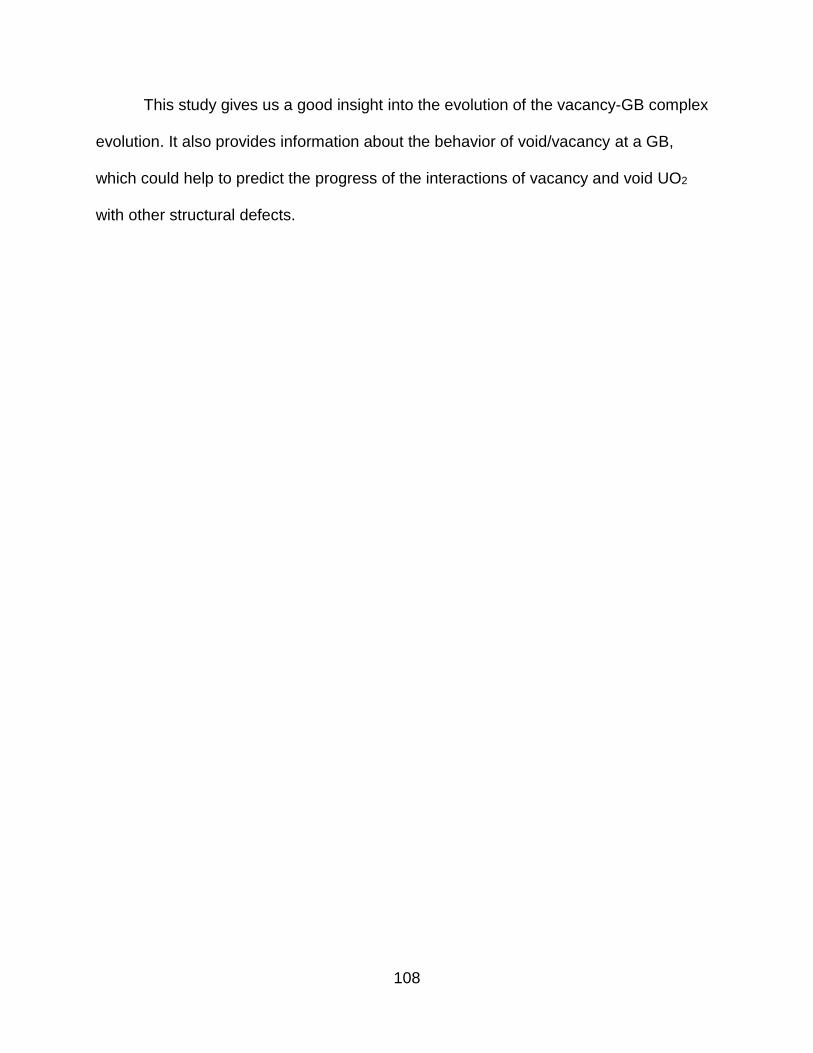
108
This study gives us a good insight into the evolution of the vacancy-GB complex
evolution. It also provides information about the behavior of void/vacancy at a GB,
which could help to predict the progress of the interactions of vacancy and void UO2
with other structural defects.

109
Figure 5-1. Single plane view (100) of the initial structure of the polycrystalline UO2 system with vacancies. There are 6 different grains in this 3-d periodic supercell.
D E F
A B C

110
Figure 5-2. Snapshots of void nucleation in polycrystalline UO2.
B
C
C
B
B
C
B
B
A
C
C
B
B
C
B
B

111
Figure 5-3. The percentage of voids in the GB. The arrows indicate the time intervals with growth of more than 2%.
8
13
18
23
28
33
0 0.5 1 1.5 2
time (ns)
%

112
Figure 5-4. Segregation energy profile of a vacancy to the 5 (310) symmetric tilt grain boundary along the direction perpendicular (the center vertical line indicate the location of the grain boundary). Inset: Repulsive energy between uranium vacancies in bulk UO2. The zero of energy is the value for the largest ΔX simulated.

113
Figure 5-5. An example of UO2 grain boundary. The ∆X indicates the distance between
GB core and each atom.

114
Figure 5-6. GB migration by attraction to voids and vacancies. The dashed line in b shows the original location of the GB, while the arrow indicates the direction of GB movement.
B
C
C
B
B
C
B
B
A
C
C
B
B
C
B
B

115
Figure 5-7. Evolution of GB-vacancy interactions in system with 5% vacancy density. As all snapshots show, these vacancies migrate along the GB, but there is no void nucleation on the GB.
A t=0 ns, D=5% B t=0.5 ns, D=5% C t=1.0 ns, D=5%

116
Figure 5-8. Void nucleation on a GB. A) After enough vacancies dissolve into the GB, a void forms on the GB. B) This void partially dissolves into small voids and isolated vacancies. C) These voids/vacancies nucleate to form another void.
A t = 1.5 ns, D = 7 %
(a) t=1.5 ns, D=5%
B t = 1.75 ns, D = 7 % C t = 2.0 ns, D = 7 %

117
Figure 5-9. An example of void in GB. The in this void is 36.73° which is equal to the angle of (310) Σ5 GB.

118
Figure 5-10. Void nucleation at a GB (D = 10%). A) One void nucleated on GB B) After enough vacancies dissolve into the GB, two voids have nucleated on the GB. C) Both of these voids keep growing. In addition, ions on the void migrate along the surface leading to a change in the shape of the voids. D) Once these voids are close enough, they merge with each other to become a single large void.
B t = 1.2 ns
(b) t=1.5 ns,
D=5%
C t = 1.5 ns
(d) t=1.5 ns,
D=5%
D t = 2.0 ns
(c) t=1.5 ns,
D=5%
A t = 0.9 ns
t=1.5 ns, D=5%

119
Figure 5-11. Rates of void nucleation at GBs in various vacancy densities, based on five simulations at each defect density.
0%
10%
20%
30%
40%
50%
60%
70%
80%
90%
100%
5 6 7 8 9 10
Rat
es o
f V
oid
nu
clea
tio
n a
t G
B
Vacancy defect density (%)
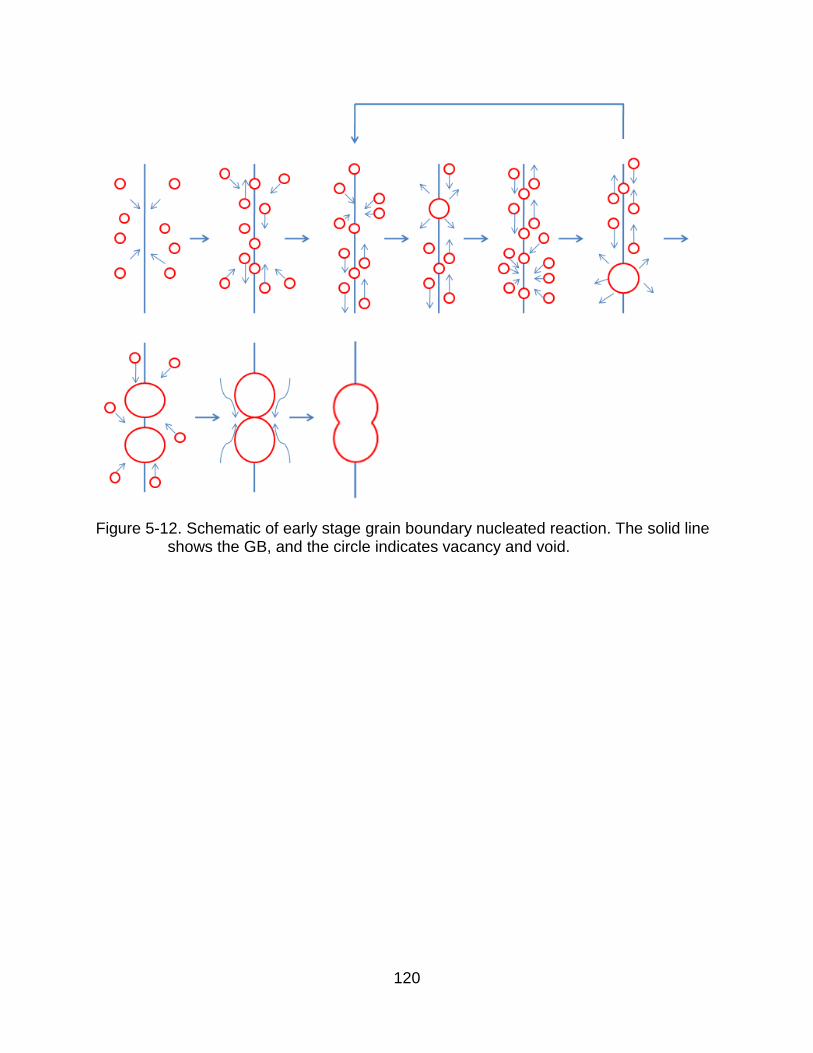
120
Figure 5-12. Schematic of early stage grain boundary nucleated reaction. The solid line shows the GB, and the circle indicates vacancy and void.

T. W. Chiang, A. Chernatynskiy, M. J. Noordhoek, S. B. Sinnott, S. R. Phillpot, “Analysis of Zirconium Surface Oxidization by DFT calculation”, Computational Materials Science (in preparation)
121
CHAPTER 6 ANALYSIS OF ZIRCONIUM SURFACE OXIDIZATION
Background
Zirconium (Zr) based alloys are widely used as the clad for nuclear fuel because
of their structural stability and low thermal neutron absorption cross-section [108]. The
prototypical clad in a boiling water reactor or pressurized water reactors is Zircaloy 2,
which is more than 98% Zr, with 1.5 % Sn, 0.12% Fe, 0.1% Cr, 0.1% Ni, and smaller
amounts of other components [109]. More recent clads, such as Zircaloy 4, ZirloTM and
M5® [110] are also Zr alloys with compositions that differ from that of Zircaloy 2 in only
minor ways.
The oxidization of Zr based alloys has been widely discussed because a thin film
of zirconium oxide has a dense structure that can inhibit fission gas penetration through
the metal. As long ago as 1970, a study by Fehlner and Mott [111] of the transition from
chemisorption to 3-D oxide and anion migration during oxide growth showed that at low
temperature (~300 K) the oxidation depends on the oxygen pressure. In a study of
anodic oxidation, Davies et al. found that Zr oxidation rates only depend on oxygen
migration rates [112]. It has also been determined that the presence of oxygen in the Zr
subsurface interstitial sites can prevent the further penetration of oxygen, leading to
slower diffusion [113, 114].
There have been a number of studies of oxygen absorption on the basal (0001)
Zr surface. An experimental study by Wang et al. [115] showed that at 0.5 monolayer
(ML) coverage, half of O atoms prefer to occupy the octahedral sites between the first
and second layers of the Zr subsurface, while the others occupy octahedral sites

122
between the second and third layers. They also showed that once the oxygen coverage
reached 2 ML, the oxygen ions prefer to reside in the surface face centered cubic
(SFCC) sites and in the tetrahedral sites between first and second subsurface layers
[116]. Other studies characterized the oxidation rate using electron microscopy (TEM
and SEM) [117, 118]. These studies found that the prismatic (1010) surface has a much
faster oxidation rate than the basal (0001) surface.
Studies using Density Functional Theory (DFT) calculations with the local-density
approximation (LDA) approximation have also analyzed oxygen absorption by the Zr
basal surface [119-121]. These concluded that the energetically favored oxygen
absorption sites are the octahedral sites between the second and third layers [119].
However, more recent calculations with the generalized gradient approximation (GGA)
using the double oxygen layer model, in which the oxygen is placed in two layers,
arrived at a different conclusion: the energetically favored sites are the SFCC sites
[120], as seen as in Figure 6-1. Another GGA study using a multiple-layer adsorption
model (MLAM), with oxygen atoms in multiple layers, indicated that at 0.25 ML the
SFCC site is energetically favored. In this model, as the coverage increases to 0.5 ML,
a combination of SFCC sites and octahedral sites is the most stable, as shown in Figure
6-1 [121]. These GGA calculations [120, 121] also suggest that while thermal diffusion
allows oxygen to cross the energy barrier from SFCC sites to the subsurface, the
occupation of subsurface sites can prevent further oxygen penetration [120]. Another
recent LDA calculation determined [122] that strain on the surface can change the most
stable sites on Zr basal surface from SFCC sites to octahedral sites.

123
Little attention has focused on analyzing the energy barriers for oxygen
penetration into the Zr basal and prism surfaces. These energy barriers are important
because they can be expected to play an important role in oxidation. While one DFT
study found that oxygen has a lower energy barrier for migration between SFCC sites
than from SFCC to a subsurface octahedral interstitial site, it did not compare the basal
and prism surfaces. [123] Hence, with the objective of understanding the large
difference in their oxidation rates, in this study we determine the paths and energy
barriers associated with the oxygen migration into Zr basal and prism surfaces.
Density Functional Theory
In order to analyze the oxidation behavior into the Zr surface, we use Density
Functional Theory (DFT) calculations [124]. As is well known, oxidation involves the
transfer of electrons from a metal to the oxygen [125]. In principle, the electronic
structure of a material can be determined by solving the time-independent Schrödinger
equation:
HΨ = EΨ (6-1)
where H is the Hamiltonian operator, Ψ is a set of eigenstate wave functions, and E is
the energy eigenvalue [126]. In the Born-Oppenheimer approximation[127], the
Schrödinger equation can be written as:
[−ћ2
2𝑚∑ ∇𝑖
2 + ∑ 𝑉(𝑟𝑖)𝑁𝑖=1 + ∑ ∑ 𝑈(𝑟𝑖 , 𝑟𝑗)𝑗<𝑖
𝑁𝑖=1
𝑁𝑖=1 ]Ψ = EΨ (6-2)
where the terms in the Hamiltonian operator are, in order, the electron kinetic energy,
the electron and nuclei interaction energy the interaction energy between electrons, and
the r is the position.

124
The m and N in Eq. 6-2 are the electron mass and the number of electrons. The
electronic wave function is denoted as Ψ, and includes the positions (vectors) of the
electrons, ri, (i=1, ..,N):
Ψ = Ψ (r1, r2 … rN) (6-3)
This is in general a complex function of all the atomic coordinates. The Schrodinger
equation can be solved exactly for only a few special cases [128] In order to perform
calculations on interesting systems, it is almost always necessary to make
approximations.
The Hartree–Fock approximation considers the energy eigenstate in terms of the
product of individual electron wave functions:
Ψ = Ψ1(r) Ψ2(r) …ΨN(r) (6-4)
which is known as the Hartree product of one electron wave functions.
A second approach to addressing the problem of the many-body nature of the
Schrödinger equation focuses on the electron density, n(r), at location, r:
n(r) = 2∑ Ψ𝑖∗(𝑟)Ψ𝑖𝑖 (6-5)
where the 2 is the prefactor from the Pauli exclusion principle, the Ψ𝑖(𝑟) is the one-
electron wave function of electron i [128], and the superscript * denotes the complex
conjugate. In 1964, Hohenberg and Kohn proved that: “the ground state energy from
Schrödinger’s equation is a unique functional of electron density” [124]. Unfortunately
the Hohenberg-Kohn theorem only proves that if the electron density were known
exactly, then the ground state would be completely determined. It does not provide any
information on the form of the electronic density or a methodology for determining it. In
1965, Kohn and Sham introduced the Kohn–Sham equation [129] by which the electron

125
density in an interacting electron system is written in terms of the density of a non-
interacting system of electrons. The Hohenberg-Kohn theorem and the Kohn-Sham
equations are the foundation of DFT. In DFT, the energy can be written as [128]
E[{Ψ𝑖}] = [ −ћ2
𝑚∑∫Ψ𝑖
∗
𝑖
∇2Ψ𝑖𝑑3𝑟 + ∫𝑉(𝑟)𝑛(𝑟)𝑑3𝑟 +
𝑒2
2∫∫
𝑛(𝑟)𝑛(𝑟′)
|𝑟−𝑟′|𝑑3𝑟𝑑3𝑟′ + 𝐸𝑖𝑜𝑛] + 𝐸𝑋𝐶[{Ψ𝑖}] (6-6)
In order, the terms on the right describe the electron kinetic energy, the electron-
nuclei interaction, the interaction between electrons, and interactions between nuclei.
The EXC is the exchange-correlation term which describes interactions that are not
included in other terms. Kohn and Sham also showed that solving a set of equation
which only considers single electron wavefunctions can give the electron density. In
particular, the Kohn and Sham equation is written as:
[−ћ2
2𝑚∇2 + 𝑉(𝑟) + 𝑉𝐻(𝑟) + 𝑉𝑋𝐶(𝑟)]Ψ𝑖(r) = 𝜀𝑖Ψ𝑖(𝑟) (6-7)
As was the case for the Schrodinger equation, it is not possible to solve the
Kohn-Sham equations exactly. To obtain an approximate solution to the Kohn-Shan
equation the following strategy has been widely used. First, define a trial electron
density n(r). Second, use this n(r) to solve the Kohn-Shan equation and find the wave
functions Ψi. Third, use the wave functions to calculate the electron density via Eq. 6-5.
Fourth, compare the calculated electron density with the trial electron density. If these
two densities are not sufficiently similar, use the newly determined electron density as
the trial electron density and repeat the process until convergence.

126
In addition to solving the Kohn-Shan equation, it is necessary to define the
exchange-correlation term; this is the most difficult part of the DFT method. Two
alternate approximations are commonly used: the local density approximation (LDA)
and the generalized gradient approximation (GGA) [130]. In LDA, it assumed that the
one-electron density takes on a fixed value and is spatially uniform over each finite
spatial region considered. The GGA is more sophisticated than LDA in that it includes
both the local electron density and the local electron density gradient. However, since
both are approximations, it is necessary to determine which is most appropriate for any
given problem [131]. There are other more advanced and computationally more
expensive methods, such as those using hybrid functionals [132, 133], but they are not
used in these studies.
Computational Details
The DFT calculations are performed using the Vienna ab initio Simulation
Package (VASP) [134, 135] with the projector augmented-wave (PAW) method [136].
To demonstrate this method, we test a 2 x 2 x 2 hexagonal unit cell Zr bulk structure.
The GGA approximation is chosen since it performed well in the study of the multiple-
layer adsorption model [121]. The Perdew-Burke-Ernzerhof function (PBE) [130] is used
to describe the gradient of the electron density. The kinetic energy cutoff is 400 eV,
which is the same as used in an earlier DFT study of Zr [121]. An 8 x 8 x 8 k-point mesh
is used for the bulk supercell. HCP single crystal Zr structure yields a lattice constant of
a = 0.324 nm, c=0.515 nm, which gives c/a = 1.595. These calculated values are
consistent with the experiment values of a = 0.323 nm, c = 0.515 nm and c/a = 1.593,
and in good agreement with previous DFT results [121, 137]. Previous experimental

127
work showed that the Zr thermal expansion doesn’t significantly affect the c/a ratio. At
950 K, c/a = 1.597 [138], which is only 0.25 % different from the 0 K value. Moreover,
the volume expansion at 950 K is also less than 1% [138]. Thus, the structure found in T
= 0 K DFT calculations can reasonably be compared to previous experimental studies
[115, 117].
To perform the calculations of oxygen migration, HCP basal (0001) and prism
(1010) surfaces are created. Schematics of those two surfaces are shown in Figure 6-2.
The planar density of the basal plane is 1.1 x 10¹³ atoms/mm2 which is higher than the
density on prism plane: 6 x 10¹² atoms/mm2. The supercell for the surface calculations
has eight metal layers with 2 x 2 surface unit cells, as shown in Figure 6-3 and 6-4. A
vacuum region of the same thickness as the thickness of the metal film is added and an
8 x 8 x 1 K point mesh is used; which is similar to that used in a previous study [121].
Throughout these calculations, atoms in the bottom four atomic layers are fixed to mimic
the effects of an infinitely thick system. After the structure is fully quenched (energy
deviations < 10-5 eV), we introduce oxygen into the surface. The oxygen is introduced in
the same manner as in previous studies that indicated the possible oxygen interstitial
sites in Zr [119, 121]. After the oxygen atoms are introduced into the Zr structure, the
structure is quenched to equilibrium, from which the stable binding energy of each
oxygen interstitial is calculated. These stable structures are used as the reference
states for the calculation of the energy barriers for migration.
The climbing image nudged elastic band (cNEB) method [139, 140] is used to
calculate the atom migration saddle points and the migration energy barriers. The NEB is
a method to find the minimum energy path (MEP), which is the lowest energy path of the

128
transition state [140]. In NEB, the possible path is divided into several images. For
instance, as Figure 6-5 shows the path from A to B is split to 5 images All images can be
considered as connected with springs or elastic bands, with spring constant ki [140].
Hence, the spring force will be expressed as:
𝐹𝑖𝑠||| = [𝑘𝑖+1(𝑅𝑖+1 − 𝑅𝑖) − 𝑘𝑖(𝑅𝑖 − 𝑅𝑖−1)]�̂� (6-8)
where the vector R is the location and �̂� is the local tangent at each image to the
path. The total force acting on each image should be a combination of the spring force
in Eq.6-8 and the true force perpendicular to the local tangent [141]. It can be expressed
as:
𝐹𝑖 = 𝐹𝑖𝑠|
||− ∇E(𝑅𝑖)|⊥ (6-9)
where the E is the system energy. It is known that along the MEP any point or image
should only suffer forces change along the MEP path [140], and the energy in any
direction perpendicular to the MEP should be constant. Thus, to find the MEP the force
must converge for all images along the path. The cNEB is a modification of the NEB
method [140]. In the original NEB calculation, the saddle point may not be located at
any of images used. By contrast, the cNEB is guaranteed to place the highest energy
image at the saddle point. Since the highest energy image have a spring force of zero,
[140] the image will move along the MEP to maximize its energy, thereby finding the
highest energy location. In each migration path considered here, six images are used.
The interval between each image is around 1 Å or less. According to our result this
resolution is enough to reproduce the energy barrier.

129
Oxygen Migration in Bulk
To understand the effects of surfaces it is first necessary to understand migration
in the bulk. There are two distinct interstitial sites: an octahedral (O) site and a
tetrahedral (T) site. While an oxygen in an O site lies half way between two Zr planes
and has six Zr nearest neighbors, an oxygen in a T site lies closer to one Zr layer than
the other and has only three Zr nearest neighbors. As a result the energy of the oxygen
is higher energy in the T sites than in the O sites, and is thus less strongly bound to the
T sites. The DFT calculations confirm this and are consistent with the results of previous
studies [119, 121].
The possible near-neighbor migration jumps among interstitial sites are illustrated
in Figure 6-1C, for which we determine all of the energy barriers. Jumps shown as
dotted lines in Figure 6-1C have high energies and are not part of the lowest energy
path; jumps shown as solid lines are part of the lowest energy paths. For example, the
barriers for migration from an O site through a Zr plane to either an O site or a T on the
other side (interlayer migration) are extremely high, see Table 6-1. These high energy
barriers arise from the close approach that the migrating oxygen atom would make to a
Zr atom in the lattice, leading to strong repulsive forces. The lowest energy path for
interlayer migration is 1
6[0001] from T to T with a barrier height of only 0.1 eV. For
migration among sites lying between the same two Zr layer (intralayer migration), the
barriers for O to O and T to T paths are high, while the lowest is that between O and T
(1.72 eV) and between T and O (0.83 eV). Each O site has 6 equivalent intralayer T
sites, three above it and three below it, lying along 1
12(4041), while each T site has 3
equivalent O sites, all of which are either above it or below it. As a result the paths for

130
long-range migration in any crystallographic direction is made up of combinations of
three distinct jumps: low energy interlayer T to T jumps, and higher energy intralayer O
to T and T to O jumps. In particular, the net path for diffusion along [0001] is O to T to T
to O, while migration within the basal plane involves O to T and T to O jumps; even in
this case there may be multiple interlayer jumps as the energy barrier is so low. The net
result is that oxygen migration energy barrier in the bulk single crystal is isotropic.
Nevertheless, it doesn’t mean that the oxygen diffusion rate is the same in each
direction [142], since defect diffusion in Zr HCP is influenced by its c/a ratio [143].
Migration into (0001) and {10𝟏0} Surfaces
We now turn to determining the migration barriers in the surface region. In Fiure.
6-3 and 6-4, the O and T sites are numbered to denote their positions relative to the
surface (layer 1). For the (0001) basal surface, Figure 6-3, the O(12) site is an
octahedral site between layers 1 and 2, while O(01) lies above the Zr surface; this O(01)
site is the SFCC. The T(12A) site lies closer to layer 1, while the T(12B) lies closer to
layer 2. In Figure 6-4 of the prism surface, the O and T sites are denoted as in the basal
surface and thus do not relate directly to the layer number.
Table 6-1 gives the energy barriers for diffusion into and out of the (0001) and
{1010} surfaces. For both surfaces, the lowest energy path is the same as the bulk
diffusion path. However, the energy barriers are modified.
Figure 6-6 shows the lowest energy path for diffusion into and out of the (0001)
surface. The overall lowest barrier path is from O(01) to O(12) to T(12B) to T(23A) to
O(23) to T(23B) to T(34A) to O(34). This energy barrier from O(01) to O(12) is smaller

131
than for migration between equivalent O sites in the bulk because an oxygen sitting on
the surface only has half the number of Zr bonds as the corresponding interstitial in the
Zr structure, and is thus higher in energy and less strongly bound. The oxygen doesn’t
migrate through from O(01) to T(01) to T(12A) to O(12) because the oxygen in T(12A) is
very unstable, as a previous study indicated [120]. In our calculation, we found an
oxygen in T(12A) spontaneously moves to T(01) since T(01) has a lower energy and
there is no measurable energy barrier. The oxygen also cannot migrate directly from
O(01) to T(12A) or T(01) to O(12) because as discussed in the context of the bulk, the
oxygen cannot cross the Zr layer from O to T. Hence, oxygen must directly migrate from
O(01) to O(12). In addition, oxygen cannot migrate directly from T(12A) to T(12B) or
other equivalent sites because along these paths, the oxygen would approach Zr atoms
so closely that there would be a strong repulsive force.
The energy barrier in T(12B) to T(23A) is much lower than for O(01) to O(12) or
for O(12) to T(12B), consistent with the behavior in the bulk. All energy barriers for
transitions from O(23) or sites deeper in to the surface are very similar to the bulk
values. This is expected because previous work showed that the energy of oxygen
interstitials in these sites have values close to bulk values. Thus the surface only
influences oxygen migration barrier in top few layers.
The oxygen migration in the {1010} prism surface can be analyzed in a manner
similar to oxygen migration in the basal surface; a sketch of the oxygen interstitial in the
prism surface is shown in Figure 6-4. Again the energy barriers for migration from T to T
and from O to O are high. If the oxygen migrates through these paths, it pushes the Zr
atoms off their lattice sites, which is energetically expensive. Thus oxygen can only

132
diffusion through the O to T to O path, as in the bulk. Figure 6-7 shows the barriers in
lowest energy path for diffusion into the {1010} surface.
The energy barrier from T1 to O1 is smaller than from T to O energy in bulk in a
manner similar to that for the (0001) surface. The energy barrier from O1 to T2 is higher
than in bulk, which is also similar to the O(12) to T(12B) barrier. The migration barriers
from T2 and from sites deeper in the surface are very similar to the bulk values.
Discussion
These results show that the barriers for oxygen penetration in the basal surface
and prism surface show similar trends in that the barriers for penetration from above the
surface into the first surface layer is lower than the bulk value, while the barrier from the
first surface layer to the second is higher. In both cases, the barriers further in the
surface have rapidly approach the bulk values.
The most important difference between the two surfaces is that the barrier from
basal surface to first subsurface layer is substantially higher, 1.89 eV, compared to 1.22
eV for the prism surface. In addition, the barrier for oxygen to migrate back out from the
first subsurface layer onto surface is lower for the in basal surface, 1.1 eV, than for the
prism surface, 1.29 eV. The effect that these different energy barriers could have on the
oxidation rate can be qualitatively understood simply by looking at associated oxygen
diffusion rates:
Ƭ = ѵ𝑒−𝐸𝑚/𝐾𝐵𝑇
where Ƭ is the jump rate, ѵ is the vibrational frequency of the atom (oxygen), Em is the
energy barrier for migration, and KB is the Boltzmann constant. Based on these energy

133
barriers, and assuming that the vibrational frequencies are the same, the migration rate
of oxygen into the prism surface should be ~1011 higher than into the basal plane.
Similarly, the migration rate from the first subsurface layer back to the surface should be
~103 higher for the basal surface than prism surface. Both of these processes should
thus lead to a significantly lower oxidation rate for the basal surface than for the prism
surface, consistent with experiment [117, 118].
While the above analysis points to the anisotropy in the energy barriers at the
surface as at least in part accounting for the strong differences in oxidation rates, they
are likely not the entire story. To characterize the overall oxidation process or oxygen
diffusion speed additional analysis is needed such as Monte Carlo simulations [144] to
predict oxygen ions migration behavior in Zr surfaces. In particular, this analysis does
not take into account any microstructural elements such as grain boundaries and
dislocations which can be expected to have a significant effect on diffusion.
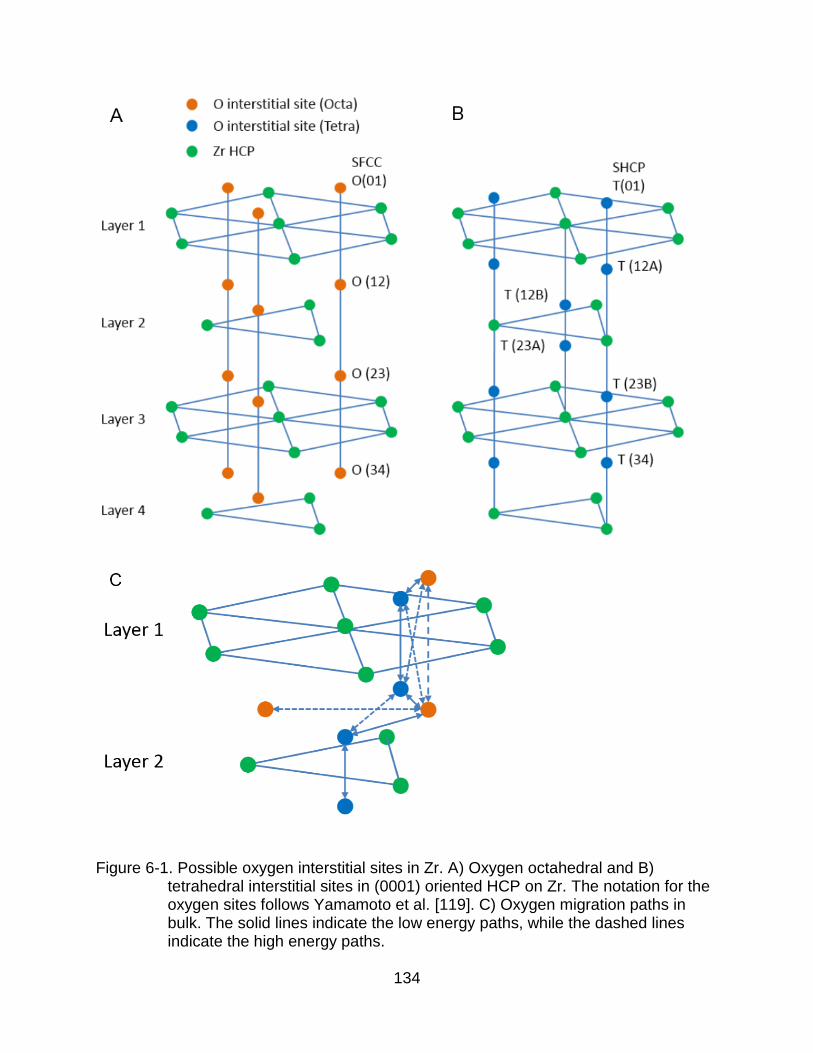
134
Figure 6-1. Possible oxygen interstitial sites in Zr. A) Oxygen octahedral and B) tetrahedral interstitial sites in (0001) oriented HCP on Zr. The notation for the oxygen sites follows Yamamoto et al. [119]. C) Oxygen migration paths in bulk. The solid lines indicate the low energy paths, while the dashed lines indicate the high energy paths.

135
Figure 6-2. Schematic of basal surface and prism surface in HCP Zr.

136
Figure 6-3. Oxygen interstitial sites on (0001) basal surface.

137
Figure 6-4. Oxygen interstitial sites on the {1010} prism surface. The open circle indicates tetrahedral sites that lie directly behind the Zr atoms. Arrows indicate a possible oxygen penetration direction. A and B are orthogonal views parallel to the prism surface.

138
Figure 6-5. Images in NEB calculation. A) A migration path is separated to 5 images. B) an image which could move along the MEP to find the saddle point.
A
B
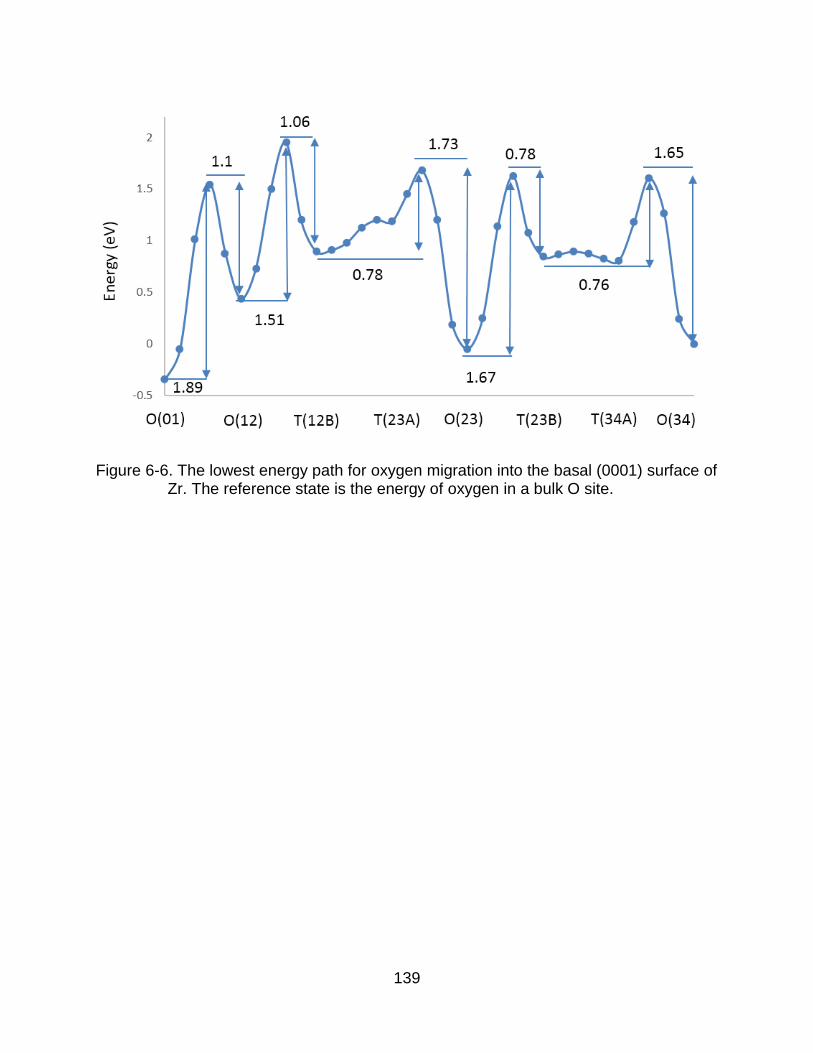
139
Figure 6-6. The lowest energy path for oxygen migration into the basal (0001) surface of Zr. The reference state is the energy of oxygen in a bulk O site.

140
Figure 6-7. The lowest energy path for oxygen migration into the prism {1010} surfaces of Zr. The zero of energy is for an oxygen in a bulk O site.

141
Table 6-1. Energy barriers for oxygen diffusion in Zr. Barriers are not shown for the interlayer O to T jump, the O to O and T to T intralayer jumps, or their equivalents in surfaces as they cannot take place.
Start End Forward Barrier (eV) Reverse Barrier (eV)
Bulk
Interlayer
O O 2.87 2.87
T T 0.10 0.10
Intralayer
O T 1.72 0.83
Basal Surface
O O
O (01) O (12) 1.89 1.10
O (12) O (23) 2.41 2.90
O (23) O (34) 2.81 2.85
T T
T (01) T (12A) 0.99 0.00
T (12B) T (23A) 0.30 0.04
T (23B) T (34A) 0.05 0.08
O T T O
O (01) O (12) 1.89 1.10
O (12) T (12B) 1.51 1.06
T (12B) T (23A) 0.30 0.04
T (23A) O (23) 0.48 1.73
O (23) T (23B) 1.67 0.78
Prism surface
O T O
T (01) O (01) 1.22 1.29
O (01) T (02) 1.80 1.14
T (02) O (02) 0.78 1.67
O (02) T (03) 1.67 0.80
T (03) O (03) 0.80 1.69

142
CHAPTER 7 CONCLUSIONS
In this dissertation, vacancy, void, and GB interactions and their dynamic
evolution in UO2 have been elucidated. Specifically, there are three parts to the
evolution. First, the early stage of void nucleation and its evolution has been captured.
Vacancies in grains diffuse randomly. On occasion, vacancies meet each other and
combine to form vacancy clusters and then small voids. These voids can further grow
by capturing more vacancies or other voids. Second, those voids can interact with GBs.
GBs and voids can share defect area to minimize the overall defect energy, which
provides a driving force for the GB and void to pin. Third, as more and more vacancies
and voids migrate to GBs, GB-void structures evolve. Voids can dissolve into the GB
when there are few vacancies inside the GB. As the number of vacancies in the GB
increases, they can nucleate into voids. These voids can connect with each other to
from the interconnected channels.
As is well known, fission gases can migrate to voids. [11] The gas pressure can
result in properties and migration behavior different from that of a void. In addition,
many fission products are produced in UO2 during the burn up process. Those fission
products can also interact with vacancies, voids and GBs. These interactions should be
the subject of future work.
As discussed in Chapter 1, irradiation produces PKAs and subsequent recoil
effects. Those effects provide energy to atoms allowing them to migrate and could lead
to other defect evolution phenomena [145, 146]. Moreover, the fission gases and
dislocations inside the UO2 pellet can also interact with vacancies and voids [6, 145].
143
These interactions could further affect the defect evolutions analyzed in this
dissertation.
From a purely technical perspective, there is also an issue with the system size.
Since the system size in this dissertation in very small, we could not explore
phenomena that take place in a UO2 pellet at longer length and time scales. To
overcome this limitation, larger scale simulations like Monte Carlo simulations or finite
element analysis are needed. Therefore, there are still many subjects for future work to
build the overall defect evolution map.
The oxidation of Zr surfaces has also been elucidated. The migration energy
barriers and a comparison of bulk, basal surface, and prism surface was made. The
results showed that the prism surface favors oxygen migration into the subsurface over
diffusion into than the basal surface. To further understand the Zr surface oxidation
behavior, higher oxygen coverage should be considered in future work. Moreover, the
temperature and pressure might change the oxygen binding and its migration
phenomenon. Thus the analysis effect on external pressure and temperature for the Zr
oxidation is also needed.
144
LIST OF REFERENCES
[1] Key World Energy Statistics, in, International Atomic Energy Agency 2012. [2] M.I. Hoffert, K. Caldeira, G. Benford, D.R. Criswell, C. Green, H. Herzog, A.K. Jain, H.S. Kheshgi, K.S. Lackner, J.S. Lewis, H.D. Lightfoot, W. Manheimer, J.C. Mankins, M.E. Mauel, L.J. Perkins, M.E. Schlesinger, T. Volk, T.M.L. Wigley, Sci., 298 (2002) 981-987. [3] R.E.H. Sims, H.-H. Rogner, K. Gregory, Energy Policy, 31 (2003) 1315-1326. [4] F.L. Toth, H.-H. Rogner, Ener. Econ., 28 (2006) 1-25. [5] S.C. Whitfield, E.A. Rosa, A. Dan, T. Dietz, Risk Anal., 29 (2009) 425-437. [6] D.R. Olander, Fundamental Aspects of Nuclear Reactor Fuel Elements, US. Dept. Energy, (1976). [7] D. Bodansky, Nuclear Energy: Principles, Practices, and Prospects, 2 ed., Springer New York, 2004. [8] S. Kashibe, K. Une, K. Nogita, J. Nucl. Mater., 206 (1993) 22-34. [9] K. Nogita, K. Une, J. Nucl. Sci. Tech., 30 (1993) 900-910. [10] K.R. Merckx, Nucl. Eng. Des., 9 (1969) 15-28. [11] K.W. Song, Y.W. Lee, M.S. Yang, D.-S. Sohn, Y.H. Kang, J. Nucl. Mater, 209 (1994) 263-269. [12] T. Jevremovic, Nuclear Principles in Engineering, Springer New York, 2009. [13] J.C. Bryan, Introduction to Nuclear Science, CRC Press, 2008. [14] M.N. Rosenbluth, High Energy Elastic Scattering of Electrons on Protons, Phys. Rev., 79 (1950) 615-619. [15] O.N.E. Agency, Pellet Clad Interaction in Water Reactor Fuels, OECD Publishing, 2004. [16] W.E. Grummitt, G. Wilkinson, Nature, 161 (1948) 520. [17] D.S. Aidhy, P.C. Millett, T. Desai, D. Wolf, S.R. Phillpot, Phys. Rev. B, 80 (2009) 104107. [18] W.J. Weber, Fundamental Aspects of Radiation Effects in Ceramics, in, EFRC Summer School 2012, 2012.

145
[19] K. Une, S. Kashibe, J. Nucl. Mater, 189 (1992) 210-216. [20] S.K. Rhee, Mater. Sci. Eng., 20 (1975) 89-93. [21] T.G. Desai, P. Millett, M. Tonks, D. Wolf, Acta Mater., 58 (2010) 330-339. [22] P.J. Clemm, J.C. Fisher, Acta Mater., 3 (1955) 70-73. [23] J.W. Cahn, Acta Mater., 4 (1956) 449-459. [24] R.J. White, M.O. Tucker, J. Nucl. Mater., 118 (1983) 1-38. [25] M.O. Tucker, J.A. Turnbull, Proc. R. Soc., 343 (1975) 299. [26] D.R. Gaskell, Introduction to the Thermodynamics of Materials, 5 ed., Taylor & Francis, 2008. [27] W. Chubb, V.W. Storhok, D.L. Keller, J. Nucl. Mater, 44 (1972) 136-152. [28] T.G. Desai, P.C. Millett, D. Wolf, Acta. Mater., 56 (2008) 4489-4497. [29] S.P.A. Gill, Int. J. Heat Mass Transfer, 52 (2009) 1123-1131. [30] P.K. Schelling, S.R. Phillpot, P. Keblinski, Phys. Rev. B, 65 (2002) 12. [31] K. Govers, M. Verwerft, J. Nucl. Mater, 438 (2013) 134-143. [32] E. Moore, L.R. Corrales, T. Desai, R. Devanathan, J. Nucl. Mater., 419 (2011) 140-144. [33] Y. Huang, F.J. Humphreys, Acta Mater., 47 (1999) 2259-2268. [34] T.A. Parthasarathy, P.G. Shewmon, Scripta metall., 17 (1983) 943. [35] T.A. Parthasarathy, P.G. Shewmon, Acta Mater., 32 (1984) 29-33. [36] W.V. Vaidya, J. Nucl. Mater, 113 (1983) 219-227. [37] G.T. Higgins, Metal Sci., 8 (1974) 143-150. [38] P.A. Beck, P.R. Sperry, J. Appl. Phys., 21 (1950) 150. [39] J.-W. Jeong, J.-H. Han, D.-Y. kim, J. Amer. Cer. Soc., 83 (2000) 915-918.

146
[40] J.M. Rickman, S.R. Phillpot, D. Wolf, D.L. Woodraska, S. Yip, J. Mater. Res., 11 (1991) 2291-2304. [41] S.M. Foiles, J.J. Hoyt, Acta Mater., 54 (2006) 3351-3357. [42] A.J. Haslam, D. Moldovan, V. Yamakov, D. Wolf, S.R. Phillpot, H. Gleiter, Acta Mater., 51 (2003) 2097-2112. [43] B. Schönfelder, D. Wolf, S.R. Phillpot, M. Furtkamp, Interface Sci., 5 (1997) 245-262. [44] J.D. Powers, A.M. Glaeser, Interface Sci., 6 (1998) 23-39. [45] E. Vincent-Aublant, J.-M. Delaye, L.V. Brutzel, J. Nucl. Mater., 392 (2009) 114-120. [46] T. Arima, K. Yoshida, K. Idemitsu, Y. Inagaki, I. Sato, Mater. Sci. Eng., 9 (2010) 012003. [47] L.V. Brutzel, E. Vincent-Aublant, J. Nucl. Mater., 377 (2008) 522-527. [48] P.V. Nerikar, K. Rudman, T.G. Desai, D. Byler, C. Unal, K.J. McClellan, S.R. Phillpot, S.B. Sinnott, P. Peralta, B.P. Uberuaga, C.R. Stanek, J. Amer. Cer. Soc., (2011) 1-8. [49] K. Govers, S. Lemehov, M. Hou, M. Verwerft, J. Nucl. Mater., 336 (2007) 161-177. [50] K. Govers, S. Lemehov, M. Hou, M. Verwerft, J. Nucl. Mater, 395 (2009) 131-139. [51] M.P. Allen, D.J. Tildesley, Computer simulation of liquids., Oxford New York, 1987. [52] L. Verlet, Phys. Rev., 159 (1967) 98. [53] U.M. Asche, L.R. Petzold, Computer Methods for Ordinary Differential Equations and Differential-Algebraic Equations, Society for Industrial and Applied Mathematics, 1998. [54] D.-S. Bae, E.J. Haug, Mech. Struct. & Mach., 15 (1987) 359-382. [55] H.J.C. Berendsen, J.P.M. Postma, W.F.v. Gunsteren, A. DiNola, J.R. Haak, J. Chem. Phys., 81 (1984) 3684-3690. [56] S. Nose, J. Chem. Phys., 81 (1984) 511-519. [57] H.C. Andersen, J. Chem. Phys., 72 (1980) 2384-2393.

147
[58] T. Schlick, Molecular Modeling and Simulation: An Interdisciplinary Guide Springer, 2010. [59] R.A. Buckingham, Math. Phy. Sci., 168 (1938) 264-283. [60] C.B. Basak, A.K. Sengupta, H.S. Kamath, J. Alloys Comp., 360 (2003) 210-216. [61] D. Wolf, P. Keblinski, S.R. Phillpot, J. Eggebrecht, J. Chem. Phys., 110 (1999) 8254-8282. [62] S.L. Dudarev, D.N. Manh, A.P. Sutton, Phil. Mag. B, 75 (1997) 613-628. [63] J. Ralph, J. Chem. Faraday Trans., 83 (1987) 1253-1262. [64] T.-W. Chiang, A. Chernatynskiy, S.B. Sinnott, S.R. Phillpot, J. Nucl. Mater, 448 (2014) 53-61. [65] J. Li., Model. Simul. Mater. Sci. Eng., 11 (2003) 173-177. [66] K. Une, K. Nogita, S. Kashibe, M. Imamura, J. Nucl. Mater., 188 (1992) 65-72. [67] P.G. Lucuta, H. Matzke, I.J. Hastings, J. Nucl. Mater, 232 (1996) 166-180. [68] S.R. Phillpot, A. El-Azab, A. Chernatynskiy, J.S. Tulenko, JOM, 63 (2011) 73-79. [69] V. Roquea, B. Crosa, D. Baronb, P. Dehaudt, J. Nucl. Mater, 277 (2000) 211-216. [70] A. Romano, M.I. Horvath, R. Restani, J. Nucl. Mater., 361 (2007) 62-68. [71] D.R. Olander, D. Wongsawaeng, J. Nucl. Mater, 354 (2006) 94-109. [72] W. Oldfield, J.B.B. Jr, Mater. Sci. Eng., 6 (1970) 361-370. [73] G.W. Greenwood, M.V. Speight, J. Nucl. Mater., 10 (1963) 140. [74] F.A. Nichols, J. Nucl. Mater., 30 (1969) 143. [75] L.J. Perryman, P.J. Goodhew, J. Nucl. Mater., 165 (1989) 110-121. [76] G.W. Greenwood, A. Boltax, J. Nucl. Mater., 5 (1962) 234-240. [77] L. Ratke, P.W. Voorhees, Growth and Coarsening: Ostwald Ripening in Material Processing, Springer, (2002). [78] Y. Li, S.Y. Hu, R. Montgomery, F. Gao, Nucl. Instrum. Methods Phys. Res. Sect. B. Beam Interact. Mater. Atoms, 303 (2012) 62-67.

148
[79] Y. Li, S.Y. Hu, R. Montgomery, F. Gao, X. Sun, M. Tonks, S.B. Biner, P. Millet, V. Tikare, B. Radhakrishnan, D. Andersson, U.S. Department of Energy Fuel Cycle R&D Program PNNL-21295 (2012). [80] S. Rokkam, A. E.-Azab, P. Millett, D. Wolf, Modelling Simul. Mater. Sci. Eng., 17 (2009) 064002. [81] J.D. Eshelby, Proc. R. Soc. Lond, 241 (1957) 376-396. [82] W.C. Johnson, J.K. Lee, Metall. Trans. A, 10 (1979) 1141-1149. [83] J.R. Willis, R. Bullough, J. Nucl. Mater, 32 (1969) 76-87. [84] J. Sun, T. Stirner, Langmuir, 17 (2001) 3103-3108. [85] B.P. Binks, Current Opinion Colloid Interface Sci., 7 (2002) 21-41. [86] H.R. Stuart, D.G. Hall, Phys. Rev. Lett, 80 (1998) 5663-5666. [87] G.E. Dieter, Mechanical metallurgy, McGraw-Hill, New York, 1976. [88] K. Nogita, K. Une, Nucl. Instrum. Meth. Phys. Res., B, 91 (1994) 301-306. [89] J.M. Griesmeyer, N.M. Ghoniem, D. Okrent, Nucl. Eng. Design, 55 (1979) 69-95. [90] J. Rest, G.L. Hofman, J. Nucl. Mater., 77 (2000) 231-238. [91] A.A. Solomon, J. Nucl. Mater, 102 (1981) 346-352. [92] C.S. Yust, J.T.A. Roberts, J. Nucl. Mater., 48 (1973) 317-329. [93] M. Hong, S.R. Phillpot, C.-W. Lee, P. Nerikar, B.P. Uberuaga, C.R. Stanek, S.B. Sinnott, Phys. Rev. B, 85 (2012) 144110. [94] T. Kwok, P.S. Ho, S. Yip, Phys. Rev. B, 29 (1984) 5354-5371. [95] Y. Tajima, W.D. Kingery, J. Phys. Chem, 77 (1982) 2592. [96] F. Zhang, A.M. Walker, K. Wright, J.D. Gale, J. Mater. Chem., 20 (2010) 10445-10451. [97] J. Rest, G.L. Hofman, J. Nucl. Mater, 210 (1994) 187-202. [98] G.L. Hofman, Y.S. Kim, Nucl. Eng. Tech., 37 (2005) 299-308. [99] C. T. Walker, P. Knappik, J. Nucl. Mater, 160 (1988) 10-23.

149
[100] A. Gonchar, S. Gorelik, S. Katynkina, L. Letyuk, I. Ryabov, J. Magn. Magn. Mater., 215-216 (2000) 221-223. [101] V.V. Likhanskii, A.A. Sorokin, O.V. Khoruzhii, Atomic Energy, 96 (2004) 102-110. [102] J.A. Turnbull, J. Nucl. Mater, 50 (1974) 62-68. [103] R.J. White, J. Nucl. Mater, 325 (2004) 61-77. [104] M.S. Veshchunov, V.I. Tarasov, J. Nucl. Mater, 392 (2009) 78-84. [105] T. Kogai, J. Nucl. Mater, 244 (1997) 131-140. [106] M. Tayal, L.D. MacDonald, E. Kohn, W.P. Dovigo, A model for the transient release of fission products from UO/sub 2/ fuel; Gasout code description Nucl. Technol., 85 (1989) 300. [107] M. Hong, B.P. Uberuaga, D.A. Andersson, C.R. Stanek, S.R. Phillpot, S.B. Sinnott, Comp. Mater. Sci., 78 (2013) 29-33. [108] N. Stojilovic, E.T. Bender, R.D. Ramsier, Pro. Surf. Sci, 78 (2005) 101-184. [109] A.J. Rothman, Potential corrosion and degradation mechanisms of Zircaloy cladding on spent nuclear fuel in a tuff repository, in, Lawrence Livermore National Laboratory Report UCID-20172, 1984. [110] M. Steinbrück, M. Böttcher, J. Nucl. Mater., 414 (2011) 276-285. [111] F.P. Fehlner, N.F. Mott, Oxid. Met., 2 (1970) 59.
[112] J.A. Davies, B. Domeij, J.P.S. Pringle, F. Brown, J. Electrochem. Soc., 112 (1965) 675. [113] K. Griffiths, J. Vac, Sci. Technol. , A6 (1988) 210. [114] C.-S. Zhang, B.J. Flinn, P.R. Norton, Surf. Sci, 264 (1992) 1-9. [115] Y.M. Wang, Y.S. Li, K.A.R. Mitchell, Surf. Sci, 342 (1995) 272-280. [116] Y.M. Wang, Y.S. Li, K.A.R. Mitchell, Surf. Sci, 380 (1997) 540-547. [117] H.G. Kima, T.H. Kima, Y.H. Jeong, J. Nucl. Mater, 306 (2002) 44-53. [118] R.A. Ploc, M.A. Miller, J. Nucl. Mater, 64 (1977) 71. [119] M. Yamamoto, C.T. Chan, K.M. Ho, S. Naito, Phys. Rev. B, 54 (1996) 14111.

150
[120] G. Jomard, A. Pasturel, Appl. Surf. Sci., 177 (2001) 230. [121] F.-H. Wang, S.-Y. Liu, J.-X. Shang, Y.-S. Zhou, Z. Li, J. Yang, Surf. Sci, 602 (2008) 2212-2216. [122] X. Wang, M. Khafizov, I. Szlufarska, J. Nucl. Mater, 445 (2014) 1-6. [123] R. Yao, F.-H. Wang, Y.-S. Zhou, Acta Phys. Sinica, 58 (2009) 177-182. [124] P. Hohenberg, W. Kohn, Phys. Rev., 136 (1964) 864-871. [125] W.D. Callister, Materials Science and Engineering: An Introduction, John Wiley & Sons, Inc, 2003. [126] R. Resnick, R. Eisberg, Quantum Physics of Atoms, Molecules, Solids, Nuclei and Particles, Wiley, 1985. [127] M. Born, K. Huang, Dynamical Theory of Crystal Lattices, Oxford University Press, New York, 1954. [128] D.S. Sholl, J.A. Steckel, Density Functional Theory: A Practical Introduction, Wiley, 2009. [129] W. Kohn, L.J. Sham, Phys. Rev., 140 (1965) 1133-1138. [130] J.P. Perdew, K. Burke, M. Ernzerhof, Phys. Rev. lett., 77 (1996) 3865-3868. [131] C. Stampfl, C.G.V.d. Walle, Phys. Rev. B, 59 (1999) 5521-5535. [132] Y. Zhao, D.G. Truhlar, J. Phys. Chem., 108 (2004) 6908-6918. [133] R.L. Martin, F. Illas, Phys. Rev. Lett., 79 (1997) 1539-1542. [134] G. Kresse, J. Hafner, Phys. Rev. B, 47 (1993) 558. [135] G. Kresse, J. Furthmüller, Phys. Rev. B, 54 (1996) 11169-11186. [136] P.E. Blöchl, Phys. Rev. B, 50 (1994) 17953-17979. [137] G. Jomard, T. Petit, L. Magaud, A. Pasturel, Phys. Rev. B, 60 (1999) 15624-15627. [138] G.B. Skinner, H.L. Johnston, J. Chem. Phys., 21 (1953) 1383. [139] G. Mills, H. Jónsson, Phys. Rev. Lett., 72 (1994) 1124-1127.

151
[140] G. Henkelman, B.P. Uberuaga, H. Jónsson, J. Chem. Phys., 113 (2000) 9901-9904. [141] H. Jonsson, G. Mills, K.W. Jacobsen, The Nudged Elastic Band Approach to Finding the Lowest Energy, World Scientific, Singapore, 1998. [142] G.M. Hood, J. Nucl. Mater., 159 (1988) 149-175. [143] G.M. Hood, H. Zou, D. Gupta, R.J. Schultz, J, Nucl. Mater., 223 (1995) 122-125. [144] K. Binder, Rep. Prog. Phys., 60 (1997) 487-559. [145] M.S. Veshchunov, J. Nucl. Mater, 277 (1999) 67-81. [146] G. Martin, P. Garcia, L.V. Brutzel, B. Dorado, S. Maillard, Nucl. Instrum. Meth. Phys. Res., B, 269 (2011) 1727-1730.

152
BIOGRAPHICAL SKETCH
Tsu-Wu Chiang was born in September 1982 at Taichung, Taiwan. He finished
his bachelor's degree at Dept. Mechanical Engineering of National Central University
Taiwan in 2005. He received the master’s degree at the same department under the
supervision of Prof. Tien-His Lee in 2007. In this period, he studied solid thin film
transfer methodology. He served in the Taiwan Army in Taoyuan Taiwan in 2008. After
the military service, he was offered admission to the University of Florida in 2009. He
got the opportunity to work as a research assistantship from Prof. Simon Phillpot.
Chiang earned his Ph.D. in materials science and engineering in August 2014.


![Untitled-1 [] · No Vacancy No Vacancy No Vacancy OBC 47.758 55.89 52.33 No Vacancy 55.13 52.46 52.33 53.00 43.80 No Vacancy No Vacancy sc 45.331 58.33 No Vacancy No Vacancy 50.67](https://img.pdfslide.us/doc/110x75/5fb0660e3185c15b9b1e7853/untitled-1-no-vacancy-no-vacancy-no-vacancy-obc-47758-5589-5233-no-vacancy.jpg)