Embed Size (px)
Citation preview

Compressive Strength of Geopolymer ConcreteComposites: Modeling and ComprehensiveSystematic ReviewHemn Unis Ahmed ( [email protected] )
University of SulaimaniAzad A. Mohammed
University of SulaimaniAhmed S. Mohammed
University of Sulaimani https://orcid.org/0000-0003-4306-3274
Research Article
Keywords: Geopolymer Concrete, Mix Proportion, Compressive Strength, Curing Condition, ANN Modelling,M5P-tree modeling
Posted Date: June 29th, 2021
DOI: https://doi.org/10.21203/rs.3.rs-611987/v1
License: This work is licensed under a Creative Commons Attribution 4.0 International License. Read Full License
Compressive strength of Geopolymer concrete composites: Modeling and
comprehensive systematic review
Hemn Unis Ahmed *1, Azad A. Mohammed1, Ahmed S. Mohammed1
)1( University of Sulaimani, College of Engineering, Department of Civil Engineering, Kurdistan Region, Iraq
*Corresponding author: Tel: +964-7501119884; e-mail: [email protected]
Abstract
The growing concern about global climate change and its adverse impacts on societies is putting severe
pressure on the construction industry as one of the largest producers of greenhouse gases. Given the
environmental issues associated with cement production, geopolymer concrete has emerged as a
sustainable construction material. Geopolymer concrete is cementless concrete that uses industrial or
agro by-product ashes as the main binder instead of ordinary Portland cement; this leads to being an
eco-efficient and environmentally friendly construction material. Compressive strength is one of the
most important mechanical property for all types of concrete composites including geopolymer
concrete, and it is affected by several parameters like an alkaline solution to binder ratio (l/b), fly ash
(FA) content, SiO2/Al2O3 (Si/Al) of the FA, fine aggregate (F) and coarse aggregate (C) content, sodium
hydroxide (SH) and sodium silicate (SS) content, ratio of sodium silicate to sodium hydroxide (SS/SH),
molarity (M), curing temperature (T), curing duration (CD) inside the oven and specimen ages (A). In
this regard, a comprehensive systematic review was carried out to show the effect of these different
parameters on the compressive strength of the fly ash-based geopolymer concrete (FA-GPC). In
addition, multi-scale models such as Artificial Neural Network (ANN), M5P-tree (M5P), Linear
Regression (LR), and Multi-logistic Regression (MLR) models were developed to predict the
compressive strength of FA-GPC composites. For the first time, in the modeling process, twelve
effective parameters including l/b, FA, Si/Al, F, C, SH, SS, SS/SH, M, T, CD, and A were considered
the modeling input parameters. Then, the efficiency of the developed models was assessed by various
statistical assessment tools like Root Mean Squared Error (RMSE), Mean Absolute Error (MAE),
Scatter Index (SI), OBJ value, and the Coefficient of determination (R2). Results show that the curing
temperature, sodium silicate content, and ratio of the alkaline solution to the binder content are the most
significant independent parameters that influence on the compressive strength of the FA-GPC, and the
ANN model has better performance for predicting the compressive strength of FA-GPC in compared to
the other developed models.
Keywords:
Geopolymer Concrete; Mix Proportion; Compressive Strength; Curing Condition; ANN Modelling; M5P-tree
modeling
1 Introduction
It is widely known that the production of Portland cement needs a considerable amount of energy and
at the same time contributes to generating a huge volume of the total carbon dioxide (around 7%) to the
atmosphere directly and indirectly, the heating of limestone releases CO2 directly which is called
calcination (50%), while the burning of fossil fuels to heat the kiln indirectly results in CO2 emissions,
this is around 40 percent of cement emissions and finally around 10% for quarrying and transporting
[1-3]. In addition, around 2.8 tons of raw materials are needs for the manufacture of one ton of cement;
this is a resource-exhausting process that consumes a large number of natural resources such as
limestone and shale for the production of clinkers for cement [4]. Furthermore, approximately one
trillion liters of mixing water is required to be used in the concrete industry annually [5]. In the same
context, the cement industry is the most energy-intensive construction material after aluminum and steel
manufacture. In a typical cement plant alone, around 110-120 kWh is used for each ton of produced
cement [6]. However, cement-based concrete is still the main important material used in the
construction industries worldwide [7]. Therefore, a highly efficient application of renewable and non-
renewable raw materials is essential for the economic development [8]. Sustainable development of a
novel material to replace the Portland cement has become increasingly substantial as the globe goes on
to face serious environmental problems [9, 10].
A convenient, suitable replacement to conventional concrete is geopolymer technology that was
developed first by Davidovits in France, 1970 [11]; the ancient Roman civilizations have used
geopolymer for building their monumental and castles in ancient times [12]. Geopolymers are members
of the family of inorganic alumino-silicate polymer synthesized from alkaline activation of various
aluminosilicate materials or other industrial or agro by-product materials rich in silicon and aluminum
like fly ash (FA), ground granulated blast furnace slag (GGBFS), metakaolin (MK), palm oil fuel ash
(POFA), rice husk ash (RHA) [13]. The microstructure of geopolymer materials is amorphous, and their
chemical constituents are similar to the natural zeolitic materials [14]. The chemical reaction between
alkali solution and base material containing aluminosilicate is called geopolymerization process; the
final product of the geopolymerization process gives a three-dimensional polymeric chain and ring
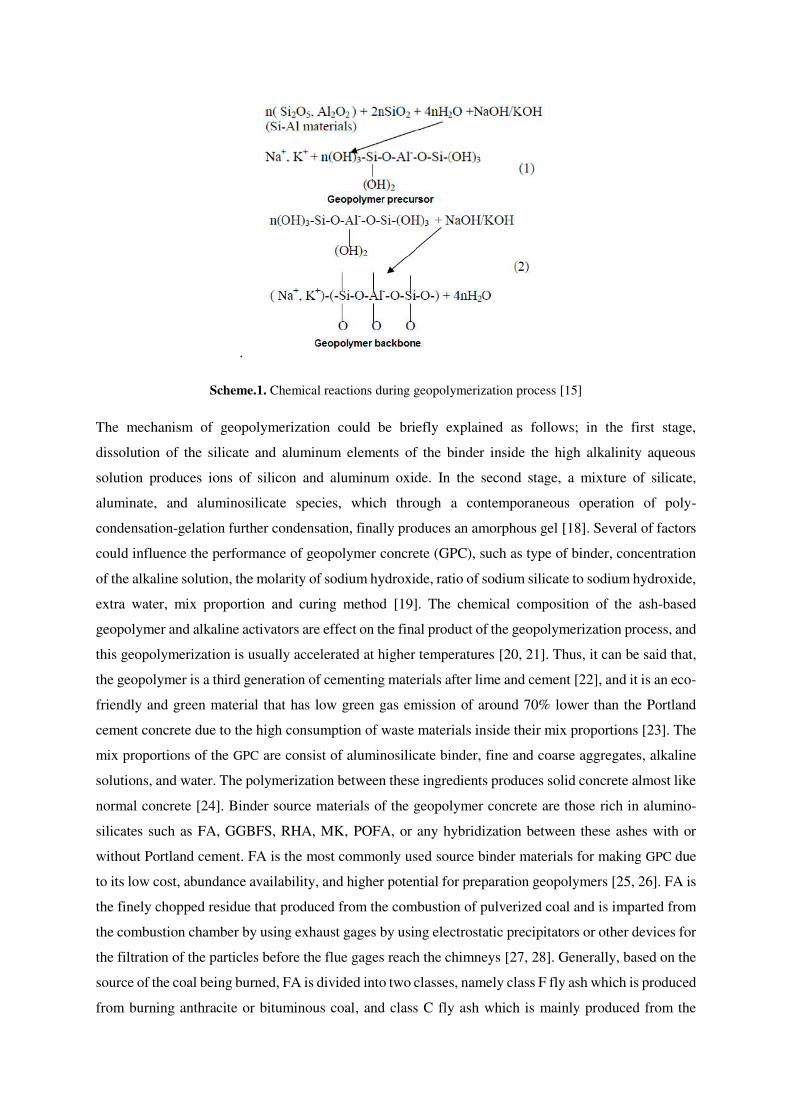
structure Si-O-Al-O bonds as shown in the Scheme.1. [15], with an empirical formula of {Mn[-(SiO2)z-
AlO2]n.wH2O}, when; M is an alkali action, n is the percent of polymerization, and w is the content of
water [16]. In addition, the chains in aluminosilicate could be in the form of poly-(sialate) with the ratio
of Si to Al is equal to 1.0 (-Al-O-Si- chain), poly (sialate-siloxo) with the ratio of Si to Al is equal to
2.0 (-Al-O-Si-Si- chain), and poly (sialate-disiloxo) with the ratio of Si to Al is equal to 3.0 (-Al-O-Si-
Si-Si- chain) [17].
.
Scheme.1. Chemical reactions during geopolymerization process [15]
The mechanism of geopolymerization could be briefly explained as follows; in the first stage,
dissolution of the silicate and aluminum elements of the binder inside the high alkalinity aqueous
solution produces ions of silicon and aluminum oxide. In the second stage, a mixture of silicate,
aluminate, and aluminosilicate species, which through a contemporaneous operation of poly-
condensation-gelation further condensation, finally produces an amorphous gel [18]. Several of factors
could influence the performance of geopolymer concrete (GPC), such as type of binder, concentration
of the alkaline solution, the molarity of sodium hydroxide, ratio of sodium silicate to sodium hydroxide,
extra water, mix proportion and curing method [19]. The chemical composition of the ash-based
geopolymer and alkaline activators are effect on the final product of the geopolymerization process, and
this geopolymerization is usually accelerated at higher temperatures [20, 21]. Thus, it can be said that,
the geopolymer is a third generation of cementing materials after lime and cement [22], and it is an eco-
friendly and green material that has low green gas emission of around 70% lower than the Portland
cement concrete due to the high consumption of waste materials inside their mix proportions [23]. The
mix proportions of the GPC are consist of aluminosilicate binder, fine and coarse aggregates, alkaline
solutions, and water. The polymerization between these ingredients produces solid concrete almost like
normal concrete [24]. Binder source materials of the geopolymer concrete are those rich in alumino-
silicates such as FA, GGBFS, RHA, MK, POFA, or any hybridization between these ashes with or
without Portland cement. FA is the most commonly used source binder materials for making GPC due
to its low cost, abundance availability, and higher potential for preparation geopolymers [25, 26]. FA is
the finely chopped residue that produced from the combustion of pulverized coal and is imparted from
the combustion chamber by using exhaust gages by using electrostatic precipitators or other devices for
the filtration of the particles before the flue gages reach the chimneys [27, 28]. Generally, based on the
source of the coal being burned, FA is divided into two classes, namely class F fly ash which is produced
from burning anthracite or bituminous coal, and class C fly ash which is mainly produced from the
burning of lignite coal sources, the former type has lower calcium content in compared to class C fly
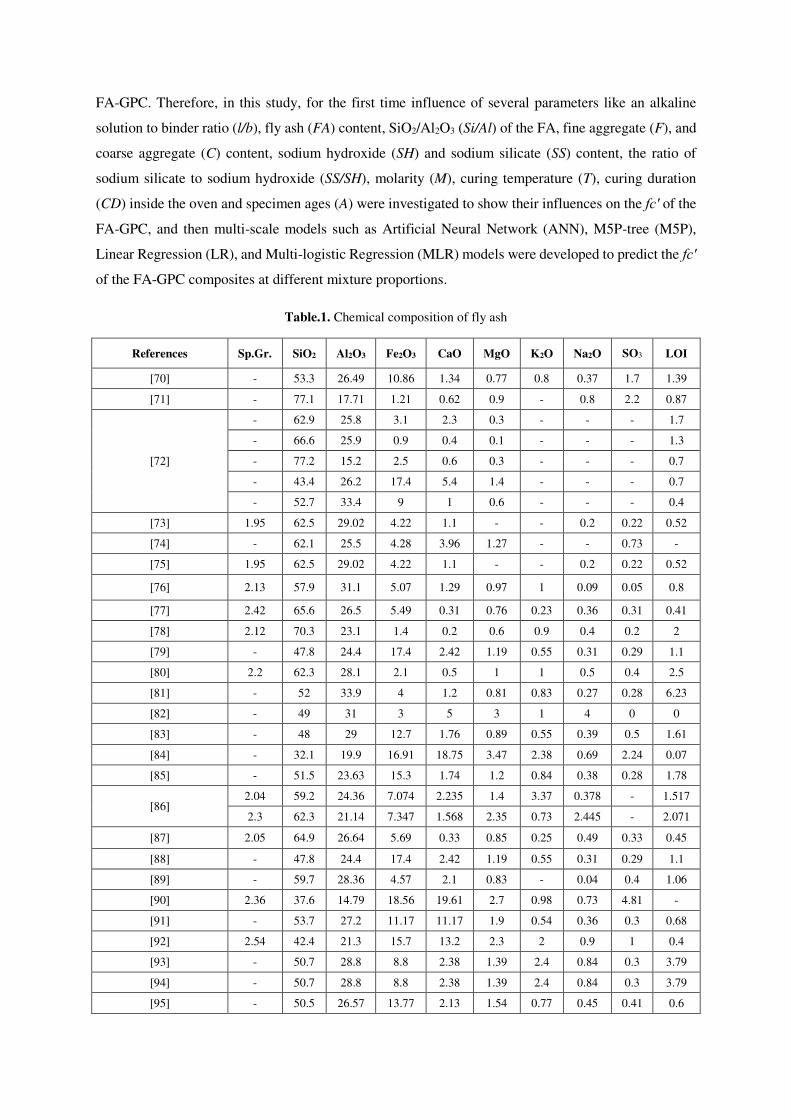
ash [29]. Further, the main components of FA are typical consist of SiO2, Al2O3, Fe2O3, and CaO with
a lower percent of some other minerals, which is shown in Table 1. The total percent of SiO2, Al2O3,
and Fe2O3 for the class F fly ah is over 70%, with the content of CaO less than 10%, while for the class
C fly ash total content of SiO2, Al2O3 and Fe2O3 should be between 50% to 70% with the percent of
CaO greater than 20% [30, 31]. In addition, FA is considered as a dangerous material because it contains
many trace elements, such as Mn, Ti, Cr, V, Co, As, Pb, and Mo. The intensity of the toxic trace
elements in FA could be 5-10 times greater than those in the raw material sources [32-34] and it has
small amounts of polycyclic aromatic hydrocarbon and dioxins [35, 36]. Therefore, the erroneous
discarding of FA and any other by-product or waste materials will increment the occupation of land and
destroy the environment and ecology [37-39]. Thus, to tackle these problems of FA and any other waste
materials; efforts have been made towards re-use of them in an efficient and green way, for instance,
high volume researchersresearchersresearchersresearchers have used FA have used FA have used FA
have used FA to replace Portland cement in different types of concrete and cementitious composites
[40-46]. More recently, FA has been utilized as an alternative source to make geopolymer paste [47,
48], mortar [49, 50], and concrete [51, 52]. For the production of FA-GPC, some reactions take place
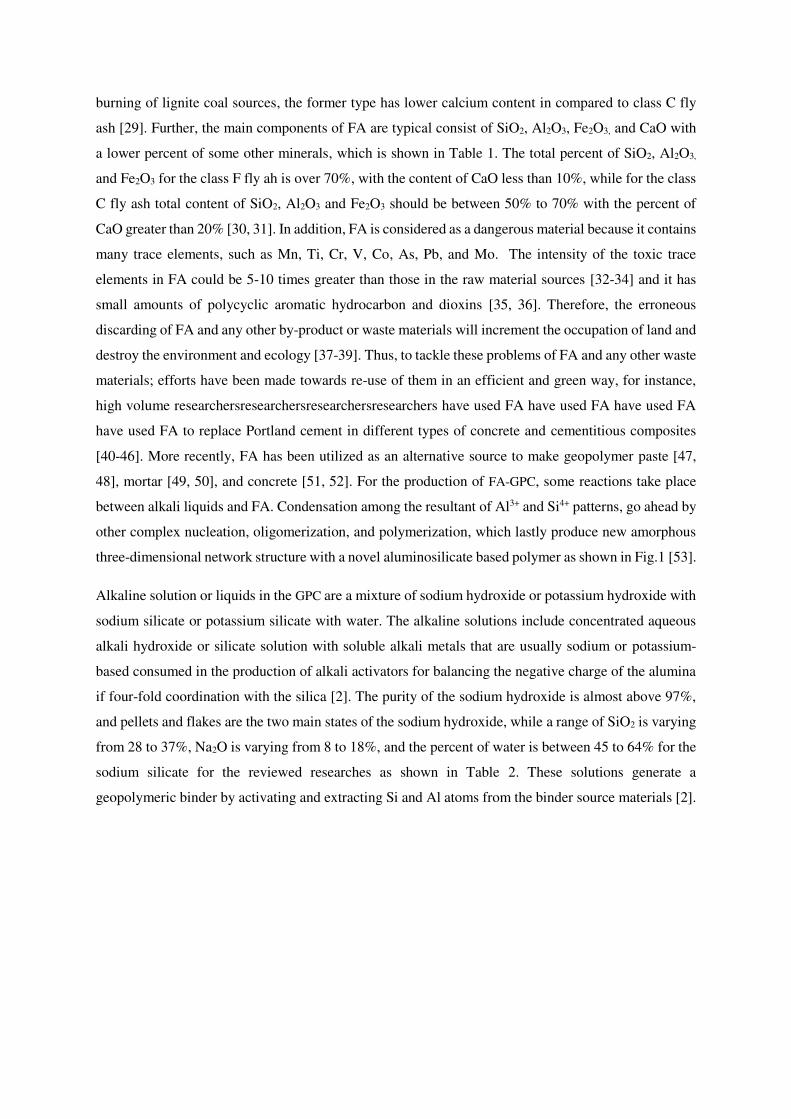
between alkali liquids and FA. Condensation among the resultant of Al3+ and Si4+ patterns, go ahead by
other complex nucleation, oligomerization, and polymerization, which lastly produce new amorphous
three-dimensional network structure with a novel aluminosilicate based polymer as shown in Fig.1 [53].
Alkaline solution or liquids in the GPC are a mixture of sodium hydroxide or potassium hydroxide with
sodium silicate or potassium silicate with water. The alkaline solutions include concentrated aqueous
alkali hydroxide or silicate solution with soluble alkali metals that are usually sodium or potassium-
based consumed in the production of alkali activators for balancing the negative charge of the alumina
if four-fold coordination with the silica [2]. The purity of the sodium hydroxide is almost above 97%,
and pellets and flakes are the two main states of the sodium hydroxide, while a range of SiO2 is varying
from 28 to 37%, Na2O is varying from 8 to 18%, and the percent of water is between 45 to 64% for the
sodium silicate for the reviewed researches as shown in Table 2. These solutions generate a
geopolymeric binder by activating and extracting Si and Al atoms from the binder source materials [2].
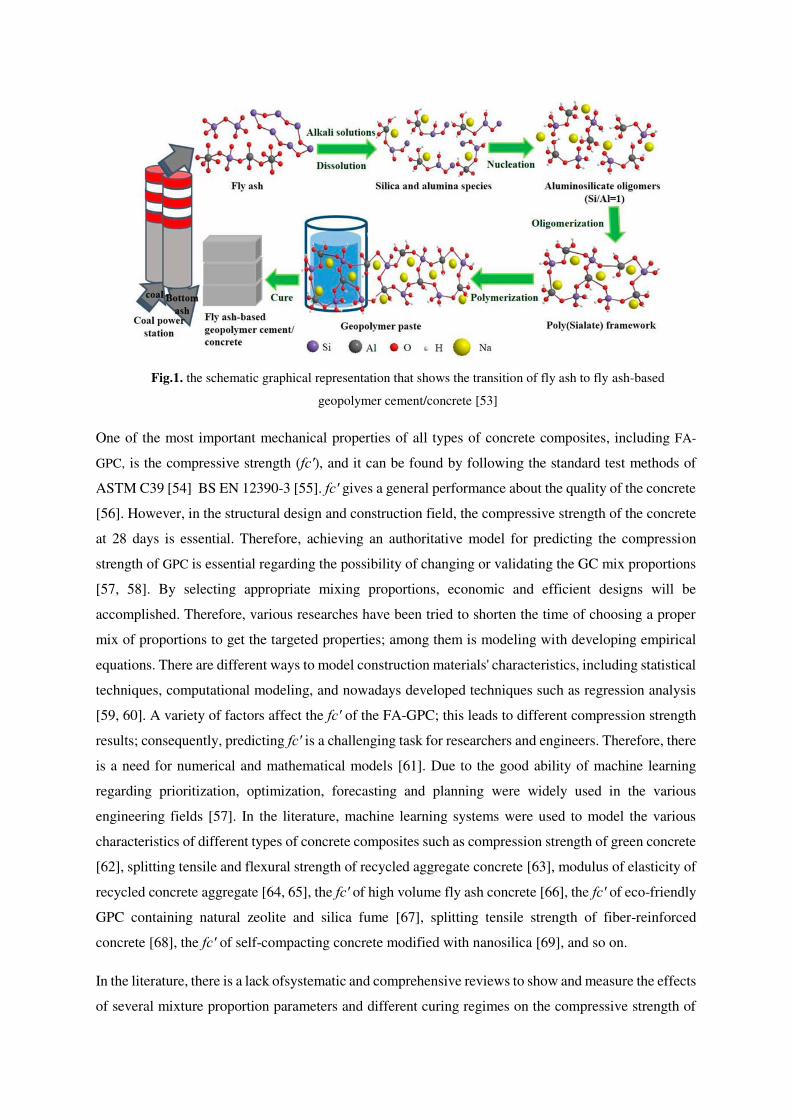
Fig.1. the schematic graphical representation that shows the transition of fly ash to fly ash-based
geopolymer cement/concrete [53]
One of the most important mechanical properties of all types of concrete composites, including FA-
GPC, is the compressive strength (fc′), and it can be found by following the standard test methods of
ASTM C39 [54] BS EN 12390-3 [55]. fc′ gives a general performance about the quality of the concrete
[56]. However, in the structural design and construction field, the compressive strength of the concrete
at 28 days is essential. Therefore, achieving an authoritative model for predicting the compression
strength of GPC is essential regarding the possibility of changing or validating the GC mix proportions
[57, 58]. By selecting appropriate mixing proportions, economic and efficient designs will be
accomplished. Therefore, various researches have been tried to shorten the time of choosing a proper
mix of proportions to get the targeted properties; among them is modeling with developing empirical
equations. There are different ways to model construction materials' characteristics, including statistical
techniques, computational modeling, and nowadays developed techniques such as regression analysis
[59, 60]. A variety of factors affect the fc′ of the FA-GPC; this leads to different compression strength
results; consequently, predicting fc′ is a challenging task for researchers and engineers. Therefore, there
is a need for numerical and mathematical models [61]. Due to the good ability of machine learning
regarding prioritization, optimization, forecasting and planning were widely used in the various
engineering fields [57]. In the literature, machine learning systems were used to model the various
characteristics of different types of concrete composites such as compression strength of green concrete
[62], splitting tensile and flexural strength of recycled aggregate concrete [63], modulus of elasticity of
recycled concrete aggregate [64, 65], the fc′ of high volume fly ash concrete [66], the fc′ of eco-friendly
GPC containing natural zeolite and silica fume [67], splitting tensile strength of fiber-reinforced
concrete [68], the fc′ of self-compacting concrete modified with nanosilica [69], and so on.
In the literature, there is a lack ofsystematic and comprehensive reviews to show and measure the effects
of several mixture proportion parameters and different curing regimes on the compressive strength of
FA-GPC. Therefore, in this study, for the first time influence of several parameters like an alkaline
solution to binder ratio (l/b), fly ash (FA) content, SiO2/Al2O3 (Si/Al) of the FA, fine aggregate (F), and
coarse aggregate (C) content, sodium hydroxide (SH) and sodium silicate (SS) content, the ratio of
sodium silicate to sodium hydroxide (SS/SH), molarity (M), curing temperature (T), curing duration
(CD) inside the oven and specimen ages (A) were investigated to show their influences on the fc′ of the
FA-GPC, and then multi-scale models such as Artificial Neural Network (ANN), M5P-tree (M5P),
Linear Regression (LR), and Multi-logistic Regression (MLR) models were developed to predict the fc′
of the FA-GPC composites at different mixture proportions.
Table.1. Chemical composition of fly ash
References Sp.Gr. SiO2 Al2O3 Fe2O3 CaO MgO K2O Na2O SO3 LOI
[70] - 53.3 26.49 10.86 1.34 0.77 0.8 0.37 1.7 1.39
[71] - 77.1 17.71 1.21 0.62 0.9 - 0.8 2.2 0.87
[72]
- 62.9 25.8 3.1 2.3 0.3 - - - 1.7
- 66.6 25.9 0.9 0.4 0.1 - - - 1.3
- 77.2 15.2 2.5 0.6 0.3 - - - 0.7
- 43.4 26.2 17.4 5.4 1.4 - - - 0.7
- 52.7 33.4 9 1 0.6 - - - 0.4
[73] 1.95 62.5 29.02 4.22 1.1 - - 0.2 0.22 0.52
[74] - 62.1 25.5 4.28 3.96 1.27 - - 0.73 -
[75] 1.95 62.5 29.02 4.22 1.1 - - 0.2 0.22 0.52
[76] 2.13 57.9 31.1 5.07 1.29 0.97 1 0.09 0.05 0.8
[77] 2.42 65.6 26.5 5.49 0.31 0.76 0.23 0.36 0.31 0.41
[78] 2.12 70.3 23.1 1.4 0.2 0.6 0.9 0.4 0.2 2
[79] - 47.8 24.4 17.4 2.42 1.19 0.55 0.31 0.29 1.1
[80] 2.2 62.3 28.1 2.1 0.5 1 1 0.5 0.4 2.5
[81] - 52 33.9 4 1.2 0.81 0.83 0.27 0.28 6.23
[82] - 49 31 3 5 3 1 4 0 0
[83] - 48 29 12.7 1.76 0.89 0.55 0.39 0.5 1.61
[84] - 32.1 19.9 16.91 18.75 3.47 2.38 0.69 2.24 0.07
[85] - 51.5 23.63 15.3 1.74 1.2 0.84 0.38 0.28 1.78
[86] 2.04 59.2 24.36 7.074 2.235 1.4 3.37 0.378 - 1.517
2.3 62.3 21.14 7.347 1.568 2.35 0.73 2.445 - 2.071
[87] 2.05 64.9 26.64 5.69 0.33 0.85 0.25 0.49 0.33 0.45
[88] - 47.8 24.4 17.4 2.42 1.19 0.55 0.31 0.29 1.1
[89] - 59.7 28.36 4.57 2.1 0.83 - 0.04 0.4 1.06
[90] 2.36 37.6 14.79 18.56 19.61 2.7 0.98 0.73 4.81 -
[91] - 53.7 27.2 11.17 11.17 1.9 0.54 0.36 0.3 0.68
[92] 2.54 42.4 21.3 15.7 13.2 2.3 2 0.9 1 0.4
[93] - 50.7 28.8 8.8 2.38 1.39 2.4 0.84 0.3 3.79
[94] - 50.7 28.8 8.8 2.38 1.39 2.4 0.84 0.3 3.79
[95] - 50.5 26.57 13.77 2.13 1.54 0.77 0.45 0.41 0.6
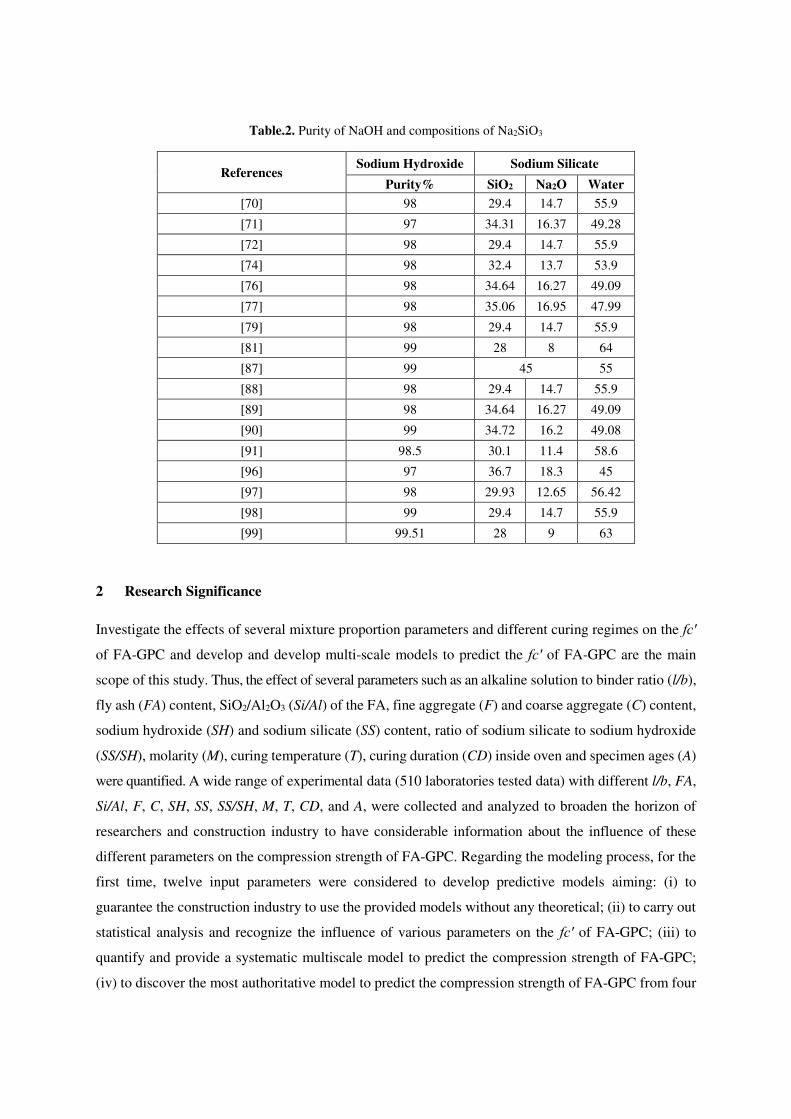
Table.2. Purity of NaOH and compositions of Na2SiO3
References Sodium Hydroxide Sodium Silicate
Purity% SiO2 Na2O Water
[70] 98 29.4 14.7 55.9
[71] 97 34.31 16.37 49.28
[72] 98 29.4 14.7 55.9
[74] 98 32.4 13.7 53.9
[76] 98 34.64 16.27 49.09
[77] 98 35.06 16.95 47.99
[79] 98 29.4 14.7 55.9
[81] 99 28 8 64
[87] 99 45 55
[88] 98 29.4 14.7 55.9
[89] 98 34.64 16.27 49.09
[90] 99 34.72 16.2 49.08
[91] 98.5 30.1 11.4 58.6
[96] 97 36.7 18.3 45
[97] 98 29.93 12.65 56.42
[98] 99 29.4 14.7 55.9
[99] 99.51 28 9 63
2 Research Significance
Investigate the effects of several mixture proportion parameters and different curing regimes on the fc′
of FA-GPC and develop and develop multi-scale models to predict the fc′ of FA-GPC are the main
scope of this study. Thus, the effect of several parameters such as an alkaline solution to binder ratio (l/b),
fly ash (FA) content, SiO2/Al2O3 (Si/Al) of the FA, fine aggregate (F) and coarse aggregate (C) content,
sodium hydroxide (SH) and sodium silicate (SS) content, ratio of sodium silicate to sodium hydroxide
(SS/SH), molarity (M), curing temperature (T), curing duration (CD) inside oven and specimen ages (A)
were quantified. A wide range of experimental data (510 laboratories tested data) with different l/b, FA,
Si/Al, F, C, SH, SS, SS/SH, M, T, CD, and A, were collected and analyzed to broaden the horizon of
researchers and construction industry to have considerable information about the influence of these
different parameters on the compression strength of FA-GPC. Regarding the modeling process, for the
first time, twelve input parameters were considered to develop predictive models aiming: (i) to
guarantee the construction industry to use the provided models without any theoretical; (ii) to carry out
statistical analysis and recognize the influence of various parameters on the fc′ of FA-GPC; (iii) to
quantify and provide a systematic multiscale model to predict the compression strength of FA-GPC;
(iv) to discover the most authoritative model to predict the compression strength of FA-GPC from four
different model techniques (ANN, M5P, LR, and MLR) by applying statistical assessment tools such
as MAE, RMSE, SI, OBJ, and R2.
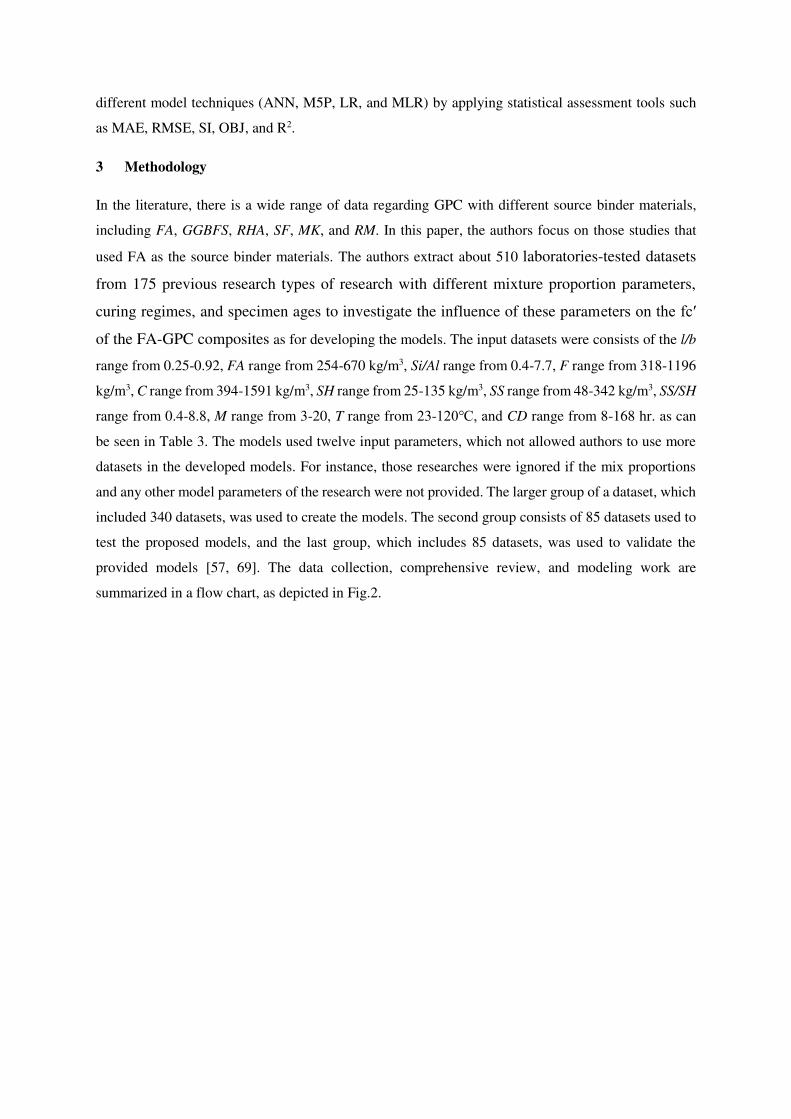
3 Methodology
In the literature, there is a wide range of data regarding GPC with different source binder materials,
including FA, GGBFS, RHA, SF, MK, and RM. In this paper, the authors focus on those studies that
used FA as the source binder materials. The authors extract about 510 laboratories-tested datasets
from 175 previous research types of research with different mixture proportion parameters,
curing regimes, and specimen ages to investigate the influence of these parameters on the fc′
of the FA-GPC composites as for developing the models. The input datasets were consists of the l/b
range from 0.25-0.92, FA range from 254-670 kg/m3, Si/Al range from 0.4-7.7, F range from 318-1196
kg/m3, C range from 394-1591 kg/m3, SH range from 25-135 kg/m3, SS range from 48-342 kg/m3, SS/SH
range from 0.4-8.8, M range from 3-20, T range from 23-120℃, and CD range from 8-168 hr. as can
be seen in Table 3. The models used twelve input parameters, which not allowed authors to use more
datasets in the developed models. For instance, those researches were ignored if the mix proportions
and any other model parameters of the research were not provided. The larger group of a dataset, which
included 340 datasets, was used to create the models. The second group consists of 85 datasets used to
test the proposed models, and the last group, which includes 85 datasets, was used to validate the
provided models [57, 69]. The data collection, comprehensive review, and modeling work are
summarized in a flow chart, as depicted in Fig.2.
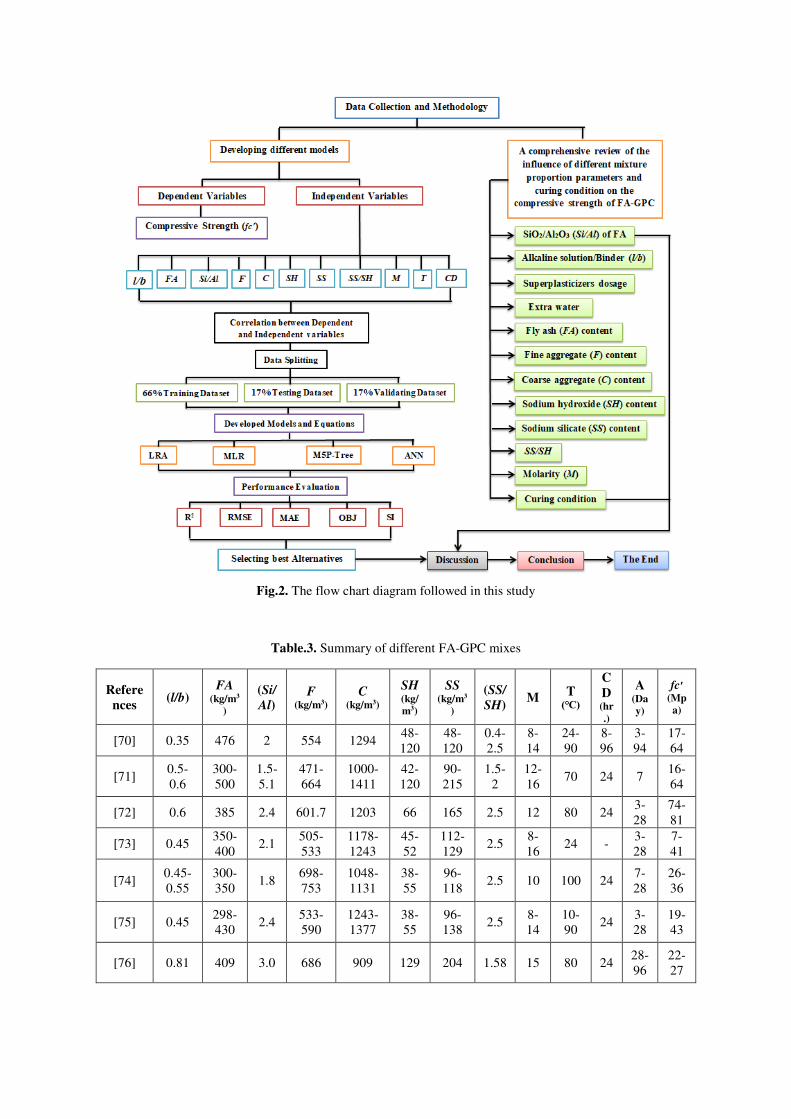
Fig.2. The flow chart diagram followed in this study
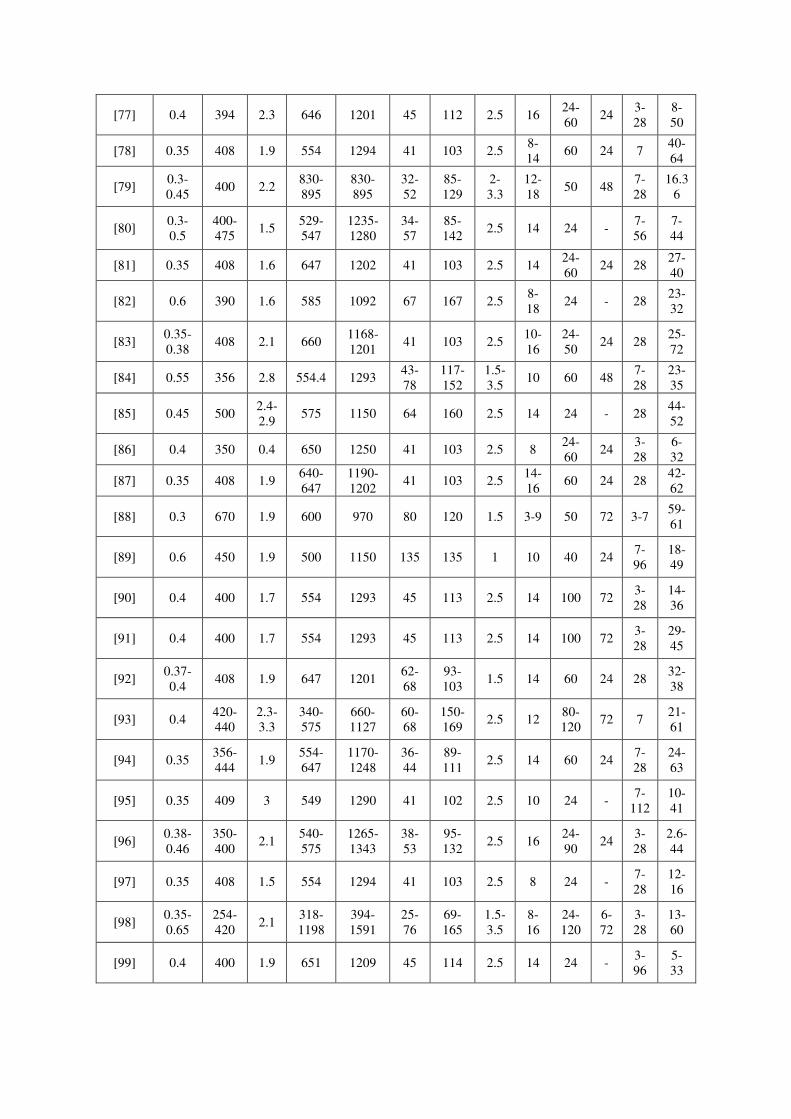
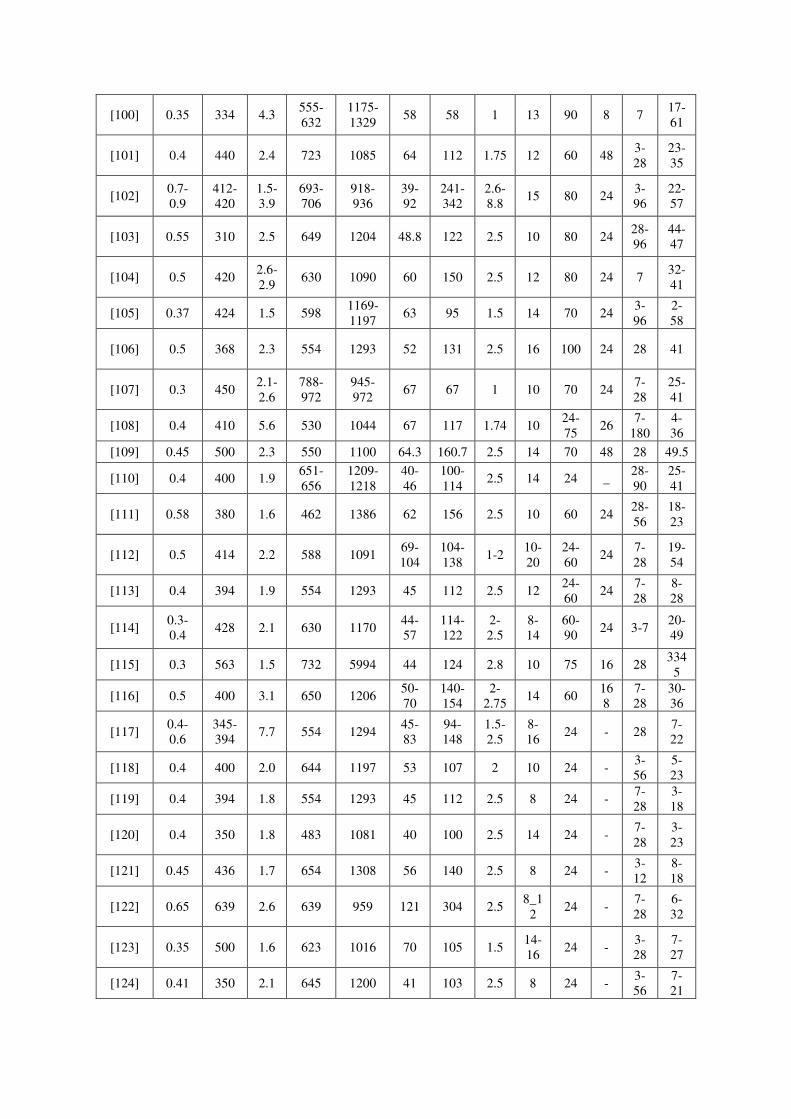
Table.3. Summary of different FA-GPC mixes
Refere
nces (l/b)
FA (kg/m3
)
(Si/
Al) F
(kg/m3) C
(kg/m3)
SH (kg/
m3)
SS (kg/m3
)
(SS/
SH) M
T (℃)
C
D (hr
.)
A (Da
y)
fc′ (Mp
a)
[70] 0.35 476 2 554 1294 48-
120
48-
120
0.4-
2.5
8-
14
24-
90
8-
96
3-
94
17-
64
[71] 0.5-
0.6
300-
500
1.5-
5.1
471-
664
1000-
1411
42-
120
90-
215
1.5-
2
12-
16 70 24 7
16-
64
[72] 0.6 385 2.4 601.7 1203 66 165 2.5 12 80 24 3-
28
74-
81
[73] 0.45 350-
400 2.1
505-
533
1178-
1243
45-
52
112-
129 2.5
8-
16 24 -
3-
28
7-
41
[74] 0.45-
0.55
300-
350 1.8
698-
753
1048-
1131
38-
55
96-
118 2.5 10 100 24
7-
28
26-
36
[75] 0.45 298-
430 2.4
533-
590
1243-
1377
38-
55
96-
138 2.5
8-
14
10-
90 24
3-
28
19-
43
[76] 0.81 409 3.0 686 909 129 204 1.58 15 80 24 28-
96
22-
27
[77] 0.4 394 2.3 646 1201 45 112 2.5 16 24-
60 24
3-
28
8-
50
[78] 0.35 408 1.9 554 1294 41 103 2.5 8-
14 60 24 7
40-
64
[79] 0.3-
0.45 400 2.2
830-
895
830-
895
32-
52
85-
129
2-
3.3
12-
18 50 48
7-
28
16.3
6
[80] 0.3-
0.5
400-
475 1.5
529-
547
1235-
1280
34-
57
85-
142 2.5 14 24 -
7-
56
7-
44
[81] 0.35 408 1.6 647 1202 41 103 2.5 14 24-
60 24 28
27-
40
[82] 0.6 390 1.6 585 1092 67 167 2.5 8-
18 24 - 28
23-
32
[83] 0.35-
0.38 408 2.1 660
1168-
1201 41 103 2.5
10-
16
24-
50 24 28
25-
72
[84] 0.55 356 2.8 554.4 1293 43-
78
117-
152
1.5-
3.5 10 60 48
7-
28
23-
35
[85] 0.45 500 2.4-
2.9 575 1150 64 160 2.5 14 24 - 28
44-
52
[86] 0.4 350 0.4 650 1250 41 103 2.5 8 24-
60 24
3-
28
6-
32
[87] 0.35 408 1.9 640-
647
1190-
1202 41 103 2.5
14-
16 60 24 28
42-
62
[88] 0.3 670 1.9 600 970 80 120 1.5 3-9 50 72 3-7 59-
61
[89] 0.6 450 1.9 500 1150 135 135 1 10 40 24 7-
96
18-
49
[90] 0.4 400 1.7 554 1293 45 113 2.5 14 100 72 3-
28
14-
36
[91] 0.4 400 1.7 554 1293 45 113 2.5 14 100 72 3-
28
29-
45
[92] 0.37-
0.4 408 1.9 647 1201
62-
68
93-
103 1.5 14 60 24 28
32-
38
[93] 0.4 420-
440
2.3-
3.3
340-
575
660-
1127
60-
68
150-
169 2.5 12
80-
120 72 7
21-
61
[94] 0.35 356-
444 1.9
554-
647
1170-
1248
36-
44
89-
111 2.5 14 60 24
7-
28
24-
63
[95] 0.35 409 3 549 1290 41 102 2.5 10 24 - 7-
112
10-
41
[96] 0.38-
0.46
350-
400 2.1
540-
575
1265-
1343
38-
53
95-
132 2.5 16
24-
90 24
3-
28
2.6-
44
[97] 0.35 408 1.5 554 1294 41 103 2.5 8 24 - 7-
28
12-
16
[98] 0.35-
0.65
254-
420 2.1
318-
1198
394-
1591
25-
76
69-
165
1.5-
3.5
8-
16
24-
120
6-
72
3-
28
13-
60
[99] 0.4 400 1.9 651 1209 45 114 2.5 14 24 - 3-
96
5-
33
[100] 0.35 334 4.3 555-
632
1175-
1329 58 58 1 13 90 8 7
17-
61
[101] 0.4 440 2.4 723 1085 64 112 1.75 12 60 48 3-
28
23-
35
[102] 0.7-
0.9
412-
420
1.5-
3.9
693-
706
918-
936
39-
92
241-
342
2.6-
8.8 15 80 24
3-
96
22-
57
[103] 0.55 310 2.5 649 1204 48.8 122 2.5 10 80 24 28-
96
44-
47
[104] 0.5 420 2.6-
2.9 630 1090 60 150 2.5 12 80 24 7
32-
41
[105] 0.37 424 1.5 598 1169-
1197 63 95 1.5 14 70 24
3-
96
2-
58
[106] 0.5 368 2.3 554 1293 52 131 2.5 16 100 24 28 41
[107] 0.3 450 2.1-
2.6
788-
972
945-
972 67 67 1 10 70 24
7-
28
25-
41
[108] 0.4 410 5.6 530 1044 67 117 1.74 10 24-
75 26
7-
180
4-
36
[109] 0.45 500 2.3 550 1100 64.3 160.7 2.5 14 70 48 28 49.5
[110] 0.4 400 1.9 651-
656
1209-
1218
40-
46
100-
114 2.5 14 24 _
28-
90
25-
41
[111] 0.58 380 1.6 462 1386 62 156 2.5 10 60 24 28-
56
18-
23
[112] 0.5 414 2.2 588 1091 69-
104
104-
138 1-2
10-
20
24-
60 24
7-
28
19-
54
[113] 0.4 394 1.9 554 1293 45 112 2.5 12 24-
60 24
7-
28
8-
28
[114] 0.3-
0.4 428 2.1 630 1170
44-
57
114-
122
2-
2.5
8-
14
60-
90 24 3-7
20-
49
[115] 0.3 563 1.5 732 5994 44 124 2.8 10 75 16 28 334
5
[116] 0.5 400 3.1 650 1206 50-
70
140-
154
2-
2.75 14 60
16
8
7-
28
30-
36
[117] 0.4-
0.6
345-
394 7.7 554 1294
45-
83
94-
148
1.5-
2.5
8-
16 24 - 28
7-
22
[118] 0.4 400 2.0 644 1197 53 107 2 10 24 - 3-
56
5-
23
[119] 0.4 394 1.8 554 1293 45 112 2.5 8 24 - 7-
28
3-
18
[120] 0.4 350 1.8 483 1081 40 100 2.5 14 24 - 7-
28
3-
23
[121] 0.45 436 1.7 654 1308 56 140 2.5 8 24 - 3-
12
8-
18
[122] 0.65 639 2.6 639 959 121 304 2.5 8_1
2 24 -
7-
28
6-
32
[123] 0.35 500 1.6 623 1016 70 105 1.5 14-
16 24 -
3-
28
7-
27
[124] 0.41 350 2.1 645 1200 41 103 2.5 8 24 - 3-
56
7-
21
Remar
ks
(Range
d are
Varies
Betwe
en)
0.25-
0.92
254
-
670
0.4
-
7.7
318
-
1196
394
-
1591
25
-
135
48
-
342
0.4
–
8.8
3
-
20
23
-
120
8
-
16
8
3
-
11
2
2
-
64
*(l/b) is the alkaline liquid to binder ratio, (FA) is a fly ash content (Kg/m3), (Si/Al) is a (SiO2/Al2O3) ratio of
fly ash, (F) is a fine aggregate content (Kg/m3), (C) is a coarse aggregate content (Kg/m3), (SH) is a sodium
hydroxide content (Kg/m3), (SS) is a sodium silicate content (Kg/m3), (SS/SH) is the ratio of sodium silicate
to sodium hydroxide of the mix, (M) is the molarity (concentration of sodium hydroxide) of the mix, (T) is
the curing temperature of the specimens and this is may be ambient curing or heat curing inside an oven (℃),
(CD) is the curing duration inside an oven (hr.), (A) is the age of samples at the time of testing (days) and fc′
is the measured compressive strength (MPa).
4 Effect of mixture proportion parameters on the compressive strength of FA-GPC
4.1 Chemical composition of fly-ash (SiO2/Al2O3) (Si/Al)
In the literature, a variety of fly ashes with slightly different chemical compositions, specific surfaces
and specific gravity were used to prepare the GPC. Based on the ASTM C618 [29], ash with the
summation of their SiO2+Al2O3+Fe2O3 greater than 70% can be known as fly ash. To investigate the
effect of mixed compositions on the fc′ and microstructure of FA-GPC an experimental laboratory
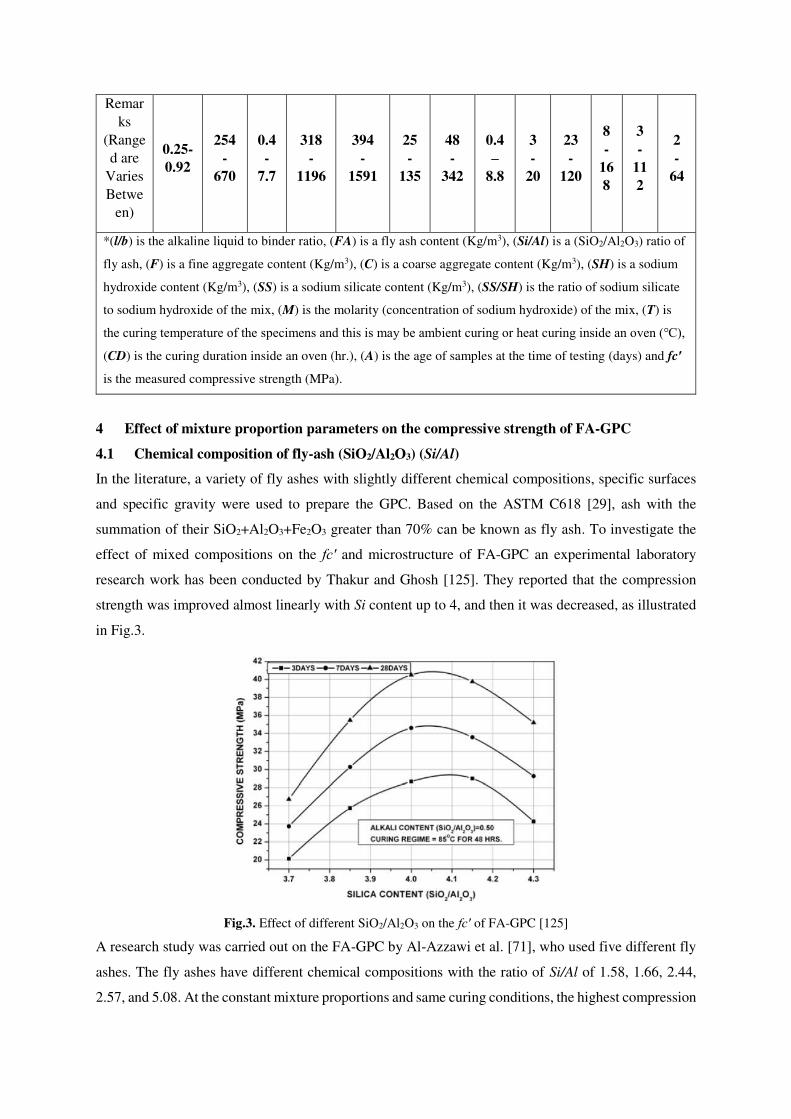
research work has been conducted by Thakur and Ghosh [125]. They reported that the compression
strength was improved almost linearly with Si content up to 4, and then it was decreased, as illustrated
in Fig.3.
Fig.3. Effect of different SiO2/Al2O3 on the fc′ of FA-GPC [125]
A research study was carried out on the FA-GPC by Al-Azzawi et al. [71], who used five different fly
ashes. The fly ashes have different chemical compositions with the ratio of Si/Al of 1.58, 1.66, 2.44,
2.57, and 5.08. At the constant mixture proportions and same curing conditions, the highest compression
strength was recorded for the fly ash with Si/Al ratio of 1.66, which it is 34 MPa. This value is
significantly higher than the other fly ashes by 20.5%, 38.2%, 41.2%, and 44.1% for the Si/Al of 1.58,
2.44, 2.57 and 5.08, respectively. This result may be attributed to the different properties of different
fly ashes that lead to different extent of geopolymerization between the alkaline activator and the fly
ashes, which influences the fc′ of the GPC. In addition, the different extent of the geopolymerization
process affects the microstructure of the FA-GPC, which in turn affects the compressive strength of the
GPC [71]. In the same context, an experimental study had been conducted to investigate the mechanical
and durability properties of FA-GPC with the inclusion of two different types of fly ashes. At ambient
curing temperature, the fc′ was 51.6 and 44.8 MPa at the age of 28 days for the Si/Al ratio of 2.43 and
2.95, respectively. At the same time, the CaO content for the Si/Al of 2.43 was greater than 2.95 [85].
This result was attributed to the lower content of CaO and low activity of fly ash [126, 127].
Furthermore, to investigate the long-term permeation characteristics of the GPC, four different types of
fly ashes were used to prepare FA-GPC. Their results claimed that the highest fc′ was achieved for the
GPC with the Si/Al of 1.71, and the lowest compression strength was recorded to Si/Al of 1.8, while the
other fly ash types fell between the two. Moreover, all their GPC mixtures archived almost 70% of their
one-year compression strength at 3 days; for instance, the GPC with Si/Al of 1.71 displayed about a 20
MPa strength increment between three and 365 days [102]. These results revealed that there is a
continuation in the geopolymerization process which leads to improvement in the compressive strength
of different types of FA-GPC. This output is in contrast to the past studies on FA-GPC, which have
recorded little subsequent improvement in the fc′ for the heat curing conditions [70, 128, 129].
In addition, another research study had been carried out on the mechanical characteristics of geopolymer
concrete which they used three different fly ashes with different chemical compositions. In the
controlled heat curing conditions and constant mixture proportions, fc′ values were 32.1, 41, and 36.6
MPa for the Si/Al of the fly ash of 2.9, 2.78, and 2.6, respectively [104]. Scanning Electron Microscopy
(SEM) examined the results behind different compressive strength values. They reported that the
samples made from the fly ash with Si/Al of 2.78 have the highest degree of reacted fly ash spheres,
which participated in the greatest compression strength. This result was reported by other researchers
who claimed that the total reacted Si/Al is crucial to the progress in the polymerization of the FA-GPC
process [70, 128]. In addition, it was observed that with the increase of Si/Al ratio, compression strength
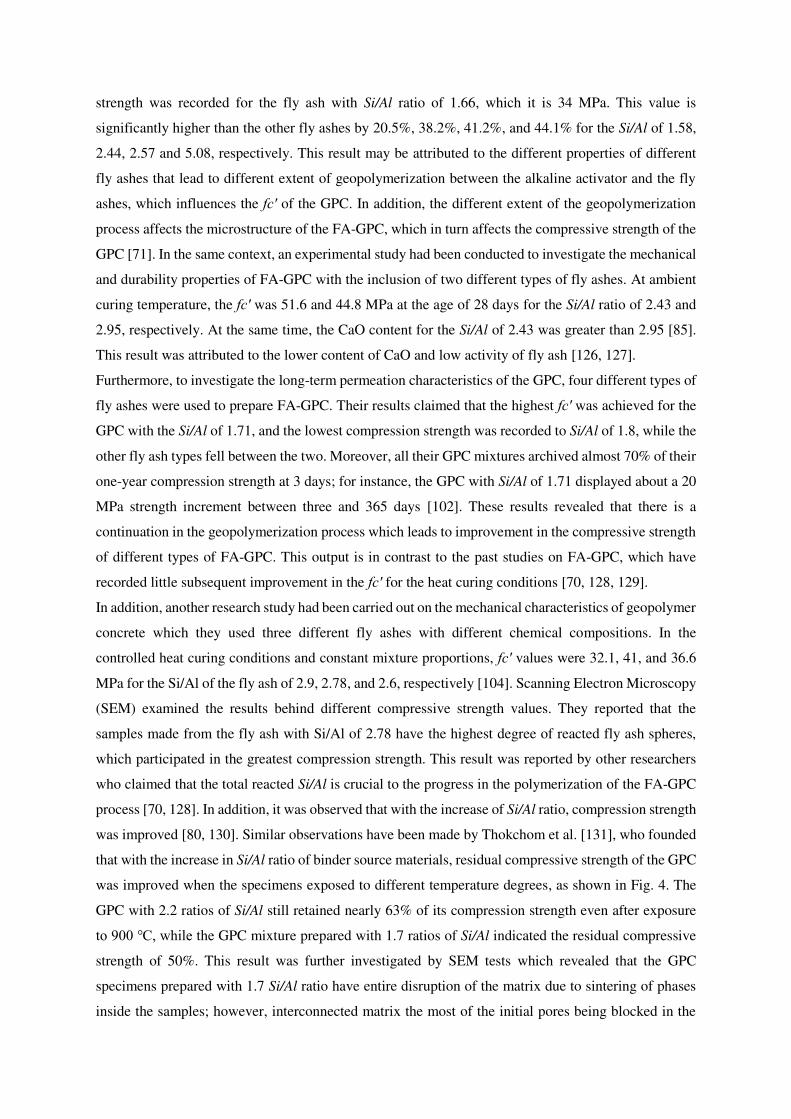
was improved [80, 130]. Similar observations have been made by Thokchom et al. [131], who founded
that with the increase in Si/Al ratio of binder source materials, residual compressive strength of the GPC
was improved when the specimens exposed to different temperature degrees, as shown in Fig. 4. The
GPC with 2.2 ratios of Si/Al still retained nearly 63% of its compression strength even after exposure
to 900 ℃, while the GPC mixture prepared with 1.7 ratios of Si/Al indicated the residual compressive
strength of 50%. This result was further investigated by SEM tests which revealed that the GPC
specimens prepared with 1.7 Si/Al ratio have entire disruption of the matrix due to sintering of phases
inside the samples; however, interconnected matrix the most of the initial pores being blocked in the
heating process. While GPC made with Si/Al of 2.2 presents a relatively undisturbed matrix except at
little places [131].
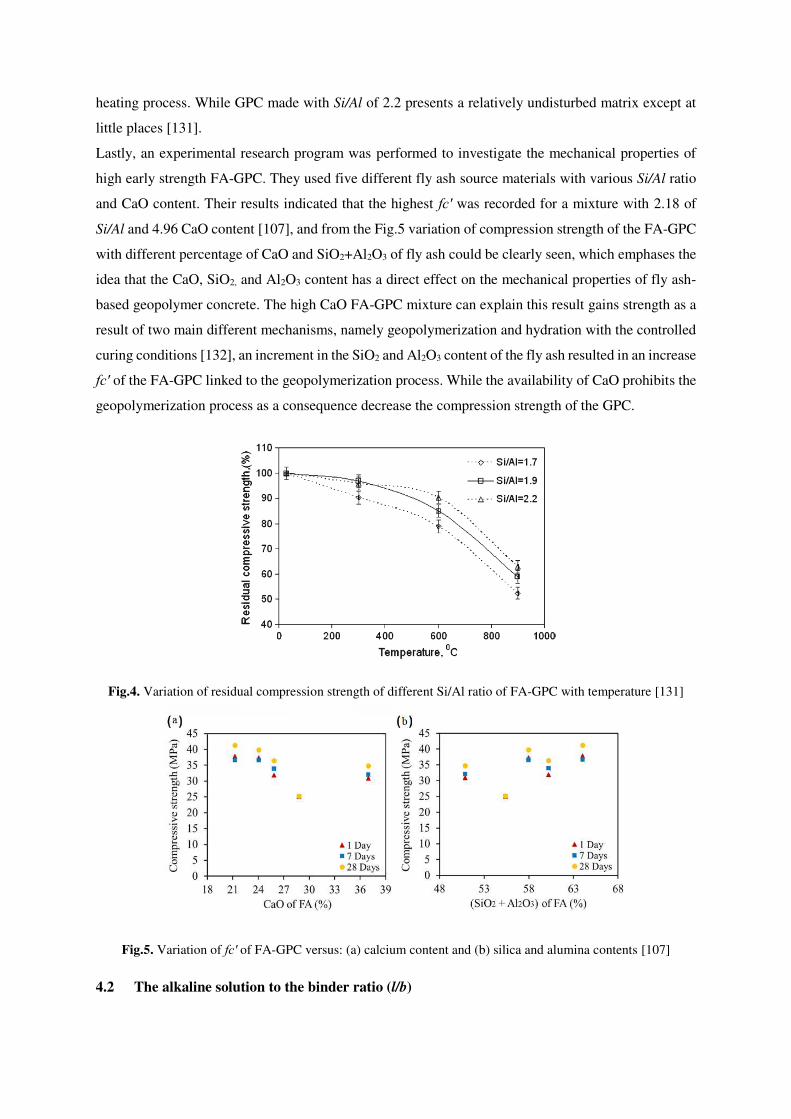
Lastly, an experimental research program was performed to investigate the mechanical properties of
high early strength FA-GPC. They used five different fly ash source materials with various Si/Al ratio
and CaO content. Their results indicated that the highest fc′ was recorded for a mixture with 2.18 of
Si/Al and 4.96 CaO content [107], and from the Fig.5 variation of compression strength of the FA-GPC
with different percentage of CaO and SiO2+Al2O3 of fly ash could be clearly seen, which emphases the
idea that the CaO, SiO2, and Al2O3 content has a direct effect on the mechanical properties of fly ash-
based geopolymer concrete. The high CaO FA-GPC mixture can explain this result gains strength as a
result of two main different mechanisms, namely geopolymerization and hydration with the controlled
curing conditions [132], an increment in the SiO2 and Al2O3 content of the fly ash resulted in an increase
fc′ of the FA-GPC linked to the geopolymerization process. While the availability of CaO prohibits the
geopolymerization process as a consequence decrease the compression strength of the GPC.
Fig.4. Variation of residual compression strength of different Si/Al ratio of FA-GPC with temperature [131]
Fig.5. Variation of fc′ of FA-GPC versus: (a) calcium content and (b) silica and alumina contents [107]
4.2 The alkaline solution to the binder ratio (l/b)
The alkaline solution is the summation of the sodium hydroxide and sodium silicate content, while the
binder content is the total weight or volume of the fly ash or other source binder materials in the mixture
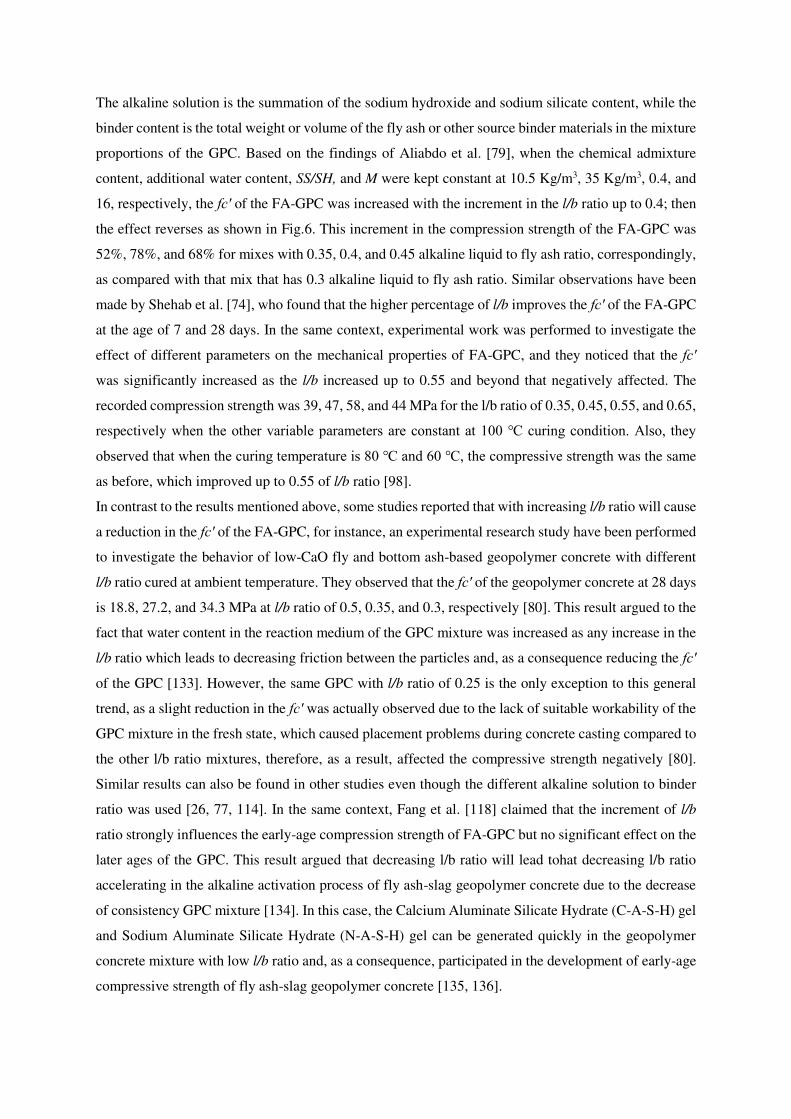
proportions of the GPC. Based on the findings of Aliabdo et al. [79], when the chemical admixture
content, additional water content, SS/SH, and M were kept constant at 10.5 Kg/m3, 35 Kg/m3, 0.4, and
16, respectively, the fc′ of the FA-GPC was increased with the increment in the l/b ratio up to 0.4; then
the effect reverses as shown in Fig.6. This increment in the compression strength of the FA-GPC was
52%, 78%, and 68% for mixes with 0.35, 0.4, and 0.45 alkaline liquid to fly ash ratio, correspondingly,
as compared with that mix that has 0.3 alkaline liquid to fly ash ratio. Similar observations have been
made by Shehab et al. [74], who found that the higher percentage of l/b improves the fc′ of the FA-GPC
at the age of 7 and 28 days. In the same context, experimental work was performed to investigate the
effect of different parameters on the mechanical properties of FA-GPC, and they noticed that the fc′
was significantly increased as the l/b increased up to 0.55 and beyond that negatively affected. The
recorded compression strength was 39, 47, 58, and 44 MPa for the l/b ratio of 0.35, 0.45, 0.55, and 0.65,
respectively when the other variable parameters are constant at 100 ℃ curing condition. Also, they
observed that when the curing temperature is 80 ℃ and 60 ℃, the compressive strength was the same
as before, which improved up to 0.55 of l/b ratio [98].
In contrast to the results mentioned above, some studies reported that with increasing l/b ratio will cause
a reduction in the fc′ of the FA-GPC, for instance, an experimental research study have been performed
to investigate the behavior of low-CaO fly and bottom ash-based geopolymer concrete with different
l/b ratio cured at ambient temperature. They observed that the fc′ of the geopolymer concrete at 28 days
is 18.8, 27.2, and 34.3 MPa at l/b ratio of 0.5, 0.35, and 0.3, respectively [80]. This result argued to the
fact that water content in the reaction medium of the GPC mixture was increased as any increase in the
l/b ratio which leads to decreasing friction between the particles and, as a consequence reducing the fc′
of the GPC [133]. However, the same GPC with l/b ratio of 0.25 is the only exception to this general
trend, as a slight reduction in the fc′ was actually observed due to the lack of suitable workability of the
GPC mixture in the fresh state, which caused placement problems during concrete casting compared to
the other l/b ratio mixtures, therefore, as a result, affected the compressive strength negatively [80].
Similar results can also be found in other studies even though the different alkaline solution to binder
ratio was used [26, 77, 114]. In the same context, Fang et al. [118] claimed that the increment of l/b
ratio strongly influences the early-age compression strength of FA-GPC but no significant effect on the
later ages of the GPC. This result argued that decreasing l/b ratio will lead tohat decreasing l/b ratio
accelerating in the alkaline activation process of fly ash-slag geopolymer concrete due to the decrease
of consistency GPC mixture [134]. In this case, the Calcium Aluminate Silicate Hydrate (C-A-S-H) gel
and Sodium Aluminate Silicate Hydrate (N-A-S-H) gel can be generated quickly in the geopolymer
concrete mixture with low l/b ratio and, as a consequence, participated in the development of early-age
compressive strength of fly ash-slag geopolymer concrete [135, 136].
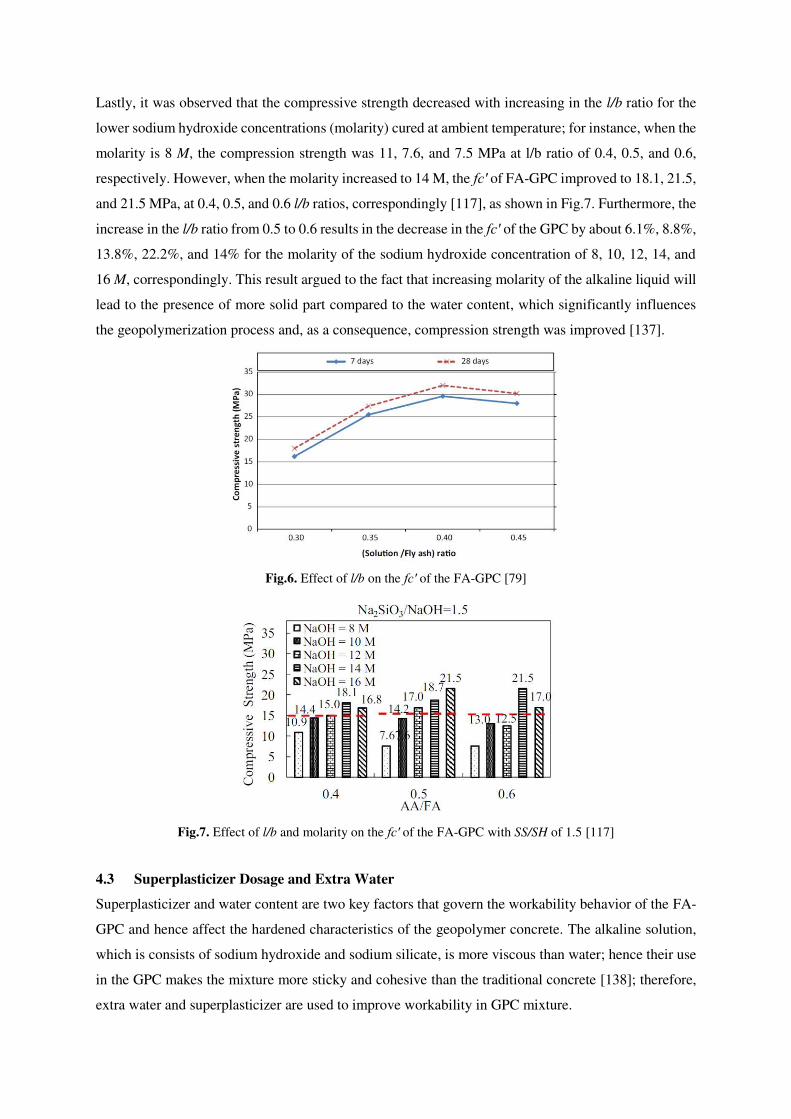
Lastly, it was observed that the compressive strength decreased with increasing in the l/b ratio for the
lower sodium hydroxide concentrations (molarity) cured at ambient temperature; for instance, when the
molarity is 8 M, the compression strength was 11, 7.6, and 7.5 MPa at l/b ratio of 0.4, 0.5, and 0.6,
respectively. However, when the molarity increased to 14 M, the fc′ of FA-GPC improved to 18.1, 21.5,
and 21.5 MPa, at 0.4, 0.5, and 0.6 l/b ratios, correspondingly [117], as shown in Fig.7. Furthermore, the
increase in the l/b ratio from 0.5 to 0.6 results in the decrease in the fc′ of the GPC by about 6.1%, 8.8%,
13.8%, 22.2%, and 14% for the molarity of the sodium hydroxide concentration of 8, 10, 12, 14, and
16 M, correspondingly. This result argued to the fact that increasing molarity of the alkaline liquid will
lead to the presence of more solid part compared to the water content, which significantly influences
the geopolymerization process and, as a consequence, compression strength was improved [137].
Fig.6. Effect of l/b on the fc′ of the FA-GPC [79]
Fig.7. Effect of l/b and molarity on the fc′ of the FA-GPC with SS/SH of 1.5 [117]
4.3 Superplasticizer Dosage and Extra Water Superplasticizer and water content are two key factors that govern the workability behavior of the FA-
GPC and hence affect the hardened characteristics of the geopolymer concrete. The alkaline solution,
which is consists of sodium hydroxide and sodium silicate, is more viscous than water; hence their use
in the GPC makes the mixture more sticky and cohesive than the traditional concrete [138]; therefore,
extra water and superplasticizer are used to improve workability in GPC mixture.
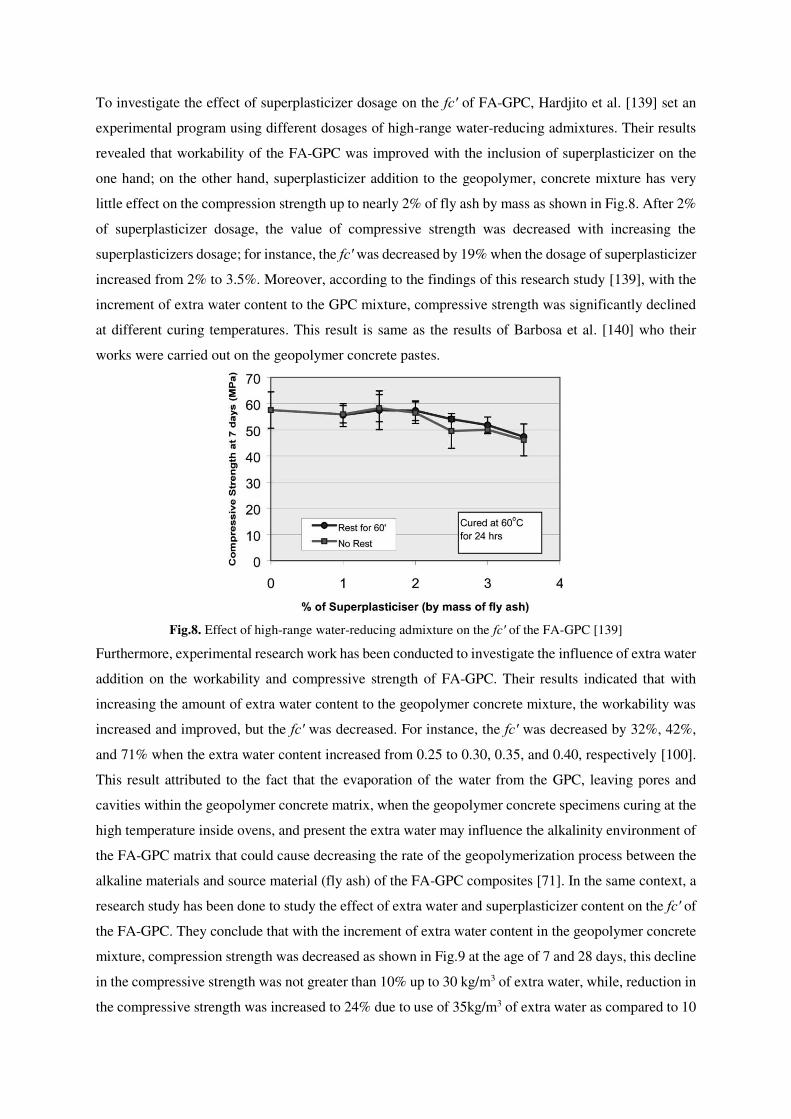
To investigate the effect of superplasticizer dosage on the fc′ of FA-GPC, Hardjito et al. [139] set an
experimental program using different dosages of high-range water-reducing admixtures. Their results
revealed that workability of the FA-GPC was improved with the inclusion of superplasticizer on the
one hand; on the other hand, superplasticizer addition to the geopolymer, concrete mixture has very
little effect on the compression strength up to nearly 2% of fly ash by mass as shown in Fig.8. After 2%
of superplasticizer dosage, the value of compressive strength was decreased with increasing the
superplasticizers dosage; for instance, the fc′ was decreased by 19% when the dosage of superplasticizer
increased from 2% to 3.5%. Moreover, according to the findings of this research study [139], with the
increment of extra water content to the GPC mixture, compressive strength was significantly declined
at different curing temperatures. This result is same as the results of Barbosa et al. [140] who their
works were carried out on the geopolymer concrete pastes.
Fig.8. Effect of high-range water-reducing admixture on the fc′ of the FA-GPC [139]
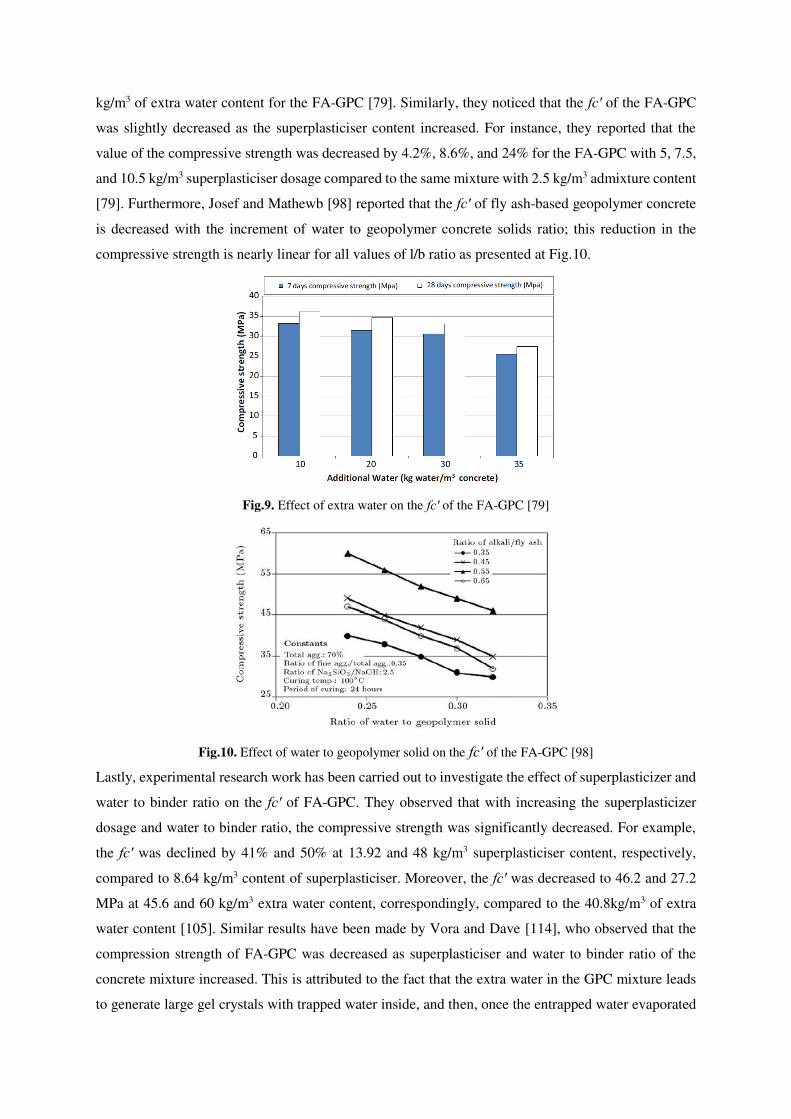
Furthermore, experimental research work has been conducted to investigate the influence of extra water
addition on the workability and compressive strength of FA-GPC. Their results indicated that with
increasing the amount of extra water content to the geopolymer concrete mixture, the workability was
increased and improved, but the fc′ was decreased. For instance, the fc′ was decreased by 32%, 42%,
and 71% when the extra water content increased from 0.25 to 0.30, 0.35, and 0.40, respectively [100].
This result attributed to the fact that the evaporation of the water from the GPC, leaving pores and
cavities within the geopolymer concrete matrix, when the geopolymer concrete specimens curing at the
high temperature inside ovens, and present the extra water may influence the alkalinity environment of
the FA-GPC matrix that could cause decreasing the rate of the geopolymerization process between the
alkaline materials and source material (fly ash) of the FA-GPC composites [71]. In the same context, a
research study has been done to study the effect of extra water and superplasticizer content on the fc′ of
the FA-GPC. They conclude that with the increment of extra water content in the geopolymer concrete
mixture, compression strength was decreased as shown in Fig.9 at the age of 7 and 28 days, this decline
in the compressive strength was not greater than 10% up to 30 kg/m3 of extra water, while, reduction in
the compressive strength was increased to 24% due to use of 35kg/m3 of extra water as compared to 10
kg/m3 of extra water content for the FA-GPC [79]. Similarly, they noticed that the fc′ of the FA-GPC
was slightly decreased as the superplasticiser content increased. For instance, they reported that the
value of the compressive strength was decreased by 4.2%, 8.6%, and 24% for the FA-GPC with 5, 7.5,
and 10.5 kg/m3 superplasticiser dosage compared to the same mixture with 2.5 kg/m3 admixture content
[79]. Furthermore, Josef and Mathewb [98] reported that the fc′ of fly ash-based geopolymer concrete
is decreased with the increment of water to geopolymer concrete solids ratio; this reduction in the
compressive strength is nearly linear for all values of l/b ratio as presented at Fig.10.
Fig.9. Effect of extra water on the fc′ of the FA-GPC [79]
Fig.10. Effect of water to geopolymer solid on the fc′ of the FA-GPC [98]
Lastly, experimental research work has been carried out to investigate the effect of superplasticizer and
water to binder ratio on the fc′ of FA-GPC. They observed that with increasing the superplasticizer
dosage and water to binder ratio, the compressive strength was significantly decreased. For example,
the fc′ was declined by 41% and 50% at 13.92 and 48 kg/m3 superplasticiser content, respectively,
compared to 8.64 kg/m3 content of superplasticiser. Moreover, the fc′ was decreased to 46.2 and 27.2
MPa at 45.6 and 60 kg/m3 extra water content, correspondingly, compared to the 40.8kg/m3 of extra
water content [105]. Similar results have been made by Vora and Dave [114], who observed that the
compression strength of FA-GPC was decreased as superplasticiser and water to binder ratio of the
concrete mixture increased. This is attributed to the fact that the extra water in the GPC mixture leads
to generate large gel crystals with trapped water inside, and then, once the entrapped water evaporated
in the mixture, it produces a highly porous matrix, as a consequence, it causes a decrease in the fc′ and
increases the absorption capacity of the GPC [141]. Overall, high amount of water and superplasticiser
content than the solid parts in the geopolymer concrete mixture cause to a reduction in the compression
strength of the GPC composite as a result of decreasing contact among activating solution and the source
reacting material [26, 142].
4.4 Fly ash content
Fly ash (FA) is widely used as a source material for making geopolymer concrete due to its low cost,
abundance availability, and higher potential for preparation geopolymers [25, 26]. The content of fly
ash in the mixture proportions of different fly ash-based geopolymer concrete for the collected data
varied from 254 to 670 kg/m3. The FAs have different chemical compositions with different specific
gravity range from 1.95 to 2.54.
An experimental laboratory research work has been carried out to investigate the influence of different
fly ash contents on the bond and compressive strength of FA-GPC; they claimed that with the increment
in the fly ash content, bond and compression strength of the GPC were improved. The maximum
increment in the fc′ of three different fly ash content for five different fly ash binder source materials
(ER, MP, BW, GL, and CL) were 19%, 23%, 17%, 36%, and 25%, respectively, when the fly ash
content changed from 300 kg/m3 to 500 kg/m3 [71]. This result (based on their SEM tests) argued the
fact that higher content of fly ash in the geopolymer concrete mixture gives denser and compacted
microstructure to the geopolymer concrete matrix. Moreover, the particles of fly ash facilitate
movement among the aggregate particles owing to the spherical shape and smooth surface of the
particles of fly ash [143]; therefore, reducing the fly ash content decreases the capability of the FA-GPC
components to consolidate and compact properly, as a consequence bond and compression strength
were decreased in one hand, on the other hand, the volume of fine fraction particles in the geopolymer
concrete matrix increased as the fly ash content increased, thus in turn fill the voids and pores between
the aggregate particles and hence compressive strength was improved [71]. Similar results of increasing
fc′ of FA-GPC with increasing fly ash content were reported at both heat curing and ambient curing
regimes [74, 96]. For instance, the value of compression strength changed from 21 MPa to 42 MPa, as
the fly ash content increased from 300 to 400 kg/m3 [96].
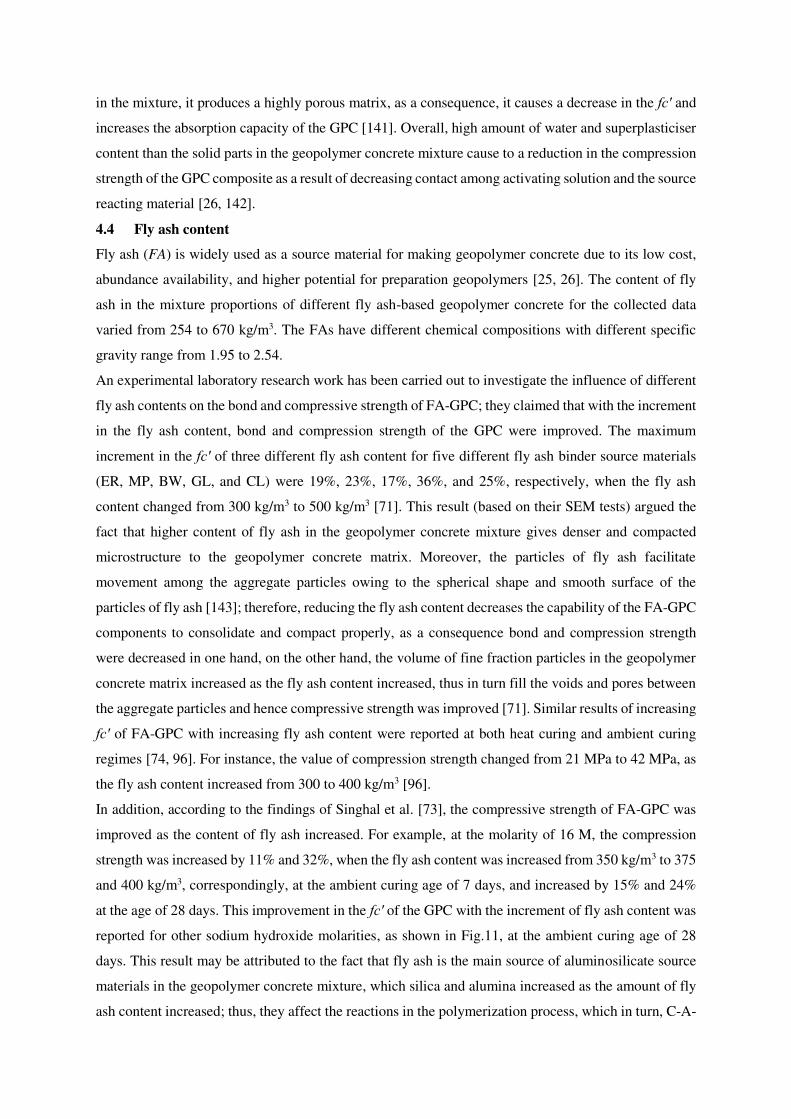
In addition, according to the findings of Singhal et al. [73], the compressive strength of FA-GPC was
improved as the content of fly ash increased. For example, at the molarity of 16 M, the compression
strength was increased by 11% and 32%, when the fly ash content was increased from 350 kg/m3 to 375
and 400 kg/m3, correspondingly, at the ambient curing age of 7 days, and increased by 15% and 24%
at the age of 28 days. This improvement in the fc′ of the GPC with the increment of fly ash content was
reported for other sodium hydroxide molarities, as shown in Fig.11, at the ambient curing age of 28
days. This result may be attributed to the fact that fly ash is the main source of aluminosilicate source
materials in the geopolymer concrete mixture, which silica and alumina increased as the amount of fly
ash content increased; thus, they affect the reactions in the polymerization process, which in turn, C-A-
S-H and N-A-S-H gels increased, and finally, compression strength was improved [73]. In the same
context, a research study have been conducted to investigate the properties of FA-GPC, they used
different contents of fly ash and they observed that the compressive strength of the fly ash-based
geopolymer concrete was increased as the fly ash content increased. For example, the compressive
strength was 25.44, 36, and 48 MPa, at 356, 408, and 444 kg/m3 of fly ash content, respectively. These
findings are attributed as the same as mentioned before [94]. Similarly, Ramujeea and PothaRajub [77]
observed that the compressive strength was increased as fly ash content increased as fly ash content
increased in the geopolymer concrete mixture. Overall, most of the researches revealed that the fc′ of
FA-GPC increased with the increment of fly ash content in the geopolymer concrete mixture, and it is
obvious that the fly ash with more fineness and glassy phase is more reactive, which leads to
accelerating geopolymerization rate and as a consequence produces a high strength geopolymer
concrete [20, 144, 145].
Fig.11. The compression strength of FA-GPC with various FA content and molarity at ambient curing condition
[73]
4.5 Aggregate Content
Aggregates in the geopolymer concrete mixtures are the same as a conventional concrete mixture which
consists of fine and coarse aggregates. In past studies, river and crushed sand with a maximum particle
size of 4.75 mm and a specific gravity of 2.60-2.75 were employed as fine aggregate. Its grade also met
the requirements of ASTM C 33 [146]. On the other hand, natural gravel or artificial crushed stone with
the nominal aggregate size of 20 mm was used in the previous research as the coarse aggregate to
prepare the coarse aggregate to prepare the coarse aggregate to prepare the fly ash-based geopolymer
concrete mixtures. Based on the collected datasets from different fly ash-based geopolymer concrete
mixture proportions, coarse aggregate content was varying between 394 to 1591 kg/m3.
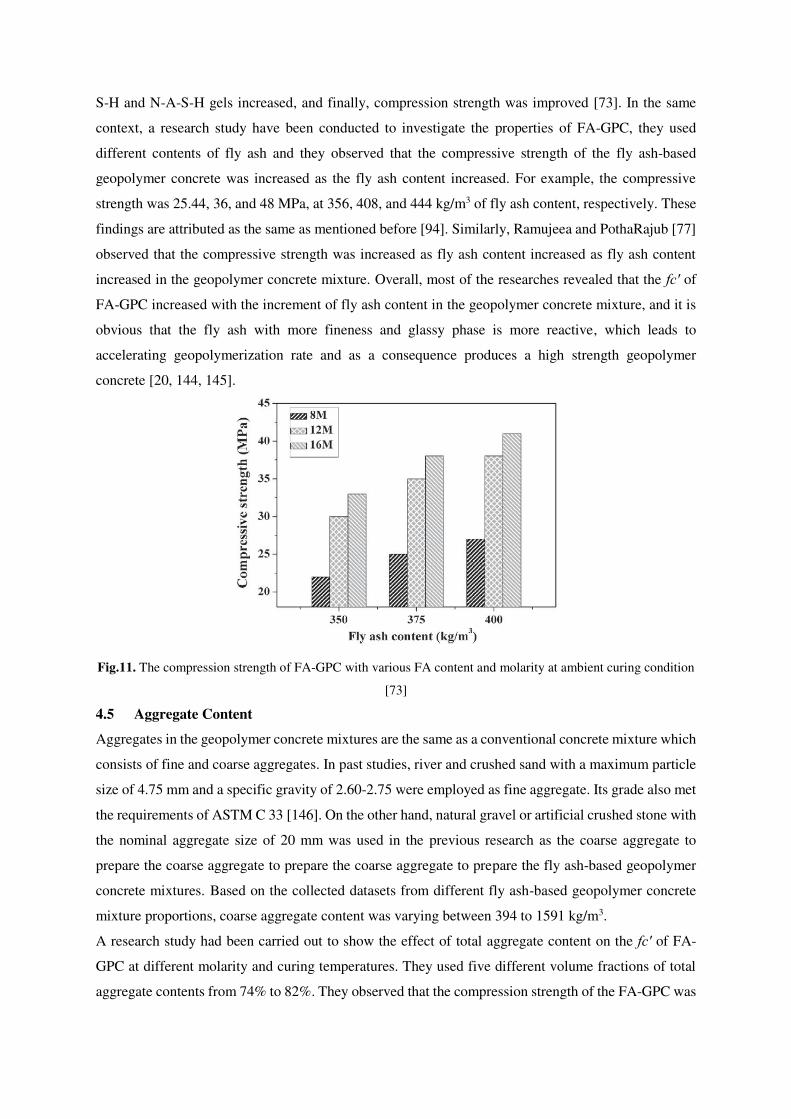
A research study had been carried out to show the effect of total aggregate content on the fc′ of FA-
GPC at different molarity and curing temperatures. They used five different volume fractions of total
aggregate contents from 74% to 82%. They observed that the compression strength of the FA-GPC was
increased with increasing total aggregate content up to 78%, and they revealed that this result might be
argued to the inadequate binding of the aggregate and the matrix phase in the fly ash-based geopolymer
concrete mixture. In addition, they reported that the highest compressive strength was achieved for the
geopolymer concrete mixture with 78% of total aggregate content at 60 ℃ curing condition as shown
if the Fig.12, but this percent of aggregate content leads to a reduction of the workability by 37.5% as
compared to the GPC mixture with 76% of aggregate content, so they prefer to use 76% of total
aggregate content having the molarity of 12 M and cured at 90 ℃ as it yields low reduction in the
compressive strength (about 2.6%) without hindering the slump value of the FA-GPC mixture [75].
Fig.12. Effect of total aggregate content on the fc′ of FA-GPC at the age of 3, 7, and 28 days [75]
In addition, experimental research work has been conducted on the effect of aggregate characteristics
on the mechanical and absorption properties of fly ash-based geopolymer mortars. They used three
different types of aggregates: river sand, crushed sand, and combined river and crushed sand. They
reported that the geopolymer mortar mixtures' compression strength was between 28.2 to 47.8 MPa at
the age of 1 day when the molarity was 12 M, the ratio of sodium silicate to sodium hydroxide was 2.5,
and the specimens cured at 90 ℃ for 24 hr. It was revealed that the geopolymer mixture with crushed
sand had higher compression strength as compared to the other aggregates. This result was attributed to
the fact that the crushed sand has a rough surface texture with an angular shape which gives a greater
surface to volume ratio and, as a consequence, provides better bond properties between the aggregates
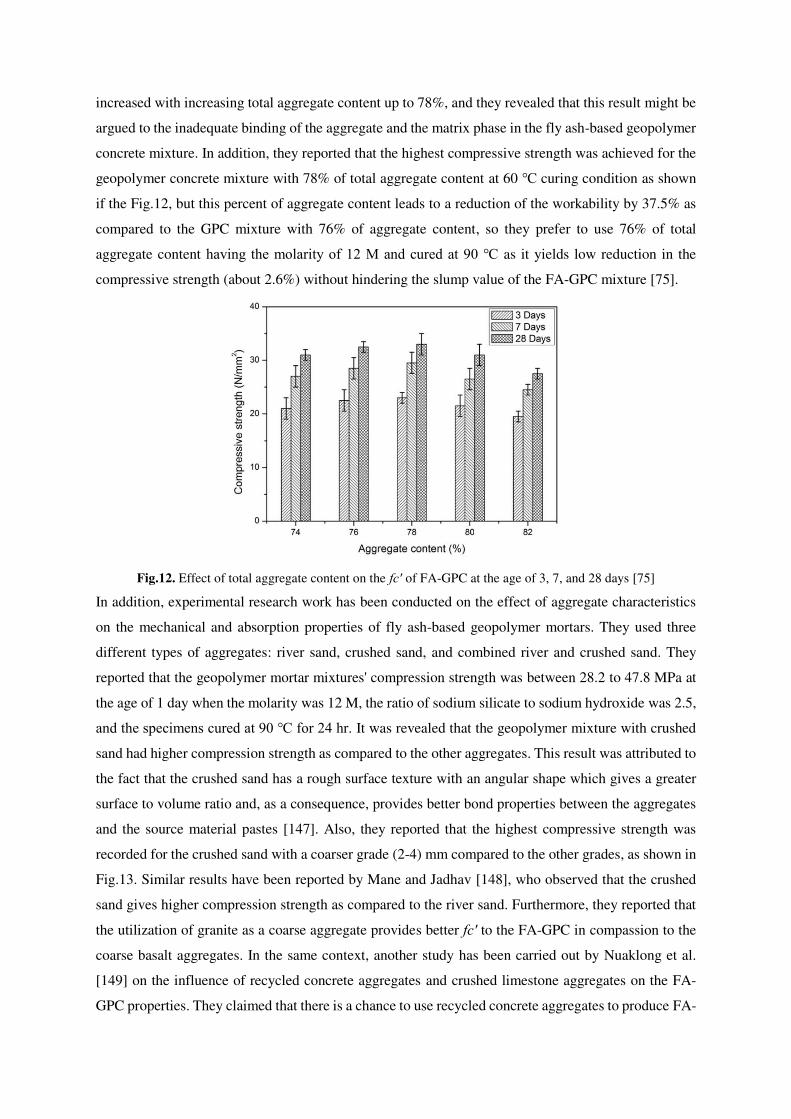
and the source material pastes [147]. Also, they reported that the highest compressive strength was
recorded for the crushed sand with a coarser grade (2-4) mm compared to the other grades, as shown in
Fig.13. Similar results have been reported by Mane and Jadhav [148], who observed that the crushed
sand gives higher compression strength as compared to the river sand. Furthermore, they reported that
the utilization of granite as a coarse aggregate provides better fc′ to the FA-GPC in compassion to the
coarse basalt aggregates. In the same context, another study has been carried out by Nuaklong et al.
[149] on the influence of recycled concrete aggregates and crushed limestone aggregates on the FA-
GPC properties. They claimed that there is a chance to use recycled concrete aggregates to produce FA-
GPC within the 7-days compression strength of 30-38 MPa; however, this value is slightly smaller than
those of FA-GPC with crushed limestone aggregates, which has the compressive strength of 38-41 MPa.
Similar results can also be found in other studies, even though different mixture proportions were used
[89].
Fig.13. Influence of aggregate type and grading on the fc′ of FA-GP mortar at the age of 1 day [147]
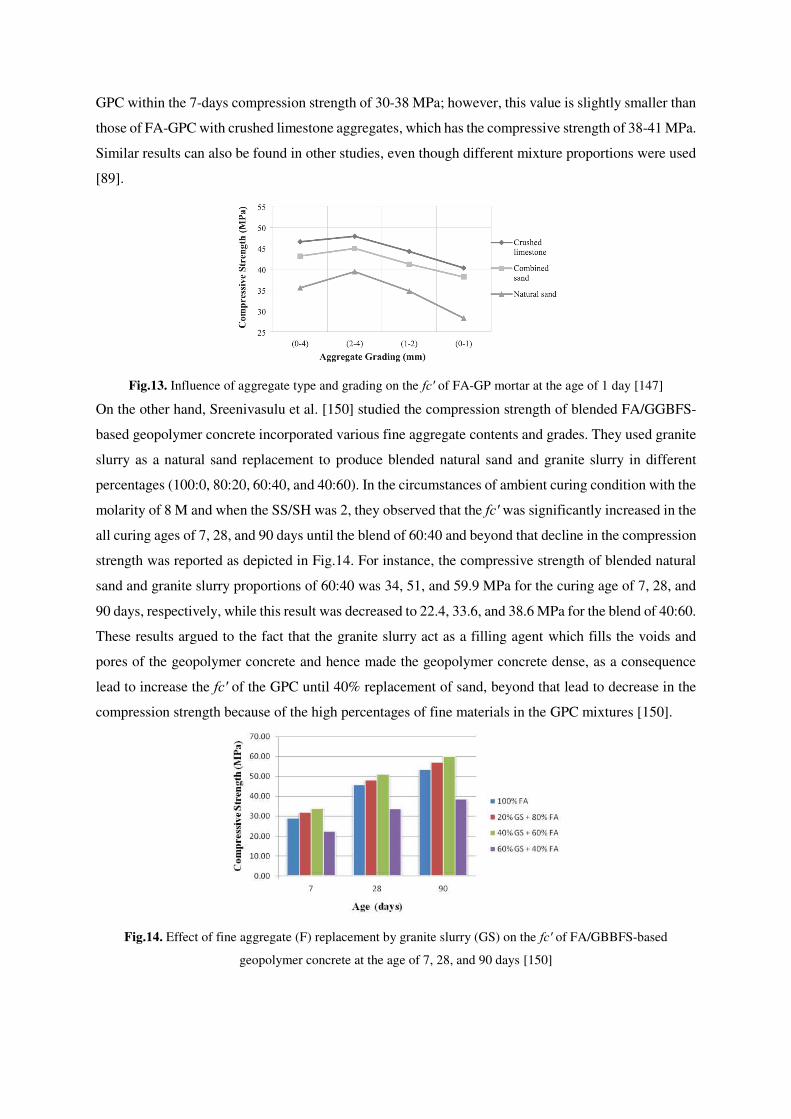
On the other hand, Sreenivasulu et al. [150] studied the compression strength of blended FA/GGBFS-
based geopolymer concrete incorporated various fine aggregate contents and grades. They used granite
slurry as a natural sand replacement to produce blended natural sand and granite slurry in different
percentages (100:0, 80:20, 60:40, and 40:60). In the circumstances of ambient curing condition with the
molarity of 8 M and when the SS/SH was 2, they observed that the fc′ was significantly increased in the
all curing ages of 7, 28, and 90 days until the blend of 60:40 and beyond that decline in the compression
strength was reported as depicted in Fig.14. For instance, the compressive strength of blended natural
sand and granite slurry proportions of 60:40 was 34, 51, and 59.9 MPa for the curing age of 7, 28, and
90 days, respectively, while this result was decreased to 22.4, 33.6, and 38.6 MPa for the blend of 40:60.
These results argued to the fact that the granite slurry act as a filling agent which fills the voids and
pores of the geopolymer concrete and hence made the geopolymer concrete dense, as a consequence
lead to increase the fc′ of the GPC until 40% replacement of sand, beyond that lead to decrease in the
compression strength because of the high percentages of fine materials in the GPC mixtures [150].
Fig.14. Effect of fine aggregate (F) replacement by granite slurry (GS) on the fc′ of FA/GBBFS-based
geopolymer concrete at the age of 7, 28, and 90 days [150]
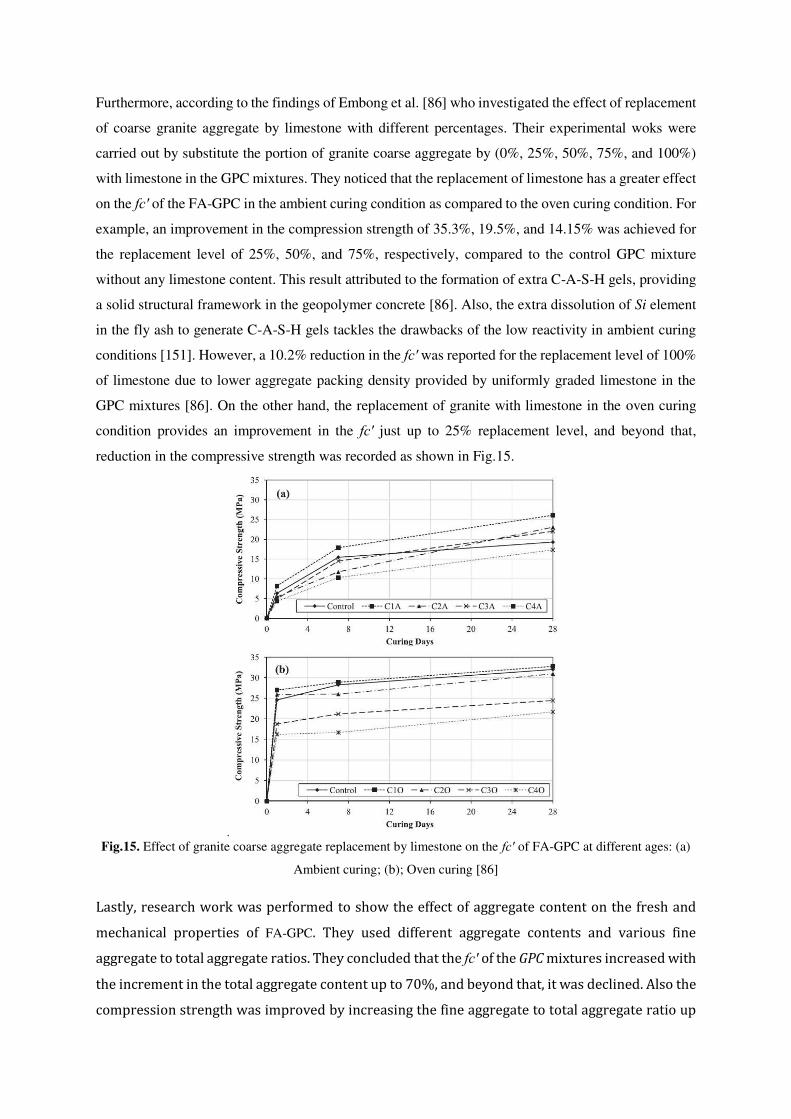
Furthermore, according to the findings of Embong et al. [86] who investigated the effect of replacement
of coarse granite aggregate by limestone with different percentages. Their experimental woks were
carried out by substitute the portion of granite coarse aggregate by (0%, 25%, 50%, 75%, and 100%)
with limestone in the GPC mixtures. They noticed that the replacement of limestone has a greater effect
on the fc′ of the FA-GPC in the ambient curing condition as compared to the oven curing condition. For
example, an improvement in the compression strength of 35.3%, 19.5%, and 14.15% was achieved for
the replacement level of 25%, 50%, and 75%, respectively, compared to the control GPC mixture
without any limestone content. This result attributed to the formation of extra C-A-S-H gels, providing
a solid structural framework in the geopolymer concrete [86]. Also, the extra dissolution of Si element
in the fly ash to generate C-A-S-H gels tackles the drawbacks of the low reactivity in ambient curing
conditions [151]. However, a 10.2% reduction in the fc′ was reported for the replacement level of 100%
of limestone due to lower aggregate packing density provided by uniformly graded limestone in the
GPC mixtures [86]. On the other hand, the replacement of granite with limestone in the oven curing
condition provides an improvement in the fc′ just up to 25% replacement level, and beyond that,
reduction in the compressive strength was recorded as shown in Fig.15.
.
Fig.15. Effect of granite coarse aggregate replacement by limestone on the fc′ of FA-GPC at different ages: (a)
Ambient curing; (b); Oven curing [86]
Lastly, research work was performed to show the effect of aggregate content on the fresh and
mechanical properties of FA-GPC. They used different aggregate contents and various fine
aggregate to total aggregate ratios. They concluded that the fc′ of the GPC mixtures increased with
the increment in the total aggregate content up to 70%, and beyond that, it was declined. Also the
compression strength was improved by increasing the fine aggregate to total aggregate ratio up
to 0.35% and then it was decreased. So, it is evident that for a given sort of coarse and fine
aggregate, there is a limit proportion of fine aggregate and total aggregate content that provided
the highest compression strength for the FA-GPC [98].
4.6 (Na2SiO3/NaOH) Ratio
Generally, sodium hydroxide (NaOH) and sodium silicate (Na2SiO3) is used as the activator solution to
prepare the geopolymer concrete mixtures. The content of the sodium hydroxide (SH) for the collected
literature datasets varied from 25 to 135 kg/m3. The purity of the SH was above 97% of all the fly ash-
based geopolymer concrete mixtures, and pellets and flakes were the two main states of the SH in all
the mixtures. In addition, the content of sodium silicate (SS) was varied between 48 to 342 kg/m3. The
constituents of the SS were SiO2, Na2O, and water. The range of SiO2 was varying from 28 to 37%,
Na2O was in the range of 8 to 18%, and the percent of water in the SS was in the range of 45 to 64%.
Also, referring to the collected data, the ratio of Na2SiO3 to NaOH was varied from 0.4 to 8.8, with an
average of 2.34.
In the literature, a variety of researches have been carried out to investigate the effect of alkaline
solutions on the engineering properties of FA-GPC mixtures. For instance, experimental laboratory
work has been conducted to shows the effect of various sodium silicate to sodium hydroxide ratios on
the fc′ of FA-GPC mixtures. They used two ratios of SS/SH which was 0.4 and 2.5 with two different
molarity. Their results revealed that with increasing the ratio of SS/SH compression strength was
significantly increased, for example, when the molarity was 8 M, and the specimens cured at 60 ℃ for
about 24 hr. the fc′ of FA-GPC was increased from 17.3 MPa to 56.8 MPa just by changing the ratio of
SS/SH from 0.4 to 2.5. Similarly, the fc′ was significantly improved from 47.9 MPa to 67.6 MPa when
the ratio of SS/SH changes from 0.4 to 2.5 when the molarity was 14 M [139]. Similarly, compression
strength improvement of FA-GPC was reported by Al-Azzawi et al. [71] as the ratio of SS/SH increased
at all GPC mixtures even fly ash contents were varying from 300 to 500 kg/m3. In the same context,
based on the findings of Aliabdo et al. [79], who studied the effect of alkaline solution dosages on the
performance of FA-GPC, they used three different (0.3, 0.4, and 0.5) sodium hydroxide to sodium
silicate ratios. Their results show that with the increment of SH/SS ratio, compressive strength was
decreased, or with the increment of SS/SH, compressive strength was increased, as illustrated in Fig.16.
The reduction in the fc′ of the FA-GPC at the curing age of 28 days was 22.5% and 29.5% at 0.4 and
0.5 of SH to SS ratio, correspondingly, as compared to the SH to SS ratio of 0.3. Similar results can also
be found in other studies even though different SS/SH was used [94, 112, 123, 152].
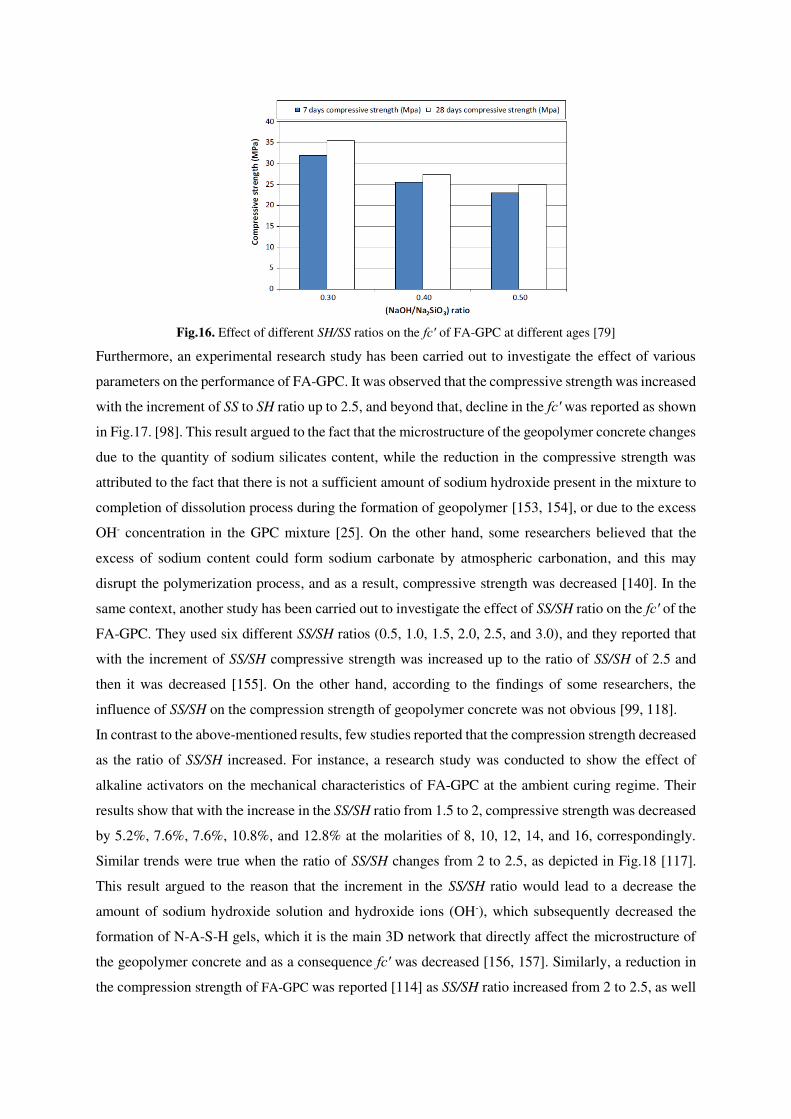
Fig.16. Effect of different SH/SS ratios on the fc′ of FA-GPC at different ages [79]
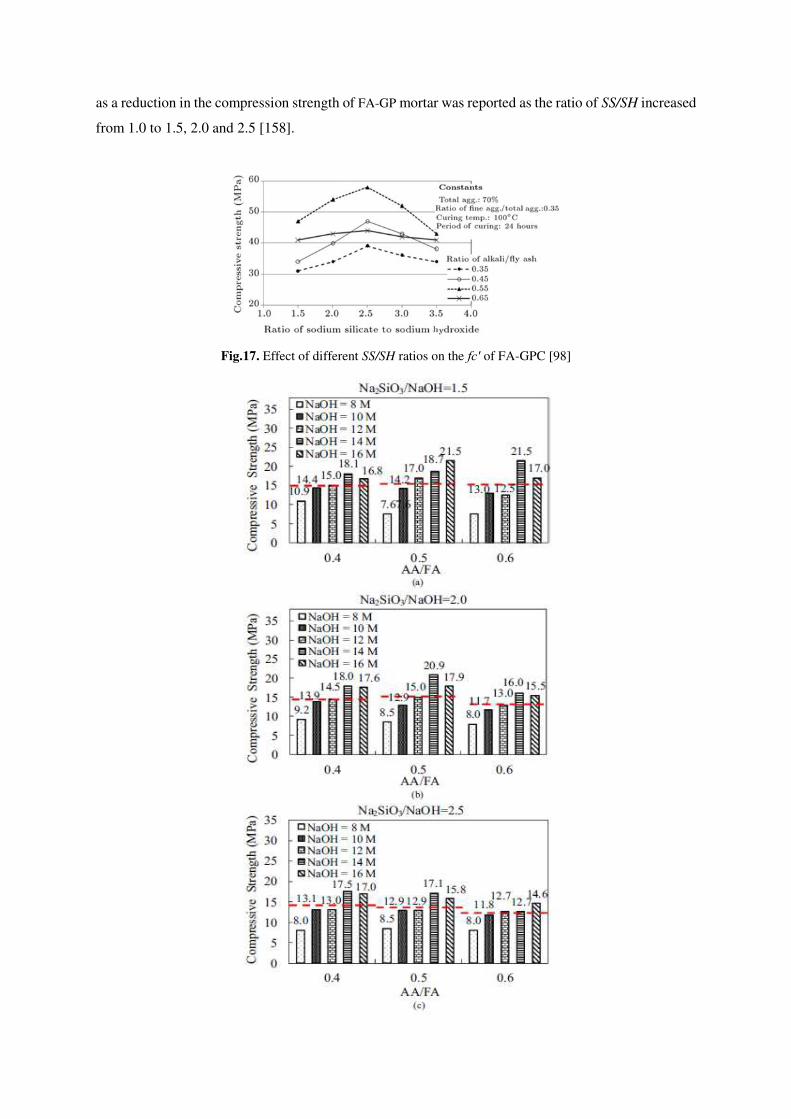
Furthermore, an experimental research study has been carried out to investigate the effect of various
parameters on the performance of FA-GPC. It was observed that the compressive strength was increased
with the increment of SS to SH ratio up to 2.5, and beyond that, decline in the fc′ was reported as shown
in Fig.17. [98]. This result argued to the fact that the microstructure of the geopolymer concrete changes
due to the quantity of sodium silicates content, while the reduction in the compressive strength was
attributed to the fact that there is not a sufficient amount of sodium hydroxide present in the mixture to
completion of dissolution process during the formation of geopolymer [153, 154], or due to the excess
OH- concentration in the GPC mixture [25]. On the other hand, some researchers believed that the
excess of sodium content could form sodium carbonate by atmospheric carbonation, and this may
disrupt the polymerization process, and as a result, compressive strength was decreased [140]. In the
same context, another study has been carried out to investigate the effect of SS/SH ratio on the fc′ of the
FA-GPC. They used six different SS/SH ratios (0.5, 1.0, 1.5, 2.0, 2.5, and 3.0), and they reported that
with the increment of SS/SH compressive strength was increased up to the ratio of SS/SH of 2.5 and
then it was decreased [155]. On the other hand, according to the findings of some researchers, the
influence of SS/SH on the compression strength of geopolymer concrete was not obvious [99, 118].
In contrast to the above-mentioned results, few studies reported that the compression strength decreased
as the ratio of SS/SH increased. For instance, a research study was conducted to show the effect of
alkaline activators on the mechanical characteristics of FA-GPC at the ambient curing regime. Their
results show that with the increase in the SS/SH ratio from 1.5 to 2, compressive strength was decreased
by 5.2%, 7.6%, 7.6%, 10.8%, and 12.8% at the molarities of 8, 10, 12, 14, and 16, correspondingly.
Similar trends were true when the ratio of SS/SH changes from 2 to 2.5, as depicted in Fig.18 [117].
This result argued to the reason that the increment in the SS/SH ratio would lead to a decrease the
amount of sodium hydroxide solution and hydroxide ions (OH-), which subsequently decreased the
formation of N-A-S-H gels, which it is the main 3D network that directly affect the microstructure of
the geopolymer concrete and as a consequence fc′ was decreased [156, 157]. Similarly, a reduction in
the compression strength of FA-GPC was reported [114] as SS/SH ratio increased from 2 to 2.5, as well
as a reduction in the compression strength of FA-GP mortar was reported as the ratio of SS/SH increased
from 1.0 to 1.5, 2.0 and 2.5 [158].
Fig.17. Effect of different SS/SH ratios on the fc′ of FA-GPC [98]
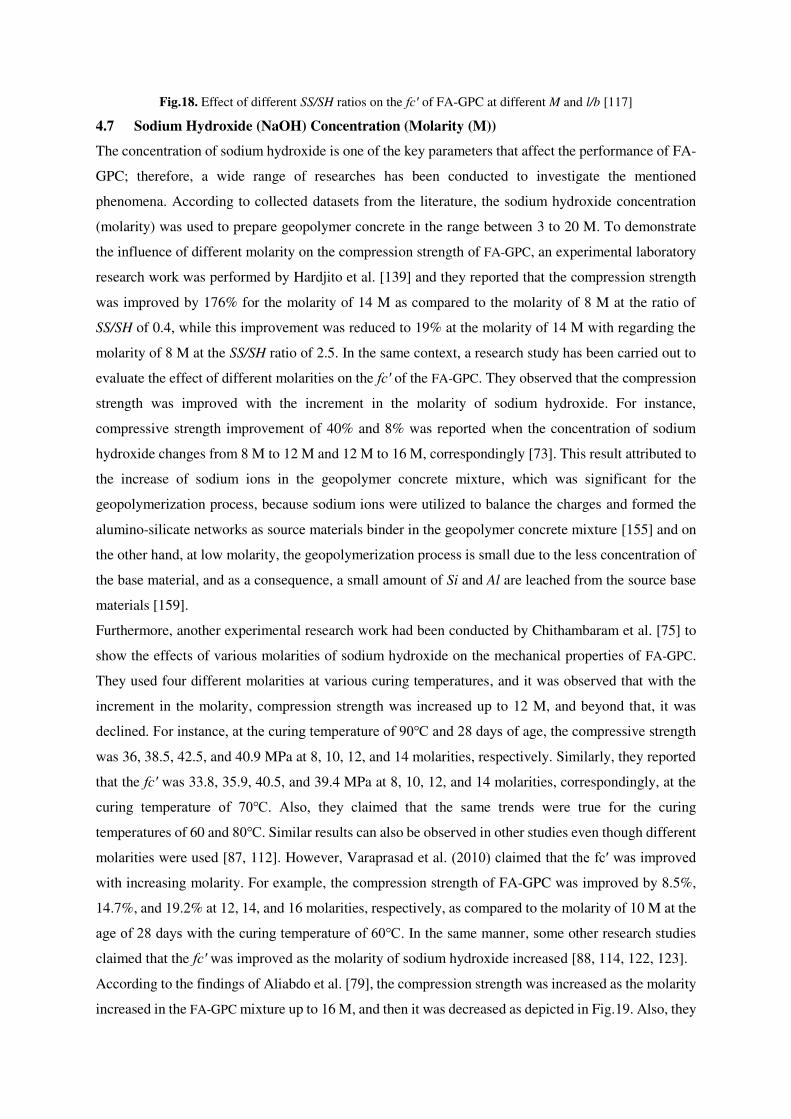
Fig.18. Effect of different SS/SH ratios on the fc′ of FA-GPC at different M and l/b [117]
4.7 Sodium Hydroxide (NaOH) Concentration (Molarity (M))
The concentration of sodium hydroxide is one of the key parameters that affect the performance of FA-
GPC; therefore, a wide range of researches has been conducted to investigate the mentioned
phenomena. According to collected datasets from the literature, the sodium hydroxide concentration
(molarity) was used to prepare geopolymer concrete in the range between 3 to 20 M. To demonstrate
the influence of different molarity on the compression strength of FA-GPC, an experimental laboratory
research work was performed by Hardjito et al. [139] and they reported that the compression strength
was improved by 176% for the molarity of 14 M as compared to the molarity of 8 M at the ratio of
SS/SH of 0.4, while this improvement was reduced to 19% at the molarity of 14 M with regarding the
molarity of 8 M at the SS/SH ratio of 2.5. In the same context, a research study has been carried out to
evaluate the effect of different molarities on the fc′ of the FA-GPC. They observed that the compression
strength was improved with the increment in the molarity of sodium hydroxide. For instance,
compressive strength improvement of 40% and 8% was reported when the concentration of sodium
hydroxide changes from 8 M to 12 M and 12 M to 16 M, correspondingly [73]. This result attributed to
the increase of sodium ions in the geopolymer concrete mixture, which was significant for the
geopolymerization process, because sodium ions were utilized to balance the charges and formed the
alumino-silicate networks as source materials binder in the geopolymer concrete mixture [155] and on
the other hand, at low molarity, the geopolymerization process is small due to the less concentration of
the base material, and as a consequence, a small amount of Si and Al are leached from the source base
materials [159].
Furthermore, another experimental research work had been conducted by Chithambaram et al. [75] to
show the effects of various molarities of sodium hydroxide on the mechanical properties of FA-GPC.
They used four different molarities at various curing temperatures, and it was observed that with the
increment in the molarity, compression strength was increased up to 12 M, and beyond that, it was
declined. For instance, at the curing temperature of 90℃ and 28 days of age, the compressive strength
was 36, 38.5, 42.5, and 40.9 MPa at 8, 10, 12, and 14 molarities, respectively. Similarly, they reported
that the fc′ was 33.8, 35.9, 40.5, and 39.4 MPa at 8, 10, 12, and 14 molarities, correspondingly, at the
curing temperature of 70℃. Also, they claimed that the same trends were true for the curing
temperatures of 60 and 80℃. Similar results can also be observed in other studies even though different
molarities were used [87, 112]. However, Varaprasad et al. (2010) claimed that the fc′ was improved
with increasing molarity. For example, the compression strength of FA-GPC was improved by 8.5%,
14.7%, and 19.2% at 12, 14, and 16 molarities, respectively, as compared to the molarity of 10 M at the
age of 28 days with the curing temperature of 60℃. In the same manner, some other research studies
claimed that the fc′ was improved as the molarity of sodium hydroxide increased [88, 114, 122, 123].
According to the findings of Aliabdo et al. [79], the compression strength was increased as the molarity
increased in the FA-GPC mixture up to 16 M, and then it was decreased as depicted in Fig.19. Also, they
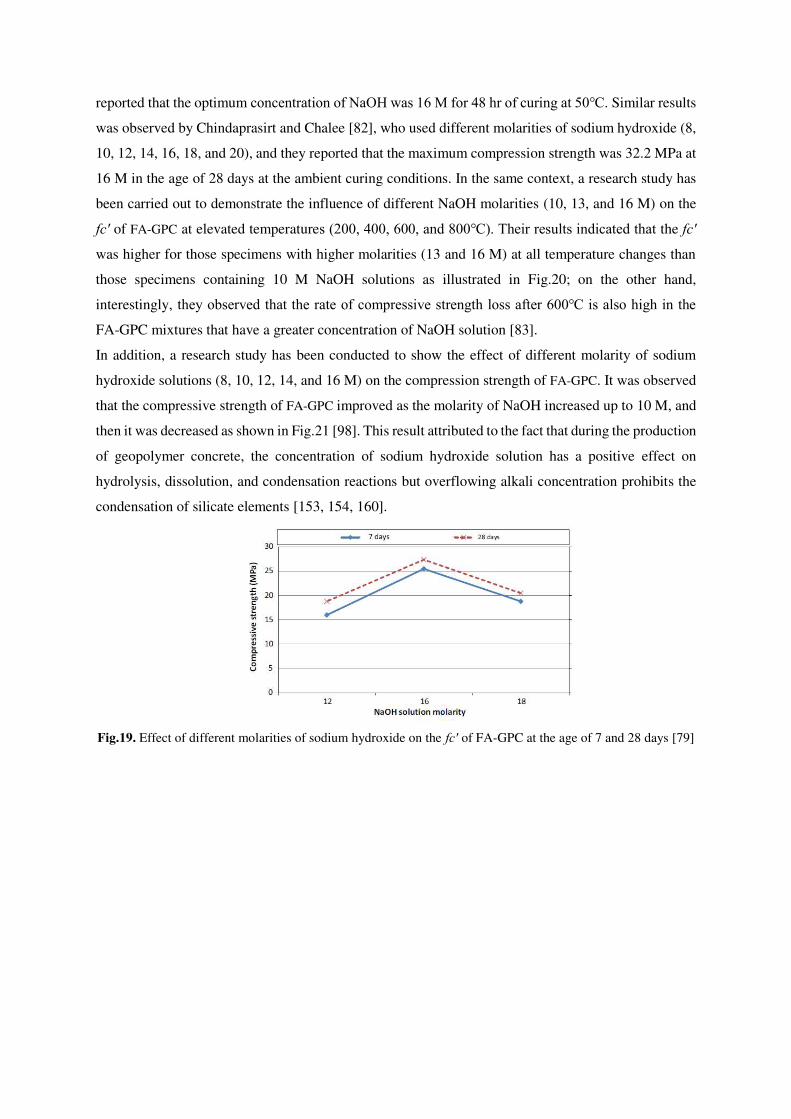
reported that the optimum concentration of NaOH was 16 M for 48 hr of curing at 50℃. Similar results
was observed by Chindaprasirt and Chalee [82], who used different molarities of sodium hydroxide (8,
10, 12, 14, 16, 18, and 20), and they reported that the maximum compression strength was 32.2 MPa at
16 M in the age of 28 days at the ambient curing conditions. In the same context, a research study has
been carried out to demonstrate the influence of different NaOH molarities (10, 13, and 16 M) on the
fc′ of FA-GPC at elevated temperatures (200, 400, 600, and 800℃). Their results indicated that the fc′
was higher for those specimens with higher molarities (13 and 16 M) at all temperature changes than
those specimens containing 10 M NaOH solutions as illustrated in Fig.20; on the other hand,
interestingly, they observed that the rate of compressive strength loss after 600℃ is also high in the
FA-GPC mixtures that have a greater concentration of NaOH solution [83].
In addition, a research study has been conducted to show the effect of different molarity of sodium
hydroxide solutions (8, 10, 12, 14, and 16 M) on the compression strength of FA-GPC. It was observed
that the compressive strength of FA-GPC improved as the molarity of NaOH increased up to 10 M, and
then it was decreased as shown in Fig.21 [98]. This result attributed to the fact that during the production
of geopolymer concrete, the concentration of sodium hydroxide solution has a positive effect on
hydrolysis, dissolution, and condensation reactions but overflowing alkali concentration prohibits the
condensation of silicate elements [153, 154, 160].
Fig.19. Effect of different molarities of sodium hydroxide on the fc′ of FA-GPC at the age of 7 and 28 days [79]
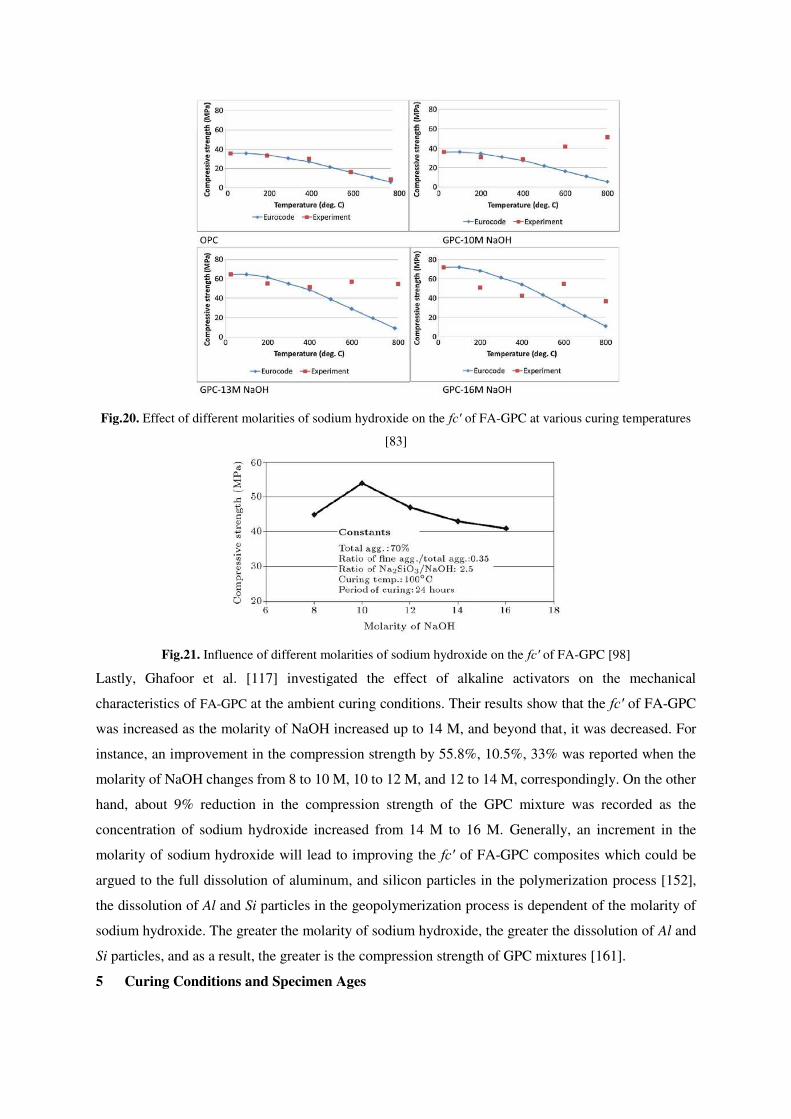
Fig.20. Effect of different molarities of sodium hydroxide on the fc′ of FA-GPC at various curing temperatures
[83]
Fig.21. Influence of different molarities of sodium hydroxide on the fc′ of FA-GPC [98]
Lastly, Ghafoor et al. [117] investigated the effect of alkaline activators on the mechanical
characteristics of FA-GPC at the ambient curing conditions. Their results show that the fc′ of FA-GPC
was increased as the molarity of NaOH increased up to 14 M, and beyond that, it was decreased. For
instance, an improvement in the compression strength by 55.8%, 10.5%, 33% was reported when the
molarity of NaOH changes from 8 to 10 M, 10 to 12 M, and 12 to 14 M, correspondingly. On the other
hand, about 9% reduction in the compression strength of the GPC mixture was recorded as the
concentration of sodium hydroxide increased from 14 M to 16 M. Generally, an increment in the
molarity of sodium hydroxide will lead to improving the fc′ of FA-GPC composites which could be
argued to the full dissolution of aluminum, and silicon particles in the polymerization process [152],
the dissolution of Al and Si particles in the geopolymerization process is dependent of the molarity of
sodium hydroxide. The greater the molarity of sodium hydroxide, the greater the dissolution of Al and
Si particles, and as a result, the greater is the compression strength of GPC mixtures [161].
5 Curing Conditions and Specimen Ages
Generally, there are three different curing regimes to cure FA-GPC composites, namely ambient curing,
oven curing, and steam curing regimes. In the following paragraph, the effect of these curing conditions
on the fc′ of FA-GPC was provided. The majority of researches used oven curing conditions to cure the
FA-GPC as compared to other curing condition types.
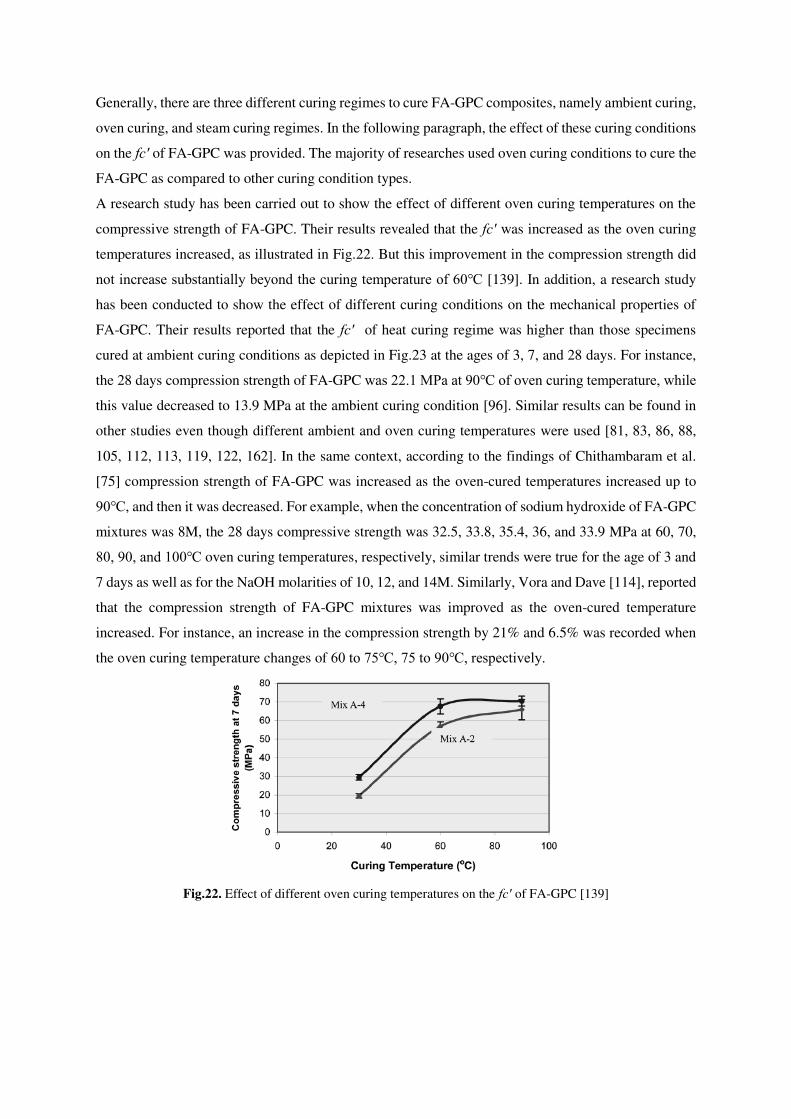
A research study has been carried out to show the effect of different oven curing temperatures on the
compressive strength of FA-GPC. Their results revealed that the fc′ was increased as the oven curing
temperatures increased, as illustrated in Fig.22. But this improvement in the compression strength did
not increase substantially beyond the curing temperature of 60℃ [139]. In addition, a research study
has been conducted to show the effect of different curing conditions on the mechanical properties of
FA-GPC. Their results reported that the fc′ of heat curing regime was higher than those specimens
cured at ambient curing conditions as depicted in Fig.23 at the ages of 3, 7, and 28 days. For instance,
the 28 days compression strength of FA-GPC was 22.1 MPa at 90℃ of oven curing temperature, while
this value decreased to 13.9 MPa at the ambient curing condition [96]. Similar results can be found in
other studies even though different ambient and oven curing temperatures were used [81, 83, 86, 88,
105, 112, 113, 119, 122, 162]. In the same context, according to the findings of Chithambaram et al.
[75] compression strength of FA-GPC was increased as the oven-cured temperatures increased up to
90℃, and then it was decreased. For example, when the concentration of sodium hydroxide of FA-GPC
mixtures was 8M, the 28 days compressive strength was 32.5, 33.8, 35.4, 36, and 33.9 MPa at 60, 70,
80, 90, and 100℃ oven curing temperatures, respectively, similar trends were true for the age of 3 and
7 days as well as for the NaOH molarities of 10, 12, and 14M. Similarly, Vora and Dave [114], reported
that the compression strength of FA-GPC mixtures was improved as the oven-cured temperature
increased. For instance, an increase in the compression strength by 21% and 6.5% was recorded when
the oven curing temperature changes of 60 to 75℃, 75 to 90℃, respectively.
Fig.22. Effect of different oven curing temperatures on the fc′ of FA-GPC [139]
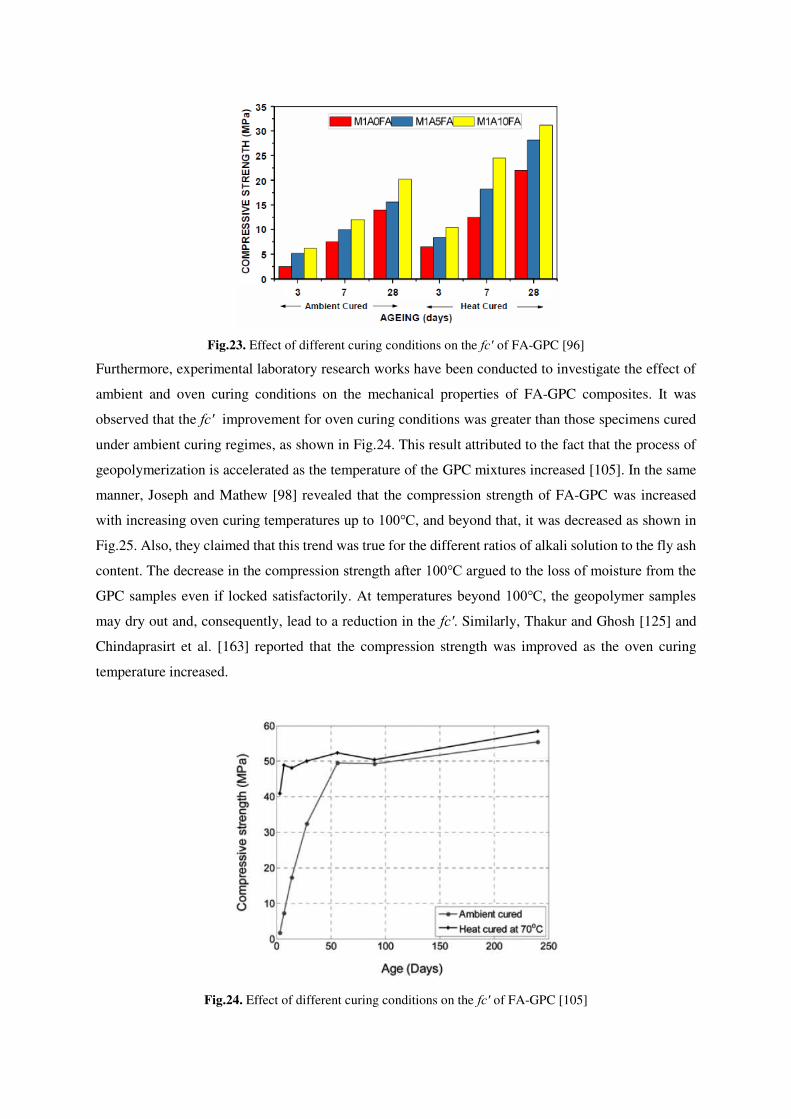
Fig.23. Effect of different curing conditions on the fc′ of FA-GPC [96]
Furthermore, experimental laboratory research works have been conducted to investigate the effect of
ambient and oven curing conditions on the mechanical properties of FA-GPC composites. It was
observed that the fc′ improvement for oven curing conditions was greater than those specimens cured
under ambient curing regimes, as shown in Fig.24. This result attributed to the fact that the process of
geopolymerization is accelerated as the temperature of the GPC mixtures increased [105]. In the same
manner, Joseph and Mathew [98] revealed that the compression strength of FA-GPC was increased
with increasing oven curing temperatures up to 100℃, and beyond that, it was decreased as shown in
Fig.25. Also, they claimed that this trend was true for the different ratios of alkali solution to the fly ash
content. The decrease in the compression strength after 100℃ argued to the loss of moisture from the
GPC samples even if locked satisfactorily. At temperatures beyond 100℃, the geopolymer samples
may dry out and, consequently, lead to a reduction in the fc′. Similarly, Thakur and Ghosh [125] and
Chindaprasirt et al. [163] reported that the compression strength was improved as the oven curing
temperature increased.
Fig.24. Effect of different curing conditions on the fc′ of FA-GPC [105]
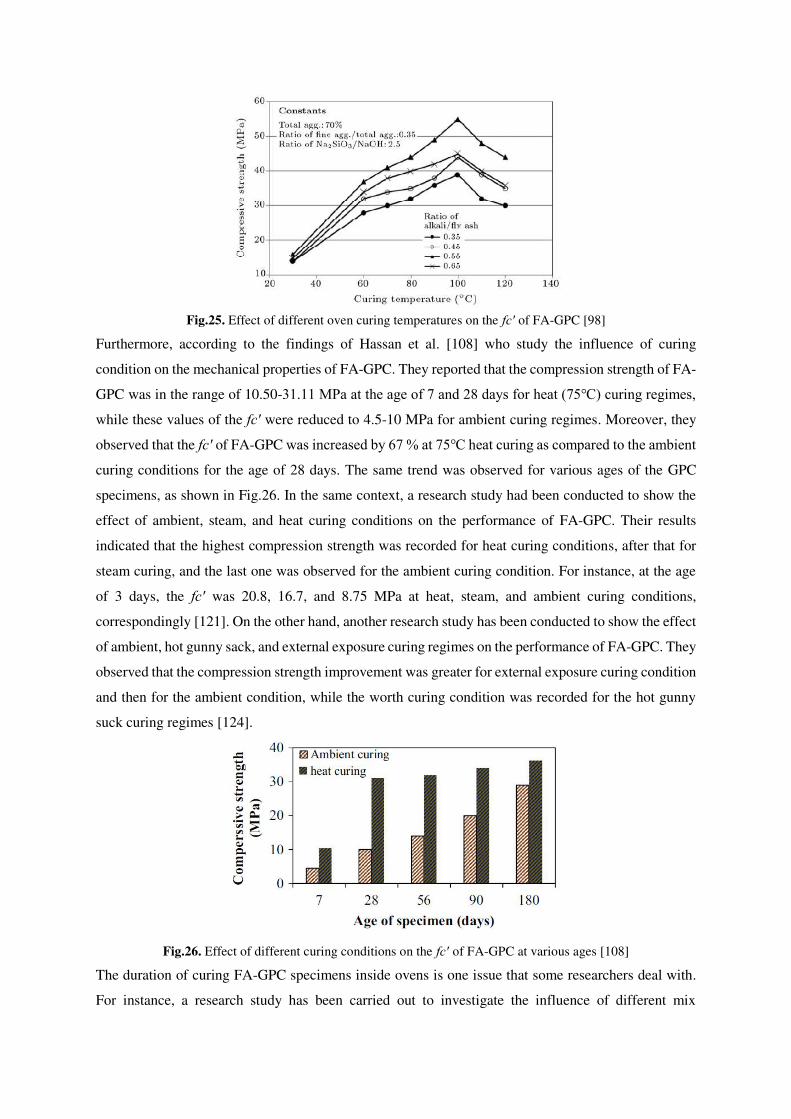
Fig.25. Effect of different oven curing temperatures on the fc′ of FA-GPC [98]
Furthermore, according to the findings of Hassan et al. [108] who study the influence of curing
condition on the mechanical properties of FA-GPC. They reported that the compression strength of FA-
GPC was in the range of 10.50-31.11 MPa at the age of 7 and 28 days for heat (75℃) curing regimes,
while these values of the fc′ were reduced to 4.5-10 MPa for ambient curing regimes. Moreover, they
observed that the fc′ of FA-GPC was increased by 67 % at 75℃ heat curing as compared to the ambient
curing conditions for the age of 28 days. The same trend was observed for various ages of the GPC
specimens, as shown in Fig.26. In the same context, a research study had been conducted to show the
effect of ambient, steam, and heat curing conditions on the performance of FA-GPC. Their results
indicated that the highest compression strength was recorded for heat curing conditions, after that for
steam curing, and the last one was observed for the ambient curing condition. For instance, at the age
of 3 days, the fc′ was 20.8, 16.7, and 8.75 MPa at heat, steam, and ambient curing conditions,
correspondingly [121]. On the other hand, another research study has been conducted to show the effect
of ambient, hot gunny sack, and external exposure curing regimes on the performance of FA-GPC. They
observed that the compression strength improvement was greater for external exposure curing condition
and then for the ambient condition, while the worth curing condition was recorded for the hot gunny
suck curing regimes [124].
Fig.26. Effect of different curing conditions on the fc′ of FA-GPC at various ages [108]
The duration of curing FA-GPC specimens inside ovens is one issue that some researchers deal with.
For instance, a research study has been carried out to investigate the influence of different mix
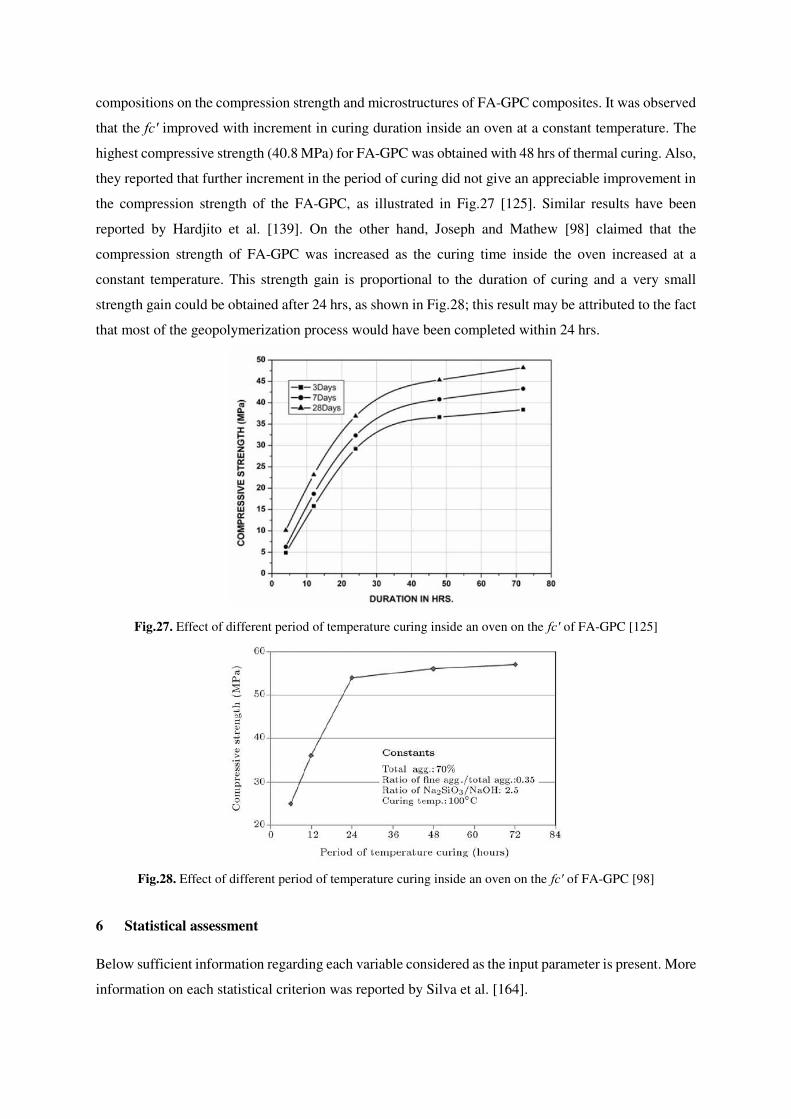
compositions on the compression strength and microstructures of FA-GPC composites. It was observed
that the fc′ improved with increment in curing duration inside an oven at a constant temperature. The
highest compressive strength (40.8 MPa) for FA-GPC was obtained with 48 hrs of thermal curing. Also,
they reported that further increment in the period of curing did not give an appreciable improvement in
the compression strength of the FA-GPC, as illustrated in Fig.27 [125]. Similar results have been
reported by Hardjito et al. [139]. On the other hand, Joseph and Mathew [98] claimed that the
compression strength of FA-GPC was increased as the curing time inside the oven increased at a
constant temperature. This strength gain is proportional to the duration of curing and a very small
strength gain could be obtained after 24 hrs, as shown in Fig.28; this result may be attributed to the fact
that most of the geopolymerization process would have been completed within 24 hrs.
Fig.27. Effect of different period of temperature curing inside an oven on the fc′ of FA-GPC [125]
Fig.28. Effect of different period of temperature curing inside an oven on the fc′ of FA-GPC [98]
6 Statistical assessment
Below sufficient information regarding each variable considered as the input parameter is present. More
information on each statistical criterion was reported by Silva et al. [164].
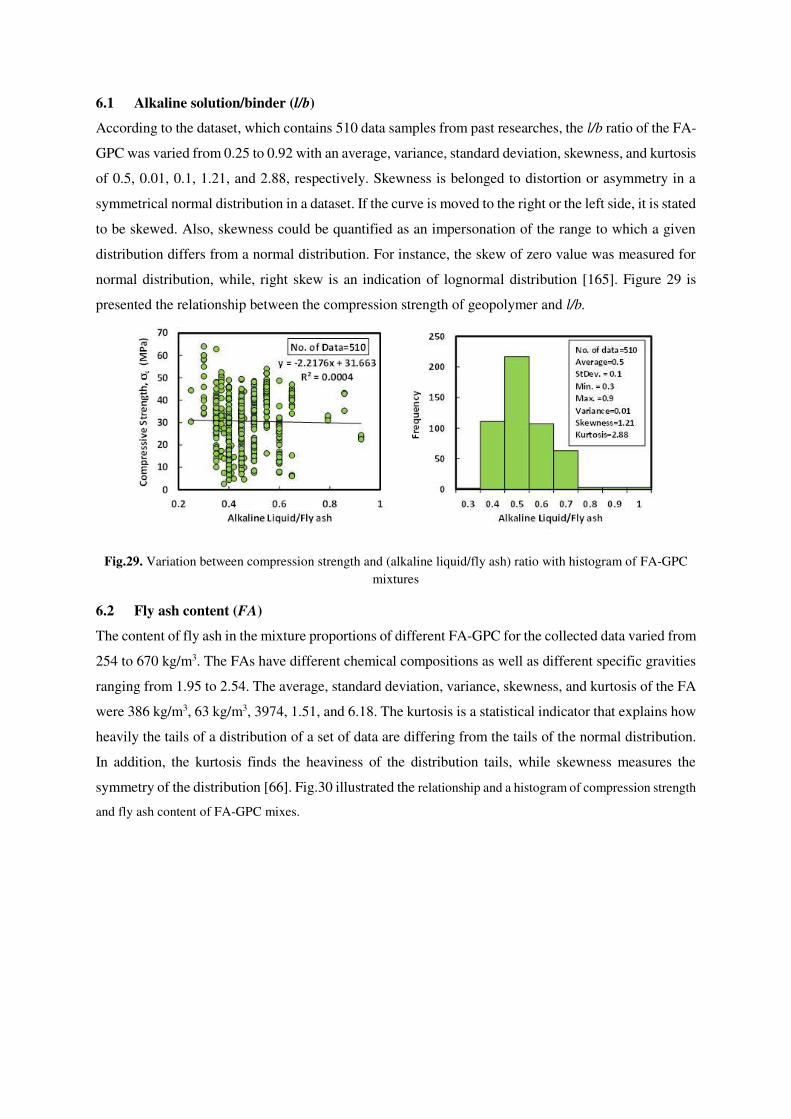
6.1 Alkaline solution/binder (l/b)
According to the dataset, which contains 510 data samples from past researches, the l/b ratio of the FA-
GPC was varied from 0.25 to 0.92 with an average, variance, standard deviation, skewness, and kurtosis
of 0.5, 0.01, 0.1, 1.21, and 2.88, respectively. Skewness is belonged to distortion or asymmetry in a
symmetrical normal distribution in a dataset. If the curve is moved to the right or the left side, it is stated
to be skewed. Also, skewness could be quantified as an impersonation of the range to which a given
distribution differs from a normal distribution. For instance, the skew of zero value was measured for
normal distribution, while, right skew is an indication of lognormal distribution [165]. Figure 29 is
presented the relationship between the compression strength of geopolymer and l/b.
Fig.29. Variation between compression strength and (alkaline liquid/fly ash) ratio with histogram of FA-GPC
mixtures
6.2 Fly ash content (FA)
The content of fly ash in the mixture proportions of different FA-GPC for the collected data varied from
254 to 670 kg/m3. The FAs have different chemical compositions as well as different specific gravities
ranging from 1.95 to 2.54. The average, standard deviation, variance, skewness, and kurtosis of the FA
were 386 kg/m3, 63 kg/m3, 3974, 1.51, and 6.18. The kurtosis is a statistical indicator that explains how
heavily the tails of a distribution of a set of data are differing from the tails of the normal distribution.
In addition, the kurtosis finds the heaviness of the distribution tails, while skewness measures the
symmetry of the distribution [66]. Fig.30 illustrated the relationship and a histogram of compression strength
and fly ash content of FA-GPC mixes.
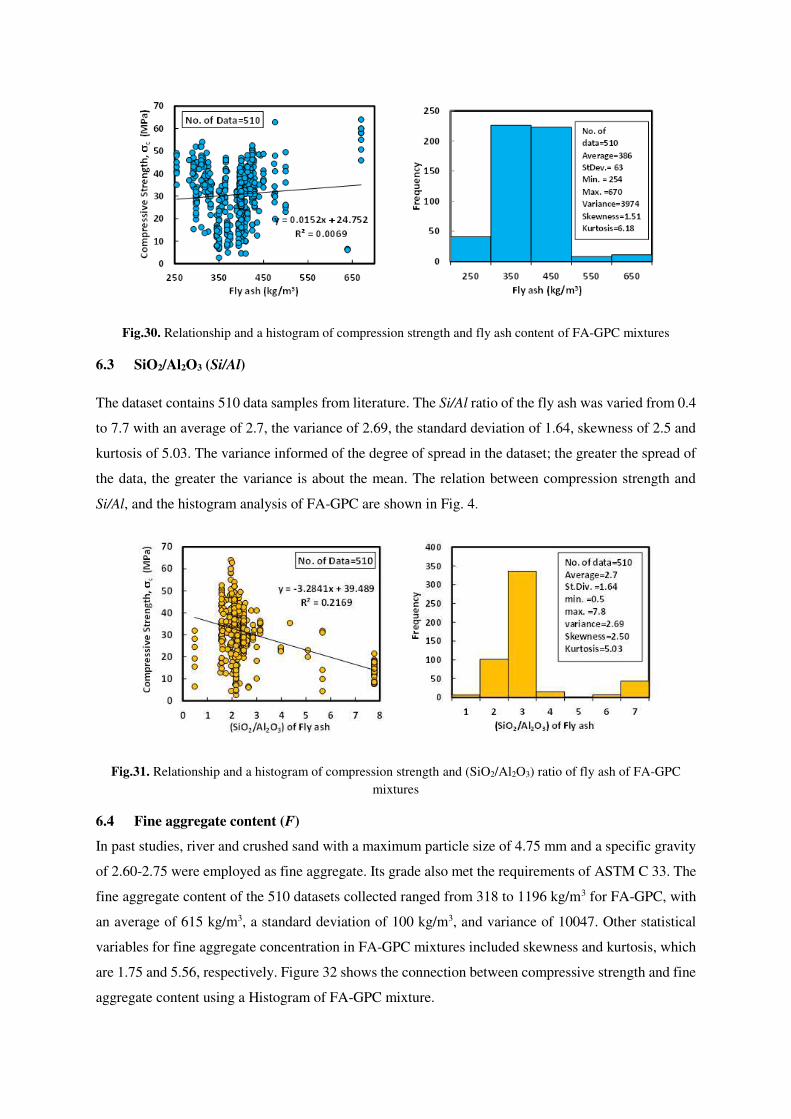
Fig.30. Relationship and a histogram of compression strength and fly ash content of FA-GPC mixtures
6.3 SiO2/Al2O3 (Si/Al)
The dataset contains 510 data samples from literature. The Si/Al ratio of the fly ash was varied from 0.4
to 7.7 with an average of 2.7, the variance of 2.69, the standard deviation of 1.64, skewness of 2.5 and
kurtosis of 5.03. The variance informed of the degree of spread in the dataset; the greater the spread of
the data, the greater the variance is about the mean. The relation between compression strength and
Si/Al, and the histogram analysis of FA-GPC are shown in Fig. 4.
Fig.31. Relationship and a histogram of compression strength and (SiO2/Al2O3) ratio of fly ash of FA-GPC
mixtures
6.4 Fine aggregate content (F)
In past studies, river and crushed sand with a maximum particle size of 4.75 mm and a specific gravity
of 2.60-2.75 were employed as fine aggregate. Its grade also met the requirements of ASTM C 33. The
fine aggregate content of the 510 datasets collected ranged from 318 to 1196 kg/m3 for FA-GPC, with
an average of 615 kg/m3, a standard deviation of 100 kg/m3, and variance of 10047. Other statistical
variables for fine aggregate concentration in FA-GPC mixtures included skewness and kurtosis, which
are 1.75 and 5.56, respectively. Figure 32 shows the connection between compressive strength and fine
aggregate content using a Histogram of FA-GPC mixture.
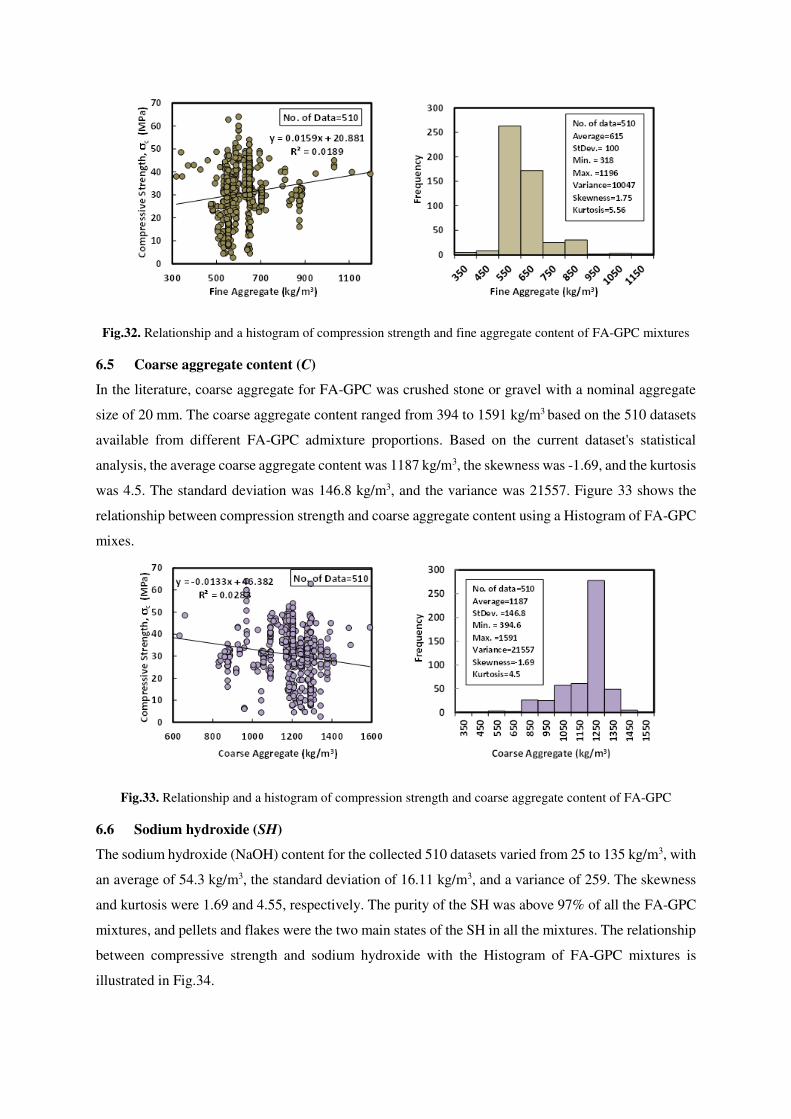
Fig.32. Relationship and a histogram of compression strength and fine aggregate content of FA-GPC mixtures
6.5 Coarse aggregate content (C)
In the literature, coarse aggregate for FA-GPC was crushed stone or gravel with a nominal aggregate
size of 20 mm. The coarse aggregate content ranged from 394 to 1591 kg/m3 based on the 510 datasets
available from different FA-GPC admixture proportions. Based on the current dataset's statistical
analysis, the average coarse aggregate content was 1187 kg/m3, the skewness was -1.69, and the kurtosis
was 4.5. The standard deviation was 146.8 kg/m3, and the variance was 21557. Figure 33 shows the
relationship between compression strength and coarse aggregate content using a Histogram of FA-GPC
mixes.
Fig.33. Relationship and a histogram of compression strength and coarse aggregate content of FA-GPC
6.6 Sodium hydroxide (SH)
The sodium hydroxide (NaOH) content for the collected 510 datasets varied from 25 to 135 kg/m3, with
an average of 54.3 kg/m3, the standard deviation of 16.11 kg/m3, and a variance of 259. The skewness
and kurtosis were 1.69 and 4.55, respectively. The purity of the SH was above 97% of all the FA-GPC
mixtures, and pellets and flakes were the two main states of the SH in all the mixtures. The relationship
between compressive strength and sodium hydroxide with the Histogram of FA-GPC mixtures is
illustrated in Fig.34.
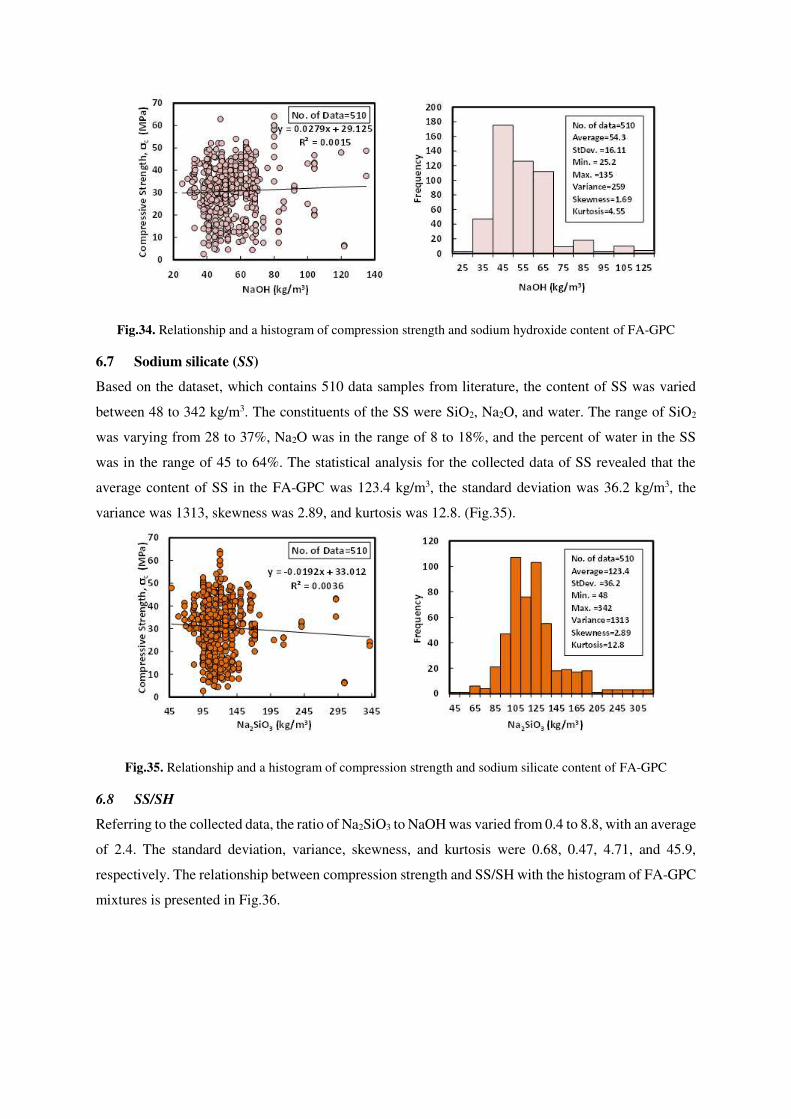
Fig.34. Relationship and a histogram of compression strength and sodium hydroxide content of FA-GPC
6.7 Sodium silicate (SS)
Based on the dataset, which contains 510 data samples from literature, the content of SS was varied
between 48 to 342 kg/m3. The constituents of the SS were SiO2, Na2O, and water. The range of SiO2
was varying from 28 to 37%, Na2O was in the range of 8 to 18%, and the percent of water in the SS
was in the range of 45 to 64%. The statistical analysis for the collected data of SS revealed that the
average content of SS in the FA-GPC was 123.4 kg/m3, the standard deviation was 36.2 kg/m3, the
variance was 1313, skewness was 2.89, and kurtosis was 12.8. (Fig.35).
Fig.35. Relationship and a histogram of compression strength and sodium silicate content of FA-GPC
6.8 SS/SH
Referring to the collected data, the ratio of Na2SiO3 to NaOH was varied from 0.4 to 8.8, with an average
of 2.4. The standard deviation, variance, skewness, and kurtosis were 0.68, 0.47, 4.71, and 45.9,
respectively. The relationship between compression strength and SS/SH with the histogram of FA-GPC
mixtures is presented in Fig.36.
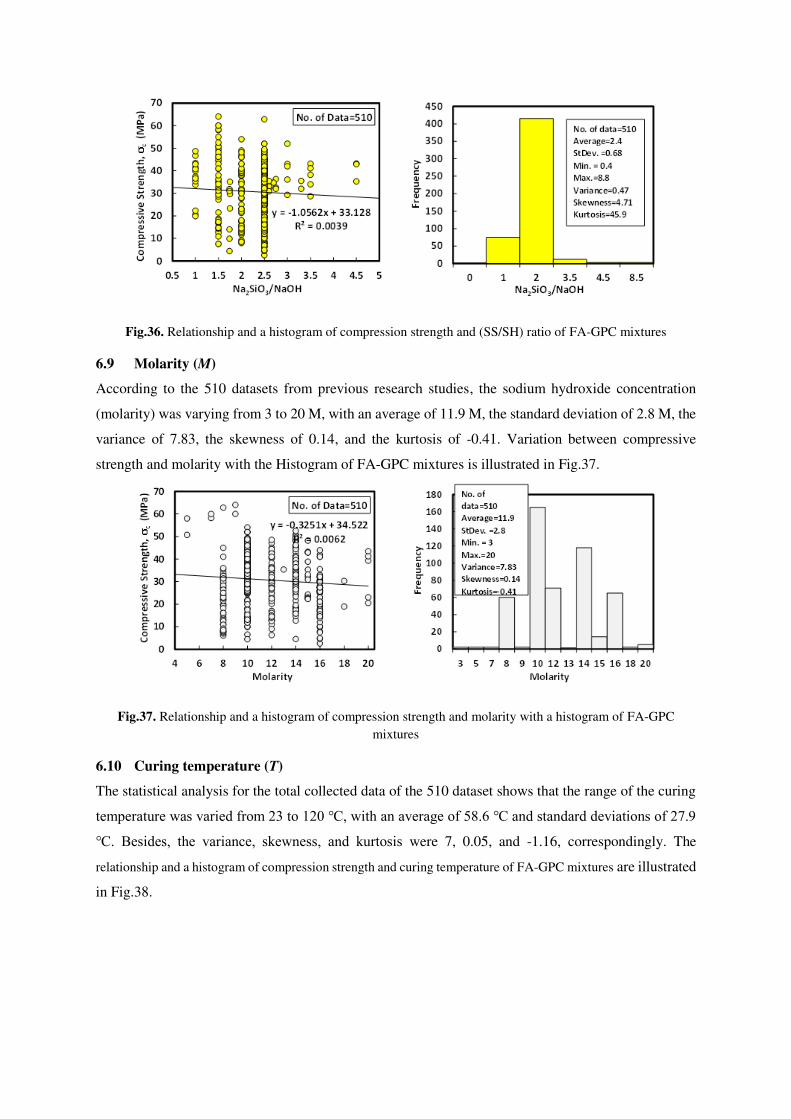
Fig.36. Relationship and a histogram of compression strength and (SS/SH) ratio of FA-GPC mixtures
6.9 Molarity (M)
According to the 510 datasets from previous research studies, the sodium hydroxide concentration
(molarity) was varying from 3 to 20 M, with an average of 11.9 M, the standard deviation of 2.8 M, the
variance of 7.83, the skewness of 0.14, and the kurtosis of -0.41. Variation between compressive
strength and molarity with the Histogram of FA-GPC mixtures is illustrated in Fig.37.
Fig.37. Relationship and a histogram of compression strength and molarity with a histogram of FA-GPC
mixtures
6.10 Curing temperature (T)
The statistical analysis for the total collected data of the 510 dataset shows that the range of the curing
temperature was varied from 23 to 120 ℃, with an average of 58.6 ℃ and standard deviations of 27.9
℃. Besides, the variance, skewness, and kurtosis were 7, 0.05, and -1.16, correspondingly. The
relationship and a histogram of compression strength and curing temperature of FA-GPC mixtures are illustrated
in Fig.38.
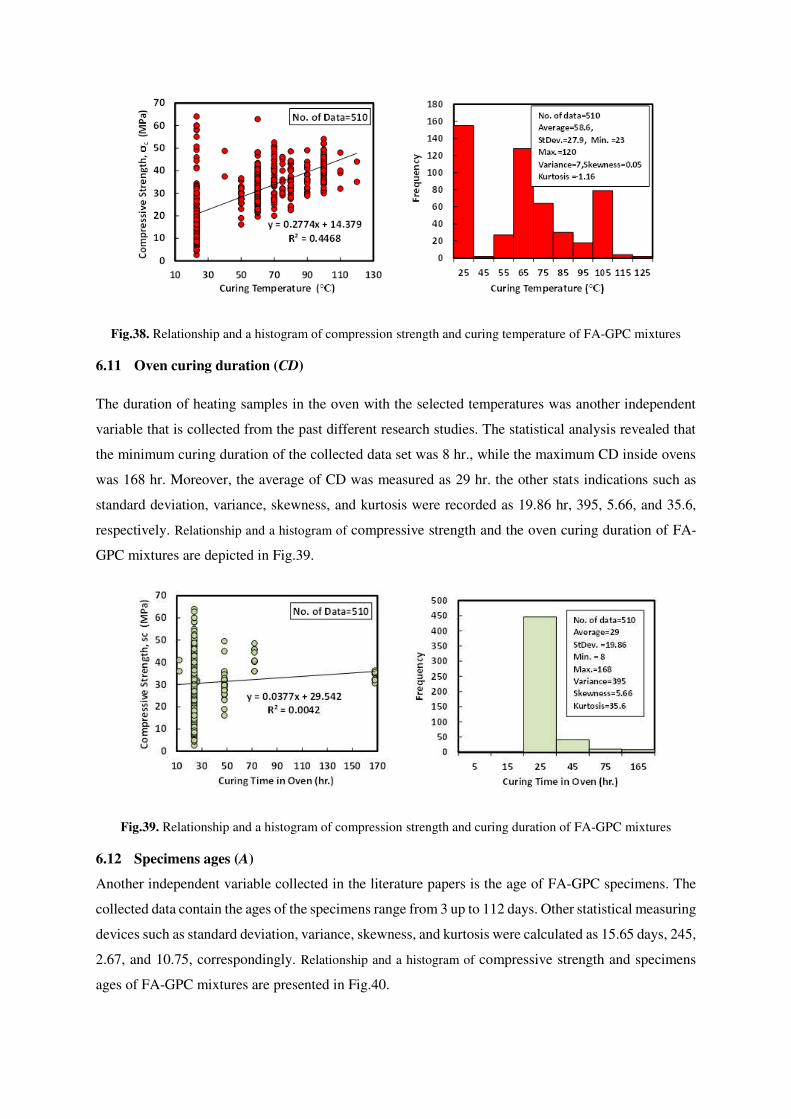
Fig.38. Relationship and a histogram of compression strength and curing temperature of FA-GPC mixtures
6.11 Oven curing duration (CD)
The duration of heating samples in the oven with the selected temperatures was another independent
variable that is collected from the past different research studies. The statistical analysis revealed that
the minimum curing duration of the collected data set was 8 hr., while the maximum CD inside ovens
was 168 hr. Moreover, the average of CD was measured as 29 hr. the other stats indications such as
standard deviation, variance, skewness, and kurtosis were recorded as 19.86 hr, 395, 5.66, and 35.6,
respectively. Relationship and a histogram of compressive strength and the oven curing duration of FA-
GPC mixtures are depicted in Fig.39.
Fig.39. Relationship and a histogram of compression strength and curing duration of FA-GPC mixtures
6.12 Specimens ages (A)
Another independent variable collected in the literature papers is the age of FA-GPC specimens. The
collected data contain the ages of the specimens range from 3 up to 112 days. Other statistical measuring
devices such as standard deviation, variance, skewness, and kurtosis were calculated as 15.65 days, 245,
2.67, and 10.75, correspondingly. Relationship and a histogram of compressive strength and specimens
ages of FA-GPC mixtures are presented in Fig.40.
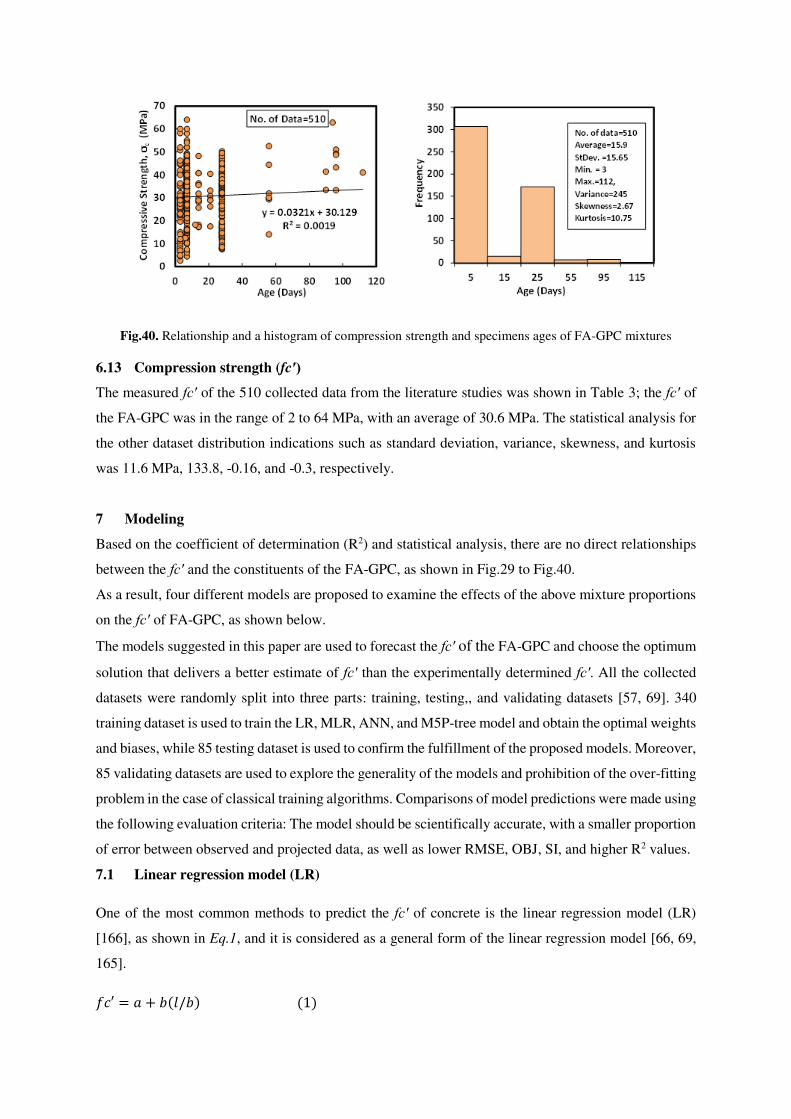
Fig.40. Relationship and a histogram of compression strength and specimens ages of FA-GPC mixtures
6.13 Compression strength (fc′) The measured fc′ of the 510 collected data from the literature studies was shown in Table 3; the fc′ of
the FA-GPC was in the range of 2 to 64 MPa, with an average of 30.6 MPa. The statistical analysis for
the other dataset distribution indications such as standard deviation, variance, skewness, and kurtosis
was 11.6 MPa, 133.8, -0.16, and -0.3, respectively.
7 Modeling
Based on the coefficient of determination (R2) and statistical analysis, there are no direct relationships
between the fc′ and the constituents of the FA-GPC, as shown in Fig.29 to Fig.40.
As a result, four different models are proposed to examine the effects of the above mixture proportions
on the fc′ of FA-GPC, as shown below.
The models suggested in this paper are used to forecast the fc′ of the FA-GPC and choose the optimum
solution that delivers a better estimate of fc′ than the experimentally determined fc′. All the collected
datasets were randomly split into three parts: training, testing,, and validating datasets [57, 69]. 340
training dataset is used to train the LR, MLR, ANN, and M5P-tree model and obtain the optimal weights
and biases, while 85 testing dataset is used to confirm the fulfillment of the proposed models. Moreover,
85 validating datasets are used to explore the generality of the models and prohibition of the over-fitting
problem in the case of classical training algorithms. Comparisons of model predictions were made using
the following evaluation criteria: The model should be scientifically accurate, with a smaller proportion
of error between observed and projected data, as well as lower RMSE, OBJ, SI, and higher R2 values.
7.1 Linear regression model (LR)
One of the most common methods to predict the fc′ of concrete is the linear regression model (LR)
[166], as shown in Eq.1, and it is considered as a general form of the linear regression model [66, 69,
165]. 𝑓𝑐′ = 𝑎 + 𝑏(𝑙/𝑏) (1)
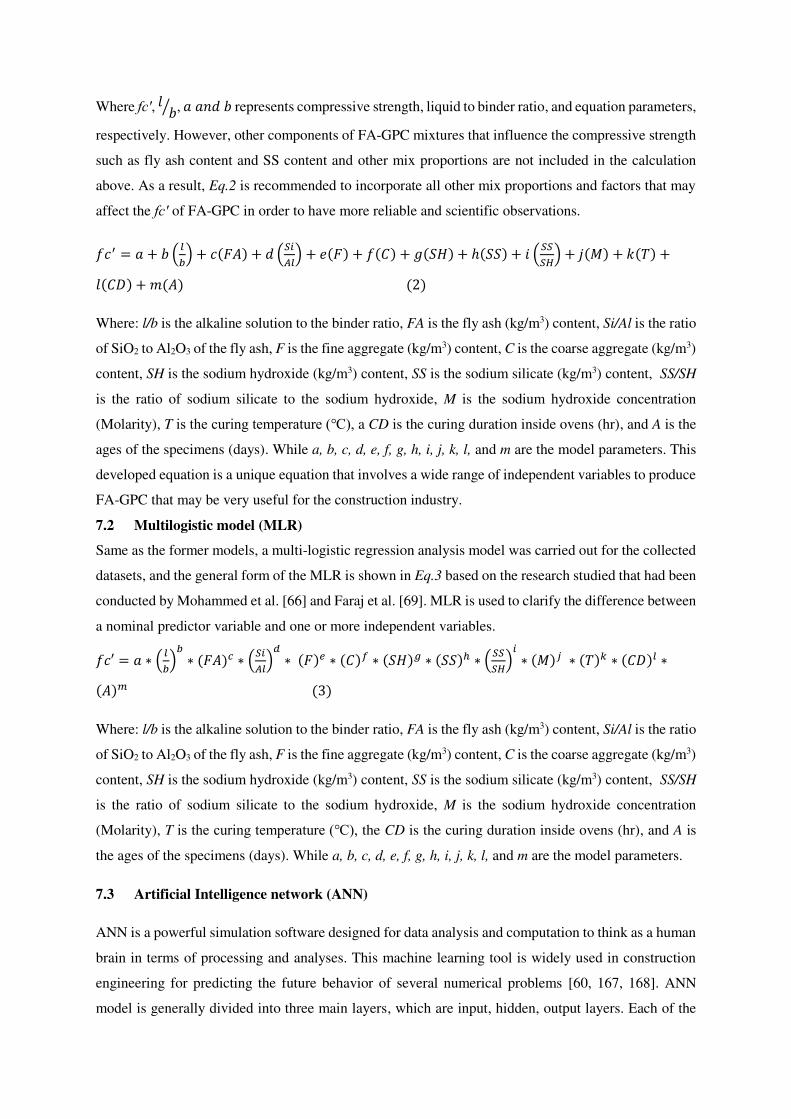
Where fc′, 𝑙 𝑏⁄ , 𝑎 𝑎𝑛𝑑 𝑏 represents compressive strength, liquid to binder ratio, and equation parameters,
respectively. However, other components of FA-GPC mixtures that influence the compressive strength
such as fly ash content and SS content and other mix proportions are not included in the calculation
above. As a result, Eq.2 is recommended to incorporate all other mix proportions and factors that may
affect the fc′ of FA-GPC in order to have more reliable and scientific observations.
𝑓𝑐′ = 𝑎 + 𝑏 ( 𝑙𝑏) + 𝑐(𝐹𝐴) + 𝑑 (𝑆𝑖𝐴𝑙) + 𝑒(𝐹) + 𝑓(𝐶) + 𝑔(𝑆𝐻) + ℎ(𝑆𝑆) + 𝑖 (𝑆𝑆𝑆𝐻) + 𝑗(𝑀) + 𝑘(𝑇) +𝑙(𝐶𝐷) + 𝑚(𝐴) (2)
Where: l/b is the alkaline solution to the binder ratio, FA is the fly ash (kg/m3) content, Si/Al is the ratio
of SiO2 to Al2O3 of the fly ash, F is the fine aggregate (kg/m3) content, C is the coarse aggregate (kg/m3)
content, SH is the sodium hydroxide (kg/m3) content, SS is the sodium silicate (kg/m3) content, SS/SH
is the ratio of sodium silicate to the sodium hydroxide, M is the sodium hydroxide concentration
(Molarity), T is the curing temperature (℃), a CD is the curing duration inside ovens (hr), and A is the
ages of the specimens (days). While a, b, c, d, e, f, g, h, i, j, k, l, and m are the model parameters. This
developed equation is a unique equation that involves a wide range of independent variables to produce
FA-GPC that may be very useful for the construction industry.
7.2 Multilogistic model (MLR)
Same as the former models, a multi-logistic regression analysis model was carried out for the collected
datasets, and the general form of the MLR is shown in Eq.3 based on the research studied that had been
conducted by Mohammed et al. [66] and Faraj et al. [69]. MLR is used to clarify the difference between
a nominal predictor variable and one or more independent variables. 𝑓𝑐′ = 𝑎 ∗ ( 𝑙𝑏)𝑏 ∗ (𝐹𝐴)𝑐 ∗ (𝑆𝑖𝐴𝑙)𝑑 ∗ (𝐹)𝑒 ∗ (𝐶)𝑓 ∗ (𝑆𝐻)𝑔 ∗ (𝑆𝑆)ℎ ∗ (𝑆𝑆𝑆𝐻)𝑖 ∗ (𝑀)𝑗 ∗ (𝑇)𝑘 ∗ (𝐶𝐷)𝑙 ∗(𝐴)𝑚 (3)
Where: l/b is the alkaline solution to the binder ratio, FA is the fly ash (kg/m3) content, Si/Al is the ratio
of SiO2 to Al2O3 of the fly ash, F is the fine aggregate (kg/m3) content, C is the coarse aggregate (kg/m3)
content, SH is the sodium hydroxide (kg/m3) content, SS is the sodium silicate (kg/m3) content, SS/SH
is the ratio of sodium silicate to the sodium hydroxide, M is the sodium hydroxide concentration
(Molarity), T is the curing temperature (℃), the CD is the curing duration inside ovens (hr), and A is
the ages of the specimens (days). While a, b, c, d, e, f, g, h, i, j, k, l, and m are the model parameters.
7.3 Artificial Intelligence network (ANN)
ANN is a powerful simulation software designed for data analysis and computation to think as a human
brain in terms of processing and analyses. This machine learning tool is widely used in construction
engineering for predicting the future behavior of several numerical problems [60, 167, 168]. ANN
model is generally divided into three main layers, which are input, hidden, output layers. Each of the
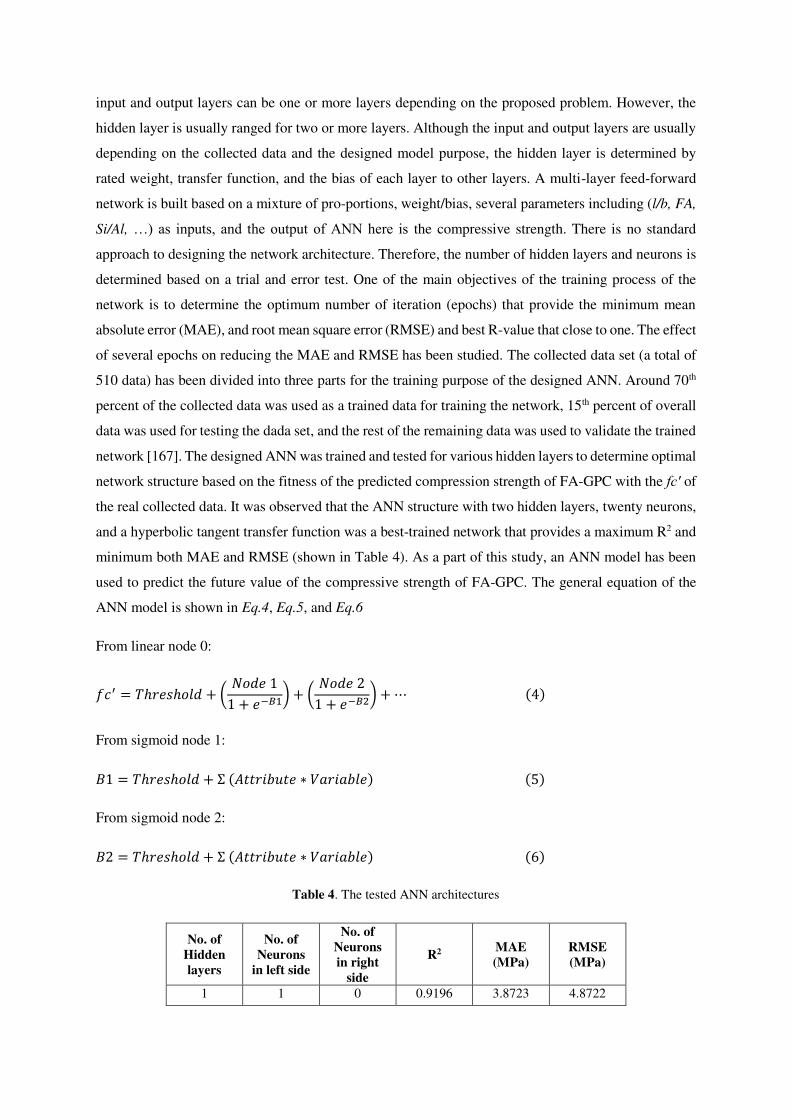
input and output layers can be one or more layers depending on the proposed problem. However, the
hidden layer is usually ranged for two or more layers. Although the input and output layers are usually
depending on the collected data and the designed model purpose, the hidden layer is determined by
rated weight, transfer function, and the bias of each layer to other layers. A multi-layer feed-forward
network is built based on a mixture of pro-portions, weight/bias, several parameters including (l/b, FA,
Si/Al, …) as inputs, and the output of ANN here is the compressive strength. There is no standard
approach to designing the network architecture. Therefore, the number of hidden layers and neurons is
determined based on a trial and error test. One of the main objectives of the training process of the
network is to determine the optimum number of iteration (epochs) that provide the minimum mean
absolute error (MAE), and root mean square error (RMSE) and best R-value that close to one. The effect
of several epochs on reducing the MAE and RMSE has been studied. The collected data set (a total of
510 data) has been divided into three parts for the training purpose of the designed ANN. Around 70th
percent of the collected data was used as a trained data for training the network, 15th percent of overall
data was used for testing the dada set, and the rest of the remaining data was used to validate the trained
network [167]. The designed ANN was trained and tested for various hidden layers to determine optimal
network structure based on the fitness of the predicted compression strength of FA-GPC with the fc′ of
the real collected data. It was observed that the ANN structure with two hidden layers, twenty neurons,
and a hyperbolic tangent transfer function was a best-trained network that provides a maximum R2 and
minimum both MAE and RMSE (shown in Table 4). As a part of this study, an ANN model has been
used to predict the future value of the compressive strength of FA-GPC. The general equation of the
ANN model is shown in Eq.4, Eq.5, and Eq.6
From linear node 0:
𝑓𝑐′ = 𝑇ℎ𝑟𝑒𝑠ℎ𝑜𝑙𝑑 + ( 𝑁𝑜𝑑𝑒 11 + 𝑒−𝐵1) + ( 𝑁𝑜𝑑𝑒 21 + 𝑒−𝐵2) + ⋯ (4)
From sigmoid node 1: 𝐵1 = 𝑇ℎ𝑟𝑒𝑠ℎ𝑜𝑙𝑑 + Ʃ (𝐴𝑡𝑡𝑟𝑖𝑏𝑢𝑡𝑒 ∗ 𝑉𝑎𝑟𝑖𝑎𝑏𝑙𝑒) (5)
From sigmoid node 2: 𝐵2 = 𝑇ℎ𝑟𝑒𝑠ℎ𝑜𝑙𝑑 + Ʃ (𝐴𝑡𝑡𝑟𝑖𝑏𝑢𝑡𝑒 ∗ 𝑉𝑎𝑟𝑖𝑎𝑏𝑙𝑒) (6)
Table 4. The tested ANN architectures
No. of
Hidden
layers
No. of
Neurons
in left side
No. of
Neurons
in right
side
R2 MAE
(MPa)
RMSE
(MPa)
1 1 0 0.9196 3.8723 4.8722
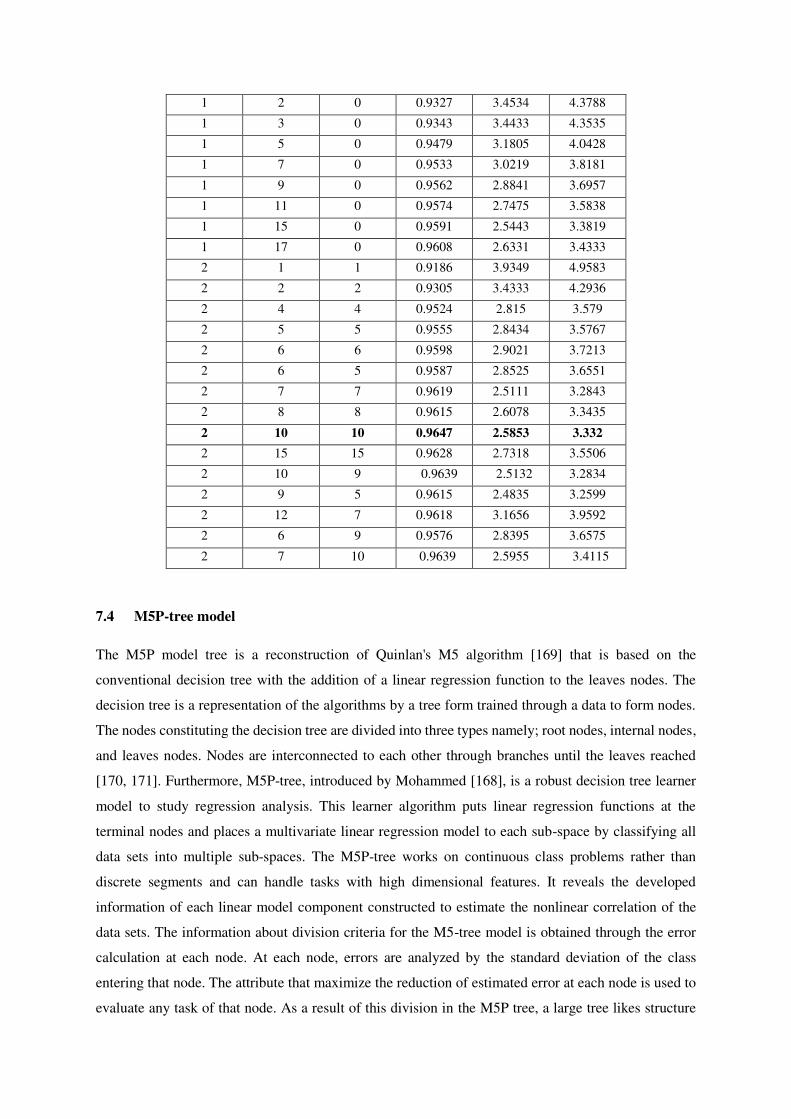
1 2 0 0.9327 3.4534 4.3788
1 3 0 0.9343 3.4433 4.3535
1 5 0 0.9479 3.1805 4.0428
1 7 0 0.9533 3.0219 3.8181
1 9 0 0.9562 2.8841 3.6957
1 11 0 0.9574 2.7475 3.5838
1 15 0 0.9591 2.5443 3.3819
1 17 0 0.9608 2.6331 3.4333
2 1 1 0.9186 3.9349 4.9583
2 2 2 0.9305 3.4333 4.2936
2 4 4 0.9524 2.815 3.579
2 5 5 0.9555 2.8434 3.5767
2 6 6 0.9598 2.9021 3.7213
2 6 5 0.9587 2.8525 3.6551
2 7 7 0.9619 2.5111 3.2843
2 8 8 0.9615 2.6078 3.3435
2 10 10 0.9647 2.5853 3.332
2 15 15 0.9628 2.7318 3.5506
2 10 9 0.9639 2.5132 3.2834
2 9 5 0.9615 2.4835 3.2599
2 12 7 0.9618 3.1656 3.9592
2 6 9 0.9576 2.8395 3.6575
2 7 10 0.9639 2.5955 3.4115
7.4 M5P-tree model
The M5P model tree is a reconstruction of Quinlan's M5 algorithm [169] that is based on the
conventional decision tree with the addition of a linear regression function to the leaves nodes. The
decision tree is a representation of the algorithms by a tree form trained through a data to form nodes.
The nodes constituting the decision tree are divided into three types namely; root nodes, internal nodes,
and leaves nodes. Nodes are interconnected to each other through branches until the leaves reached
[170, 171]. Furthermore, M5P-tree, introduced by Mohammed [168], is a robust decision tree learner
model to study regression analysis. This learner algorithm puts linear regression functions at the
terminal nodes and places a multivariate linear regression model to each sub-space by classifying all
data sets into multiple sub-spaces. The M5P-tree works on continuous class problems rather than
discrete segments and can handle tasks with high dimensional features. It reveals the developed
information of each linear model component constructed to estimate the nonlinear correlation of the
data sets. The information about division criteria for the M5-tree model is obtained through the error
calculation at each node. At each node, errors are analyzed by the standard deviation of the class
entering that node. The attribute that maximize the reduction of estimated error at each node is used to
evaluate any task of that node. As a result of this division in the M5P tree, a large tree likes structure
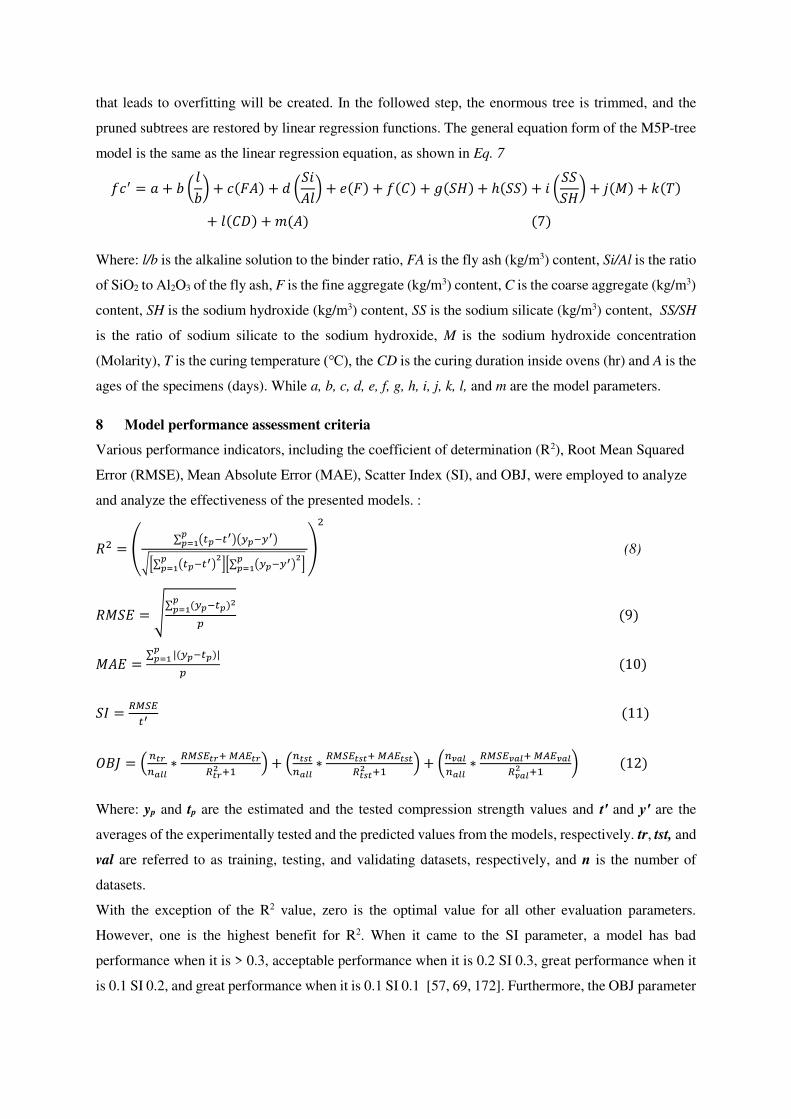
that leads to overfitting will be created. In the followed step, the enormous tree is trimmed, and the
pruned subtrees are restored by linear regression functions. The general equation form of the M5P-tree
model is the same as the linear regression equation, as shown in Eq. 7 𝑓𝑐′ = 𝑎 + 𝑏 (𝑙𝑏) + 𝑐(𝐹𝐴) + 𝑑 (𝑆𝑖𝐴𝑙) + 𝑒(𝐹) + 𝑓(𝐶) + 𝑔(𝑆𝐻) + ℎ(𝑆𝑆) + 𝑖 (𝑆𝑆𝑆𝐻) + 𝑗(𝑀) + 𝑘(𝑇)+ 𝑙(𝐶𝐷) + 𝑚(𝐴) (7)
Where: l/b is the alkaline solution to the binder ratio, FA is the fly ash (kg/m3) content, Si/Al is the ratio
of SiO2 to Al2O3 of the fly ash, F is the fine aggregate (kg/m3) content, C is the coarse aggregate (kg/m3)
content, SH is the sodium hydroxide (kg/m3) content, SS is the sodium silicate (kg/m3) content, SS/SH
is the ratio of sodium silicate to the sodium hydroxide, M is the sodium hydroxide concentration
(Molarity), T is the curing temperature (℃), the CD is the curing duration inside ovens (hr) and A is the
ages of the specimens (days). While a, b, c, d, e, f, g, h, i, j, k, l, and m are the model parameters.
8 Model performance assessment criteria
Various performance indicators, including the coefficient of determination (R2), Root Mean Squared
Error (RMSE), Mean Absolute Error (MAE), Scatter Index (SI), and OBJ, were employed to analyze
and analyze the effectiveness of the presented models. :
𝑅2 = ( ∑ (𝑡𝑝−𝑡′)(𝑦𝑝−𝑦′)𝑝𝑝=1√[∑ (𝑡𝑝−𝑡′)2𝑝𝑝=1 ][∑ (𝑦𝑝−𝑦′)2𝑝𝑝=1 ] )2 (8)
𝑅𝑀𝑆𝐸 = √∑ (𝑦𝑝−𝑡𝑝)2𝑝𝑝=1 𝑝 (9)
𝑀𝐴𝐸 = ∑ |(𝑦𝑝−𝑡𝑝)|𝑝𝑝=1 𝑝 (10) 𝑆𝐼 = 𝑅𝑀𝑆𝐸𝑡′ (11)
𝑂𝐵𝐽 = ( 𝑛𝑡𝑟𝑛𝑎𝑙𝑙 ∗ 𝑅𝑀𝑆𝐸𝑡𝑟+ 𝑀𝐴𝐸𝑡𝑟𝑅𝑡𝑟2 +1 ) + (𝑛𝑡𝑠𝑡𝑛𝑎𝑙𝑙 ∗ 𝑅𝑀𝑆𝐸𝑡𝑠𝑡+ 𝑀𝐴𝐸𝑡𝑠𝑡𝑅𝑡𝑠𝑡2 +1 ) + (𝑛𝑣𝑎𝑙𝑛𝑎𝑙𝑙 ∗ 𝑅𝑀𝑆𝐸𝑣𝑎𝑙+ 𝑀𝐴𝐸𝑣𝑎𝑙𝑅𝑣𝑎𝑙2 +1 ) (12)
Where: yp and tp are the estimated and the tested compression strength values and t′ and y′ are the
averages of the experimentally tested and the predicted values from the models, respectively. tr, tst, and
val are referred to as training, testing, and validating datasets, respectively, and n is the number of
datasets.
With the exception of the R2 value, zero is the optimal value for all other evaluation parameters.
However, one is the highest benefit for R2. When it came to the SI parameter, a model has bad
performance when it is > 0.3, acceptable performance when it is 0.2 SI 0.3, great performance when it
is 0.1 SI 0.2, and great performance when it is 0.1 SI 0.1 [57, 69, 172]. Furthermore, the OBJ parameter
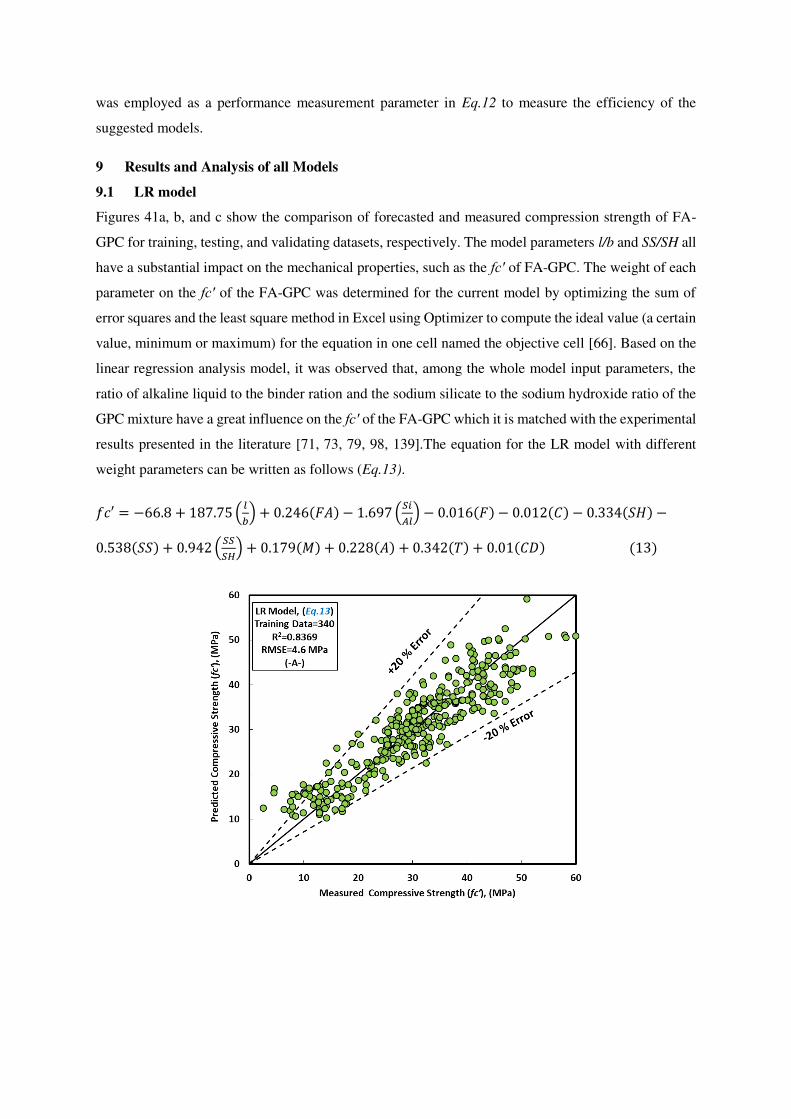
was employed as a performance measurement parameter in Eq.12 to measure the efficiency of the
suggested models.
9 Results and Analysis of all Models
9.1 LR model
Figures 41a, b, and c show the comparison of forecasted and measured compression strength of FA-
GPC for training, testing, and validating datasets, respectively. The model parameters l/b and SS/SH all
have a substantial impact on the mechanical properties, such as the fc′ of FA-GPC. The weight of each
parameter on the fc′ of the FA-GPC was determined for the current model by optimizing the sum of
error squares and the least square method in Excel using Optimizer to compute the ideal value (a certain
value, minimum or maximum) for the equation in one cell named the objective cell [66]. Based on the
linear regression analysis model, it was observed that, among the whole model input parameters, the
ratio of alkaline liquid to the binder ration and the sodium silicate to the sodium hydroxide ratio of the
GPC mixture have a great influence on the fc′ of the FA-GPC which it is matched with the experimental
results presented in the literature [71, 73, 79, 98, 139].The equation for the LR model with different
weight parameters can be written as follows (Eq.13).
𝑓𝑐′ = −66.8 + 187.75 ( 𝑙𝑏) + 0.246(𝐹𝐴) − 1.697 (𝑆𝑖𝐴𝑙) − 0.016(𝐹) − 0.012(𝐶) − 0.334(𝑆𝐻) −0.538(𝑆𝑆) + 0.942 (𝑆𝑆𝑆𝐻) + 0.179(𝑀) + 0.228(𝐴) + 0.342(𝑇) + 0.01(𝐶𝐷) (13)
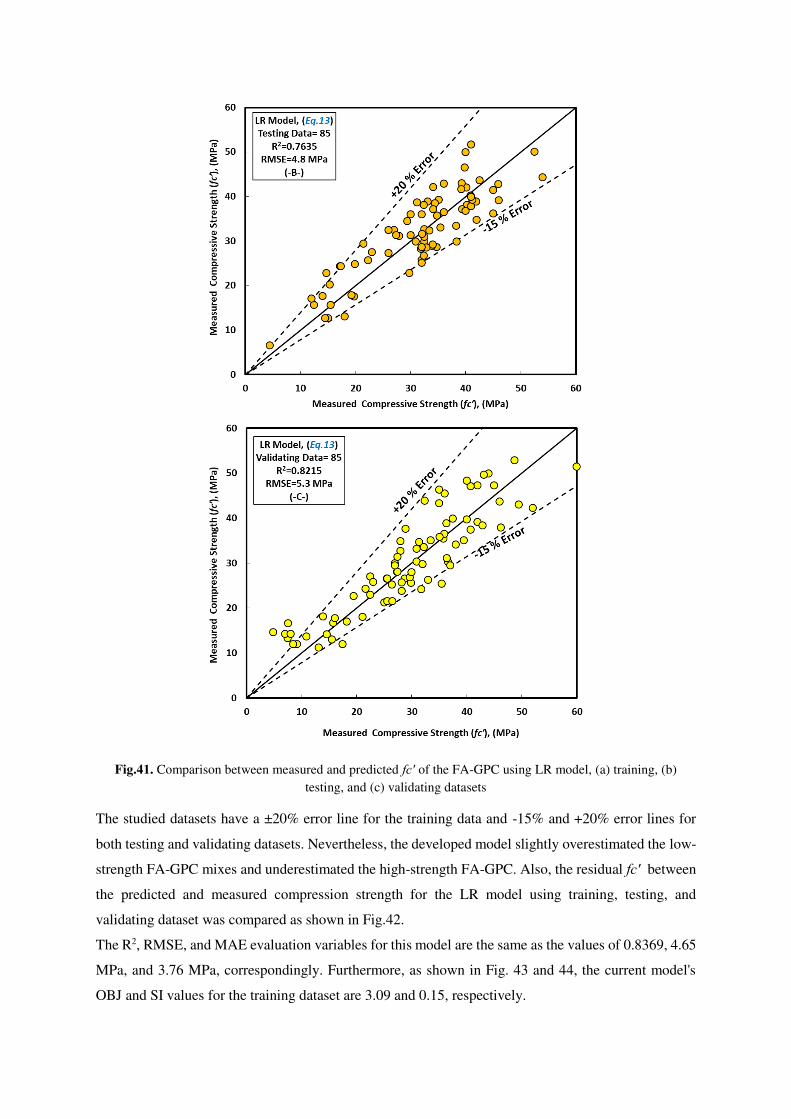
Fig.41. Comparison between measured and predicted fc′ of the FA-GPC using LR model, (a) training, (b)
testing, and (c) validating datasets
The studied datasets have a ±20% error line for the training data and -15% and +20% error lines for
both testing and validating datasets. Nevertheless, the developed model slightly overestimated the low-
strength FA-GPC mixes and underestimated the high-strength FA-GPC. Also, the residual fc′ between
the predicted and measured compression strength for the LR model using training, testing, and
validating dataset was compared as shown in Fig.42.
The R2, RMSE, and MAE evaluation variables for this model are the same as the values of 0.8369, 4.65
MPa, and 3.76 MPa, correspondingly. Furthermore, as shown in Fig. 43 and 44, the current model's
OBJ and SI values for the training dataset are 3.09 and 0.15, respectively.
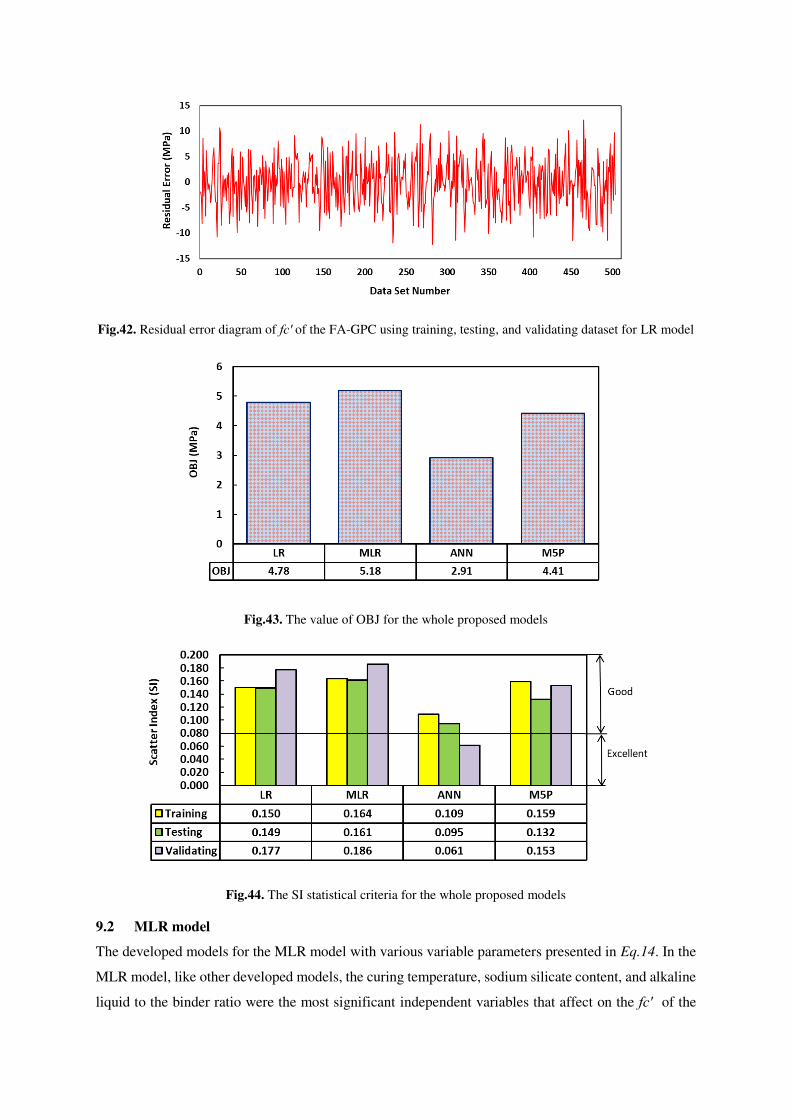
Fig.42. Residual error diagram of fc′ of the FA-GPC using training, testing, and validating dataset for LR model
Fig.43. The value of OBJ for the whole proposed models
Fig.44. The SI statistical criteria for the whole proposed models
9.2 MLR model
The developed models for the MLR model with various variable parameters presented in Eq.14. In the
MLR model, like other developed models, the curing temperature, sodium silicate content, and alkaline
liquid to the binder ratio were the most significant independent variables that affect on the fc′ of the
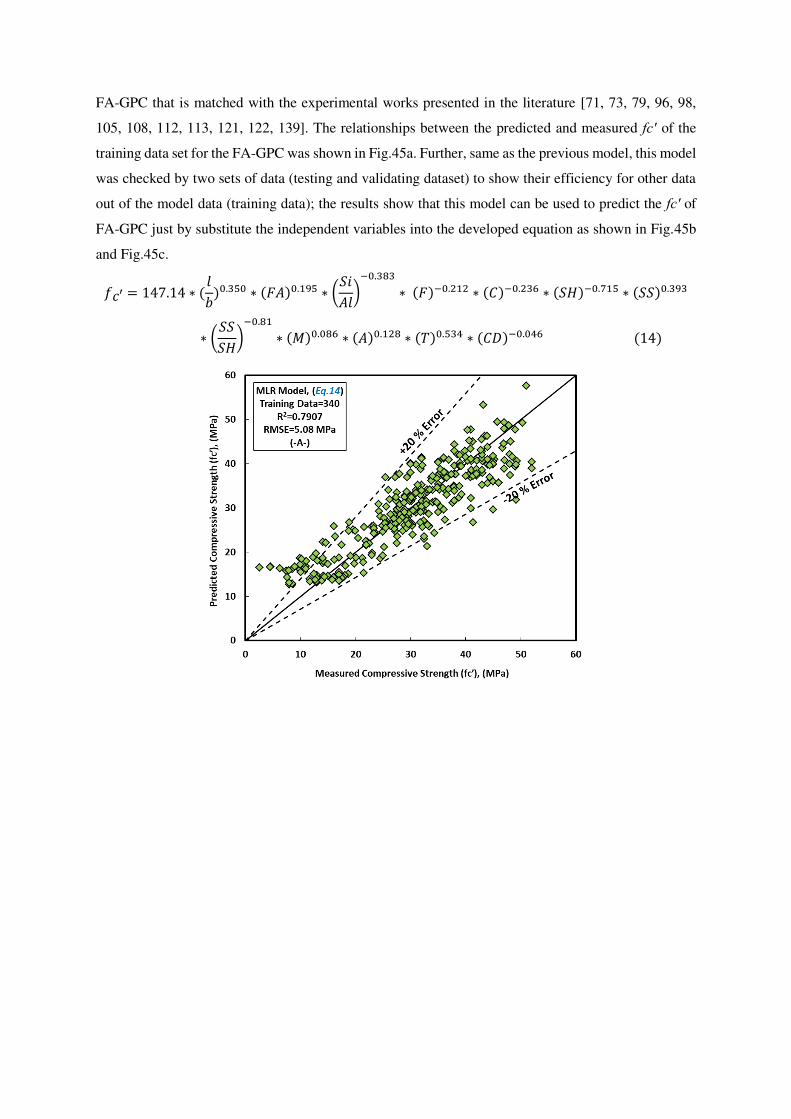
FA-GPC that is matched with the experimental works presented in the literature [71, 73, 79, 96, 98,
105, 108, 112, 113, 121, 122, 139]. The relationships between the predicted and measured fc′ of the
training data set for the FA-GPC was shown in Fig.45a. Further, same as the previous model, this model
was checked by two sets of data (testing and validating dataset) to show their efficiency for other data
out of the model data (training data); the results show that this model can be used to predict the fc′ of
FA-GPC just by substitute the independent variables into the developed equation as shown in Fig.45b
and Fig.45c. 𝑓𝑐′ = 147.14 ∗ (𝑙𝑏)0.350 ∗ (𝐹𝐴)0.195 ∗ (𝑆𝑖𝐴𝑙)−0.383 ∗ (𝐹)−0.212 ∗ (𝐶)−0.236 ∗ (𝑆𝐻)−0.715 ∗ (𝑆𝑆)0.393∗ (𝑆𝑆𝑆𝐻)−0.81 ∗ (𝑀)0.086 ∗ (𝐴)0.128 ∗ (𝑇)0.534 ∗ (𝐶𝐷)−0.046 (14)
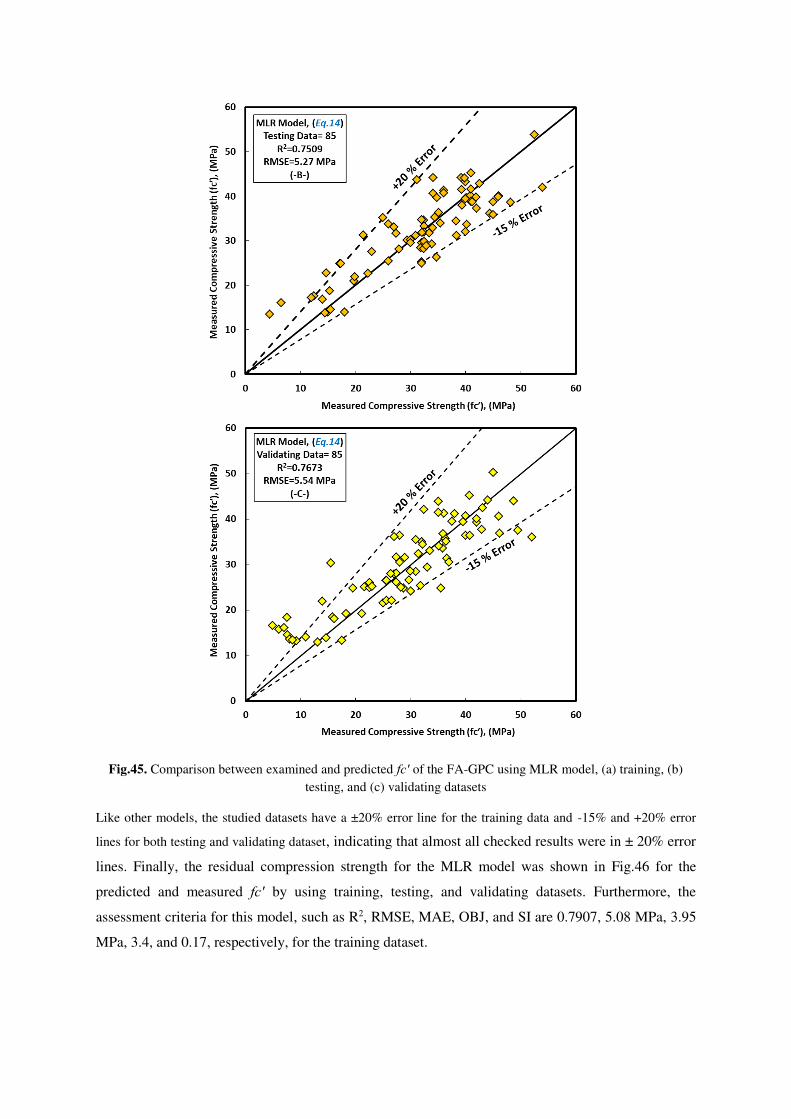
Fig.45. Comparison between examined and predicted fc′ of the FA-GPC using MLR model, (a) training, (b)
testing, and (c) validating datasets
Like other models, the studied datasets have a ±20% error line for the training data and -15% and +20% error
lines for both testing and validating dataset, indicating that almost all checked results were in ± 20% error
lines. Finally, the residual compression strength for the MLR model was shown in Fig.46 for the
predicted and measured fc′ by using training, testing, and validating datasets. Furthermore, the
assessment criteria for this model, such as R2, RMSE, MAE, OBJ, and SI are 0.7907, 5.08 MPa, 3.95
MPa, 3.4, and 0.17, respectively, for the training dataset.
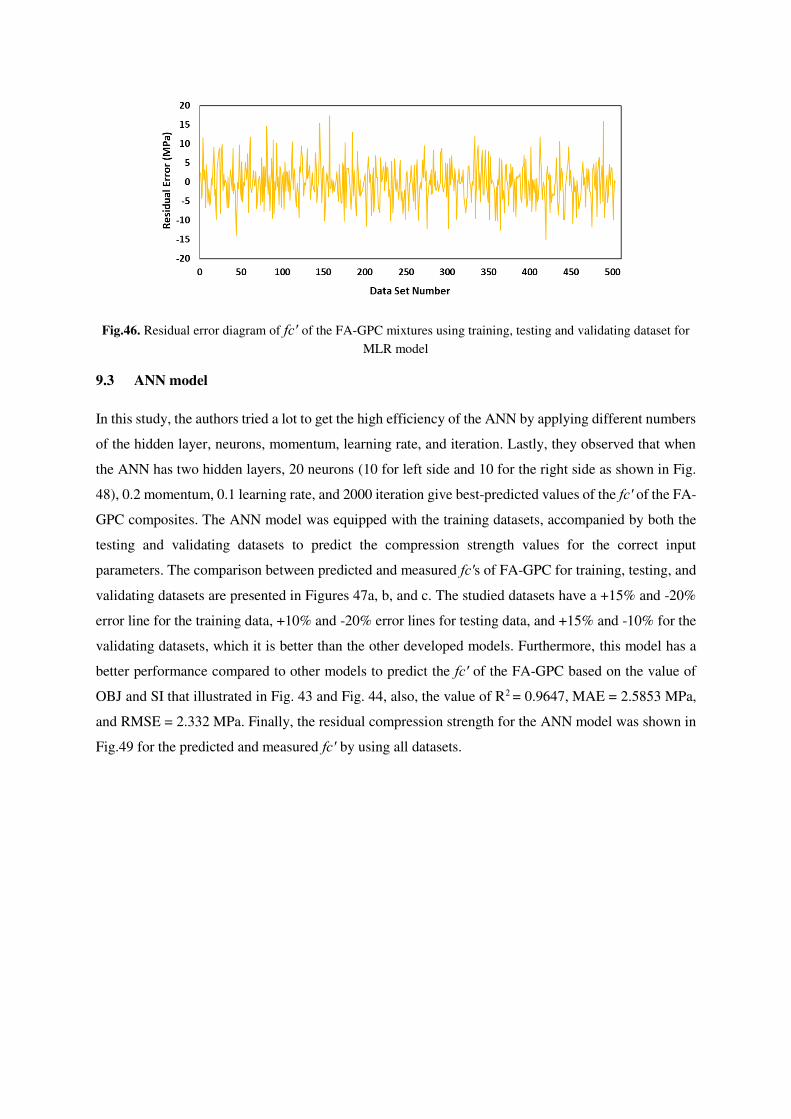
Fig.46. Residual error diagram of fc′ of the FA-GPC mixtures using training, testing and validating dataset for
MLR model
9.3 ANN model
In this study, the authors tried a lot to get the high efficiency of the ANN by applying different numbers
of the hidden layer, neurons, momentum, learning rate, and iteration. Lastly, they observed that when
the ANN has two hidden layers, 20 neurons (10 for left side and 10 for the right side as shown in Fig.
48), 0.2 momentum, 0.1 learning rate, and 2000 iteration give best-predicted values of the fc′ of the FA-
GPC composites. The ANN model was equipped with the training datasets, accompanied by both the
testing and validating datasets to predict the compression strength values for the correct input
parameters. The comparison between predicted and measured fc′s of FA-GPC for training, testing, and
validating datasets are presented in Figures 47a, b, and c. The studied datasets have a +15% and -20%
error line for the training data, +10% and -20% error lines for testing data, and +15% and -10% for the
validating datasets, which it is better than the other developed models. Furthermore, this model has a
better performance compared to other models to predict the fc′ of the FA-GPC based on the value of
OBJ and SI that illustrated in Fig. 43 and Fig. 44, also, the value of R2 = 0.9647, MAE = 2.5853 MPa,
and RMSE = 2.332 MPa. Finally, the residual compression strength for the ANN model was shown in
Fig.49 for the predicted and measured fc′ by using all datasets.
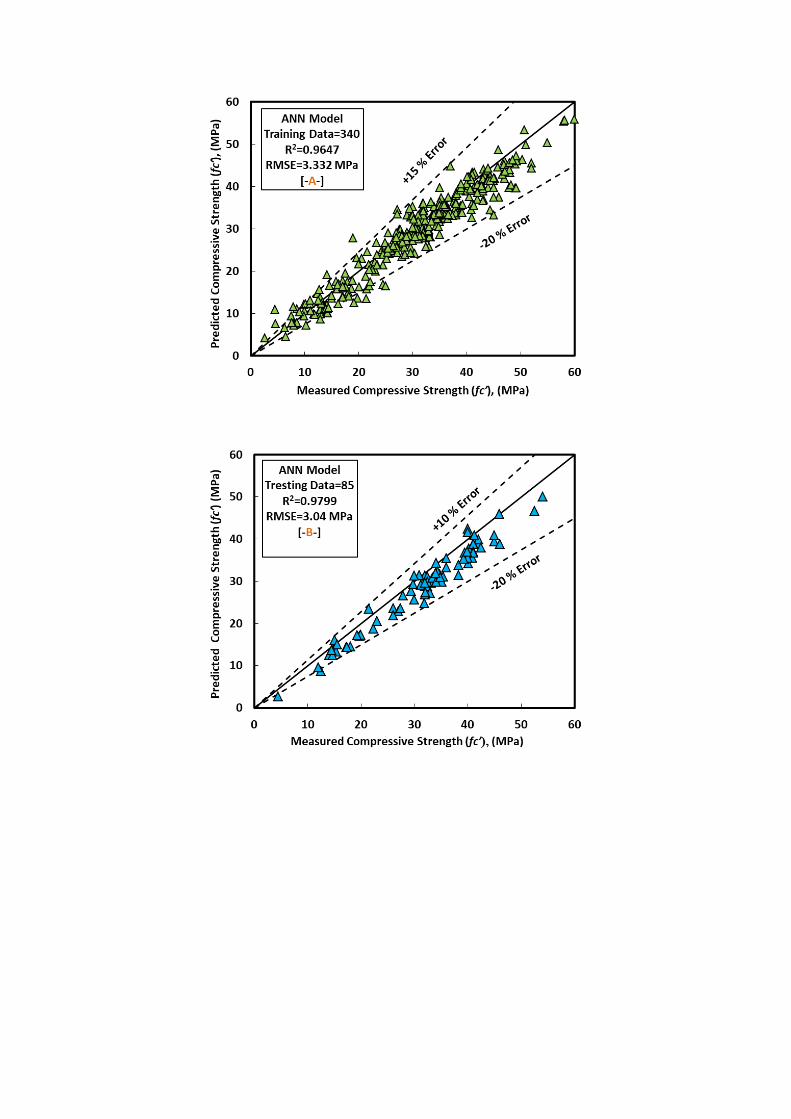
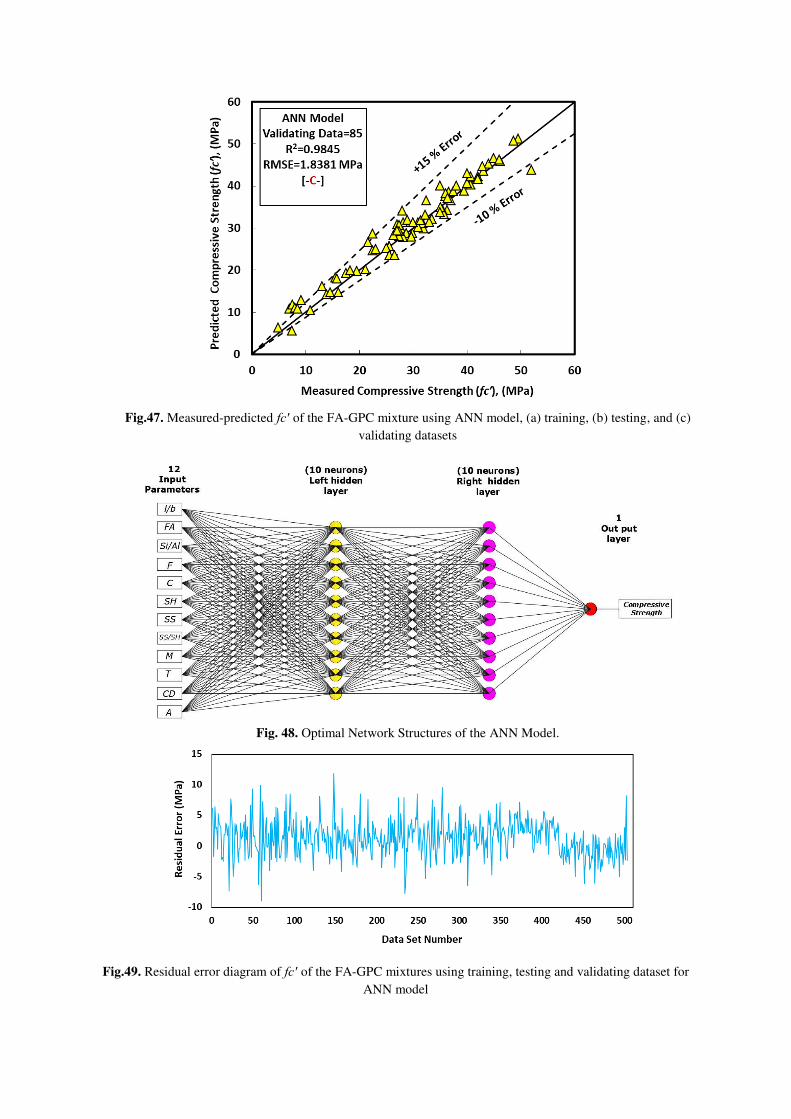
Fig.47. Measured-predicted fc′ of the FA-GPC mixture using ANN model, (a) training, (b) testing, and (c)
validating datasets
Fig. 48. Optimal Network Structures of the ANN Model.
Fig.49. Residual error diagram of fc′ of the FA-GPC mixtures using training, testing and validating dataset for
ANN model
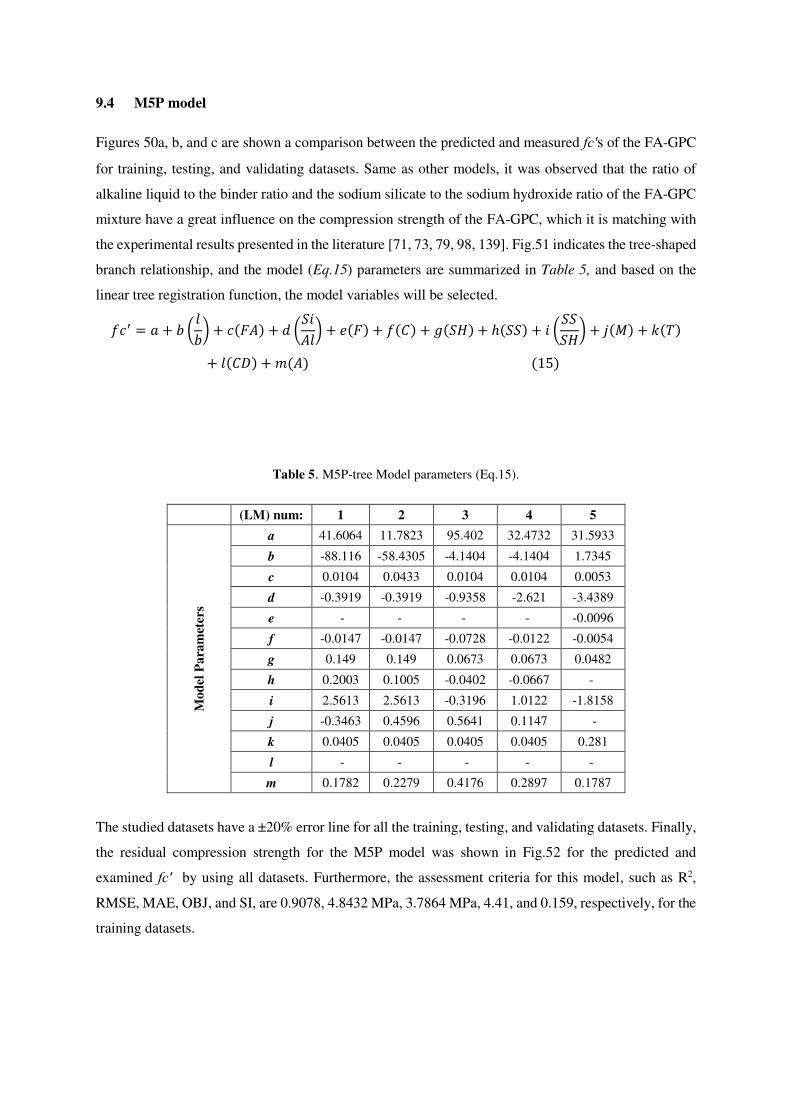
9.4 M5P model
Figures 50a, b, and c are shown a comparison between the predicted and measured fc′s of the FA-GPC
for training, testing, and validating datasets. Same as other models, it was observed that the ratio of
alkaline liquid to the binder ratio and the sodium silicate to the sodium hydroxide ratio of the FA-GPC
mixture have a great influence on the compression strength of the FA-GPC, which it is matching with
the experimental results presented in the literature [71, 73, 79, 98, 139]. Fig.51 indicates the tree-shaped
branch relationship, and the model (Eq.15) parameters are summarized in Table 5, and based on the
linear tree registration function, the model variables will be selected. 𝑓𝑐′ = 𝑎 + 𝑏 (𝑙𝑏) + 𝑐(𝐹𝐴) + 𝑑 (𝑆𝑖𝐴𝑙) + 𝑒(𝐹) + 𝑓(𝐶) + 𝑔(𝑆𝐻) + ℎ(𝑆𝑆) + 𝑖 (𝑆𝑆𝑆𝐻) + 𝑗(𝑀) + 𝑘(𝑇)+ 𝑙(𝐶𝐷) + 𝑚(𝐴) (15)
Table 5. M5P-tree Model parameters (Eq.15).
(LM) num: 1 2 3 4 5
Mo
del
Pa
ram
eter
s
a 41.6064 11.7823 95.402 32.4732 31.5933
b -88.116 -58.4305 -4.1404 -4.1404 1.7345
c 0.0104 0.0433 0.0104 0.0104 0.0053
d -0.3919 -0.3919 -0.9358 -2.621 -3.4389
e - - - - -0.0096
f -0.0147 -0.0147 -0.0728 -0.0122 -0.0054
g 0.149 0.149 0.0673 0.0673 0.0482
h 0.2003 0.1005 -0.0402 -0.0667 -
i 2.5613 2.5613 -0.3196 1.0122 -1.8158
j -0.3463 0.4596 0.5641 0.1147 -
k 0.0405 0.0405 0.0405 0.0405 0.281
l - - - - -
m 0.1782 0.2279 0.4176 0.2897 0.1787
The studied datasets have a ±20% error line for all the training, testing, and validating datasets. Finally,
the residual compression strength for the M5P model was shown in Fig.52 for the predicted and
examined fc′ by using all datasets. Furthermore, the assessment criteria for this model, such as R2,
RMSE, MAE, OBJ, and SI, are 0.9078, 4.8432 MPa, 3.7864 MPa, 4.41, and 0.159, respectively, for the
training datasets.
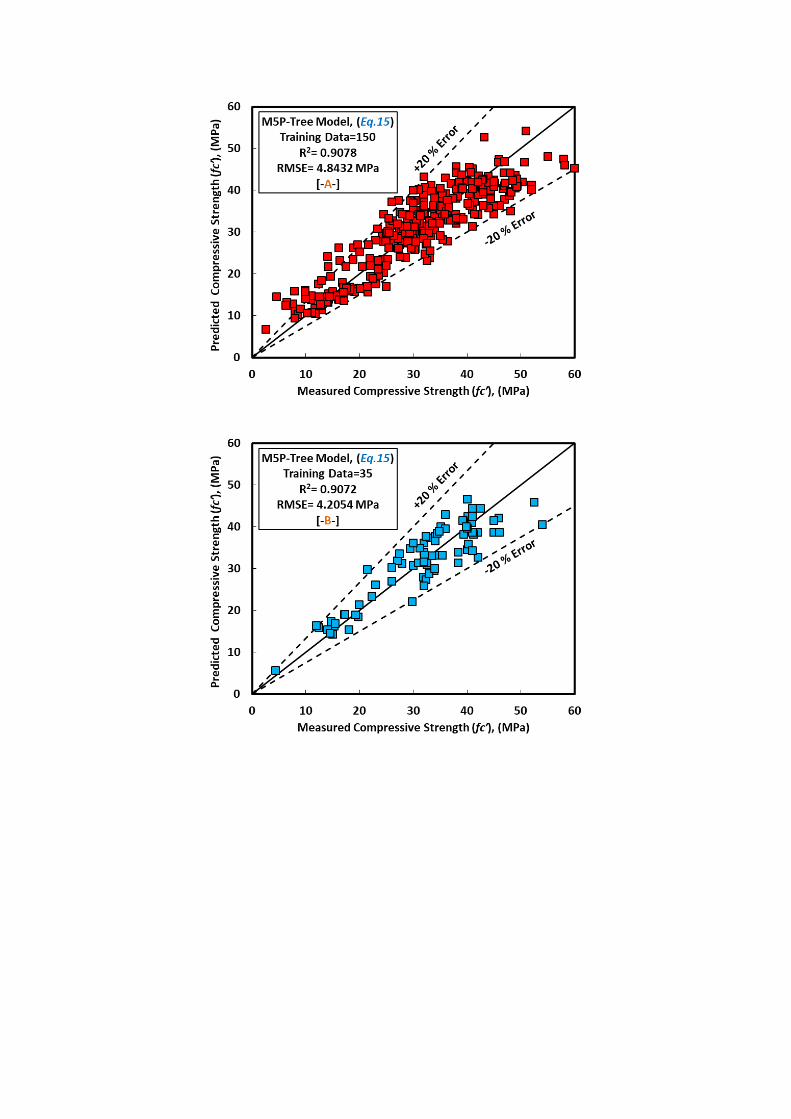
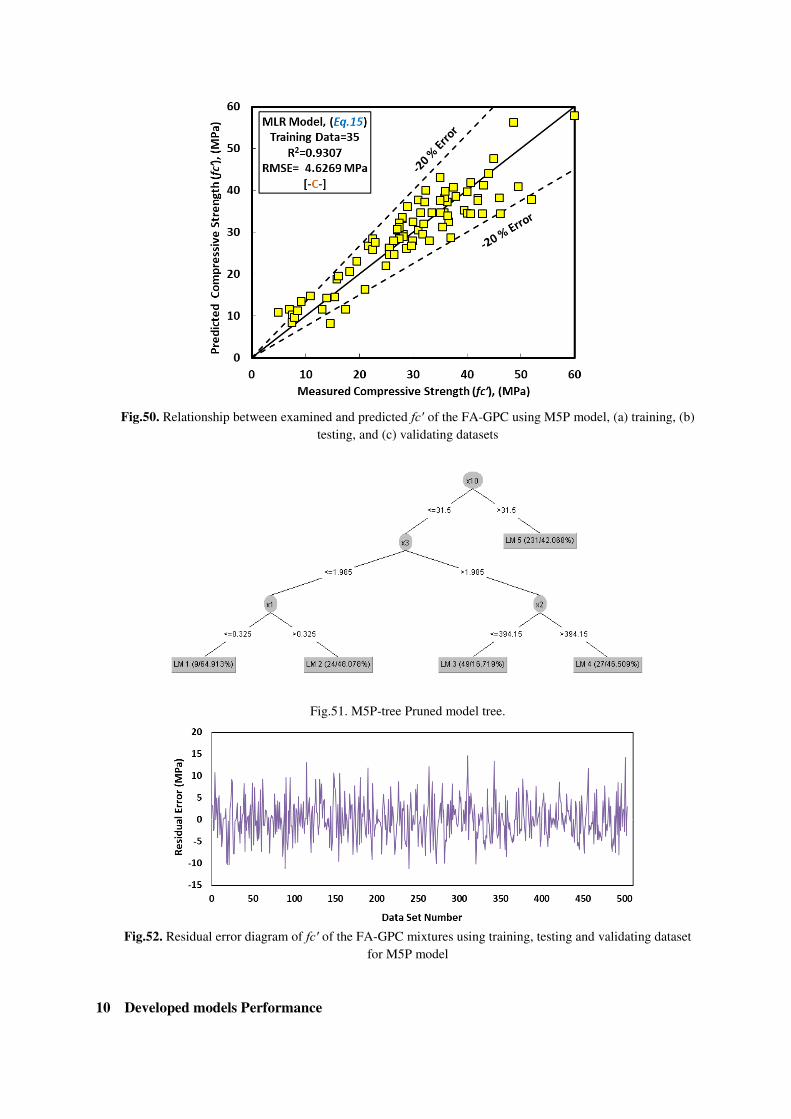
Fig.50. Relationship between examined and predicted fc′ of the FA-GPC using M5P model, (a) training, (b)
testing, and (c) validating datasets
Fig.51. M5P-tree Pruned model tree.
Fig.52. Residual error diagram of fc′ of the FA-GPC mixtures using training, testing and validating dataset
for M5P model
10 Developed models Performance
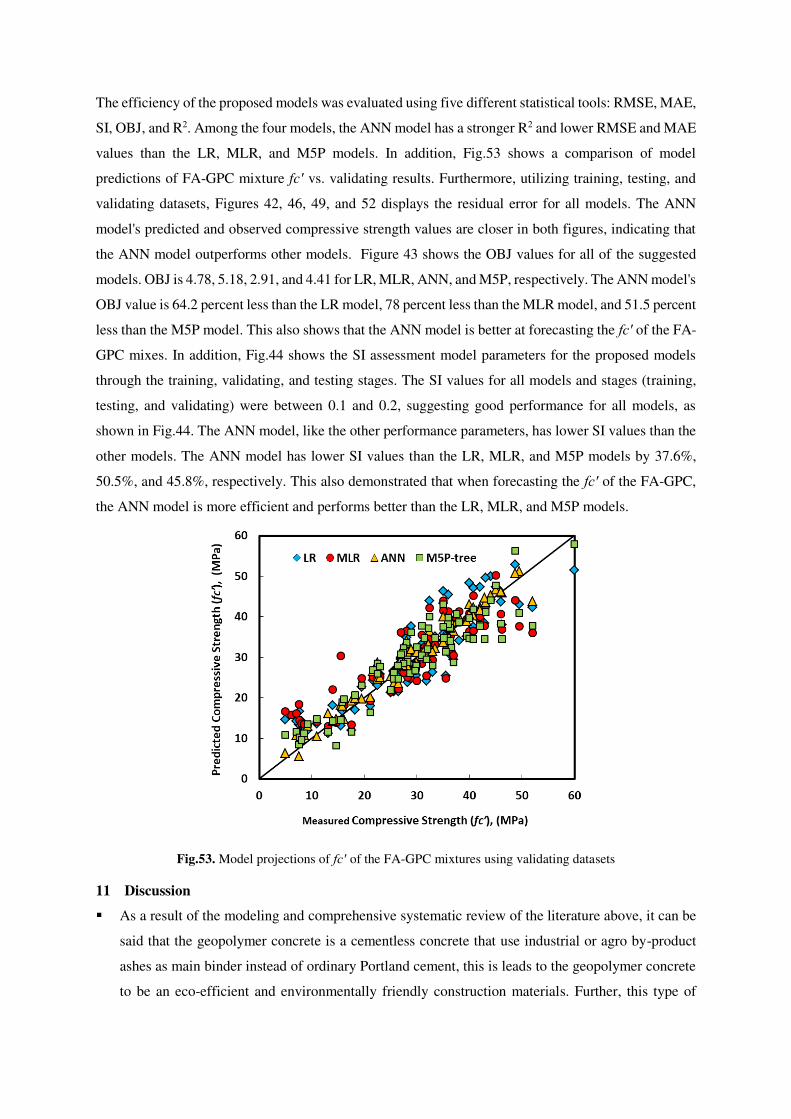
The efficiency of the proposed models was evaluated using five different statistical tools: RMSE, MAE,
SI, OBJ, and R2. Among the four models, the ANN model has a stronger R2 and lower RMSE and MAE
values than the LR, MLR, and M5P models. In addition, Fig.53 shows a comparison of model
predictions of FA-GPC mixture fc′ vs. validating results. Furthermore, utilizing training, testing, and
validating datasets, Figures 42, 46, 49, and 52 displays the residual error for all models. The ANN
model's predicted and observed compressive strength values are closer in both figures, indicating that
the ANN model outperforms other models. Figure 43 shows the OBJ values for all of the suggested
models. OBJ is 4.78, 5.18, 2.91, and 4.41 for LR, MLR, ANN, and M5P, respectively. The ANN model's
OBJ value is 64.2 percent less than the LR model, 78 percent less than the MLR model, and 51.5 percent
less than the M5P model. This also shows that the ANN model is better at forecasting the fc′ of the FA-
GPC mixes. In addition, Fig.44 shows the SI assessment model parameters for the proposed models
through the training, validating, and testing stages. The SI values for all models and stages (training,
testing, and validating) were between 0.1 and 0.2, suggesting good performance for all models, as
shown in Fig.44. The ANN model, like the other performance parameters, has lower SI values than the
other models. The ANN model has lower SI values than the LR, MLR, and M5P models by 37.6%,
50.5%, and 45.8%, respectively. This also demonstrated that when forecasting the fc′ of the FA-GPC,
the ANN model is more efficient and performs better than the LR, MLR, and M5P models.
Fig.53. Model projections of fc′ of the FA-GPC mixtures using validating datasets
11 Discussion
As a result of the modeling and comprehensive systematic review of the literature above, it can be
said that the geopolymer concrete is a cementless concrete that use industrial or agro by-product
ashes as main binder instead of ordinary Portland cement, this is leads to the geopolymer concrete
to be an eco-efficient and environmentally friendly construction materials. Further, this type of
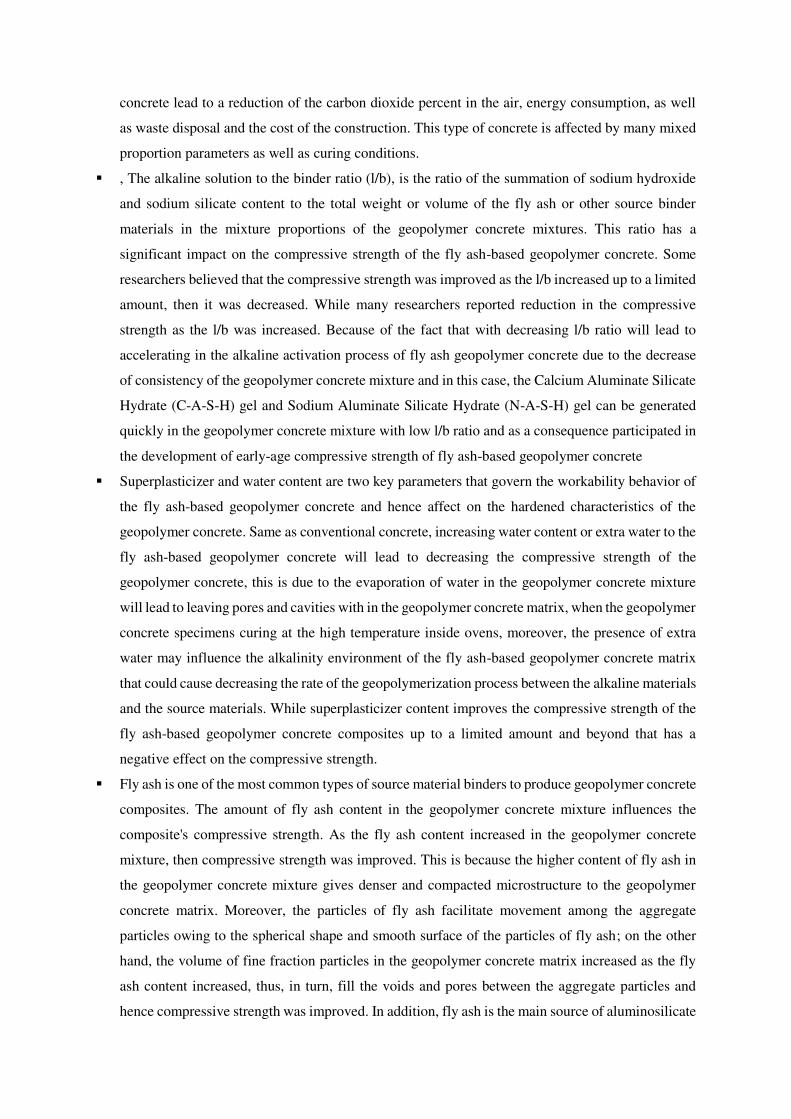
concrete lead to a reduction of the carbon dioxide percent in the air, energy consumption, as well
as waste disposal and the cost of the construction. This type of concrete is affected by many mixed
proportion parameters as well as curing conditions.
, The alkaline solution to the binder ratio (l/b), is the ratio of the summation of sodium hydroxide
and sodium silicate content to the total weight or volume of the fly ash or other source binder
materials in the mixture proportions of the geopolymer concrete mixtures. This ratio has a
significant impact on the compressive strength of the fly ash-based geopolymer concrete. Some
researchers believed that the compressive strength was improved as the l/b increased up to a limited
amount, then it was decreased. While many researchers reported reduction in the compressive
strength as the l/b was increased. Because of the fact that with decreasing l/b ratio will lead to
accelerating in the alkaline activation process of fly ash geopolymer concrete due to the decrease
of consistency of the geopolymer concrete mixture and in this case, the Calcium Aluminate Silicate
Hydrate (C-A-S-H) gel and Sodium Aluminate Silicate Hydrate (N-A-S-H) gel can be generated
quickly in the geopolymer concrete mixture with low l/b ratio and as a consequence participated in
the development of early-age compressive strength of fly ash-based geopolymer concrete
Superplasticizer and water content are two key parameters that govern the workability behavior of
the fly ash-based geopolymer concrete and hence affect on the hardened characteristics of the
geopolymer concrete. Same as conventional concrete, increasing water content or extra water to the
fly ash-based geopolymer concrete will lead to decreasing the compressive strength of the
geopolymer concrete, this is due to the evaporation of water in the geopolymer concrete mixture
will lead to leaving pores and cavities with in the geopolymer concrete matrix, when the geopolymer
concrete specimens curing at the high temperature inside ovens, moreover, the presence of extra
water may influence the alkalinity environment of the fly ash-based geopolymer concrete matrix
that could cause decreasing the rate of the geopolymerization process between the alkaline materials
and the source materials. While superplasticizer content improves the compressive strength of the
fly ash-based geopolymer concrete composites up to a limited amount and beyond that has a
negative effect on the compressive strength.
Fly ash is one of the most common types of source material binders to produce geopolymer concrete
composites. The amount of fly ash content in the geopolymer concrete mixture influences the
composite's compressive strength. As the fly ash content increased in the geopolymer concrete
mixture, then compressive strength was improved. This is because the higher content of fly ash in
the geopolymer concrete mixture gives denser and compacted microstructure to the geopolymer
concrete matrix. Moreover, the particles of fly ash facilitate movement among the aggregate
particles owing to the spherical shape and smooth surface of the particles of fly ash; on the other
hand, the volume of fine fraction particles in the geopolymer concrete matrix increased as the fly
ash content increased, thus, in turn, fill the voids and pores between the aggregate particles and
hence compressive strength was improved. In addition, fly ash is the main source of aluminosilicate
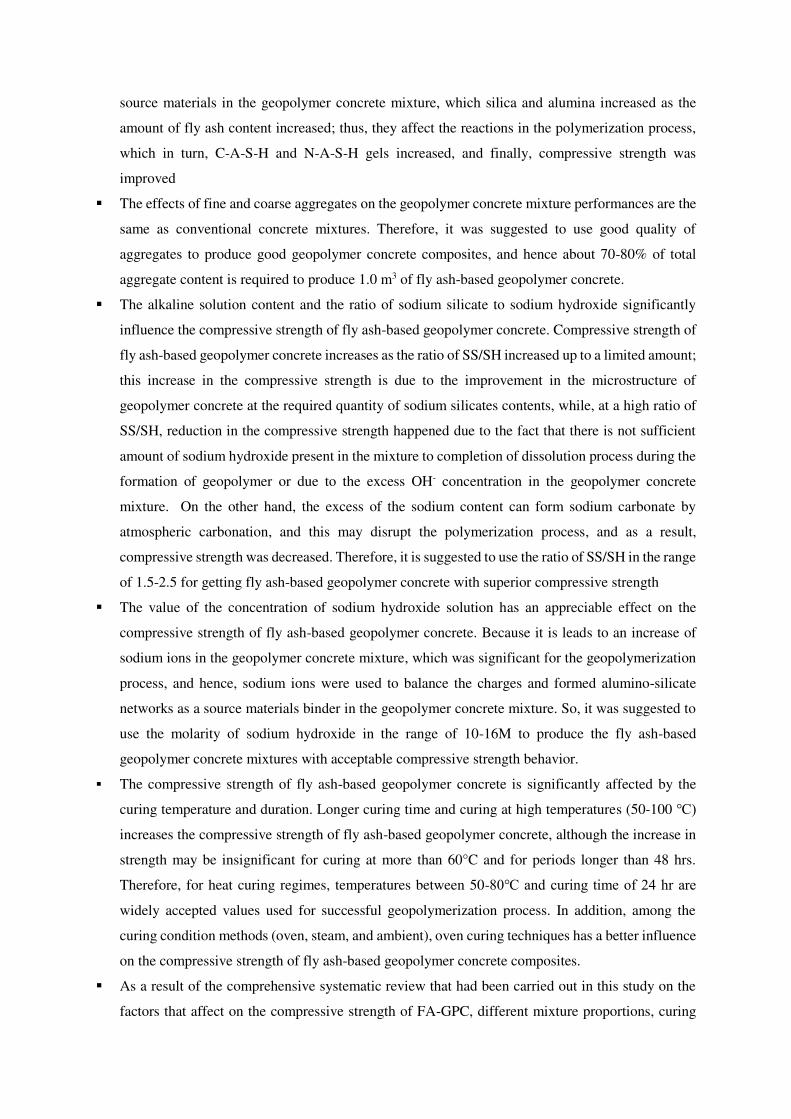
source materials in the geopolymer concrete mixture, which silica and alumina increased as the
amount of fly ash content increased; thus, they affect the reactions in the polymerization process,
which in turn, C-A-S-H and N-A-S-H gels increased, and finally, compressive strength was
improved
The effects of fine and coarse aggregates on the geopolymer concrete mixture performances are the
same as conventional concrete mixtures. Therefore, it was suggested to use good quality of
aggregates to produce good geopolymer concrete composites, and hence about 70-80% of total
aggregate content is required to produce 1.0 m3 of fly ash-based geopolymer concrete.
The alkaline solution content and the ratio of sodium silicate to sodium hydroxide significantly
influence the compressive strength of fly ash-based geopolymer concrete. Compressive strength of
fly ash-based geopolymer concrete increases as the ratio of SS/SH increased up to a limited amount;
this increase in the compressive strength is due to the improvement in the microstructure of
geopolymer concrete at the required quantity of sodium silicates contents, while, at a high ratio of
SS/SH, reduction in the compressive strength happened due to the fact that there is not sufficient
amount of sodium hydroxide present in the mixture to completion of dissolution process during the
formation of geopolymer or due to the excess OH- concentration in the geopolymer concrete
mixture. On the other hand, the excess of the sodium content can form sodium carbonate by
atmospheric carbonation, and this may disrupt the polymerization process, and as a result,
compressive strength was decreased. Therefore, it is suggested to use the ratio of SS/SH in the range
of 1.5-2.5 for getting fly ash-based geopolymer concrete with superior compressive strength
The value of the concentration of sodium hydroxide solution has an appreciable effect on the
compressive strength of fly ash-based geopolymer concrete. Because it is leads to an increase of
sodium ions in the geopolymer concrete mixture, which was significant for the geopolymerization
process, and hence, sodium ions were used to balance the charges and formed alumino-silicate
networks as a source materials binder in the geopolymer concrete mixture. So, it was suggested to
use the molarity of sodium hydroxide in the range of 10-16M to produce the fly ash-based
geopolymer concrete mixtures with acceptable compressive strength behavior.
The compressive strength of fly ash-based geopolymer concrete is significantly affected by the
curing temperature and duration. Longer curing time and curing at high temperatures (50-100 ℃)
increases the compressive strength of fly ash-based geopolymer concrete, although the increase in
strength may be insignificant for curing at more than 60°C and for periods longer than 48 hrs.
Therefore, for heat curing regimes, temperatures between 50-80℃ and curing time of 24 hr are
widely accepted values used for successful geopolymerization process. In addition, among the
curing condition methods (oven, steam, and ambient), oven curing techniques has a better influence
on the compressive strength of fly ash-based geopolymer concrete composites.
As a result of the comprehensive systematic review that had been carried out in this study on the
factors that affect on the compressive strength of FA-GPC, different mixture proportions, curing
conditions, and age of the concrete specimens influence the compressive strength. Therefore,
developing multi-scale models to predict this important property of the geopolymer concrete by
considering a wide range of input parameters is essential regarding knowing the effect of each
parameter on the compressive strength of the FA-GPC as well as modeling will be helpful for the
concrete and construction industry regarding saving in time, energy, cost-effectiveness, and it gives
guidance about scheduling for the construction process and removal of formwork elements.
12 Conclusions
Based on the extensive literature review and discussions made in this study, the following conclusions
can be reached:
I. Geopolymer concrete with acceptable compressive strength values could be produced by using fly
ash as source binder materials.
II. , The alkaline solution to the binder ratio (l/b), has a significant impact on the compressive strength
of the fly ash-based geopolymer concrete. Some researches believed that the compressive strength
was improved as the l/b increased. While, many researchers reported a reduction in the compressive
strength as the l/b was increased.
III. Increasing water content or extra water to the fly ash-based geopolymer concrete will lead to
decreasing the compressive strength of the geopolymer concrete. While superplasticizer content
improves the compressive strength of the fly ash-based geopolymer concrete composites up to a
limited value around 2% of fly ash content.
IV. strength of fly ash-based geopolymer concrete increases as the ratio of SS/SH increased up to
around 2.5, and then it decreased.
V. It was suggested to use the molarity of sodium hydroxide in the range of 10-16M to produce the fly
ash-based geopolymer concrete mixtures with acceptable compressive strength behavior.
VI. Among the curing methods, the heat curing regime is the best one for getting early and high
compressive strength of fly ash-based geopolymer concrete.
VII. It was suggested to use the oven curing temperatures between 50-80℃ and curing time of 24 hr for
successful geopolymerization process as well as getting acceptable compressive strength of fly ash-
based geopolymer concrete.
VIII. Different models could be successfully used to predict the compressive strength of FA-GPC with
different mixture proportions, curing regimes, and concrete ages.
IX. All the used models LR, MLR, ANN, and M5P could be successfully used to develop predictive
models for the compressive strength of the FA-GPC. Overall, the ANN model has better
performance than the other two models. The R2 values for this model are 0.96, 0.98, and 0.98 for
the training, testing, and validating datasets, respectively. In addition, other sensitivity indicators
for the training dataset for the ANN model are 3.33 MPa, 2.58 MPa, 2.91 and 0.109 for the RMSE,
MAE, OBJ, and SI, respectively.
Recommendation
Detailed investigations on the fresh and mechanical properties of fly ash-based geopolymer concrete
can be found in the literature. However, studies which are focused on the other properties of this
composite are still limited. In order for this composite to be acceptable by the construction industry,
some durability properties such as water permeability, gas permeability, chloride resistance, fatigue
performance, and freeze-thaw resistance should further be examined comprehensively.
Author Declarations
We wish to draw the attention of the Editor to the following facts which may be considered as potential
conflicts of interest and to significant financial contributions to this work. [OR] We wish to confirm
that there are no known conflicts of interest associated with this publication and there has been no
significant financial support for this work that could have influenced its outcome. We confirm that the
manuscript has been read and approved by all named authors and that there are no other persons who
satisfied the criteria for authorship but are not listed. We further confirm that the order of authors listed
in the manuscript has been approved by all of us. We confirm that we have given due consideration to
the protection of intellectual property associated with this work and that there are no impediments to
publication, including the timing of publication, with respect to intellectual property. In so doing, we
confirm that we have followed the regulations of our institutions concerning intellectual property. We
further confirm that any aspect of the work covered in this manuscript that has involved either
experimental animals or human patients has been conducted with the ethical approval of all relevant
bodies and that such approvals are acknowledged within the manuscript. [CAN BE DELETED IF NOT
RELEVANT] We understand that the Corresponding Author is the sole contact for the Editorial process
(including Editorial Manager and direct communications with the office). He/she is responsible for
communicating with the other authors about progress, submissions of revisions and final approval of
proofs. We confirm that we have provided a current, correct email address which is accessible by the
Corresponding Author.
Consent for publication
I (Ahmed S. Mohammed) hereby declare that I participated in this study and the manuscript's
development (Compressive strength of Geopolymer concrete composites: Modeling and
comprehensive systematic review). I have read the final version and give my consent for the article to
be published in Silicon Journal.
Availability of data and materials
The data supporting the conclusions of this article are included with the article.
Competing interests
The authors declare that they have no competing interests.
Funding
This work had no finding.
Authors' contributions
Hemn Unis Ahmed and Ahmed S. Mohammed is collecting data, planning, and writing. Azad
Mohammed, results and analysis. Hemn and Ahmed did the conclusions and editing.
Acknowledgment
The University of Sulaimani, College of Engineering, supported this work.
References
[1] Mahasenan, N., Smith, S., & Humphreys, K. (2003, January). The cement industry and global climate change:
current and potential future cement industry CO2 emissions. In Greenhouse Gas Control Technologies-6th
International Conference (pp. 995-1000). Pergamon, https://doi.org/10.1016/B978-008044276-1/50157-4
[2] Madheswaran, C. K., Gnanasundar, G., & Gopalakrishnan, N. (2013). Effect of molarity in geopolymer
concrete. International Journal of Civil & Structural Engineering, 4(2), 106-115,
https://doi.org/10.6088/ijcser.20130402001
[3] Yu, Q. L. (2019). Application of nanomaterials in alkali-activated materials. In Nanotechnology in Eco-
efficient Construction (pp. 97-121). Woodhead Publishing, https://doi.org/10.1016/B978-0-08-102641-
0.00005-0
[4] Guo, X., Shi, H., & Dick, W. A. (2010). Compressive strength and microstructural characteristics of class C
fly ash geopolymer. Cement and Concrete Composites, 32(2), 142-147,
https://doi.org/10.1016/j.cemconcomp.2009.11.003
[5] Mehta, P. K. (2001). Reducing the environmental impact of concrete. Concrete international, 23(10), 61-66.
[6] Mejeoumov, G. G. (2007). Improved cement quality and grinding efficiency by means of closed mill circuit
modeling. Texas A&M University, https://core.ac.uk/download/pdf/4276576.pdf
[7] Shaikh, F. U. A. (2016). Mechanical and durability properties of fly ash geopolymer concrete containing
recycled coarse aggregates. International Journal of Sustainable Built Environment, 5(2), 277-287,
https://doi.org/10.1016/j.ijsbe.2016.05.009
[8] Shalini, A., Gurunarayanan, G., & Sakthivel, S. (2016). Performance of rice husk ash in geopolymer
concrete. Int J Innov Res Sci Tech, 2, 73-77.
[9] Han, B., Yu, X., & Ou, J. (2014). Self-sensing concrete in smart structures. Butterworth-Heinemann.
[10] Provis, J. L., Palomo, A., & Shi, C. (2015). Advances in understanding alkali-activated materials. Cement
and Concrete Research, 78, 110-125, https://doi.org/10.1016/j.cemconres.2015.04.013
[11] Abdel-Gawwad, H. A., & Abo-El-Enein, S. A. (2016). A novel method to produce dry geopolymer cement
powder. HBRC journal, 12(1), 13-24, https://doi.org/10.1016/j.hbrcj.2014.06.008
[12] Davidovits, J. (2015). Geopolymer Chemistry and Applications. 4-th edition. J. Davidovits.–Saint-Quentin,
France.
[13] Davidovits, J. (2008). Geoplolymer chemistry and application. institute Geopolymer Saint-Quentin.
[14] Palomo, A., Blanco-Varela, M. T., Granizo, M. L., Puertas, F., Vazquez, T., & Grutzeck, M. W. (1999).
Chemical stability of cementitious materials based on metakaolin. Cement and Concrete Research, 29(7),
997-1004, https://doi.org/10.1016/S0008-8846(99)00074-5
[15] Abdullah, M. M. A., Hussin, K., Bnhussain, M., Ismail, K. N., & Ibrahim, W. M. W. (2011). Mechanism and
chemical reaction of fly ash geopolymer cement-a review. Int. J. Pure Appl. Sci. Technol, 6(1), 35-44.
[16] Palomo, A., Grutzeck, M. W., & Blanco, M. T. (1999). Alkali-activated fly ashes: A cement for the
future. Cement and concrete research, 29(8), 1323-1329, https://doi.org/10.1016/S0008-8846(98)00243-9
[17] Liew, Y. M., Heah, C. Y., & Kamarudin, H. (2016). Structure and properties of clay-based geopolymer
cements: A review. Progress in Materials Science, 83, 595-629,
https://doi.org/10.1016/j.pmatsci.2016.08.002
[18] Duxson, P., Fernández-Jiménez, A., Provis, J. L., Lukey, G. C., Palomo, A., & van Deventer, J. S. (2007).
Geopolymer technology: the current state of the art. Journal of materials science, 42(9), 2917-2933,
https://doi.org/10.1007/s10853-006-0637-z
[19] Ravitheja, A., & Kumar, N. K. (2019). A study on the effect of nano clay and GGBS on the strength properties
of fly ash based geopolymers. Materials Today: Proceedings, 19, 273-276,
https://doi.org/10.1016/j.matpr.2020.06.292
[20] Diaz, E. I., Allouche, E. N., & Eklund, S. (2010). Factors affecting the suitability of fly ash as source material
for geopolymers. Fuel, 89(5), 992-996, https://doi.org/10.1016/j.fuel.2009.09.012
[21] Yip, C. K., Lukey, G. C., Provis, J. L., & van Deventer, J. S. (2008). Effect of calcium silicate sources on
geopolymerisation. Cement and Concrete Research, 38(4), 554-564,
https://doi.org/10.1016/j.cemconres.2007.11.001
[22] Sumesh, M., Alengaram, U. J., Jumaat, M. Z., Mo, K. H., & Alnahhal, M. F. (2017). Incorporation of nano-
materials in cement composite and geopolymer based paste and mortar–A review. Construction and Building
Materials, 148, 62-84, https://doi.org/10.1016/j.conbuildmat.2017.04.206
[23] Weil, M., Dombrowski, K., & Buchwald, A. (2009). Life-cycle analysis of geopolymer. In Geopolymers (pp.
194-210). Woodhead Publishing, https://doi.org/10.1533/9781845696382.2.194
[24] Omer, S. A., Demirboga, R., & Khushefati, W. H. (2015). Relationship between compressive strength and
UPV of GGBFS based geopolymer mortars exposed to elevated temperatures. Construction and Building
Materials, 94, 189-195, https://doi.org/10.1016/j.conbuildmat.2015.07.006
[25] Xu, H., & Van Deventer, J. S. J. (2000). The geopolymerisation of alumino-silicate minerals. International
journal of mineral processing, 59(3), 247-266, https://doi.org/10.1016/S0301-7516(99)00074-5
[26] Pavithra, P. E., Reddy, M. S., Dinakar, P., Rao, B. H., Satpathy, B. K., & Mohanty, A. N. (2016). A mix
design procedure for geopolymer concrete with fly ash. Journal of cleaner production, 133, 117-125,
https://doi.org/10.1016/j.jclepro.2016.05.041
[27] Gorai, B., & Jana, R. K. (2003). Characteristics and utilisation of copper slag—a review. Resources,
Conservation and Recycling, 39(4), 299-313, https://doi.org/10.1016/S0921-3449(02)00171-4
[28] Ahmaruzzaman, M. (2010). A review on the utilization of fly ash. Progress in energy and combustion
science, 36(3), 327-363, https://doi.org/10.1016/j.pecs.2009.11.003
[29] ASTM-C618 (1999) Standard specification for coal fly ash and raw or calcined natural pozzolan for use as a
mineral admixture in Concretein concrete, ASTM International, West Conshohocken, PA, USA.
[30] Bankowski, P., Zou, L., & Hodges, R. (2004). Reduction of metal leaching in brown coal fly ash using
geopolymers. Journal of hazardous materials, 114(1-3), 59-67, https://doi.org/10.1016/j.jhazmat.2004.06.034
[31] Antiohos, S. K., & Tsimas, S. (2007). A novel way to upgrade the coarse part of a high calcium fly ash for
reuse into cement systems. Waste Management, 27(5), 675-683,
https://doi.org/10.1016/j.wasman.2006.03.016
[32] Neupane, G., & Donahoe, R. J. (2013). Leachability of elements in alkaline and acidic coal fly ash samples
during batch and column leaching tests. Fuel, 104, 758-770, https://doi.org/10.1016/j.fuel.2012.06.013
[33] Nyale, S. M., Eze, C. P., Akinyeye, R. O., Gitari, W. M., Akinyemi, S. A., Fatoba, O. O., & Petrik, L. F.
(2014). The leaching behaviour and geochemical fractionation of trace elements in hydraulically disposed
weathered coal fly ash. Journal of Environmental Science and Health, Part A, 49(2), 233-242,
https://doi.org/10.1080/10934529.2013.838929
[34] Yao, Z. T., Ji, X. S., Sarker, P. K., Tang, J. H., Ge, L. Q., Xia, M. S., & Xi, Y. Q. (2015). A comprehensive
review on the applications of coal fly ash. Earth-Science Reviews, 141, 105-121,
https://doi.org/10.1016/j.earscirev.2014.11.016
[35] Shibayama, A., Kim, Y., Harjanto, S., Sugai, Y., Okada, K., & Fujita, T. (2005). Remediation of contaminated
soil by fly ash containing dioxins from incineration by using flotation. Materials transactions, 46(5), 990-995,
https://doi.org/10.2320/matertrans.46.990
[36] Nomura, Y., Fujiwara, K., Terada, A., Nakai, S., & Hosomi, M. (2010). Prevention of lead leaching from fly
ashes by mechanochemical treatment. Waste Management, 30(7), 1290-1295,
https://doi.org/10.1016/j.wasman.2009.11.025
[37] Boiny, H. U., Alshkane, Y. M., & Rafiq, S. K. (2016, October). Mechanical properties of cement mortar by
using polyethylene terephthalate fibers. In 5th National and 1st International Conference on Modern
Materials and Structures in Civil Engineering, Iran (Islamic Republic of Iran).
[38] Alshkane, Y. M., Rafiq, S. K., & Boiny, H. U. (2017). Correlation between Destructive and Non-Destructive
Tests on the Mechanical Properties of Different Cement Mortar Mixtures incorporating Polyethylene
Terephthalate Fibers. Sulaimania Journal for Engineering Sciences, 4(5), https://doi.org/10.17656/sjes.10058
[39] Ahmed, H. U., Faraj, R. H., Hilal, N., Mohammed, A. A., & Sherwani, A. F. H. (2021). Use of recycled fibers
in concrete composites: A systematic comprehensive review. Composites Part B: Engineering, 108769,
https://doi.org/10.1016/j.compositesb.2021.108769
[40] Anjos, M. A., Camões, A., Campos, P., Azeredo, G. A., & Ferreira, R. L. (2020). Effect of high volume fly
ash and metakaolin with and without hydrated lime on the properties of self-compacting concrete. Journal of
Building Engineering, 27, 100985, https://doi.org/10.1016/j.jobe.2019.100985
[41] Barbhuiya, S. (2011). Effects of fly ash and dolomite powder on the properties of self-compacting
concrete. Construction and Building Materials, 25(8), 3301-3305,
https://doi.org/10.1016/j.conbuildmat.2011.03.018
[42] Bouzoubaa, N., & Lachemi, M. (2001). Self-compacting concrete incorporating high volumes of class F fly
ash: Preliminary results. Cement and concrete research, 31(3), 413-420, https://doi.org/10.1016/S0008-
8846(00)00504-4
[43] Dinakar, P., Babu, K. G., & Santhanam, M. (2008). Mechanical properties of high-volume fly ash self-
compacting concrete mixtures. Structural concrete, 9(2), 109-116,
https://www.icevirtuallibrary.com/doi/abs/10.1680/stco.2008.9.2.109
[44] Moffatt, E. G., Thomas, M. D., & Fahim, A. (2017). Performance of high-volume fly ash concrete in marine
environment. Cement and Concrete Research, 102, 127-135,
https://doi.org/10.1016/j.cemconres.2017.09.008
[45] Roychand, R., Li, J., De Silva, S., Saberian, M., Law, D., & Pramanik, B. K. (2021). Development of zero
cement composite for the protection of concrete sewage pipes from corrosion and fatbergs. Resources,
Conservation and Recycling, 164, 105166, https://doi.org/10.1016/j.resconrec.2020.105166
[46] Yildirim, G., Sahmaran, M., & Ahmed, H. U. (2015). Influence of hydrated lime addition on the self-healing
capability of high-volume fly ash incorporated cementitious composites. Journal of Materials in Civil
Engineering, 27(6), 04014187, https://doi.org/10.1061/(ASCE)MT.1943-5533.0001145
[47] Jiang, X., Xiao, R., Ma, Y., Zhang, M., Bai, Y., & Huang, B. (2020). Influence of waste glass powder on the
physico-mechanical properties and microstructures of fly ash-based geopolymer paste after exposure to high
temperatures. Construction and Building Materials, 262, 120579,
https://doi.org/10.1016/j.conbuildmat.2020.120579
[48] Wulandari, K. D., Ekaputri, J. J., Kurniawan, S. B., Primaningtyas, W. E., Abdullah, S. R. S., Ismail, N. I.,
& Imron, M. F. (2021). Effect of microbes addition on the properties and surface morphology of fly ash-
based geopolymer paste. Journal of Building Engineering, 33, 101596,
https://doi.org/10.1016/j.jobe.2020.101596
[49] Shill, S. K., Al-Deen, S., Ashraf, M., & Hutchison, W. (2020). Resistance of fly ash based geopolymer mortar
to both chemicals and high thermal cycles simultaneously. Construction and Building Materials, 239, 117886,
https://doi.org/10.1016/j.conbuildmat.2019.117886
[50] Sivasakthi, M., Jeyalakshmi, R., & Rajamane, N. P. (2021). Fly ash geopolymer mortar: Impact of the
substitution of river sand by copper slag as a fine aggregate on its thermal resistance properties. Journal of
Cleaner Production, 279, 123766, https://doi.org/10.1016/j.jclepro.2020.123766
[51] Noushini, A., Castel, A., Aldred, J., & Rawal, A. (2020). Chloride diffusion resistance and chloride binding
capacity of fly ash-based geopolymer concrete. Cement and Concrete Composites, 105, 103290,
https://doi.org/10.1016/j.cemconcomp.2019.04.006
[52] Morla, P., Gupta, R., Azarsa, P., & Sharma, A. (2021). Corrosion Evaluation of Geopolymer Concrete Made
with Fly Ash and Bottom Ash. Sustainability, 13(1), 398, https://doi.org/10.3390/su13031469
[53] Zhuang, X. Y., Chen, L., Komarneni, S., Zhou, C. H., Tong, D. S., Yang, H. M., ... & Wang, H. (2016). Fly
ash-based geopolymer: clean production, properties and applications. Journal of Cleaner Production, 125,
253-267, https://doi.org/10.1016/j.jclepro.2016.03.019
[54] ASTM C39/C39M (2017) Standard Test Method for Compressive Strength of Cylindrical Concrete
Specimens, ASTM International, West Conshohocken, PA, USA.
[55] The European Standard BS EN12390-3, 2009, testing on hardned concrete:part-3: compressive strength of
test specimens
[56] Neville, A. M., & Brooks, J. J. (2010). Concrete technology.
[57] Golafshani, E. M., Behnood, A., & Arashpour, M. (2020). Predicting the compressive strength of normal and
High-Performance Concretes using ANN and ANFIS hybridized with Grey Wolf Optimizer. Construction
and Building Materials, 232, 117266, https://doi.org/10.1016/j.conbuildmat.2019.117266
[58] George, U. A., & Elvis, M. M. (2019). Modelling of the mechanical properties of concrete with cement ratio
partially replaced by aluminium waste and sawdust ash using artificial neural network. SN Applied
Sciences, 1(11), 1514, https://doi.org/10.1007/s42452-019-1504-2
[59] Mehdipour, V., Stevenson, D. S., Memarianfard, M., & Sihag, P. (2018). Comparing different methods for
statistical modeling of particulate matter in Tehran, Iran. Air Quality, Atmosphere & Health, 11(10), 1155-
1165, https://doi.org/10.1007/s11869-018-0615-z
[60] Sihag, P., Jain, P., & Kumar, M. (2018). Modelling of impact of water quality on recharging rate of storm
water filter system using various kernel function based regression. Modeling earth systems and
environment, 4(1), 61-68, https://doi.org/10.1007/s40808-017-0410-0
[61] Shahmansouri, A. A., Bengar, H. A., & Ghanbari, S. (2020). Compressive strength prediction of eco-efficient
GGBS-based geopolymer concrete using GEP method. Journal of Building Engineering, 101326,
https://doi.org/10.1016/j.jobe.2020.101326
[62] Velay-Lizancos, M., Perez-Ordoñez, J. L., Martinez-Lage, I., & Vazquez-Burgo, P. (2017). Analytical and
genetic programming model of compressive strength of eco concretes by NDT according to curing
temperature. Construction and Building Materials, 144, 195-206,
https://doi.org/10.1016/j.conbuildmat.2017.03.123
[63] Gholampour, A., Mansouri, I., Kisi, O., & Ozbakkaloglu, T. (2020). Evaluation of mechanical properties of
concretes containing coarse recycled concrete aggregates using multivariate adaptive regression splines
(MARS), M5 model tree (M5Tree), and least squares support vector regression (LSSVR) models. Neural
Computing and Applications, 32(1), 295-308, https://doi.org/10.1007/s00521-018-3630-y
[64] Behnood, A., Olek, J., & Glinicki, M. A. (2015a). Predicting modulus elasticity of recycled aggregate
concrete using M5′ model tree algorithm. Construction and Building Materials, 94, 137-147,
https://doi.org/10.1016/j.conbuildmat.2015.06.055
[65] Golafshani, E. M., & Behnood, A. (2018). Application of soft computing methods for predicting the elastic
modulus of recycled aggregate concrete. Journal of cleaner production, 176, 1163-1176,
https://doi.org/10.1016/j.jclepro.2017.11.186
[66] Mohammed, A., Rafiq, S., Sihag, P., Kurda, R., & Mahmood, W. (2020). Soft computing techniques:
systematic multiscale models to predict the compressive strength of HVFA concrete based on mix proportions
and curing times. Journal of Building Engineering, 101851, https://doi.org/10.1016/j.jobe.2020.101851
[67] Shahmansouri, A. A., Yazdani, M., Ghanbari, S., Bengar, H. A., Jafari, A., & Ghatte, H. F. (2020). Artificial
neural network model to predict the compressive strength of eco-friendly geopolymer concrete incorporating
silica fume and natural zeolite. Journal of Cleaner Production, 279, 123697,
https://doi.org/10.1016/j.jclepro.2020.123697
[68] Behnood, A., Verian, K. P., & Gharehveran, M. M. (2015b). Evaluation of the splitting tensile strength in
plain and steel fiber-reinforced concrete based on the compressive strength. Construction and Building
Materials, 98, 519-529, https://doi.org/10.1016/j.conbuildmat.2015.08.124
[69] Faraj, R. H., Mohammed, A. A., Mohammed, A., Omer, K. M., & Ahmed, H. U. (2021). Systematic
multiscale models to predict the compressive strength of self-compacting concretes modified with nanosilica
at different curing ages. Engineering with Computers, 1-24, https://doi.org/10.1007/s00366-021-01385-9
[70] Hardjito, D., Wallah, S. E., Sumajouw, D. M. J., & Rangan, B. V. (2005, August). Introducing fly ash-based
geopolymer concrete: manufacture and engineering properties. In 30th conference on our world in concrete
& structures (Vol. 24).
[71] Al-Azzawi, M., Yu, T., & Hadi, M. N. (2018, June). Factors affecting the bond strength between the fly ash-
based geopolymer concrete and steel reinforcement. In Structures (Vol. 14, pp. 262-272). Elsevier,
https://doi.org/10.1016/j.istruc.2018.03.010
[72] Zhao, R., Yuan, Y., Cheng, Z., Wen, T., Li, J., Li, F., & Ma, Z. J. (2019). Freeze-thaw resistance of class F
fly ash-based geopolymer concrete. Construction and Building Materials, 222, 474-483,
https://doi.org/10.1016/j.conbuildmat.2019.06.166
[73] Singhal, D., Junaid, M. T., Jindal, B. B., & Mehta, A. (2018). Mechanical and microstructural properties of
fly ash based geopolymer concrete incorporating alccofine at ambient curing. Construction and building
materials, 180, 298-307, https://doi.org/10.1016/j.conbuildmat.2018.05.286
[74] Shehab, H. K., Eisa, A. S., & Wahba, A. M. (2016). Mechanical properties of fly ash based geopolymer
concrete with full and partial cement replacement. Construction and building materials, 126, 560-565,
https://doi.org/10.1016/j.conbuildmat.2016.09.059
[75] Chithambaram, S. J., Kumar, S., Prasad, M. M., & Adak, D. (2018). Effect of parameters on the compressive
strength of fly ash based geopolymer concrete. Structural Concrete, 19(4), 1202-1209,
https://doi.org/10.1002/suco.201700235
[76] Wardhono, A., Gunasekara, C., Law, D. W., & Setunge, S. (2017). Comparison of long term performance
between alkali activated slag and fly ash geopolymer concretes. Construction and Building materials, 143,
272-279, https://doi.org/10.1016/j.conbuildmat.2017.03.153
[77] Ramujee, K., & PothaRaju, M. (2017). Mechanical properties of geopolymer concrete composites. Materials
Today: Proceedings, 4(2), 2937-2945, https://doi.org/10.1016/j.matpr.2017.02.175
[78] Wallah, S. E. (2010). Creep behaviour of fly ash-based geopolymer concrete. Civil Engineering
Dimension, 12(2), 73-78.
[79] Aliabdo, A. A., Abd Elmoaty, M., & Salem, H. A. (2016). Effect of water addition, plasticizer and alkaline
solution constitution on fly ash based geopolymer concrete performance. Construction and Building
Materials, 121, 694-703, https://doi.org/10.1016/j.conbuildmat.2016.06.062
[80] Xie, T., & Ozbakkaloglu, T. (2015). Behavior of low-calcium fly and bottom ash-based geopolymer concrete
cured at ambient temperature. Ceramics International, 41(4), 5945-5958,
https://doi.org/10.1016/j.ceramint.2015.01.031
[81] Sarker, P. K. (2011). Bond strength of reinforcing steel embedded in fly ash-based geopolymer
concrete. Materials and structures, 44(5), 1021-1030, https://doi.org/10.1617/s11527-010-9683-8
[82] Chindaprasirt, P., & Chalee, W. (2014). Effect of sodium hydroxide concentration on chloride penetration
and steel corrosion of fly ash-based geopolymer concrete under marine site. Construction and Building
Materials, 63, 303-310, https://doi.org/10.1016/j.conbuildmat.2014.04.010
[83] Shaikh, F. U. A., & Vimonsatit, V. (2015). Compressive strength of fly‐ash‐based geopolymer concrete at elevated temperatures. Fire and materials, 39(2), 174-188, https://doi.org/10.1002/fam.2240
[84] Sastry, K. G. K., Sahitya, P., & Ravitheja, A. (2020). Influence of nano TiO2 on strength and durability
properties of geopolymer concrete. Materials Today: Proceedings,
https://doi.org/10.1016/j.matpr.2020.03.139
[85] Çevik, A., Alzeebaree, R., Humur, G., Niş, A., & Gülşan, M. E. (2018). Effect of nano-silica on the chemical
durability and mechanical performance of fly ash based geopolymer concrete. Ceramics
International, 44(11), 12253-12264, https://doi.org/10.1016/j.ceramint.2018.04.009
[86] Embong, R., Kusbiantoro, A., Shafiq, N., & Nuruddin, M. F. (2016). Strength and microstructural properties
of fly ash based geopolymer concrete containing high-calcium and water-absorptive aggregate. Journal of
cleaner production, 112, 816-822, https://doi.org/10.1016/j.jclepro.2015.06.058
[87] Sumajouw, D. M. J., Hardjito, D., Wallah, S. E., & Rangan, B. V. (2007). Fly ash-based geopolymer concrete:
study of slender reinforced columns. Journal of materials science, 42(9), 3124-3130,
https://doi.org/10.1007/s10853-006-0523-8
[88] Jaydeep, S., & Chakravarthy, B. J. (2013). Study on fly ash based geo-polymer concrete using
admixtures. International Journal of Engineering Trends and Technology, 4(10), 4614-4617,
https://ijettjournal.org/archive/ijett-v4i10p161
[89] Nuaklong, P., Jongvivatsakul, P., Pothisiri, T., Sata, V., & Chindaprasirt, P. (2020). Influence of rice husk
ash on mechanical properties and fire resistance of recycled aggregate high-calcium fly ash geopolymer
concrete. Journal of Cleaner Production, 252, 119797, https://doi.org/10.1016/j.jclepro.2019.119797
[90] Okoye, F. N., Durgaprasad, J., & Singh, N. B. (2016). Effect of silica fume on the mechanical properties of
fly ash based-geopolymer concrete. Ceramics International, 42(2), 3000-3006,
https://doi.org/10.1016/j.ceramint.2015.10.084
[91] Okoye, F. N., Prakash, S., & Singh, N. B. (2017). Durability of fly ash based geopolymer concrete in the
presence of silica fume. Journal of cleaner Production, 149, 1062-1067,
https://doi.org/10.1016/j.jclepro.2017.02.176
[92] Sarker, P. K., Haque, R., & Ramgolam, K. V. (2013). Fracture behaviour of heat cured fly ash based
geopolymer concrete. Materials & Design, 44, 580-586, https://doi.org/10.1016/j.matdes.2012.08.005
[93] Junaid, M. T., Kayali, O., & Khennane, A. (2017). Response of alkali activated low calcium fly-ash based
geopolymer concrete under compressive load at elevated temperatures. Materials and Structures, 50(1), 50,
https://doi.org/10.1617/s11527-016-0877-6
[94] Olivia, M., Sarker, P., & Nikraz, H. (2008). Water penetrability of low calcium fly ash geopolymer
concrete. Proc. ICCBT2008-A, 46, 517-530.
[95] Abhilash, P., Sashidhar, C., & Reddy, I. R. (2016). Strength properties of Fly ash and GGBS based Geo-
polymer Concrete. International Journal of ChemTech Research, ISSN, 0974-4290.
[96] Jindal, B. B., Parveen, Singhal, D., & Goyal, A. (2017). Predicting relationship between mechanical
properties of low calcium fly ash-based geopolymer concrete. Transactions of the Indian Ceramic
Society, 76(4), 258-265, https://doi.org/10.1080/0371750X.2017.1412837
[97] Vignesh, P., & Vivek, K. (2015). An experimental investigation on strength parameters of flyash based
geopolymer concrete with GGBS. International Research Journal of Engineering and Technology, 2(2), 135-
142, https://www.irjet.net/archives/V2/i2/Irjet-v2i224.pdf
[98] Joseph, B., & Mathew, G. (2012). Influence of aggregate content on the behavior of fly ash based geopolymer
concrete. Scientia Iranica, 19(5), 1188-1194, https://doi.org/10.1016/j.scient.2012.07.006
[99] Nath, P., & Sarker, P. K. (2014). Effect of GGBFS on setting, workability and early strength properties of fly
ash geopolymer concrete cured in ambient condition. Construction and Building Materials, 66, 163-171,
https://doi.org/10.1016/j.conbuildmat.2014.05.080
[100] Patankar, S. V., Jamkar, S. S., & Ghugal, Y. M. (2013). Effect of water-to-geopolymer binder ratio on
the production of fly ash based geopolymer concrete. Int. J. Adv. Technol. Civ. Eng, 2(1), 79-83.
[101] Adak, D., Sarkar, M., & Mandal, S. (2017). Structural performance of nano-silica modified fly-ash based
geopolymer concrete. Construction and Building Materials, 135, 430-439,
https://doi.org/10.1016/j.conbuildmat.2016.12.111
[102] Gunasekara, C., Law, D. W., & Setunge, S. (2016). Long term permeation properties of different fly ash
geopolymer concretes. Construction and Building Materials, 124, 352-362,
https://doi.org/10.1016/j.conbuildmat.2016.07.121
[103] Mehta, A., & Siddique, R. (2017). Sulfuric acid resistance of fly ash based geopolymer
concrete. Construction and Building Materials, 146, 136-143,
https://doi.org/10.1016/j.conbuildmat.2017.04.077
[104] Cui, Y., Gao, K., & Zhang, P. (2020). Experimental and Statistical Study on Mechanical Characteristics
of Geopolymer Concrete. Materials, 13(7), 1651, https://doi.org/10.3390/ma13071651
[105] Albitar, M., Visintin, P., Ali, M. M., & Drechsler, M. (2015). Assessing behaviour of fresh and hardened
geopolymer concrete mixed with class-F fly ash. KSCE Journal of Civil Engineering, 19(5), 1445-1455,
https://doi.org/10.1007/s12205-014-1254-z
[106] Bhogayata, A. C., & Arora, N. K. (2019). Utilization of metalized plastic waste of food packaging articles
in geopolymer concrete. Journal of Material Cycles and Waste Management, 21(4), 1014-1026,
https://doi.org/10.1007/s10163-019-00859-9
[107] Gomaa, E., Sargon, S., Kashosi, C., Gheni, A., & ElGawady, M. A. (2020). Mechanical Properties of
High Early Strength Class C Fly Ash-Based Alkali Activated Concrete. Transportation Research Record,
0361198120915892, https://doi.org/10.1177%2F0361198120915892
[108] Hassan, A., Arif, M., & Shariq, M. (2019). Effect of curing condition on the mechanical properties of fly
ash-based geopolymer concrete. SN Applied Sciences, 1(12), 1694, https://doi.org/10.1007/s42452-019-
1774-8
[109] Kurtoglu, A. E., Alzeebaree, R., Aljumaili, O., Nis, A., Gulsan, M. E., Humur, G., & Cevik, A. (2018).
Mechanical and durability properties of fly ash and slag based geopolymer concrete. Advances in Concrete
Construction, 6(4), 345, http://dx.doi.org/10.12989/acc.2018.6.4.345
[110] Nath, P., & Sarker, P. K. (2015). Use of OPC to improve setting and early strength properties of low
calcium fly ash geopolymer concrete cured at room temperature. Cement and concrete composites, 55, 205-
214, https://doi.org/10.1016/j.cemconcomp.2014.08.008
[111] Saravanan, S., & Elavenil, S. (2018). Strength Properties of Geopolymer Concrete using M Sand by
Assessing their Mechanical Characteristics. ARPN Journal of Engineering and Applied Sciences, 13(13),
4028-4041.
[112] Topark-Ngarm, P., Chindaprasirt, P., & Sata, V. (2015). Setting time, strength, and bond of high-calcium
fly ash geopolymer concrete. Journal of Materials in Civil Engineering, 27(7), 04014198,
https://doi.org/10.1061/(ASCE)MT.1943-5533.0001157
[113] Vijai, K., Kumutha, R., & Vishnuram, B. G. (2011). Experimental investigations on mechanical
properties of geopolymer concrete composites, http://dl.lib.mrt.ac.lk/handle/123/9265
[114] Vora, P. R., & Dave, U. V. (2013). Parametric studies on compressive strength of geopolymer
concrete. Procedia Engineering, 51, 210-219, https://doi.org/10.1016/j.proeng.2013.01.030
[115] Wang, Y., Hu, S., & He, Z. (2019). Mechanical and Fracture Properties of Fly Ash Geopolymer Concrete
Addictive with Calcium Aluminate Cement. Materials, 12(18), 2982, https://doi.org/10.3390/ma12182982
[116] Ibrahim, M., Johari, M. A. M., Maslehuddin, M., & Rahman, M. K. (2018). Influence of nano-SiO2 on
the strength and microstructure of natural pozzolan based alkali activated concrete. Construction and
Building Materials, 173, 573-585, https://doi.org/10.1016/j.conbuildmat.2018.04.051
[117] Ghafoor, M. T., Khan, Q. S., Qazi, A. U., Sheikh, M. N., & Hadi, M. N. S. (2021). Influence of alkaline
activators on the mechanical properties of fly ash based geopolymer concrete cured at ambient
temperature. Construction and Building Materials, 273, 121752,
https://doi.org/10.1016/j.conbuildmat.2020.121752
[118] Fang, G., Ho, W. K., Tu, W., & Zhang, M. (2018). Workability and mechanical properties of alkali-
activated fly ash-slag concrete cured at ambient temperature. Construction and Building Materials, 172, 476-
487, https://doi.org/10.1016/j.conbuildmat.2018.04.008
[119] Vijai, K., Kumutha, R., & Vishnuram, B. G. (2010). Effect of types of curing on strength of geopolymer
concrete. International journal of physical sciences, 5(9), 1419-1423, https://doi.org/10.5897/IJPS.9000200
[120] Krishnaraja, A. R., Sathishkumar, N. P., Kumar, T. S., & Kumar, P. D. (2014). Mechanical behaviour of
geopolymer concrete under ambient curing. International Journal of Scientific Engineering and
Technology, 3(2), 130-132.
[121] Kumaravel, S. (2014). Development of various curing effect of nominal strength Geopolymer
concrete. Journal of Engineering Science and Technology Review, 7(1), 116-119.
[122] Muhammad, N., Baharom, S., Ghazali, N. A. M., & Alias, N. A. (2019). Effect of Heat Curing
Temperatures on Fly Ash-Based Geopolymer Concrete. Int. J. Eng. Technol, 8, 15-19.
[123] Das, S. K., & Shrivastava, S. (2020). Siliceous fly ash and blast furnace slag based geopolymer concrete
under ambient temperature curing condition. Structural Concrete, https://doi.org/10.1002/suco.201900201
[124] Nuruddin, M. N., Kusbiantoro, A. K., Qazi, S. Q., Darmawan, M. D., & Husin, N. H. (2011).
Development of geopolymer concrete with different curing conditions. IPTEK The Journal for Technology
and Science, 22(1), https://doi.org/10.21833/ijaas.2018.01.005
[125] Thakur, R. N., & Ghosh, S. (2009). Effect of mix composition on compressive strength and
microstructure of fly ash based geopolymer composites. ARPN Journal of Engineering and Applied
Sciences, 4(4), 68-74, http://www.arpnjournals.com/jeas/research_papers/rp_2009/jeas_0609_200.pdf
[126] Dombrowski, K., Buchwald, A., & Weil, M. (2007). The influence of calcium content on the structure
and thermal performance of fly ash based geopolymers. Journal of Materials Science, 42(9), 3033-3043,
https://doi.org/10.1007/s10853-006-0532-7
[127] Chi, M., & Huang, R. (2013). Binding mechanism and properties of alkali-activated fly ash/slag
mortars. Construction and building materials, 40, 291-298,
https://doi.org/10.1016/j.conbuildmat.2012.11.003
[128] Fernandez-Jimenez, A. M., Palomo, A., & Lopez-Hombrados, C. (2006). Engineering properties of
alkali-activated fly ash concrete. ACI Materials Journal, 103(2), 106,
https://www.concrete.org/publications/internationalconcreteabstractsportal/m/details/id/15261
[129] Ryu, G. S., Lee, Y. B., Koh, K. T., & Chung, Y. S. (2013). The mechanical properties of fly ash-based
geopolymer concrete with alkaline activators. Construction and Building Materials, 47, 409-418,
https://doi.org/10.1016/j.conbuildmat.2013.05.069
[130] Khale, D., & Chaudhary, R. (2007). Mechanism of geopolymerization and factors influencing its
development: a review. Journal of materials science, 42(3), 729-746, https://doi.org/10.1007/s10853-006-
0401-4
[131] Thokchom, S., Mandal, K. K., & Ghosh, S. (2012). Effect of Si/Al ratio on performance of fly ash
geopolymers at elevated temperature. Arabian Journal for Science and Engineering, 37(4), 977-989,
https://doi.org/10.1007/s13369-012-0230-5
[132] Garcia-Lodeiro, I., Palomo, A., Fernández-Jiménez, A., & Macphee, D. E. (2011). Compatibility studies
between NASH and CASH gels. Study in the ternary diagram Na2O–CaO–Al2O3–SiO2–H2O. Cement and
Concrete Research, 41(9), 923-931, https://doi.org/10.1016/j.cemconres.2011.05.006
[133] Sathonsaowaphak, A., Chindaprasirt, P., & Pimraksa, K. (2009). Workability and strength of lignite
bottom ash geopolymer mortar. Journal of Hazardous Materials, 168(1), 44-50,
https://doi.org/10.1016/j.jhazmat.2009.01.120
[134] Rafeet, A., Vinai, R., Soutsos, M., & Sha, W. (2017). Guidelines for mix proportioning of fly ash/GGBS
based alkali activated concretes. Construction and Building Materials, 147, 130-142,
https://doi.org/10.1016/j.conbuildmat.2017.04.036
[135] Lloyd, R. R., Provis, J. L., & van Deventer, J. S. (2009). Microscopy and microanalysis of inorganic
polymer cements. 1: remnant fly ash particles. Journal of materials science, 44(2), 608-619,
https://doi.org/10.1007/s10853-008-3077-0
[136] Saha, S., & Rajasekaran, C. (2017). Enhancement of the properties of fly ash based geopolymer paste by
incorporating ground granulated blast furnace slag. Construction and Building Materials, 146, 615-620,
https://doi.org/10.1016/j.conbuildmat.2017.04.139
[137] Hu, W., Nie, Q., Huang, B., Su, A., Du, Y., Shu, X., & He, Q. (2018). Mechanical property and
microstructure characteristics of geopolymer stabilized aggregate base. Construction and Building
Materials, 191, 1120-1127, https://doi.org/10.1016/j.conbuildmat.2018.10.081
[138] Deb, P. S., Nath, P., & Sarker, P. K. (2014). The effects of ground granulated blast-furnace slag blending
with fly ash and activator content on the workability and strength properties of geopolymer concrete cured at
ambient temperature. Materials & Design (1980-2015), 62, 32-39,
https://doi.org/10.1016/j.matdes.2014.05.001
[139] Hardjito, D., Wallah, S. E., Sumajouw, D. M., & Rangan, B. V. (2004). On the development of fly ash-
based geopolymer concrete. ACI Materials Journal, 101(6), 467-472,
https://www.concrete.org/publications/internationalconcreteabstractsportal.aspx?m=details&ID=13485
[140] Barbosa, V. F., MacKenzie, K. J., & Thaumaturgo, C. (2000). Synthesis and characterisation of materials
based on inorganic polymers of alumina and silica: sodium polysialate polymers. International Journal of
Inorganic Materials, 2(4), 309-317, https://doi.org/10.1016/S1466-6049(00)00041-6
[141] Van Jaarsveld, J. G. S., Van Deventer, J. S. J., & Lukey, G. C. (2002). The effect of composition and
temperature on the properties of fly ash-and kaolinite-based geopolymers. Chemical Engineering
Journal, 89(1-3), 63-73, https://doi.org/10.1016/S1385-8947(02)00025-6
[142] He, J., Jie, Y., Zhang, J., Yu, Y., & Zhang, G. (2013). Synthesis and characterization of red mud and rice
husk ash-based geopolymer composites. Cement and Concrete Composites, 37, 108-118,
https://doi.org/10.1016/j.cemconcomp.2012.11.010
[143] Rickard, W. D., Williams, R., Temuujin, J., & Van Riessen, A. (2011). Assessing the suitability of three
Australian fly ashes as an aluminosilicate source for geopolymers in high temperature applications. Materials
Science and Engineering: A, 528(9), 3390-3397, https://doi.org/10.1016/j.msea.2011.01.005
[144] Komljenović, M., Baščarević, Z., & Bradić, V. (2010). Mechanical and microstructural properties of alkali-activated fly ash geopolymers. Journal of Hazardous Materials, 181(1-3), 35-42,
https://doi.org/10.1016/j.jhazmat.2010.04.064
[145] Kumar, S., & Kumar, R. (2011). Mechanical activation of fly ash: Effect on reaction, structure and
properties of resulting geopolymer. Ceramics International, 37(2), 533-541,
https://doi.org/10.1016/j.ceramint.2010.09.038
[146] ASTM Designation C33/C33M (2018). Standard specification of concrete aggregates, Annual Book of
ASTM Standard.
[147] Mermerdaş, K., Manguri, S., Nassani, D. E., & Oleiwi, S. M. (2017). Effect of aggregate properties on the mechanical and absorption characteristics of geopolymer mortar. Engineering science and Technology,
an international Journal, 20(6), 1642-1652, https://doi.org/10.1016/j.jestch.2017.11.009
[148] Mane, S., & Jadhav, H. S. (2012). Investigation of geopolymer mortar and concrete under high
temperature. International Journal of Emerging Technology and Advanced Engineering, 2 (12), 384-390.
[149] Nuaklong, P., Sata, V., & Chindaprasirt, P. (2016). Influence of recycled aggregate on fly ash
geopolymer concrete properties. Journal of Cleaner Production, 112, 2300-2307,
https://doi.org/10.1016/j.jclepro.2015.10.109
[150] Sreenivasulu, C., GURU, J. J., SEKHAR, R. M. V., & PAVAN, K. D. (2016). Effect of fine aggregate
blending on short-term mechanical properties of geopolymer concrete. Asian Journal of Civil Engineering,
17 (5), 537–550, https://www.sid.ir/en/Journal/ViewPaper.aspx?ID=484795
[151] Puligilla, S., & Mondal, P. (2013). Role of slag in microstructural development and hardening of fly ash-
slag geopolymer. Cement and Concrete Research, 43, 70-80,
https://doi.org/10.1016/j.cemconres.2012.10.004
[152] Nath, P., & Sarker, P. K. (2017). Flexural strength and elastic modulus of ambient-cured blended low-
calcium fly ash geopolymer concrete. Construction and Building Materials, 130, 22-31,
https://doi.org/10.1016/j.conbuildmat.2016.11.034
[153] Weng, L., & Sagoe-Crentsil, K. (2007). Dissolution processes, hydrolysis and condensation reactions
during geopolymer synthesis: Part I—Low Si/Al ratio systems. Journal of materials science, 42(9), 2997-
3006, https://doi.org/10.1007/s10853-006-0820-2
[154] Sagoe-Crentsil, K., & Weng, L. (2007). Dissolution processes, hydrolysis and condensation reactions
during geopolymer synthesis: Part II. High Si/Al ratio systems. Journal of materials science, 42(9), 3007-
3014, https://doi.org/10.1007/s10853-006-0818-9]
[155] Mustafa Al Bakri, A. M., Kamarudin, H., Bnhussain, M., Rafiza, A. R., & Zarina, Y. (2012). Effect of
Na2 SiO3/NaOH Ratios and NaOH Molarities on Compressive Strength of Fly-Ash-Based Geopolymer. ACI
Materials Journal, 109(5),
https://www.concrete.org/publications/internationalconcreteabstractsportal/m/details/id/51684080
[156] Ridtirud, C., Chindaprasirt, P., & Pimraksa, K. (2011). Factors affecting the shrinkage of fly ash
geopolymers. International Journal of Minerals, Metallurgy, and Materials, 18(1), 100-104,
https://doi.org/10.1007/s12613-011-0407-z
[157] Phoo-ngernkham, T., Maegawa, A., Mishima, N., Hatanaka, S., & Chindaprasirt, P. (2015). Effects of
sodium hydroxide and sodium silicate solutions on compressive and shear bond strengths of FA–GBFS
geopolymer. Construction and Building Materials, 91, 1-8,
https://doi.org/10.1016/j.conbuildmat.2015.05.001
[158] Morsy, M. S., Alsayed, S. H., Al-Salloum, Y., & Almusallam, T. (2014). Effect of sodium silicate to
sodium hydroxide ratios on strength and microstructure of fly ash geopolymer binder. Arabian Journal for
science and engineering, 39(6), 4333-4339, https://doi.org/10.1007/s13369-014-1093-8
[159] Alonso, S., & Palomo, A. (2001). Alkaline activation of metakaolin and calcium hydroxide mixtures:
influence of temperature, activator concentration and solids ratio. Materials Letters, 47(1-2), 55-62,
https://doi.org/10.1016/S0167-577X(00)00212-3
[160] Duxson, P., Lukey, G. C., Separovic, F., & Van Deventer, J. S. J. (2005). Effect of alkali cations on
aluminum incorporation in geopolymeric gels. Industrial & Engineering Chemistry Research, 44(4), 832-
839, https://doi.org/10.1021/ie0494216
[161] Görhan, G., & Kürklü, G. (2014). The influence of the NaOH solution on the properties of the fly ash-
based geopolymer mortar cured at different temperatures. Composites part b: engineering, 58, 371-377,
https://doi.org/10.1016/j.compositesb.2013.10.082
[162] Ramujee, K. (2014). Development of low calcium flyash based geopolymer concrete. International
Journal of Engineering and Technology, 6(1), 1.
[163] Chindaprasirt, P., Chareerat, T., Hatanaka, S., & Cao, T. (2011). High-strength geopolymer using fine
high-calcium fly ash. Journal of Materials in Civil Engineering, 23(3), 264-270,
https://doi.org/10.1061/(ASCE)MT.1943-5533.0000161
[164] Silva, R. V., De Brito, J., & Dhir, R. K. (2014). Properties and composition of recycled aggregates from
construction and demolition waste suitable for concrete production. Construction and Building Materials, 65,
201-217, https://doi.org/10.1016/j.conbuildmat.2014.04.117
[165] Mohammed, A., Rafiq, S., Sihag, P., Kurda, R., Mahmood, W., Ghafor, K., & Sarwar, W. (2020). ANN,
M5P-tree and nonlinear regression approaches with statistical evaluations to predict the compressive strength
of cement-based mortar modified with fly ash. Journal of Materials Research and Technology, 9(6), 12416-
12427, https://doi.org/10.1016/j.jmrt.2020.08.083
[166] FM Zain, M., & M Abd, S. (2009). Multiple regression model for compressive strength prediction of
high performance concrete. JApSc, 9(1), 155-160.
[167] Demircan, E., Harendra, S., & Vipulanandan, C. (2011). Artificial neural network and nonlinear models
for gelling time and maximum curing temperature rise in polymer grouts. Journal of materials in civil
engineering, 23(4), 372-377, https://doi.org/10.1061/(ASCE)MT.1943-5533.0000172
[168] Mohammed, A. S. (2018). Vipulanandan model for the rheological properties with ultimate shear stress
of oil well cement modified with nanoclay. Egyptian journal of petroleum, 27(3), 335-347,
https://doi.org/10.1016/j.ejpe.2017.05.007
[169] Quinlan Ross J., 1992. Learning with continuous classes. In: 5th Australian Joint Conference on
Artificial Intelligence, Singapore, pp. 343–348.
[170] Wang, Y., & Witten, I. H. 1997. Induction of model trees for predicting continuous classes. In Poster
papers of the 9th European Conference on Machine Learning, https://hdl.handle.net/10289/1183
[171] Malerba, D., Esposito, F., Ceci, M., & Appice, A. (2004). Top-down induction of model trees with
regression and splitting nodes. IEEE Transactions on Pattern Analysis and Machine Intelligence, 26(5), 612-
625, https://doi.org/10.1109/TPAMI.2004.1273937
[172] Li, M. F., Tang, X. P., Wu, W., & Liu, H. B. (2013). General models for estimating daily global solar
radiation for different solar radiation zones in mainland China. Energy conversion and management, 70, 139-
148, https://doi.org/10.1016/j.enconman.2013.03.004


![EXPERIMENTAL STUDY OF FLY ASH- BASED GEOPOLYMER CONCRETE… · Alakaline Solution/Fly ash=0.35 Liquid/Fly Ash = 0.44 Compressive Strenght [MPa] Mixing Time Compressive Strenght [MPa]](https://img.pdfslide.us/doc/110x75/5fc8c63fff9292783f3b190d/experimental-study-of-fly-ash-based-geopolymer-concrete-alakaline-solutionfly.jpg)