Embed Size (px)
DESCRIPTION
Compressional Slownesses
Citation preview

Seediscussions,stats,andauthorprofilesforthispublicationat:http://www.researchgate.net/publication/235708332
COMPRESSIONALSLOWNESSDETERMINATIONBEHINDPOORLY-CEMENTEDCASING(CASEHISTORY)
CONFERENCEPAPER·MARCH2003
DOI:10.13140/RG.2.1.2570.9608
DOWNLOADS
178
VIEWS
335
6AUTHORS,INCLUDING:
FabioBrambilla
BakerHughesIncorporated
7PUBLICATIONS0CITATIONS
SEEPROFILE
M.Giorgioni
ShellGlobal
20PUBLICATIONS74CITATIONS
SEEPROFILE
D.Patterson
BakerHughesIncorporated
14PUBLICATIONS36CITATIONS
SEEPROFILE
Availablefrom:FabioBrambilla
Retrievedon:13September2015

1
COMPRESSIONAL SLOWNESS DETERMINATION BEHIND POORLY-CEMENTED CASING (CASE HISTORY)
F. Pampuri, M. Borghi, S. Deias, ENI-AGIP, M. Giorgioni, Enterprise Oil ItalianaSpA, F. Brambilla, X. Tang, D. Patterson, BAKER ATLAS
Copyright OMC 2003This paper was presented at the Offshore Mediterranean Conference and Exhibition in Ravenna, Italy, March 26-28, 2003. Itwas selected for presentation by the OMC 2003 Programme Committee following review of information contained in the abstractsubmitted by the authors. The Paper as presented at OMC 2003 has not been reviewed by the Programme Committee.
ABSTRACT
This paper presents an important application of cased-hole acoustic dipole waveform loggingto determine the formation compressional-wave slowness (DTC) profile in the presence ofpoor cement bonding (e.g., unbounded casing, free pipe).
In Southern Italy, the formations above the reservoir are often characterized by strongborehole instability and the drilled interval is usually cased immediately after drilling to avoidcollapse. For this reason, open log data are often unavailable over this interval even thoughan acoustic-slowness log (i.e., the DTC profile) is desired for seismic correlation purposes.
Conventional monopole acoustic logging can determine DTC through casing, if casing andformation are well bonded. However, the evaluation of the cementation around the liner overthis interval indicates that most of the logged interval consists of free pipe. This situationallows the casing to ring and this strong casing-signal and resulting poor acoustic coupling tothe formation does not permit the standard DTC determination.
In this field example, a decision was made to obtain dipole and monopole waveform dataover a 900-meter section inside the liner. The goal was to obtain a reliable DTC bycombining the results from processing both the monopole and dipole waveforms.
The processing has been carried out following these steps:
1. Detailed evaluation of the cementation and broad subdivision of the interval into threezones: free pipe, poor to medium cementation and good cement bond.
2. Dipole and monopole waveform component analysis in terms of slowness coherencequality determination by processing using selected frequency bands.
3. Final DTC determination using optimized procedures and parameters by combining DTCcomputed from monopole acquisition (good cement bond zone) with the DTC from thedipole acquisition when passing through a poor cemented interval.
The main result of this processing is a reliable DTC curve over the entire well includingintervals with poor cement bond by combining results of the processing of both monopoleand dipole waves. The important result is the demonstration of the ability to obtain anaccurate compressional slowness even through poorly bonded casing.

2
INTRODUCTION
The well, discussed below, was cased immediately after drilling, due to borehole stabilityproblems. For this reason no open logs were recorded and available for comparison. Anacoustic log is mandatory for seismic correlation purposes and shale overpressure analysis,and this meant an alternate approach was required.
The evaluation of the cementation around the liner on this interval indicates that most of theinterval was in free pipe condition. This situation does not permit the standard monopolelogging of the compressional waves through casing. Baker Atlas proposed to run a full dipoleand monopole acquisition of the XMAC inside the casing so it could be processed in theGeoScience Centre to obtain a reliable DTC combining the results from processing ofMonopole and Dipole waveforms. This proposal was made because analyst had observed, inprevious logs, that a part of the flexural energy produced by the dipole transmitter isconverted to compressional waves which are readily apparent when passing through apoorly cemented intervals. This feature permits the use of waves recorded with the dipolereceivers, for the computation of the compressional slowness.
BOREHOLE STATUS AND LOGGING OPERATIONS
TD: 3XXX m (MD)Bit size: 8.5 in.Borehole fluid: FW-K2-GL, density 1.6 g/cc.Casing: 7 in liner (29 lb/ft T95) from 2XXX m to 3XXX m.
9.625 in casing (53.5 lb/ft T95) from 0 m to 2XXX mDeviation max: 54.7 deg. The logged interval is quite straight having the inclination near to53-54 deg.
LOG RECORDED:SBT-GR: 1XXX m - 3XXX m.XMAC-GR: 2XXX m - 3XXX m.
STRATIGRAPHY:The logged interval includes the Unita' Apule and the Unita' Irpine characterised by boreholestability problems.
DATA ANALYSIS PROCEDURE
The processing has been carried out following these steps
1. Detailed evaluation of the cementation2. Dipole and Monopole waveform components analysis in terms of slowness determination
working on selected frequency bands3. Final DTC determination using optimised procedures and parameters
CEMENTATION EVALUATION
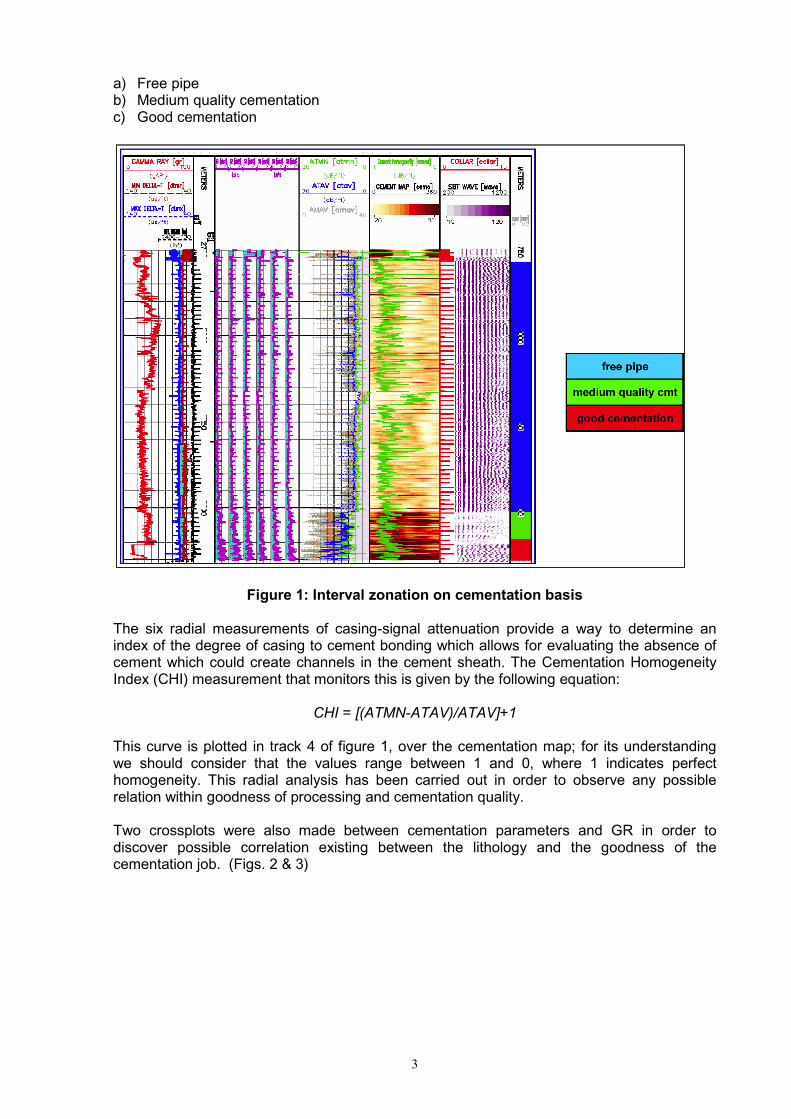
The SBT log permits a detailed analysis of the cement to casing bond across six sectorsproviding a full 360 degree azimuthal evaluation of the cementation. The combinedobservation of the cement map and the ATAV and ATMN curves, i.e. the average andminimum value of attenuations recorded over the six radial sectors of casing as investigatedby the SBT (fig. 1) permit the recognition of three zones, that have been named:
3
a) Free pipeb) Medium quality cementationc) Good cementation
Figure 1: Interval zonation on cementation basis
The six radial measurements of casing-signal attenuation provide a way to determine anindex of the degree of casing to cement bonding which allows for evaluating the absence ofcement which could create channels in the cement sheath. The Cementation HomogeneityIndex (CHI) measurement that monitors this is given by the following equation:
CHI = [(ATMN-ATAV)/ATAV]+1
This curve is plotted in track 4 of figure 1, over the cementation map; for its understandingwe should consider that the values range between 1 and 0, where 1 indicates perfecthomogeneity. This radial analysis has been carried out in order to observe any possiblerelation within goodness of processing and cementation quality.
Two crossplots were also made between cementation parameters and GR in order todiscover possible correlation existing between the lithology and the goodness of thecementation job. (Figs. 2 & 3)

4
Figure 2: Cross-plot Cementation Homegeneity index vs GR
Figure 3: Cross-plot Average Cementation vs GR
As readily apparent, there is no relationship between lithology and cementation quality.

5
DIPOLE AND MONOPOLE WAVEFORM COMPONENTS ANALYSIS
Over each waveform mode recorded, a frequency analysis has been carried out and for eachmode three frequency bands (low, medium and high) have been selected to be processed forutilization in the slowness coherence analysis.
The six resulting correlograms allow for selecting of the best filter and the processingparameters to produce consistent slowness among the six different computed correlograms,for the finalised processing.
The parameters of the correlation windows used have been selected in order to explore wideranges of potential slowness in order to recognize the presence of compressional andshear/flexural arrival over a wide portion of the recorded waveforms.
The filter values and the parameters selected are presented on table 1 below.
Table 1: Waveforms correlations parametersMonopole Processing parameters
Filter FIR Low Medium HighHz 200 - 4000 4000 - 12000 12000 - 20000
Correlation ParametersWindowlength
400 step 200 us 15 # of windows
Correl start 500 Corr end 3500 us 3000 us lengthDtmin 35 Dtmax 240 us/ft
Dipole Processing parametersFilter FIR Low Medium High
Hz 200 - 1600 1600 - 4000 4000 - 15000Correlation ParametersWindowlength
500 step 250 us 17 # of windows
Correl start 750 Corr end 5000 us 4250 us lengthDtmin 40 Dtmax 440 us/ft
Furthermore, two slownesses per correlogram, have been determined where possible:• The first slowness was determined in order to derive the DTC (i.e. the compressionalcurve) curve.• The second slowness (named DTZ or DT far) has been computed where thecorrelograms indicate the presence of consistent correlation suggesting the occurrence ofanother wave having slower speed than the compressional. This DTZ curve can be relatedto either the shear waves or to the casing flexural waves. The DTZ curve has been computedmainly to observe the capability to acquire reliable shear slownesses in this demandinglogging environment.
LEARNING POINTS AND FINAL DTC COMPUTATION
The main results from these analyses are:
a) Determination of DTC from monopole wave: it has been possible only over the intervalshaving medium to good cement bond. However, the DTC determination can be made only onthe correlogram resulting from the processing using the medium filter (4 - 12 KHz) and thecorrelogram is often discontinuous, as it is very sensitive to the cementation quality.
6
b) Determination of DTC from dipole wave: the best determination is done over thecorrelogram from the medium filter (1.6 - 4 KHz). Correlograms from both low and high filtersoften display some reliable DTC. The indication is that the formation signals span a largefrequency band. No compressional formation signal can be retrieved over the well-cementedzone. It is evident that the acoustic mechanism for generating compressional signal from thecasing works only when the casing if free to ring reacting to the flexural signal.
c) Combining the best of the results from a) and b) it is possible to produce a reliable DTCcurve over any quality of casing cementation.
d) Determination of DTS from monopole wave it is possible over the good to medium qualitycemented intervals.
e) Determination of DTS from dipole wave: in the well-cemented interval the dipole providesa good DTS curve. The DTZ curves computed over the poor and medium cemented zonecould be indicative of shear slowness but when logging a formation not having a previouswell known DTS value it is not possible to judge how close the DTZ computed slowness is tothe true DTS.
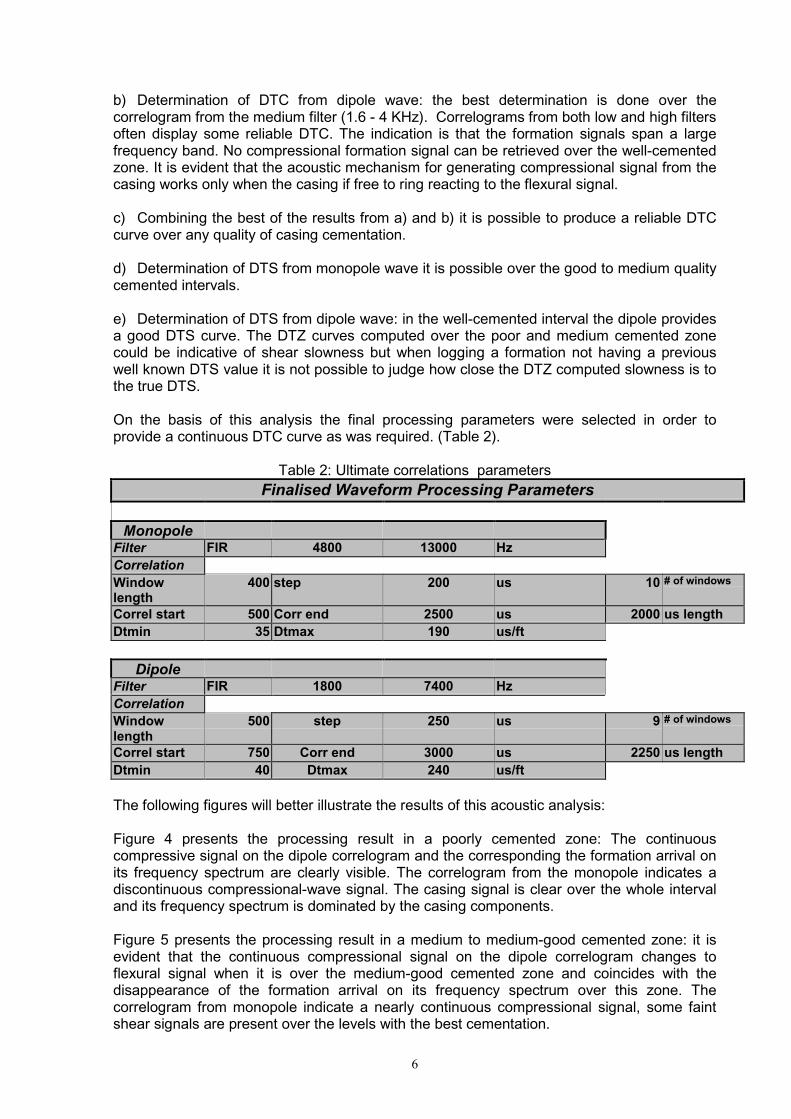
On the basis of this analysis the final processing parameters were selected in order toprovide a continuous DTC curve as was required. (Table 2).
Table 2: Ultimate correlations parametersFinalised Waveform Processing Parameters
MonopoleFilter FIR 4800 13000 HzCorrelationWindowlength
400 step 200 us 10 # of windows
Correl start 500 Corr end 2500 us 2000 us lengthDtmin 35 Dtmax 190 us/ft
DipoleFilter FIR 1800 7400 HzCorrelationWindowlength
500 step 250 us 9 # of windows
Correl start 750 Corr end 3000 us 2250 us lengthDtmin 40 Dtmax 240 us/ft
The following figures will better illustrate the results of this acoustic analysis:
Figure 4 presents the processing result in a poorly cemented zone: The continuouscompressive signal on the dipole correlogram and the corresponding the formation arrival onits frequency spectrum are clearly visible. The correlogram from the monopole indicates adiscontinuous compressional-wave signal. The casing signal is clear over the whole intervaland its frequency spectrum is dominated by the casing components.
Figure 5 presents the processing result in a medium to medium-good cemented zone: it isevident that the continuous compressional signal on the dipole correlogram changes toflexural signal when it is over the medium-good cemented zone and coincides with thedisappearance of the formation arrival on its frequency spectrum over this zone. Thecorrelogram from monopole indicate a nearly continuous compressional signal, some faintshear signals are present over the levels with the best cementation.

7
Figure 6 shows the agreement of the slownesses computed over the intervals with goodcementation.
Figure 4: Finalised result for compressional slowness and correlograms in free pipe zone
Figure 5: Finalised result for compressional slowness and correlograms in transitionfrom free pipe to medium quality cementation zone. Oval indicates where the DT, ondipole jumps to the compressional arrival

8
Figure 6: Finalised result for compressional slowness and correlograms ingood quality cementation zone

9
ACOUSTIC THEORY
In the free pipe situation, the transversely polarised dipole-wave motion can effectivelypenetrate through casing and the fluid annulus behind, producing additional wavephenomena that are different from those of a well-cemented casing situation. The decouplingof the casing and formation by the fluid annulus permits the generation of a formationcompressional wave and a casing bending (or flexural) wave.
The full waveform recorded at the dipole receiver is thus composed of the followingcomponents: formation compressional signal, flexural (close to the shear) signal and ringingcasing waves. The waveform correlation analysis, of this compressional component of thefull waveform recorded provides a way to obtain a reliable DTC.
The two simplified above models on figure 7 demonstrates the feasibility, of the cased-holedipole logging. The synthetic full waveforms are computed for two monochromatic acousticsources having excitation frequencies of 6 kHz and 3 kHz respectively. A log inside a freebonded casing with a theoretical formation around was simulated.
Figure 7: Cased-hole, Dipole Logging modelling on free pipe condition
The higher frequency case clearly shows a prominent P-wave arrival and a flexural wavearrival, respectively travelling at the formation P- and S-wave velocity. This proves that atransversely polarised wave can see through casing/cement, even in the free pipe situation.In addition, the seismogram also shows an emergent event trailing the formation waves. Thiswave is the casing flexural wave.When the casing is not bonded with the formation, the casing will flex when it is excited by adipole source. At a lower excitation frequency (3 kHz), the P-wave arrival almost disappears,the resulting waveform is composed mainly by the formation flexural wave and the casingflexural wave. This 'casing wave' is characterised by strong amplitude.
In the actual acoustic logging environment, the optimum frequency band to producecompressional waves, in the free pipe condition, may not be the same as that of the abovesynthetic example, as this frequency band depends on the casing size, casing weight, drillingfluids type, borehole and tool size, and formation slowness.
Acoustic logging instruments, such as XMAC Elite, generate dipole waves with a relativelybroad frequency spectrum and their receivers are able to record waveforms composed of a
10
wide spectrum of frequencies. These features permit the logging of compressional wavesunder common well conditions.
This acquisition indicates, as already suggested, that the cemented casing cannot produceenergetic ringing waves and for this reason the dipole source does not induce compressionalsignals which can be recorded by the dipole sensor of the acoustic logging instrument.However, this is an ideal situation where the compressional wave is derived directly from themonopole mode.
CONCLUSIONS
This study has shown that a reliable Dt compressional can be calculated over intervals withpoorly cemented casing by combining the results of the processing of both monopole anddipole acoustic waveforms. This conclusion is important because previously, without thistechnique, a reliable Dt compressional could not be determined for such intervals.
In order to achieve this result, a digital acoustic service with a suited acquisition mode (fullmonopole and dipole waveform) is necessary. In addition the understanding of the cementquality is valuable to help with the evaluation of the waveform data.
A processing procedure has been set up for this special analysis following these steps:
1. General well QC: Detailed evaluation of the cementation and broad subdivision of theinterval into three zones: free pipe, poor to medium cementation and good cement bond.
2. Dipole and Monopole waveform components analysis in terms of slowness coherencequality determination by processing on selected frequency bands.
3. Final DTC determination using optimised procedures and parameters, combining DTCcomputed from monopole acquisition (good cement bond zone) and DTC from the dipoleacquisition using converted flexural to compressional wave when passing through a poorcemented interval.
REFERENCES
Bigelow, E.L.: Cement Evaluation, Atlas Wireline Services, Houston, Texas,1990.
Bigelow, E.L., Domangue, E.J., and Lester, R.A.: “A New Innovative Technology For CementEvaluation,” SPE 20585, Proceedings 1990 SPE Annual Technical Conference andExhibition.
Biot, M. A., a, "Theory of propagation of elastic waves in a fluid-saturated porous solid, I: Lowfrequency range": J. Acoust. Soc. Am. 28, 1956.
Biot, M. A., b, "Theory of propagation of elastic waves in a fluid-saturated porous solid, II:Higher frequency range": J. Acoust. Soc. Am. 28, 1956.
Chen, S.T., and Eriksen, E.A.: “Compressional- And Shear-Wave Logging In Open AndCased Holes Using A Multipole Tool," Geophysics 56, No. 4, 1991.
Cheng, N., and Cheng, C.H.: “Estimations Of Formation Velocity, Permeability, And Shear-Wave Velocity Using Acoustic Logs", Geophysics 61, No. 2, 1996.

11
Cocco, E., Ortoloani, F., Pescatore, T., Russo, M., Sgrosso, I., Torre, M.: "Les facìessedimentaires du Basin Irpinien (Italie Méridionale)", Atti Accad. Pontoniana 21, 1-13. 1972.
Giorgioni, M., Gambini, R., Amato, A., Mariucci, M.T., Montone, P.: "Relationship betweenborehole breakouts and faults along a deep well in the Southern Apennines (Italy)", inOMC99 Proceedings, 375-389, Ravenna, 1999.
Kimball, C. V., and Marzetta, T. L., "Semblance processing of borehole acoustic array data":Geophysics, 49, 1986.
Kimball, C. V., "Shear slowness measurement by dispersive processing of borehole flexuralmode": Geophysics, 63, 1998.
Pettinelli, R., Rea, G.: "Sequenza di sovrascorrimenti nell'Appennino Campano-Lucano"Abstract Congresso Società Geologica Italiana, Palermo 21-23 September, vol. B: 667-668,1998
Pettinelli, R., "Campano-Lucano apennine sector; allochtonous sheets structural setting"EAGE Conference on geology and petroleum geology. St. Julians, Malta, 2000.
Puliti, A., Rovere, A., "Horizontal, slanted/horizontal, and bi-drain wells: key factors for thedevelopment of the Val D' Agri main field (Val D'Agri - Italy)", in OMC99 Proceedings, 457-466, Ravenna, 1999.
Schmitt, D. P. "Shear-wave Logging in Elastic Formations,’’ J. Acoust. Soc. Am, 1988.
Zemanek, J., Angona, F. A., Williams, D. M., and Caldwell, R. L., "Continuous shear wavelogging", Paper U., in 25th Annual Logging Symposium Transactions: SPWLA, 1984.