Embed Size (px)
Citation preview

Fuel 89 (2010) 2925–2938
Contents lists available at ScienceDirect
Fuel
journal homepage: www.elsevier .com/locate / fuel
Compression ignition engine modifications for straight plant oil fuelingin remote contexts: Modification design and short-run testing
M. Basinger a,*, T. Reding b, C. Williams c, K.S. Lackner a, V. Modi c,**
a Earth and Environmental Engineering, Columbia University, New York City, USAb Mechanical Engineering, Manhattan College, New York City, USAc Mechanical Engineering, Columbia University, New York City, USA
a r t i c l e i n f o a b s t r a c t
Article history:Received 15 October 2009Received in revised form 31 March 2010Accepted 22 April 2010Available online 4 May 2010
Keywords:Plant oilsStraight vegetable oilDiesel engineEmissionsCI engine
0016-2361/$ - see front matter � 2010 Elsevier Ltd. Adoi:10.1016/j.fuel.2010.04.028
* Corresponding author. Tel.: +1 212 854 7993.** Principal corresponding author.
E-mail address: [email protected] (M. Basing
Though many plant oils have a similar energy density to fossil diesel fuel, several properties of plant oilsare considerably different from those of diesel. Engine modifications can overcome some of these differ-ences. An engine modification kit has been designed and tested for a slow speed, stationary, indirect-injection diesel engine – the Lister-type CS 6/1, common throughout the developing world. The kit allowswaste vegetable oil fueling with similar performance to that of diesel fueling. The kit’s simple yet robustdesign is targeted for use as a development mechanism, allowing remote farmers to use locally grownplant oils as a diesel substitute.
The modification kit includes a preheating system and the tuning of the injector pressure and timing tobetter atomize given the unique properties of straight plant oils. The design methodology for the modi-fications is detailed and a suite of performance test results are described including fuel consumption, effi-ciency, pre-combustion chamber pressure, and various emissions. The results of the study show how acombination of preheating the high pressure fuel line, advancing the injector timing and increasing theinjector valve opening pressure allows this engine to efficiently utilize plant oils as a diesel fuel substi-tute, potentially aiding remote rural farmers with a lower cost, sustainable fuel source – enabling impor-tant agro-processing mechanization in parts of the world that needs it most.
� 2010 Elsevier Ltd. All rights reserved.
1. Introduction
The idea of fueling compression ignition engines on plant oil isas old as the diesel engine itself. In Rudolph Diesel’s preface to his1912 patent he wrote that the ‘‘use of vegetable oil for engine fuelmay seem insignificant today but such oil may become in thecourse of time, as important as petroleum” [1]. It seems that overthe decades since this patent, whenever petroleum prices suddenlyincrease a renewed interest in plant oil combustion occurs. Thishas resulted in a significant body of the literature describing en-gine performance and resulting emissions of different oils in differ-ent engines. Some studies have investigated modifications to theengine that allow for straight fueling with plant oil, others blendplant oils with diesel, while others carry out a combination of theseapproaches.
More recently, biodiesel production (transesterification) has be-come a popular endeavor. Even so, biodiesel captures only a smallfraction of the total diesel fuel market share – in 2007 the US’s pro-duction of biodiesel was 1% the amount of fossil diesel sold [2].
ll rights reserved.
er).
Even if the entire world’s production of 115 billion liters of vegeta-ble oil had been used for fuel in 2007, neglecting conversion lossesas well as the debate on the use of food materials for fuel, thiswould only satisfy about 3/4 of the US diesel fuel demand [3].
However, some niche contexts do offer immediate opportunity.The technology development and experimental results discussedin this paper are focused on the application of straight plant oilsin diesel engines in the developing country context. Many develop-ing countries lack adequate energy infrastructure. Modern fuelsand generation systems are often inaccessible due to complex is-sues of financing, transportation, education/training, etc. The Uni-ted Nations Development Programme (UNDP) reported thatworldwide in 2005, nearly 2.4 billion people used traditional bio-mass fuels for cooking and nearly 1.6 billion people did not haveaccess to electricity [4]. Mechanical power for agriculture process-ing from small, stationary diesel engines is a core developmentmechanism for rural populations. However, the cost and availabil-ity of fuel in these remote locations can prohibit the use of thisimportant energy resource.
The use of locally grown, non-edible, plant oils to fuel slow-speed diesel engines has potential to provide a low cost, sustain-able solution. The ruggedness of engines like the Listeroid CS andits widespread availability lend itself to this application.

2926 M. Basinger et al. / Fuel 89 (2010) 2925–2938
2. SVO fueling methodology
The combustion of plant oils in diesel engines is influenced byqualities of both the oil and the engine. Different studies havefound different results and reached different conclusions depend-ing on the type of oil and engine that were used. Few experimentalstudies reach across engine type and oil type to elucidate thesetrends [5,6]. What follows is a brief review of the impact of theoil and the impact of the engine on plant oil combustion.
2.1. The impact of the oil
The processing of plant oils is complex. An entire industry sur-rounds the procedures and practices involved in taking oil-cropsfrom the field to the food-stand, or fuel tank. Extremely large, mul-ti-volume works, such as Baily’s Industrial Oil and Fats Products,detail every aspect of this industry [7]. Some vegetable oil combus-tion studies have found that the degree or type of processing of theoil has little impact on engine performance or emissions while oth-ers recommend at least degumming in order to remove phosphat-ides [5,6]. A detailed treatment of all the combustion implicationsfrom the different degrees of processing of plant oils is beyond thescope of this paper.
The term straight vegetable oil (SVO) will hence forth be used tosimply differentiate plant oil from biodiesel. Specific properties ofdifferent SVOs are discussed, in order to highlight broad differ-ences from one type of plant oil to the next as they generally relateto combustion.
The two primary motivations behind transesterification are toremove the glycerin ‘‘head” of the vegetable oil and to reduce theviscosity. The glycerin in SVOs has been shown to lead to enginedeposits in endurance testing [8,9]. High viscosity can impede flowin the fuel lines and filter but is of most concern with regard to itsimpact on atomization. For this reason the high viscosity of SVOhas been the property of greatest emphasis in most SVO combus-tion research. Improvements to viscosity can be obtained throughpreheating. As shown in Fig. 1, SVO viscosity is exponentially re-duced as temperature increases.
A Brookfield viscometer, model LVTD, and a hotplate were usedto measure the dynamic viscosity of the eight vegetable oils andnumber 2 diesel fuel. Each sample was heated in five degree incre-ments; the viscosity measurements are shown in Fig. 1. The soy, ra-peseed (canola), and peanut samples were cooking oils obtainedfrom a commercial food market. The waste vegetable oil (WVO)is used cooking oil from a local cafeteria; it is the same sample usedthroughout this paper. The pre-WVO, from which the WVO is
50
75
100
Vis
cosi
ty (c
P)
Soybean
Canola
Peanut
Palm
Jatropha
Soy Shortening
Pre-WVO
WVO
0
25
0 50 100 150 200
Temperature (C)
Diesel
Fig. 1. Viscosity vs. temperature of several plant oils and diesel.
derived, is a mix of soy and rapeseed (canola) cooking oil. Fullparameter, chemical, and lipid analysis of the WVO is providedin Appendix in Tables A.1–A.3.
A regression utilizing equation (1) can be fit to the viscosity ver-sus temperature curves from Fig. 1, where l is the viscosity in cen-ti-Poise and T is the temperature in Celsius. Coefficients A, B, and Cfor each oil are shown in Table 1. The temperature range overwhich the viscosity was measured is also provided
l ¼ Aþ BeCT ð1Þ
Though the high viscosity of unheated SVOs is a major issue forcombustion in modern diesel engines, there are several other phys-ical and fuel properties that also warrant attention. Table A.1 inAppendix lists some of these properties for a few SVOs.
The oil yield per land area per year is important when consider-ing scaling issues surrounding the use of SVOs as fuel. Soil, climatecondition, agricultural inputs (fertilizer, etc.), plant variety, andother factors all impact yield. Due to the complexity of these fac-tors and their interactions, Table A.1 provides an oil yield informa-tion as a range. As waste vegetable oil (WVO) is by its nature awaste product, an annual yield per area of land has not been pro-vided. Even so, the availability of WVO is significant. Pahl has esti-mated that more than 11 billion liters of WVO are produced everyyear in the United States alone [10].
Other important SVO properties, such as energy density, can becompared more succinctly than oil yield. For example, the energydensity, or calorific value, of SVOs is generally about 10% less thannumber 2 diesel, though will vary from SVO to SVO. This lower en-ergy density results in higher fuel consumption compared to fossildiesel.
The cetane number (CN) also has important combustion impli-cations. The CN is a measure of a fuel’s ignition delay quality; ahigher CN corresponds to a shorter ignition delay. Long ignition de-lay is undesirable due to the consequences of engine knock. A CNbetween 40 and 60 is preferable [11]. Some negative aspects ofan SVO’s ignition quality can be lessened or avoided through tun-ing the engine’s injection timing for the particular fuel.
Vegetable oils are hydrocarbons, though much heavier, and lessvolatile than number two diesel [12]. The chemical composition ofSVOs is important when considering combustion implications. Ta-ble A.2 in Appendix shows the C:H:O:S:N ratio for several SVOs.The occurrence of oxygen in the SVO molecule is advantageous,enhancing mixing-limited combustion and even reducing particu-late emissions, though potentially increasing NOx [13,14]. The exis-tence of nitrogen and oxygen in SVOs has valuable lubricitybenefits [15].
The ratio of an SVO’s C:H:O:S:N is meaningful, but the bondconfiguration of these elements, the lipid profile, is also importantto consider. Different fatty acid chains occur in significantly differ-ent amounts for different oils. This lipid profile has implications forcombustion. Many investigations have shown high amounts ofunsaturated fatty acid chains, especially linolenic and linoleicchains, increase engine wear as a result of the polymerizing qualityof the heavy polyunsaturated lipids [16,9,6]. There is a trade-offhowever. The degree of saturation of an oil impacts cold flow prop-erties. Soybean oil may have more polymerizing qualities com-pared to palm oil, but at low temperatures, such as those oftenfound in temperate climates during winter months, the cloud pointand pour point of palm oil can prohibit its use as a non-blendedand non-preheated fuel. The lipid profile has also been shown todirectly influence ignition delay and in turn NOx and particulateemissions [17].
Ryan and Bagby found that it is not only an SVO’s physicalproperties (viscosity), but its chemistry can also impact atomiza-tion characteristics. Polyunsaturated lipids such as linolenic and
Table 1Viscosity–temperature coefficients.
A B C Correlation coefficient Temperature range (�C)
Soybean 1.110 109.6 �0.036 0.999 25–160Rapeseed 5.590 141.9 �0.038 0.998 25–200Peanut 5.768 165.9 �0.041 0.998 25–200Palm 3.265 327.2 �0.055 0.993 25–145Jatropha 1.607 134.1 �0.037 0.999 25–145Soy shortening �3.638 89.30 �0.022 0.996 50–145Pre-WVO 1.040 146.7 �0.039 0.998 25–145WVO 3.486 171.1 �0.040 0.997 25–160Diesel 1.015 5.058 �0.019 0.996 25–125
M. Basinger et al. / Fuel 89 (2010) 2925–2938 2927
linoleic chains were most affected during the injection process,resulting in unexpected injector spray characteristics [18].
Structural indices such as the saponification value (SV) and io-dine value (IV) are used to quickly describe constituent lipid qual-ities. The SV is a measure of the average molecular weight, or chainlength, of the fatty acids present in an oil. The IV describes theunsaturated quality, the amount of double bonds, of an oil. An IVis assigned to an SVO based on the amount of iodine that can beabsorbed by the double bonds. The IV neglects the differentiationbetween polyunsaturated acids and monounsaturated acids.Knothe describes other, less common indices that can be used toovercome the limitations of the IV [19]. For the time being how-ever, the widespread use of the IV means that it is often readilyavailable across studies, making it a useful index. Table A.3 inAppendix provides the lipid profiles and iodine values for severalSVOs.
The experiments undertaken in this research utilized wastevegetable oil (WVO). WVO properties can vary widely from in-stance to instance depending on the cooking conditions and virginoil type. For this reason the specific properties of the WVO utilizedin this study is detailed in Appendix along side the other, morestandard vegetable oils. The lipid profile of the WVO is similar tosoy and rapeseed, with oleic and linoleic being the dominant lipidconstituents. The cetane number of the WVO is toward the lowerend of the various vegetable oils compared in Appendix. Theseproperties show the WVO to be one of the harsher fuels, withpoorer combustibility.
2.2. The impact of the engine
Several SVO engine study reviews highlight the role of the en-gine type and configuration in influencing combustion; dependingon the engine and modification used in a study, results can differsignificantly [8,9,11,12,20–22]. Engine speed and loading has beenfound to be important. Vojtisek-Lom et al. investigated rapeseedSVO fueling and found at higher engine loads CO levels improvedwhile NOx worsened compared to diesel, while at low engine loadsHC, CO, and PM worsened [23]. In addition to load, the design ofspecific components also impacts SVO combustion. Piston configu-ration and injector design are influential, but most often an empha-sis is placed on the type of injection system, direct or indirect.
Modern diesel engines tend to have direct injection (DI) sys-tems due to the improved efficiency and emissions it can offer.Older designs, sometimes relics from days with less stringent fuelquality standards, utilized indirect-injection (IDI) systems becauseof its ability to robustly burn lower quality fuel. The general trendin SVO combustion studies seems to confirm this value of IDI sys-tems. Hemmerlein et al. showed that DI engines fueled on rapeseedSVO tended to have poorer emissions and were not suitable for di-rect fueling, while IDI engines with big cylinders were suitable [5].
Ryan et al. tested multiple SVOs in a DI and IDI engine andfound increased nozzle coking and lubrication contamination com-pared to diesel in the DI engine but not in the IDI engine, though
the specific energy consumption of the DI engine was generallybetter then the IDI engine [6]. However, Engler et al. found thatthough short run IDI engine tests were favorable for various de-gummed SVOs, longer 40 h tests revealed rapid fouling of the lubri-cation oil [24].
Suda showed that in some DI engines unburned fuel impinge-ment on the cylinder wall results in deposits, ring and cylinderwear, and lubrication oil contamination [25]. Suda also tested soy-bean SVO in an IDI with a pre-combustion chamber and designed aspecial heat plug to allow the engine to robustly burn the SVO.
Redesigning major engine components is often less desirablethan more minor modifications. The most common minor enginemodification is to preheat the SVO. Different studies have madedifferent conclusions with regard to just how much to preheat. Bariet al. found heating between 55 and 70 �C was adequate for reduc-ing filter clogging and improving engine performance and emis-sions characteristics [26,27]. Pugazhvadivu and Jeyachandranfound preheating to 135 �C to be preferable [28]. Nwafor investi-gated the impact of preheating rapeseed SVO to 70 �C and foundat low speed and partial loading it was beneficial, but at higherspeeds and loads it had less impact [29]. Analysis of properties ofvarious SVOs has shown temperatures between 200 and 300 �Cto result in thermal decomposition, while higher temperatures ap-proach the flash point [30]. Even lower temperatures have been ar-gued to result in overheating the SVO. Bari et al. noted that at100 �C vapor bubbles occurred in the fuel line, resulting in non-ideal combustion [31]. Suda found that at 90 �C oxidation can oc-cur, resulting in gum formation [25].
Another common minor modification is to increase the injectorvalve opening pressure (IVOP). Increasing a diesel engine’s IVOPhas been shown to decrease fuel spray droplet diameter, and in-crease velocity and penetration distance resulting in a host of en-gine performance and emissions improvements [32–36]. Initialaverage fuel spray droplet diameter has been shown to be inver-sely related to its velocity squared [37]. This means that as velocityincreases (from increased IVOP), droplet size rapidly decreases.Droplet evaporation can be described by the D2 law, which relatesevaporation rate to the droplet diameter squared [38]. Decreasingthe droplet diameter can then significantly increase evaporationrates, thus enhancing combustion. This dual exponential relation-ship between droplet evaporation time and diameter, and betweendiameter and velocity means that even relatively small increases tothe IVOP can have significant combustion advantages.
It has already been discussed how SVOs are more viscous andheavier then number 2 diesel fuel; this has been shown to resultin considerably larger droplet diameters and lower injection veloc-ities, as described by lower Weber numbers [39,40]. For these rea-sons SVOs in particular can benefit from increased IVOP. Enokiet al. noted an improvement in brake thermal efficiency, ignition,and combustion stability with increased IVOP in an IDI enginefueled on various SVOs [34]. Puhan et al. also found improved en-gine performance and emissions from increased IVOP in a DI en-gine fueled on linseed methyl esters [41].
2928 M. Basinger et al. / Fuel 89 (2010) 2925–2938
There is a point where increasing the IVOP becomes counter-productive. This is due to increased spray penetration resultingin wall impingement [34]. For this reason it can be valuable to‘‘tune” a particular engine’s IVOP for the specific SVO.
Injection timing is another minor modification that has beenemployed to help the performance and emissions of SVO fueleddiesel engines. Haldar et al. observed enhanced engine perfor-mance with advanced timing, they attributed this to the lowercetane number of SVOs [42]. Bari et al. investigated timing ef-fects on a WVO in a DI engine. They found advanced timingimproved efficiency and reduced CO emissions, though it ele-vated NOx emissions [27]. Nwafor et al. also found benefitsfrom advancing the timing of a rapeseed SVO fueled IDI engine.The engine ran smoother and both CO and CO2 emissions im-proved [43]. This was attributed to the longer ignition delayand slower burning rates of plant oils. However, delay periodwas also found to be influenced by engine load, speed and tem-perature. Similar to IVOP findings, advancing the timing too farcan have negative consequences, resulting in erratic enginebehavior [43].
3. Experimental setup
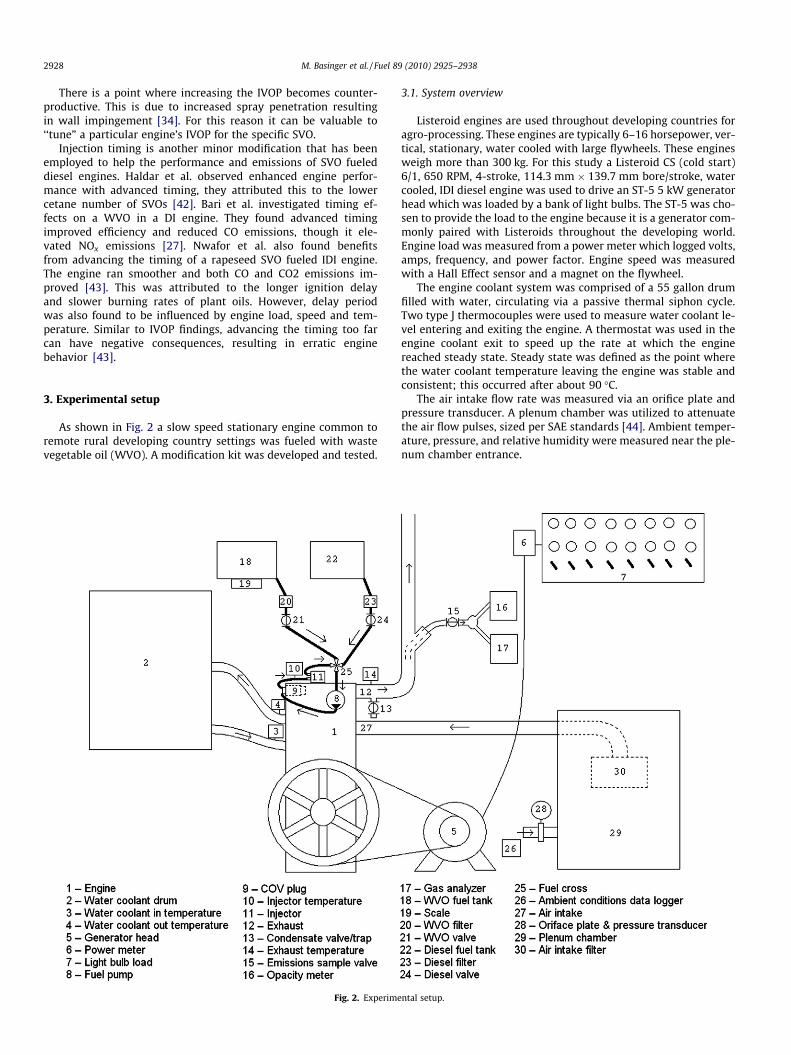
As shown in Fig. 2 a slow speed stationary engine common toremote rural developing country settings was fueled with wastevegetable oil (WVO). A modification kit was developed and tested.
Fig. 2. Experime
3.1. System overview
Listeroid engines are used throughout developing countries foragro-processing. These engines are typically 6–16 horsepower, ver-tical, stationary, water cooled with large flywheels. These enginesweigh more than 300 kg. For this study a Listeroid CS (cold start)6/1, 650 RPM, 4-stroke, 114.3 mm � 139.7 mm bore/stroke, watercooled, IDI diesel engine was used to drive an ST-5 5 kW generatorhead which was loaded by a bank of light bulbs. The ST-5 was cho-sen to provide the load to the engine because it is a generator com-monly paired with Listeroids throughout the developing world.Engine load was measured from a power meter which logged volts,amps, frequency, and power factor. Engine speed was measuredwith a Hall Effect sensor and a magnet on the flywheel.
The engine coolant system was comprised of a 55 gallon drumfilled with water, circulating via a passive thermal siphon cycle.Two type J thermocouples were used to measure water coolant le-vel entering and exiting the engine. A thermostat was used in theengine coolant exit to speed up the rate at which the enginereached steady state. Steady state was defined as the point wherethe water coolant temperature leaving the engine was stable andconsistent; this occurred after about 90 �C.
The air intake flow rate was measured via an orifice plate andpressure transducer. A plenum chamber was utilized to attenuatethe air flow pulses, sized per SAE standards [44]. Ambient temper-ature, pressure, and relative humidity were measured near the ple-num chamber entrance.
ntal setup.

Fig. 4. COV plug modification.
M. Basinger et al. / Fuel 89 (2010) 2925–2938 2929
A dual fuel tank approach was utilized – the engine was startedon diesel to allow the preheater to come up to temperature andshutdown on diesel so that the high pressure fuel lines and pumpwere purged of the WVO. Each fuel tank had its own filter. TheWVO was pre-filtered to 1 lm before being added to the fuel tank.
The WVO’s ‘‘on-engine” filter (post fuel tank) was 80 mesh, toreduce a pressure drop that could result in starving the engine offuel. (Less than 0.1% water content was found in the pre-filteredWVO; even so the WVO’s ‘‘on-engine” filter included a water drainthat was regularly checked to avoid possible water buildup in thefilter enclosure.) To minimize mixing between the two fuels, theinjector’s fuel return line was not routed back to either fuel tank,but instead directly to the juncture of the two fuel lines (WVOand diesel) situated just before the fuel pump. This point is labeledas the ‘‘fuel cross” in Fig. 2.
The opacity of the exhaust was measured using an AutoLogicmodel #310-0332 opacity meter to take readings at 16 Hz thatwere then averaged across a 10 min sampling window. To measuregaseous emissions, an Enerac 700 integrated emissions system wasused to measure O2, CO, CO2, unburned hydrocarbons (UHCs), NO,NO2, and SO2. Data were collected once per second as parts per mil-lion (ppm) or vol%, depending on the concentration. Readings wereaveraged across a 10 min steady state window (steady state refer-ring to both engine stabilization and the stabilization of the gasanalyzer measurements).
4. Preheater design
In order to lower the viscosity of the WVO to a level comparableto diesel, a preheater was designed to take advantage of the Lister-oid CS’s special characteristics. The original design of the engine in-cluded a ‘‘Change Over Valve” (COV) for adjusting the compressionratio for easier start-up in cold climates. This original design isshown in Fig. 3. As this engine is now manufactured and used inprimarily warm climates, the COV has been replaced by a COVplug. This COV plug’s direct access to a large amount of waste heatthrough the cooling jacket, nearby location to the injector, and easyremoval for use in a modification kit, made it an appealing candi-date for use as a preheater.
Various methods of using the COV plug as a preheater were ex-plored. A priority was placed on a design that could be easily man-ufactured in a basic machine shop making it appropriate fordeployment and servicing in a developing country context. The fi-nal design consisted of machining a ‘‘V-shaped” passageway toroute the fuel through as shown in Fig. 4. The inlet and outlet weretapped to allow compression fittings to be attached so that thehigh pressure line could be connected as shown in Fig. 2.
Fig. 3. Original lister CS head and COV [45].
More complex geometries could have been utilized to furtheraid heat transfer, but the ‘‘V-shape” channel was chosen as it wasbelieved to possess an optimal ease and cost of local manufactura-bility for the target context. The passageway diameter was chosento be 0.635 cm (0.25 in.). It was assumed that any larger diameterwould potentially adversely affect the injection timing or riskedoverexerting the fuel pump (due to the increased volume of fueland its compressibility under high pressure). The length of the pas-sageway was chosen to be 11.43 cm (4.5 in.); a longer lengthwould have been within 1.3 cm (0.5 in.) of the pre-combustionchamber leaving a thickness of material that might be susceptibleto failure. A simplified heat transfer model aided the design of thegeometry, showing that the fuel would not be over or underheated. The performance was then confirmed experimentally.
Before building the preheater, to estimate the performance ofthe ‘‘V-shaped” passageway it was modeled as a 1-D heat transferproblem. The modeled passageway was a straight tube with diam-eter D and length L with the same values as the ‘‘V-shaped” diam-eter and length. The mass flow rate of the fuel flow through thepassage way was designated _m, with a bulk temperature Tb, anda wall temperature Tw, as shown in Fig. 5. This simplification al-lowed the utilization of well-known empirical correlations fordetermining the heat transfer coefficients.
The bulk temperature of the fuel (Tb) was defined by:
Tb ¼Tf þ Ti
2ð2Þ
where Ti was the initial temperature of the fuel entering the pas-sageway and Tf was the final temperature leaving the passageway.In a convection dominated system, the overall power utilized toraise the temperature of the fuel can be calculated by:
_q ¼ _mcp Tf � Ti� �
¼ hA Tw � Tbð Þ ð3Þ
where cp is the specific heat of the fuel and is a function of Tb. A isthe surface area in the tube. h is the convection coefficient and is a
Fig. 5. Heat transfer model.

100
125
150
Inje
ctor
Tem
pera
ture
(C) Experimental
Theoretical
50
75
0% 25% 50% 75% 100%
Engine Load (%)
Fig. 7. Injector temperature performance.
2930 M. Basinger et al. / Fuel 89 (2010) 2925–2938
function of the Nusselt number (Nu). For laminar, fully developedflow in a horizontal tube, an empirical relation has been developedand is expressed in Eq. (4) [46,47]
Nu ¼ hDk¼ 0:61 ReRað Þ1=5 1þ 1:8
ReRað Þ1=5
" #ð4Þ
where Re and Ra were the Reynolds number and Raleigh number,respectively, and defined in the following equations:
Re ¼ UDm
ð5Þ
Ra ¼ gb Tw � Tbð ÞD3
mað6Þ
where U was the average velocity of the fuel, m was the kinematicviscosity of the fuel, g was the gravitational acceleration, b wasthe volumetric thermal expansion coefficient of the fuel (assumedto be constant), and a was the thermal diffusivity of the fuel. mand a were functions of Tb. For a given Tw and Ti, Tf can be itera-tively solved for through utilizing Eqs. (2)–(6). In order to findappropriate values of Tw a thermal profile of the COV plug was mea-sured through the following experimental setup.
Five thermocouples were installed into the COV plug in an ‘‘X”configuration, first at a depth of 1.3 cm (0.5 in.) into the plug fromthe exterior of the engine, then 3.8 cm (1.5 in.), and finally 6.4 cm(2.5 in.). These depths extended across 80% of the total COV pluglength. The five measured temperatures were averaged at eachdepth for each load tested and this thermal profile of the plug isshown in Fig. 6. Error bars indicate standard deviation betweenthe five thermocouples, averaged across the five loads at the spe-cific depth.
For purposes of a simple theoretical calculation of Tf the walltemperature of the passageway (Tw) was assumed to be uniformacross all depths, but vary depending on the load, so the averagetemperature across all depths was used as the Tw for each load.
To justify the use of Eqs. (2) and (3) the role of convection rel-ative to conduction needed to be determined so the Rayleigh num-ber (Ra) of the waste vegetable oil traveling through thepassageway was calculated using the measured Tw. The Rayleighnumber exceeded 50,000 for all engine loads (10–90%), validatingthe assumption that convection dominated [46].
Tf was found through iteratively solving Eqs. (2)–(6). This theo-retical Tf was compared to the experimentally measured tempera-ture at the injector utilizing the actual geometry. Fig. 7 shows theagreement between the calculated theoretical and the experimen-tally measured.
140
160
Tem
pera
ture
(C)
1.3cm depth
3.8cm depth
6.4cm depth
100
120
0% 25% 50% 75% 100%
Engine Load
Fig. 6. COV temperature profile.
The differences between the calculated and measured resultsare likely due to the following.
1. The simplifying assumption of laminar flow is inaccurate. Thefuel pump pushes fuel through the preheater in pulses whichlikely enhance heat transfer.
2. The experimental measurement of the fuel temperature wasnot at the exit of the preheater (Tf ), but instead approximately15 cm (6 in.) downstream at the inlet to the injector. Thoughthis 15 cm (6 in.) of fuel line was insulated, some temperatureloss would have occurred, meaning the experimental values inFig. 7 are lower than the actual Tf .
3. The wall temperature of the passageway (Tw) was assumed tobe uniform and only vary with load. But the measured COV plugthermal profile showed increasing temperature with increasingdepth into the plug. These higher temperature ranges wouldhave made the heat transfer more favorable then the simplifiedmodel represented.
Even with these limitations of the model, the design was veri-fied and the performance of the preheater was found to increasethe temperature of the WVO entering the injector to a satisfactorilylevel (approximately 90 �C), significantly reducing viscosity. Thisincrease in temperature related to a heat recovery rate of 23–42 W (across the loading range tested).
4.1. Pressure and timing
As discussed above, the combustion characteristics of WVO aredifferent from that of fossil diesel. A more complete burn can occurfrom increased injector valve opening pressure (IVOP) and ad-vanced injector timing.
To increase the IVOP on the Listeroid CS engine, a cap on the topof the injector is removed, a lock nut loosened, and a screw tight-ened. Equally as simple, advancing the timing involves loosening alock nut under fuel pump and raising an adjusting screw. Becauseof the minimal overhead with regard to tools and training requiredto make each of these modifications, both were determined to beappropriate additions for the modification kit’s targeted context.
5. Results and discussion
The performance of the modification kit described above (pre-heater, increased IVOP, and advanced timing) was experimentallytested through multiple methods.

M. Basinger et al. / Fuel 89 (2010) 2925–2938 2931
5.1. Injection tuning
In order to tune the engine’s timing and IVOP to optimal condi-tions for the WVO, three timing settings (20� BTDC, 25� BTDC, and30� BTDC) and three IVOPs (9 MPa, 12 MPa, and 15 MPa) weretested. Higher IVOPs were tested previously but erratic perfor-mance precluded further exploration past 15 MPa. Each of thesenine settings was tested three times each at 75% engine load(±1%) and 650 RPM (±1 RPM). For all of the 27 tests, the fuel waspreheated via the COV plug design detailed above. The summaryof the engine’s performance across these tests is detailed below. Er-ror bars signify standard error across the three repetitions, for eachof the nine different settings. Fig. 8 shows various engine perfor-mance parameters. All four parameters point toward an optimizedtuning of the injector timing at 25� BTDC with an IVOP of 15 MPa.
The temperature of the middle of the exhaust stream was mea-sured immediately off the engine head with a type-J thermocouple.The results are shown in Fig. 8(a). A clear difference in temperatureoccurs primarily from increasing the IVOP. As the timing advancesthe exhaust temperature is lowered to a point, and then increasesagain. The lowered temperature is likely indicative of more com-plete combustion, whereas the hotter temperatures are likely dueto less complete combustion that continued late into the cycle[28]. These results follow the same trend as the findings from Bariet al. where advanced timing of a DI engine fueled on WVO re-sulted in lower exhaust temperature, due to combustion occurringearlier, thus allowing the burnt gas more time to cool [27]. The 25�BTDC advanced timing and 15 MPa increased IVOP resulted in anexhaust temperature reduction of nearly 14%, compared to thestock timing and pressure (20� BTDC and 9 MPa).
Fig. 8(b) shows the brake specific fuel consumption for the sys-tem (generator and electrical losses were not subtracted). With atrend nearly identical to the exhaust temperature, the best perfor-
370
380
390
400
410
420
Exh
aust
Tem
pera
ture
(C)
9 MPa
12 MPa
15 MPa
340
350
360
370
18 20 22 24 26 28 30 32
Injector Timing (ºBTDC)
22%
23%
24%
Bra
ke F
uel C
onve
rsio
n E
ff.
20%
21%
18 20 22 24 26 28 30 32
Injector Timing (ºBTDC)
9 MPa
12 MPa
15 MPa
(a) (
(d(c)
Fig. 8. IVOP and timing
mance was found at the timing of 25� BTDC with an IVOP of15 MPa. The 25� BTDC advanced timing and 15 MPa increased IVOPresulted in a BSFC reduction of 9%, compared to the stock timingand pressure (20� BTDC and 9 MPa). These results relate well tothe findings of Nwafor et al. where advanced timing of an IDI en-gine resulted in lower BSFC at low engine speeds [43].
Given WVO’s measured higher heating value of 39.4 MJ/kg, thebrake fuel conversion efficiency was calculated (the generator andelectrical system was assumed 82.5% efficient). Fig. 8(c) shows howtuning the IVOP and timing can result in a gain of 2% efficiency.Such a gain is significant when considering the modest efficiencyof the engine. This trend toward improved efficiency at advancedtiming is similar to Haldar’s findings [42].
The equivalence ratio is the actual fuel to air ratio divided by thestoichiometric fuel to air ratio and is a direct indicator of the qual-ity of combustion. Fig. 8(d) shows the equivalence ratio across thenine test points. In strong agreement with all other engine perfor-mance parameters, the equivalence ratio map reinforces thehypothesis that when fueling the Listeroid CS 6/1 on WVO, optimaltuning occurs at the timing of 25� BTDC with an IVOP of 15 MPa. Atthis advanced timing and increased IVOP the equivalence ratio de-creased by almost 10%, compared to the stock timing and pressure(20� BTDC and 9 MPa).
These engine performance benefits that were gained by advanc-ing the timing and increasing the IVOP can likely be attributed tothe specific atomization and ignition qualities of the WVO. As dis-cussed earlier, plant oils have poorer atomization qualities due totheir specific physical and chemical properties. The cetane number(CN) of the WVO used in the experiments, as shown in Table A.1, islow compared to fossil diesel, meaning that ignition is delayed.Advancing the injection timing then helps to overcome this highignition delay. Similarly, increased injection valve opening pres-sure has been shown to reduce the droplet size, decreasing the
415
425
435
445
Syst
em B
SFC
(g/
kWH
)
9 MPa
12 MPa
15 MPa
385
395
405
18 20 22 24 26 28 30 32
Injector Timing (ºBTDC)
0.54
0.56
0.58
0.60
Equ
ival
ence
Rat
io (
)
9 MPa12 MPa15 MPa
0.50
0.52
0.54
18 20 22 24 26 28 30 32
Injector Timing (ºBTDC)
b)
)
performance map.

2932 M. Basinger et al. / Fuel 89 (2010) 2925–2938
burn time and leading to more complete combustion (as describedabove). This more complete combustion is also seen in theemissions.
The measured opacity values are reported in Fig. 9. The resultsshow that at the most advanced injector timing (30� BTDC), regard-less of IVOP, opacity is worse than at stock timing (20� BTDC).However, in agreement with the engine performance data fromFig. 8, increasing the IVOP improves the opacity. The 25� BTDC ad-vanced timing and 15 MPa increased IVOP resulted in a measuredopacity that was only 2%; this was a fraction of the 7% measured atstock timing and pressure (20� BTDC and 9 MPa). The results viv-idly show an engine tuning ‘‘envelope” effect – advanced timingand increased IVOP improves combustion, but only to a point,
6
8
10
12
Opa
city
(%)
9 MPa12 MPa15 MPa
0
2
4
18 20 22 24 26 28 30 32
Injector Timing (ºBTDC)
Fig. 9. IVOP and timing exhaust opacity map.
600
800
1000
1200
CO
(ppm
)
9 MPa
15 MPa
0
200
400
Injector Timing (ºBTDC)
18 20 22 24 26 28 30 32
70
80
90
100
110
120
UH
C (p
pm)
9 MPa12 MPa15 MPa
40
50
60
70
Injector Timing (ºBTDC)
18 20 22 24 26 28 30 32
(a)
(c)
Fig. 10. IVOP and timin
where it then begins to degrade combustion. When injection is ad-vanced too far cylinder conditions are not optimal for good atom-ization. Temperatures and pressures rise rapidly close to TDC.These conditions are important for appropriate mixing and vapor-ization which lead to good combustion. Advancing the injectiontoo much introduces the fuel spray into the cylinder before theseconditions are available.
The measured gaseous emissions are reported in Fig. 10. Forboth the carbon monoxide and the oxides of nitrogen, the12 MPa IVOP results so closely resembled the 15 MPa IVOP resultsthat they have not been shown in Fig. 10(a) and (b). Instead, thelow and high IVOP setting are shown to illustrate the envelope.
At the lower IVOP more CO is generated, but less NOx. (NOx isreported as the sum of measured NO + NO2.) This common CO–NOx trade-off (also described as a PM–NOx trade-off) points againto the quality of the combustion. As the IVOP is increased, atomiza-tion improves. In diesel engine combustion, carbon monoxide pro-duction tends to be low under fuel lean conditions (equivalenceratio less than 1). During the combustion process carbon monoxideis produced, but with adequate oxidant, mixing, and at necessarytemperatures much of it is oxidized to carbon dioxide. At the high-est IVOP (15 MPa), as timing is advanced past 25� BTDC, CO rapidlyincreases. This may be explained by the poorer mixing and oxida-tion conditions that occur at the more advanced timing – the fuelspray is encountering lower pressures and temperatures and be-cause the IVOP is higher, more of the spray encounters these con-ditions (the increased IVOP results in faster injection: reducedinjection period). Even so, at the 25� BTDC timing and 15 MPa IVOPthe carbon monoxide was decreased to 63% of what was measuredat the stock timing and pressure (20� BTDC and 9 MPa).
The NOx values between the different IVOPs are not dramati-cally different (the error bars in Fig. 10(b) between the two IVOPsoverlap at low and mid timing). Increasing the IVOP from 9 to
900
1000
1100
1200
NO
x (p
pm)
9 MPa 15 MPa
600
700
800
18 20 22 24 26 28 30 32
Injector Timing (ºBTDC)
40
60
80
100
SO2
(ppm
)
9 MPa
12 MPa
15 MPa
0
20
40
18 20 22 24 26 28 30 32
Injector Timing (ºBTDC)
(b)
(d)
g emissions map.

M. Basinger et al. / Fuel 89 (2010) 2925–2938 2933
15 MPa does not then drastically increase NOx. Timing on the otherhand does seem to noticeably affect NOx. The envelope is not assharp, NOx somewhat levels off as timing is increased past 25�BTDC. As such, the NOx increase from the stock timing and pressure(20� BTDC and 9 MPa) to the preferred timing and pressure (25�BTDC and 15 MPa) was a 45% increase.
NOx formation is commonly attributed to the Zeldovich mecha-nism (a thermal mechanism). With regard to advanced injectiontiming, Patterson and Henien describe NO formation increasingin two ways [48]. As timing is advanced ignition delay increasesbut less so than the actual advancement (in terms of crank angle),resulting in earlier autoignition. Higher NO formation is then re-lated to the longer ignition delay as it allows for more fuel evapo-ration and mixing in the ‘‘lean flame region” of the spray. But inother spray regions NO may also increase due to higher tempera-tures. This description seems applicable to what is observed inFig. 10(b). Bari et al. also found NOx to increase with advanced tim-ing when fueled on WVO [27].
Fig. 10(c) and (d) shows the measured UHC and SO2 concentra-tions, respectively. Both cases support the same trend observedthroughout all of the other IVOP/timing maps. Unburned hydrocar-bon emissions appear to stay relatively level at advanced timinglikely due to the better matching of the ignition delay to timing,but then UHC more rapidly increase as timing is further advancedpast 25� BTDC. This may be because as timing continues to be ad-vanced the spray is introduced into lower pressure and tempera-ture conditions which results in less vaporization and largerdroplets which may not burn as completely or may potentially im-pinge on the walls. Compared to the stock timing and pressure (20�BTDC and 9 MPa), the preferred timing and pressure (25� BTDC and15 MPa) realized a 31% decrease in UHC.
In the case of SO2, emissions became undetectable at the opti-mized tuning of 25� BTDC with an IVOP of 15 MPa. Sulfur dioxideis produced from the sulfur in the fuel or lubrication oil and isformed more vigorously in fuel-rich conditions (equivalence ratiosgreater than 1). But even in fuel lean conditions, the air to fuel ratioimpacts SO2 formation. Fig. 10(d) mirrors Fig. 8(d); SO2 tracks clo-sely with equivalence ratio. The conversion of SO2 to SO3 and even-tually H2SO4 (which is strongly hydrophilic and mixes with waterand particulate matter in the exhaust, reducing the amount of SO2)has been the object of other studies, especially with regard to catal-ysis design, and it has been shown that the equivalence ratio andexhaust temperature significantly influence these conversions[49]. Given this tendency of SO2, the lower equivalence ratio andexhaust temperatures are likely the cause of the lower SO2 emis-sions at the injection timing of 25� BTDC and IVOP of 15 MPa. Atthis advanced timing and increased pressure (25� BTDC and
3
4
5
6
7
Pre
ssur
e (M
Pa)
Diesel
WVO
WVO w/mod
0
1
2
3
-90 -60 -30 0 30 60 90
Pre
ssur
e
Crank Angle Degrees
0
0
ΔΔ ΔΔP/ ΔΔ ΔΔ
CA
0
ΔΔ ΔΔ
(a) Pre-combustion Chamber Pressure vs. Crank Angle
Fig. 11. Pre-combustion
15 MPa) the SO2 emissions were decreased by more than 98% ofthe measured values at stock timing and pressure (20� BTDC and9 MPa).
The error bars in Figs. 8–10 are the standard error across thesamples taken per specific IVOP and timing position. Across the fig-ures these error bars tend to decrease as timing is advanced to 25�BTDC and IVOP is increased to 15 MPa. This means that not onlydoes engine performance and emissions tend to improve at this en-gine tuning position, but the performance and emissions are moreconsistent.
One limitation of this study’s injection tuning exercise is thatit was only carried out at one engine loading point, 75% load.Studies such as Bari et al. have found engine performance andemissions results to vary across loads as timing is changed. Thisstudy tuned the timing and IVOP at 75% engine loading as thiswas assumed to be the most common engine loading for this spe-cific engine in its specific context (agro-processing in developingcountries).
5.2. Pre-combustion pressure
A pressure transducer provided by Kulite Semiconductor Prod-ucts Inc. was used to map the pressure in the pre-combustionchamber versus the crank angle. Three cases were tested:
� diesel at standard (unmodified) conditions (room temperaturefuel, IVOP of 9 MPa, and injector timing of 20� BTDC)� WVO under unmodified conditions (room temperature fuel,
IVOP of 9 MPa, and injector timing of 20� BTDC)� WVO under modified conditions (fuel heated to 100 �C, IVOP of
15 MPa, and injector timing of 25� BTDC)
The engine was loaded to 75% and run at 650 RPM. The pressuretransducer was mounted into the COV plug preventing its useas a preheater; instead, the high pressure line was heatedelectrically.
The pressure traces are shown in Fig. 11(a). Ignition is usuallyidentified by heat release, specifically the initial spike on the rateof heat release (RoHR) curve. To accurately calculate the heat re-lease of an IDI engine both the prechamber and main chamberpressures must be measured. Though heat release can be calcu-lated with only one or the other pressure, the calculation can haveas large as a 25% error, especially during early combustion [37].Due to the availability of only the prechamber pressure, heat re-lease was not calculated. Instead, ignition was approximately iden-tified by the rapid change in pressure per change in crank angle(DP=DCA ). From Fig. 11(b) ignition can be identified for each of
.15
0.2
.25
0.3Diesel
WVO
WVO w/mod
0
.05
0.1
-12 -10 -8 -6 -4
Crank Angle Degrees(b) Pre-combustion Chamber Change in Pressure per change in Crank Angle
chamber pressure.

2934 M. Basinger et al. / Fuel 89 (2010) 2925–2938
the three cases. For the purpose of this study the ignition point wasspecifically defined as the point where the DP=DCA exceeded 0.15for 2 crank angle degrees.
The summarized ignition points, peak pressure values, and peakpressure points are shown in Fig. 12. The ignition point and peakpressure point of diesel and WVO are nearly identical, thoughthe peak pressure value of WVO is lower. The modified WVO caseshowed a slightly earlier ignition which resulted in an earlier peakpressure point, and higher peak pressure value. Lower viscosityfrom preheating, advanced injector timing, and increased IVOPare likely all contributing factors to this enhancement to the igni-tion quality.
4
6
8
10
ºBT
DC
, ºT
TD
C, M
Pa
Diesel
WVO
WVO w/mod
0
2
4
Ignition point
(ºBTDC)Peak Pressure Point
(ºATDC)Peak Pressure
(MPa)
Fig. 12. Pre-combustion pressure test summary.
300
350
400
450
Exh
aust
Tem
pera
ture
(C)
Diesel
WVO
WVO w/mod
150
200
250
Engine Load (%)
0% 25% 50% 75% 100 %
15%
20%
Bra
ke F
uel C
onve
rsio
n E
ff.
Diesel
WVO
5%
10%
Engine Load (%)
WVO
WVO w/mod
0% 25% 50% 75% 100 %
(a) (
(c) (
Fig. 13. Multi-load perfo
5.3. Multi-load comparison
From the IVOP-timing maps and pre-combustion traces it wasfound that an appropriate modification kit would include:
� a COV plug preheater (injector temperature �90 �C)� advanced injection timing (25� BTDC)� increased IVOP (15 MPa)
This modification kit was then tested across 10–90% engineloading, a range assumed to be typical of in-field use. These resultsfrom the modified case where then compared to diesel and WVOwithout the modification kit. The diesel and WVO were run understock conditions – no injector preheating, injector timing of 20�BTDC, and an IVOP of 9 MPa. Data were taken for each of the threetest cases only after bringing the engine to ‘‘steady state” condi-tions at 650 RPM at each of the five loads tested. Data for each caseand for each load were then averaged across a 1 h ‘‘steady state”window. These results are detailed in Fig. 13.
The engine performance from the modification kit is favorable.However, this type of a short-run test does not illuminate longevitybased wear issues that may occur from the WVO without modifi-cation case. In the short term, the modification kit performed sim-ilarly to, though slightly better than the unmodified case, anddiesel performed best of all.
Fig. 13(a) shows the measured exhaust temperature. Across allloads: the WVO case was the highest, the WVO case with modifi-cation kit was slightly lower, and the diesel case was lower still.As mentioned in the above injection tuning section, the exhausttemperature is likely indicative of the completeness of combustion.The WVO at stock timing, IVOP, and temperature is not combustingas completely as the WVO with the modification kit. Diesel likely
600
800
1000
1200
Syst
em B
SFC
(g/
kWH
) Diesel
WVO
WVO w/mod
0
200
400
0% 25% 50% 75% 100 %
Engine Load (%)
0.4
0.5
0.6
Equ
ival
ence
Rat
io (
Diesel
WVO
WVO w/mod
0.2
0.3
0.4
0% 25% 50% 75% 100 %
Equ
ival
ence
Rat
io (
Engine Load (%)
)
b)
d)
rmance comparison.

M. Basinger et al. / Fuel 89 (2010) 2925–2938 2935
had the lowest temperature because it is a lighter fuel than WVO.The heavier (less evaporate) WVO molecules continued to burnlate into the cycle, resulting in a higher temperature than the die-sel. Averaged across all loads, the modified WVO case had an ex-haust temperature almost 4.5% higher than the diesel, but about0.5% lower than the unmodified WVO.
Fig. 13(b) shows a similar trend in the System BSFC. The dieselcase performed noticeably better than either WVO case. Averagedacross all loads, the modified WVO case had an BSFC about 15%higher than the diesel, but 3% lower than the unmodified WVO.It’s important to note that at a calorific value of 45.8 MJ/kg versusWVO’s 39.4 MJ/kg, diesel has a strong energy density advantage.The efficiency measurement shown in Fig. 13 (c) accounts for thisdifference in heating values. Averaged across all tested loads, themodified WVO case has a 3.3% gain in efficiency compared to the
6
8
10
12
Opa
city
(%)
Diesel
WVO
WVO w/mod
0
2
4
0% 25% 50% 75% 100%
Engine Load (%)
Fig. 14. Multi-load opacity comparison.
308
408
508
608
708
808
CO
(ppm
)
Diesel
WVO
WVO w/mod
8
108
208
308
Engine Load (%)0% 25% 50% 75% 100 %
60
80
100
120
UH
C (p
pm)
Diesel
0
20
40
Engine Load (%)
Diesel
WVO
WVO w/mod
0% 25% 50% 75% 100 %
(a) (
((c)
Fig. 15. Multi-load emi
unmodified WVO case, and a 1% gain compared to the diesel. Thissame type of trend in BSFC and efficiency was also found by Nwa-for et al. and Bari et al. [43,27].
The equivalence ratios for each of the three cases in Fig. 13(d)are nearly indistinguishable from one another, though at highloads the unmodified WVO case does have slightly poorer values.Averaged across all loads, the modified WVO case was about 1%lower than the unmodified WVO, and about 1% higher than the die-sel. Bari et al. also found the air to fuel ratio to decrease signifi-cantly between diesel and WVO, and to decrease slightly morewhen timing was advanced for the WVO case [27]. The same typeof trend was found in this study between the two WVO cases, espe-cially at higher loads. Though the equivalence ratio was not as low.
For each of the three cases the opacity was measured and is de-tailed in Fig. 14. The low levels measured do not present a strongcontrast between the three cases, though an interesting phenome-non occurred as engine loading increased: at lower engine loadsthe diesel exhaust was less opaque but at higher loads the modifiedWVO performed best. Across all engine loads the unmodified WVOhad the most opaque exhaust. This higher opacity level of the WVOwithout modification seems to follow from its relatively poorerequivalence ratio. The likely explanation of the lower opacity ofthe exhaust from WVO in the modified engine operation at highload when compared to a diesel operated engine is that at lowloads the lighter molecular weight of the diesel results in a spraythat atomizes to smaller droplet sizes, which burn more com-pletely. But as loading increases, the role of the increased IVOP be-comes more important. The likely reduction in droplet size and theimproved mixing from the increased IVOP are keeping the equiva-lence ratio lower then the diesel case and thus the opacity isslightly lower. There is more air to oxidize the fuel, resulting in lesssoot formation.
The measured emissions for each case are compared in Fig. 15.As indicated by the lower CO, UHC, SO2, and the higher NOx levels,
600
800
1000
1200
NO
x (p
pm)
Diesel
WVO
WVO w/mod
0
200
400
0% 25% 50% 75% 100 %
Engine Load (%)
30
40
50
60
SO2
(ppm
)
Diesel
WVO
WVO w/mod
0
10
20
0% 25% 50% 75% 100 %
Engine Load (%)
b)
d)
ssions comparison.

2936 M. Basinger et al. / Fuel 89 (2010) 2925–2938
the diesel seems to have the best combustion characteristics.Unmodified WVO generally emits more CO and SO2, though themodified WVO case did tend to have slightly higher UHC and lowerNOx.
The CO results for the unmodified WVO and diesel cases shownin Fig. 15(a) resembled the trend found by Bari et al. [27]. At allloads diesel CO is the lowest. At low loads unmodified WVO wasrelatively flat, then at mid load the CO began to increase. The mod-ified WVO case was in between the diesel and unmodified case;specifically, when averaged across all loads, the modified WVOcase had carbon monoxide concentration almost 84% higher thanthe diesel, but about 30% lower than the unmodified WVO. Thisis likely because the modification improves mixing and evapora-tion, but the heavier WVO molecules with their slower evaporationrate still do not burn as completely as the diesel.
When comparing the opacity values to the CO values of theunmodified WVO case and diesel case at high loads, it appears thatthe increased availability of oxidant from improved mixing and thelower droplet size (due to the increased IVOP) is enough to reducethe soot, but not enough to also lower the CO below the diesel le-vel. The increased IVOP is definitely impactful, but the WVO is stillmolecularly heavier than diesel.
The NOx values in Fig. 15(b) show the diesel to have the highestvalues across all loads, while both WVO cases are nearly identical.When averaged across all loads, the modified WVO case had a NOx
concentration almost 31% lower than the diesel, but about 2% high-er than the unmodified WVO. Like the CO, this points to a morecomplete combustion in the diesel case, which in turn provideshotter temperatures for greater thermal NOx generation.
The UHC values in Fig. 15(c) also show the diesel to have thebest emissions, though at low loads the three cases are very simi-lar. At medium loads the modified WVO case is higher than theunmodified case by nearly 7%. This might be due to increased wallimpingement from the higher IVOP in the modified case. Further-more, at high loads the two WVO cases are indistinguishable.
The SO2 values in Fig. 15(d) are generally noisy, very low, andsimilar across all cases and all loads. At the lowest loading (10%)the unmodified WVO case is considerably higher than the other
Table A.1Physical and fuel properties of several plant oils and diesel.
Diesel Soybean Rapeseed Peanut
Yield (L/ha Yr) – 450–480 590–1200 850–1100Viscosity (cSt)a 2.6–
3.633 37–42 40
Density (kg/m3) 820–845
914–924 912–920 888–902
Calorific value(MJ/kg)
43–46 36.9–39.6 36.8–39.7 39.5–39.8
Cetane number 45–56 36–38 38–41 35–42Reference [50–
54][50,12,55–57,10,54,58]
[12,55,56,58,5,57,10,54] [12,55,56,
a Viscosity of diesel, palm, jatropha, and WVO measured at 40 �C; all others measured
Table A.2Chemical composition of several plant oils and diesel.
Element Diesel Soybean Rapeseed
C 80.33–86 76.2–77.1 77.9–78H 12.36–14.8 11.6–12.9 10–13.2O 1.19 10–10.4 8.9–12S 0.1–0.25 0.01 0.0012–0.01N 1.76 1.9 –C residue 0.1–0.14 0.24–0.27 0.3–0.31Ash 0.01 0.006–0.01 0.01–0.54Reference [61,5,53,54] [55,58,63,54] [55,58,64,5]
two cases. This may be due to the relationship sulfur oxide haswith PM as discussed earlier. At this low loading the opacity waslow, which may indicate that the sulfur oxides had less soot to at-tach to, and thus showed up more readily as SO2. To really under-stand what is happening to the sulfur a more comprehensivetreatment is necessary, especially with regard to the PM. Insteadof a simple opacity measurement, gravimetric PM measurementswould be valuable, as well as further analysis of the VOF, SO3,SO2, etc. Such an exercise is left for future studies.
6. Conclusions
Plant oils have potential as a fuel source for stationary enginesused for agricultural processing in remote developing communitycontexts. The role that different SVO physical and chemical proper-ties have on combustion has been discussed. Similarly, engine de-sign differences and modifications applicable to SVO fueling havebeen described.
An experimental investigation was carried out involving the de-sign of a unique preheating modification for an IDI engine commonin developing countries, raising the fuel temperature at the injectorto 90 �C. This type of an increase in temperature for a vegetable oil,decreases the viscosity to a comparable value of diesel at roomtemperature. To create the passive preheating modification, achannel was machined through a legacy engine component, theCOV plug. To obtain the 90� temperature across all engine loads,a heat transfer model was employed utilizing empirical correla-tions. The model allowed for identification of the appropriate geo-metric dimensions of the channel in the COV plug.
The engine was also tuned to an increased IVOP and advancedtiming appropriate to the combustion characteristics of preheatedSVOs. It was found that 25� BTDC with an IVOP of 15 MPa was idealfor the specific engine when fueled on waste vegetable oil. Exper-iments were carried out that showed improved performance andemission characteristics from the utilization of this three partmodification kit. These improvements included 14% lower exhausttemperatures, 9% lower brake specific fuel consumption, 10% lower
Palm Jatropha WVO
2800–6000 740–1590 –39 34–37 36
860–910 860–933 910–940
36.5–40.1 37.8–42.1 39.2–39.6
42–49 38–45 36–3758,59,57,10,54] [12,31,51,56,53,57,10] [60,61,12,13,56,57,62,10] Original
data
at 38 �C.
Peanut Palm Jatropha WVO
70–76.55 50.27 76.11–76.56 76.50–77.7811.97 7.07 10.52–13.19 11.55–12.0711.48 36.28 11.06 11.1–11.570.01 0.4–0.63 – 0.02–0.03– 0.42 0.34 0.02–0.030.22–0.24 0.22–0.24 0.7–0.9 –0.005–0.02 5.33 0.03–0.036 –[55,58,64] [53,65] [60,61,13] Original data

Table A.3Lipid profile of several plant oils.
Plant oil
Lipids Soybean Rapeseed Peanut Palm Jatropha WVO
Lauric (C12:0) – – – 0–1.15 5.9 0.02–0.04Myristic (C14:0) – – 0.1 0.5–2.74 0.1–2.7 0.14–0.25Palmitic (C16:0) 11.3–13.9 3.49–3.5 8–11.34 26.18–47.5 14.1–15.3 6.74–12.4Palmitoleic (C16:1) 0.1–0.3 – – 0.1–1.66 1.3 0.47–1.0Stearic (C18:0) 2.1–3.6 0.85–1.6 1.8–2.4 3.5–11.97 3.7–9.8 2.79–4.47Oleic (C18:1) 23.2–24.9 33–64.4 48.28–53.3 35.49–46.1 21.8–45.8 31.50–58.2Linoleic (C18:2) 53–56.2 20.4–22.3 28.4–32 6.5–12.76 29–47.4 21.2–42.20Linolenic (C18:3) 4.3–6.31 7.9–8.23 0.3–0.93 0–2.25 0.3 5.85–7.4Arachidic (C20:0) 0.3 – 0.9–1.32 0.4–1.74 0.3 0.39–0.62Gadoleic (C20:1) 0.3 9.3 2.4 0.2–2.56 – –Behenic (C22:0) – – 2.52-3 – 0.2 0.34–0.35Erucic (C22:1) 0.3 23 – 0-1.49 – 0.06–0.08Lignoceric (C24:0) 0.1 – 1.23–1.8 0.1 – 0.07–0.09Iodine value 69.82–152 81–120 80–119.55 44–65.5 92–112 107–115Reference [55,58,19,9,66] [55,58,19,9,66] [67,55,58,19,66] [67,19,9,66] [60,68,69] Original data
M. Basinger et al. / Fuel 89 (2010) 2925–2938 2937
equivalence ratio, 2% increased brake fuel conversion efficiency, 5%lower opacity, and 63% lower carbon monoxide.
Acknowledgments
This project was supported by the Gates Foundation, DarrenManelski, and the Three Loaves Fund. This support is gratefullyacknowledged. The authors would like to thank Kulite Semicon-ductor Products Inc. for the use of their pressure transducer, andAdam Hurst for his assistance. The assistance received from MarcoCastaldi, Alissa Park, and Will Northrop is also gratefully acknowl-edged. Additionally the support, guidance, and expert advice pro-vided by George Breckenridge is recognized, without which thisresearch would not have been possible.
Appendix A. Selected properties of several plant oils and diesel
See Tables A.1–A.3.
References
[1] Vasudevan P, Sharma S, Kumar A. Liquid fuel from biomass: an overview. J SciInd Resh 2005;64(11):822–31.
[2] United States Department of Energy. Annual energy report; 2008.[3] Pimentel D, Marklein A, Toth MA, Karpoff MN, Paul GS, Mccormack R, et al.
Food versus biofuels: environmental and economic costs. Hum Ecol2009;37(1):1–12.
[4] Modi V. Energy services for the poor. Technical report, Millennium Project TaskForce 1; 2004.
[5] Hemmerlein N, Korte V, Richter H, Schroder G. Performance exhaust emissionsand durability of modern diesel engines running on rapeseed oil. SAE paper910848; 1991
[6] Ryan TW, Dodge LG, Callahan TJ. The effects of vegetable oil properties oninjection and combustion in two different diesel engines. J Am Oil Chem1984;61(10):1610–9.
[7] Hui Y, editor. Bailey’s industrial oil & fat products. 5th ed.. New York: Wiley;1996.
[8] Graboski MS, McCormick RL. Combustion of fat and vegetable oil derived fuelsin diesel engines. Prog Energ Combust Sci 1998;24(2):125–64.
[9] Nettles-Anders SL, Olsen DB. Survey of straight vegetable oil compositionimpact on combustion properties. SAE paper 2009-01-0487; 2009.
[10] Modi V, McDade S, Lallement D, Saghir J. Energy services for the millenniumdevelopment goals. Technical report, UNDP; 2005.
[11] Ramadhas AS, Jayaraj S, Muraleedharan C. Use of vegetable oils as i.c. enginefuels – a review. Renew Energy 2004;29(5):727–42.
[12] Babu A, Devaradjane G. Vegetable oils and their derivatives as fuels for ciengines: an overview. SAE paper 2003-01-0767; 2003.
[13] Gangwar HK, Agarwal AK. Emission and combustion characteristics ofvegetable oil (Jatropha curcus) blends in an indirect ignition transportationengine. SAE paper 2008-280034; 2008.
[14] Rakopoulos C, Antonopoulos K, Rakopoulos D, Hountalas D, Giakoumis E.Comparative performance and emissions study of a direct injection dieselengine using blends of diesel fuel with vegetable oils or bio-diesels of variousorigins. Energy Convers Manage 2006;47(18–19):3272–87.
[15] Schumacher L. Biodiesel lubricity. Technical report, University of Idaho; 2003.
[16] Korus R, Jo J, Peterson C. A rapid engine test to measure injector fouling indiesel engines using vegetable oil fuels. J Am Oil Chem Soc1985;62(11):1563–4.
[17] Schonborn A, Ladommatos N, Allan R, Williams J, Rogerson J. Effect of themolecular structure of individual fatty acid alcohol esters (biodiesel) on theformation of NOx and particulate matter in the diesel combustion process. SAEpaper 2008-01-1578; 2008.
[18] Ryan TWI, Bagby MO. Identification of chemical changes occurring during thetransient injection of selected vegetable oils. SAE paper 930933; 1993
[19] Knothe G. Structure indices in fa chemistry. How relevant is the iodine value? JAm Oil Chem Soc 2002;79(9):847–54.
[20] Mondal P, Basu M, Balasubramanian N. Direct use of vegetable oil and animalfat as alternative fuel in internal combustion engine. Biofuels BioproductsBiorefining-Biofpr 2008;2(2):155–74.
[21] Peterson C, Jones S. Using unmodified vegetable oils as a diesel fuel extender aliterature review. Technical report, University of Idaho; 2002.
[22] Hossain PADAK. Plant oils as fuels for compression ignition engines: atechnical review and life-cycle analysis. Renew Energy 2010;35:1–13.
[23] Vojtisek-Lom M, Blazek J, Dufek M, Fenkl M. Investigation of combustion ratesand injection and ignition onset of heated rapeseed oil in direct-injectionturbodiesel engines. Technical report 2009-01-1914, SAE; 2009.
[24] Engler C, Johnson L, Lepori W, Yarbrough C. Effects of processing and chemicalcharacteristics of plant oils on performance of an indirect-injection dieselengine. J Am Oil Chem Soc 1983;60(8):1592–6.
[25] Suda KJ. Vegetable oil or diesel fuel-a flexible option. Technical report 840004,SAE International Engine Study; 1984.
[26] Bari S, Yu C, Lim T. Filter clogging power loss issues while running a dieselengine with waste cooking oil. Proc Inst Mech Eng Part D, J Automobile Eng2002;216(12):993–1001.
[27] Bari S, Yu CW, Lim TH. Effect of fuel injection timing with waste cooking oil asa fuel in a direct injection diesel engine. Proc Inst Mech Eng Part D – JAutomobile Eng 2004;218(D1):93–104.
[28] Pugazhvadivu M, Jeyachandran K. Investigations on the performance andexhaust emissions of a diesel engine using preheated waste frying oil as fuel.Renew Energy 2005;30(14):2189–202.
[29] Nwafor OMI. The effect of elevated fuel inlet temperature on performance ofdiesel engine running on neat vegetable oil at constant speed conditions.Renew Energy 2003;28(2):171–81.
[30] Dweck J, Sampaio C. Analysis of the thermal decomposition of commercialvegetable oils in air by simultaneous tg/dta. J Therm Anal Calorim2004;75(2):385–91.
[31] Bari S, Lim TH, Yu CW. Effects of preheating of crude palm oil (cpo) on injectionsystem, performance and emission of a diesel engine. Renew Energy2002;27(3):339–51.
[32] Celikten I. An experimental investigation of the effect of the injection pressureon engine performance and exhaust emission in indirect injection dieselengines. Applied Thermal Engineering 2003;23(16):2051–60.
[33] Cao Z-M, Nishino K, Mizuno S, Torii K. Piv measurement of internal structure ofdiesel fuel spray. Experiments in fluids 2000;29(7):S211–9.
[34] Enoki K, Hayashi S, Sawa N. Effective utilization of blended plant fuels forpre-combustion chamber compression ignition engines. SAE paper 940330;1994.
[35] Su T, Chang C, Reitz R, Farrell P, Pierpont A, Tow T. Effects of injection pressureand nozzle geometry on spray smd and d.i. emissions. SAE paper 952360;1995.
[36] Varde K, Popa D, Varde L. A study of diesel spray characteristics at highinjection. Technical report, U.S. Dept. of Transportation, Office of the Secretaryof Transportation; 1985.
[37] Heywood JB. Internal combustion engine fundamentals. New York: McGraw-Hill Book Company; 1988.
[38] Openshaw K. A review of Jatropha curcas: an oil plant of unfulfilled promise.Biomass Bioenergy 2000;19(1):1–15.
2938 M. Basinger et al. / Fuel 89 (2010) 2925–2938
[39] Lee CS, Park SW, Kwon SI. An experimental study on the atomization andcombustion characteristics of biodiesel-blended fuels. Energy Fuels2005;19(5):2201–8.
[40] Murayama T, Oh Y-t, Miyamoto N, Chikahisa T, Takagi N, Itow K. Low carbonflower buildup, low smoke, and effcient diesel operation with vegetable oils byconverstion to monoesters and blending with diesel oil or alcohols. SAE paper841161; 1984.
[41] Puhan S, Jegan R, Balasubbramanian K, Nagarajan G. Effect of injectionpressure on performance, emission and combustion characteristics of highlinolenic linseed oil methyl ester in a di diesel engine. Renew Energy2009;34(5):1227–33.
[42] Haldar S, Ghosh B, Nag A. Studies on the comparison of performance andemission characteristics of a diesel engine using three degummed non-ediblevegetable oils. Biomass Bioenergy 2009;33(8):1013–8.
[43] Nwafor OMI, Rice G, Ogbonna AI. Effect of advanced injection timing on theperformance of rapeseed oil in diesel engines. Renew Energy 2000;21(3–4):433–44.
[44] SAE International, Measurement of intake air or exhaust gas flow of dieselengines. SAE International Standard J244; 1992.
[45] R.A. Lister & Co., Ltd., Dursley, Gloucestershire, England, Instruction Book andSpare Parts List.
[46] Gebhart B, Jaluria Y, Mahajan RJ, Sammakia B, editors. Buoyancy-induced flowsand transport. New York: Hemisphere Publishing Company; 1988.
[47] Rohsenow WM, Hartnett JP, Ganic EN, editors. Handbook of heat transferfundamentals. New York: McGraw-Hill Book Company; 1985.
[48] Patterson DJ, Henein NA. Emissions from combustion engines and theircontrol. Ann Arbor: Ann Arbor Science Publishers Inc.; 1972.
[49] Corro G. Sulfur impact on diesel emission control – a review. React KineticsCatal Lett 2002;75(1):89–106.
[50] Alptekin E, Canakci M. Characterization of the key fuel properties of methylester–diesel fuel blends. Fuel 2009;88(1):75–80.
[51] de Almeida SCA, Belchior CR, Nascimento MVG, Vieira L d SR, Fleury G.Performance of a diesel generator fuelled with palm oil. Fuel 2002;81(16):2097–102.
[52] Clevenger MD, Bagby MO, Goering CE, Schwab AW, Savage LD. Developing anaccelerated test of coking tendencies of alternative fuels. Trans ASAE1988;31(4):1054–8.
[53] Kalam MA, Masjuki HH. Emissions and deposit characteristics of a small dieselengine when operated on preheated crude palm oil. Biomass Bioenergy2004;27(3):289–97.
[54] Masjuki H. A rapid test to measure performance, emission and wear of a dieselengine fueled with palm oil diesel. J Am Oil Chem Soc 1993;70:1021–5.
[55] Demirbas A. Chemical and fuel properties of seventeen vegetable oils. EnergySources 2003;25(7):721–8.
[56] Girard P, Fallot A. Review of existing and emerging technologies for theproduction of biofuels in developing countries. Energy Sustain Dev2006;10(2):92–108.
[57] Korbitz W. Worldwide trends in production and marketing of biodiesel.Austrian Biofuels Institute; May 2000.
[58] Goering C, Schwab A, Daugherty M, Pryde E, Keakin A. Fuel properties of elevenvegetable oils. American Society of Agricultural Engineers CONF-811221;1982.
[59] Altin R, Cetinkaya S, Yucesu HS. The potential of using vegetable oil fuels asfuel for diesel engines. Energy Convers Manage 2001;42(5):529–38.
[60] Achten W, Verchot L, Franken Y, Mathijs E, Singh V, Aerts R, et al. Jatrophabiodiesel production and use. Biomass Bioenergy 2008;32(12):1063–84.
[61] Agarwal D, Agarwal AK. Performance and emissions characteristics of jatrophaoil (preheated and blends) in a direct injection compression ignition engine.Appl Therm Eng 2007;27(13):2314–23.
[62] Rabe ELM. Jatropha oil in compression ignition engines. Ph.D. Thesis.Eindhoven University of Technology; 2007.
[63] Ngo T-A, Kim J, Kim SK, Kim S-S. Pyrolysis of soybean oil with H-ZSM5 (Proton-exchange of Zeolite Socony Mobil #5) and MCM41 (Mobil Composition ofMatter No. 1) catalysts in a fixed-bed reactor. Energy 2010;35(6):2723–8.
[64] Kaya C, Hamamci C, Baysal A, Akba O, Erdogan S, Saydut A. Methyl ester ofpeanut (Arachis hypogea l.) seed oil as a potential feedstock for biodieselproduction. Renew Energy 2009;34(5):1257–60.
[65] Bagby MO. Vegetable oils for diesel fuel: opportunities for development.Technical report 87-1588, American Society of Agricultural Engineers; 1987.
[66] Ogawa T, Okada M. Influence of properties and composition of diesel fuels onparticle emissions. Technical report, R&D Review of Toyota CRDL; November2003.
[67] Abollé A, Kouakou L, Planche H. The viscosity of diesel oil and mixtures withstraight vegetable oils: palm, cabbage palm, cotton, groundnut, copra andsunflower. Biomass Bioenergy 2009;33(9):1116–21.
[68] de Oliveira JS, Leite PM, de Souza LB, Mello VM, Silva EC, Rubim JC, et al.Characteristics and composition of Jatropha gossypiifoliaand Jatropha curcas l.oils and application for biodiesel production. Biomass Bioenergy2009;33(3):449–53.
[69] Senthil Kumar M, Ramesh A, Nagalingam B. An experimental comparison ofmethods to use methanol and jatropha oil in a compression ignition engine.Biomass Bioenergy 2003;25(3):309–18.


![Homogeneous Charge Compression Ignition (HCCI ... emissions in a highly competitive era [1, 2]. Compression Ignition (CI) and Spark Ignition (SI) combustion are two primary technologies](https://img.pdfslide.us/doc/110x75/5aca15977f8b9a5d718deb8b/homogeneous-charge-compression-ignition-hcci-emissions-in-a-highly-competitive.jpg)