Embed Size (px)
Citation preview

Aron J. Hall, DVM, MSPH, DACVPM
CDC Viral Gastroenteritis Team
Presented at the 8th Annual OutbreakNet Conference, Atlanta, GA
August 30, 2011
Comprehensive Surveillance for Acute Gastroenteritis Outbreaks
through NORS
National Center for Immunization & Respiratory Diseases
Division of Viral Diseases

Background
• Acute gastroenteritis (AGE) outbreaks represent a substantial public health burden in the United States
• NORS launched in 2009 to enhance and expand upon previous surveillance systems–Foodborne Disease Outbreak Surveillance System (FDOSS)–Waterborne Disease and Outbreak Surveillance System
(WBDOSS)
• NORS is a web-based system for local, state, and territorial health departments to report outbreaks of:–Waterborne disease–Foodborne disease–AGE due to person-to-person transmission, animal contact,
environmental contamination, and other/unknown modes

Uses of NORS Data
• Assess the national burden and temporal trends of AGE outbreaks
• Identify priority settings and populations for interventions
• Characterize AGE outbreaks, e.g.:– Etiology
– Setting
– Mode of transmission
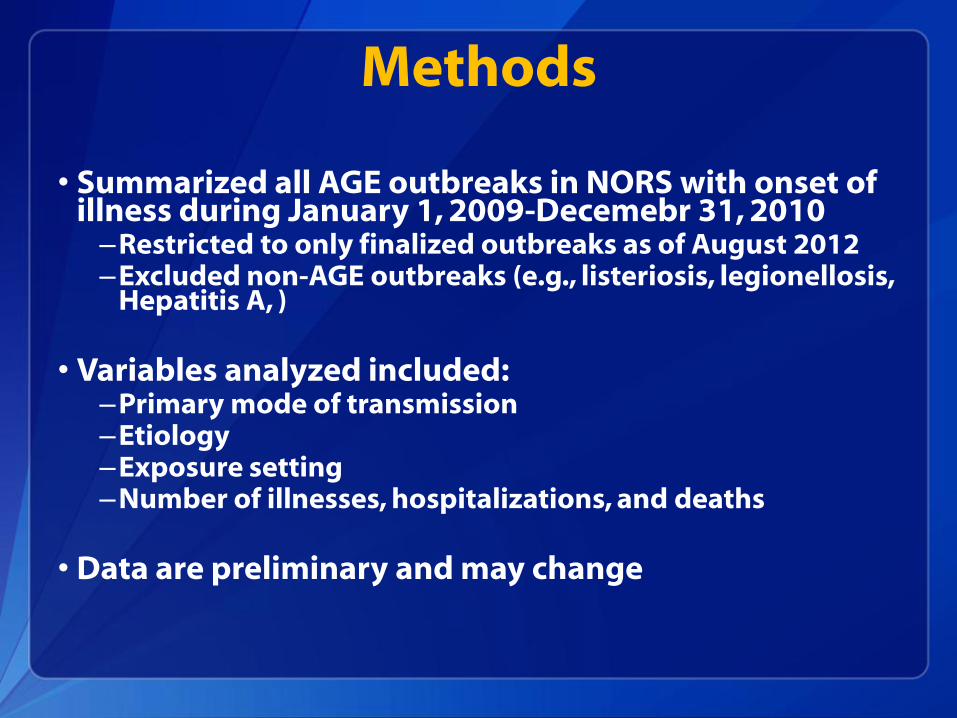
Methods
• Summarized all AGE outbreaks in NORS with onset of illness during January 1, 2009-Decemebr 31, 2010–Restricted to only finalized outbreaks as of August 2012–Excluded non-AGE outbreaks (e.g., listeriosis, legionellosis,
Hepatitis A, )
• Variables analyzed included:–Primary mode of transmission–Etiology–Exposure setting–Number of illnesses, hospitalizations, and deaths
• Data are preliminary and may change

Number of AGE Outbreaks, Associated-
Illnesses, Hospitalizations, and Deaths
Reported to NORS, 2009-2010
Transmission
ModeOutbreaks (%) Illnesses (%)
Hospitalizations
(%)Deaths (%)
Person-to-person 2,275 (51) 81,789 (67) 1,376 (43) 140 (81)
Foodborne 1,641 (36) 29,164 (24) 1,394 (44) 17 (10)
Animal Contact 61 (1) 913 (1) 98 (3) 0 (0)
Waterborne 39 (1) 1,229 (1) 63 (2) 1 (1)
Environmental 9 (0.2) 314 (0.3) 12 (0.4) 0 (0)
Unknown 471 (10) 8,194 (7) 246 (8) 14 (8)
Total 4,496 (100) 121,603 (100) 3,189 (100) 172 (100)

No Reports <2.4 2.4-7.0 7.1-13.5 >13.5
73
43
8
7
52
9
43
116
337
78
98
11
296
36
103
58
11
173
41
97
27
64
83
33
43
3298
2
36
156
289
22
131
319
31
8
298
39
111
22
114
30
97
40
119
13
28
11
Number and Rate (per million person-years) of
AGE Outbreaks Reported to NORS by State,
2009-2010
216

AGE Outbreaks Reported to NORS by
Month and Transmission Mode, 2009-2010
0
50
100
150
200
250
300
350
400
450
1 2 3 4 5 6 7 8 9 10 11 12 1 2 3 4 5 6 7 8 9 10 11 12
2009 2010
No
. Ou
tbre
aks
First Illness Onset
Person
Food
Animal
Water
Environment
Unknown

Etiology of AGE Outbreaks, Associated-
Illnesses, Hospitalizations, and Deaths
Reported to NORS, 2009-2010
65%15%
5%4%
11%
Norovirus Salmonella E. coli Shigella Other
79%
9%
2% 2%8%
41%
36%
13%
4%6%
84%
7%5%1% 3%
Outbreaks Illnesses Hospitalizations Deaths
Note: Restricted to single etiology outbreaks (N=2,933)
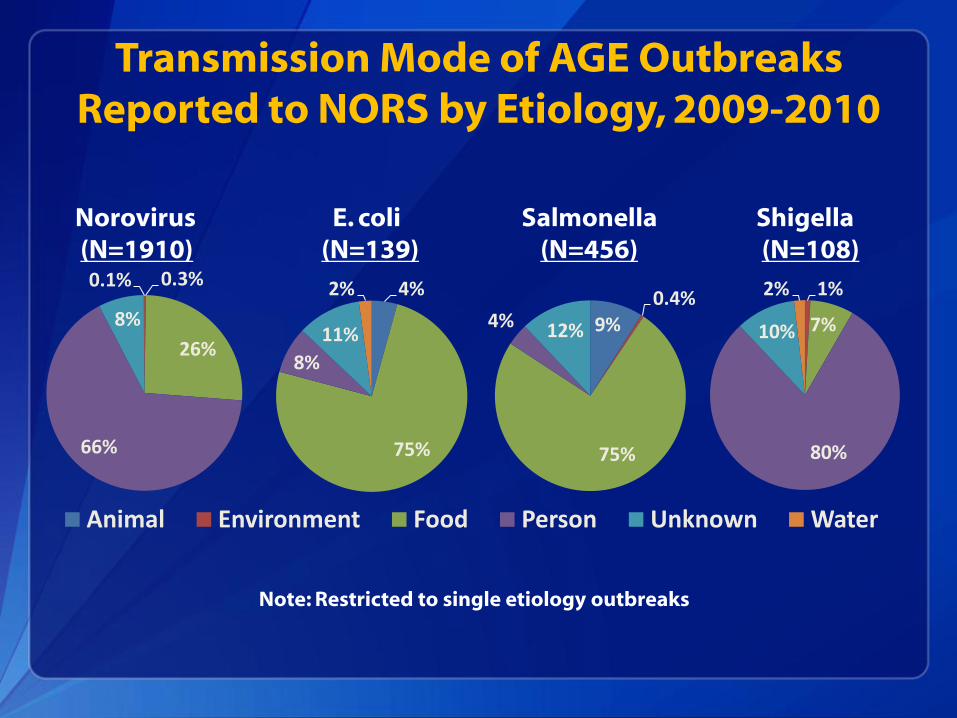
0.3%
26%
66%
8%
0.1%
Animal Environment Food Person Unknown Water
Transmission Mode of AGE Outbreaks
Reported to NORS by Etiology, 2009-2010
Norovirus E. coli Salmonella Shigella
(N=1910) (N=139) (N=456) (N=108)
Note: Restricted to single etiology outbreaks
4%
75%
8%
11%
2%
9%0.4%
75%
4% 12%
1%
7%
80%
10%
2%

Setting of Exposure in AGE Outbreaks
Reported to NORS, 2009-2010
Note: Restricted to outbreaks with setting of exposure reported (N=3,245)
Long-term care facility
44%
Restaurant and banquet facility
22%
Private home10%
School and daycare
9%
Other15%

Limitations
• Passive reporting system subject to underreporting and competing priorities, leading to variability–Between reporting sites
–Among different outbreak types
• Variable uptake during first two years of NORS, thus data may not be generalizable across all sites
• Water data has not yet been formally closed out and should be considered preliminary
• NORS is a dynamic surveillance system and data may be modified at any time

Conclusions
• Norovirus is the leading cause of AGE outbreaks in the United States
– Also the leading cause of outbreak-associated hospitalizations and deaths
– Salmonella, E. coli, and Shigella are other important contributors
• Building upon its predecessors, NORS highlights the public health significance of AGE outbreaks not transmitted through food or water
• NORS represents the first comprehensive national system for AGE outbreak surveillance and provides valuable epidemiologic insights
– Role of different transmission routes for key AGE pathogens
– Identify priority settings most impacted

Ongoing and Planned NORS
Improvements• Improved data accessibility (Full Download)
– Data downloaded by state and local users in a variety of file formats and database structures
– Data from each transmission mode accessed more readily across CDC management teams
• Direct data upload from existing databases (NORS Direct)– Eliminate double entry by state epidemiologists
– Improve system acceptability and reporting rates
• Extensive user interface changes (NORS 2.0)
• Direct integration with CaliciNet to enable real-time data exchange on norovirus outbreaks

Acknowledgments
• NORS P2P– Mary Wikswo
• NORS Food– Karunya Manikonda
– Karen Herman
– Amie Nisler
– Kelly Walsh
– Elisabeth Mungai
– Shacara Johnson
– Hannah Gould
• State, Local, and Territorials Health Departments
• NORS Water– Virginia Roberts
– Jonathan Yoder
• NORS IT– Rickey Zachary
– Franky Maslim
– Jason Price
– Don Wade

EXTRA SLIDES

Top 5 Etiologies of AGE Outbreaks
Reported to NORS, 2009-2010
Outbreaks Illnesses Hospitalizations Deaths
1. Norovirus 65% Norovirus 79% Norovirus 41% Norovirus 84%
2. Salmonella 16% Salmonella 9% Salmonella 36% E. coli 7%
3. E. coli 5% C. perfringens 4% E. coli 13% Salmonella 5%
4. Shigella 4% Shigella 2% Shigella 4% C. perfringens 2%
5. Campylobacter 2% E. coli 2% Campylobacter 2% Shigella 1%
91% 96% 96% 99%
Note: Restricted to single etiology outbreaks (N=2,933)