Embed Size (px)
Citation preview
This article was downloaded by: [University of Utah]On: 02 May 2013, At: 15:31Publisher: Taylor & FrancisInforma Ltd Registered in England and Wales Registered Number: 1072954 Registeredoffice: Mortimer House, 37-41 Mortimer Street, London W1T 3JH, UK
Journal of Statistical Computation andSimulationPublication details, including instructions for authors andsubscription information:http://www.tandfonline.com/loi/gscs20
Comprehensive study of tests fornormality and symmetry: extending theSpiegelhalter testPatrick J. Farrell a & Katrina Rogers-Stewart aa School of Mathematics and Statistics, Carleton University, 1125Colonel By Drive, Ottawa, Ontario, K1S 5B6, CanadaPublished online: 16 Aug 2006.
To cite this article: Patrick J. Farrell & Katrina Rogers-Stewart (2006): Comprehensive studyof tests for normality and symmetry: extending the Spiegelhalter test, Journal of StatisticalComputation and Simulation, 76:9, 803-816
To link to this article: http://dx.doi.org/10.1080/10629360500109023
PLEASE SCROLL DOWN FOR ARTICLE
Full terms and conditions of use: http://www.tandfonline.com/page/terms-and-conditions
This article may be used for research, teaching, and private study purposes. Anysubstantial or systematic reproduction, redistribution, reselling, loan, sub-licensing,systematic supply, or distribution in any form to anyone is expressly forbidden.
The publisher does not give any warranty express or implied or make any representationthat the contents will be complete or accurate or up to date. The accuracy of anyinstructions, formulae, and drug doses should be independently verified with primarysources. The publisher shall not be liable for any loss, actions, claims, proceedings,demand, or costs or damages whatsoever or howsoever caused arising directly orindirectly in connection with or arising out of the use of this material.

Journal of Statistical Computation and SimulationVol. 76, No. 9, September 2006, 803–816
Comprehensive study of tests for normality and symmetry:extending the Spiegelhalter test
PATRICK J. FARRELL* and KATRINA ROGERS-STEWART
School of Mathematics and Statistics, Carleton University, 1125 Colonel By Drive, Ottawa,Ontario, K1S 5B6, Canada
(Revised 7 May 2004; in final form 4 February 2005)
Statistical inference in the form of hypothesis tests and confidence intervals often assumes that thedistribution(s) being sampled are normal or symmetric. As a result, numerous tests have been proposedin the literature for detecting departures from normality and symmetry. This article initially summarizesthe research that has been conducted for developing such tests. The results of an extensive simulationstudy to compare the power of existing tests for normality is then presented. The effects on powerof sample size, significance level, and in particular, alternative distribution shape are investigated.In addition, the power of three modifications to the tests for normality proposed by Spiegelhalter[Spiegelhalter, D.J., 1977, A test for normality against symmetric alternatives. Biometrika, 64, 415–418; Spiegelhalter, D.J., 1980, An omnibus test for normality for small samples. Biometrika, 67,493–496.], which are tailored to particular shape departures from the normal distribution is evalu-ated. The test for normality suggested by Spiegelhalter [Spiegelhalter, D.J., 1980, An omnibus testfor normality for small samples. Biometrika, 67, 493–496.] is also extended here to serve as a testfor symmetry. The results of a simulation study performed to assess the power of this proposed test forsymmetry and its comparison with existing tests are summarized and discussed. A key considerationin the assessment of the power of these various tests for symmetry is the ability of the test to maintainthe nominal significance level.
Keywords: Kurtosis; Power; Significance level; Skewness; Triples tests
1. Introduction
The validity of many statistical procedures for single and multi-population parameter infer-ence is contingent upon the assumption that the distribution(s) being sampled are normallydistributed. Still other methodologies, such as the Wilcoxon signed-rank test, require that thepopulation(s) being sampled are symmetric. As such, numerous tests have been proposed fordetecting departures from normality and symmetry.
Initially, we consider an extensive simulation study via computer to estimate the powerof many of the tests that have been suggested for assessing normality. The study focuses onsingle population inference. Of specific interest is the power of the tests for small samplesizes; that is, samples of size 30 or less. In addition to the effect of sample size on power, alsoinvestigated are the effects of significance level and true alternative distribution. The alternative
*Corresponding author. Email: [email protected]
Journal of Statistical Computation and SimulationISSN 0094-9655 print/ISSN 1563-5163 online © 2006 Taylor & Francis
http://www.tandf.co.uk/journalsDOI: 10.1080/10629360500109023
Dow
nloa
ded
by [
Uni
vers
ity o
f U
tah]
at 1
5:31
02
May
201
3

804 P. J. Farrell and K. Rogers-Stewart
distributions studied were categorized into a symmetric short-tailed group, a symmetric long-tailed classification, and a group consisting of asymmetric distributions. For each test, webased our estimates of power on critical values that we determined by generating 1,000,000samples of a given size from a standard normal distribution. Thus, the critical values employedhere are more accurate than those used in previous studies such as refs. [1–3].
Of particular interest in this study is the test for normality originally proposed bySpiegelhalter [4]. This test is based on the notion that normality under the null hypothesisis tested against a ‘family’ of distributions in the alternative hypothesis. We shall henceforthrefer to this ‘family’ as the set of ‘alternative distributions’. Spiegelhalter [4] used a set ofalternative distributions that comprised only the Laplace and uniform, and discovered that thetest was quite competitive with others in terms of power when the true distribution was notnormal, but was either symmetric short-tailed or symmetric long-tailed. In order to improvepower when the true distribution was asymmetric, Spiegelhalter [5] extended the set of alterna-tive distributions to include left and right exponentials in addition to the two symmetric ones.We illustrate in the simulation study conducted here that the power of the test for normalitybased on Spiegelhalter [5] is very competitive with other existing tests across a wide array ofnon-normal symmetric and asymmetric distributions.
In addition to existing tests for normality, in our simulation study, we also consider simplemodifications to the Spiegelhalter [4, 5] sets of alternative distributions. Specifically, we inves-tigated the power of three variants that were developed by reducing the number of distributionsin the alternative set, so that the set only consisted of symmetric short-tailed, symmetric long-tailed, or asymmetric distributions at any one given instance. This idea was motivated by thefact that the test might be more powerful if the set of alternative distributions was focused on aparticular type of departure from normality. We illustrate this to be the case in our simulationstudy. Thus, if by some prior knowledge, the alternative distribution can be restricted to sym-metric short-tailed, symmetric long-tailed, or asymmetric, the Spiegelhalter [4, 5] tests can bemodified to offer greater power.
We also considered a modification to the Spiegelhalter [5] test that allows it to serve as a testfor symmetry. In addition to offering flexibility in the specification of the distributions associa-ted with the alternative hypothesis, the Spiegelhalter [4, 5] tests also offer this flexibility withthe null. We therefore modify the Spiegelhalter [5] test into one of symmetry by associatingwith the null hypothesis the uniform and Laplace distributions in addition to the normal. Theset of alternative distributions in this case consists of only the left and right exponentials. Wecompared this new test for symmetry to three existing ones; namely, two triples tests [see ref. 6]and the Sk test proposed by Cabilio and Masaro [7]. The simulation study demonstrated that,when critical values were based on the normal distribution, the proposed test for symmetrybased on the notion of Spiegelhalter [5] did not maintain the significance level as well as theother tests for certain types of symmetric distributions such as Cauchy. However, it did providesignificantly better power for numerous different types of asymmetric distributions.
In section 2, we present the tests for normality and symmetry that were considered inthis study, including the various modifications to the Spiegelhalter [4, 5] tests proposed here.Section 3 discusses the simulations employed to assess and compare the various tests fornormality and symmetry, while conclusions and discussion are given in section 4.
2. Tests for normality and symmetry
In this section, we present the normality and symmetry tests investigated in this study. We focushere on single population inference, where we let x = (x1, . . . , xn)
′ be a simple random sampleof size n from a continuous distribution with location parameter µ and scale parameter σ .
Dow
nloa
ded
by [
Uni
vers
ity o
f U
tah]
at 1
5:31
02
May
201
3

Comprehensive study of tests for normality and symmetry 805
2.1 Tests for normality
We describe in this subsection, the tests for normality investigated in this study. Generallyspeaking, each test can be categorized as falling into one of four groups. These classificationsare referred to as correlation tests, empirical distribution function (EDF) tests, moment tests,and most powerful and scale invariant tests. For a description and extensive evaluation ofnumerous tests for normality [see ref. 8].
We investigate five of the correlation tests for normality here. The product-momentcorrelation coefficient, BL, was proposed by Blom [9, p. 71]. It is given by:
BL =∑n
i=1 x(i)bi√(∑ni=1 x2
(i)
)(∑n
i=1 b2i )
,
where x(i) are the order statistics of the random sample x1, . . . , xn, and bi is the expected valueof the ith standardized order statistic under normality. According to Blom [9], bi is determinedsuch that P(Z ≤ bi) = (i − 0.375)/(n + 0.25). Shapiro and Wilk [10] proposed SW, whichmakes use of the covariance matrix of the order statistics:
SW = (∑n
i=1 aix2(i))∑n
i=1(xi − x̄)2,
where x̄ is the sample mean, the vector a′ = q ′V −1√(q ′V −1V −1q), with q being the vector ofexpected values of standardized order statistics under normality, and V is the correspondingcovariance matrix. Rahman and Govindarajulu [11] proposed a modification to SW that isbased on approximations to q and V given by Mosteller [12] and Blom [9], suggesting thatthe coefficient vector a′ be computed as
ai = −(n + l)(n + 2)φ(qi)[qi−1φ(qi−1) − 2qiφ(qi) + qi+1φ(qi+1)],where q0φ(q0) = qn+2φ(qn+1) = 0 and φ is the standard normal density function. We shallhenceforth refer to the Rahman and Govindarajulu [11] modification to SW as RG. Under RG,computation of a′ is simpler than for SW. Chen [13] notes that RG gives larger weights than SWto extreme order statistics, and appears to be more sensitive for detecting symmetric short-tailedalternatives. Rahman and Govindarajulu [14] also developed an asymptotic approximationfor the distribution of the square root of the Shapiro–Wilk [10] statistic that allows for thecomputation of approximate critical values. D’Agostino [15] suggested DG, which is basedupon the ratio of a linear unbiased estimator of the standard deviation of the normal distributionto the sample standard deviation:
DG ={
T
(n2s)
} √n
(n − 1),
where T = ∑ni=1{i − 0.5(n + 1)}x(i) and s = √
(∑n
i=1(xi − x̄)2/(n − 1)). David et al. [16]proposed DA, which effectively compares the sample range to the sample standard deviation:
DA ={
(x(n) − x(1))
s
} √n
(n − 1).
We also study two EDF tests. The statistic LF, proposed by Lilliefors [17], reflects thegreatest absolute difference between the standard normal and sample cumulative distributions:
LF = supx
|Fn(x) − �(x)|,
Dow
nloa
ded
by [
Uni
vers
ity o
f U
tah]
at 1
5:31
02
May
201
3
806 P. J. Farrell and K. Rogers-Stewart
where �(x) denotes the cumulative distribution of the standard normal, and Fn(x) thestandardized empirical distribution function. Anderson and Darling [18] introduced AD.The test statistic is of the form
∫ ∞−∞[Fn(x) − �(x)]2ψ(t) dt , where ψ(t) is a weight func-
tion, and belongs to the Cramer–von Mises family. The weight function in AD is ψ(t) =[(�(x))(1 − �(x))]−1, which places added importance on the tails. Anderson and Darling[18] illustrated that AD can be computed using:
AD =(
1
n
) n∑i=1
(2i − 1) log{zi + log(1 − zn+1−i )} − n,
where zi = �(y(i)) with y(i) = (x(i) − x̄)/s.We also investigated the performance of the moment test initially proposed by Bowman
and Shenton [19], and then independently by Jarque and Bera [20]. The test is based on acomparison of the standardized sample skewness and kurtosis to the skewness and kurtosisof the standard normal distribution, whch are 0 and 3, respectively. The form of the statistic,BW, that we considered is given by
BW = n
[{(√
b1)2
6
}+
{(b2 − 3)2
24
}],
where√
b1 = ∑ni=1(xi − x̄)3/(ns3) and b2 = ∑n
i=1(xi − x̄)4/(ns4).Finally, we also considered a number of tests that fall into the family of most powerful
location and scale invariant tests. Hajek and Sidak [21, p. 49] give the most powerful locationand scale invariant tests against normality as T (λ0, λN) = p(x|λ0)/p(x|λN), where p(x|λ) =∫ ∞
0
∫ ∞−∞ p(x|µ, σ, λ)σ−1 dµ dσ , λ0 is the alternate distribution, λN the normal distribution,
and λ is any distribution. Spiegelhalter [4, 5] proposed two tests, henceforth referred to asSH77 and SH80, based upon the earlier mentioned tests. The test statistics take the form
p(λN|x) ={∑
λ∈�
T (λ, λN)
}−1
,
where � denotes a family of distributions comprising the normal and a set of alternativedistributions. These tests are most sensitive to departures from normality for the non-normaldistributions contained in �.Any set of distributions can comprise �; however, considered hereare only combinations of the following five: normal (λN), Laplace or double exponential (λD),uniform (λU), right exponential (λR) and left exponential (λL). The formulae for computingthe relevant p(x|λ) are:
p(x|λN) = 1
2�
(1
2n − 1
2
)n−(1/2){πs2(n − 1)}−(1/2)(n−1),
p(x|λU) = n−1(n − 1)−1(x(n) − x(1))−(n−1),
p(x|λD) = 2−(n−1)(n − 2)!n∑
j=1
w−1j ,
Dow
nloa
ded
by [
Uni
vers
ity o
f U
tah]
at 1
5:31
02
May
201
3

Comprehensive study of tests for normality and symmetry 807
where
wj =
4vn−1j
(j − n
2
) (n
2+ 1 − j
), j �= n
2,n
2+ 1
4vn−1j {1 + (n − 1)
(x(n/2)+1 − x(n/2))v−1j } j = n
2,n
2+ 1
with vj =n∑
i=1
|x(i) − x(j)|,
p(x|λR) = (n − 2)!{nn(x̄ − x(1))n−1} and p(x|λL) = (n − 2)
{nn(x(n) − x̄)n−1} .
The test statistic SH77 uses only λD and λU as the set of alternative distributions so that in thiscase � = {λN, λD, λU}. In contrast, SH80 employs all four of the non-normal distributions inthe alternative set, so that � = {λN, λD, λU, λR, λL}.
Using the set of distributions in � for SH80 as an example, we now provide some additionaldetails regarding the development of the test statistic, p(λN|x), given earlier. Recall that thecontinuous distribution being sampled is specified here to have location parameter µ and scaleparameter σ . Spiegelhalter [5] assumes a joint prior p(µ, σ |λ)ασ−1, and that p(λ) = 1/5 forλ ∈ �; the latter assumption is used to infer an absence of any knowledge as to the true shape ofthe distribution, and that the five distributions in � = {λN, λD, λU, λR, λL} are equally likely.The test statistic is simply the posterior probability of λN, given the sample data, which, sincep(λ) = 1/5, is
p(λN|x) = {p(x|λN)p(λN)}/{∑
λ∈�
p(x|λ)p(λ)
}=
{∑λ∈�
T (λ, λN)
}−1
.
Spiegelhalter [5] extended the set of alternative distributions to include λR and λL in orderto improve the power of SH77 when the true distribution was asymmetric. On the basis ofthis idea, we decided to investigate the power of three other variants that were developed byreducing the number of distributions in the alternative set, so that the set only consisted ofsymmetric short-tailed, symmetric long-tailed, or asymmetric distributions at any one giveninstance. This notion was motivated by the fact that the test might be more powerful if theset of alternative distributions was focused on a particular type of departure from normality.Therefore, in addition to SH77 and SH80, we also study the behaviour of three variants to theSpiegelhalter [4, 5] tests that we label SHU, SHL, and SHAS. The first of the three, SHU,is designed for testing against symmetric short-tailed distributions, and is such that we set� = {λN, λU}. The second, SHL, is intended to best detect symmetric long-tailed departuresfrom normality, and is such that � = {λN, λD}. Finally, SHAS is expected to excel whentesting against asymmetric distributions; in this case, � = {λN, λR, λL}.
2.2 Tests for symmetry
In addition to offering flexibility in the specification of the distributions associated with thealternative hypothesis, the Spiegelhalter [4, 5] tests also offer this flexibility with the null.This led us to modify the Spiegelhalter [5] test into one of symmetry by associating with thenull hypothesis, the uniform and Laplace distributions in addition to the normal. The set ofalternative distributions in this case consists of only the left and right exponentials. Thus, wedefine
SHSYM = p(x|asymmetric)
p(x|symmetric)= (p(x|λL) + p(x|λR))
(p(x|λN) + p(x|λD) + p(x|λU))
as a test statistic for assessing the symmetry of a distribution.
Dow
nloa
ded
by [
Uni
vers
ity o
f U
tah]
at 1
5:31
02
May
201
3

808 P. J. Farrell and K. Rogers-Stewart
Cabilio and Masaro [7] discuss a number of the existing tests for symmetry. They alsopropose a statistic, Sk, for testing symmetry that is given by
Sk =√
n(x̄ − m)
s,
where x̄ and m are the sample mean and median, respectively. Cabilio and Masaro [7] alsodiscuss and investigate the use of two triples test statistics, T ∗
1 and T1, that were suggested byRandles et al. [6]. A U -statistic is computed for these two tests that is based on sets of threeobservations, (xi, xj , xk), where i < j < k. If mijk is the median for the triple (xi, xj , xk),then the U -statistic is defined as
η̂ =(
n
3
)−1 ∑i<j<k
f ∗(xi, xj , xk),
where f ∗(xi, xj , xk) = (1/3)sign[{(xi + xj + xk)/3} − mijk]. For testing symmetry, Randleset al. [6] suggest
T1 =∣∣∣∣√
nη̂
σ̂n
∣∣∣∣ .Here, σ̂n denotes an estimate of the standard deviation obtained by jackknifing the U -statistics.The statistic T ∗
1 has the same form as T1, but rejects if greater than tα/2 with n degrees offreedom, while T1 rejects if greater than zα/2.
In subsection 3.2, we investigate the performance of SHSYM as a test for symmetry, andcompare it with Sk, T1, and T ∗
1 .
3. Simulation study
3.1 Comparison of normality tests
In order to compare, for small sample sizes, the power of AD, BL, BW, DA, DG, LF, RG, SW,SH77, SH80, and the three variants, SHAS, SHL, and SHU, an extensive simulation involvingnumerous symmetric short-tailed, symmetric long-tailed, and asymmetric distributions wascarried out. Two levels of significance, α = 0.05 and 0.10, and five different sample sizes,n = 10, 15, 20, 25, and 30, were considered.
Prior to conducting the empirical study of power, appropriate critical values were determinedfor each test. Even though certain critical values are available in the literature for some of thetests considered here, critical values for each sample size under consideration were derivedempirically for each test. These critical values were based on 1,000,000 simulated samplesfrom a standard normal distribution. This approach ensures the same magnitude of MonteCarlo error for each. Note that previous studies have based critical values on substantiallyfewer than 1,000,000 replications.
To obtain the necessary critical values for a particular test and sample size, the statisticfor the test of interest was computed for each of the 1,000,000 replications. These statisticswere then ordered to create an empirical distribution. As the AD, BW, and LF tests are right-tailed, the 90th and 95th percentiles of the empirical distributions of their associated statisticsare necessary in order to consider the power of these tests at α = 0.05 and 0.10. In contrast,the BL, RG, SW, SH77, SH80, SHAS, SHL, and SHU tests are left-tailed, implying that thepower study will require the 5th and 10th percentiles of the empirical distributions of their test
Dow
nloa
ded
by [
Uni
vers
ity o
f U
tah]
at 1
5:31
02
May
201
3
Comprehensive study of tests for normality and symmetry 809
statistics. Finally, as DA and DG are two-sided tests, the 2.5th, 5th, 95th, and 97.5th percentilesof the empirical distributions of the test statistics are required.
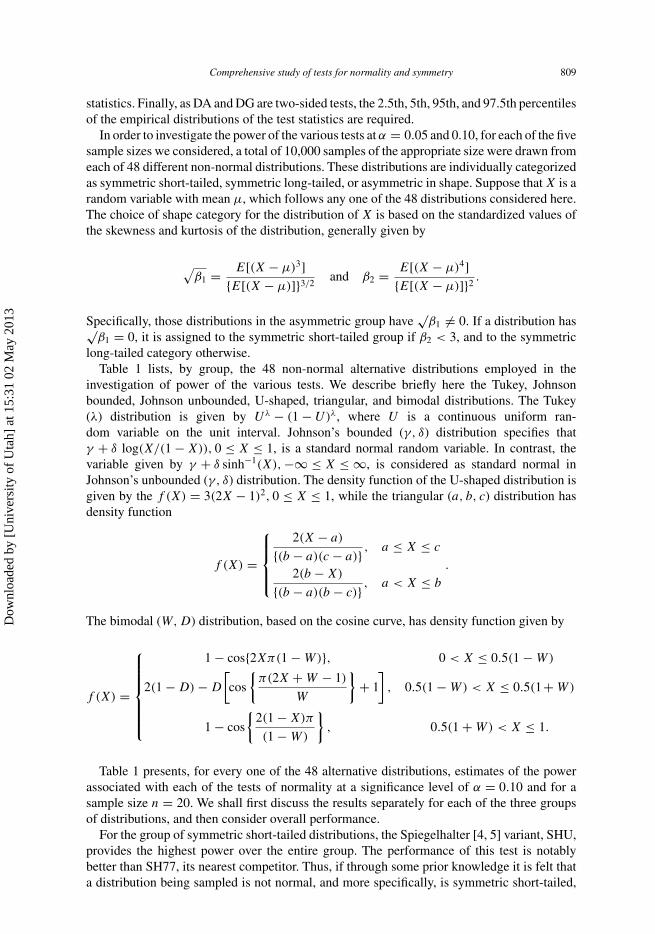
In order to investigate the power of the various tests at α = 0.05 and 0.10, for each of the fivesample sizes we considered, a total of 10,000 samples of the appropriate size were drawn fromeach of 48 different non-normal distributions. These distributions are individually categorizedas symmetric short-tailed, symmetric long-tailed, or asymmetric in shape. Suppose that X is arandom variable with mean µ, which follows any one of the 48 distributions considered here.The choice of shape category for the distribution of X is based on the standardized values ofthe skewness and kurtosis of the distribution, generally given by
√β1 = E[(X − µ)3]
{E[(X − µ)]}3/2and β2 = E[(X − µ)4]
{E[(X − µ)]}2.
Specifically, those distributions in the asymmetric group have√
β1 �= 0. If a distribution has√β1 = 0, it is assigned to the symmetric short-tailed group if β2 < 3, and to the symmetric
long-tailed category otherwise.Table 1 lists, by group, the 48 non-normal alternative distributions employed in the
investigation of power of the various tests. We describe briefly here the Tukey, Johnsonbounded, Johnson unbounded, U-shaped, triangular, and bimodal distributions. The Tukey(λ) distribution is given by Uλ − (1 − U)λ, where U is a continuous uniform ran-dom variable on the unit interval. Johnson’s bounded (γ, δ) distribution specifies thatγ + δ log(X/(1 − X)), 0 ≤ X ≤ 1, is a standard normal random variable. In contrast, thevariable given by γ + δ sinh−1(X), −∞ ≤ X ≤ ∞, is considered as standard normal inJohnson’s unbounded (γ, δ) distribution. The density function of the U-shaped distribution isgiven by the f (X) = 3(2X − 1)2, 0 ≤ X ≤ 1, while the triangular (a, b, c) distribution hasdensity function
f (X) =
2(X − a)
{(b − a)(c − a)} , a ≤ X ≤ c
2(b − X)
{(b − a)(b − c)} , a < X ≤ b
.
The bimodal (W, D) distribution, based on the cosine curve, has density function given by
f (X) =
1 − cos{2Xπ(1 − W)}, 0 < X ≤ 0.5(1 − W)
2(1 − D) − D
[cos
{π(2X + W − 1)
W
}+ 1
], 0.5(1 − W) < X ≤ 0.5(1+ W)
1 − cos
{2(1 − X)π
(1 − W)
}, 0.5(1 + W) < X ≤ 1.
Table 1 presents, for every one of the 48 alternative distributions, estimates of the powerassociated with each of the tests of normality at a significance level of α = 0.10 and for asample size n = 20. We shall first discuss the results separately for each of the three groupsof distributions, and then consider overall performance.
For the group of symmetric short-tailed distributions, the Spiegelhalter [4, 5] variant, SHU,provides the highest power over the entire group. The performance of this test is notablybetter than SH77, its nearest competitor. Thus, if through some prior knowledge it is felt thata distribution being sampled is not normal, and more specifically, is symmetric short-tailed,
Dow
nloa
ded
by [
Uni
vers
ity o
f U
tah]
at 1
5:31
02
May
201
3

810 P. J. Farrell and K. Rogers-Stewart
Table 1. Empirical power for normality tests at a significance level of α = 0.10 and n = 20.
SW RG BL AD LF BW DG DA SH77 SH80 SHU SHL SHAS
Symmetric short-tailedUniform 35.2 54.8 18.2 28.8 18.2 23.1 17.0 54.9 62.1 58.4 68.9 0.5 35.7Tukey (1.5) 42.1 62.0 22.9 34.3 21.8 28.9 16.7 62.4 69.3 65.6 75.9 0.6 41.7Tukey (1.25) 40.7 60.3 22.4 33.1 20.9 27.9 16.4 61.3 68.0 64.0 74.7 0.4 40.5Tukey (0.75) 25.9 42.1 12.4 21.3 15.5 16.1 17.2 41.5 48.8 44.1 56.8 0.7 25.6Tukey (0.5) 13.7 24.4 7.0 12.9 11.7 8.4 14.4 22.4 28.4 24.6 35.9 1.6 15.0Tukey (0.25) 8.6 11.9 6.4 8.8 9.3 6.2 9.3 10.1 12.4 11.4 15.3 4.9 9.8Bimodal (0.2, 0.2) 14.9 23.6 8.2 15.2 13.8 9.5 13.9 20.5 25.9 22.8 32.7 1.4 15.4Bimodal (0.2, 0.5) 21.4 32.8 11.9 22.9 21.0 14.3 12.5 25.3 31.1 28.7 38.7 1.3 18.5Bimodal (0.2, 0.8) 30.7 43.2 17.8 33.9 31.7 20.5 10.0 32.8 39.9 36.6 47.3 1.3 22.8Bimodal (0.5, 0.2) 32.5 47.6 17.9 30.1 21.9 23.2 16.3 44.0 51.6 47.3 59.7 0.7 29.3Bimodal (0.5, 0.5) 52.2 68.5 33.0 50.3 37.5 42.5 12.7 60.0 67.5 63.8 74.6 0.7 40.6Bimodal (0.5, 0.8) 79.5 89.4 62.5 79.4 64.2 71.9 5.9 79.4 84.9 83.2 88.4 1.2 59.2Bimodal (O.8, 0.8) 44.4 63.3 25.2 37.3 24.1 32.2 15.8 62.2 69.3 66.0 76.0 0.4 42.0Bimodal (0.8, 0.5) 69.5 82.9 47.7 62.2 41.9 58.1 11.0 80.4 85.2 84.5 89.2 0.7 63.2Bimodal (0.8, 0.8) 93.8 97.7 82.4 91.1 73.9 89.7 5.4 94.9 97.2 97.3 97.9 1.3 86.7Johnson bounded (0, 0.5) 62.7 79.8 39.9 52.4 32.1 46.9 12.8 79.1 84.2 82.9 88.3 0.6 62.0Johnson bounded (0, 0.7071) 28.3 44.7 14.3 24.4 17.1 19.0 17.4 44.2 52.3 47.2 60.0 0.8 27.4Johnson bounded (0, 2.0) 8.7 11.5 6.9 9.1 9.3 6.9 9.4 9.8 11.6 11.1 13.9 5.7 10.1U-Shape 100.0 100.0 100.0 100.0 99.2 100.0 19.2 99.7 100.0 100.0 99.8 4.2 100.0Triangular (0, 5, 10) 7.4 12.5 4.9 7.8 8.7 4.7 10.1 11.0 14.4 12.0 18.2 4.3 8.7
Symmetric long-tailedCauchy 90.1 81.8 92.5 91.4 88.3 89.0 91.6 73.2 88.9 87.7 0.2 94.0 50.4Laplace 34.8 20.9 41.7 37.1 31.6 36.6 37.1 29.2 30.7 28.0 2.2 48.4 13.1Logistic 18.7 12.6 21.9 17.9 15.5 21.5 18.9 16.6 14.1 14.0 5.0 23.4 11.9Tukey (−1.5) 98.0 95.0 98.6 98.4 98.1 96.5 98.5 79.5 98.0 97.5 0.2 99.1 63.5Tukey (−1.25) 96.0 91.6 97.2 96.9 95.7 94.2 96.7 78.5 95.9 95.3 0.2 98.1 58.2Tukey (−0.75) 83.3 73.5 86.7 85.4 81.7 81.7 85.5 69.2 82.5 80.1 0.5 89.7 41.5Tukey (−0.5) 69.0 55.5 74.0 70.5 65.8 69.3 71.6 57.0 66.1 63.5 0.9 77.6 32.2Tukey (−0.25) 45.5 32.0 51.7 45.6 39.1 48.1 47.7 37.8 39.1 38.2 1.9 54.8 20.6Johnson unbounded (0, 0.5) 92.6 84.4 94.5 94.4 92.3 89.3 93.7 74.9 92.6 91.0 0.2 96.2 44.8Johnson unbounded (0, 1.0) 50.4 36.6 56.8 51.2 45.2 52.7 52.4 41.2 44.8 43.0 1.4 60.4 21.1Johnson unbounded (0, 2.0) 18.5 13.0 22.2 18.0 14.9 22.0 19.2 17.5 14.1 14.6 5.2 23.2 12.4t (2) 59.9 46.2 65.6 60.5 54.0 62.1 62.2 49.4 55.1 53.2 1.2 68.5 29.4t (3) 40.7 29.2 46.2 40.7 35.0 44.0 42.3 34.7 34.6 34.0 2.4 48.4 20.3t (10) 15.5 11.8 18.2 14.8 13.4 17.6 15.8 15.0 12.8 12.8 7.5 18.9 11.3t (15) 13.9 10.8 15.3 13.6 12.3 15.1 13.6 12.8 11.3 11.5 7.6 15.7 10.9t (20) 12.2 10.3 13.4 11.6 11.2 13.5 12.2 11.0 10.8 10.6 7.8 14.0 9.9
AsymmetricHalf-normal 59.6 60.9 52.9 50.5 37.0 51.0 23.8 17.7 30.5 63.2 26.4 17.9 71.9Log-normal 95.9 96.1 94.7 93.8 86.7 93.8 81.5 19.8 72.4 96.0 12.1 73.9 97.8Chi-square (2) 90.2 91.2 87.2 85.5 70.3 85.2 60.1 16.8 53.7 92.1 21.4 48.8 95.4Chi-square (3) 77.1 76.8 73.1 71.0 54.9 71.8 46.5 15.0 40.3 77.3 18.0 38.7 84.4Chi-square (10) 34.3 31.9 33.1 29.9 24.2 34.4 21.6 11.2 18.5 28.4 12.4 19.5 33.7Chi-square (15) 27.1 24.1 26.2 24.2 19.8 27.4 18.0 10.7 15.4 22.4 11.3 16.3 25.7Chi-square (20) 22.9 21.0 22.4 20.9 17.8 23.4 16.2 11.0 14.5 19.0 10.8 15.2 21.2Triangular (0, 2, 10) 29.6 36.7 22.1 27.3 22.3 22.6 11.3 19.2 26.0 32.5 30.7 5.0 33.7Triangular (0, 9, 10) 41.7 49.7 31.9 36.8 27.4 31.0 12.1 25.7 33.9 48.9 39.1 5.5 52.3Beta (2, 1) 46.5 55.0 35.0 39.4 28.5 33.9 11.7 30.4 39.6 56.9 44.4 5.4 60.8Weibull (3) 9.8 11.6 8.6 9.8 9.7 8.4 10.0 9.6 11.5 11.2 13.3 7.1 10.6Weibull (10) 23.2 20.3 22.8 20.9 17.9 23.7 16.4 10.4 13.9 18.4 10.2 15.7 21.4
substantial gains in power can be achieved by removing the Laplace distribution from the setof alternative distributions in SH77, and making use of SHU. The RG, SH80, and DA testsalso provide reasonable power; however, these tests are clearly bettered by SHU and, to alesser extent, SH77. An advantage of the DA test is its computational simplicity. Also of noteis the performance of RG relative to SW.
Dow
nloa
ded
by [
Uni
vers
ity o
f U
tah]
at 1
5:31
02
May
201
3

Comprehensive study of tests for normality and symmetry 811
Relatively speaking, the performance of the other tests over the distributions in the sym-metric short-tailed group is quite poor. In particular, the estimates of power for the DG test arequite low over all distributions, as are the estimates associated with SHL. The performanceof SHL is not surprising, as only a symmetric long-tailed distribution is included in the setof alternative distributions. This clearly is not a sound strategy when testing a departure fromnormality which is characterized by a symmetric short-tailed distribution.
For the group of symmetric long-tailed distributions, the performance of SHU and SHL arenow reversed. The Spiegelhalter [4, 5] variant, SHL, yields the highest power for a majorityof the distributions in the group. The performance of BL is comparable to that of SHL. Unlikethe results associated with the symmetric short-tailed distributions, there are a number of testsin this group with reasonable power. The AD, SW, SW, and DG tests have powers over thesymmetric long-tailed distributions that are similar, and almost as high as those associatedwith BL. Of these four similarly-performing tests, AD and DG seem to have slightly higherpower than SW and BW for distributions such as the Cauchy, Laplace, logistic, and Tukey.In contrast, BW seems to be the test of choice for power in this set of four for t-distributions,in particular, for distributions where the degrees of freedom are high. The estimates of powerfor the LF, RG, SH77, and SH80 tests are also reasonable, but not quite as high as thoseassociated with the AD, SW, BW, and DG tests. The LF and SH77 tests appear to per-form slightly better in terms of power than SH80. In addition, a comparison of the estimatesof power obtained for the SH77 and SHL tests suggest that when data come from a sym-metric long-tailed distribution, substantial gains in power can be achieved by removing theuniform distribution from the set of alternative distributions in SH77. The relative perfor-mance of the DA test for symmetric long-tailed distributions is quite different than for thecase of symmetric short-tailed distributions, where it was one of the more powerful tests.The Shapiro–Wilk [10] modification, RG, performs similarly to DA. Not surprisingly, thepower estimates associated with SHAS and SHU are poor, with the latter test yielding resultsthat relatively speaking are exceedingly poor. This can be attributed to the fact that bothSHAS and SHU do not include a symmetric long-tailed distribution in the set of alternativedistributions.
Over the classification of asymmetric distributions, SHAS is significantly more powerfulthan any of the other tests for most cases. In addition, for distributions where the SHAS testdoes not have the highest estimated power, its relative performance is extremely similar tothat of the most powerful test. The estimates of power for SH80, RG, and SW are similar andreasonable, but none are able to match SHAS. Thus, it is again observed that substantial gainsin power can be achieved by tailoring the set of alternative distributions in the Spiegelhalter[4, 5] tests. For the asymmetric distributions, the performance of the BL, BW, and AD testsare similar, but lag behind those of SH80, RG, and SW. The remaining tests are inferior tothese three.
Up to now, we have discussed the power estimates for a single significance level, α = 0.10,and sample size, n = 20. We shall not present the simulation results associated with n = 10,15, 25, and 30 for the 0.10 significance level, nor any of the results for the five differentsamples sizes associated with α = 0.05. However, as might be expected, the power estimatesdecreased when the significance level or the sample size was decreased, and increased whenthe sample size was increased. In addition, the conclusions drawn earlier with α = 0.10 andn = 20 regarding the relative performance of the tests were not affected by changing thesignificance level or the sample size.
If the performance of the tests is to be assessed over all shapes of distributions in order topropose an omnibus test, it is clear that the Spiegelhalter [4, 5] variants SHL, SHU, and SHASwill not fill this role. Although each of these tests is extremely powerful for distributions inthe shape category group that it is designed to detect, none of them would be advisable over
Dow
nloa
ded
by [
Uni
vers
ity o
f U
tah]
at 1
5:31
02
May
201
3

812 P. J. Farrell and K. Rogers-Stewart
all distributions in the different shape categories. The DG, DA, and SH77 tests are relativelyweak at detecting asymmetric alternatives, whereas similar difficulties are encountered whenusing the BL, SW, and LF tests for detecting symmetric short-tailed alternatives. Over thesymmetric long-tailed distributions, the AD and SW tests have similar power; however, SW ismore powerful in detecting alternative distributions in the other two shape categories. Whencompared with the SH80 test, SW has more power for symmetric long-tailed distributions,although SH80 is the test of choice between the two for detecting symmetric short-tailed andasymmetric distributions. The use of RG, the modification to SW, leads to improvement inpower for the symmetric short-tailed and asymmetric distributions, to the point where they aresimilar to those of SH80. Of note, however, is the fact that if, by some prior knowledge, thealternative distribution can be restricted to symmetric short-tailed, symmetric long-tailed, orasymmetric, the use of SHU, SHL, or SHAS, respectively, will result in significantly higherpower. Spiegelhalter [4, 5] conjectured this, but no quantification was given.
3.2 Comparison of symmetry tests
In this subsection, we consider the performance of SHSYM proposed in section 2 as a modi-fication that allows for the original test proposed for normality by Spiegelhalter [5] to betransformed into a test for symmetry. Similar to subsection 3.1, we performed a simulationstudy to investigate and compare the empirical significance level and power of SHSYM withthe triples test statistics T1 and T ∗
1 considered by Randles et al. [6], and the Sk statistic proposedby Cabilio and Masaro [7]. In order to allow for a contrast with the results given in Cabilioand Masaro [7], we present and discuss results here that arose when a nominal significancelevel of 0.05 was employed.
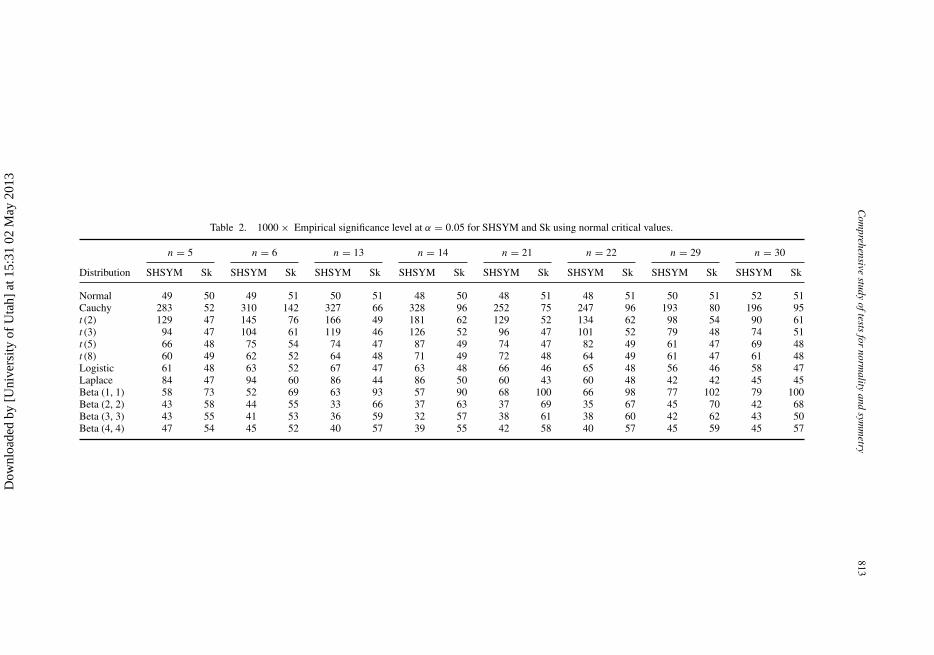
We initially considered the problem of the development of appropriate critical values forSHSYM. This is obviously more challenging than the determination of such values whentesting normality because the null hypothesis is now true over all possible symmetric distri-butions. It is therefore more difficult to propose a single critical value that will maintain thedesired significance level under all distributions when the null hypothesis is true.
To begin with, we used the standard normal distribution to develop critical values forSHSYM for numerous different sample sizes (n = 5, 6, 9, 10, 13, 14, 17, 18, 21, 22, 25,26, 29, and 30). As stated earlier, a nominal level of significance of 0.05 was considered.For each sample size, the critical values associated with this level of significance were basedon l,000,000 samples. For each of these different sample sizes, 10,000 samples were thenselected from each of the symmetric distributions listed in table 2. For each distribution andsample size, an empirical significance level was then computed. These levels are presented intable 2 for a representative selection of the earlier mentioned sample sizes, along with thoseobtained for Sk by Cabilio and Masaro [7] for comparative purposes. From these results, itwould appear that SHSYM does not maintain the nominal level of significance as well as Skfor a number of the symmetric distributions, including the Cauchy, the logistic, the Laplace,and the t with small degrees of freedom.
Given this result, we considered the effect of changing the null distribution upon whichthe critical values for SHSYM were based on the ability of the test to maintain the nominalsignificance level. Specifically, we performed a simulation using sample sizes of n = 5, 6, 9,10, 13, 14, 17, 18, 20, 21, 22, 25, 26, 29, and 30, and a significance level of 0.05. The differentnull distributions employed to determine critical values are listed horizontally across the top oftable 3, and include the normal, Cauchy, logistic, Laplace, and uniform, along with numerousforms of the t and beta distributions. To obtain critical values for each of these distributions,an empirical distribution for SHSYM was determined by selecting l,000,000 samples from the
Dow
nloa
ded
by [
Uni
vers
ity o
f U
tah]
at 1
5:31
02
May
201
3
Com
prehensivestudy
oftestsfor
normality
andsym
metry
813
Table 2. 1000 × Empirical significance level at α = 0.05 for SHSYM and Sk using normal critical values.
n = 5 n = 6 n = 13 n = 14 n = 21 n = 22 n = 29 n = 30
Distribution SHSYM Sk SHSYM Sk SHSYM Sk SHSYM Sk SHSYM Sk SHSYM Sk SHSYM Sk SHSYM Sk
Normal 49 50 49 51 50 51 48 50 48 51 48 51 50 51 52 51Cauchy 283 52 310 142 327 66 328 96 252 75 247 96 193 80 196 95t (2) 129 47 145 76 166 49 181 62 129 52 134 62 98 54 90 61t (3) 94 47 104 61 119 46 126 52 96 47 101 52 79 48 74 51t (5) 66 48 75 54 74 47 87 49 74 47 82 49 61 47 69 48t (8) 60 49 62 52 64 48 71 49 72 48 64 49 61 47 61 48Logistic 61 48 63 52 67 47 63 48 66 46 65 48 56 46 58 47Laplace 84 47 94 60 86 44 86 50 60 43 60 48 42 42 45 45Beta (1, 1) 58 73 52 69 63 93 57 90 68 100 66 98 77 102 79 100Beta (2, 2) 43 58 44 55 33 66 37 63 37 69 35 67 45 70 42 68Beta (3, 3) 43 55 41 53 36 59 32 57 38 61 38 60 42 62 43 50Beta (4, 4) 47 54 45 52 40 57 39 55 42 58 40 57 45 59 45 57
Dow
nloa
ded
by [
Uni
vers
ity o
f U
tah]
at 1
5:31
02
May
201
3

814 P. J. Farrell and K. Rogers-Stewart
Table 3. 1000 × Empirical rejection probabilities at α = 0.05 and n = 20 for SHSYM usingvarious critical values.
Critical values distributionSampled
distribution Normal Cauchy t (2) t (3) t (5) t (8) Logistic Laplace Uniform Beta (1, 1) Beta (4, 4)
Type 1 61 0 5 16 32 42 44 38 49 49 79Type 2 50 0 4 13 26 36 37 32 41 41 61Type 3 79 0 12 29 49 61 62 56 68 68 92Type 4 90 0 17 38 58 71 73 66 80 80 103Type 5 107 1 27 52 76 89 90 85 94 94 121Type 6 273 52 181 216 240 256 258 249 263 263 284Type 7 411 0 112 218 303 346 351 329 373 373 457Type 8 839 12 513 679 764 798 801 786 814 814 863Type 9 222 0 48 104 156 185 188 174 200 200 250Type 10 354 1 116 206 273 310 314 297 328 328 385Type 11 93 0 19 42 64 76 77 71 82 82 108Type 12 182 0 51 94 132 153 156 146 165 165 201Type 13 949 95 785 878 918 934 935 928 941 941 958Type 14 954 110 800 889 924 939 941 934 945 945 962Type 15 273 0 49 115 178 217 220 202 238 238 314Type 16 666 3 321 472 569 611 615 596 633 633 705Type 17 217 0 45 98 149 176 180 164 193 193 244Type 18 667 4 311 469 567 612 616 595 634 634 702Type 19 220 1 64 121 167 190 193 181 203 203 242Type 20 580 8 305 427 497 537 541 520 556 556 607
appropriate distribution for each sample size listed earlier. The ability of the critical values foreach of the symmetric distributions to maintain a nominal significance level of 0.05 was theninvestigated by generating 10,000 samples of size n = 20 from each of distribution Types1 through 6 of the generalized lambda family as described in Randles et al. [6]. Each ofthese six distributions is symmetric. Table 3 summarizes the results regarding the empiricalsignificance levels obtained. With the exception of the Cauchy and the t distribution withsmall degrees of freedom, the empirical significance levels obtained for distribution Types 1through 6 do not differ considerably over the symmetric distributions employed to determinethe critical values. We repeated this investigation for all sample sizes listed earlier, and for asignificance level of 0.10, with similar results. As such, we made use of the normal distributionfor determining the critical values for SHSYM in the power comparison with T1, T ∗
1 , andSk discussed subsequently, bearing in mind the relative ability of SHSYM to maintain theappropriate significance level.
In order to compare the symmetry tests SHSYM, T1, T ∗1 , and Sk with regards to power,
10,000 samples of size n = 20 were selected from each of distribution Types 7 through 20of the generalized lambda family as described in Randles et al. [6]. Types 7 through 14 areasymmetric, while Types 15 through 20 have the right half stochastically larger than the lefthalf. Estimates of power obtained for the four tests were determined for a nominal significancelevel of 0.05 using critical values based on using the normal as the null distribution. Theseestimates are reported in table 4. The table illustrates that SHSYM obtains the highest estimateof power for all distributions with the exception of distribution Types 15, 17, and 18, wherethe power of the test, although not the best, is very competitive. In addition, for numerousdistributions where SHSYM is the most powerful (Types 7, 8, 13, 14, and 20), the estimate ofpower is significantly better than its nearest competitor. Similar findings were obtained whenthis simulation was repeated for samples of size n = 30.
Dow
nloa
ded
by [
Uni
vers
ity o
f U
tah]
at 1
5:31
02
May
201
3

Comprehensive study of tests for normality and symmetry 815
Table 4. 1000 × Empirical rejectionprobabilities at α = 0.05 for Sk, T ∗
1 , T1, andSHSYM using normal critical values.
Distribution Sk T ∗1 T1 SHSYM
Type 1 117 55 71 61Type 2 49 34 45 50Type 3 44 47 64 79Type 4 46 53 67 90Type 5 48 56 68 107Type 6 92 83 103 273Type 7 223 222 258 411Type 8 430 625 669 839Type 9 142 190 219 222Type 10 205 286 331 354Type 11 53 60 76 93Type 12 100 129 153 182Type 13 564 769 795 949Type 14 596 793 823 954Type 15 335 248 282 273Type 16 662 446 484 666Type 17 241 219 263 217Type 18 644 624 671 667Type 19 154 140 161 220Type 20 309 304 333 580
4. Conclusion and discussion
A comprehensive investigation of existing tests for normality and symmetry has been per-formed in this study. Although the Spiegelhalter [5] test is one of the most powerful tests fornormality across a wide array of alternative distributions, numerous modifications to this testhave been suggested here in order to improve the power. These modifications were based onthe notion of reducing the number of distributions in the alternative set to focus on a particularform of shape departure from normality such as symmetric short-tailed, symmetric long-tailed, or asymmetric. A modification to the Shapiro–Wilk [10] test proposed by Rahman andGonvindarajulu [11] has also been investigated; it results in an improvement in power whenthe alternative distribution is either symmetric short-tailed or asymmetric.
The results of a simulation study conducted to compare the tests for normality seem tosuggest that no omnibus test for detecting departures appears to exist. Nevertheless, the studydemonstrates, for small sample sizes, the strengths and weaknesses with regards to power ofnumerous of the existing tests, along with some modifications to the Spiegelhalter [4, 5] testsproposed here. The ability of the Shapiro–Wilk [10] and Spiegelhalter [5] tests to detect depar-tures over a wide variety of alternative distributions is noteworthy. The former test has morepower for symmetric long-tailed distributions, whereas the latter has greater ability in detectingnon-normal symmetric short-tailed and asymmetric distributions. The modification of Rahmanand Govindarajulu [11] to the Shapiro–Wilk statistic, similar to Spiegelhalter [5], produces apowerful test against non-normal symmetric short-tailed and asymmetric distributions. If, bysome prior knowledge, the alternative distribution can be restricted to being one of symmetricshort-tailed, symmetric long-tailed, or asymmetric shape, modifying the set of alternative dis-tributions in Spiegelhalter [5] to acknowledge only the perceived departure from normality willresult in significantly higher power. Spiegelhalter [4, 5] conjectured this, but no quantificationwas given. Alternatively, another possibility when prior knowledge allows for restriction ofthe alternative distribution is to directly use the Shapiro–Wilk [10] test when the distribution isthought to be non-normal symmetric long-tailed, and apply the Rahman–Govindarajulu [11]
Dow
nloa
ded
by [
Uni
vers
ity o
f U
tah]
at 1
5:31
02
May
201
3

816 P. J. Farrell and K. Rogers-Stewart
modification for non-normal symmetric short-tailed and asymmetric alternatives. However,some power will be lost if this latter strategy is adopted. Generally speaking, when comparedwith tests based on the notion of Spiegelhalter [4, 5] where the alternative class is extremelyrestricted, goodness-of-fit tests will have relatively lower power as the alternative class is muchmore composite.
The Spiegelhalter [5] test for normality was also modified here into a test for symmetry.When compared with existing tests using simulation, this modification frequently yieldedhigher power for detecting asymmetric distributions, thus lending further to the versatility ofthe Spiegelhalter [4, 5] concept. Of note, however, was the fact that this test for symmetry didnot maintain the nominal significance level as well as others when the critical values werebased on a normal distribution.
Acknowledgements
This research was supported through funds from the Natural Sciences and EngineeringResearch Council of Canada. The authors are grateful to the referee for useful comments.
References[1] Shapiro, S.S., Wilk, M.B. and Chen, H.J., 1968, A comparative study of various tests for normality. Journal of
the American Statistical Association, 63, 1343–1372.[2] Filliben, J.J., 1975, The probability plot correlation coefficient test for normality. Technometrics, 17, 111–117.[3] Looney, S.W. and Gulledge, T.R., 1985, Use of the correlation coefficient with normal probability plots. American
Statistician, 39, 75–79.[4] Spiegelhalter, D.J., 1977, A test for normality against symmetric alternatives. Biometrika, 64, 415–418.[5] Spiegelhalter, D.J., 1980, An omnibus test for normality for small samples. Biometrika, 67, 493–496.[6] Randles, H., Fligner, M.A., Policello, G.E. and Wolfe, D.A., 1980, An asymptotically distribution-free test for
symmetry versus asymmetry. Journal of the American Statistical Association, 75, 168–172.[7] Cabilio, P. and Masaro, J., 1996, A simple test of symmetry about an unknown median. Canadian Journal of
Statistics, 24, 349–361.[8] D’Agostino, R.B. and Stephens, M.A., 1986, Goodness-of-Fit Techniques (New York: Dekker).[9] Blom, G., 1958, Statistical Estimates and Transformed Beta Variables (New York: Wiley).
[10] Shapiro, S.S. and Wilk, M.B., 1965, An analysis of variance test for normality (complete samples). Biometrika,52, 591–611.
[11] Rahman, M.M. and Govindarajulu, Z., 1997, A modification of the test of Shapiro and Wilk for normality.Journal of Applied Statistics, 24, 219–235.
[12] Mosteller, F., 1946, On some useful ‘inefficient’ statistics. Annals of Mathematical Statistics, 17, 377–408.[13] Chen, L., 2003, C470. Normality tests based on weighted order statistics. Journal of Statistical Computation
and Simulation, 73, 603–606.[14] Rahman, M.M. and Govindarajulu, Z., 1997, Asymptotic considerations of Shapiro–Wilk W test for normality.
Journal of Applied Statistical Science, 5, 197–210.[15] D’Agostino, R.B., 1971, An omnibus test of normality for moderate and large size samples. Biometrika, 58,
341–348.[16] David, H.A., Hartley, H.O. and Pearson, E.S., 1954, The distribution of the ratio, in a single normal sample, of
range to standard deviation. Biometrika, 41, 482–493.[17] Lillefors, H.W., 1967, On the Kolmogorov–Smirnov test for normality with mean and variance unknown.
Journal of the American Statistical Association, 62, 399–402.[18] Anderson, T.W. and Darling, D.A., 1952,Asymptotic theory of certain goodness-of fit criteria based on stochastic
processes. Annals of Mathematical Statistics, 23, 193–212.[19] Bowman, K.O. and Shenton, L.R., 1975, Omnibus test contours for departures from normality based on
√b1
and b2. Biometrika, 62, 243–250.[20] Jarque, C.M. and Bera, A.K., 1987, A test for normality of observations and regression residuals. International
Statistical Review, 55, 163–172.[21] Hajek, J. and Sidak, Z., 1967, Theory of Rank Tests (New York: Academic Press).
Dow
nloa
ded
by [
Uni
vers
ity o
f U
tah]
at 1
5:31
02
May
201
3