Embed Size (px)
Citation preview

Comprehensive Report for the World Bank:
“Financial Literacy and Consumer Awareness Survey in the West Bank and Gaza”
Implemented by:
Riyada Consulting and Training
July 2011
THE WORLD BANK Financial and Private Sector Development
2
This survey report is a product of Riyada Consulting and Training, reviewed by the staff of the International Bank for Reconstruction and Development/ The World Bank. The findings, interpretations, and conclusions expressed herein do not necessarily reflect the views of the Executive Directors of the World Bank or the governments they represent.
This survey report is made possible by the support of the American people through the United States Agency for International Development (USAID). The contents are the responsibility of Riyada Consulting and Training and do not necessarily reflect the views of USAID or the United States Government.
Research Study Team: Shuaa Marrar Senior Researcher / Team Leader Karim Bitar Financial Consultant Trevor Lake Researcher Samer Esaied Coordinator / Researcher in the West Bank Maher Essa Coordinator / Researcher in Gaza Strip Nayif Tahseen Statistician / Field Work Supervisor in West Bank and Gaza Strip Fatma Shurafa Assistant Statistician / Field Work Supervisor in Gaza Strip Amal Karakra Research Assistant and Data Entry Specialist Field Researchers 31 Researchers

3
TABLE OF CONTENTS
1. Introduction: .............................................................................................................................................. 7
2. Executive Summary: ............................................................................................................................... 12
3. Survey Methodology and Empirical Approach: ..................................................................................... 16
The frame was divided into strata depending on the homogeneity of the divided parts as follows: ...... 17
4. Socio-Demographic Composition of the Sample:................................................................................... 19
4.1 Location: ........................................................................................................................................... 19
4.2 Locality: ............................................................................................................................................ 19
4.3 Gender, Position in the Family and Number of Household Members: ............................................. 19
4.4 Age Distribution: .............................................................................................................................. 20
4.5 Levels of Education: ......................................................................................................................... 20
4.6 Employment: ..................................................................................................................................... 21
4.7 Income: ............................................................................................................................................. 22
4.8 Ownership of Basic Items (personal possessions), area of residence, and Language: ...................... 23
4.9 Quality of life and expectations: ....................................................................................................... 24
5. Findings: ................................................................................................................................................. 25
5.1 Money Management, Making Ends Meet: ........................................................................................ 25
5.1.1 Budgeting: .................................................................................................................................. 25
5.1.2 Keeping Monthly Records: ........................................................................................................ 25
5.1.3 Managing Debts: ........................................................................................................................ 26
5.1.4 Coping with Financial Shocks: .................................................................................................. 26
5.2 Planning and Provisioning for the Future: ........................................................................................ 28
5.2.1 Consumption Behavior: ............................................................................................................. 28
5.2.2 Saving Behavior: ........................................................................................................................ 29
5.3 Making Financial Choices: ............................................................................................................... 31
5.3.1 Familiarity with Financial Institutions: ...................................................................................... 31
5.3.2 Trust in Financial Institutions: ................................................................................................... 32
5.3.3 Assessment of the Quality of Financial Services: ...................................................................... 33
5.3.4 Contact with Financial Institutions: ........................................................................................... 33
5.3.5 Choosing a Financial Institution: ............................................................................................... 34
5.3.6 Factors Affecting the Choice of Financial Services Providers: ................................................. 34

4
5.3.7 Current Financial Services used by Respondents: ..................................................................... 36
5.3.8 Conflict Resolution with Financial Institutions: ........................................................................ 38
5.4 Staying Informed about Financial Matters:....................................................................................... 38
5.4.1 Access to media: ........................................................................................................................ 38
5.4.2 Observation of Trends: ............................................................................................................... 40
5.4.3 Main Sources of Information: .................................................................................................... 41
5.5 Financial Literacy: ............................................................................................................................ 43
5.5.1 Own Assessment: ....................................................................................................................... 43
5.5.2 Examples of Financial Literacy: ................................................................................................ 44
5.6 Financial Education Needs: .............................................................................................................. 49
5.6.1 Financial Training Courses Needed: .......................................................................................... 49
5.6.2 Financial Literacy Programs: ..................................................................................................... 50
6. Conclusions and Policy Recommendations: ........................................................................................... 51
7. References: .............................................................................................................................................. 57
8. Annexes: ................................................................................................................................................. 59

5
List of Tables__________________________________________________________
Table (1): Sampling Frame according to Number of Households
Table (2): Sampling Frame according to Type of Locality
Table (3): Sample Distribution according to Main Regions
Table (4): Sample Distribution according to Governorates
Table (5): Sample Distribution by localities
Table (6): Highest level of education attained
Table (7): Current main occupation status
Table (8): Current main occupation according to sector
Table (9): Household Income Ranges
Table (10): Keeping records of income and expenditures
Table (11): Spending and saving behavior
Table (12): Consumption Behaviour in cases of Increased Income
Table (13): Familiarity with financial institutions
Table (14): Trust in financial institutions
Table (15): Assessment of the quality of financial services
Table (16): Contact with financial institutions
Table (17): Financial services currently used by respondents
Table (18): Types of loans currently taken by respondents
Table (19): Duration of loans according to duration
Table (20): Financial services respondents were most often not satisfied with (over the last 5 years)
Table (21): Consumer trust in a quick and just resolution of conflict with financial institutions
Table (22): The use of internet including email
Table (23): Sources of Information for Market Changes
Table (24): Consumer analysis of time deposit and interest rates
Table (25): Consumer comparison of prices
Table (26): Making purchasing decisions
Table (27): Awareness of compensation from insurance
Table (28): Awareness of investment/productive loans
Table (29): Advice for working in dangerous professions

6
Table (30): Advice on Education Decisions
Table (31): Tracking of income and expenditures
Table (32): Preferred Aspects of Financial Training Courses for People
List of Figures_________________________________________________________
Figure 1: Distribution of respondents according to region
Figure 2: The number of family members (Ranges)
Figure 3: Distribution of respondents according to age groups
Figure 4: Ownership of various items
Figure 5: Respondents satisfaction with their lives
Figure 6: Management of household finances
Figure 7: Responses to managing income reduction
Figure 8: Unspent money allocation
Figure 9: Actions taken when facing financial difficulty
Figure 10: Saving behavior
Figure 11: Reasons behind saving
Figure 12: Reasons for not saving
Figure 13: Factors considered when choosing a financial institution
Figure 14: Opening a savings account - decision
Figure 15: Factors contributing to taking a bank loan
Figure 16: Type of insurance respondents currently have
Figure 17: Daily access to media
Figure 18: Market changes that respondents personally follow
Figure 19: Frequency in which respondents talk about financial institutions and services
Figure 20: Frequency in which respondents compare terms and conditions for provision of financial services before signing a contract for such a service.
Figure 21: Assessment of respondents own level of financial literacy
Figure 22: Responses to Bankruptcy
Figure 23: Individuals losses cases where the government should compensate for according
Figure 24: Organizations most suitable to provide financial literacy programs

7
1. Introduction: 1.1 Background and Objectives of the Survey:
The report includes the results and analysis of a representative household survey regarding levels of financial literacy and consumer financial awareness in the West Bank and Gaza. The survey was commissioned by the World Bank and it is aligned with the objectives of the World Bank’s (WB) Global Program on Consumer Protection and Financial literacy that was launched in 2010. The aim of the WB program is to help targeted countries achieve better consumer protection in financial services. The WB initiative has targeted both public and private sector agencies, and has sponsored comprehensive research projects with the objective of finding the best solutions for each individual country/region. The survey focuses on financial services such as banking, insurance, microfinance in terms of credit, savings and payment systems, and was designed to identify the level of financial awareness and familiarity with financial services providers in the West Bank and Gaza. The survey also tried to identify appropriate methods for expanding consumer education and strengthening consumer rights in the West Bank and Gaza. It is expected that the survey will support the objectives outlined by the Word Bank’s Financial Governance/Consumer Protection in Financial Services Program. A major objective of this survey is to provide regional data for the World Bank’s multi-national database. Thus, the inherent strengths of this initiative is that it will allow regional stakeholders the opportunity to draw upon both local and international data. Local, international, small and large-scale strategies can then be formulated by comparing the diagnostic reviews of local data to that of other survey countries. By learning from the successes and failures of other survey countries, more effective mechanisms for the improvement of consumer protection and financial literacy in the West Bank and Gaza can be established. The survey focuses on consumer protection and was designed with the goal of contributing to the development of the financial markets and national development agenda of the West Bank and Gaza. This supports the overall objective of the activity, which is to gather data to be used to develop a tool-kit for financial services and consumer protection in the West Bank and Gaza. The survey methodology was agreed with the World Bank and the detailed sampling was developed by Riyada Consulting and Training – as further illustrated in the methodology section of this report. In addition, a standard questionnaire was previously developed by the World Bank and was adapted to the Palestinian context by Riyada Consulting. The questionnaire was also shared with local stakeholders such as the Palestinian Monetary Authority, USAID and other departments of the World Bank. After the questionnaire was modified and subsequently finalized, Riyada collected the data in May, 2011 – the survey collected data from 2022 Palestinians in the West Bank and Gaza. Results of the survey have been used to define and evaluate the levels of financial awareness and familiarity with financial services providers, attitudes and opinions regarding the financial markets, household management of financial resources and use of financial services.

8
1.2 Literature Review: In the wake of the global financial crisis, much of the world has submitted itself to – voluntarily or by necessity – financial reform. Reform is considered vital as it is predicted that – According to World Bank estimates – two billion people throughout the world will enter the formal financial system in the next two decades (Zia 2011; World Bank 2008). This development is fueled by global trends of financial liberation, more globally accessible technology and private sector initiatives. Thus, many consider it imperative that financial reform strategies include mechanisms and tool-kits that would help societies adapt to these trends and ensure the financial security of at-risk populations. Current economic conditions in developing regions have raised serious concerns about the financial security of certain populations, especially those lacking the skills and resources to withstand – and when possible take advantage of – changes in the financial market. Research has attempted to confirm that an important component of financial security is financial education, which seeks to enhance financial literacy and consumer financial awareness. The Organization for Economic Co-operation and Development (OECD) defines financial education as:
“the process by which financial consumers/investors improve their understanding of financial products and concepts and, through information, instruction and/or objective advice, develop the skills and confidence to become more aware of financial risks and opportunities, to make informed choices, to know where to go for help, and to take other effective actions to improve their financial well-being”(2005).
Financial Literacy has been defined as “the ability to use knowledge and skills to manage financial resources effectively for a lifetime of financial well-being “(PACFL 2008). It is argued that lack of financial literacy leads to financial mistakes and imprudent financial practices. Improving the financial literacy and consumer financial awareness in any given society is a challenging task; it requires that consumers collect, process, and project data on various aspects of compound interest, inflation, risk diversification, and assets. Moreover, simply to avoid making financial mistakes, substantial knowledge and an effective analytical tool-kit is necessary (Ferguson 2002). In parts of the developing world, countries have sought to increase financial literacy by improving access to financial services and taking steps to ensure they are used appropriately. In other areas efforts have been made to establish statewide financial literacy and credit counseling centers offering cost-free financial counseling and education to both urban and rural populations (Zia 2010). Studies have shown that financial literacy levels are lowest in developing countries (Cole, Sampson and Zia 2009). In recent years, stakeholders have commissioned studies and employed researchers to understand which mechanisms work, how they work, and for whom they produce the most desirable results. The World Bank is clearly one of the largest stakeholders in this area and has commissioned a large number of studies and employed researchers and analysts to develop broad policy recommendations that can be adapted when necessary to fit specific geographic and socio-political settings.
9
Although many studies have been completed in recent years, there is very little evidence to prove that financial literacy has an impact on the well-being of a population. This may change in the near future as more evidence is collected by large studies and research projects. At this stage, a contextualized approach to financial literacy education, one that incorporates basic sensitivities to a particular region, cultural, institutional and ideological antecedents is considered to be the most agreeable avenue to increasing a target population’s financial security. Thus, comprehensive research and analysis on particular regions should be considered requisite to the design and implementation of financial education programs. The paper will first define and provide context for the terms/concepts of ‘financial literacy’ and ‘financial education’, so as to better establish a comprehensive understanding of the topic. Following this will be an analysis of the findings of a range of researchers who have arduously worked to extract empirical evidence from available data – this will include an investigation of key findings and results taken from completed studies on financial education/literacy. 1.2.1 Defining Financial Literacy and Education: In the context of financial literacy and education, it is important that the terms be properly defined so that evidence can be compared and analyzed within a more narrow and coherent paradigm. Researchers and stakeholders have been unable to come to a clear understanding as of how to define financial literacy. The term/concept has been defined and contextualized in various ways, including as a form of knowledge, ability or skill, a perceived knowledge, an advantageous financial behavior, and financial experiences. Of these, knowledge or understanding is most commonly inferred within the definition of financial literacy; contrastingly, many common definitions remain content with mere familiarity with financial concepts (Hung, Parker and Yoong 2009). Below we will examine a range of conceptual and operational financial literacy definitions. Hilgert, Hogarth, and Beverly define financial literacy as ‘financial knowledge’(2003), whereas Lusardi and Mitchell expand on this by adding that it is required knowledge of the most basic economic concepts needed to make reasonable financial decisions (2008). This basic knowledge – according to Lusardi – is the working of interest compounding, basics of risk diversification, and the difference between nominal and real values (2008). Contrasting these knowledge based conceptualizations are those who consider it to be a skill or ability; Mandell defines the term as “the ability to evaluate the new and complex financial instruments and make informed judgments in both choice of instruments and extent of use that would be in their own best long-run interests” (2007). Schagen follows the vein of Mandell, Lusardi, and tufano by emphasizing judgment and decision making in his definition of the term – “the ability to make informed judgments and to take effective decisions regarding the use and management of money” (1997). Others argue that the basis for financial knowledge and other aspects of financial literacy must include practical experience (Moore 2003). Literature reveals that ‘financial knowledge’ – considered by many to be central to financial literacy – is distinguishable from ‘general knowledge’. Scholars have found that finance specific knowledge is more valuable than general knowledge when predicting hypothetical outcomes of investment tasks (Parker et al. 2008). Other literature suggests that cognitive abilities including different types of knowledge tend to be mutually supporting (Stanovich and West 2000; Jenson 1998). According to the PACFL, financial
10
knowledge and skills are gained through ‘financial education’ (2008). Thus, financial education as a concept should be firmly connected to the promotion of financial literacy. While the concept of financial literacy has become increasingly prominent in regards to processes and mechanisms used for financial reform, many questions have yet to be adequately answered. At this stage, a contextualized approach to financial literacy education, one that incorporates basic sensitivities to a particular region, cultural, institutional and ideological antecedents is considered to be the most agreeable avenue to increasing a target population’s financial security. Thus, comprehensive research and analysis on particular regions should be considered requisite to the design and implementation of financial education programs. 1.2.2 Measuring Financial Literacy: Global efforts to improve financial literacy have utilized varying approaches to asses and measure the level of financial literacy in a particular population. The way in which researchers define and measure financial literacy has been subject to wide debate and disagreement. For example, the OECD approach utilizes cross-country high-level financial literacy indicators while the World Bank has primarily used cross-country consumer financial awareness surveys. Other methods of measurement have sought to gauge both quantitative and qualitative factors – it is argued that these are complementary rather than competing approaches (Zia 2010). While these methods vary, the measurement of financial literacy generally involves an attempt to find a causal relationship between financial education and financial literacy, or between financial literacy and social well-being. Raw data for analysis and measurement is generally collected through surveys. An expert in the field, Bilal Zia contends that “while survey analysis can control for all observable variables … such as income, gender, age, education, etc., there may be some unobserved variables, such as ability, that may be driving the positive correlation between financial literacy and use of financial services” (2010). Espoused with cynicism, Zia offers that those who participate in surveys or financial literacy seminars may vary significantly – in regards to their interests in financial matters – to those who choose not to participate; thus, according to Zia, ‘positive correlation’ may be instead driven by endogenous selection. Zia argues that data collected and analyzed from surveys cannot provide enough evidence to distinguish the causality of financial literacy; thus, “greater financial literacy may lead to greater use of financial services, or just as likely, individuals who use more financial services may score better on the financial literacy assessments based on their experience in financial markets” (2010). 1.2.3 The Utilization of Available Data: Regarding available data, it is argued that the large discrepancies in measured financial literacy puts some of the more economically vulnerable groups at an even greater disadvantage – i.e. the poor, under-educated and minority households (Hung, Parker and Yoong 2009). According to some, these measures are linked to suboptimal behavior; Hilgert, Hogarth and Beverley contend that individuals with more financial knowledge are more likely to engage in recommended financial practices (2003). Moreover, Lusardi and Mitchell find that among adults, those who exhibited higher levels of financial knowledge were more likely to plan ahead, and to invest in complex assets (2006). Others argue that when it comes

11
to decision making, financial literacy is a secondary concern; this is based on the fact that results of financial education programs have thus far been collectively inconclusive (Hung, Parker and Yoong 2009). Furthermore, as behavioral patterns are difficult to measure, studies may not always recognize subtle changes. For example, the results of a survey may lack the statistical power to accurately detect small changes (Zia 2010). 1.2.4 Financial Literacy Programs: Global concern has brought the topic of financial literacy to a forefront of financial debate due to the perception that many people have an innate predisposition to making poor financial decisions – a predisposition that – in theory – could be altered with a suitable intervention strategy. Developing mechanisms of change in this context brings with it several intrinsic challenges; for example, certain methods of financial education may not be effective on certain groups of people. Furthermore, evaluating the efficacy and impact of financial literacy programs has also been a major challenge. Research has revealed only minimal impacts of these programs, particularly when considering factors such as peer effects and recognized behavioral biases (Duflo and Saez 2004). Lack of consensus regarding this matter mirrors the finding of a 2006 report by the Financial Literacy and Education Commission, that concluded that “a systematic method of evaluation of financial literacy programs does not exist” (Hung, Parker and Yoong 2009). 1.2.5 Conclusion: Evolving market economies have opened the door of opportunity for consumers, investors, workers, and companies. However, with opportunity comes an abundance of choices that may be overwhelming for many. Increasingly, making the best decisions regarding available opportunities places heavy demands on those unsure of how to make ‘sensible’ choices (Lerman and Bell 2006). Thus, the concept and innate socio-economic value of financial literacy has become a focus of many grass-roots consumer and community interest groups, government agencies, major banking firms, and other organizations; i.e. the World Bank has established a $15 million Trust Fund on Financial Literacy. Policy makers and other stakeholders have become concerned that consumers lack a working knowledge of basic financial concepts. It is argued that they are deficient of the tools needed to make wise decisions that would be advantageous to their overall well-being (Zia 2010). Researchers have attempted to use survey evidence to prove that there are strong positive correlations between financial literacy and various development indicators. Also, several studies have sought to prove that low levels of financial literacy cause risky financial behavior. It has been argued that those with less financial literacy borrow at higher interest rates, often do not have a sufficient retirement plan, acquire fewer assets, and participate less in the formal financial systems (Zia 2011; World Bank 2010). With support from international organizations such as the World Bank, data is currently being gathered to establish empirical evidence to these and other claims regarding financial literacy and education. The World Bank has been a major player in this field, and has continued to contribute to these objectives by commissioning studies and field experiments throughout the world.
12
2. Executive Summary: This comprehensive report titled ‘Financial literacy and Consumer Awareness Survey in the West Bank and Gaza’ was commissioned by the World Bank with aim to establish a better understanding of the levels of financial literacy and consumer awareness in the West Bank and Gaza. The quantitative and qualitative research and analysis of this study focused on the financial literacy and consumer awareness of the Palestinian people and was conducted via a literature review and a comprehensive survey. In order to provide the World Bank with a comprehensive evaluation of the financial literacy and consumer awareness in the West Bank and Gaza, a broad-based literature review was conducted. The literature review is split up into four sections, each building upon the next. The sections include: defining financial literacy and education; measuring financial literacy; utilization of available data and financial literacy programs. Following this, the research team conducted a comprehensive survey that was thoroughly analysed and broken down into key findings that are presented in the findings section of this report. These findings are divided into six sub-sections that include: money management, making ends meet; planning and provisioning for the future; making financial choices; staying informed about financial matters; financial literacy and financial education needs. The report concludes with a series of policy recommendations based on the literature review, the key findings of the survey, and on supplementary research. Below is a brief summation of the report. The research methodology for this study constituted mainly of a general literature review and a comprehensive quantitative survey. The quantitative survey sample is a three-stage stratified cluster sample of 2022 persons (2022 households). The margin of error in the main key variables is approximately 2.5% on the entire sample size. The survey targeted people aged 18 years and above, in the West Bank (excluding Ramallah), Ramallah and Gaza Strip. Researchers ensured that the sample was representative of geographic representation, economic activity, economic sectors, poverty levels, age groups, gender and availability and the overall condition of public infrastructure. The socio-demographic composition of the sample is provided in detail among the following sub-sections: location; locality; gender, position in the family and number of household members; age distribution; levels of education; employment; income; ownership of basic properties and language skills and satisfaction with own life and expectations for the future. Key Findings: This section includes the key findings of the study. These findings are split up into six subsections and are summarized below. Financial Planning: Data has confirmed that financial planning leads to an increase in saving; 41.1% of respondents who plan their household’s finances save money, while only 26.1% of those who do not plan their household’s finances save money. Furthermore, 25.8% of respondents who keep records of income and expenditures claimed to always have unspent money (from income) at the end of each month, compared to 10.4% of those who do not. About 57.9% of the respondents claimed to have not borrowed money – during the last year – to pay back debts. Over half (50.8%) of the respondents had debts, of these, 21.4% revealed that

13
their current debts exceed their annual income. The majority (73.7%) of the respondents who had disposable income over the last year chose to keep this unspent money as cash; thus, illustrating either a mistrust of financial service providers, lack of knowledge of financial services, or lack of access to financial services. Moreover, research shows that a moderate percentage of respondents incorporate financial planning practices into their households; however, the majority of respondents lack any sort of financial planning. Financial Behavior: Data shows that those who are more satisfied with their lives save more money than those who are not. Approximately 39.4% of the respondents who claim to have a high level of life satisfaction save money, whereas only 18.3% of those who claimed to be dissatisfied with their lives save money. The study also found that those living in camps have the most difficult time saving, while large households save more than smaller ones. Furthermore, most Palestinians (97.7%) save to prepare themselves for unexpected expenses. Regarding those respondents who do not save, 94.6% claimed it was because of their low income level. Few (11.7%) stated that they do not save because they do not trust financial service providers. Moreover, 59.6% of the respondents spend all their income and do not save anything. Financial Choices: The study found that overall, trust in financial institutions was low; only 19.2% of the respondents indicated that they ‘mostly’ trust commercial banks, and only 13.2% trust insurance companies. Furthermore, data indicates that a bank’s reputation is the most important factor (according to 43.1% of survey respondents) when opening a savings account; this finding proved accurate when cross referenced with locality, gender, age groups, and education level. Over the last five years, 60% of the respondents claimed to be satisfied with all of the financial services they were employing, while only 10.9% were unsatisfied with the financial services they had received. Data shows that the most commonly used financial services in the West Bank and Gaza are insurance policies (50.4%); of these 65.2% are medical insurance policies. Regarding loans, 91.9% taken out were consumer loans, most (31.5%) for 1-2 years. Data revealed that people believe that commercial banks offer the best quality of financial services, although many respondents had never had contacts with financial institutions during the last 5 years (see table 16). Research has revealed that the level of familiarity a person has with particular financial institutions has an effect on whether or not that person trusts the institution; thus it can be concluded that financial education should be considered a viable method to increasing a population’s trust, familiarity, and overall use of financial services. Furthermore, the most familiar with financial services were highly educated, male (36.9%, compared to 18.1% for females), and between the age of 21-35. The survey also revealed that 51% of respondents who had unspent money from month to month would deposit it or keep it in a bank and that 24% of respondents would use new additional income to open an interest-bearing bank deposit. In terms of access to banking savings products, 34% of the respondents had a current account, 6% had bank deposits and 9% had debit cards. These figures indicate a significant level of financial access, along the lines of the results of the IMF’s Financial Access Survey (which indicated that 54.3% of adults in 2009 had deposits with banks).

14
Financial Information: The study found that frequent access to media increases levels of financial literacy, and (mass media) is considered by most to be the most suitable tool for spreading/increasing a population’s financial literacy. Furthermore, the study shows that 80.8% of Palestinians watch TV on a daily basis, while a lesser percentage listen to the radio daily (34.9%) and even less read newspapers daily (14.8%). The study also reveals that 56.5% Palestinians in the West Bank and Gaza know how to use a computer and 46.5% know how to use the internet. Financial Literacy: When self-assessing levels of financial literacy, only 5.3% of those surveyed stated that they have excellent knowledge and skills regarding financial issues. Data reveals that 38% of the respondents indicated that they have satisfactory knowledge and skills, 27.6% good knowledge and skills and 15.4% have unsatisfactory knowledge and skills. Whereas 11.9% of the respondents stated that they do not have any financial knowledge or skills. The study revealed that 55.7% of those who claim to have excellent knowledge and skills in regards to financial matters plan their household’s finances by making budgets and/or recording their expenses, compared to only 23% of those who admit to not having any financial knowledge. Financial Education – Needs: The study shows that the need for financial education is high and that most (53.1%) believe that mass media organizations are the most capable of providing populations with financial literacy programs; this was followed by 28.3% who believe that commercial banks are the most suitable, and 17.9% who contend that NGOs or public institutions are the most suitable. Around 74.8% of those surveyed indicated interest in training courses on information that a consumer should pay attention to when signing a contract with a financial institution. Conclusions: The study has revealed that, low financial literacy in the West Bank and Gaza has been – to a certain extent – due to less access to financial services in the region. The survey data shows that there is a substantial disparity among the West Bank and Gaza in regard to financial literacy, with areas in the West Bank (e.g. Southern West Bank) showing lower levels of financial literacy. Lastly, the levels of financial literacy and awareness among residents of refugee camps are much lower than other regions, again showing strong linkages between political situations and financial access and financial literacy. Further, data has indicated that the lowest levels of financial awareness and literacy were consolidated within Gaza and the Southern West Bank region. Women, seniors, those with less education and those residing in refugee camps also were shown to have low levels of financial literacy and consumer awareness. The study has indicated that overall, the people of the West Bank and Gaza are too often unprepared for unexpected financial problems; thus, financial education initiatives are essential to increasing the financial knowledge and literacy of those currently incapable of making sufficient financial provisions for the future – a future that many predict to be unstable at best. Moreover, the results of this
15
study should be taken into consideration when developing specific strategies and strategic policy mechanisms aimed at increasing financial knowledge, awareness, literacy, and capability among the people living in the West Bank and Gaza. Recommendations: This sub-section provides a few core policy recommendations (as seen below). Each recommendation is justified and explained by the ‘rationale’ behind it, and is followed by proposed remedial action. However, further analysis is required to ascertain the correlation between these factors, thereby determining adequate policy recommendations on improving financial literacy in the region. � Given the positive responses, mass media is likely to be an effective channel for financial literacy
and consumer awareness in the West Bank and Gaza. Therefore, further research must be carried out to assess the utility of mass media for this purpose.
� Preliminary inferences indicate that financial literacy and consumer awareness may be improved by incorporating these issues into the educational system, preferably at early stages.
� Measures should be developed to strengthen the relationship between financial institutions and consumers, as the survey results show strong scope for improvement in financial literacy and capability through such direct interaction and increased consumers’ familiarity with financial services.
� Palestinian Monetary Authority may consider publishing more information gathered by its Consumers’ Relations and Market Conduct Department –or requiring information to be published by financial institutions– regarding consumer protection issues, such as statistics on consumer complaints and disputes, customer satisfaction surveys, mystery shopping reports, etc., in order for consumers to know more about the quality of services provided by financial institutions and thus to increase their trust on financial institutions.
� Financial literacy programs should incorporate topics on capital markets and the stock exchange. Given the level of interest in these topics and the easier access to technology such as internet, a relevant number of consumers, including those less financially educated, seem likely to invest in risky products. Thus policymakers should educate households on possible risks of such investments and ways to minimize risks while investing in financial markets.
� Given the high level of access to mobile phones, financial literacy programs could use this technology. However, additional research needs to be carried out on how customers use this service and the type of information they seek on mobile phones. A number of pilot projects, such as by Grameen Foundation, have been implemented in a number of countries; the results of these pilots will be helpful in developing a customized program for West Bank and Gaza.
� In building programs to attract more customers to open bank accounts, policy-makers should assess both the demand and supply side factors that have resulted in the current low levels of usage. Although lack of trust and inadequate services are leading issues related to the supply of financial services, demand-side economic factors such as ‘cash-only’ sales and financial capability should also be considered.
Overall, financial education initiatives should be developed to increase financial knowledge, strengthen capacity and promote responsible financial behavior among the most marginalized populations of the West Bank and Gaza, i.e., seniors, women, youth, residents of refugee camps, and rural populations.

16
3. Survey Methodology and Empirical Approach: The research methodology was mainly constituted of a general literature review and a comprehensive quantitative survey. The following sections describe the sampling methodology and data collection methods applied. Target Population
The target population is comprised of all Palestinians of the age group 18 – 65 years old residing in the territories of the West Bank and Gaza.
Sampling Frame
The sampling frame included all geographical locations in which the target population resides. The sampling frame was used to select the sample of locations for the survey. It also included the type of localities (urban, rural and refugee camps) and population size in each location. This information was taken into consideration in designing the survey sample.
Sampling Frame Distribution:
The following table provides the distribution of Palestinian households by governorates according to data available on the Census of 2007:
Table (1): Sampling Frame according to Number of Households: Governorate Total Number of Households West Bank: Jenin 47,437 Tubas 9,004 Tulkarem 29,938 Nablus 59,663 Qalqilia 16,483 Salfit 11,103 Ramallah and Al Bireh 52,834 Jericho 7,615 Jerusalem 70,434 Bethlehem 32,667 Hebron 89,919 Subtotal 427,097 Gaza Strip: North Gaza 40,262 Gaza 76,810 Deir Al Balah 32,083 Khan Yonis 43,203 Rafah 26,863 Subtotal 219,221 Total 646,318
17
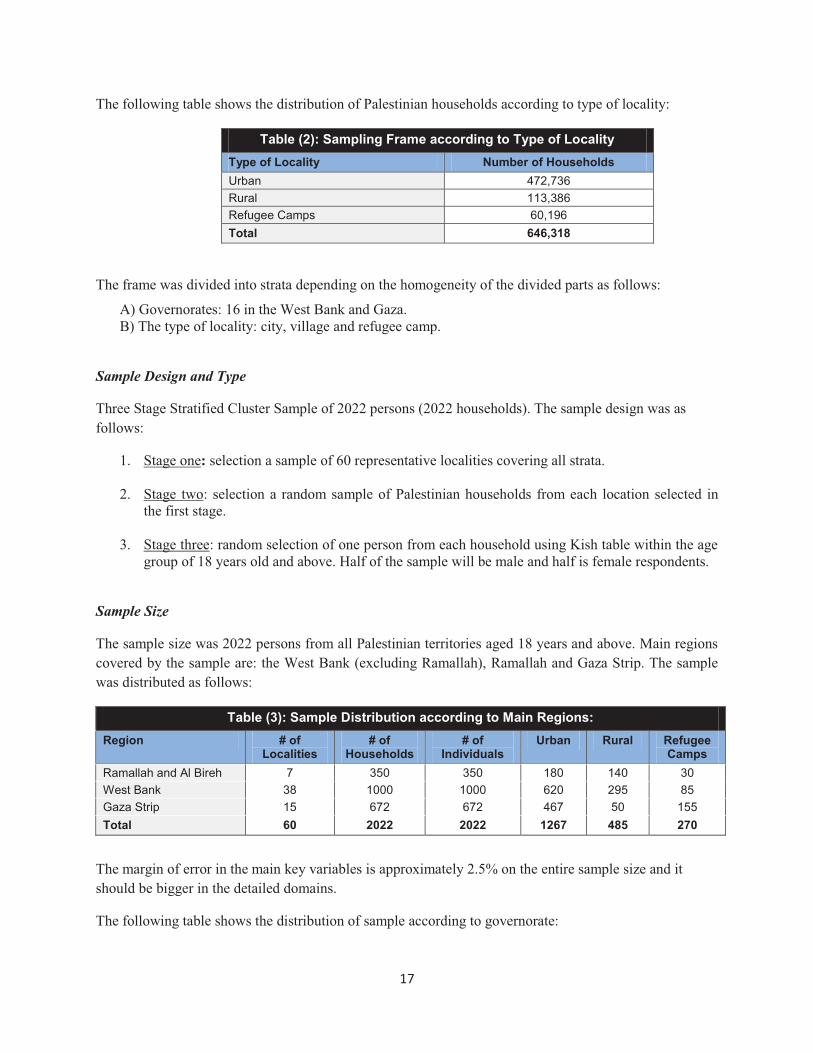
The following table shows the distribution of Palestinian households according to type of locality:
Table (2): Sampling Frame according to Type of Locality Type of Locality Number of Households Urban 472,736 Rural 113,386 Refugee Camps 60,196 Total 646,318
The frame was divided into strata depending on the homogeneity of the divided parts as follows:
A) Governorates: 16 in the West Bank and Gaza. B) The type of locality: city, village and refugee camp.
Sample Design and Type
Three Stage Stratified Cluster Sample of 2022 persons (2022 households). The sample design was as follows:
1. Stage one: selection a sample of 60 representative localities covering all strata.
2. Stage two: selection a random sample of Palestinian households from each location selected in the first stage.
3. Stage three: random selection of one person from each household using Kish table within the age
group of 18 years old and above. Half of the sample will be male and half is female respondents.
Sample Size
The sample size was 2022 persons from all Palestinian territories aged 18 years and above. Main regions covered by the sample are: the West Bank (excluding Ramallah), Ramallah and Gaza Strip. The sample was distributed as follows:
Table (3): Sample Distribution according to Main Regions: Region # of
Localities # of
Households # of
Individuals Urban Rural Refugee
Camps Ramallah and Al Bireh 7 350 350 180 140 30 West Bank 38 1000 1000 620 295 85 Gaza Strip 15 672 672 467 50 155 Total 60 2022 2022 1267 485 270
The margin of error in the main key variables is approximately 2.5% on the entire sample size and it should be bigger in the detailed domains.
The following table shows the distribution of sample according to governorate:

18
Table (4): Sample Distribution according to Governorates: Governorate # of Localities # of Households # of Individuals West Bank: Jenin 4 130 130 Tobas 3 45 45 Tulkarem 3 80 80 Nablus 6 165 165 Qalqilia 2 45 45 Salfit 2 45 45 Ramallah and Al Bireh 7 350 350 Jericho 3 45 45 Jerusalem 6 175 175 Bethlehem 3 80 80 Hebron 6 190 190 Subtotal 45 1350 1350 Gaza Strip: North Gaza 3 121 121 Gaza 3 236 236 Deir Al Balah 3 98 98 Khan Younis 3 132 132 Rafah 3 85 85 Subtotal 15 672 672 Total 60 2022 2022
Sample Representation:
The researchers ensured that the sample is representative of the following during the field work:
1) Geographical representation: the sample distribution covers all governorates of the West Bank (including Jerusalem) and Gaza strip, thus provides a comprehensive geographical representation.
2) Economic Activity: in general, Ramallah and Al Bireh governorate is considered the economic and commercial center and thus was given a higher weight in the sample compared to the rest of the localities.
3) Economic Sectors: the sample covered different economical sectors such as employees of industrial, services and commercial sectors (usually in the main cities), workers in the agricultural sector (rural areas) and workers in the informal sector (mostly in Gaza).
4) Poverty levels: the sample covers poor localities as provided by statistics. In general, Gaza is considered poorer than the West Bank. Also, refugee camps and some localities particularly in North West Bank are considered poorer than the rest of localities and the above sample distribution provides coverage of such localities.
5) Age Groups: the sample covered all age groups above the age of 18. The reason behind selecting the starting age to be 18 is the fact that it is within this age that an individual is expected to become involved with financial transactions and thus will be dealing with financial services.
6) Gender: the sample was gender balanced; half of the respondents were males and half were females. This corresponds with the gender distribution of the Palestinian Territories.
7) Infrastructure: the sample covered central and remote localities to guarantee representation of poor versus good infrastructure and availability of services including financial services.

19
4. Socio-Demographic Composition of the Sample:
4.1 Location: The sample distribution was 66.8% West Bank and 33.2% Gaza Strip. The following figure illustrates the sample distribution according to region:
Figure 1: Distribution of respondents according to region
4.2 Locality: Data shows that most of the respondents, as further illustrated in the table below:
Table (5): Sample Distribution by localities: Locality Percentage City 57.7% Village 29.2% Camp 13.1%
4.3 Gender, Position in the Family and Number of Household Members: Regarding gender, 52.4% of the respondents were males, and 47.6% females. Notably, the household head (The person who is responsible or in charge of economic and financial matters within the family) constituted 37.7% of the total respondents, whereas 36.3% are the spouse of the household head, 23.4% are the child (sons, daughters) of the household head, 1.1% are the sibling of the household head and few (0.6%) are the parents of the household head.
25.2%
28.1% 13.4%
33.2% North west bank
Central west bank
South west bank
Gaza strip

20
Figure 2: The number of family members (Ranges)
4.4 Age Distribution: The age distribution of the total sample is presented in the chart below.
Figure 3: Distribution of respondents according to age groups
4.5 Levels of Education: The results show that most respondents attained at least primary and basic education (1-10 classes); the following table illustrates the level of education of the sample:
Table (6): Highest level of education attained: Levels Percentage No school or primary (1-4 classes) 4.8% Basic school(5-10 classes) 25% Secondary(high) school (all 12 classes) 32.3% One-year or two-year vocational school (reduced program) 7% Three-year vocational school and apprentice 0.9% Four-year vocational school and apprentice 9.2% Post-secondary school, associate degree 3% College, academy, technical college 14.9% Masters degree 2.4% Doctoral studies 0.3% Don’t know/ Doesn’t want to respond 0.1%
0%
10%
20%
30%
40%
50%
60%
1-4 5-8 9-12 13-16 17-20
33.1%
52.5%
12.6% 1.3% 0.2%
0% 5% 10% 15% 20%
18- 20 21- 25 26- 30 31- 35 36- 40 41- 45 46- 50 51- 55 56- 60
61 and higher
8.0% 14.4%
17.9% 13.7%
13.3% 10.1%
7.9% 5.2%
4.5% 5.0%

21
According to region, the survey shows that Southern West Bank respondents have the highest rate of attending at least primary and basic education, with a percentage of 79%, followed by Gaza respondents with 74.1%, then North West Bank with 67.9%, and finally, Central West Bank with 63.1%. Notably, Southern West Bank has the highest percentages when it comes to technical and vocational education, while Gaza and Northern West Bank have higher percentages of respondents with formal university/ college education.
Interestingly, the Central West Bank has the lowest education rate. Data shows that financial literacy is highest in the Central West Bank and that the majority of Palestine’s financial institutions are located in the Central West Bank. Thus, when considering survey data, there is not conclusive evidence that shows that level of education is directly related to levels of financial literacy. Rather, data reveals that greater access to financial services may result in higher levels of financial literacy.
In regards to gender, 6.5% of female respondents have had no school or only primary education (grades 1-4), compared to 3.3% of male respondents. Data shows that females have a higher percentage of college/academy and secondary school education than males, while males have a higher level of vocational education/training. These statistics are in-line with the socio-cultural norms present in the West Bank and Gaza territory – women are often under-represented and marginalized in the male led workforce.
4.6 Employment: The survey findings regarding the current main occupation status of people living in the West Bank and Gaza are outlined in the table below (Table 7).
Table (7): Current main occupation status: Occupation Percentages Housewife 31% Employee 21.5% Other status of employed persons (daily worker, black market worker etc.) 10.3% Business owner 10.2% Pupil, student 8.3% Registered as unemployed 4.9% Unregistered unemployed (no longer receives an unemployment allowance / support allowance and looks for work)
4.9%
Self-employed person in non-agricultural activities (include PFA, AF, liberal professionals) 2.1% Self-employed person in agricultural activities 1.9% Person unable to work 1.6% Retired - due to age 1.5% Another status of non working person (pre-school, dependant) 1.1% Family helper 0.5% Retired - other causes 0.2% Other data collected shows that (of the respondents) the highest level of unemployment was in Gaza, and overall, most of the unemployed respondents were living in refugee camps. Furthermore, most of the respondents who were self employed worked in the agricultural sector and in rural areas (clustered villages).
22
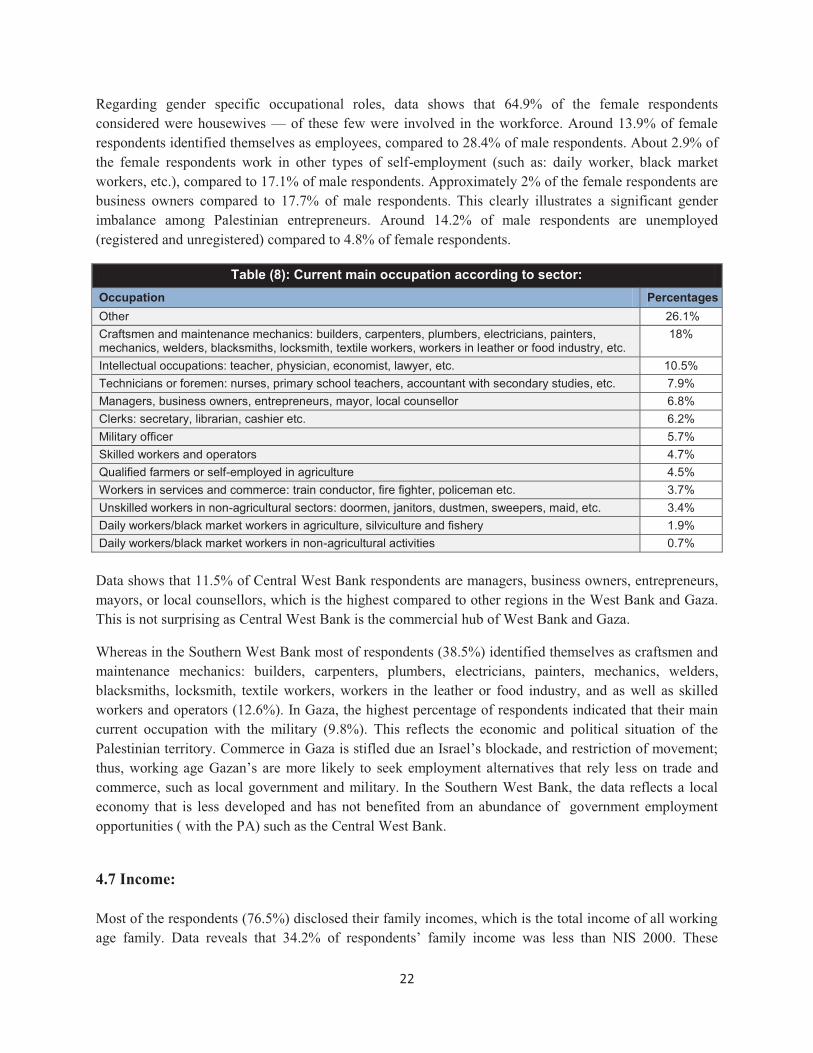
Regarding gender specific occupational roles, data shows that 64.9% of the female respondents considered were housewives — of these few were involved in the workforce. Around 13.9% of female respondents identified themselves as employees, compared to 28.4% of male respondents. About 2.9% of the female respondents work in other types of self-employment (such as: daily worker, black market workers, etc.), compared to 17.1% of male respondents. Approximately 2% of the female respondents are business owners compared to 17.7% of male respondents. This clearly illustrates a significant gender imbalance among Palestinian entrepreneurs. Around 14.2% of male respondents are unemployed (registered and unregistered) compared to 4.8% of female respondents.
Table (8): Current main occupation according to sector: Occupation Percentages Other 26.1% Craftsmen and maintenance mechanics: builders, carpenters, plumbers, electricians, painters, mechanics, welders, blacksmiths, locksmith, textile workers, workers in leather or food industry, etc.
18%
Intellectual occupations: teacher, physician, economist, lawyer, etc. 10.5% Technicians or foremen: nurses, primary school teachers, accountant with secondary studies, etc. 7.9% Managers, business owners, entrepreneurs, mayor, local counsellor 6.8% Clerks: secretary, librarian, cashier etc. 6.2% Military officer 5.7% Skilled workers and operators 4.7% Qualified farmers or self-employed in agriculture 4.5% Workers in services and commerce: train conductor, fire fighter, policeman etc. 3.7% Unskilled workers in non-agricultural sectors: doormen, janitors, dustmen, sweepers, maid, etc. 3.4% Daily workers/black market workers in agriculture, silviculture and fishery 1.9% Daily workers/black market workers in non-agricultural activities 0.7% Data shows that 11.5% of Central West Bank respondents are managers, business owners, entrepreneurs, mayors, or local counsellors, which is the highest compared to other regions in the West Bank and Gaza. This is not surprising as Central West Bank is the commercial hub of West Bank and Gaza.
Whereas in the Southern West Bank most of respondents (38.5%) identified themselves as craftsmen and maintenance mechanics: builders, carpenters, plumbers, electricians, painters, mechanics, welders, blacksmiths, locksmith, textile workers, workers in the leather or food industry, and as well as skilled workers and operators (12.6%). In Gaza, the highest percentage of respondents indicated that their main current occupation with the military (9.8%). This reflects the economic and political situation of the Palestinian territory. Commerce in Gaza is stifled due an Israel’s blockade, and restriction of movement; thus, working age Gazan’s are more likely to seek employment alternatives that rely less on trade and commerce, such as local government and military. In the Southern West Bank, the data reflects a local economy that is less developed and has not benefited from an abundance of government employment opportunities ( with the PA) such as the Central West Bank.
4.7 Income: Most of the respondents (76.5%) disclosed their family incomes, which is the total income of all working age family. Data reveals that 34.2% of respondents’ family income was less than NIS 2000. These

23
households live below the poverty line which was set at NIS 2237 by the Palestinian Central Bureau of Statistics in 2010 (PCBS, 2010).
Table (9): Household Income Ranges: Income Ranges: Family Income Less than 1000 NIS 12.5% 1000-2000 NIS 21.7% 2000-3000 NIS 15.4% 3000-4000 NIS 8.7% More than 4000 NIS 18.2% No income 4.7% Do not know 9.1% No answer 9.8%
In a regional context, Central West Bank respondents have the highest family income range (NIS 4000 and more), with a percentage of 35%, followed by Northern West Bank (17.3%), Southern West Bank (15.5%), and Gaza (6%).
The data indicates that the highest percentage of levels of income for Central West Bank were concentrated in the income range of (NIS 4000 and more), while the family incomes of the other three regions were concentrated in the NIS 1000-2000 range. These figures can explained by the fact that the Central West Bank is the area where most political and economic activities take place and companies, banks, NGOs, ministries and government institutions, have their headquarters. The lower income range among other regions reflects a lower cost of living, the Israel Blockade (Gaza) and economic hindrances caused by the Israeli occupation, e.g., the Separation Wall, checkpoints, settlements, etc.
4.8 Ownership of Basic Items (personal possessions), area of residence, and Language: As the following graph illustrates, the majority of respondents own mobile phones, followed by computers. Almost half of the respondents have access to the internet.
Figure 4: Ownership of various items:
Most (70.6%) of the people surveyed live in a central location within their city, town, or village. About 56% of the respondents considered their homes to be in a good area.
0% 20% 40% 60% 80% 100%
Car
Linetelephone
Access to internet
Computer (PC)
Mobile phone
28.0%
49.3%
51.8%
66.0%
95.4%

24
Regarding language, the most common second language of the respondents was English (35.6%), with only 14.2% revealing that they had knowledge of the Hebrew language.
4.9 Quality of life and expectations: More than half of the respondents (58.5%) indicated that they are very satisfied/ satisfied with their quality of life, whereas 41.1% were strongly dissatisfied/ dissatisfied. As for their expectations for the future, 47.2% claimed that their life would be better within the next 12 months.
Figure 5: Respondents satisfaction with their lives:
Moreover, most Northern (65.3%) and Central (61.6%) West Bank respondents are satisfied with their life, compared to Gaza (54.2%) and Southern West Bank (49.4%). Slightly more than 50% of respondents from each region believe that their life will become better in the coming year. The exception was the respondents from the Southern West Bank – only 29.5% were optimistic about the future. Respondents who were aged 18-20 were the most satisfied with their life, and those aged 41-45 and 51-55 were the most dissatisfied with their life.
Data shows that women have more satisfaction with life (62.9%) than males (54.4%). Furthermore, female respondents claimed to be more optimistic about the future than men; however.
Data also reveals a correlation between level of education and one’s satisfaction with life. According to the survey, respondents holding higher educational degrees are slightly more satisfied with life than those with lower levels of educational levels. Respondents with no school or only primary education (grades 1-4) were significantly more dissatisfied with their lives.
Quality of life (life satisfaction) levels were found to be higher among employees, family helpers and students respondents than among those in other categories. The highest level of dissatisfaction was among respondents who were unemployed, retired, or working in the agricultural sector (self employed).
0% 10% 20% 30% 40% 50% 60%
I don't know
Very satisfied
Strongly dissatisfied
Dissatisfied
Satisfied
0.4%
3.5%
8.3%
32.8%
55.0%

25
5. Findings:
5.1 Money Management, Making Ends Meet:
5.1.1 Budgeting: Data shows that a moderate percentage of respondents incorporate financial planning practices into their households; however, the majority of respondents lack any sort of financial planning.
Educated respondents plan their household’s finances more often than those with lower levels of education. In fact data reveals that the higher the level of education, the more likely people would practice financial planning, i.e., doctoral level (57.1%) compared to college/academy level (53.5%). Furthermore, only 10.5% of respondents with up to or less than primary (grade 1-4) levels of education planned their household’s finances.
Figure 6: Management of household finances
In a regional context, 48.2% of those surveyed in the Northern West Bank claimed to have planned their household’s finances by making a budget or recording expenses, compared to 35.7% in Gaza, 29.7% in the Southern West Bank and 27.9% in the Central West Bank.
The survey results confirmed that respondents who plan their household’s finances (by making a budget or recording expenses) save more than those who do not plan their household’s finances, as 41.1% of respondents who plan their household’s finances save money, while only 26.1% of those who do not plan their household’s finances save money. This correlation is not in itself conclusive, as survey data has revealed that those with lower incomes are less likely to save. 5.1.2 Keeping Monthly Records: At a regional level, data shows that Southern West Bank respondents (21%) were most likely to have kept records of their finances, whereas Gazans were the most likely to not have kept records (money spent and/or received).
59.2%
35.9%
4.9%
0.0%
10.0%
20.0%
30.0%
40.0%
50.0%
60.0%
70.0%
Do not plan their household's finances
Plan their households finacnes
Do not know

26
Table (10): Keeping records of income and expenditures:
Answers Percentage No, we don’t keep records of everything, but we know in general how much money is received and spent during a month.
50.2%
No, we don’t keep records of family’s resources, and we don’t have even a vague idea of how much money is received and spent during a month
21.2%
Yes, we keep records of everything, but not all revenues and expenditures are entered 14.6% Yes, we keep records of everything, entering all revenues and all expenditures 10.2% Don’t know 3.7%
Respondents with higher educational levels tend to keep financial records of different types much more than those with lower educational levels, e.g. 22.4% of respondents with masters degrees claim to keep good records of their finances – entering all revenues and expenditures – while respondents with no or only basic education were most likely to not have kept any financial records.
Respondents who plan their household’s finances (by making budget or recording expenses) were more likely to keep records of their income and expenditure, while respondents who do not plan their household’s finances were less likely to keep records of family income and expenditures.
Data shows that those who keep records of their income and expenditures have less debt than those who do not. Approximately 41.7% of respondents who claimed to have kept records of income and expenditures are in debt, while 56.9% of respondents who do not keep records of income and expenditures have outstanding debts. From this, one might conclude that managing household finances and keeping records of income and expenditures is a good way to reduce the chance of accumulating debt. Thus, those who record their income and expenditure are more aware of their revenues and expenditures; thus, there is a heightened awareness of when to increase savings and reduce spending so as to avoid unwanted debt.
5.1.3 Managing Debts: About 57.9% of the respondents claimed to have not borrowed money during the last year to pay back debts. Over half (50.8%) of the respondents had debts, and 21.4% of them revealed that their current debts exceed their annual income.
Data indicates that planning household’s finances does not have a significant effect on the possibility of getting into debt – as debt is oftentimes deliberate, and is not always a sign of financial instability. In fact, data indicates that those with debts are more likely to make budgets, as they are in a position where they cannot afford to make financial errors. Not surprisingly, data shows that those with debts are less likely to save money – 13.6% of respondents who have debts save money, compared to 49.8% of respondents who do not have debts.
5.1.4 Coping with Financial Shocks: Around 42.4% of the respondents experienced unexpected significant reduction in their income over the last three years. Approximately 45.9% attributed this loss to the occupation (loss of land, restrictions on
27
movement, etc), while 35.9% claimed that it was due to salary reduction or delays in salary payments; 17.5 of the respondents claimed that their loss was related to the economic crisis.
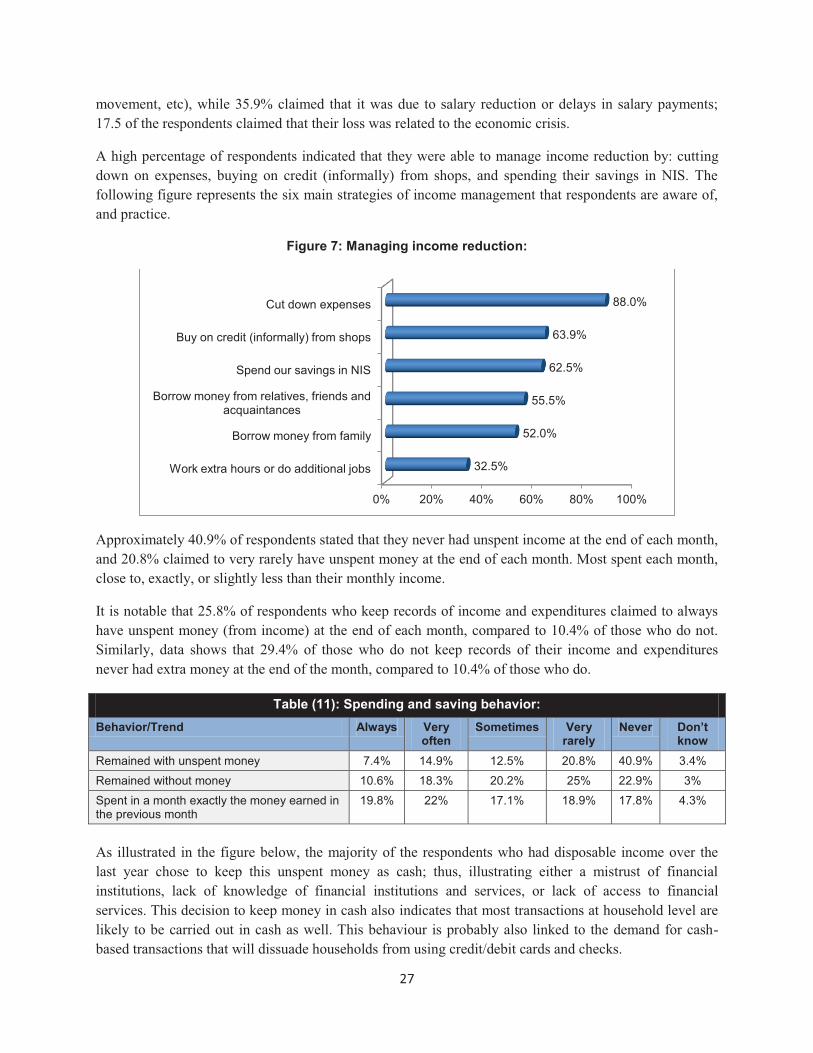
A high percentage of respondents indicated that they were able to manage income reduction by: cutting down on expenses, buying on credit (informally) from shops, and spending their savings in NIS. The following figure represents the six main strategies of income management that respondents are aware of, and practice.
Figure 7: Managing income reduction:
Approximately 40.9% of respondents stated that they never had unspent income at the end of each month, and 20.8% claimed to very rarely have unspent money at the end of each month. Most spent each month, close to, exactly, or slightly less than their monthly income.
It is notable that 25.8% of respondents who keep records of income and expenditures claimed to always have unspent money (from income) at the end of each month, compared to 10.4% of those who do not. Similarly, data shows that 29.4% of those who do not keep records of their income and expenditures never had extra money at the end of the month, compared to 10.4% of those who do.
Table (11): Spending and saving behavior: Behavior/Trend Always Very
often Sometimes Very
rarely Never Don’t
know Remained with unspent money 7.4% 14.9% 12.5% 20.8% 40.9% 3.4% Remained without money 10.6% 18.3% 20.2% 25% 22.9% 3% Spent in a month exactly the money earned in the previous month
19.8% 22% 17.1% 18.9% 17.8% 4.3%
As illustrated in the figure below, the majority of the respondents who had disposable income over the last year chose to keep this unspent money as cash; thus, illustrating either a mistrust of financial institutions, lack of knowledge of financial institutions and services, or lack of access to financial services. This decision to keep money in cash also indicates that most transactions at household level are likely to be carried out in cash as well. This behaviour is probably also linked to the demand for cash-based transactions that will dissuade households from using credit/debit cards and checks.
0% 20% 40% 60% 80% 100%
Work extra hours or do additional jobs
Borrow money from family
Borrow money from relatives, friends and acquaintances
Spend our savings in NIS
Buy on credit (informally) from shops
Cut down expenses
32.5%
52.0%
55.5%
62.5%
63.9%
88.0%

28
Figure 8: Unspent money allocation:
Figure 9: Actions taken when facing financial difficulty:
5.2 Planning and Provisioning for the Future:
5.2.1 Consumption Behavior: Respondents were to assume that they earned an additional amount of $15,000 and were asked to state what they would do with this money. They were given 15 different options and asked to choose three. Respondents were also asked to prioritize their choices. A weighted average approach was used to determine the overall ranking of each option, with the results as follows:
0% 20% 40% 60% 80%
We invest it in the capital market
We invest it in gold and jewellery
We repay debt
We lend it to friends or relatives
We spend it on consumer goods
We spend it on health
We invest it in our own business
We spend it on education (for children)
We deposit it or do not withdraw it …
We spend it on basic necessities
We keep it in cash
21.9%
25.7%
26.7%
32.0%
41.6%
46.2%
46.7%
48.1%
52.0%
52.0%
73.7%
0% 20% 40% 60% 80%
Use a credit card
Borrow from non-banking financial …
Pawn jewellery or other goods
Spend our savings in foreign currency (USD)
Work extra hours or do additional jobs
Spend our savings in NIS
Borrow money from family
Borrow money from relatives, friends and …
Buy on credit (informally) from shops
Cut down expenses
3.0%
4.6%
6.1%
19.9%
28.1%
41.5%
59.2%
64.2%
74.4%
78.4%

29
Table (12): Consumption Behaviour in cases of Increased Income: Option % Rank
I’ll invest in my own business 19.09% 1 I’ll repay my earlier debts 15.54% 2 I’ll try to add money (through borrowing, e.g.) and buy a plot of land, a car, etc. 12.85% 3 I’ll make reserves (for unexpected event, special events, for a rainy day, etc.) 11.41% 4 I’ll spend it on education and development of my children 9.40% 5 I’ll make long-term savings to accumulate money for more expensive things (a house, apartment, expensive car, etc.) 7.71% 6
I’ll spend it on the purchase of household goods (furniture, clothes, home electronic appliances, etc.)
5.82% 7
I’ll spend it on my medical treatment and that of my close family 3.92% 8 I’ll spend it on entertainment, on travel or vacation 3.65% 9 I’ll buy gold, jewels and the like 3.33% 10 I’ll spend it on upgrade of my skills or training for a new vocation/profession 2.74% 11 I’ll invest it in the bank deposit at an interest rate 1.75% 12 I’ll buy stock of Palestinian companies 1.73% 13 I’ll buy an insurance policy for myself or the family, spend it on voluntary pension (through a pension fund) 0.76% 14
Don’t know 0.29% 15 Total 100.00%
5.2.2 Saving Behavior: According to the survey, the saving behavior of the respondents is as follows:
Figure 10: Saving behavior:
At the regional level, Southern and Northern West Bank respondents saved the most and those in Gaza saved the least.
0% 20% 40% 60%
Don't know
Try to save something and spend the rest on daily needs
Spend money o daily needs and save the rest
Spend all the money and do not save
9.1%
13.1%
18.1%
59.7%
30
This is likely due to their low level of income (average of NIS 1000 and less per month), compared to other regions. Contrasting the validity of the mentioned correlation is the info gathered from respondents in the Central West Bank. Data collected from these respondents also showed low levels of saving; even though their income range is the highest among all other regions (NIS 4000 and more). This may be due to the fact that the cost of living is much higher in the Central West Bank than in other regions. Again respondents living in camps represent the base of this spectrum, which corresponds with having the lowest income.
Various indicators affect how much an individual or household saves. For example, respondents with large number of family members (14-15) save more than respondents with fewer family members. This is because larger families have more income generation power (working individuals) than smaller families and therefore tend to save more.
Furthermore, respondents who are more satisfied with their lives tend to save more money than those who are not. Approximately 39.4% of the respondents who claim to have a high level of life satisfaction save money, whereas only 18.3% of those who claimed to be dissatisfied with their lives save money.
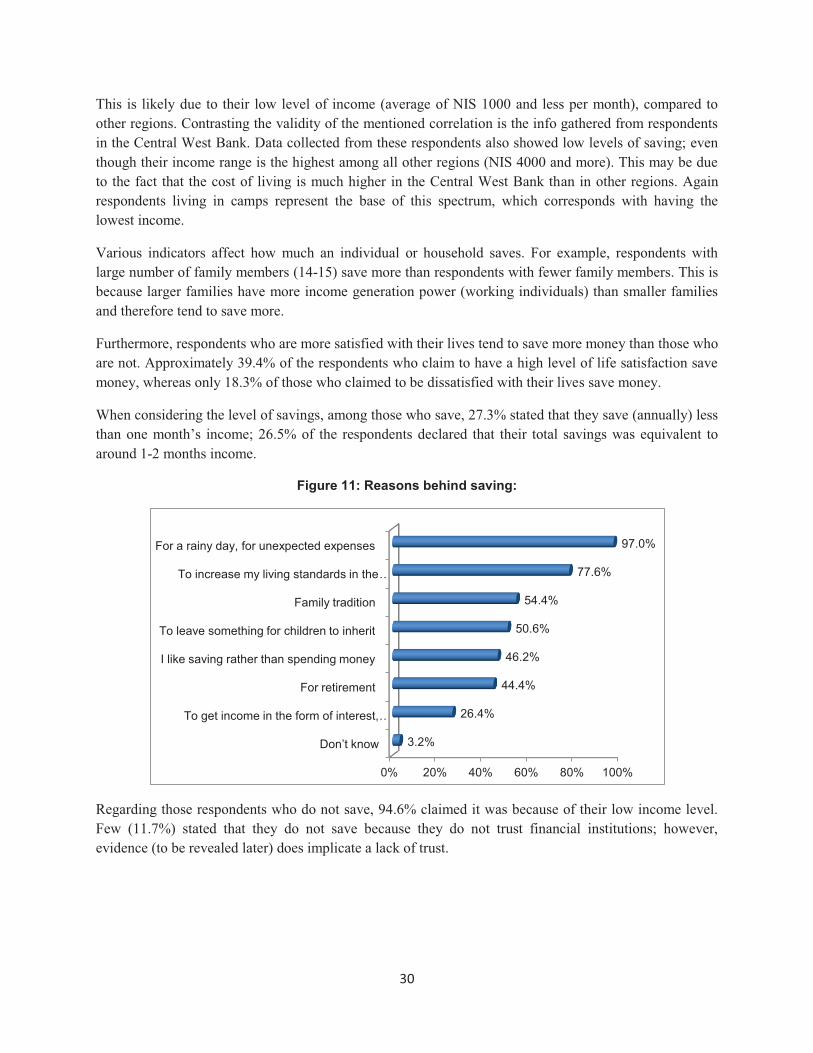
When considering the level of savings, among those who save, 27.3% stated that they save (annually) less than one month’s income; 26.5% of the respondents declared that their total savings was equivalent to around 1-2 months income.
Figure 11: Reasons behind saving:
Regarding those respondents who do not save, 94.6% claimed it was because of their low income level. Few (11.7%) stated that they do not save because they do not trust financial institutions; however, evidence (to be revealed later) does implicate a lack of trust.
0% 20% 40% 60% 80% 100%
Don’t know
To get income in the form of interest, …
For retirement
I like saving rather than spending money
To leave something for children to inherit
Family tradition
To increase my living standards in the …
For a rainy day, for unexpected expenses
3.2%
26.4%
44.4%
46.2%
50.6%
54.4%
77.6%
97.0%

31
Figure 12: Reasons for not saving:
5.3 Making Financial Choices:
5.3.1 Familiarity with Financial Institutions: The Table below illustrates the respondents’ familiarity with financial institutions:
Table (13): Familiarity with financial institutions: Institutions/ Trend Much/Very
Much Average Little/Very
Little Do not Know
Palestinian Monetary Authority 11.2% 19% 23.8% 46% Commercial Banks 37.2% 29.9% 19.6% 13.3% Insurance Companies 27.9% 28.2% 23.8% 20.1% Brokerage Houses 6% 11.7% 23.7% 60% Mutual Help/ Community Based Organizations 12.7% 21.1% 27.7% 38.5% Cooperatives 10.5% 15.6% 25.5% 48.4% Leasing Companies 6.6% 11.7% 26.1% 55.6% Other Non-banking Financial Institutions such as Microfinance Organizations
11.6% 20.9% 29.1% 38.5%
The Consumer Protection Agency 4.1% 9% 23.6% 63.3% Palestinian Capital Markets Authority 5.9% 9.9% 18.8% 65.5% Association of Banks of Palestine 8.6% 11% 15.8% 64.6% Palestine Insurance Federation 10.8% 11.1% 14.7% 63.5% Money Changers 53.9% 20.7% 12% 13.3%
Data collected reveals that in terms of familiarity with financial institutions, the Central West was ranked first, followed by the Southern West Bank, Gaza, and the Northern West Bank.
For example, 37.1% of Central West Bank respondents are familiar or very familiar with the workings of insurance companies, followed by Southern West Bank respondents (31.7%), Gaza respondents (25.1%) and Northern West Bank respondents (19.3%). Furthermore, data suggests that people in cities are more familiar with financial institutions than those living in villages or camps. For example, 29.6% of
0% 20% 40% 60% 80% 100%
Don’t know
I don’t trust financial institutions
I don’t see the point of having savings
I cannot resist the temptation to spend the money on shopping
I cannot do this because of a low income
4.3%
11.7%
18.9%
23.3%
94.6%

32
respondents living in cities are much/very much familiar with insurance companies, followed by those living in camps (26%) and villages (25.5%). Although data does show slightly more familiarity among residents of cities than those residing in villages or camps, the lack of significant deviation suggests a very minimal correlation.
In respect to gender, 36.9% of male respondents were familiar with insurance companies, compared to 18.1% of female respondents. Although the study often found only marginal divergence among male and female respondents, overall, males were found to be slightly more familiar with financial institutions than females.
Data suggests that there is a correlation between education level and knowledge of financial institutions. The survey found that the highest levels were among those holding doctorate degrees (42.9%), followed by those holding a masters degree (10.2%) and college/academy degrees (7.3%).
The lowest levels of familiarity with financial institutions were found among the least educated (grades 1-4 or less), the middle aged (56-60) and the youth (18-20), compared to respondents aged between 21-35 who had the highest levels of familiarity. Further, there is little overall knowledge of relevant capital market actors, such as brokerage houses and the Palestinian Capital Markets Authority.
5.3.2 Trust in Financial Institutions: Overall, the trust in financial institutions was low, only 19.2% of the respondents indicated that they ‘mostly’ trust commercial banks, and only 13.2% trust insurance companies. The most distrust was among non-banking financial service providers such as micro finance institutions and mutual help/ community based organizations.
Table (14): Trust of financial institutions: Institutions/ Trend Much/Very
Much Average Little/Very
Little Don’t Know
Palestinian Monetary Authority 8.4% 18.9% 21.2% 51.5% Commercial Banks 19.2% 33.4% 27.7% 19.7% Insurance Companies 13.2% 30.2% 3.3% 26% Brokerage Houses 2.9% 11.9% 23% 62.7% Mutual Help/ Community Based Organizations 8.6% 20.5% 27% 43.9% Leasing Companies 4.2% 10.6% 25.6% 59.5% Other, Non-banking Financial Institutions such as Microfinance Organizations
6.4% 17.2% 32.1% 44.2%
The Consumer Protection Agency 3.8% 10% 22.7% 63.4% Data indicates that Southern and Central West Bank respondents trust financial institutions more than Northern West Bank respondents, and that Gaza respondents have the lowest level of trust.
Data suggests that the level of familiarity a person has with particular financial institutions has an effect on whether or not that person trusts the institution; thus it can be concluded that financial education

33
should be considered a viable method to increasing population’s trust on financial institutions and overall use of financial services. Furthermore, male respondents were more familiar with, and had more trust for financial institutions than the female respondents. As mentioned previously, education proved to be a very strong indicator as to a person’s familiarity and/or trust of financial institutions.
Moreover, respondents who revealed that they highly trust a particular financial institutions have indicated that the quality of the services that were provided by that institution were good; those with the least trust evaluated the financial service of particular institutions as bad. For example, 58.8% of those who highly trust commercial banks would assess the quality of their services as very good, while only 0.9% of respondents with the least trust for commercial banks would assess the quality of the banks’ services as very good.
5.3.3 Assessment of the Quality of Financial Services: Data shows that commercial banks ranked first with regard to quality of financial services. The figure below provides a detailed breakdown of the perceived quality of particular financial services.
Table (15): Assessment of the quality of financial services: Institutions/ Trend Good/Very
Good Fair Bad/Very
Bad Don’t Know
Commercial Banks 37.4% 32.6% 9.3% 20.8% Palestinian Monetary Authority 14.8% 22.1% 5.3% 57.8% Insurance Companies 23.7% 34.3% 10.1% 31.9% Mutual Help/ Community Based Organizations 16.5% 30.3% 6.4% 46.8% Non-banking Financial Providers such as Microcredit Organizations
13.9% 26.8% 11.9% 47.3%
Informal Money Lenders 29.6% 29.6% 15.2% 25.6%
5.3.4 Contact with Financial Institutions: Overall, very few respondents indicated that they had contacts with financial institutions. Most indicated that they had not had contact with a financial institution during the past year.
Table (16): Contact with financial institutions: Financial Institutions staff Daily Few
Times/Week Few
Times/Month Once/Month
or Less Never called
Independent financial advisers or brokers 0.2% 0.5% 0.8% 3% 95.4% Representatives of the brokerage houses 0.2% 0.3% 1.8% 2.6% 95% Representatives of a non-banking financial institution, such as microcredit organizations
0.1% 1% 2.3% 5.3% 91.2%
Members of your mutual help / community association
0.8% 2% 4.2% 4.5% 88.5%
Representatives of insurance companies / private pension fund
0.1% 1.5% 3.8% 10% 84.6%
Informal money lenders 2.5% 5.5% 11.6% 11.9% 68.6% Bank officers or bankers 1.1% 4.3% 13.1% 22.7% 58.8%
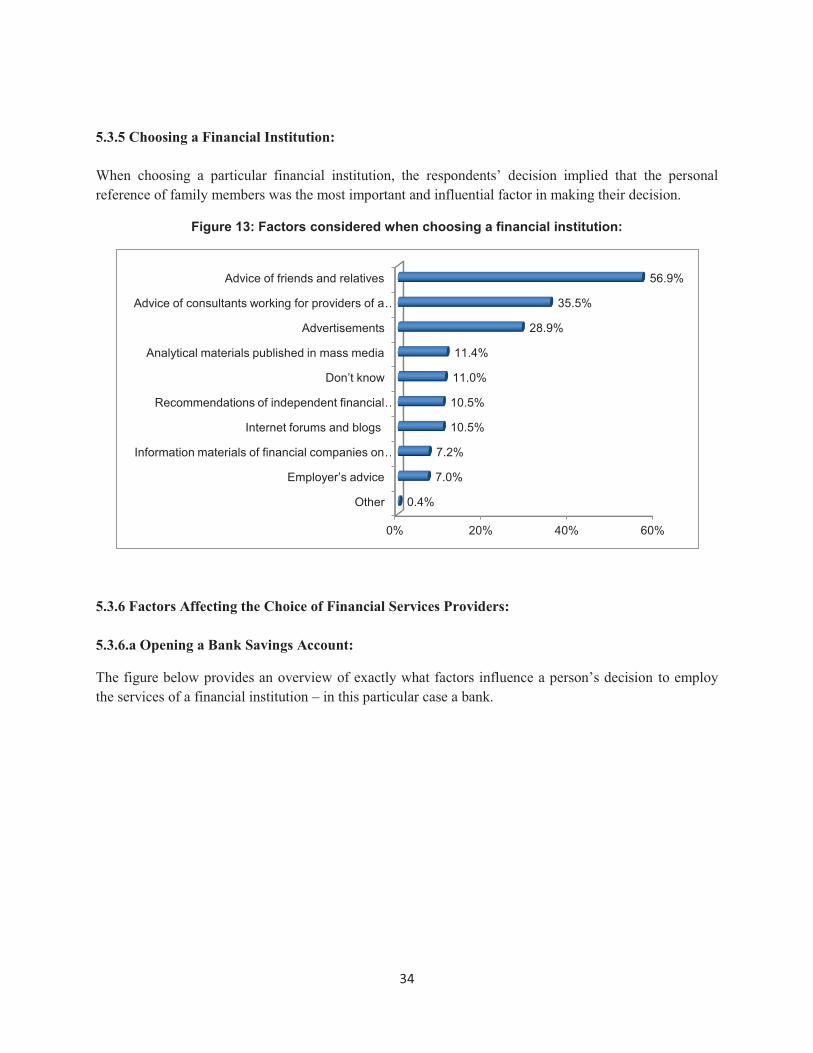
34
5.3.5 Choosing a Financial Institution: When choosing a particular financial institution, the respondents’ decision implied that the personal reference of family members was the most important and influential factor in making their decision.
Figure 13: Factors considered when choosing a financial institution:
5.3.6 Factors Affecting the Choice of Financial Services Providers: 5.3.6.a Opening a Bank Savings Account:
The figure below provides an overview of exactly what factors influence a person’s decision to employ the services of a financial institution – in this particular case a bank.
0% 20% 40% 60%
Other
Employer’s advice
Information materials of financial companies on …
Internet forums and blogs
Recommendations of independent financial …
Don’t know
Analytical materials published in mass media
Advertisements
Advice of consultants working for providers of a …
Advice of friends and relatives
0.4%
7.0%
7.2%
10.5%
10.5%
11.0%
11.4%
28.9%
35.5%
56.9%

35
Figure 14: Opening a savings account - decision:
Overall, a bank’s reputation was the most important factor that respondents considered when opening a savings account; this finding proved accurate when cross referenced with locality, gender, age groups, and education level. The lone exception being respondents from the Southern West Bank, who indicated that savings and credit interest rates and costs were the most important factor when making such a decision.
5.3.6.b Securing a Bank Loan:
Around 40.6% of the respondents would take a bank loan based on the bank’s interest rates and costs, whereas 26.5% would take a bank loan based on the bank’s reputation. The latter figure implies an underlying level of trust people already have of banks, while the former implies that that direct user benefits are more important than less tangible aspects of a bank’s profile.
Figure 15: Factors contributing to the choice of taking a bank loan:
Overall, when considering locality, gender, age groups, and education levels, savings and credit interest rates and costs were the most important factors that were considered when taking out a bank loan.
0% 5% 10% 15% 20% 25% 30% 35% 40% 45%
Gifts and advertising campaigns
Don’t know
Proximity
Savings and credit interest rate and costs
The way bank’s personnel treat you
Bank’s reputation
4.2%
8.6%
9.0%
16.3%
18.9%
43.1%
0% 10% 20% 30% 40% 50%
Gifts and advertising campaigns
Proximity
The way bank’s personnel treat you
Don’t know
Bank’s reputation
Savings and credit interest rate and costs
2.3%
4.8%
12.6%
13.2%
26.5%
40.6%

36
5.3.7 Current Financial Services used by Respondents: The financial services most commonly used by respondents were insurance policies. The table below illustrates the percentage of other commonly used financial services.
Table (17): Financial services currently used by respondents: Financial Services Percentage Insurance policies 50.4% Money changers 42.7% Buying on credit (informally) from food shops 37.2% Current account 34.2% Loans from relatives, friends, acquaintances. 33.3% Bank debit card 8.5% Buying on credit from the electrical appliances shops 7.5% Consumer loan 6.6% Bank deposit 5.9% Bank credit card 5.4% Private pensions 3.3% Mortgage loan 0.6% Loans from microcredit organizations or other non-banking financial institutions 2.4% Investments in shares 2.3% Car/ terrain loans 1.4% Loans from Mutual Help Associations 0.5% Loans from usurers 0.4% Pawning goods 0.2% Investment funds 0.1%
5.3.7.a Insurance:
Data shows that the most widely used type of service was medical insurance.
Figure 16: Type of insurance respondents currently have:
0% 10% 20% 30% 40% 50% 60% 70%
Other
Terrians/ Corp insurance
Life insurance
House insurance
Car insurance
Medical insurance
0.3%
1.0%
1.6%
1.7%
24.2%
65.2%

37
5.3.7.b Loans:
Those surveyed were asked about which types of loans they have (up to three); this information helped to see that many consumers had at least three consumer loans, as shown in the table below.
Table (18): Types of loans currently taken by respondents: First Loan Second Loan Third Loan Consumer Loan 91.9 86.4 100 Mortgage Loan 8.1 13.6 -
The duration of loans varied considerably between the three types; however, most loans were for a duration of between 1-2 years.
Table (19): Duration of loans Duration (months) First Loan Second Loan Third Loan 1-12 24.4% 21.6% 66.7% 13-24 31.5% 52.1% 16.7% 25-36 17.2% 13% 16.7% 37-48 5.9% 8.6% 0% 49-60 11.3% 4.3% 0% 61-72 5.3% 0% 0% 73-84 1.2% 0% 0% 85-96 0.6% 0% 0% 97-108 0.6% 0% 0% 109-120 0.6% 0% 0% 121 and more 1.8% 0% 0%
Loans were most often taken out in US dollars, and with a fixed interest rate. Most of the respondents (60-75%) stated that they do not have delays in making the repayments of their loans, and more than half of them face no difficulties in making the loan repayments.
5.3.7.c Dissatisfaction with Financial Services:
Over the last five years, 60% of the respondents claimed to be satisfied with all of the financial services they were employing, while only 10.9% were unsatisfied with the financial services they had received (over the last 5 years). The table below provides greater detail of those that were unsatisfied with the financial services that they had utilized.
Of those unsatisfied, approximately 91.5% did not take any actions to remedy this dissatisfaction. Of those who took action, 80.6% said that they responded by terminating their use of the financial service.

38
Table (20): Financial services that respondents were most often not satisfied (over the last 5 years):
Financial Services Percentage A consumer loan 85.7% Loans from relatives, friends, acquaintances. Buying on credit (informally) from food shops 80.6% Buying on credit from the electrical appliances shops 79.7% Current account 76.1% Loans from Microcredit organizations Credit or other non-banking financial institutions 70.6% A bank credit card 51.7% An insurance policy 46.2% A mortgage loan 44.0% Loans from usurers 41.7% Investment in shares 35.0% A car/ terrain loan 31.6% Bank deposit 31.6% Pawning goods 26.3% A bank debit card 23.5% Loans from Mutual Help Associations 22.2% Private pensions 20.0% Investment funds 0%
5.3.8 Conflict Resolution with Financial Institutions: Regarding the resolution of conflict with financial institutions, respondents provided inconclusive data regarding trust and assurances – as further illustrated below.
Table (21): Consumer trust in a quick and just resolution of conflict with financial institutions:
Quick Percentage Just Percentage Completely sure 5.8% Completely sure 6% Sure 20.1% Sure 15.1% Fifty-Fifty 27.7% Fifty-Fifty 29.2% Not sure 16.2% Not sure 18.2% Not at all sure 9.8% Not at all sure 10.8% Don’t know 20.4% Don’t know 20.7%
5.4 Staying Informed about Financial Matters:
5.4.1 Access to media: Most of the respondents indicated that they watch TV on daily bases, while a lesser percentage claimed to listen to the radio daily and even less read newspapers. Among those with access to different media sources, respondents in Gaza relied the most on newspapers for financial information. The respondents unanimously preferred TV media to other media resources.

39
Interestingly, preferred media outlets seem to coincide with familiarity of technology, which itself is connected to particular age groups. For example, respondents aged 26-30 were most likely to read newspapers, while respondents above the age of 61 were most likely to prefer radio as a daily resource of information.
Regarding gender, male respondents had higher access to media daily; e.g. 20.1% read the newspapers daily, compared to 8.9% of female respondents. Around 40.6% of male respondents listen daily to the radio compared to 28.6% of female respondents.
In respect to education, more educated respondents had more access to media than those who were less educated. Computer literacy also appears to correspond with which media source people choose. Most of the computer literate respondents listen to the radio and watch TV more than those who do not know how to use a computer. Furthermore, data indicates that respondents who use the internet on a daily basis, more often read newspapers daily; 73.7% of those who read the newspapers daily, also used the internet daily. Contrastingly, only 16.5% of the respondents who read newspapers occasionally – a few times a week – use the internet.
Survey data reveals that those who read newspapers, listen to the radio and watch TV most frequently (daily and few times a week), more often follow changes in the financial markets, compared to those who have less access to media. Thus, the more access respondents had to the media, the more likely they followed changes in the financial market.
Moreover, respondents who have frequent access to the media (read the newspapers, listen to the radio and watch TV on a daily basis) believe that mass media is the most suitable channel to deliver financial literacy training programs. For example, 62.4% of respondents who read newspapers daily believe that mass media is the most suitable tool for improving a populations financial literacy. Furthermore, 51.8% of those who claimed to never read newspapers were indecisive about financial education delivery methods.
Figure 17: Daily access to media
Survey data also indicated that 56.5% of the respondents knew how to use a computer and 46.5% knew how to use the internet. Regarding gender, 61% of males knew how to use the computer, compared to 51.6% of females. Similarly, 54.1% of male respondents use the internet on a daily basis, compared to only 36.7% of female respondents.
0% 20% 40% 60% 80% 100%
Read the Newspaper
Listen to Radio
Watch TV
14.8%
34.9%
80.8%

40
At a regional level, 63.9% of Northern West Bank respondents know how to use a computer and 46.6% use the internet on a daily basis. On the opposite end of the spectrum, only 20.2% of Southern West Bank respondents know how to use computers. Respondents aged 18-25 are the most knowledgeable of computers, whereas the oldest respondents (61 years old and more) are the least who know how to use the computer and the electronic mail.
Furthermore, respondents living in cities were more computer literate than those living in villages and camps.
Regarding education, respondents holding doctoral, master, college/academy and four-year vocational school and apprentice degrees, were the most computer literate. Data shows that those holding Masters degrees and college/academy degrees were used the internet most frequently.
Respondents who know how to use the computer follow changes in the financial markets more than those who don’t. For example, 61.6% of respondents who use the computer follow changes in price fluctuations for oil, gold and metals.
The table below illustrates frequency in which respondents claimed to have used the internet (including email).
Table (22): The use of internet including email: The use Percentage Daily 46.5% Few times a week 20.9% Few times a month 10.6% Once a month or less 7.3% Never 14.6%
Given that 95% of the respondents owned a mobile phone, financial literacy programs may consider incorporating mobile phones as a channel for disseminating financial information. Further research may be required on type of information that can be shared through mobile phones, which will depend on the typical usage behaviour in the region; this could vary from using text messages to checking information on market prices to entertainment purposes such as listening to music and sharing pictures.
5.4.2 Observation of Trends: The results show that following of market changes is not high among respondents. The main trends followed by respondents included fluctuations in prices of oil, gold and metals, as well as changes in public pensions and changes in the inflation rates. Opposite to that, respondents seem to least follow the changes of interest rates on deposits, followed by changes of quotations and indices in capital markets and changes of interest rates on credits (although still more than 10% of respondents follow these trends).
At a regional level, Central West Bank and Northern West Bank respondents personally followed markets changes the most. Southern West Bank respondents were the least likely to personally follow changes in above mentioned financial markets. Data indicates that respondents living in camps are less interested in personally following changes in financial markets changes, compared to those living in cities and villages.

41
Figure 18: Market changes that respondents personally follow
More specifically, respondents who are between 26-50 years follow changes of quotations and indices in the capital market the most, while those aged between 46-50 and 51-55 most often follow changes in the property market, changes of interest rate on deposits, and price fluctuations for oil, gold and metals.
Male respondents follow changes in the financial markets more than female respondents. For example, 19.4% of men follow changes in the property market compared to 9.3% of women.
In regards to education, respondents holding doctoral and/or masters degrees follow changes in all financial markets more often than those with less education.
Figure 19: Frequency in which Respondents talk about financial institutions and services
5.4.3 Main Sources of Information: The table below represents the main sources of information that respondents use to monitor changes in the different markets.
0% 20% 40% 60% 80% 100%
Changes of interest rates on deposites
Changes of quotations and indices in the capital market
Changes of interest rates on credits
Changes in the property market
Changes in inflation rate
Changes in the level of public pensions, benefits and tax …
Price fluctuations for oil, gold and metals
12.8%
14.6%
16.0%
19.2%
26.5%
34.3%
54.7%
87.2%
85.4%
84.0%
80.8%
73.5%
65.7%
45.3% Don't Follow Personally
Follow Personally
0% 10% 20% 30% 40%
Daily
Few times a week
few times a month
Once a month or less
Never
10.5%
15.5%
19.8%
22.5%
31.7%

42
Table (23): Sources of Information for Market Changes Market Changes/ Source of Information
Advertising Newspapers, magazines, TV programs specializing on financial issues
Specialized web sites
Employees of banks, insurance and management companies, during a personal visit or by phone
Independent financial consultants or brokers
Friends and acquain-tances
Changes in the property market
11.2% 27.7% 12.3% 8.4% 2.6% 37.6%
Changes of quota-tions and indices in the capital market
6.2% 33.4% 30.3% 14.8% 3.4% 11.7%
Changes of interest rates on deposits
13.8% 17.3% 10.6% 39.8% 2.4% 16.1%
Changes of interest rates on credits
14.5% 12.9% 8.2% 44.2% 0.9% 19.2%
Changes in inflation rate
10.4% 30.9% 11.5% 18.9% 1.7% 26.6%
Changes in the level of public pensions, benefits and tax exemptions
12.7% 19.2% 11.1% 18.9% 1.2% 37%
Price fluctuations for oil, gold and metals
13.5% 37.6% 12.1% 12.6% 1.5% 22.7%
According to the survey, specialized newspapers, TV programs and magazines constituted the correspondents’ main sources of information for monitoring the price fluctuations of oil, gold and metals (37.6%), changes in quotations and indices in the capital markets (33.4%), and changes in inflation rates (30.9%). Bank officers and employees were the main sources of information relating to changes in interest rates on credits (44.2%) and on deposits (39.8%). Lastly, friends and acquaintances constituted the main sources of information for monitoring changes in the property markets and public pension benefits (37.7% and 37% respectively). Moreover, advertising, specialized websites and independent financial consultants or brokers did not significantly influence the above mentioned trends or changes in the capital markets.
Figure 20: Frequency in which respondents compare terms and conditions for provision of financial services before signing a contract for such a service.
0% 10% 20% 30% 40% 50%
Don't know
Never
Rarely
Sometimes
Don't use any financial service
Always
2.8%
7.1%
8.0%
14.3%
22.0%
45.8%

43
5.5 Financial Literacy:
5.5.1 Own Assessment: When it comes to respondents’ assessment of their level of financial literacy, only 5.3% stated that they have excellent knowledge and skills regarding financial issues. Data reveals that 38% of the respondents indicated that they have satisfactory knowledge and skills, 27.6% good knowledge and skills and 15.4% have unsatisfactory knowledge and skills. Whereas 11.9% of the respondents stated that they do not have any financial knowledge or skills.
Figure 21: Assessment of respondents own level of financial literacy
Central West Bank respondents had the most ‘excellent knowledge and skills’ in regards to financial issues, followed by Northern West Bank respondents, Gaza, and Southern West Bank.
Respondents living in cities cite themselves as having more knowledge and skills than those living in villages and camps, where 6.2% of respondents who live in cities assess their knowledge and skills as excellent, compared to 4.2% and 4.1% of those living in camps and villages respectively.
Most respondents who claimed to have excellent knowledge and skills of financial issues were aged between 46-50 years, while those aged 60 years and over most often did not have any financial knowledge or skills.
Data indicates that males believe that they have more knowledge and skills than females, e.g. 7.5% of male respondents think they have excellent knowledge and skills compared to 2.9% of females.
In addition, 33.3% of respondents holding doctorate degree believe they are excellent in financial matters, compared to respondents who had no school or only primary education (3.1%). Most of the uneducated respondents claimed to have no financial knowledge or skills.
Respondents who assess themselves as having excellent to satisfactory knowledge of financial issues have better daily access to media (read the newspapers, listen to radio and watch TV) than those do not.
0% 5% 10% 15% 20% 25% 30% 35% 40%
Don't know
Excellent knowledge and skills
No knowledge and skills
Unsatisfactory knowledge and skills
Good knowledge and skills
Satisfactory knowledge and skills
1.8%
5.3%
11.9%
15.4%
27.6%
38.0%

44
Respondents who believe they have excellent knowledge of financial issues watch market changes more than those who do not, e.g. 88.8% of these particular respondents watch changes in price fluctuations for oil, gold and metals. Similarly, 74.5% of these – self-proclaimed knowledgeable – respondents claimed to always compare the terms and conditions for provision of financial services by various companies before they sign a contract, compared to 17.2% of those who believe they do not have financial knowledge.
Around 80% of those who believe they have excellent financial knowledge managed to give correct answers to the calculation questions presented to them, while 72% of them managed to give correct answers to financial but non mathematical questions. On the other hand, only 37% of those who believe they do not possess financial knowledge managed to give correct answers to the calculation questions presented to them, and 51% of them managed to give correct answers to the financial but non mathematical questions.
Respondents who believe they have excellent knowledge and skills of financial matters plan their household’s finances by making budget or recording expenses (55.7%), compared to only 23% of those who admit to not having any financial knowledge; the same principle can be applied to keeping financial records of different types.
5.5.2 Examples of Financial Literacy: In order to assess the level of financial literacy, respondents were asked a number of questions after being given practical (hypothetical) examples of situations that might require making financial decisions. The results and analysis of this part of study is presented below.
5.5.2.a Analysis of Interest Rates:
Half of the respondents answered correctly to a question regarding how much money they will have in their account if they deposited NIS 10,000 for 2 years at an interest rate of 8%. Whereas 19% of them stated that they don’t know and the rest gave wrong answers.
Table (24): Consumer analysis of time deposit and interest rates Answers Percentage More than 10,800 50.9% Exactly 10,800 22% Don’t know 19% Less than 10,800 8.1%
Correct answers were distributed as follows as to geographical area: 57.6% of Northern West Bank, 57.4% of Gaza, 48.2% of Central West Bank and 27.7% of Southern West Bank.
Correct answers were distributed as follows as to type of locality: 52.8% of cities, 51.9% of camps, and 46.7% of villages.
Moreover, around 58% of those aged 21-30 gave the correct answer. As for gender, 58.1% of male respondents were correct, compared to 43% of female respondents.
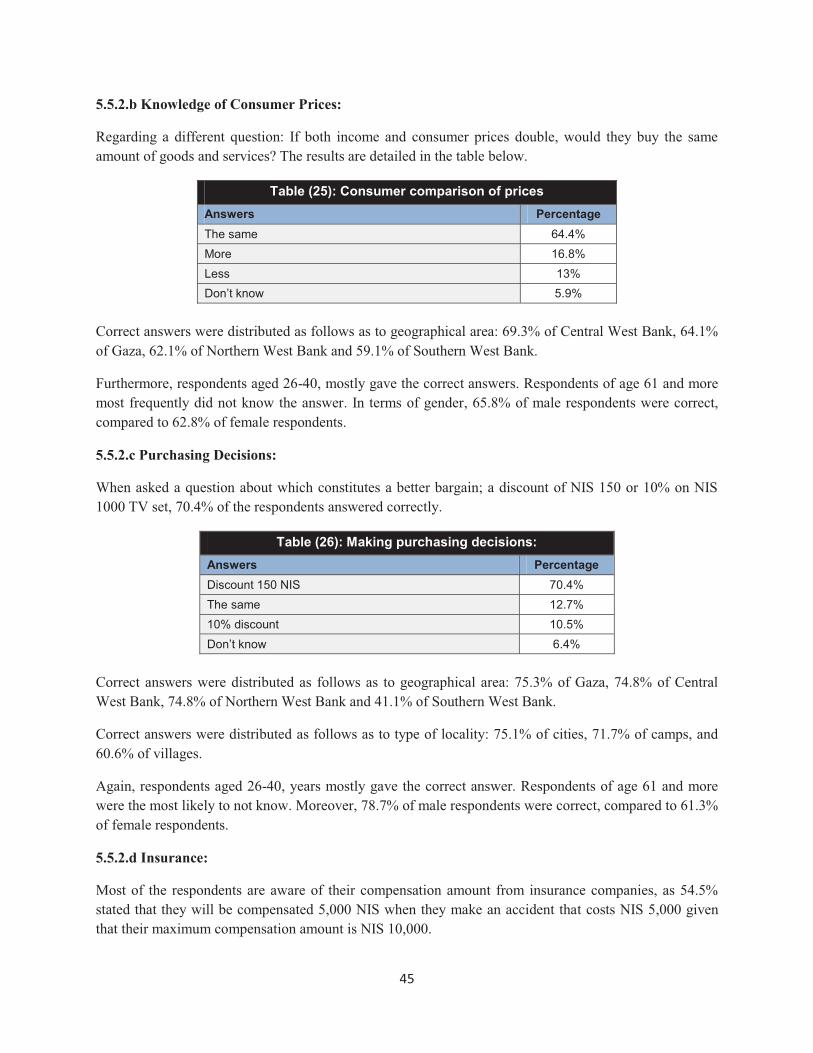
45
5.5.2.b Knowledge of Consumer Prices:
Regarding a different question: If both income and consumer prices double, would they buy the same amount of goods and services? The results are detailed in the table below.
Table (25): Consumer comparison of prices Answers Percentage The same 64.4% More 16.8% Less 13% Don’t know 5.9%
Correct answers were distributed as follows as to geographical area: 69.3% of Central West Bank, 64.1% of Gaza, 62.1% of Northern West Bank and 59.1% of Southern West Bank.
Furthermore, respondents aged 26-40, mostly gave the correct answers. Respondents of age 61 and more most frequently did not know the answer. In terms of gender, 65.8% of male respondents were correct, compared to 62.8% of female respondents.
5.5.2.c Purchasing Decisions:
When asked a question about which constitutes a better bargain; a discount of NIS 150 or 10% on NIS 1000 TV set, 70.4% of the respondents answered correctly.
Table (26): Making purchasing decisions: Answers Percentage Discount 150 NIS 70.4% The same 12.7% 10% discount 10.5% Don’t know 6.4%
Correct answers were distributed as follows as to geographical area: 75.3% of Gaza, 74.8% of Central West Bank, 74.8% of Northern West Bank and 41.1% of Southern West Bank.
Correct answers were distributed as follows as to type of locality: 75.1% of cities, 71.7% of camps, and 60.6% of villages.
Again, respondents aged 26-40, years mostly gave the correct answer. Respondents of age 61 and more were the most likely to not know. Moreover, 78.7% of male respondents were correct, compared to 61.3% of female respondents.
5.5.2.d Insurance:
Most of the respondents are aware of their compensation amount from insurance companies, as 54.5% stated that they will be compensated 5,000 NIS when they make an accident that costs NIS 5,000 given that their maximum compensation amount is NIS 10,000.

46
Table (27): Awareness of compensation from insurance Answers Percentage NIS 5000 54.5% Don’t know 30.2% NIS 10,000 15.3%
Correct answers were distributed by geographical area: 67.7% of Central West Bank, 51.3% of Gaza, 48.0% of Southern West Bank and 47.5% of Northern West Bank; and by locality: correct = 55.1% of cities, 55.0% of villages, and 50.8% of camps.
Similarly to previous questions respondents aged 26-40 were most likely to give the correct answer, while those aged over 61, were the least likely.
5.5.2.e Money Lending:
Around 83.3% of the respondents know that a local moneylender’s loan to buy clothes for children is not a productive loan, while 9.8% stated that it is a productive loan, and the rest (6.9%) did not know.
Table (28): Awareness of investment/productive loans Answers Percentage No 83.3% Yes 9.8% Don’t know 6.9%
5.5.2.f Coping Strategies:
Working in Dangerous Professions:
Respondents were asked to give advice for somebody who works in a dangerous profession, of the three choices, the table below illustrates the distribution of these choices.
Table (29): Advice for working in dangerous professions Answers Percentage Purchase health/life/accident insurance 48.7% Take up another (different) work 37.4%
Increase savings 13.8% In respect to geographic area, the correct answers were distributed as follows: 60.7% of Central West Bank, 44.6% of Gaza, 44.0% of Northern West Bank and 42.8% of Southern West Bank.
Correct answers were distributed as follows as to type of locality: 51.3% of camps, 48.6% of villages, and 48.2% of cities.
A pattern remained consistent among these questions: respondents aged 26-40 most often answered correctly, respondents aged over 61 most often answered incorrectly, and men were slightly more likely
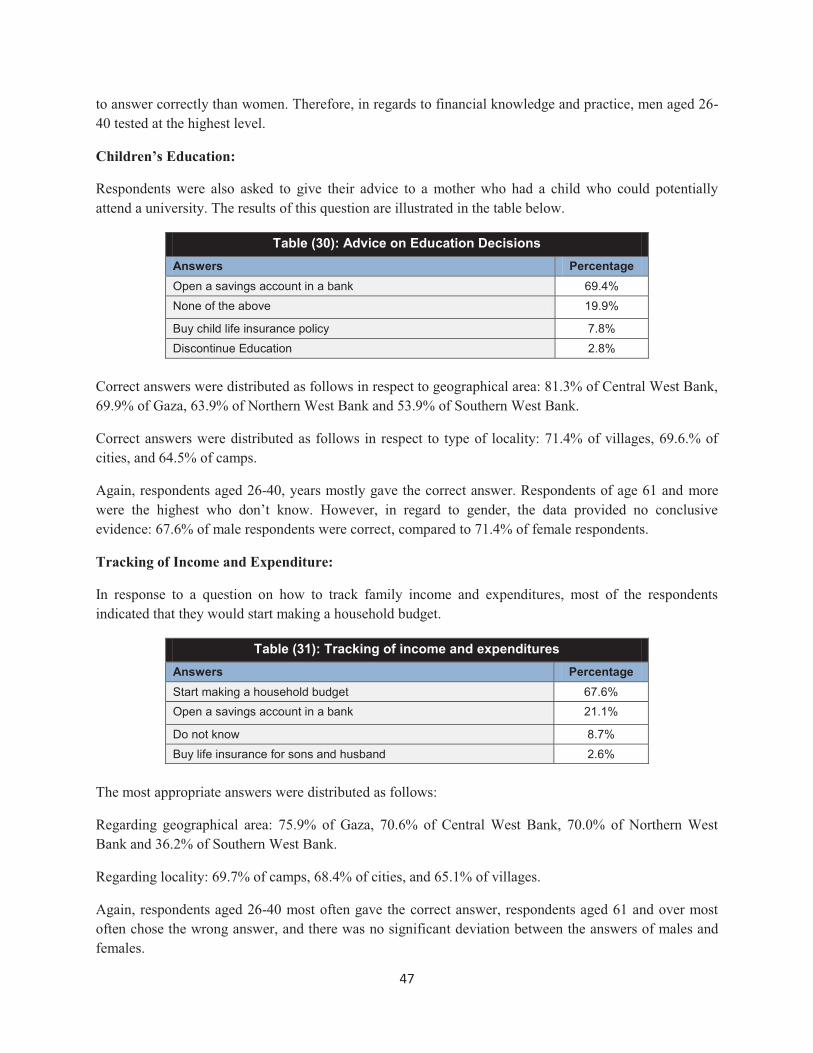
47
to answer correctly than women. Therefore, in regards to financial knowledge and practice, men aged 26-40 tested at the highest level.
Children’s Education:
Respondents were also asked to give their advice to a mother who had a child who could potentially attend a university. The results of this question are illustrated in the table below.
Table (30): Advice on Education Decisions Answers Percentage Open a savings account in a bank 69.4% None of the above 19.9%
Buy child life insurance policy 7.8% Discontinue Education 2.8%
Correct answers were distributed as follows in respect to geographical area: 81.3% of Central West Bank, 69.9% of Gaza, 63.9% of Northern West Bank and 53.9% of Southern West Bank.
Correct answers were distributed as follows in respect to type of locality: 71.4% of villages, 69.6.% of cities, and 64.5% of camps.
Again, respondents aged 26-40, years mostly gave the correct answer. Respondents of age 61 and more were the highest who don’t know. However, in regard to gender, the data provided no conclusive evidence: 67.6% of male respondents were correct, compared to 71.4% of female respondents.
Tracking of Income and Expenditure:
In response to a question on how to track family income and expenditures, most of the respondents indicated that they would start making a household budget.
Table (31): Tracking of income and expenditures Answers Percentage Start making a household budget 67.6% Open a savings account in a bank 21.1%
Do not know 8.7% Buy life insurance for sons and husband 2.6%
The most appropriate answers were distributed as follows:
Regarding geographical area: 75.9% of Gaza, 70.6% of Central West Bank, 70.0% of Northern West Bank and 36.2% of Southern West Bank.
Regarding locality: 69.7% of camps, 68.4% of cities, and 65.1% of villages.
Again, respondents aged 26-40 most often gave the correct answer, respondents aged 61 and over most often chose the wrong answer, and there was no significant deviation between the answers of males and females.
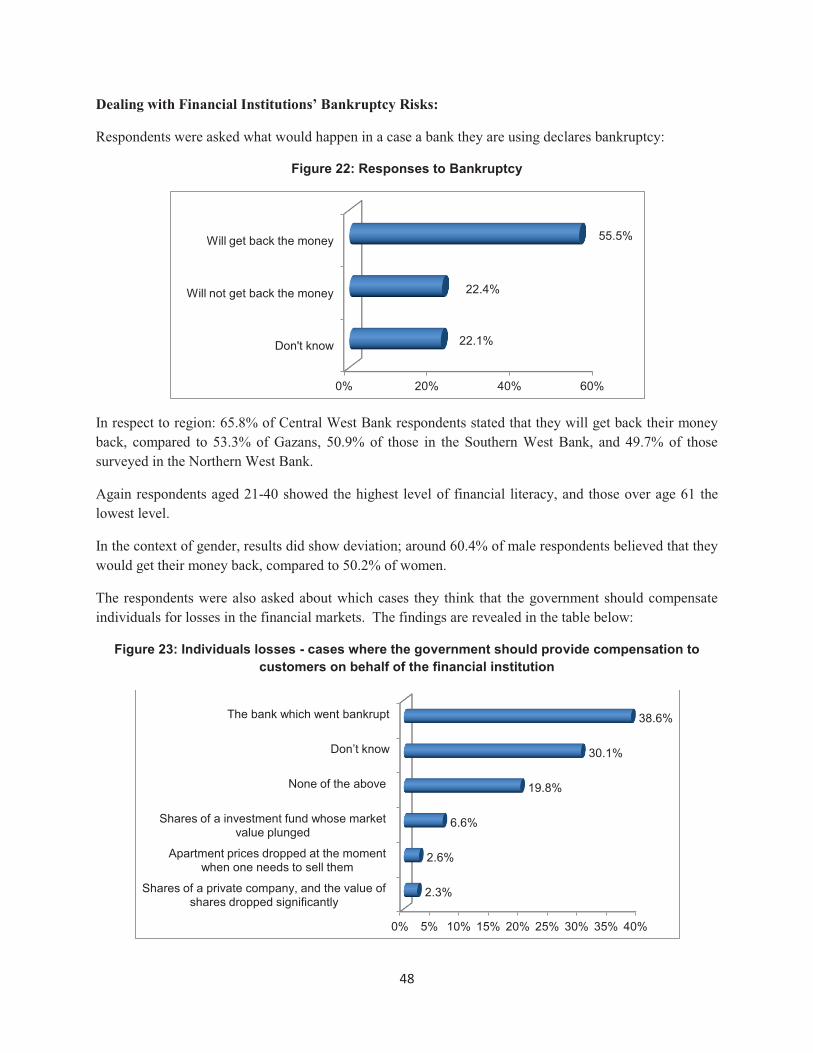
48
Dealing with Financial Institutions’ Bankruptcy Risks:
Respondents were asked what would happen in a case a bank they are using declares bankruptcy:
Figure 22: Responses to Bankruptcy
In respect to region: 65.8% of Central West Bank respondents stated that they will get back their money back, compared to 53.3% of Gazans, 50.9% of those in the Southern West Bank, and 49.7% of those surveyed in the Northern West Bank.
Again respondents aged 21-40 showed the highest level of financial literacy, and those over age 61 the lowest level.
In the context of gender, results did show deviation; around 60.4% of male respondents believed that they would get their money back, compared to 50.2% of women.
The respondents were also asked about which cases they think that the government should compensate individuals for losses in the financial markets. The findings are revealed in the table below:
Figure 23: Individuals losses - cases where the government should provide compensation to customers on behalf of the financial institution
0% 20% 40% 60%
Don't know
Will not get back the money
Will get back the money
22.1%
22.4%
55.5%
0% 5% 10% 15% 20% 25% 30% 35% 40%
Shares of a private company, and the value of shares dropped significantly
Apartment prices dropped at the moment when one needs to sell them
Shares of a investment fund whose market value plunged
None of the above
Don’t know
The bank which went bankrupt
2.3%
2.6%
6.6%
19.8%
30.1%
38.6%

49
Data shows that Southern West Bank respondents were most likely to believe that the government should compensate for individual losses if a bank were to go bankrupt and/or if the value of a private company’s shares dropped significantly. Furthermore, Central West Bank respondents stated that the government should compensate for individual losses when the value of shares of an investment fund plunged, and when property values decline at a moment when a home owner needs to sell.
In respect to gender, 43.3% of male respondents stated that the government should compensate individual losses when the bank went bankrupt, compared to 33.4% of females.
According to locality, 44.4% of respondents living in villages stated that the government should compensate for individual losses in the case of a bank going bankrupt, compared to 33.9% of those living in cities and 33.3% living in camps. The results of this study have shown that respondents living in camps have significantly less financial knowledge, experience than those living in cities and villages.
5.6 Financial Education Needs:
5.6.1 Financial Training Courses Needed: Data shows that the need for financial training in the West bank and Gaza is high. Around 75% of those surveyed indicated interest in training courses on information that a consumer should pay attention to when signing a contract with a financial institution; .whereas around 70% were interested in learning about consumer protection rights and what to do when these rights are violated, as well as in learning about debt management..Interestingly, despite the relative lack of awareness of capital market actors and low use of securities products, about 46% of respondents expressed interest in learning more about capital markets, stock exchange and unit shares.,
Table (32): Preferred Aspects of Financial Training Courses for People: Training Aspects Percentage What information should a user pay attention to when signing a contract with a bank or another financial company
74.8%
What consumer rights protection laws are available and what one needs to do when one’s consumer rights are violated
70.4%
How to manage debt 69.2% How to plan purchases of durables (car, house) 68.1% How to form one’s own financial targets and draw a personal current financial plan or budget 64.2% How does the pension scheme work and what methods are available to secure one’s old age income 62.1% What parameters are used to compare the services offered by banks and other financial companies 57% Banking services – current accounts, saving deposits, and plastic cards 56.1% Consumer credits to purchase goods and services 55.9% How to interpret and differentiate financial advertising information 55.8% Private pension funds 46.7% Capital markets, stock and unit fund shares 46.2% Insurance and insurance products 46.1% Mortgage loans 41.2%
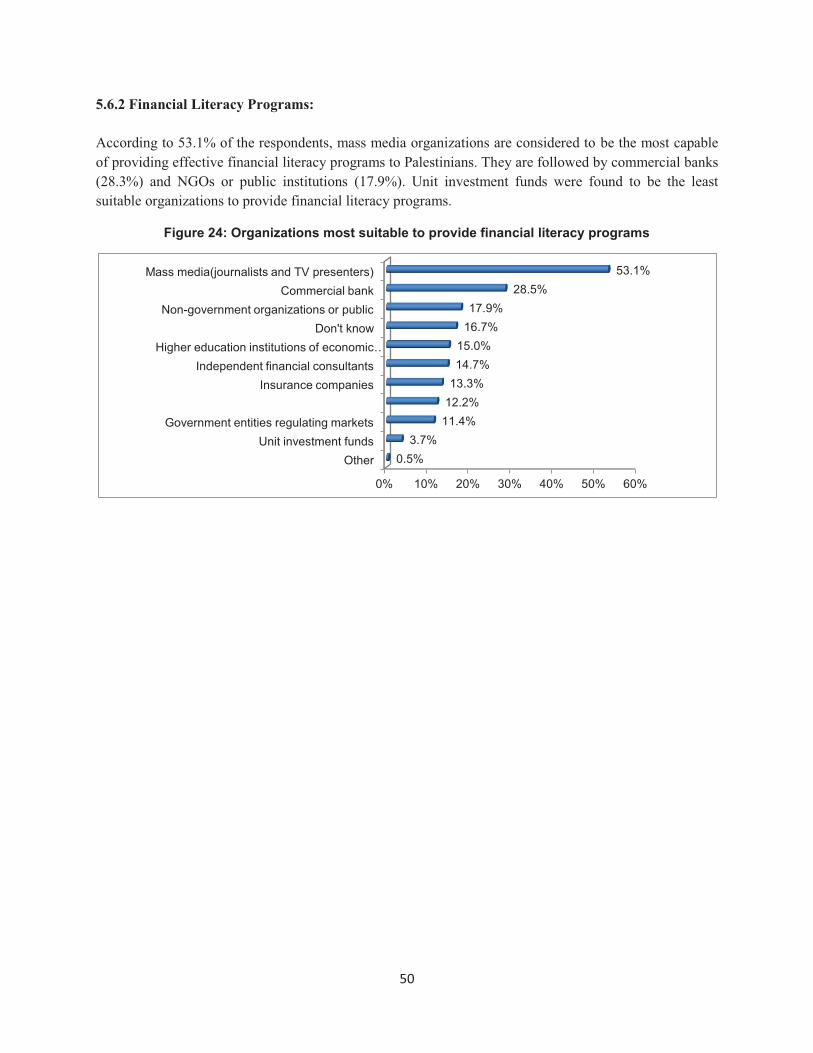
50
5.6.2 Financial Literacy Programs: According to 53.1% of the respondents, mass media organizations are considered to be the most capable of providing effective financial literacy programs to Palestinians. They are followed by commercial banks (28.3%) and NGOs or public institutions (17.9%). Unit investment funds were found to be the least suitable organizations to provide financial literacy programs.
Figure 24: Organizations most suitable to provide financial literacy programs
0% 10% 20% 30% 40% 50% 60%
Other Unit investment funds
Government entities regulating markets
Insurance companies Independent financial consultants
Higher education institutions of economic …Don't know
Non-government organizations or public Commercial bank
Mass media(journalists and TV presenters)
0.5% 3.7%
11.4% 12.2% 13.3% 14.7% 15.0%
16.7% 17.9%
28.5% 53.1%

51
6. Conclusions and Policy Recommendations:
This report includes the results and analysis of a representative household survey regarding levels of financial literacy and consumer financial awareness in the West Bank and Gaza (the Occupied Palestinian Territory). The ‘Financial Literacy and Consumer Awareness Survey’ was conducted in May, 2011 and collected data from 2022 Palestinians in the West Bank and Gaza. The survey methodology was agreed with the World Bank and the detailed sampling was developed by Riyada consulting and Training. The methodology used to analysis the raw data utilizes the interrelated concepts of financial literacy, financial knowledge, and financial education – as outlined in the Literature Review. Similar studies have attempted to prove that that financial literacy is connected to financial knowledge, consumer financial awareness, and financial behavior. Generally, studies of financial literacy have focused on financial behavior; i.e. planning, management of money, financial choices, and the ability to utilize available resources for help. This study has sought to answer the question: does lack of financial literacy and consumer financial awareness in the West Bank and Gaza lead to financial mistakes and imprudent financial practices, and overall, does financial literacy impact the well-being of the populations targeted in the study? The findings reflect the current state consumer awareness and financial education. Data collected in the survey –including financial awareness, familiarity with financial institutions and services, attitudes and opinions regarding the financial markets, household management of financial resources and use of financial services – was organized, studied, and analyzed to generate these key findings and policy recommendations.
Key Findings: Financial Planning: � Budgeting: The survey results confirmed that respondents who plan their household’s finances (by
making a budget or recording expenses) save more than those who do not plan their household’s finances.
� Keeping financial records: Survey data indicates that those who keep record of their income and expenditures have less debt than those who do not.
� Managing Debts: Respondents with debts are more likely to keep in-line with their financial budgets. Financial Behavior: � Consumption Behavior: Respondents with a substantial amount of extra income are most likely to
spend it on new business ventures. � Saving Behavior: respondents living in camps save the least; large households save more than small
ones and those satisfied with their life save more than those who are not. Most respondents save to prepare themselves for unexpected expenses.
Financial Choices:

52
� Familiarity: those most familiar with financial institutions are educated, male, and aged 21-35. � Trust: overall trust in financial institutions was low. � Quality of financial services offered: According to respondents, commercial banks offer the best
quality of financial services. � Contact: overall, very few respondents indicated that they had contacts with financial institutions.
Advice from friends and relatives was considered the most important factor when choosing the business of a particular financial institution; most chose to open a bank account based on the institution’s reputation.
� Financial services used: The most commonly used financial service among respondents was insurance policies. Most respondents indicated that they were happy with the financial services they were being provided; however, a large number of respondents were not using any financial services.
Financial Information: � Access to Media: Respondents who have frequent access to media believe that mass media is the most
suitable tool for spreading/increasing a population’s financial literacy. Financial Literacy: � Self assessment: Respondents who believe they have excellent knowledge and skills of financial
matters plan their household’s finances by making budgets and/or recording their expenses. � Assessment: When respondents were tested on formulating interest rates, knowledge of consumer
prices, purchasing decisions, knowledge of their own insurance policies, and intricacies of borrowing money, most recorded correct answers (over 50%). Most respondents were knowledgeable of how to track income and expenditure -the data does not reveal high percentages of either of the latter two findings.
Financial Education – Needs: � Needs: Data shows that the need for financial education is high. � Delivery of Financial Education: the survey found that most respondents believe that mass media
organizations are the most capable of providing populations with financial literacy programs. Policy Recommendations: The study has revealed that, low financial literacy in the West Bank and Gaza is related– to a certain extent – to lower access to financial services. The survey data shows that there is a substantial disparity among the West Bank and Gaza in regard to financial literacy, with areas in the West Bank with tighter socio-economic constraints (e.g. Southern West Bank) having lower levels of financial literacy. Lastly, the levels of financial literacy and awareness among residents of refugee camps are much lower than other regions, again showing strong linkages between socio-economic constraints and financial access and financial literacy. Not surprisingly, data has indicated that the lowest levels of financial awareness and literacy were consolidated within Gaza and the Southern West Bank region. Women, seniors, those with less education and those residing in refugee camps also were shown to have low levels of financial literacy and consumer awareness. The study has indicated that overall, the people of the West Bank and Gaza are too

53
often unprepared for unexpected financial problems; thus, financial education initiatives are essential to increasing the financial knowledge and literacy of those currently incapable of making sufficient financial provisions for the future – a future that many predict to be unstable at best. Moreover, the results of this study should be taken into consideration when developing specific strategies and strategic policy mechanisms aimed at increasing financial knowledge, awareness, literacy, and capability among the people living in the West Bank and Gaza.
Despite intrinsic disadvantages, the study has also revealed that the West Bank and Gaza has a vast amount of room for improvement in regard to financial awareness, familiarity with financial services, familiarity with financial markets, management of household finances, and use of financial services. Thus, the Occupation aside, the West Bank and Gaza has room for, and is capable of improvement. Taking into account the findings of the study, it is clear that the Palestinians must consolidate their efforts and proactively work at resolving these underlying issues and challenges. The study has found that the biggest determents to adequate levels of financial literacy and consumer awareness in the Palestinian Territory are low education level, socio-cultural norms/gender bias, age, and access to services. Regarding gender, data did reveal broad based inequality and gender bias toward women; however, remedying this socio-cultural glitch is beyond the scope of this study. Thus, no policy recommendations are provided for this specific imbalance. It is however suggested that more research be done on these imbalances so that more conclusive evidence can be obtained and later utilized for initiatives of change. Based on research and the findings of the survey, Riyada consulting offers the following recommendations: Recommendations - Financial Education & Modes of Delivery:
Financial education initiatives should be developed to increase financial knowledge, strengthen capacity and promote responsible financial behavior among the most marginalized populations of the West Bank and Gaza, i.e., seniors, women, youth, residents of refugee camps, and rural populations. The study has revealed that the top educational desires of those residing in the West Bank and Gaza are: a better understanding of what information a user should pay attention to when signing a contract with a bank or other financial service providers, and a better understanding of what consumer rights protections laws are available and exactly what should/can be done when there is suspicion that a person’s consumer rights are being violated by a financial institution. Thus, it is recommended that all future financial education initiatives include, and if necessary emphasize these educational desires. 1. Financial literacy and consumer awareness education should be delivered through mass media;
mass media should be utilized to elevate consumer awareness and increase financial literacy in the West Bank and Gaza.
� Rationale: A major finding of the study is that mass media organizations are considered by Palestinians to be the most capable of providing effective financial literacy programs to Palestinians; this was followed by

54
commercial banks, and NGOs or public institutions. By definition, ‘mass media’ is media which is intended for a large audience, e.g., broadcast media (television, radio), print media (newspapers, magazines), and the internet. In the 21st century, technology and its relation to mass media has become integral to education and knowledge sharing. If efforts are combined among institutions, consumers, and other stakeholders, mass media should be able to contribute considerably to a target populations level of financial literacy and also support better understanding of consumer protection laws and regulations. Mass media has become a powerful channel and tool for communicating knowledge and ideas; communication campaigns can initiate behavioral change if simple and clear messages are transmitted at a high frequency (unremitting exposure to information is key). As the study has confirmed, mass media can potentially play a major role in the implementation of a financial education strategy in Gaza and the West Bank; there is indeed room for the use of new information, communication tools and innovations. Moreover, mass media has proven to be an effective tool to multiply a message in various channels, and for reaching target groups from multiple directions. Mass media campaigns require that the public sector, financial institutions, educators, economists, sociologists, and experienced practitioners collaborate with media relations experts to tailor an effective financial literacy and consumer awareness campaign. This may involve paper, electronic and social media, and the internet. Some examples of financial literacy initiatives that mass media organizations have used are: a series of short educational videos accessed via the internet, educational podcasts (audio, video) and television and/or radio programs.
� Remedial action needed:
o Utilizing mass media, introduce a financial literacy and consumer awareness campaign targeting youth (under 18). The campaign/program should focus on the use of comic books, short YouTube style videos, economic games, television series and other appropriate forms of mass media that cater to the younger demographic.
o Utilizing mass media, introduce a financial literacy and consumer awareness campaign targeting adults (above 31). The campaign/program should focus on the use of multi-week adult education programs on television, TV series/ soap operas, documentaries (testimonies/success stories), and print publications (newspapers, magazines); the study revealed that the above 31 age group was most likely to read newspapers.
o Utilizing mass media, introduce a financial literacy and consumer awareness campaign targeting adults (above 61). The campaign/program should focus on the use of radio programming and print publications; the study revealed that the above 61 age group was most likely to access information via radio than any other age group.
2. Financial literacy and consumer awareness education should be incorporated into the
educational system, preferably at early stages:
� Rationale:
Survey data has indicated that education is the most explicit indicator of financial literacy and consumer awareness; furthermore, the study has found that that financial awareness and consumer awareness was most prevalent among those with degrees in higher education. Financial behavior was

55
also found to be linked to level of education. In fact data reveals that the higher the level of education, the more likely people would practice financial planning. Higher education was also a determinant of familiarity with financial institutions.
From this, it can be deduced that financial literacy and consumer awareness would be increased dramatically if it were to became incorporated into the curriculum of both primary and – to a larger extent – secondary education. As a large portion of the people in the West Bank and Gaza are under the age of 18 and live under socio-economic conditions that limit their access to institutions of higher education, it is recommended that a financial literacy and consumer awareness program be introduced into the education system. This initiative should focus on encouraging Palestinian youth to change their attitudes and begin planning and organizing their future by better utilizing available resources, including reputable and accessible financial services providers.
A national, regionally customized financial education program targeting youth could be developed loosely using the templates created by other states and institutions, i.e. the programs created by the State of the New Zealand or the Canadian Foundation for Economic Education’s (CFEE). Since 1974 the CFEE has worked toward the goal of increasing the extent to which Canadians make economic decisions with competence and confidence. CFEE activities include: producing print and multimedia resources for use in classrooms, research, curriculum development, helping teachers improve their teaching techniques, assisting public and private organizations wanting to help educate Canadian youth, and assisting government departments in their information/communication efforts. Established in 1974, by 2009 the CFEE was maintaining a database of more than 5,000 classroom teachers; their resources and programs were reaching over 300,000 Canadian Students each year (SEDI 2009). Similarly, in New Zealand, the Ministry of Education and other agencies have developed a framework for ‘personal financial education’ that is designed to help teach students financial skills for life.
� Remedial action needed:
o Introduction of a youth-targeted financial education program into the primary and secondary schools; this will require the development of a multi-year action plan that is approved, supported, and later introduced by the Ministry of Education.
o Encouraging young students to plan their finances according to their future aspirations and goals. o Teaching teachers how to incorporate financial education into the schools curriculum. o Teaching students the benefits of financial planning, and creating better awareness of the
financial services available to them. o At an early age, and within the program: promote better financial awareness– this should cover
the above mentioned top educational desires.
3. Measures should be developed to strengthen the relationship between financial institutions and consumers:
� Rationale:

56
According to the study, among residents of the West Bank and Gaza, trust in financial services providers is low. Financial institutions must make efforts to build trust and assurances between consumers and financial institutions, e.g., community outreach campaigns, more transparent policies, and clearer terms and conditions for financial services. Research shows that commercial banks were – according to survey respondents – the second most appropriate provider/facilitator of financial literacy programs in the West Bank and Gaza. If better efforts are made to reinforce trust between financial institutions and consumers, commercial banks will be able to harvest this trust, and thus will be able to more effectively provide services to target groups. This trust can also be utilized when facilitating financial literacy and consumer education programs to target groups. Initiatives could be made to lower the level of distrust between financial institutions and consumers. As data shows that a large percentage of the population of the West Bank and Gaza distrust financial services providers, building and nurturing trust between consumers and institutions should be considered a core objective.
� Remedial action needed:
o Financial institutions and other stakeholders should exert more efforts to increase consumer awareness, and better understanding of ways in which financial institutions can better serve target groups.
o Financial institutions and the public sector should coordinate to provide assurances to consumers by discrediting misinformation and falsities about financial institutions and their services.

57
7. References: Cole, Shawn, Thomas Sampson and Bilal Zia (2009). ‘Financial Literacy, Financial Decisions, and the Demand for Financial Services: Evidence from India and Indonesia. Journal of Finance. Available at: http://www.hbs.edu/research/pdf/09-117.pdf Ferguson, R.W. (2002) Reflection on financial literacy. Remarks by vice chairman Roger W. Ferguson, Jr. before the National Council on Economic Education, Washington, D.C.. Available at: http://www.federalreserve.gov/boarddocs/speeches/2002/20020513/default.htm. Hilgert, M., Hogarth, J., and Beverley, S. (2003). ‘Household financial management: The connection between knowledge and behavior’. Federal Reserve Bulletin. Technical report #309. Hung, Angela A, Andrew M. Parker and Joanne K. Yoong (2009). ‘Defining and Measuring Financial Literacy’. Rand, Labor and Population. Available at: http://www.rand.org/content/dam/rand/pubs/working_papers/2009/RAND_WR708.pdf Jensen, A. R. (1998). The g factor. Westport, CT: Praeger. Lerman, Robert I. and Elizabeth Bell (2006). ‘Where Do We Go From Here?’. Opportunity and Ownership Project. Indianapolis: The Urban Institute, Center on Labor, Human Services, and Population. Lusardi, A. (2008). Financial literacy: An essential tool for informed consumer choice? Dartmouth College Working Paper. Lusardi, A., and Mitchell, O.S. (2006). Financial literacy and planning: Implications for retirement wellbeing. Wharton School, University of Pennsylvania, Pension Research Council Working Paper n. 1. Lusardi, A., and Mitchell, O.S. (2008). ‘Planning and financial literacy: How do women fare?’ American Economic Review: Papers & Proceedings 98: 413-417. Mandell, L. (2007). ‘Financial literacy of high school students’. In J.J. Xiao (Ed.), Handbook of Consumer Finance Research (pp. 163-183). New York, NY: Springer. Moore, D. (2003). Survey of Financial Literacy in Washington State: Knowledge, Behavior, Attitudes, and Experiences. Technical Report n. 03-39, Social and Economic Sciences Research Center, Washington State University. OECD (2005). (OECD) Improving financial literacy: Analysis of issues and policies. Organization for Economic Co-operation and Development. Available at: http://titania.sourceoecd.org/vl=4607980/cl=25/nw=1/rpsv/ij/oecdthemes/9998007x/v200 5n30/s1/p1l.

58
Parker, A.M., Yoong, J., Bruine de Bruin, W., Willis, R. (2008). ‘Over Confidence and Economic Behavior.’Paper presented at the Conference on Understanding Economic Decision-Making. Jackson, WY. Available at: https://mmicdata.rand.org/alp/index.php/(Over)confidence_and_economic_behavior PACFL (2008). ‘Annual Report to the President.’. President’s Advisory Council on Financial Literacy. Available at: http://www.treas.gov/offices/domestic-finance/financial-institution/fineducation/ council/index.shtml. Schagen, S. (1997). The Evaluation of NatWest Face 2 Face with Finance. NFER. Available at: http://www.prnewswire.co.uk/cgi/news/release?id=51122 SEDI (2009). ‘Financial Literacy: Strategies To Meet The Needs of Low Income Albertans’ Available at: http://www.sedi.org/DataRegV2-unified/sedi-Reports/Strategies%20to%20meet%20the%20needs%20of%20low%20income%20Albertans.pdf Stanovich, K. E., and West, R. F. (2000). ‘Individual differences in reasoning: implications for the rationality debate?.’ Behavioral and Brain Sciences 23: 645–726. World Bank (2008,2010) http://www.worldbank.org/financialcrisis/ Zia, Bilal (2010). ‘The Fad of Financial Literacy?’. Blogs. World Bank: All About Finance. Available at: http://blogs.worldbank.org/allaboutfinance/the-fad-of-financial-literacy
Zia, Bilal (2011) ‘The Impact of Financial Literacy Around the World’: Motivation, Existing Evidence, and Upcoming Evaluations’. Presented on behalf of the World Bank during the Dime Conference, June 2011.

59
8. Annexes:
Agenda
Workshop on Financial Sector Consumer Awareness
Leaders Hall, Ramallah June 28, 2011
9:00 – 9:30 Registration
9:30 – 10:00 Opening Remarks
- Moderator: Rasha Ramaa, Association of Banks of Palestine - Mr. Ali Faroun, Director, Market Conduct and Consumer Awareness Division, Palestinian
Monetary Authority - Ms. Abeer Odeh, Chief Executive Officer, Palestinian Capital Markets Authority - John Crihfield, Director, Private Enterprise Office, USAID
10:00-11:00 World Bank Presentation on Results of Financial Capabilities Survey
- Mrs. Shuaa Marrar, Director, Riyada Consulting - Mr. Tomas Prouza, Consultant, World Bank
11:00-11:30 Coffee Break
11:30-12:30 Presentations about Current Consumer Awareness and Protection Activities - Mr. Ali Faroun, Palestinian Monetary Authority - Ms. Abeer Odeh, Palestinian Capital Markets Authority - Nihad Assad, Palestinian Insurance Federation
12:30 – 14:00 Discussion Related to Financial Sector Consumer Awareness
14:00-15:00 Lunch

60


![ENTERPRISE SURVEYS/media/GIAWB/...The Enterprise Surveys collect a wide array of qualitative and quantitative information through face to face ... [fin3] Proportion of](https://img.pdfslide.us/doc/110x75/5aea49ec7f8b9a45568b9b52/enterprise-mediagiawbthe-enterprise-surveys-collect-a-wide-array-of-qualitative.jpg)