Embed Size (px)
Citation preview
Comprehensive ProjectBy Melissa Joy
Background Information on Probability
Intro to Fay’s Formula
Notation
Overview of the method behind Fay’s Formula
Breast cancer example using raw data
Table of age conditional breast cancer risk
Table of age conditional cancer risk (all sites)
Bibliography
Thank you’s
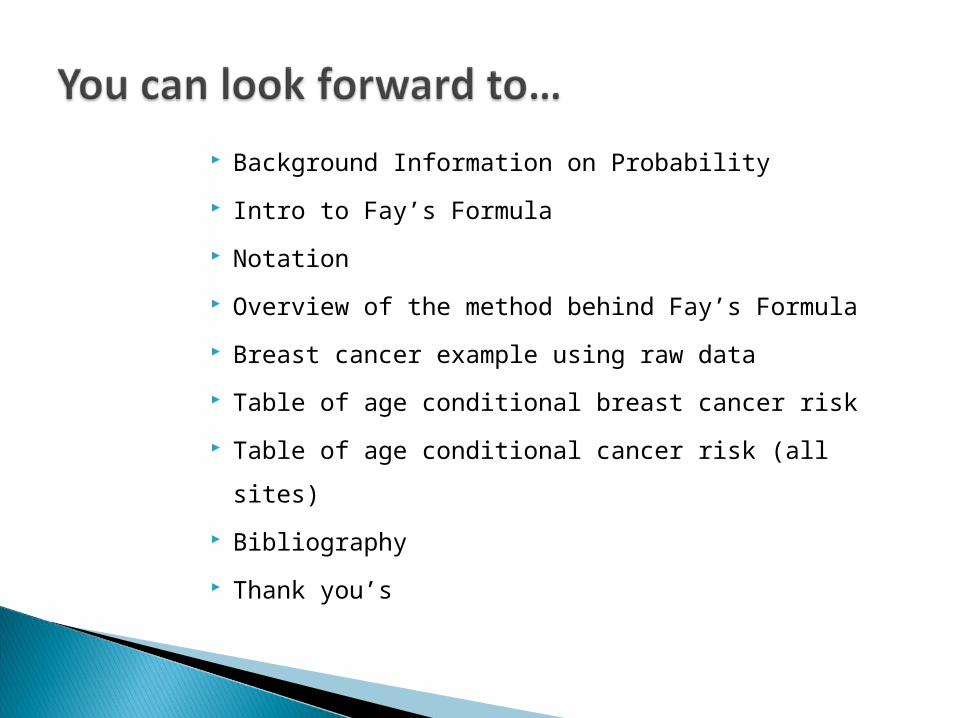
Probability is the likelihood or chance that something will
happen
Conditional Probability is the probability of some event A,
given the occurrence of some other event B.
◦ It is written P(A|B)
◦ It is said “the probability of A, given B”◦ P(A|B) = P(A ∩ B)
P(B)
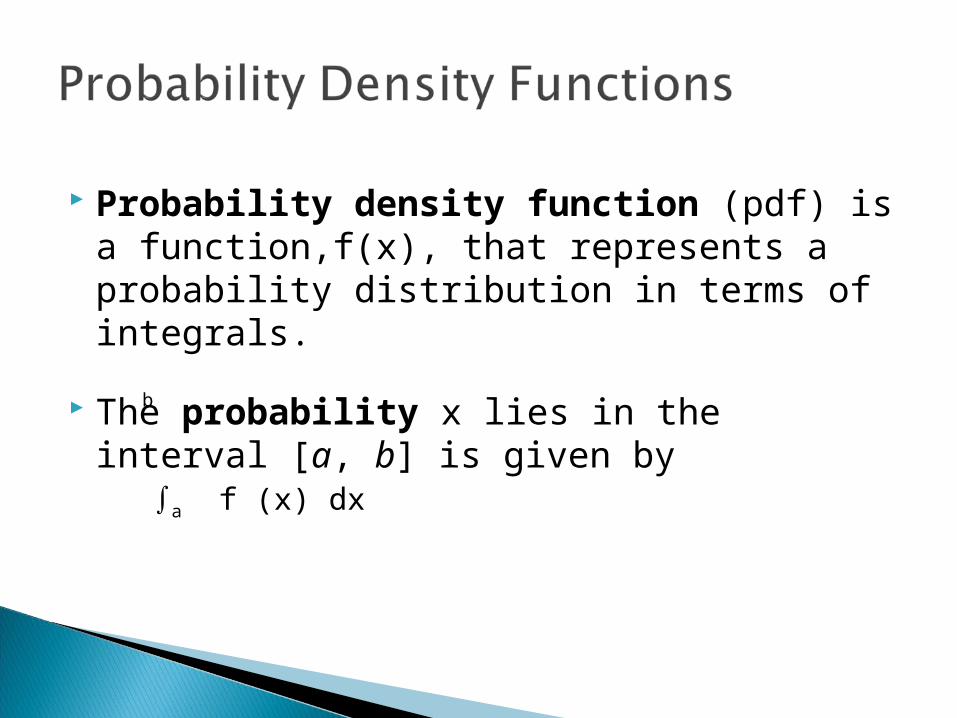
Probability density function (pdf) is a function,f(x), that represents a probability distribution in terms of integrals.
The probability x lies in the interval [a, b] is given by ∫a f (x) dxb
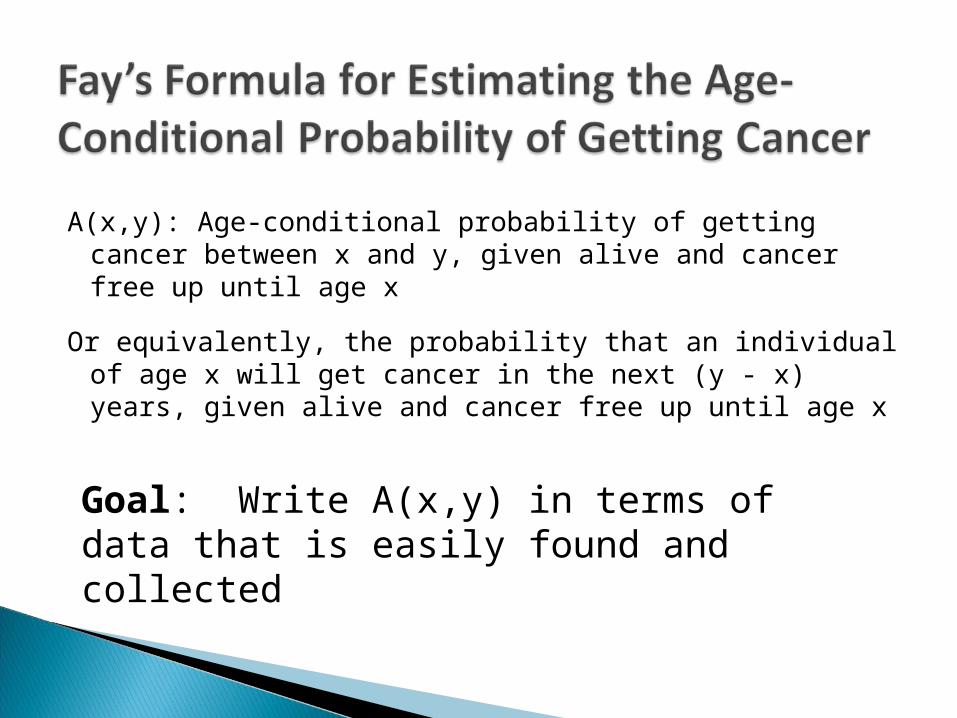
A(x,y): Age-conditional probability of getting cancer between x and y, given alive and cancer free up until age x
Or equivalently, the probability that an individual of age x will get cancer in the next (y - x) years, given alive and cancer free up until age x
Goal: Write A(x,y) in terms of data that is easily found and collected
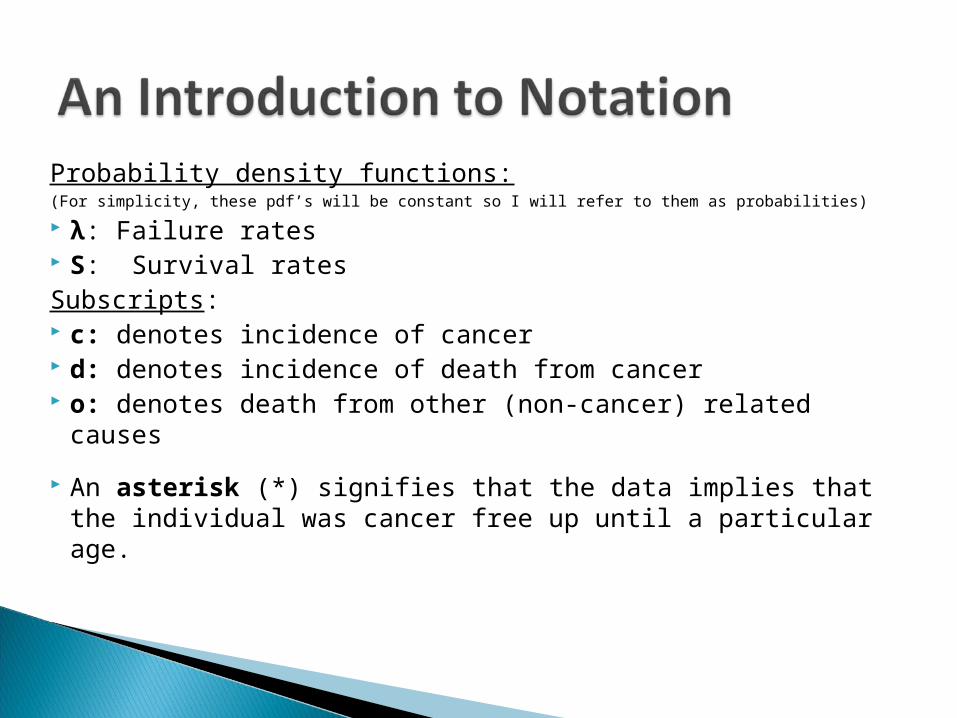
Probability density functions:(For simplicity, these pdf’s will be constant so I will refer to them as probabilities)
λ: Failure rates S: Survival ratesSubscripts: c: denotes incidence of cancer d: denotes incidence of death from cancer o: denotes death from other (non-cancer) related causes
An asterisk (*) signifies that the data implies that the individual was cancer free up until a particular age.
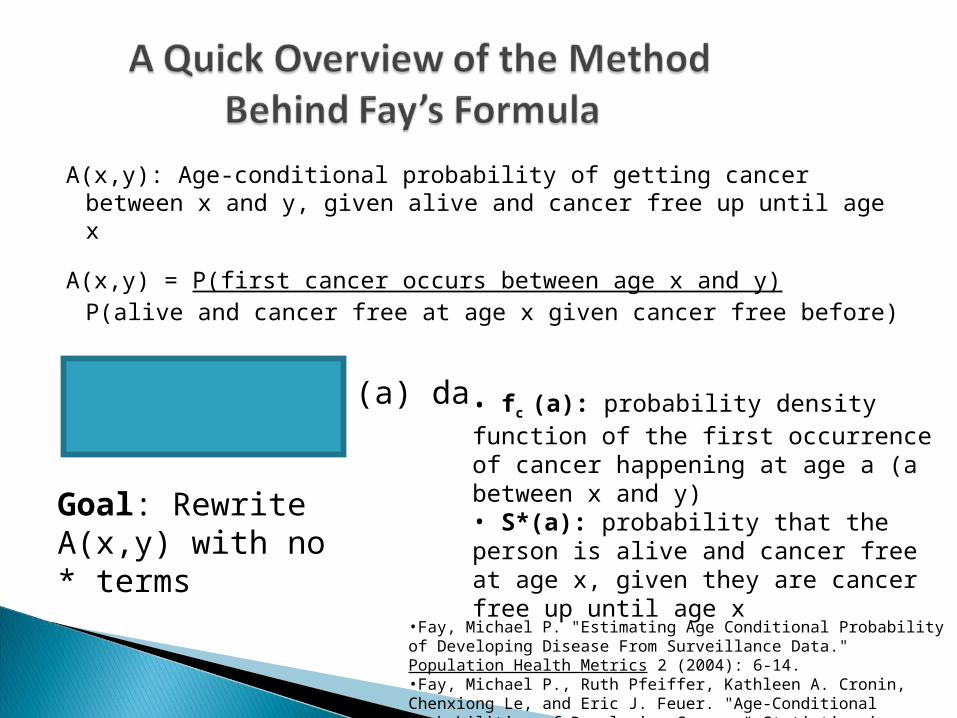
A(x,y): Age-conditional probability of getting cancer between x and y, given alive and cancer free up until age x
A(x,y) = P(first cancer occurs between age x and y)P(alive and cancer free at age x given cancer free before)
A(x,y) = ∫x fc (a) da S* (x)
Goal: Rewrite A(x,y) with no * terms
• fc (a): probability density function of the first occurrence of cancer happening at age a (a between x and y)• S*(a): probability that the person is alive and cancer free at age x, given they are cancer free up until age x
y
•Fay, Michael P. "Estimating Age Conditional Probability of Developing Disease From Surveillance Data." Population Health Metrics 2 (2004): 6-14.•Fay, Michael P., Ruth Pfeiffer, Kathleen A. Cronin, Chenxiong Le, and Eric J. Feuer. "Age-Conditional Probabilities of Developing Cancer." Statistics in Medicine 22 (2003): 1837-1848.
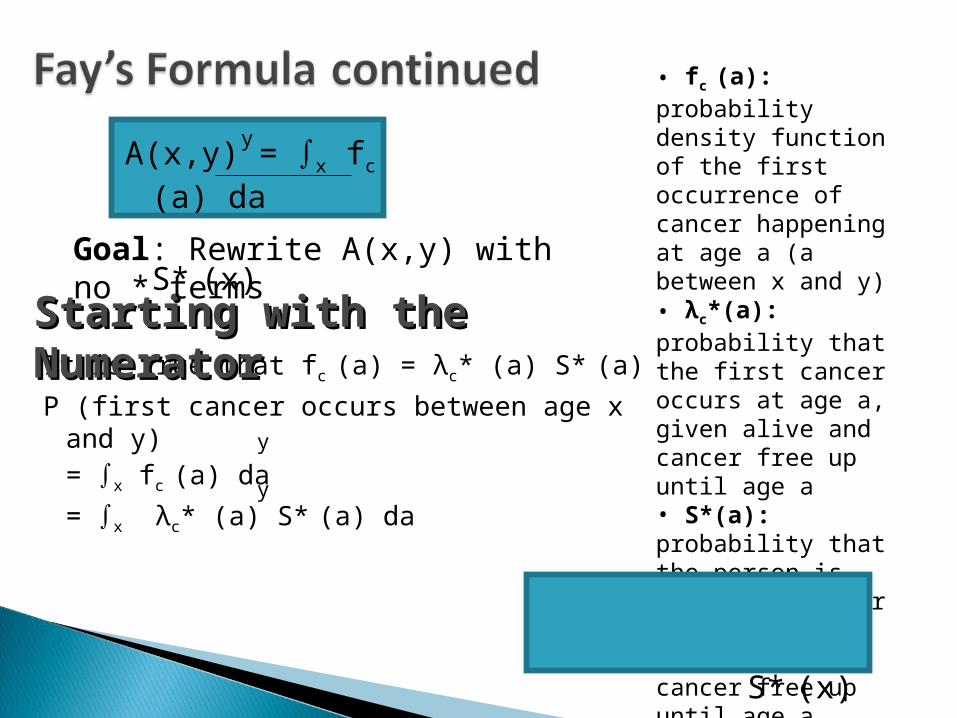
It is true that fc (a) = λc* (a) S* (a)
P (first cancer occurs between age x and y) = ∫x fc (a) da
= ∫x λc* (a) S* (a) da
• fc (a): probability density function of the first occurrence of cancer happening at age a (a between x and y)• λc*(a): probability that the first cancer occurs at age a, given alive and cancer free up until age a• S*(a): probability that the person is alive and cancer free at age a, given they are cancer free up until age a
yA(x,y) = ∫x fc (a) da
S* (x)
y
y
Starting with the NumeratorStarting with the Numerator
Goal: Rewrite A(x,y) with no * terms
A(x,y) = ∫x λc*(a) S*(a) da S* (x)
y
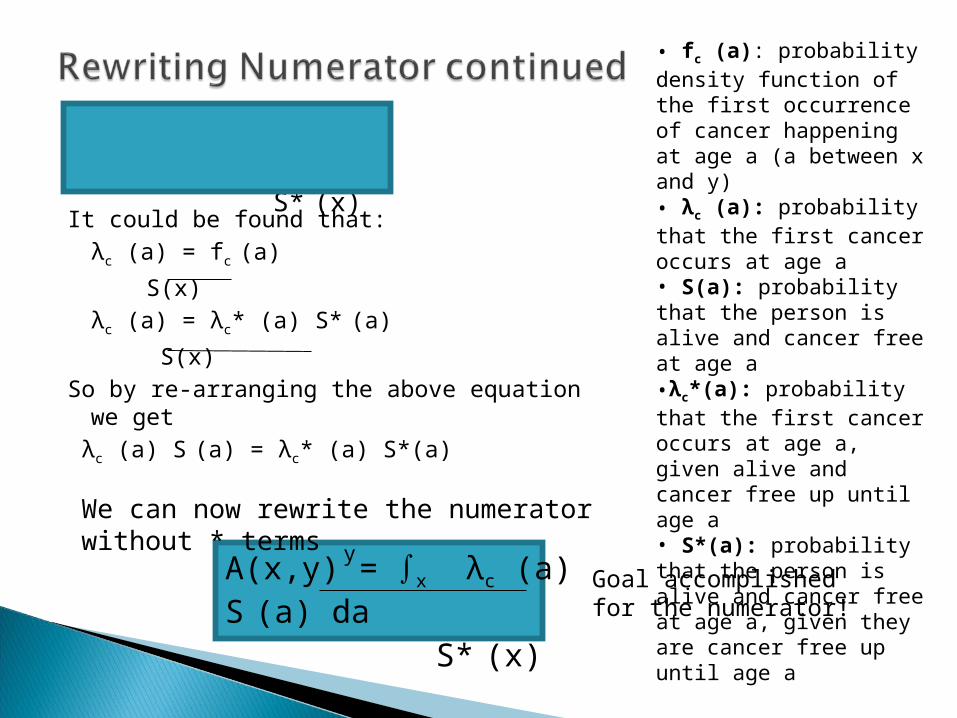
It could be found that:λc (a) = fc (a)
S(x) λc (a) = λc* (a) S* (a)
S(x)So by re-arranging the above equation we get λc (a) S (a) = λc* (a) S*(a)
• fc (a): probability density function of the first occurrence of cancer happening at age a (a between x and y)• λc (a): probability that the first cancer occurs at age a• S(a): probability that the person is alive and cancer free at age a•λc*(a): probability that the first cancer occurs at age a, given alive and cancer free up until age a• S*(a): probability that the person is alive and cancer free at age a, given they are cancer free up until age a
A(x,y) = ∫x λc (a) S (a) da S* (x)
y
We can now rewrite the numerator without * terms
Goal accomplished for the numerator!
A(x,y) = ∫x λc*(a) S*(a) da S* (x)
y
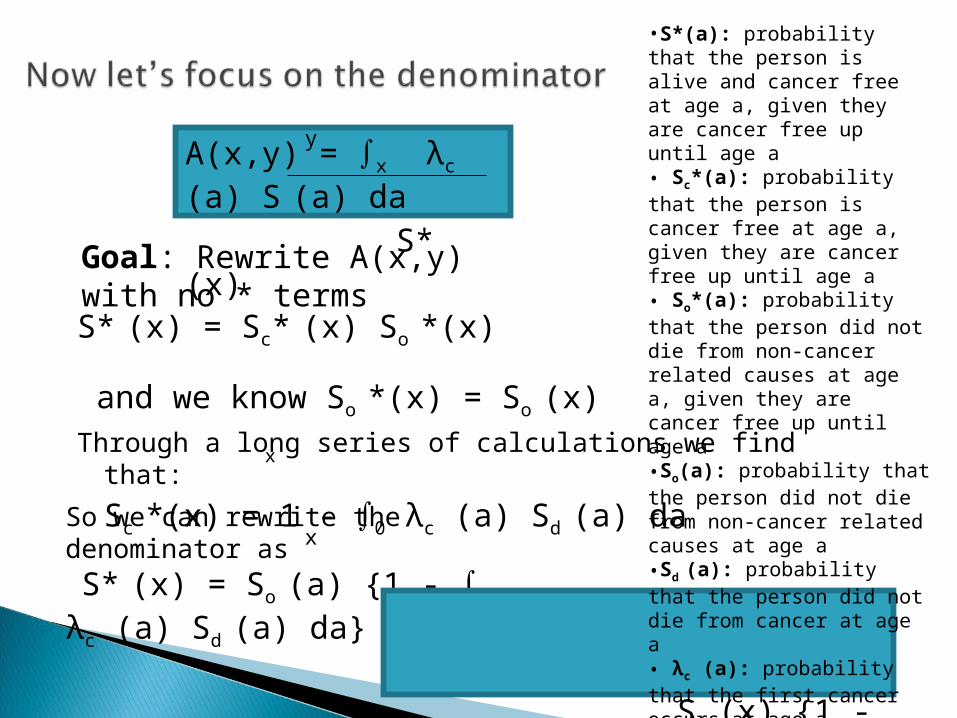
S* (x) = Sc* (x) So *(x)
and we know So *(x) = So (x) Through a long series of calculations we find that:
Sc *(x) = 1 - ∫0 λc (a) Sd (a) da
A(x,y) = ∫x λc (a) S (a) da S* (x)
So we can rewrite the denominator as S* (x) = So (a) {1 - ∫0 λc (a) Sd (a) da}
y
x
x
Goal: Rewrite A(x,y) with no * terms
A(x,y) = ∫x λc (a) S (a) da So (x) {1 - ∫0 λc (a) Sd (a) da}
y
x
•S*(a): probability that the person is alive and cancer free at age a, given they are cancer free up until age a• Sc*(a): probability that the person is cancer free at age a, given they are cancer free up until age a• So*(a): probability that the person did not die from non-cancer related causes at age a, given they are cancer free up until age a•So(a): probability that the person did not die from non-cancer related causes at age a•Sd (a): probability that the person did not die from cancer at age a• λc (a): probability that the first cancer occurs at age a• S(a): probability that the person is alive and cancer free at age a
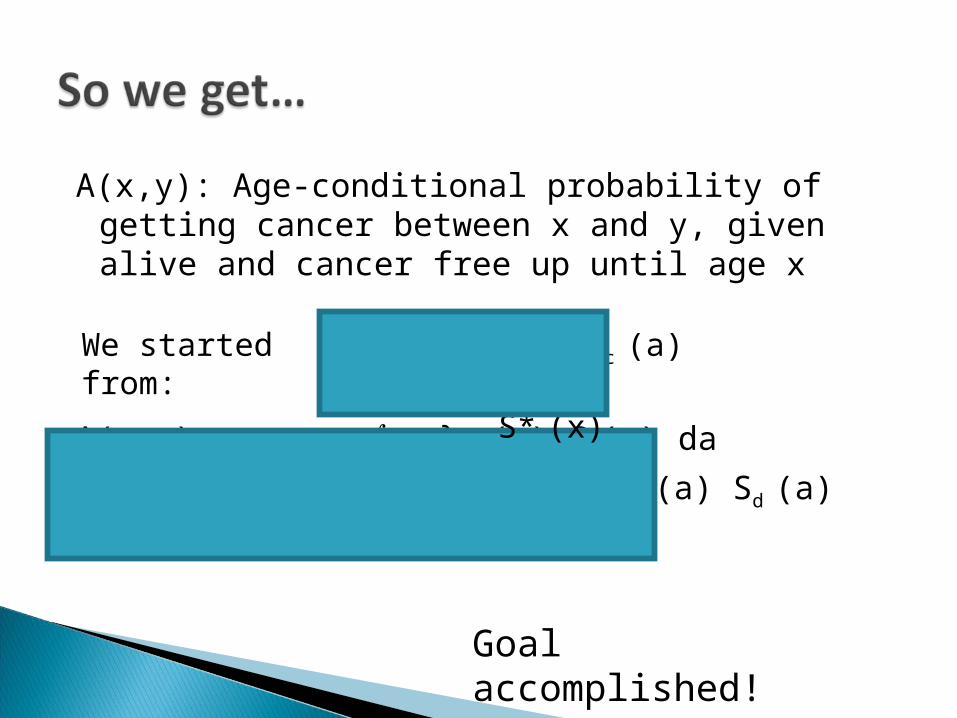
A(x,y): Age-conditional probability of getting cancer between x and y, given alive and cancer free up until age x
A(x,y) = ∫x λc (a) S (a) da So (x) {1 - ∫0 λc (a) Sd (a) da}
y
x
A(x,y) = ∫x fc (a) da S* (x)
yWe started from:
Goal accomplished!
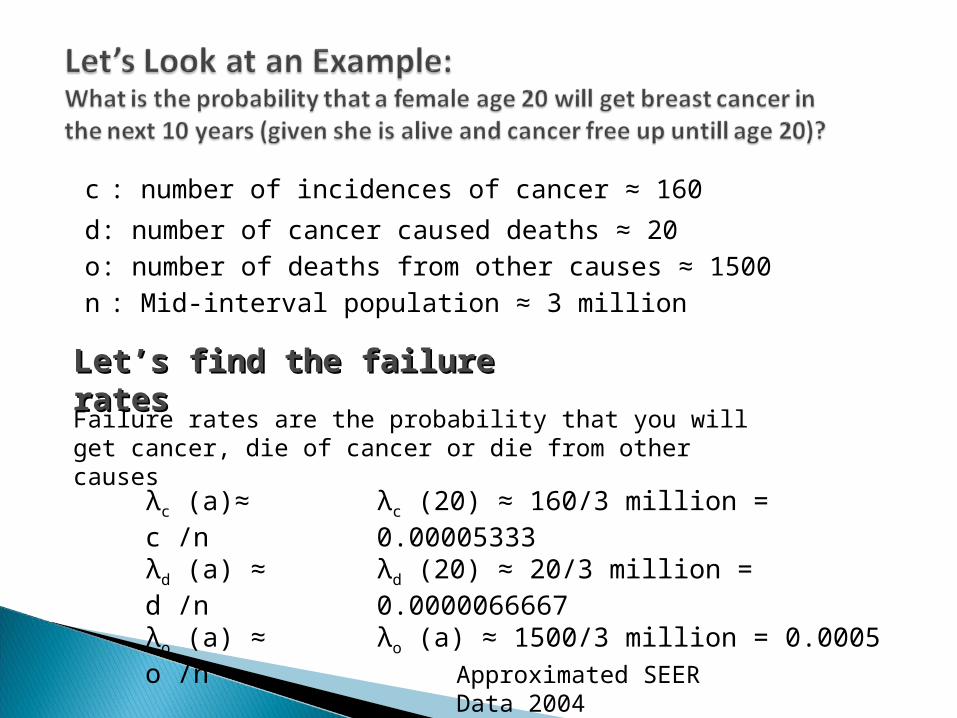
c : number of incidences of cancer ≈ 160
d: number of cancer caused deaths ≈ 20o: number of deaths from other causes ≈ 1500n : Mid-interval population ≈ 3 million
Approximated SEER Data 2004
λc (a)≈ c /nλd (a) ≈ d /n λo (a) ≈ o /n
λc (20) ≈ 160/3 million = 0.00005333λd (20) ≈ 20/3 million = 0.0000066667λo (a) ≈ 1500/3 million = 0.0005
Let’s find the failure ratesLet’s find the failure rates
Failure rates are the probability that you will get cancer, die of cancer or die from other causes
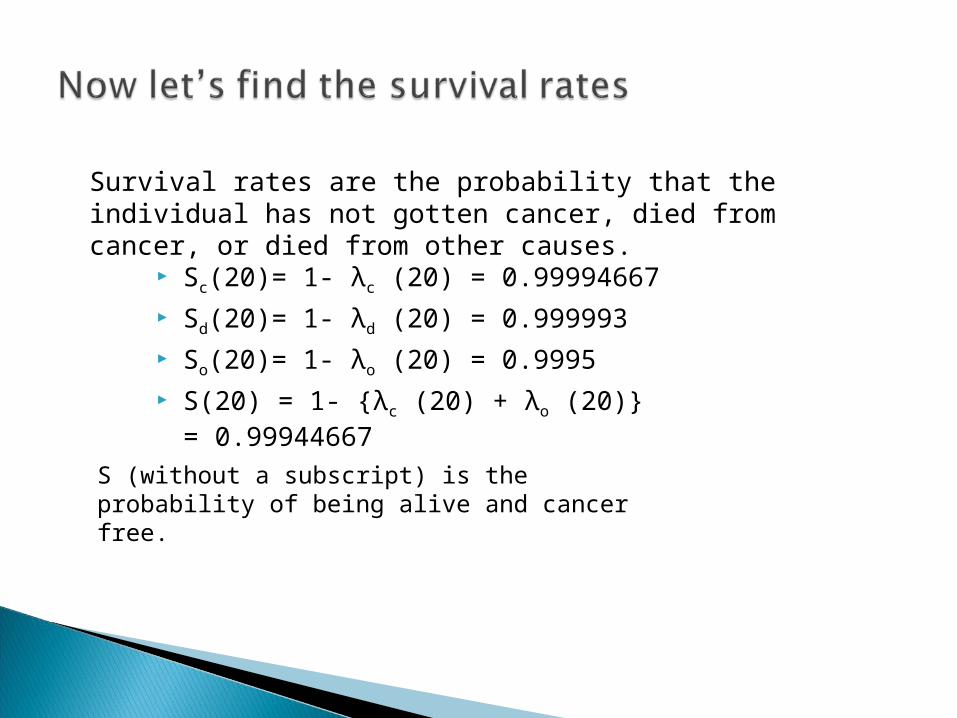
Sc(20)= 1- λc (20) = 0.99994667 Sd(20)= 1- λd (20) = 0.999993 So(20)= 1- λo (20) = 0.9995 S(20) = 1- {λc (20) + λo (20)} = 0.99944667
Survival rates are the probability that the individual has not gotten cancer, died from cancer, or died from other causes.
S (without a subscript) is the probability of being alive and cancer free.
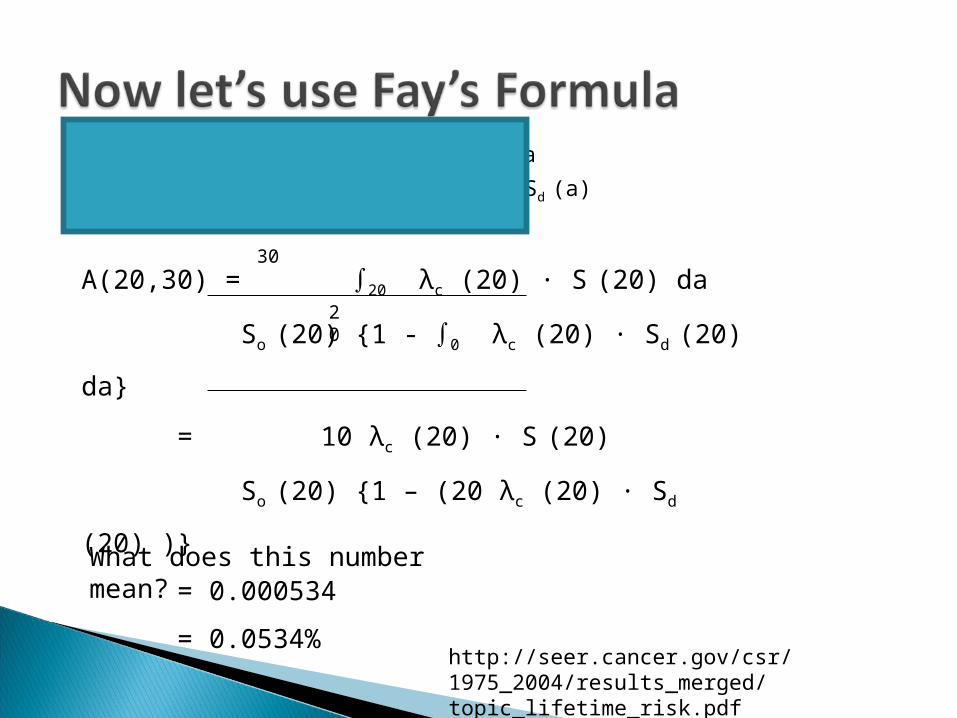
A(x,y) = ∫x λc (a) S∙ (a) da
So (x) {1 - ∫0 λc (a) S∙ d (a) da}
http://seer.cancer.gov/csr/1975_2004/results_merged/topic_lifetime_risk.pdf
A(20,30) = ∫20 λc (20) S∙ (20) da
So (20) {1 - ∫0 λc (20) S∙ d (20) da}
= 10 λc (20) S∙ (20)
So (20) {1 – (20 λc (20) S∙ d (20) )}
= 0.000534
= 0.0534%What does this number mean?
y
x
30
20
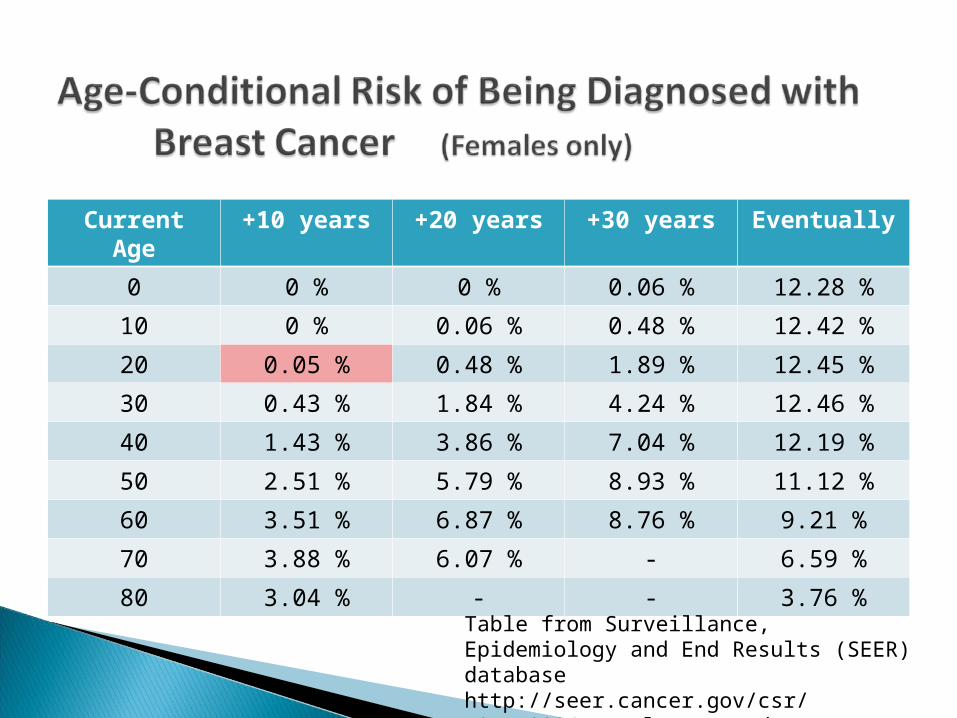
Current Age +10 years +20 years +30 years Eventually
0 0 % 0 % 0.06 % 12.28 %
10 0 % 0.06 % 0.48 % 12.42 %
20 0.05 % 0.48 % 1.89 % 12.45 %
30 0.43 % 1.84 % 4.24 % 12.46 %
40 1.43 % 3.86 % 7.04 % 12.19 %
50 2.51 % 5.79 % 8.93 % 11.12 %
60 3.51 % 6.87 % 8.76 % 9.21 %
70 3.88 % 6.07 % - 6.59 %
80 3.04 % - - 3.76 %
Table from Surveillance, Epidemiology and End Results (SEER) databasehttp://seer.cancer.gov/csr/1975_2004/results_merged/topic_lifetime_risk.pdf
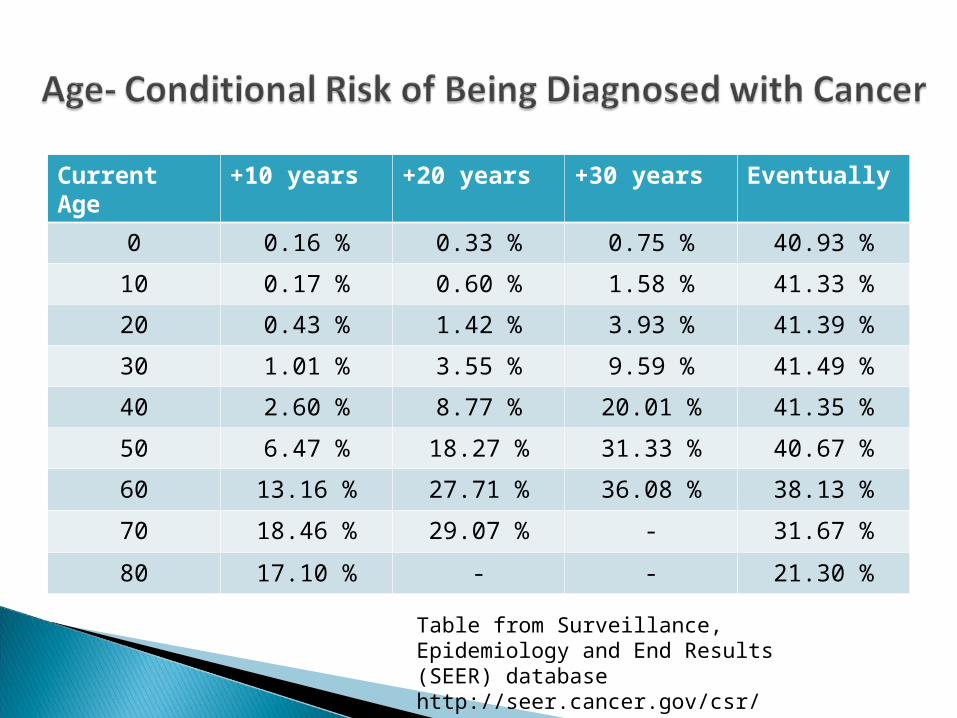
Current Age
+10 years +20 years +30 years Eventually
0 0.16 % 0.33 % 0.75 % 40.93 %
10 0.17 % 0.60 % 1.58 % 41.33 %
20 0.43 % 1.42 % 3.93 % 41.39 %
30 1.01 % 3.55 % 9.59 % 41.49 %
40 2.60 % 8.77 % 20.01 % 41.35 %
50 6.47 % 18.27 % 31.33 % 40.67 %
60 13.16 % 27.71 % 36.08 % 38.13 %
70 18.46 % 29.07 % - 31.67 %
80 17.10 % - - 21.30 %
Table from Surveillance, Epidemiology and End Results (SEER) databasehttp://seer.cancer.gov/csr/1975_2004/results_merged/topic_lifetime_risk.pdf
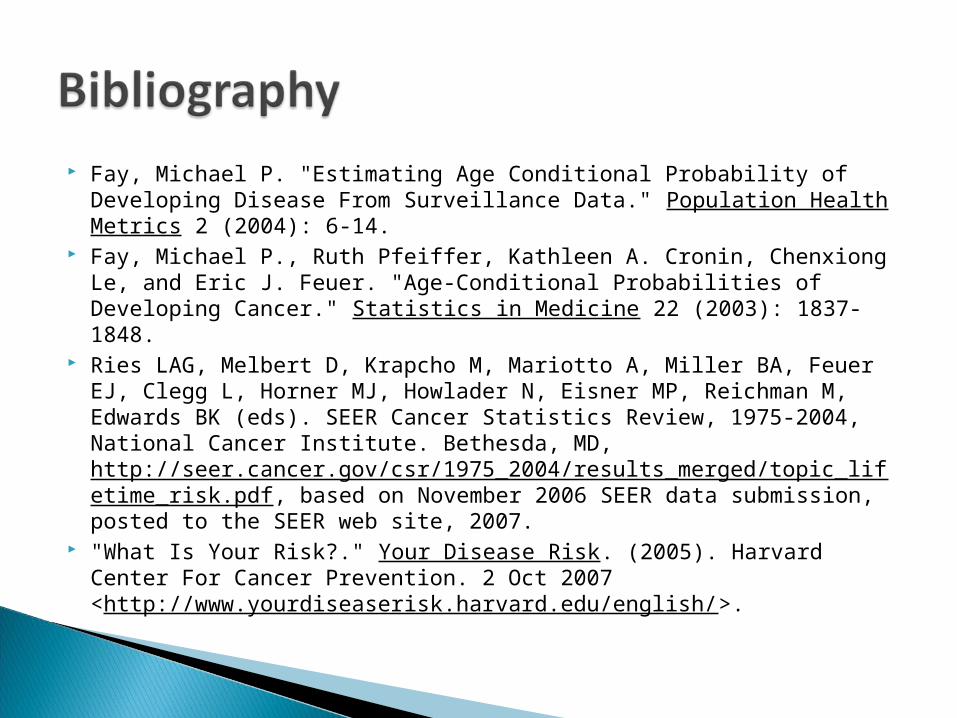
Fay, Michael P. "Estimating Age Conditional Probability of Developing Disease From Surveillance Data." Population Health Metrics 2 (2004): 6-14.
Fay, Michael P., Ruth Pfeiffer, Kathleen A. Cronin, Chenxiong Le, and Eric J. Feuer. "Age-Conditional Probabilities of Developing Cancer." Statistics in Medicine 22 (2003): 1837-1848.
Ries LAG, Melbert D, Krapcho M, Mariotto A, Miller BA, Feuer EJ, Clegg L, Horner MJ, Howlader N, Eisner MP, Reichman M, Edwards BK (eds). SEER Cancer Statistics Review, 1975-2004, National Cancer Institute. Bethesda, MD, http://seer.cancer.gov/csr/1975_2004/results_merged/topic_lifetime_risk.pdf, based on November 2006 SEER data submission, posted to the SEER web site, 2007.
"What Is Your Risk?." Your Disease Risk. (2005). Harvard Center For Cancer Prevention. 2 Oct 2007 <http://www.yourdiseaserisk.harvard.edu/english/>.
Professor Lengyel Professor Buckmire Professor Knoerr And… the entire Oxy math department
THANK YOU!

Go to http://www.yourdiseaserisk.wustl.edu/to calculate your risk and learn what could
raise and lower your risk


![Flashback 8-20-12 Convert interval notation to inequality notation. 1.[-2, 3]2. (-∞, 0) Convert inequality notation to interval notation. 3.-4 ≤ x ≤ 44](https://img.pdfslide.us/doc/110x75/56649e935503460f94b98e88/flashback-8-20-12-convert-interval-notation-to-inequality-notation-1-2.jpg)