Embed Size (px)
Citation preview
Comprehensive numerical approaches for the design and safetyassessment of masonry buildings retrofitted with steel bandsin developing countries: The case of India
India, reinfo
officeental
are lot usingre, an
e susceptible to damage and ing earthquakes, as observed in
4. Unreinforced brick masonry with GI sheet.
⇑ Corresponding author.E-mail address: [email protected] (G. Milani).
Thainswemong Choudhury a, Gabriele Milani b,⇑, Hemant B. Kaushik aa Indian Institute of Technology Guwahati, Indiab Technical University of Milan, Italy
Received 25 October 2014Received in revised form 11 February 2015 Accepted 28 February 2015
1. Introduction
In developing countries like Thailand, etc., a large number of unexists. These include governmentschools, markets and ancient monumnational importance. Most of themseismicity, see Fig. 1, and were builwithout any strengthening measuregular pattern. Such buildings arprone to partial or total collapse dur
Bangladesh, Myanmar, rced masonry buildings s, residential quarters, structures, which are of cated in regions of high traditional technology, d arranging bricks in
strengthened, were severely damaged or collapsed during recent earthquakes [3–6].
The unreinforced brick masonry buildings in the developing countries of South-East Asia, can broadly be classified as:
1. Unreinforced brick masonry with reinforced concrete slab.2. Unreinforced brick masonry with pitched clay tile roof.3. Unreinforced brick masonry walls in mud mortar with timber
roof.
various past earthquakes [1,2]. Past studies have revealed that a large number of unreinforced masonry buildings that were notVulnerability analyses of the above mentioned four categoriesof buildings are carried out by Sinha and Brzev [7], Kumar [8],
Khan and Khalid [9] and Ansary [10], respectively, by consideringvarious building features, like architectural aspects, buildingconfiguration, structural details, load resisting systems, floor androofing system, foundation and site conditions, etc. The analyses
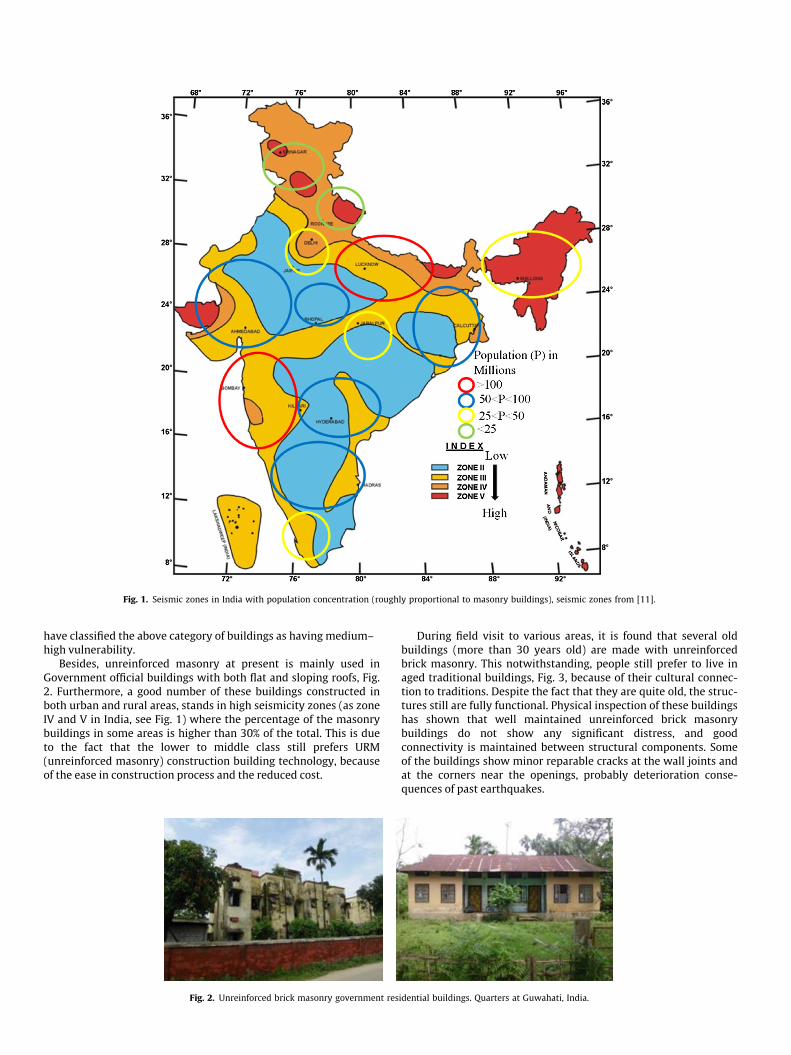
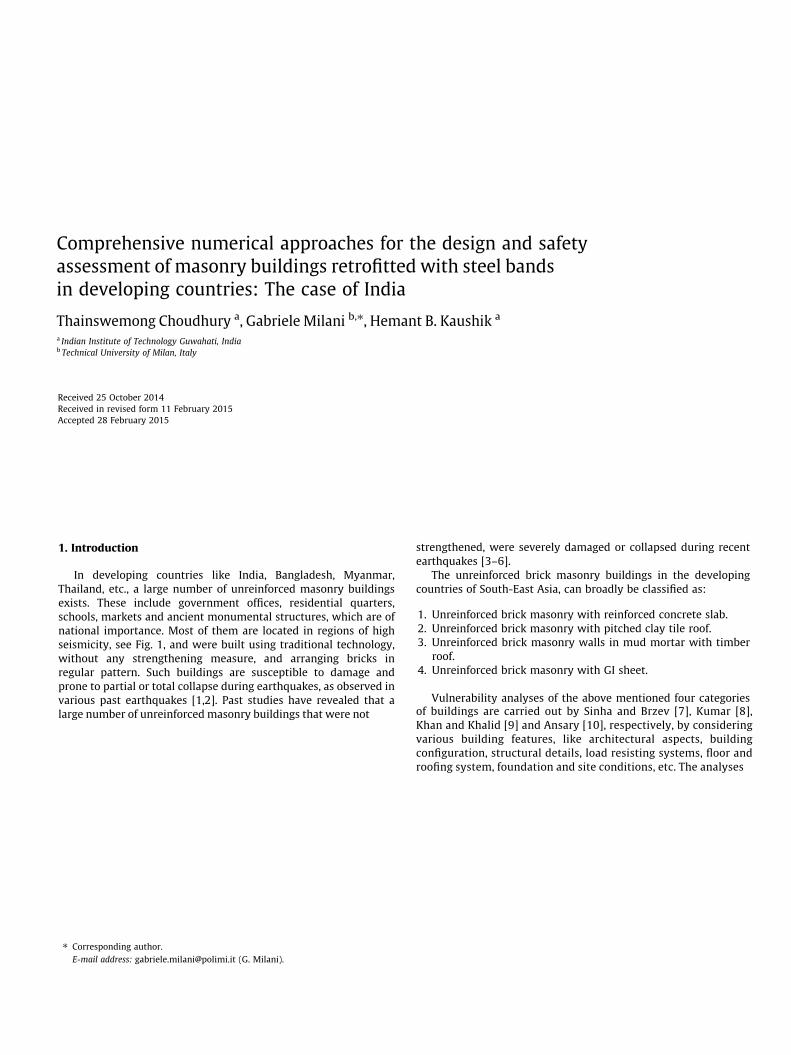
Fig. 1. Seismic zones in India with population concentration (roughly proportional to masonry buildings), seismic zones from [11].
have classified the above category of buildings as having medium–high vulnerability.
Besides, unreinforced masonry at present is mainly used in Government official buildings with both flat and sloping roofs, Fig. 2. Furthermore, a good number of these buildings constructed in both urban and rural areas, stands in high seismicity zones (as zone IV and V in India, see Fig. 1) where the percentage of the masonry buildings in some areas is higher than 30% of the total. This is due to the fact that the lower to middle class still prefers URM (unreinforced masonry) construction building technology, because of the ease in construction process and the reduced cost.
Fig. 2. Unreinforced brick masonry government res
During field visit to various areas, it is found that several old buildings (more than 30 years old) are made with unreinforced brick masonry. This notwithstanding, people still prefer to live in aged traditional buildings, Fig. 3, because of their cultural connec-tion to traditions. Despite the fact that they are quite old, the struc-tures still are fully functional. Physical inspection of these buildings has shown that well maintained unreinforced brick masonry buildings do not show any significant distress, and good connectivity is maintained between structural components. Some of the buildings show minor reparable cracks at the wall joints and at the corners near the openings, probably deterioration conse-quences of past earthquakes.
idential buildings. Quarters at Guwahati, India.
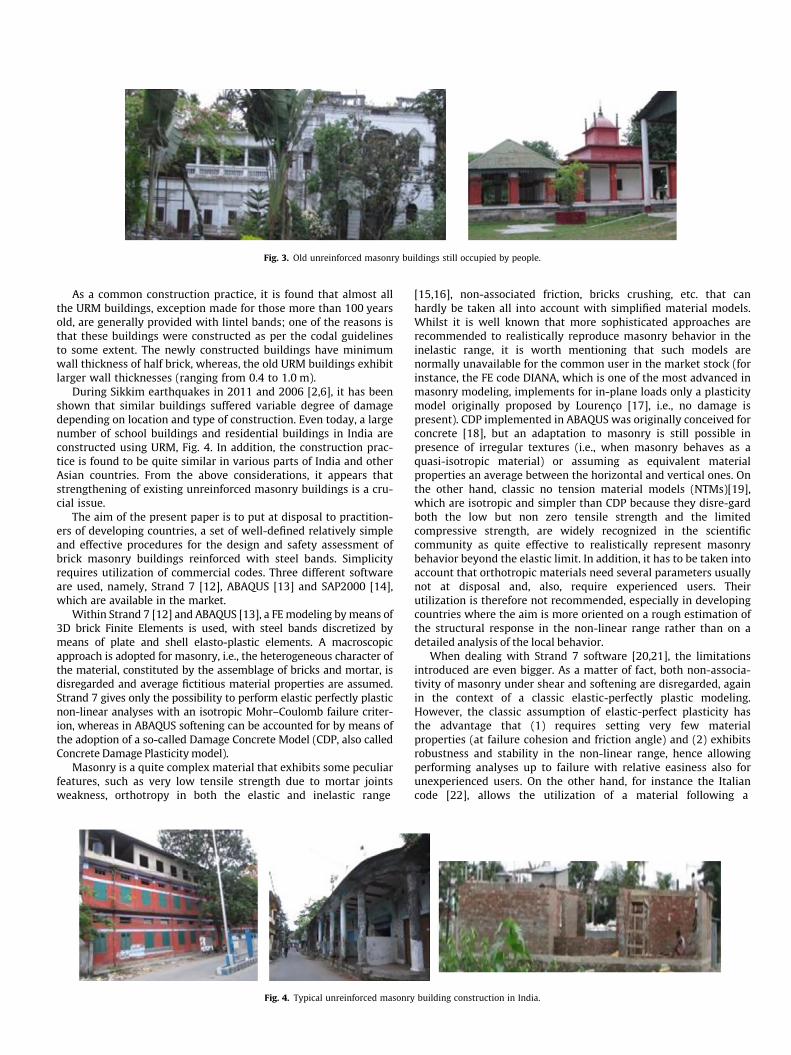
Fig. 3. Old unreinforced masonry buildings still occupied by people.
As a common construction practice, it is found that almost all the URM buildings, exception made for those more than 100 years old, are generally provided with lintel bands; one of the reasons is that these buildings were constructed as per the codal guidelines to some extent. The newly constructed buildings have minimum wall thickness of half brick, whereas, the old URM buildings exhibit larger wall thicknesses (ranging from 0.4 to 1.0 m).
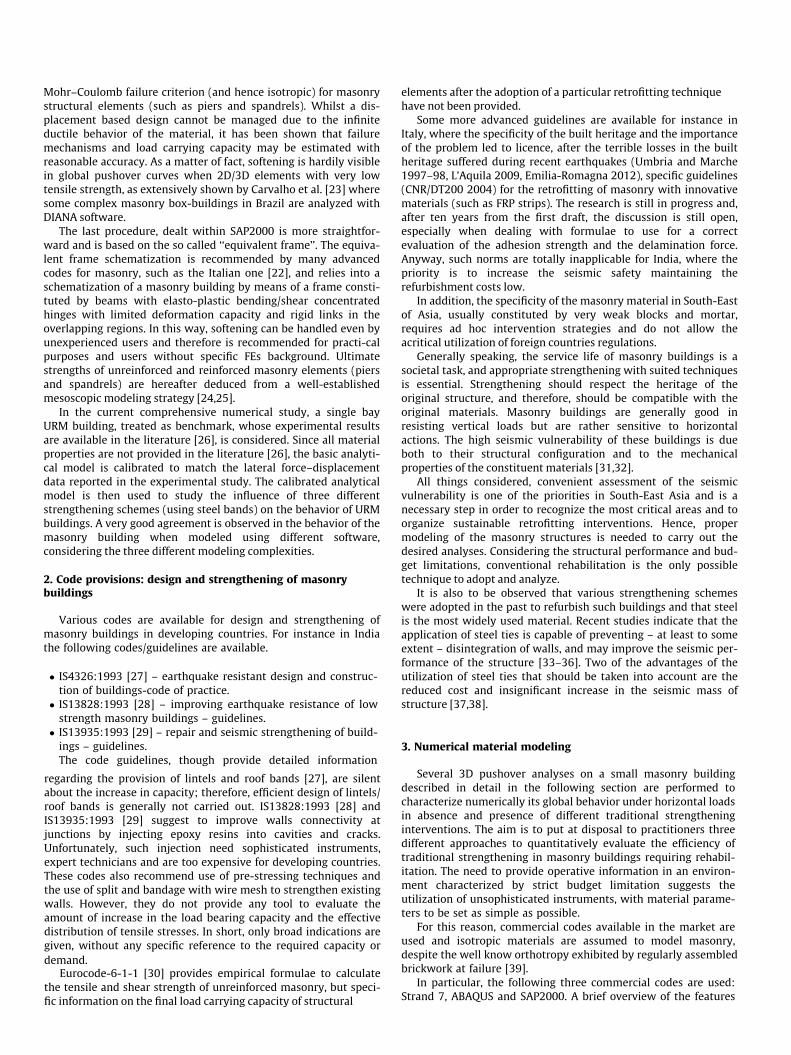
During Sikkim earthquakes in 2011 and 2006 [2,6], it has been shown that similar buildings suffered variable degree of damage depending on location and type of construction. Even today, a large number of school buildings and residential buildings in India are constructed using URM, Fig. 4. In addition, the construction prac-tice is found to be quite similar in various parts of India and other Asian countries. From the above considerations, it appears that strengthening of existing unreinforced masonry buildings is a cru-cial issue.
The aim of the present paper is to put at disposal to practition-ers of developing countries, a set of well-defined relatively simple and effective procedures for the design and safety assessment of brick masonry buildings reinforced with steel bands. Simplicity requires utilization of commercial codes. Three different software are used, namely, Strand 7 [12], ABAQUS [13] and SAP2000 [14], which are available in the market.
Within Strand 7 [12] and ABAQUS [13], a FE modeling by means of 3D brick Finite Elements is used, with steel bands discretized by means of plate and shell elasto-plastic elements. A macroscopic approach is adopted for masonry, i.e., the heterogeneous character of the material, constituted by the assemblage of bricks and mortar, is disregarded and average fictitious material properties are assumed. Strand 7 gives only the possibility to perform elastic perfectly plastic non-linear analyses with an isotropic Mohr–Coulomb failure criter-ion, whereas in ABAQUS softening can be accounted for by means of the adoption of a so-called Damage Concrete Model (CDP, also called Concrete Damage Plasticity model).
Masonry is a quite complex material that exhibits some peculiar features, such as very low tensile strength due to mortar joints weakness, orthotropy in both the elastic and inelastic range
Fig. 4. Typical unreinforced masonry
[15,16], non-associated friction, bricks crushing, etc. that can hardly be taken all into account with simplified material models. Whilst it is well known that more sophisticated approaches are recommended to realistically reproduce masonry behavior in the inelastic range, it is worth mentioning that such models are normally unavailable for the common user in the market stock (for instance, the FE code DIANA, which is one of the most advanced in masonry modeling, implements for in-plane loads only a plasticity model originally proposed by Lourenço [17], i.e., no damage is present). CDP implemented in ABAQUS was originally conceived for concrete [18], but an adaptation to masonry is still possible in presence of irregular textures (i.e., when masonry behaves as a quasi-isotropic material) or assuming as equivalent material properties an average between the horizontal and vertical ones. On the other hand, classic no tension material models (NTMs)[19], which are isotropic and simpler than CDP because they disre-gard both the low but non zero tensile strength and the limited compressive strength, are widely recognized in the scientific community as quite effective to realistically represent masonry behavior beyond the elastic limit. In addition, it has to be taken into account that orthotropic materials need several parameters usually not at disposal and, also, require experienced users. Their utilization is therefore not recommended, especially in developing countries where the aim is more oriented on a rough estimation of the structural response in the non-linear range rather than on a detailed analysis of the local behavior.
When dealing with Strand 7 software [20,21], the limitations introduced are even bigger. As a matter of fact, both non-associa-tivity of masonry under shear and softening are disregarded, again in the context of a classic elastic-perfectly plastic modeling. However, the classic assumption of elastic-perfect plasticity has the advantage that (1) requires setting very few material properties (at failure cohesion and friction angle) and (2) exhibits robustness and stability in the non-linear range, hence allowing performing analyses up to failure with relative easiness also for unexperienced users. On the other hand, for instance the Italian code [22], allows the utilization of a material following a
building construction in India.
Mohr–Coulomb failure criterion (and hence isotropic) for masonry structural elements (such as piers and spandrels). Whilst a dis-placement based design cannot be managed due to the infinite ductile behavior of the material, it has been shown that failure mechanisms and load carrying capacity may be estimated with reasonable accuracy. As a matter of fact, softening is hardily visible in global pushover curves when 2D/3D elements with very low tensile strength, as extensively shown by Carvalho et al. [23] where some complex masonry box-buildings in Brazil are analyzed with DIANA software.
The last procedure, dealt within SAP2000 is more straightfor-ward and is based on the so called ‘‘equivalent frame’’. The equiva-lent frame schematization is recommended by many advanced codes for masonry, such as the Italian one [22], and relies into a schematization of a masonry building by means of a frame consti-tuted by beams with elasto-plastic bending/shear concentrated hinges with limited deformation capacity and rigid links in the overlapping regions. In this way, softening can be handled even by unexperienced users and therefore is recommended for practi-cal purposes and users without specific FEs background. Ultimate strengths of unreinforced and reinforced masonry elements (piers and spandrels) are hereafter deduced from a well-established mesoscopic modeling strategy [24,25].
In the current comprehensive numerical study, a single bay URM building, treated as benchmark, whose experimental results are available in the literature [26], is considered. Since all material properties are not provided in the literature [26], the basic analyti-cal model is calibrated to match the lateral force–displacement data reported in the experimental study. The calibrated analytical model is then used to study the influence of three different strengthening schemes (using steel bands) on the behavior of URM buildings. A very good agreement is observed in the behavior of the masonry building when modeled using different software, considering the three different modeling complexities.
2. Code provisions: design and strengthening of masonry buildings
Various codes are available for design and strengthening of masonry buildings in developing countries. For instance in India the following codes/guidelines are available.
� IS4326:1993 [27] – earthquake resistant design and construc-tion of buildings-code of practice.� IS13828:1993 [28] – improving earthquake resistance of low
strength masonry buildings – guidelines.� IS13935:1993 [29] – repair and seismic strengthening of build-
ings – guidelines.The code guidelines, though provide detailed information
regarding the provision of lintels and roof bands [27], are silent about the increase in capacity; therefore, efficient design of lintels/roof bands is generally not carried out. IS13828:1993 [28] and IS13935:1993 [29] suggest to improve walls connectivity at junctions by injecting epoxy resins into cavities and cracks. Unfortunately, such injection need sophisticated instruments, expert technicians and are too expensive for developing countries. These codes also recommend use of pre-stressing techniques and the use of split and bandage with wire mesh to strengthen existing walls. However, they do not provide any tool to evaluate the amount of increase in the load bearing capacity and the effective distribution of tensile stresses. In short, only broad indications are given, without any specific reference to the required capacity or demand.
Eurocode-6-1-1 [30] provides empirical formulae to calculate the tensile and shear strength of unreinforced masonry, but speci-fic information on the final load carrying capacity of structural
elements after the adoption of a particular retrofitting technique have not been provided.
Some more advanced guidelines are available for instance in Italy, where the specificity of the built heritage and the importance of the problem led to licence, after the terrible losses in the built heritage suffered during recent earthquakes (Umbria and Marche 1997–98, L’Aquila 2009, Emilia-Romagna 2012), specific guidelines (CNR/DT200 2004) for the retrofitting of masonry with innovative materials (such as FRP strips). The research is still in progress and, after ten years from the first draft, the discussion is still open, especially when dealing with formulae to use for a correct evaluation of the adhesion strength and the delamination force. Anyway, such norms are totally inapplicable for India, where the priority is to increase the seismic safety maintaining the refurbishment costs low.
In addition, the specificity of the masonry material in South-East of Asia, usually constituted by very weak blocks and mortar, requires ad hoc intervention strategies and do not allow the acritical utilization of foreign countries regulations.
Generally speaking, the service life of masonry buildings is a societal task, and appropriate strengthening with suited techniques is essential. Strengthening should respect the heritage of the original structure, and therefore, should be compatible with the original materials. Masonry buildings are generally good in resisting vertical loads but are rather sensitive to horizontal actions. The high seismic vulnerability of these buildings is due both to their structural configuration and to the mechanical properties of the constituent materials [31,32].
All things considered, convenient assessment of the seismic vulnerability is one of the priorities in South-East Asia and is a necessary step in order to recognize the most critical areas and to organize sustainable retrofitting interventions. Hence, proper modeling of the masonry structures is needed to carry out the desired analyses. Considering the structural performance and bud-get limitations, conventional rehabilitation is the only possible technique to adopt and analyze.
It is also to be observed that various strengthening schemes were adopted in the past to refurbish such buildings and that steel is the most widely used material. Recent studies indicate that the application of steel ties is capable of preventing – at least to some extent – disintegration of walls, and may improve the seismic per-formance of the structure [33–36]. Two of the advantages of the utilization of steel ties that should be taken into account are the reduced cost and insignificant increase in the seismic mass of structure [37,38].
3. Numerical material modeling
Several 3D pushover analyses on a small masonry buildingdescribed in detail in the following section are performed to characterize numerically its global behavior under horizontal loads in absence and presence of different traditional strengthening interventions. The aim is to put at disposal to practitioners three different approaches to quantitatively evaluate the efficiency of traditional strengthening in masonry buildings requiring rehabil-itation. The need to provide operative information in an environ-ment characterized by strict budget limitation suggests the utilization of unsophisticated instruments, with material parame-ters to be set as simple as possible.
For this reason, commercial codes available in the market are used and isotropic materials are assumed to model masonry, despite the well know orthotropy exhibited by regularly assembled brickwork at failure [39].
In particular, the following three commercial codes are used: Strand 7, ABAQUS and SAP2000. A brief overview of the features
of the material models implemented in the aforementioned soft-ware are provided below.
3.1. Strand 7 [12] FE code
In Strand 7, within the elasto-plasticity theory, only isotropicmaterial models with associated flow rule are available, withoutthe possibility to deal with softening, damage and non associativity.Such limitations make the code more suitable for an advancedanalysis of ductile materials, which is not the case of masonry. Onthe other hand, such limitations make its utilization by unexperi-enced users easier, because there is no need to tune arc-lengthsolvers parameters, as well as the many material models requiredto identify an orthotropic behavior for masonry. In the present sim-ulations, a Mohr–Coulomb failure criterion with associated flowrule is assumed, which reflects, within the limitations of theinstrument used, the main features exhibited by the materialmasonry, i.e., fric-tional behavior and limited tensile strength. Withsuch assumptions, there is no possibility to deal with compressioncrushing when 3D elements are used. An elastic-perfectly plasticbehavior is adopted, which obviously does not allow reproducingthe well known masonry finite ductility. Since out-of-plane failuresare possible in a 3D model, nonlinear geometry effects are takeninto account. In absence of specific indications provided by localcodes of practice, values of cohesion and friction angle are assumedin agreement with the Italian code requirements for existingbuildings [24,25]. In gen-eral, when the quality of masonry is verypoor, cohesion to assume decreases considerably, whereas it hasbeen observed that friction angle exhibits quite constant values. Forhistoric masonry where the chemo-physical deterioration of themortar joint does not allow having confidence on a minimumtensile carrying capacity, no ten-sion material models (NTMs) areusually adopted [19]. In NTMs, it is assumed that masonry behaveselastically in compression, whereas the maximum principal stressallowed cannot be beyond zero. Such mathematical conditiontranslates practically into an implementation inside standardelasto-plastic commercial FE codes of materials with quasi zero orvanishing tensile strength, and there-fore when a Mohr–Coulombmaterial model is adopted, also assuming a vanishing cohesion.Such constraint may cause difficulties in convergence, especiallynear the formation of a failure mechanism of the structure and evenin presence of vertical loads only.
In order to circumvent such intrinsic drawbacks and in absenceof adequate experimentation done for both masonry and the con-stituent materials for the problem at hand (such as indirect tensiletests on triplets, shear tests at different levels of pre-compression,etc.) two different values of cohesion are assumed in the sim-ulations, one correspondent to an average-good quality of themasonry material, the other to a weaker one.
The impossibility to predict with an elastic-perfectly plasticmaterial the finite ductility of masonry is a further strong lim-itation of the approach proposed, which however, is also typical of,e.g., all limit analyses (both associated and non-associated) done forexisting masonry structures, available in the literature [24] andallowed for instance by the Italian code. Italian code guidelines onthe built heritage specify that, when pushover analyses areperformed by means of FE computations outside theschematization of the equivalent frame, it is very difficult toreproduce the softening branch of the pushover curve, both for thelimited masonry tensile strength (almost all carrying capacityagainst horizontal loads is indeed due to masonry self-weight) andfor numerical difficulties in finding a converged solution after thepeak load. Usually, softening material models with arc lengthsolvers are not available, and therefore, code allows to convention-ally perform elastic-perfectly plastic analyses, which are simple andin any case are capable of providing good prediction of failure loads
and the active collapse mechanisms.Steel bands, where present, are modeled by means of elastic-perfectly plastic plate and shell elements. They are connected node by node to the masonry material (no interface elements are used). The fact that they are connected node by node to masonry is secured by bolds that cannot be designed or verified at a global level but require a local ad hoc design. The perfect adhesion to the support is secured practically by the presence of bolted connec-tions at fixed step (typically ranging from 20 to 40 cm). Here it is worth noting that an efficient strengthening is obtained when the steel bands remain in the elastic range, therefore an elasto-plastic material model is adequate. The same procedure is adopted in ABAQUS, whereas in the equivalent frame model steel bands effect is taken into account at a meso-mechanical level for the eval-uation of the moment–rotation and shear–displacement curves of spandrels and piers. As a matter of fact, meso-mechanical FE mod-els of piers and spandrels are constituted by 3D (masonry) and 2D (steel bands) elements identical to those used at a structural level.
3.2. ABAQUS [13] FE code
Pushover analyses are also conducted by means of ABAQUS [13] assuming a Concrete damage-plasticity (CDP) material model for masonry, which is available within the software and within many other FE codes. Although a CDP approach [39–42] (or even simpler models [43–45]) is conceived for isotropic fragile materials like concrete, it has been widely shown that its basic constitutive law can be also adapted to masonry, see for e.g. [39–41]. It is worth not-ing, indeed, that experimental results reported by Page on regular masonry wallets [15] and successive numerical models [16] show that such material exhibits a moderate orthotropy ratio (around 1.2) under biaxial stress states in the compression–compression region. Obviously, such feature cannot be taken into account when an isotropic model, like the present one, is utilized. However, it is commonly accepted in the literature the utilization of isotropic models (like concrete smeared crack approach available in both Ansys and Adina) after an adaptation of the parameters to fit an average behavior between vertical and horizontal compression. A suitable model should also take into account the ratio between the ultimate compression strength in biaxial stress states and in uniaxial conditions. Such ratio, which exhibits some similarities between concrete and masonry, is reasonably set equal to 1.16.
CDP model allows analyzing materials with different strength in tension and compression, assuming distinct damage parameters. Compressive crushing is also described by means of the introduc-tion of plastic deformation with a parabolic softening law.
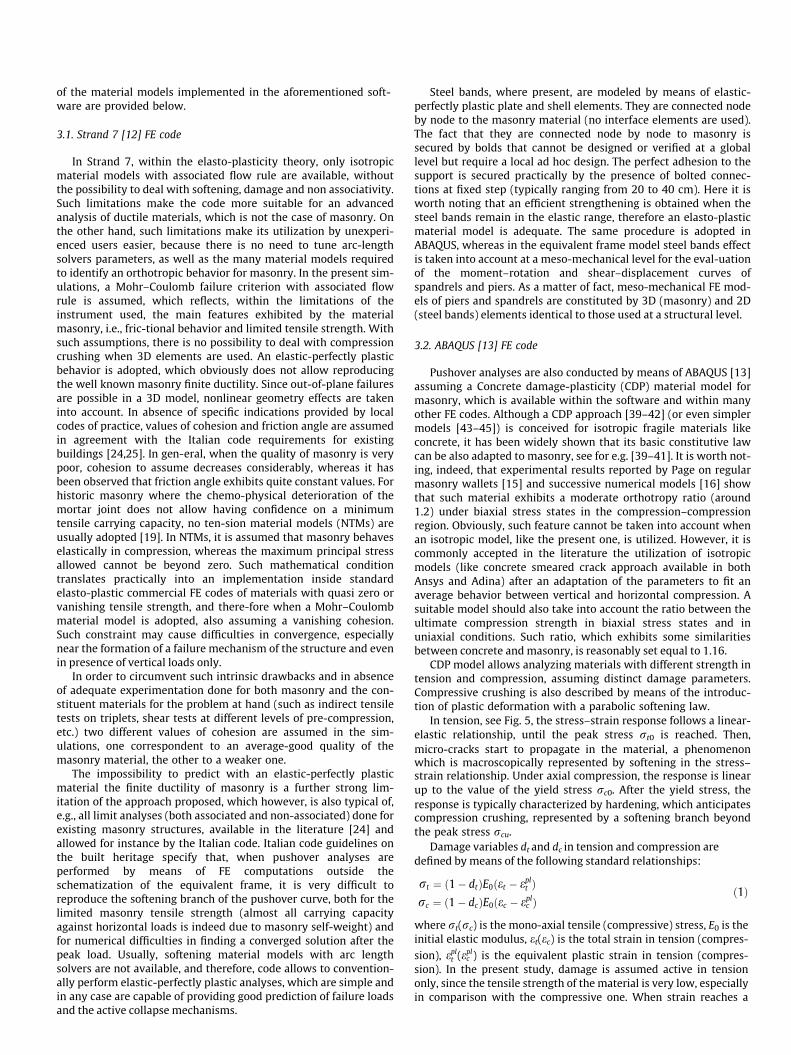
In tension, see Fig. 5, the stress–strain response follows a linear-elastic relationship, until the peak stress rt0 is reached. Then, micro-cracks start to propagate in the material, a phenomenon which is macroscopically represented by softening in the stress–strain relationship. Under axial compression, the response is linear up to the value of the yield stress rc0. After the yield stress, the response is typically characterized by hardening, which anticipates compression crushing, represented by a softening branch beyond the peak stress rcu.
Damage variables dt and dc in tension and compression are defined by means of the following standard relationships:
rt ¼ ð1� dtÞE0ðet � eplt Þ
rc ¼ ð1� dcÞE0ðec � eplc Þ
ð1Þ
where rt(rc) is the mono-axial tensile (compressive) stress, E0 is theinitial elastic modulus, et(ec) is the total strain in tension (compres-
sion), eplt (epl
c ) is the equivalent plastic strain in tension (compres-sion). In the present study, damage is assumed active in tensiononly, since the tensile strength of the material is very low, especiallyin comparison with the compressive one. When strain reaches a
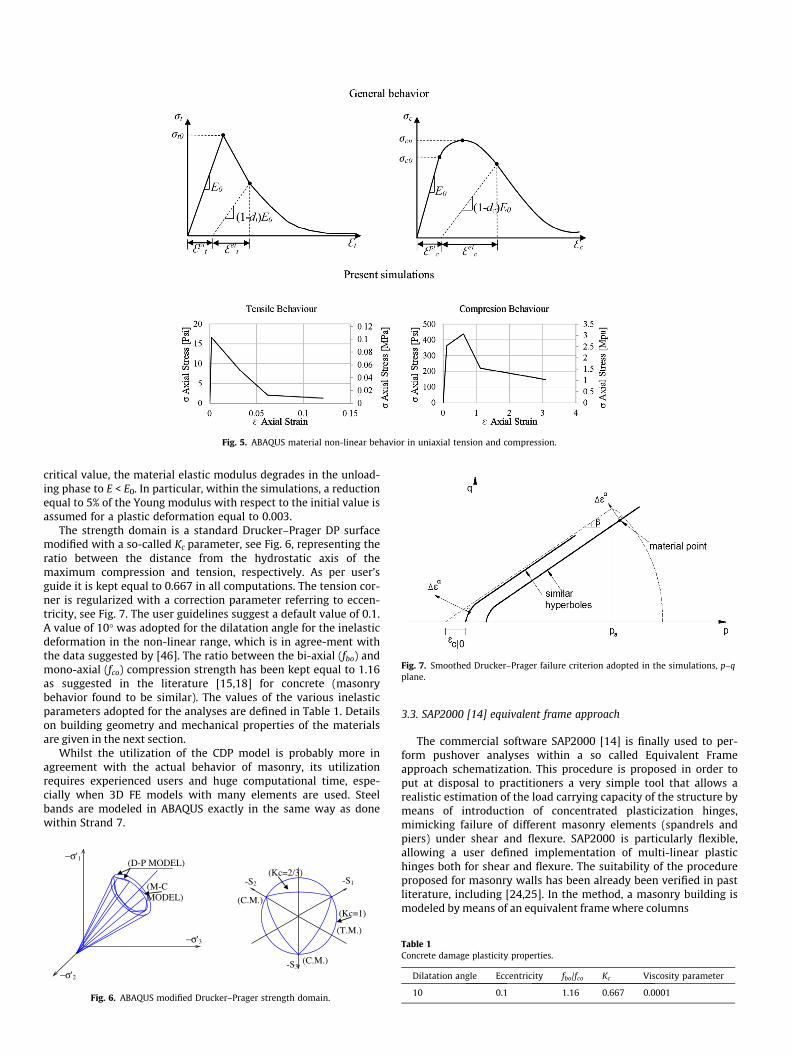
Fig. 5. ABAQUS material non-linear behavior in uniaxial tension and compression.
Fig. 7. Smoothed Drucker–Prager failure criterion adopted in the simulations, p–q plane.
critical value, the material elastic modulus degrades in the unload-ing phase to E < E0. In particular, within the simulations, a reduction equal to 5% of the Young modulus with respect to the initial value is assumed for a plastic deformation equal to 0.003.
The strength domain is a standard Drucker–Prager DP surface modified with a so-called Kc parameter, see Fig. 6, representing the ratio between the distance from the hydrostatic axis of the maximum compression and tension, respectively. As per user’s guide it is kept equal to 0.667 in all computations. The tension cor-ner is regularized with a correction parameter referring to eccen-tricity, see Fig. 7. The user guidelines suggest a default value of 0.1. A value of 10� was adopted for the dilatation angle for the inelastic deformation in the non-linear range, which is in agree-ment with the data suggested by [46]. The ratio between the bi-axial (fbo) and mono-axial (fco) compression strength has been kept equal to 1.16 as suggested in the literature [15,18] for concrete (masonry behavior found to be similar). The values of the various inelastic parameters adopted for the analyses are defined in Table 1. Details on building geometry and mechanical properties of the materials are given in the next section.
Whilst the utilization of the CDP model is probably more in agreement with the actual behavior of masonry, its utilization requires experienced users and huge computational time, espe-cially when 3D FE models with many elements are used. Steel bands are modeled in ABAQUS exactly in the same way as done within Strand 7.
−σ'3
(C.M.)
-S2 -S1
-S3
(T.M.)
(C.M.)
(Kc=1)
(Kc=2/3)
−σ'2
−σ'1(D-P MODEL)
(M-C MODEL)
Fig. 6. ABAQUS modified Drucker–Prager strength domain.
3.3. SAP2000 [14] equivalent frame approach
The commercial software SAP2000 [14] is finally used to per-form pushover analyses within a so called Equivalent Frame approach schematization. This procedure is proposed in order to put at disposal to practitioners a very simple tool that allows a realistic estimation of the load carrying capacity of the structure by means of introduction of concentrated plasticization hinges, mimicking failure of different masonry elements (spandrels and piers) under shear and flexure. SAP2000 is particularly flexible, allowing a user defined implementation of multi-linear plastic hinges both for shear and flexure. The suitability of the procedure proposed for masonry walls has been already been verified in past literature, including [24,25]. In the method, a masonry building is modeled by means of an equivalent frame where columns
Table 1Concrete damage plasticity properties.
Dilatation angle Eccentricity fbo/fco Kc Viscosity parameter
10 0.1 1.16 0.667 0.0001
represent piers and beams spandrels. Rigid links (i.e., linear elastic beams with large stiffness) are used to model the connection between piers and spandrels. Deformable beams are assumed elasto-plastic with concentrated plasticization due to shear and flexure.
The approximation works reasonably well for regular buildings, even if it has been shown that the reduction to an equivalent frame is not unique, but is inapplicable for structures with many irregu-larities or in all those cases where the identification of piers and spandrels is not possible (e.g., masonry churches).
For the case under study, the masonry prototype of Fig. 8a–b is converted into the equivalent frame depicted in Fig. 8c. To evaluate the non-linear behavior of the hinges to implement in SAP2000, there are many possibilities. The most straightforward approach is the use of code of practice indications. Since the utilization of the equivalent frame is basically required by Italian norms [22], reference should be made to Italian code. However, the evaluation of the load carrying capacity of the single structural elements is a standard one and does not link well to the previously presented 3D models. Code formulas involve, indeed, mechanical parameters that cannot be implemented in simplistic models like a Mohr–Coulomb or a CDP. For this reason, in the present paper, in order to determine the ultimate shear and moment capacity of each structural element, a homogenized finite element (FE) approach is utilized, as suggested by Milani et al. [24,25]. A heterogeneous discretization is avoided to reduce the computational time needed in the pre-processing phase, adopting for masonry an elastic-perfectly plastic material identical to those assumed in Strand 7 model. Such choice is also in agreement to the idea of simplifying the approach to a great extent, in light of the utilization of the procedure in developing countries. In any case, full details of the procedure are provided in [25], where the reader is referred for details. Here it is worth noting that each pier and spandrel is extracted from the structure and, after the imposition of suitable boundary conditions, is loaded up to failure with a distribution of actions mimicking shear and bending separately. For each load case, either a shear–displacement or moment–rotation pushover curve is obtained for each pier and spandrel element. Such input properties generated for all piers and spandrels are summarized in Table 2, and implemented in SAP2000. For spandrels, it is rea-sonably assumed that only shear failure is possible due to their geometry (deep members). In Table 2, spandrel 1 corresponds to the spandrel above the door and spandrel 2 corresponds to the spandrel above window 1. Similar input properties for each pier and spandrel are generated for the strengthened cases also. Once input properties are generated for all elements, pushover analyses on the whole equivalent frame are carried out.
4. Building geometry and FE discretization
With the aim of proposing a parametric study about the perfor-mance of a typical masonry building subjected to quasi-static hori-zontal loads incremented up to failure, a small one story masonry prototype experimentally tested by Shahzada et al. [26], is consid-ered. The prediction of the lateral load carrying capacity of the small building by means of the three numerical approaches pre-viously discussed represents a good benchmark for the systematic evaluation of their applicability in design practice. Three different strengthening interventions with steel bands, discussed in the sequel, are finally numerically analyzed to estimate (1) the increase in the load bearing capacity and (2) the agreement of the results obtained using three different numerical approaches.
Shahzada et al. [26] performed an experimental study on a full-scale one-story unreinforced brick masonry building subjected to quasi-static horizontal loads incremented up to failure of the
structure. The experimental results in terms of force–displacement (capacity) curves, reported by Shahzada, are used in the present study to benchmark previously discussed numerical models and to calibrate the unknown mechanical parameters to adopt a suitable modeling of masonry elements. When some parameters are missing from experimentation, they are kept in agreement with consolidated literature in the field. The building geometry and dimensions of the walls (spandrels, lintels and piers), as well as the dimensions of the openings (windows and doors) are fully defined in Fig. 8 and Table 3.
The unreinforced small building is a one storeyed structure with dimensions in plan equal to 13.5 ft � 11.5 ft (Fig. 8). The structure is built with walls constituted by 9 inch thick brick masonry with English bond pattern. Reinforced concrete lintel beams, 6 inch high and 9 inch wide, are disposed above all openings to improve stabil-ity against vertical loads near openings. To further improve stabil-ity against gravity loads a reinforced concrete slab, 6 inch thick, constitutes the plan roof. Small brick masonry parapets, 13.5 inch thick are disposed all around the slab. A horizontal concentrated load is applied to the wall without openings by means of a single load cell, at level of the R.C. slab as illustrated in Fig. 8. Displacements are measured at the mid-point on the R.C. slab on the opposite wall.
A few preliminary mechanical characterization for masonry is at disposal, exception made for an estimation of masonry Young modulus, compressive strength of masonry and bricks and masonry diagonal tensile strength, as indicated synoptically in Table 4. Other material properties required in the three approaches have been taken from established literature.
Pushover analyses within Strand 7 and ABAQUS are conducted utilizing the discretization shown in Fig. 8b and constituted by 2903 eight-noded solid elements and 5676 nodes. All nodes located at the base of the structure are assumed fully restrained. The vertical dead load is directly applied to walls head and a con-centrated load incremented up to failure of the structure is applied at the point where the quasi-static load was applied as per the experimental model.
The analyses performed using Strand 7 are carried out considering a Mohr–Coulomb failure criterion for masonry with a friction angle of 30� and cohesion value of 21.75 Psi (0.15 MPa). The non-linear analyses performed using ABAQUS assumed a Concrete Damage Plasticity model for which the non-linear parameters are reported in Table 1. The maximum strength in ten-sion and compression are calculated using the Mohr–Coulomb yield criterion under plane stress conditions.
Material non-linearity is defined exclusively for masonry ele-ments, whereas concrete lintels/slabs and steel bands are assumed to behave elastically. Such assumption is quite reasonable con-sidering that concrete and steel strength are much larger than that of masonry.
5. Non-linear analysis and results
Pushover analyses in absence and presence of retrofitting (threestrengthening configurations), are carried out using the aforemen-tioned FE software in the longitudinal positive X direction, inagreement with experimentation. From experimental results, themaximum lateral load carrying capacity of the structure is around24 Kips (106.76 kN). Using the above mechanical parameters, it isfound that all the models fail for a horizontal load of about 30 Kips(133.45 kN), which is about 25% higher than the experimentalvalue.
In order to rationally investigate the reasons of such differencesin the load carrying capacity, and to improve the accuracy of the
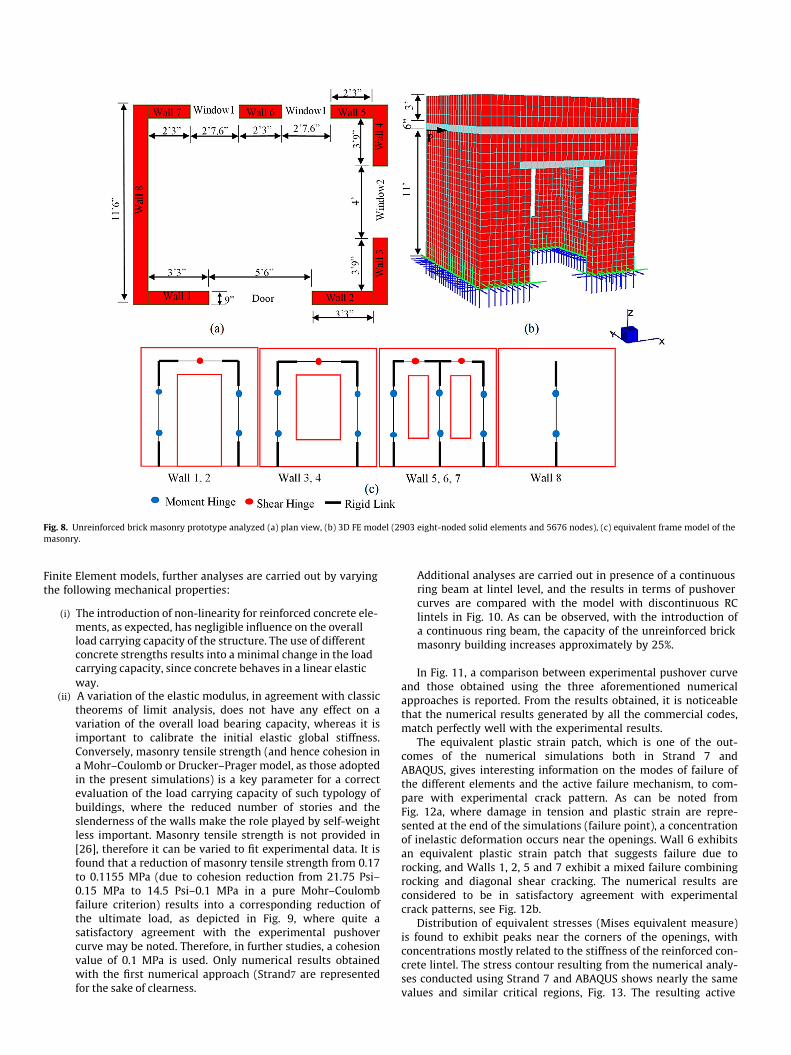
Fig. 8. Unreinforced brick masonry prototype analyzed (a) plan view, (b) 3D FE model (2903 eight-noded solid elements and 5676 nodes), (c) equivalent frame model of themasonry.
Finite Element models, further analyses are carried out by varyingthe following mechanical properties:
(i) The introduction of non-linearity for reinforced concrete ele-ments, as expected, has negligible influence on the overall load carrying capacity of the structure. The use of different concrete strengths results into a minimal change in the load carrying capacity, since concrete behaves in a linear elastic way.
(ii) A variation of the elastic modulus, in agreement with classic theorems of limit analysis, does not have any effect on a variation of the overall load bearing capacity, whereas it is important to calibrate the initial elastic global stiffness. Conversely, masonry tensile strength (and hence cohesion in a Mohr–Coulomb or Drucker–Prager model, as those adopted in the present simulations) is a key parameter for a correct evaluation of the load carrying capacity of such typology of buildings, where the reduced number of stories and the slenderness of the walls make the role played by self-weight less important. Masonry tensile strength is not provided in [26], therefore it can be varied to fit experimental data. It is found that a reduction of masonry tensile strength from 0.17 to 0.1155 MPa (due to cohesion reduction from 21.75 Psi–0.15 MPa to 14.5 Psi–0.1 MPa in a pure Mohr–Coulomb failure criterion) results into a corresponding reduction of the ultimate load, as depicted in Fig. 9, where quite a satisfactory agreement with the experimental pushover curve may be noted. Therefore, in further studies, a cohesion value of 0.1 MPa is used. Only numerical results obtained with the first numerical approach (Strand7 are represented for the sake of clearness.
Additional analyses are carried out in presence of a continuous ring beam at lintel level, and the results in terms of pushover curves are compared with the model with discontinuous RC lintels in Fig. 10. As can be observed, with the introduction of a continuous ring beam, the capacity of the unreinforced brick masonry building increases approximately by 25%.
In Fig. 11, a comparison between experimental pushover curve and those obtained using the three aforementioned numerical approaches is reported. From the results obtained, it is noticeable that the numerical results generated by all the commercial codes, match perfectly well with the experimental results.
The equivalent plastic strain patch, which is one of the out-comes of the numerical simulations both in Strand 7 and ABAQUS, gives interesting information on the modes of failure of the different elements and the active failure mechanism, to com-pare with experimental crack pattern. As can be noted from Fig. 12a, where damage in tension and plastic strain are repre-sented at the end of the simulations (failure point), a concentration of inelastic deformation occurs near the openings. Wall 6 exhibits an equivalent plastic strain patch that suggests failure due to rocking, and Walls 1, 2, 5 and 7 exhibit a mixed failure combining rocking and diagonal shear cracking. The numerical results are considered to be in satisfactory agreement with experimental crack patterns, see Fig. 12b.
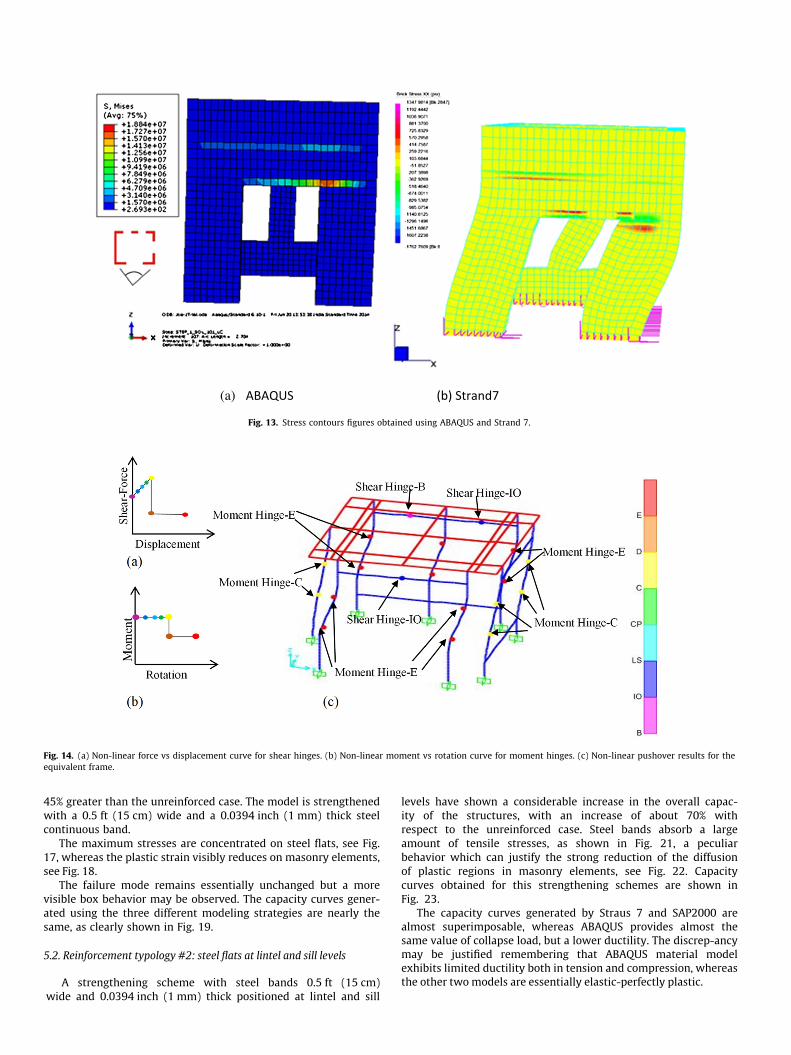
Distribution of equivalent stresses (Mises equivalent measure) is found to exhibit peaks near the corners of the openings, with concentrations mostly related to the stiffness of the reinforced con-crete lintel. The stress contour resulting from the numerical analy-ses conducted using Strand 7 and ABAQUS shows nearly the same values and similar critical regions, Fig. 13. The resulting active
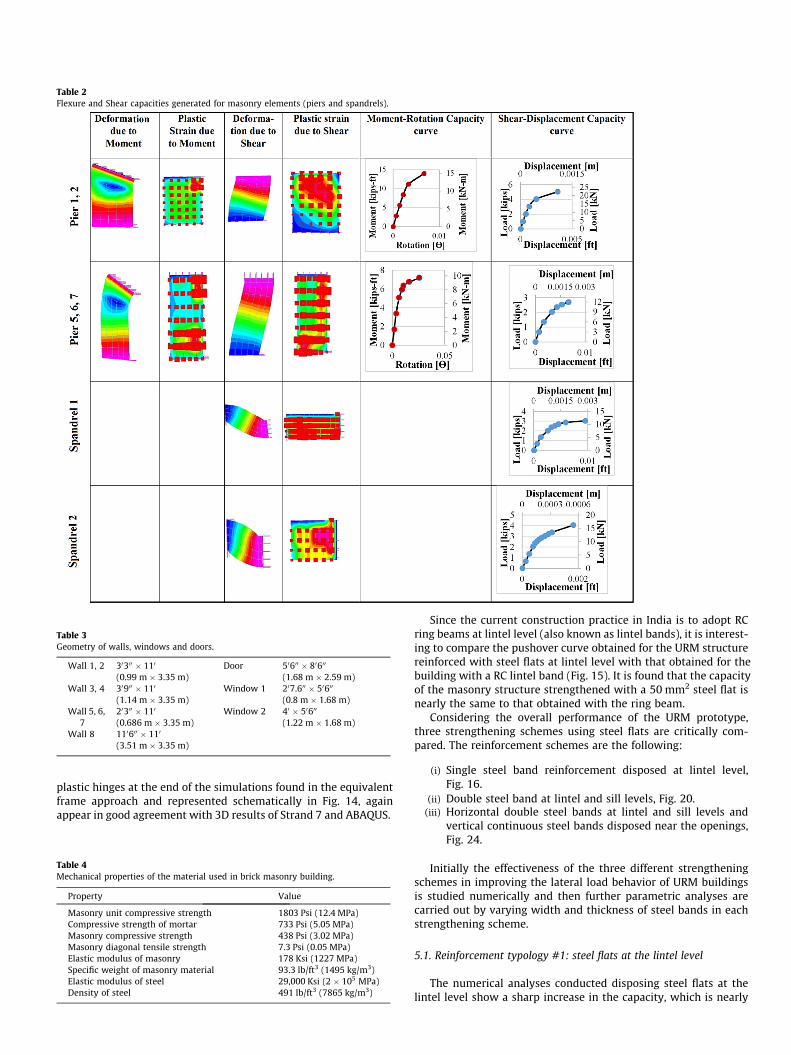
Table 2Flexure and Shear capacities generated for masonry elements (piers and spandrels).
Table 3Geometry of walls, windows and doors.
Wall 1, 2 30300 � 110
(0.99 m � 3.35 m)Door 50600 � 80600
(1.68 m � 2.59 m)Wall 3, 4 30900 � 110
(1.14 m � 3.35 m)Window 1 207.600 � 50600
(0.8 m � 1.68 m)Wall 5, 6,
720300 � 110
(0.686 m � 3.35 m)Window 2 40 � 50600
(1.22 m � 1.68 m)Wall 8 110600 � 110
(3.51 m � 3.35 m)
plastic hinges at the end of the simulations found in the equivalent frame approach and represented schematically in Fig. 14, again appear in good agreement with 3D results of Strand 7 and ABAQUS.
Table 4Mechanical properties of the material used in brick masonry building.
Property Value
Masonry unit compressive strength 1803 Psi (12.4 MPa)Compressive strength of mortar 733 Psi (5.05 MPa)Masonry compressive strength 438 Psi (3.02 MPa)Masonry diagonal tensile strength 7.3 Psi (0.05 MPa)Elastic modulus of masonry 178 Ksi (1227 MPa)Specific weight of masonry material 93.3 lb/ft3 (1495 kg/m3)Elastic modulus of steel 29,000 Ksi (2 � 105 MPa)Density of steel 491 lb/ft3 (7865 kg/m3)
Since the current construction practice in India is to adopt RC ring beams at lintel level (also known as lintel bands), it is interest-ing to compare the pushover curve obtained for the URM structure reinforced with steel flats at lintel level with that obtained for the building with a RC lintel band (Fig. 15). It is found that the capacity of the masonry structure strengthened with a 50 mm2 steel flat is nearly the same to that obtained with the ring beam.
Considering the overall performance of the URM prototype, three strengthening schemes using steel flats are critically com-pared. The reinforcement schemes are the following:
(i) Single steel band reinforcement disposed at lintel level, Fig. 16.
(ii) Double steel band at lintel and sill levels, Fig. 20.(iii) Horizontal double steel bands at lintel and sill levels and
vertical continuous steel bands disposed near the openings, Fig. 24.
Initially the effectiveness of the three different strengtheningschemes in improving the lateral load behavior of URM buildingsis studied numerically and then further parametric analyses arecarried out by varying width and thickness of steel bands in eachstrengthening scheme.
5.1. Reinforcement typology #1: steel flats at the lintel level
The numerical analyses conducted disposing steel flats at thelintel level show a sharp increase in the capacity, which is nearly
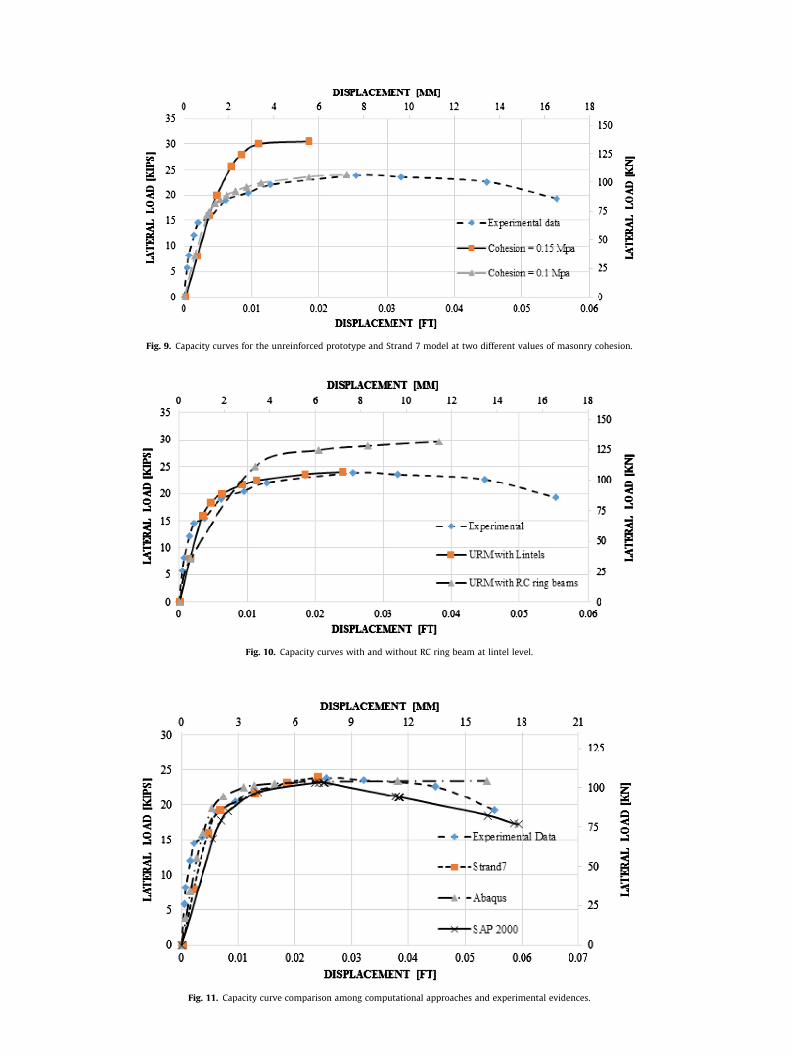
Fig. 9. Capacity curves for the unreinforced prototype and Strand 7 model at two different values of masonry cohesion.
Fig. 10. Capacity curves with and without RC ring beam at lintel level.
Fig. 11. Capacity curve comparison among computational approaches and experimental evidences.
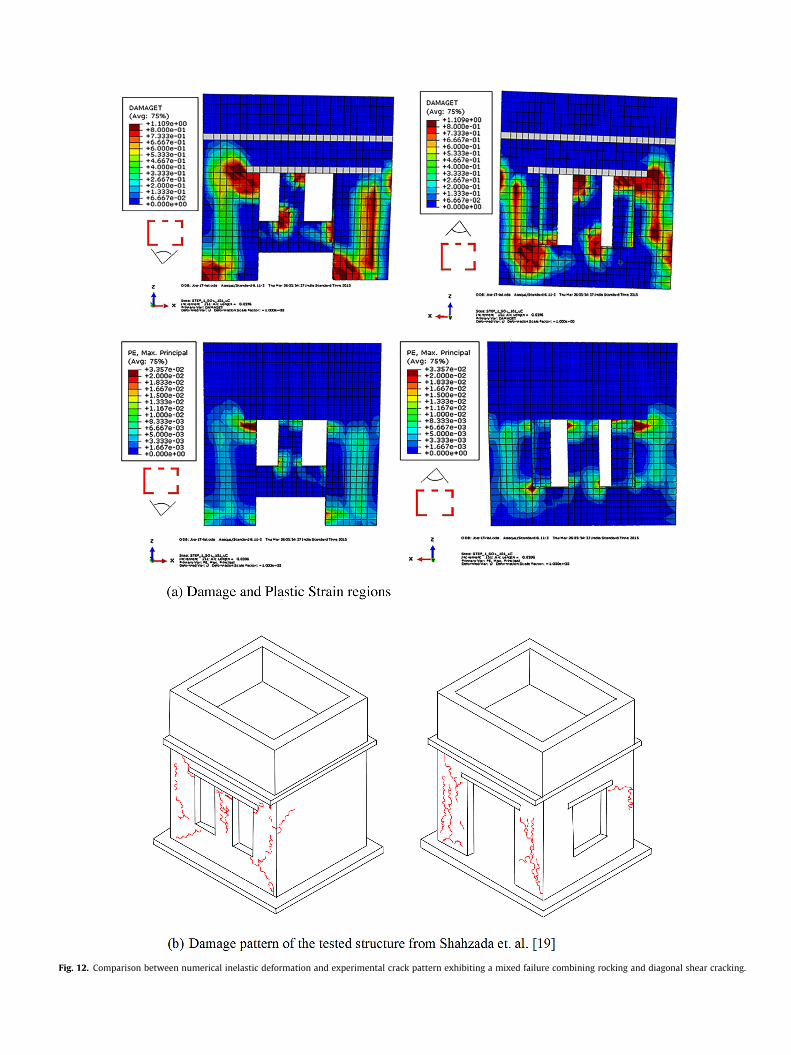
Fig. 12. Comparison between numerical inelastic deformation and experimental crack pattern exhibiting a mixed failure combining rocking and diagonal shear cracking.
(a)
Fig. 13. Stress contours figures obtained using ABAQUS and Strand 7.
Fig. 14. (a) Non-linear force vs displacement curve for shear hinges. (b) Non-linear moment vs rotation curve for moment hinges. (c) Non-linear pushover results for theequivalent frame.
45% greater than the unreinforced case. The model is strengthened with a 0.5 ft (15 cm) wide and a 0.0394 inch (1 mm) thick steel continuous band.
The maximum stresses are concentrated on steel flats, see Fig. 17, whereas the plastic strain visibly reduces on masonry elements, see Fig. 18.
The failure mode remains essentially unchanged but a more visible box behavior may be observed. The capacity curves gener-ated using the three different modeling strategies are nearly the same, as clearly shown in Fig. 19.
5.2. Reinforcement typology #2: steel flats at lintel and sill levels
A strengthening scheme with steel bands 0.5 ft (15 cm) wide and 0.0394 inch (1 mm) thick positioned at lintel and sill
levels have shown a considerable increase in the overall capac-ity of the structures, with an increase of about 70% with respect to the unreinforced case. Steel bands absorb a large amount of tensile stresses, as shown in Fig. 21, a peculiar behavior which can justify the strong reduction of the diffusion of plastic regions in masonry elements, see Fig. 22. Capacity curves obtained for this strengthening schemes are shown in Fig. 23.
The capacity curves generated by Straus 7 and SAP2000 are almost superimposable, whereas ABAQUS provides almost the same value of collapse load, but a lower ductility. The discrep-ancy may be justified remembering that ABAQUS material model exhibits limited ductility both in tension and compression, whereas the other two models are essentially elastic-perfectly plastic.
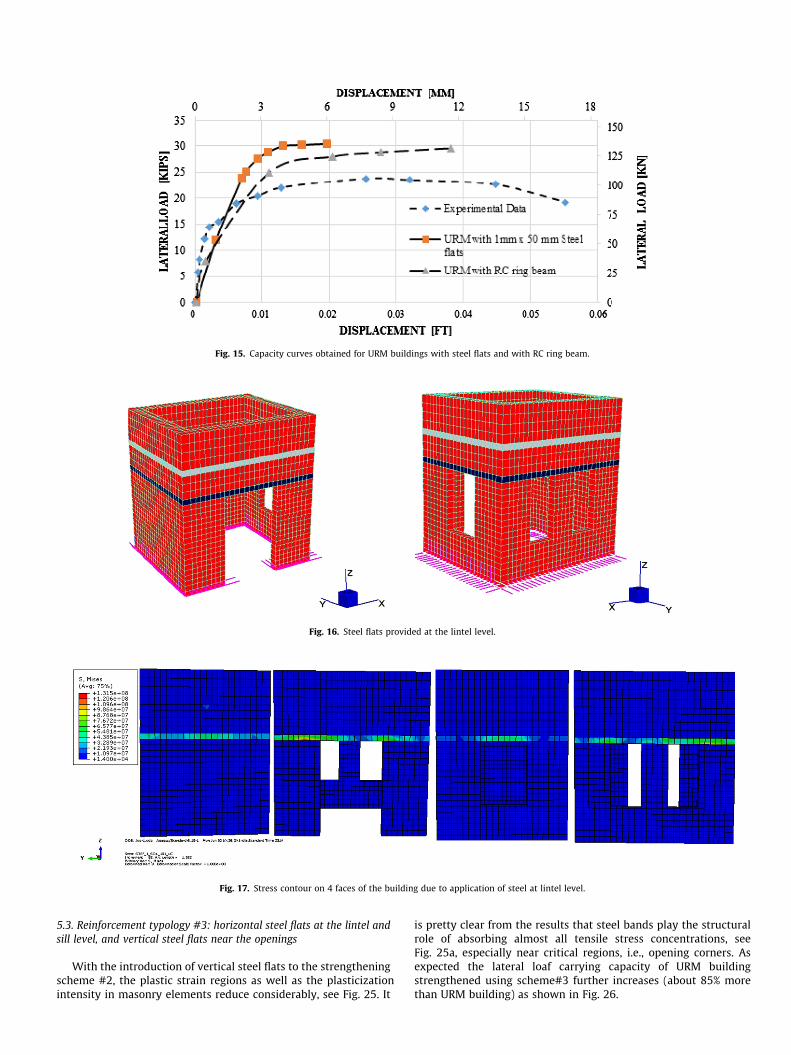
Fig. 15. Capacity curves obtained for URM buildings with steel flats and with RC ring beam.
Fig. 16. Steel flats provided at the lintel level.
Fig. 17. Stress contour on 4 faces of the building due to application of steel at lintel level.
5.3. Reinforcement typology #3: horizontal steel flats at the lintel and sill level, and vertical steel flats near the openings
With the introduction of vertical steel flats to the strengthening scheme #2, the plastic strain regions as well as the plasticizationintensity in masonry elements reduce considerably, see Fig. 25. It
is pretty clear from the results that steel bands play the structural role of absorbing almost all tensile stress concentrations, see Fig. 25a, especially near critical regions, i.e., opening corners. As expected the lateral loaf carrying capacity of URM building strengthened using scheme#3 further increases (about 85% more than URM building) as shown in Fig. 26.
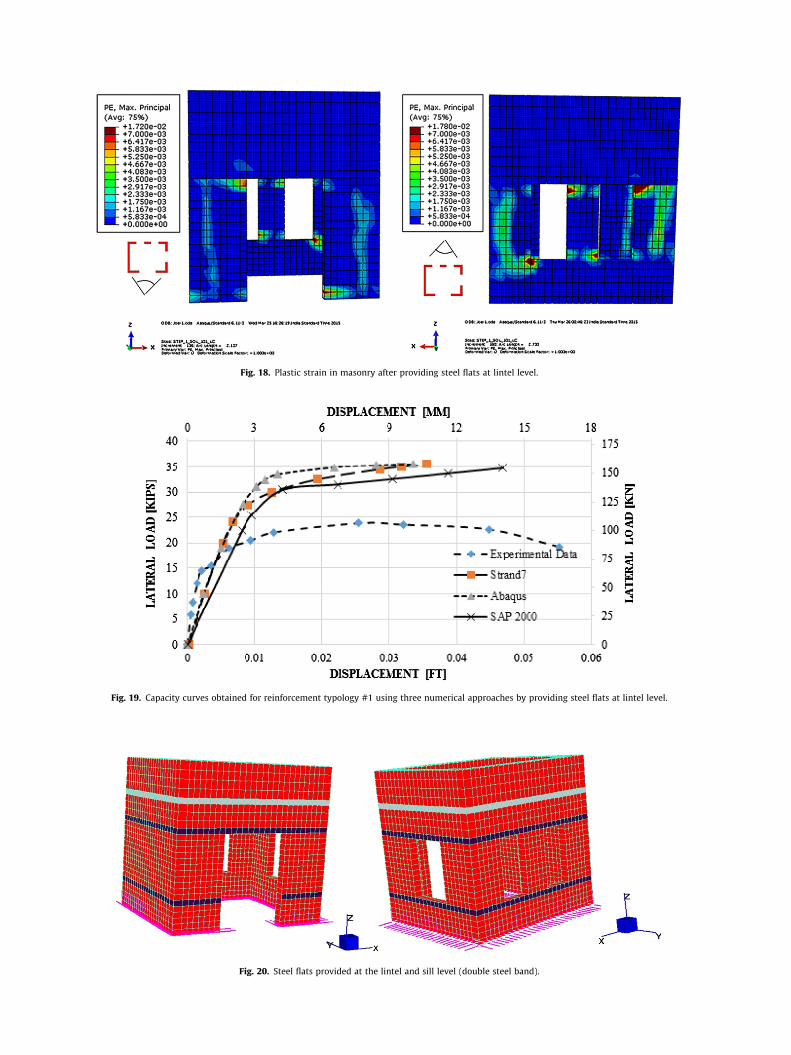
Fig. 18. Plastic strain in masonry after providing steel flats at lintel level.
Fig. 19. Capacity curves obtained for reinforcement typology #1 using three numerical approaches by providing steel flats at lintel level.
Fig. 20. Steel flats provided at the lintel and sill level (double steel band).
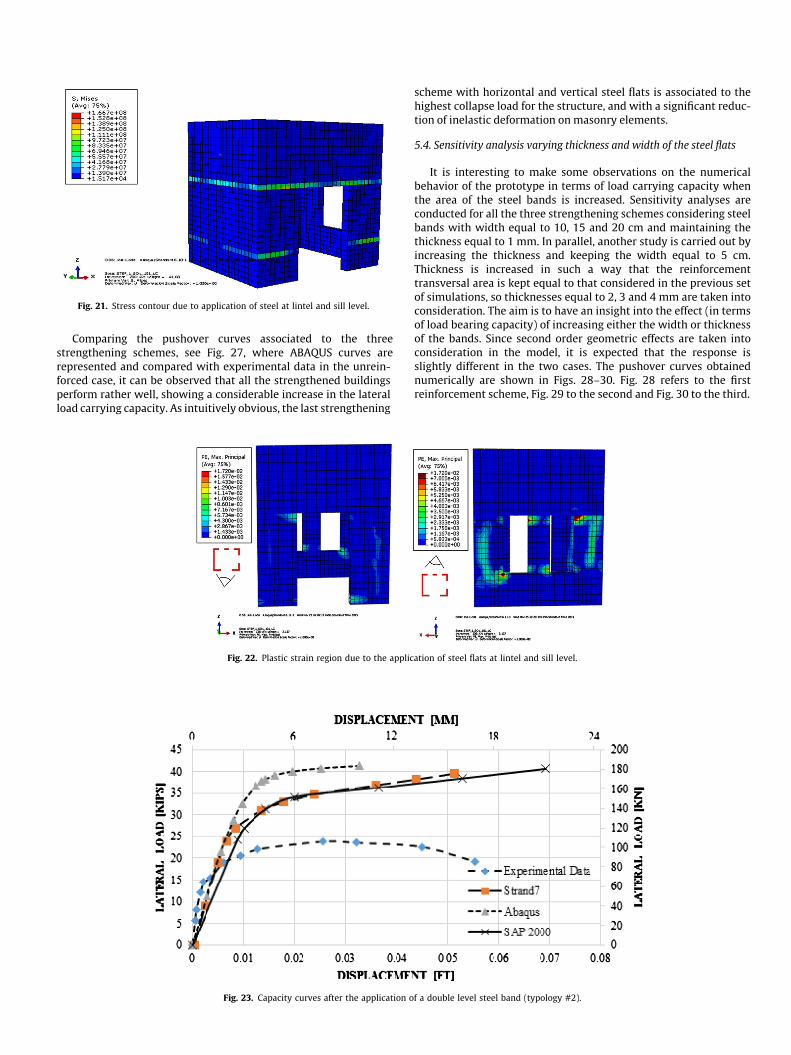
Fig. 21. Stress contour due to application of steel at lintel and sill level.
Comparing the pushover curves associated to the three strengthening schemes, see Fig. 27, where ABAQUS curves are represented and compared with experimental data in the unrein-forced case, it can be observed that all the strengthened buildings perform rather well, showing a considerable increase in the lateral load carrying capacity. As intuitively obvious, the last strengthening
Fig. 22. Plastic strain region due to the applic
Fig. 23. Capacity curves after the application o
scheme with horizontal and vertical steel flats is associated to the highest collapse load for the structure, and with a significant reduc-tion of inelastic deformation on masonry elements.
5.4. Sensitivity analysis varying thickness and width of the steel flats
It is interesting to make some observations on the numerical behavior of the prototype in terms of load carrying capacity when the area of the steel bands is increased. Sensitivity analyses are conducted for all the three strengthening schemes considering steel bands with width equal to 10, 15 and 20 cm and maintaining the thickness equal to 1 mm. In parallel, another study is carried out by increasing the thickness and keeping the width equal to 5 cm. Thickness is increased in such a way that the reinforcement transversal area is kept equal to that considered in the previous set of simulations, so thicknesses equal to 2, 3 and 4 mm are taken into consideration. The aim is to have an insight into the effect (in terms of load bearing capacity) of increasing either the width or thickness of the bands. Since second order geometric effects are taken into consideration in the model, it is expected that the response is slightly different in the two cases. The pushover curves obtained numerically are shown in Figs. 28–30. Fig. 28 refers to the first reinforcement scheme, Fig. 29 to the second and Fig. 30 to the third.
ation of steel flats at lintel and sill level.
f a double level steel band (typology #2).
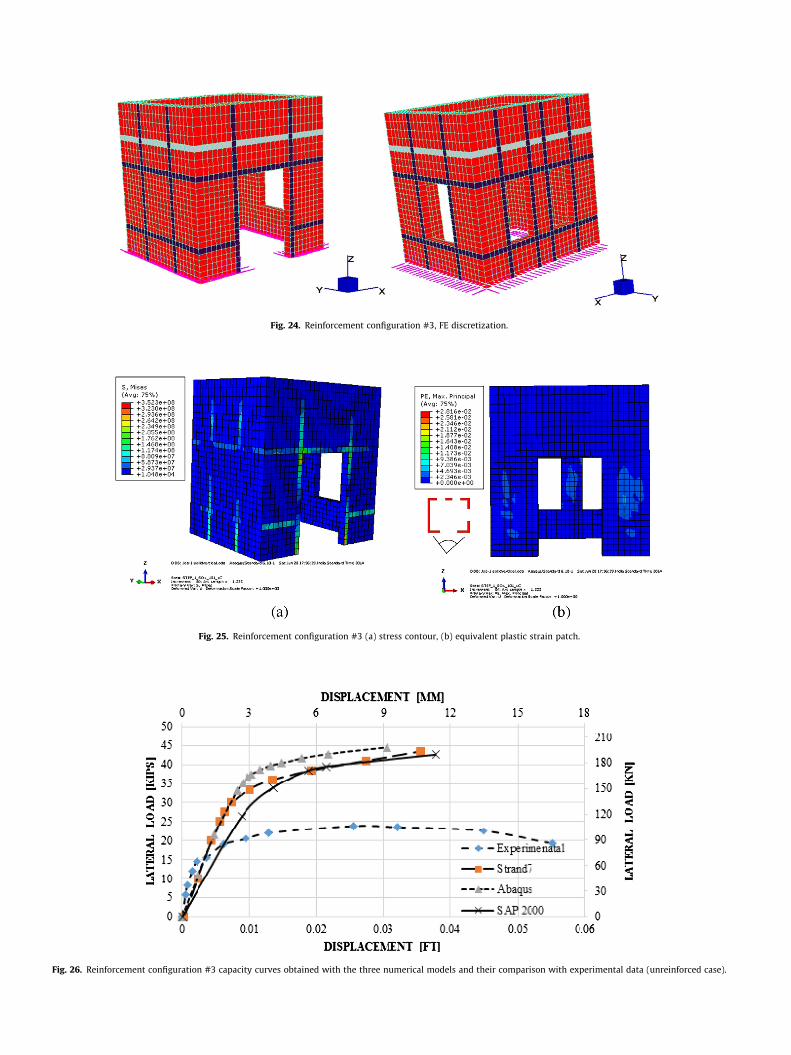
Fig. 24. Reinforcement configuration #3, FE discretization.
Fig. 25. Reinforcement configuration #3 (a) stress contour, (b) equivalent plastic strain patch.
Fig. 26. Reinforcement configuration #3 capacity curves obtained with the three numerical models and their comparison with experimental data (unreinforced case).
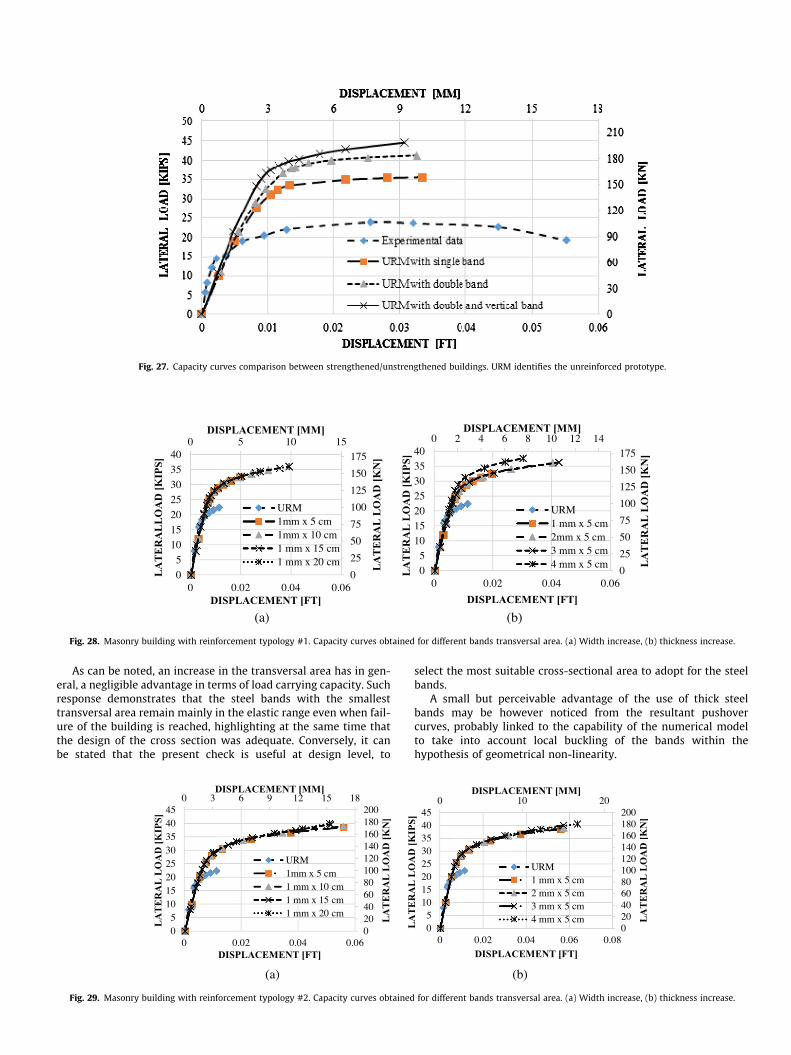
Fig. 27. Capacity curves comparison between strengthened/unstrengthened buildings. URM identifies the unreinforced prototype.
Fig. 28. Masonry building with reinforcement typology #1. Capacity curves obtained for different bands transversal area. (a) Width increase, (b) thickness increase.
As can be noted, an increase in the transversal area has in gen-eral, a negligible advantage in terms of load carrying capacity. Suchresponse demonstrates that the steel bands with the smallesttransversal area remain mainly in the elastic range even when fail-ure of the building is reached, highlighting at the same time thatthe design of the cross section was adequate. Conversely, it canbe stated that the present check is useful at design level, to
Fig. 29. Masonry building with reinforcement typology #2. Capacity curves obtained
select the most suitable cross-sectional area to adopt for the steelbands.
A small but perceivable advantage of the use of thick steelbands may be however noticed from the resultant pushovercurves, probably linked to the capability of the numerical modelto take into account local buckling of the bands within thehypothesis of geometrical non-linearity.
for different bands transversal area. (a) Width increase, (b) thickness increase.
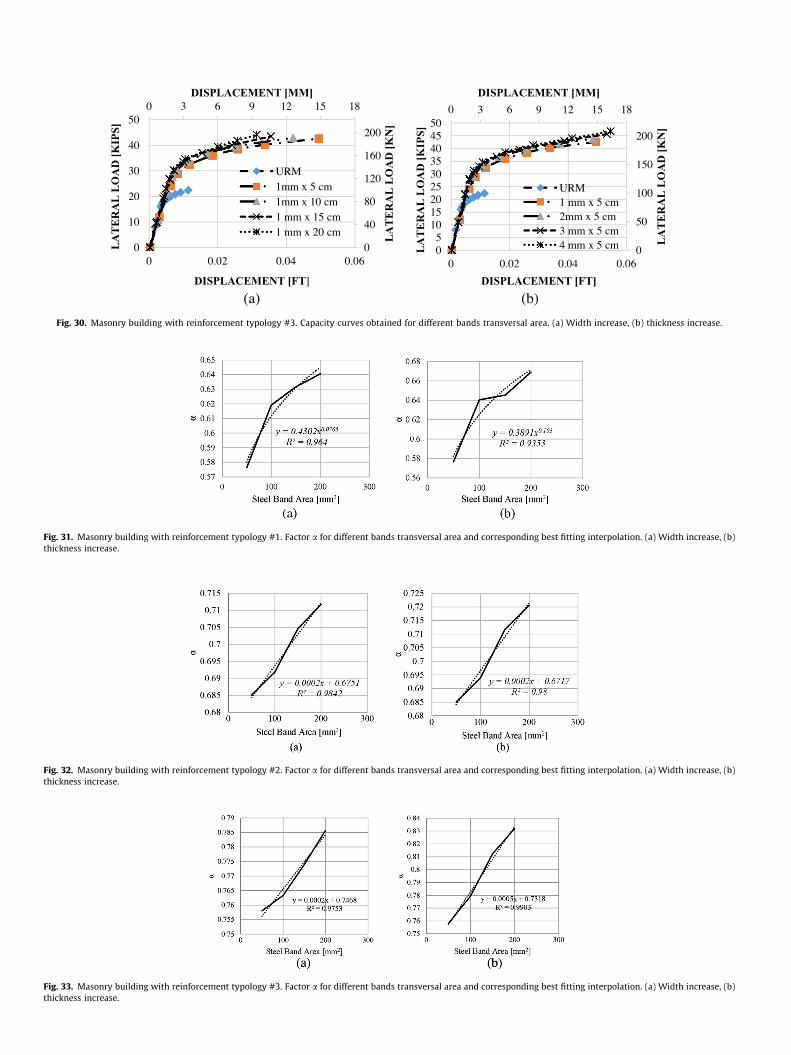
Fig. 30. Masonry building with reinforcement typology #3. Capacity curves obtained for different bands transversal area. (a) Width increase, (b) thickness increase.
Fig. 31. Masonry building with reinforcement typology #1. Factor a for different bands transversal area and corresponding best fitting interpolation. (a) Width increase, (b)thickness increase.
Fig. 32. Masonry building with reinforcement typology #2. Factor a for different bands transversal area and corresponding best fitting interpolation. (a) Width increase, (b)thickness increase.
Fig. 33. Masonry building with reinforcement typology #3. Factor a for different bands transversal area and corresponding best fitting interpolation. (a) Width increase, (b)thickness increase.
6. Proposed design equations predicting the load carrying capacity of the structure
From a detailed analysis of the pushover curves provided by all the numerical models in the cases of strengthening schemes inves-tigated, it may be interesting to propose design equations capable of providing a direct estimate of the increase in the load bearing capacity as a function of the transversal area of the bands used for reinforcement. Such equations are derived directly from the numerical pushover curves through standard best fitting. In Figs. 31–33, the a factor, representing the ratio between peak hori-zontal load and total weight of the structure is represented as a function of the steel bands transversal area. Fig. 31 refers to the first strengthening configuration analyzed, Fig. 32 to the second and Fig. 33 to the third. Continuous thick lines refer to data extracted and post-processed from the numerical pushover curves, whereas dotted lines are interpolating functions.
In the interpolating equation y represents a and x represents ‘‘A’’ the area of steel in mm2. From the results of the simulations, it is interesting to notice that the interpolating functions are linear for reinforcement typology #2 and #3. Such property is particu-larly suitable for a very straightforward design of a possible seismic retrofitting. Reinforcement typology #1 behavior exhibits, on the contrary, a quasi hyperbolic behavior. Considering the increase in the load bearing capacity obtained in the three cases, it is authors’ opinion that the third reinforcement configuration with increase in the bands’ thickness, is the most suitable to be utilized in common design (around 10% of increase in the load bearing capacity when transversal area is increased from 50 to 200 mm2). The empirical equation obtained for a for a double horizontal strengthening and vertical steel bands with thickness increase is associated to an interpolating line expressed by the following equation:
a ¼ 0:0005Aþ 0:7318 ð2Þ
where a is the ratio between collapse load and total weight of thestructure and A is the steel area in mm2. In any case, when restric-tive money constraints are present, it can also be concluded thateven a single band 1 mm thick and 5 cm wide is capable of increas-ing the lateral strength sufficiently. It has to be stressed that theabove equations are generated basing on the benchmark modelanalyzed in the previous section for comparison purposes. Moregeneral equations can be deduced by carrying out a systematicparametric study where the building geometry, number of storeys,wall thickness, position of openings, etc. is varied.
7. Conclusions
In the present paper, a numerical assessment of the role playedby steel bands in retrofitting masonry buildings in South-East Asiahas been carried out. The numerical assessment has been con-ducted by performing non-linear static analyses using three FEcommercial codes, namely, Strand 7, ABAQUS and SAP2000. Theutilization of commercial software, despite the approximationsintroduced in the material models adopted for masonry, is neces-sary to maintain the approach available to the majority ofpractitioners involved in standard design. A small one storeymasonry building, experimentally tested in absence of reinforce-ment (steel band) and loaded by means of a concentrated horizon-tal load up to failure, has been used to initially validate the modelsand calibrate mechanical parameters to adopt a suitable modelingof masonry elements. Then, it has been hypothesized to strengthenthe same masonry prototype by means of three different strength-ening schemes using continuous steel bands. From simulationresults, it has been found that a single band at lintels level withmoderate cross-section (1 mm � 5 cm) provides a reasonably high
increase in the lateral load carrying capacity. Further simulationshave been carried out to check the effect of an increase in widthand thickness of the steel flats. It has been found that steel flatswith increased thickness generally exhibit a slightly highercapacity than those with increased width (keeping the samecross-sectional area). Besides, it has been found that higher valuesof the cross-sectional area do not contribute much to a furtherincrease in capacity. In any case, all the three strengthening inter-ventions are rather effective, being all associated to a considerableincrease in the overall strength of the structure.
Simple fitting equations have been finally developed from theultimate loads numerically estimated in all the different cases ana-lyzed. The developed empirical equations are based on a series ofanalyses on a small single storeyed building with a single room.Even though the majority of brick masonry buildings in theSouth-East Asian countries are single storeyed with few rooms,the applicability of the proposed equations will be limited to theretrofitting of individual rooms. A systematic parametric studyshould be carried out to cover all the possibility that can beencountered in practice, by varying the building height, geometry,wall thickness, position of opening, etc., in order to developgeneralized design equations. Such study is possible repeatingmany times the numerical simulations here presented on differentgeometries and strengthening configurations. With the results of alarge parametric investigation, more general empirical equationscan be deduced, useful for a straightforward design, without theneed to perform detailed FE non-linear simulations.
Acknowledgments
The financial support by Erusmus Mundus Heritage Program forthis project is gratefully acknowledged. The authors wish to thankthe Department of Civil and Environmental Engineering, theDepartment of Architecture, Built Environment and ConstructionEngineering, Technical University of Milan (Politecnico di Milano),Italy and Department of Civil Engineering, Indian Institute ofTechnology Guwahati, India, for providing the working facilitiesand continuous encouragement. Prof. Maurizio Acito is gratefullyacknowledged for the use of a licensed version of Strand7.
References
[1] Augusti G, Ciampoli M, Giovenale P. Seismic vulnerability of monumental buildings. J Struct Saf 2001;23:253–74.
[2] Kaushik HB, Dasgupta K. Assessment of seismic vulnerability of structures in Sikkim (India) based on damage observation during two recent earthquakes. J Perform Constr Facil 2013;27(6):697–720.
[3]
[4]
Ural A, Dogangün A, Sazen H, Angin Z. Seismic performance of masonry buildings during the 2007 Bala, Turkey earthquakes. Nat Hazard 2011;60(3): 1013–26.Jain SK, Lettis B, Murty CVR, Bardet JP. Bhuj, India earthquake of January 26, 2001. Earthquake Spectra 2002;18(A):398.
[5] Rai, Murty, Preliminary report on the 2005 North Kashmir earthquake of October, NICEE, IIT Kanpur, 2005 <www.nicee.org/eqe-iitk/uploads/EQR_ Kashmir.pdf>.
[6] Kaushik HB, Dasgupta K, Sahoo DR, Kharel G. Performance of structures during the Sikkim earthquake of 14 February 2006. Curr Sci 2006;91(4):449–55.
[7] Sinha R, Brzev SN, Housing report unreinforced brick masonry building with reinforced concrete roof slab, World Housing Encyclopedia 2002, EERI and IAEE, 2002.
[8] Kumar A, Housing report unreinforced brick masonry building with pitched clay tile roof, World Housing Encyclopedia 2002, EERI and IAEE, 2002.
[9] Khan AA, Khalid M, Housing report unreinforced brick masonry walls in mud mortar with flat timber roof, World Housing Encyclopedia 2002, EERI and IAEE, 2002.
[10] Ansary M, Housing report unreinforced brick masonry buildings with GI sheet, World Housing Encyclopedia 2003, EERI and IAEE, 2003.
[11] IS1893. Criteria for earthquake resistant design of structures. New Delhi: Bureau of Indian Standards; 2002.
[12] Strand 7.2 user’s manual. <www.strand7.com>.[13] ABAQUS: theory manual, version 6.10, 2010.[14] CSI (Computers and Structures Inc.), SAP2000 v15 analysis reference manual,
CSI, Berkeley, 2011.
[15] Page A. The biaxial compressive strength of brick masonry. Proc Inst Civil Eng 1981;71:893–906.
[16] Milani G, Lourenco PB, Tralli A. Homogenised limit analysis of masonry walls. Part I. Failure surfaces. Comput Struct 2006;84(3–4):166–80.
[17] Lourenço PB, Computational strategies for masonry structures [PhD thesis]. The Netherlands: Delft University of Technology, 1996.
[18] Lubliner J, Oliver J, Oller S, Oñate E. A plastic-damage model for concrete. Int J Solids Struct 1989;25(3):299–326.
[19] Lucchesi M, Padovani C, Pasquinelli G, Zani N. On the collapse of masonry arches. Meccanica 1997;32:327–34.
[20] Pelà L, Aprile A, Benedetti A. Seismic assessment of masonry arch bridges. Eng Struct 2009;31:1777–88.
[21] Mallardo V, Malvezzi R, Milani E, Milani G. Seismic vulnerability of historical masonry buildings: a case study in Ferrara. Eng Struct 2008;30(8):2223–41.
[22] NTC, Nuove norme tecniche per le costruzioni. Ministero delle Infrastrutture (GU n.29 04/02/2008), Rome, Italy, 2008 [14.01.08].
[23] Carvalho J, Ortega J, Lourenço PB, Ramos LF, Roman H. Safety analysis of modern heritage masonry buildings: box-buildings in Recife, Brazil. Eng Struct 2014;80:222–40.
[24] Milani G, Beyer K, Dazio A. Upper bound analysis limit analysis of meso-mechanical spandrel models for the pushover analysis of 2D masonry frames. Eng Struct 2009;31(11):2696–710.
[25] Cundari GA, Milani G. Homogenized and heterogeneous limit analysis model for pushover analysis of ancient masonry walls with irregular texture. Int J Archit Heritage 2013;7:303–38.
[26] Shahzada K, Khan AN, Elnashai AS, Ashraf M, Javed M, Naseer A, et al. Experimental seismic performance evaluation of unreinforced brick masonry building. Earthquake Spectra 2012;28(3):1269–90.
[27] IS4326. Earthquake resistant design and construction of buildings-code of practice. New Delhi: Bureau of Indian Standards; 1993.
[28] IS13828. Improving earthquake resistance of low strength masonry buildings– guidelines. New Delhi: Bureau of Indian Standards; 1993.
[29] IS13935. Repair and seismic strengthening of buildings – guidelines. New Delhi: Bureau of Indian Standards; 1993.
[30] Eurocode-6-1-1. Design of masonry structures. Part 1-1: General rules for reinforced and unreinforced masonry structures. The European Union: European Standards; 2005.
[31] Betti M, Vignoli A. Assessment of seismic resistance of a basilica-type church under earthquake loading: modelling and analysis. Adv Eng Softw 2008;3(4): 258–83.
[32] Cardoso R, Lopes M, Bento R. Seismic evaluation of old masonry buildings. PartI. Method description and application to a case-study. Eng Struct 2005;27: 2024–35.
[33] Tomazevic M, Lutman M, Weiss P. Seismic upgrading of old brick masonry urban houses: tying of wall with steel ties. Earthquake Spectra 1996;12(3): 559–622.
[34] El-Borgi S, Smaoui H, Casciati F, Jerbi K, Kanoun F. Seismic evaluation and innovative retrofit of a historical building in Tunisia. J Struct Control Health Monit 2005;12(2):179–95.
[35] Borri A, Castori G, Grazini A. Retrofitting of masonry building with reinforced masonry ring-beam. Constr Build Mater 2009;23(5):1892–901.
[36] Vincente R, Rodrigues H, Varum H, Mendes Da Silva JAR. Evaluation of strengthening techniques of traditional masonry buildings: case study of a four-building aggregate. J Perform Const Facil 2011;25(3):202–16.
[37] Tassios TP. Seismic engineering of monuments. Bull Earthquake Eng 2010;8:1231–65.
[38] Branco M, Guerreiro LM. Seismic rehabilitation of historical masonry building. Eng Struct 2011;33:1626–34.
[39] Acito M, Bocciarelli M, Chesi C, Milani G. Collapse of the clock tower in Finale Emilia after the May 2012 Emilia Romagna earthquake sequence: numerical insight. Eng Struct 2014;72:70–91.
[40] Bayraktar A, Sahin A, Özcan M, Yildirim F. Numerical damage assessment of Haghia Sophia bell tower by nonlinear FE modeling. Appl Math Model 2010;34:92–121.
[41] Barbieri G, Biolzi L, Bocciarelli M, Fregonese L, Frigeri A. Assessing the seismic vulnerability of a historical building. Eng Struct 2013;57:523–35.
[42] Brandonisio G, Lucibello G, Mele E, De Luca A. Damage and performance evaluation of masonry churches in the 2009 L’Aquila earthquake. Eng Fail Anal 2013;34:693–714.
[43] Ramos L, Lourenço PB. Seismic analysis of the old buildings in Baixa Pombalina, Lisbon, Portugal. Proc of the 9th North American Masonry Conference. p. 908–19.
[44] Ramos L, Lourenço PB. Modelling and vulnerability of historical city centers in seismic areas: a case study in Lisbon. Eng Struct 2004;26(9): 1295–310.
[45] Betti M, Bartoli G, Orlando M. Evaluation study on structural fault of a Renaissance Italian palace. Eng Struct 2010;32(7):1801–13.
[46] Van Der Pluijm. Shear behaviour of bed joints. In: Abrams DP, editor. Proceedings of 6th North American masonry conference, Philadelphia, 6–9 June. p. 125–36.