Embed Size (px)
Citation preview

School Improvement Plan
Comprehensive Needs AssessmentSchool: Stough ESPlan Year 2014-2016
Page 1 of 24
DataComponents Areas of Strengths Areas of Concern
Stud
ent
Achi
evem
ent
ReadingAccording to 3rd Grade EOG reading data, male students increased by 5% from the previous yearAccording to4th Grade EOG reading data, overall students made an increase of 23% in proficiency from the previous yearAccording to4th Grade EOG reading proficiency data, our students were 5% of WCPSS studentsAccording to 4th Grade EOG reading proficiency data, Levels 1 & 2 made a 56% increase from the previous yearAccording to the 4th Grade EOG reading proficiency data, 7 subgroups increased in proficiency (Level 1 & 2, Level 3, Not SWD,Female, Male, Black, White)According to 5th Grade EOG Reading data, proficiency increased 10% from the previous year.According to 5th Grade EOG proficiency data, Level 3 students increased 34% from the previous yearAccording to 5th Grade EOG reading proficiency data, 5 subgroups increased in proficiency (Level 3, Not SWD, Female, Male,Hispanic/LatinoBased on EVAAS data, 4th grade exceeded expected growth by 4.1Based on EVAAS data, 5th grade make expected growth by 1.5Based on EVAAS data in reading, Stough made the most growth overall in reading in the Northern Area in Reading.
Math
According to AMO, Stough met 12 out of 12 math targets for the 2013-2014 school year.EVASS indicates that 4th grade met growth.According to EOG data:3rd grade students increased their math proficiency from 56% in 2013 to 59% in 2014.4th grade students increased their math proficiency from 46% in 2013 to 57% in 2014. Over the past three years, the NCE Gain exceeded the expected growth by 2.5B.
Reading:
Case 21:*3rd had 41% projected proficiency, as compared to the Northern area with 57% projected proficiency. 16% discrepancy.*4th had 55% projected proficiency, as compared to the Northern area with 63% projected proficiency. 8% discrepancy.*5th had 61% projected proficiency, as compared to the Northern area with 65% projected proficiency. 4% discrepancy. EOG: Schoolwide:*61% of our students were proficient, as compared to 67% of students in Wake County. 6% discrepancy.*White students had 81% proficiency; there are substantial achievement gaps between them and other subgroups as outlined below:*Only 10% of SWD were proficient (achievement gap-71%)*Only 32% of LEP students were proficient (achievement gap-49%)*Only 48% of black students were proficient (achievement gap-33%)*Only 47% of Hispanic/Latino students were proficient (achievement gap-34%)*Only one subgroup met or exceeded the performance of white students (multiracial) Third Grade:*57% of Stough third graders were proficient, while Wake County third graders as a whole had 70% proficiency. 13% discrepancy.*Third grade Stough proficiency went down 6% from last year (from 63% to 57%), while County proficiency went up 3% (from 67% to 70%).*Third grade Stough female proficiency went down 14% from last year (from 68% to 54%).*Third grade Stough black proficiency went down 5% from last year (from 50% to 45%).*At Stough, 86% of white students were proficient as compared to 46% of Hispanic/Latino students (40% discrepancy), 45% of blackstudents (41% discrepancy), 41% of *LEP students (45% discrepancy). Fourth Grade:*86% of white students were proficient, as compared to 64% black (22% discrepancy) (not enough students in other subgroups for data,and not much else to say about 4th grade because 4th had tons of strengths rather than weaknesses) Fifth Grade:*55% of Stough students were proficient as compared to 64% of students in Wake County (9% discrepancy).*Black student performance went down from last year, from 39% proficient to 38%.*White student performance went down from last year, from 73% proficient to 72%.*72% of white students were proficient, as compared to 38% of black students (34% achievement gap) and 45% of Hispanic/Latino students(27% achievement gap).
AMO's and EVAAS*Students with disabilities did not meet their AMO (9.5% proficient, 12.1 below target)*2 of our 12 reading targets were not met *All expected growth targets were met or exceeded (all blue or green)
Math According to the Math EOG for 2013-2014, all students performed lower than Northern area and County.In Math, there is a significant achievement gap between white (73%) and multi-racial (67%) students and other sub-groups –Hispanic/Latino (45%), Black (35%), LEP (39%), and SWD (10%).According to the Math EOG for 2013-2014, 3rd grade results indicate: Stough 59% proficient, District 72% proficient, State 61% proficient. There was a total discrepancy of -13% when compared with the District and -2% with the State.4th grade results indicate: Stough 57% proficient, District 67% proficient, State 54% proficient. There was a total discrepancy of -10% whencompared with the District and +3% with the State.5th grade results indicate: Stough 43% proficient, District 67% proficient, State 56% proficient. There was a total discrepancy of -24% whencompared with the District and -13% with the State.
The AMO was not met with Students w/Disabilities and Academically Gifted students.
According to Case 21 Assessments (2014) the projected percent proficient for each grade level is below the Northern Area.For 3rd grade: Stough is 58.43% while Northern Area is 66.7 %.For 4th: Stough is 51.5 % while Northern Area is 56.9%.For 5th: Stough 45.0% while Northern Area: 55.8 %.

School Improvement Plan
Comprehensive Needs AssessmentSchool: Stough ESPlan Year 2014-2016
Page 2 of 24
DataComponents Areas of Strengths Areas of Concern
Inst
ruct
iona
lPr
actic
es/S
trat
egie
s
PDP goal for Writer’s Workshop across all grade levels
Dual Serve ESL and Title 1
Dual Serve SWD and Title 1 Use of support staff, TA’s, and specialists for interventions throughout the dayImplementation of research based interventionsProgress monitoring through mCLASSInterventionists on five grade levels (K-4)Implementation of MTSSCoaching StaffESL and Special Ed Team participating in co-teaching
Literacy Walk Through Data provided by the Literacy Coach & IRT:
• 72% of classrooms had kid-friendly objectives posted• 75% of questions being asked during lessons were higher level - based on Bloom's• 64% of students were engaged in writing activities which aligns school PDP goal• 83% or students observed were reading text on the appropriate reading level
Improve PLTs and respond appropriately and more frequently to data
Implement a system to address and remediate fact fluency K-5 Grade level data wallsFlexible grouping and team time among grade levels without losing instructional time.Literacy Walk Through Data provided by the Literacy Coach & IRT:• Only 30% of classrooms had a wide variety of reading materials that were easily accessible to students• Only 38% of classrooms were engaging students in 21st century learning opportunities (i.e. collaboration, problem solving, empathy,technology, creative thinking, and global issues)• Only 52% of classrooms had the appropriate amount of time scheduled for literacy (reading and writing)• Only 66% of teachers had their lessons plans out and visible
Staf
f and
Stud
ent
Dem
ogra
phic
s
Staff Demographics: According to the 2013-2014 NC Report Card:-45 classroom teachers- 100% were Highly Qualified & Licensed- 36% had advanced degrees- 7 were NBCT
- Teacher Experience* 0-3 yrs - 18%* 4-10 yrs - 38%* 10+ yrs - 44%
- Teacher turnover rate - 15%
Student Demographics - 2013-14
- 614 total enrollment
- Ethnicity - - 41.2% Black or African American- 27.9% White- 21.7% Hispanic/Latino- 3.7% Asian- 5.5% Multi-Racial- 0 % American Indian
Based on 2012-2013 WCPSS Enrollment Report:- 55.2% F&R- 19.3% LEP
- Teacher turnover rate (15%) is higher than the district (11%) and state (13%) averages

School Improvement Plan
Comprehensive Needs AssessmentSchool: Stough ESPlan Year 2014-2016
Page 3 of 24
DataComponents Areas of Strengths Areas of Concern
Perc
eptio
n
According to 2014 school-designed working conditions suvey on a scale from 0 to 5 (with 0 being strongly disagree, 3 agree,and 5 being strongly agree), staff chose a rating of 3 to 5 :
- 96% for PLT being aligned to the School Improvement Plan
- 96% for PD that enhances teacher's abilities to improve student learning
- 100% School Improvement team provides effective leadership
- 81% Teachers have an appropriate level of influence on decision making in this school through school leadership roles.
- 96% The school leadership facilitates using data to improve student learning.
- 89% Teachers receive feedback that can help them improve teaching.
-88% Professional learning communities/ teams translate to improvements in instructional practices by teachers.
- 89% School administrators consistently enforce rules for student conduct.
-96% Teachers consistently enforce rules for student conduct.
-93% Students at this school understand expectations for their conduct.
- 28 of 45 teachers (62%) completed the 2014 school-designed working conditions suvey.
- 64% Teachers have time available to collaborate with colleagues.
- 75% Teachers feel comfortable raising issues and concerns that are important to them.
- 68% feel that PBIS initiatives are having a positive impact on student behavior at Stough
- There is limited data available in regards to a parent survey.
Fourth Grade student survey results not avalaible at time of CNA completion.
Prog
ram
Safe and Orderly Schools (PBIS)
- Referrals for most students in the "Pony Pal" mentoring program have leveled out or decreased.
2013-2014 Parent Outreach data indicates the following parents/families attended the listed events:
Birthday Luncheons: 227 (May/June info not included yet)
Global Open House: 7
Kindergarten Rodeo: 6
Open House/Tours : 13
Kindergarten Open House: TBD on May 13, 2014
Title 1 PAC Nights: 114 (1 more event on 5/9/14
Safe and Orderly Schools (PBIS)
- There were 215 major office referrals this year. 30 students received out of school suspensions for a total of 38 days, as of 5/5/14Stough Achievers Program - no data has been collected to show growth or declining for student achievement.

School Improvement Plan
Comprehensive Needs AssessmentSchool: Stough ESPlan Year 2014-2016
Page 4 of 24
Priority Concerns Root Causes(with evidence) Solutions
There is a lack of proficiency in Reading and Mathfor most subgroups.
Lack of data-driven instruction as indicated by lackof rigor, critical thinking, collaboration, questioning,as evidenced on walk-through data and studentachievement results.
Increase in Free and Reduced, ESL/LEP population(especially Hispanic), & mobility of students
There is a significant achievement gap betweenwhite students and other sub groups (21%). White-62%, SWD- 9%, LEP- 21%, Hispanic- 29%, Black-25%.
For proficiency the following areas need to beaddressed:• Remediation• Core - Rigor, Mastery• Resources• Math Concepts• Reading Concepts• Math higher order thinking skillsFor instruction the following arease need to beaddressed:
• Planning• Assessments• Rigor• Resources• Instructional assistants
The demographics of the school are influenced by:• School assignment – Stough is an over-flowschool for at 3 surrounding schools.• Poverty
Structural• Purposeful, meaningful, scheduling ofremediation/ enrichment• Vertical planning for Reading and Math• Backward Design - assessments, plan, teach,post-assessment• PLT focused on common planning &assessment• Infuse global learning into all parts of thecurriculum - explicitAcademic needs• Implement SIOP with fidelity• Writing Across the Curriculum using Responsejournals (open-ended questions, written response)• Create opportunities for collaborative learning• Create tools for teachers to strengtheninstructions (committees)• Vocabulary acquisition• Opportunities for use of Higher Level ThinkingSkills• Effective use of technology (including trainingand examples of use)
School Improvement Plan
Comprehensive Needs AssessmentSchool: Stough ESPlan Year 2014-2016
Page 5 of 24
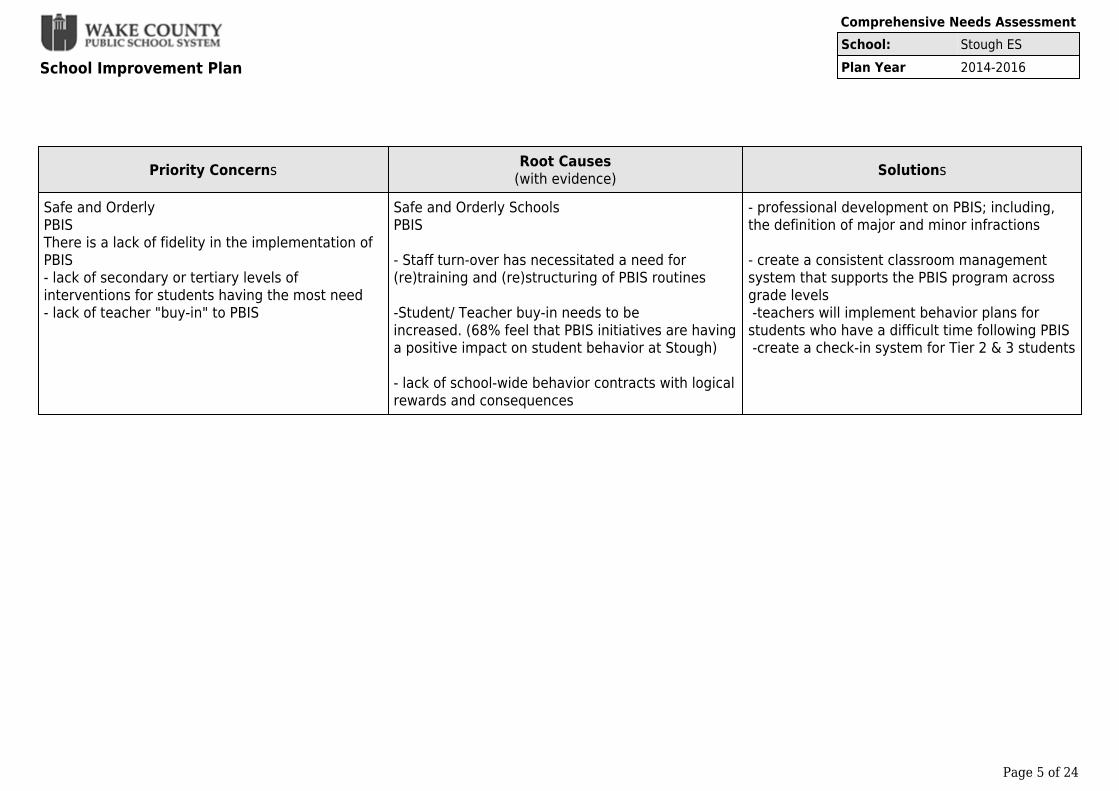
Priority Concerns Root Causes(with evidence) Solutions
Safe and OrderlyPBISThere is a lack of fidelity in the implementation ofPBIS - lack of secondary or tertiary levels ofinterventions for students having the most need- lack of teacher "buy-in" to PBIS
Safe and Orderly SchoolsPBIS
- Staff turn-over has necessitated a need for(re)training and (re)structuring of PBIS routines
-Student/ Teacher buy-in needs to beincreased. (68% feel that PBIS initiatives are havinga positive impact on student behavior at Stough)
- lack of school-wide behavior contracts with logicalrewards and consequences
- professional development on PBIS; including,the definition of major and minor infractions
- create a consistent classroom managementsystem that supports the PBIS program acrossgrade levels -teachers will implement behavior plans forstudents who have a difficult time following PBIS -create a check-in system for Tier 2 & 3 students

School Improvement Plan
Comprehensive Needs AssessmentSchool: Stough ESPlan Year 2014-2016
Page 6 of 24
Data SummaryDescribe your conclusionsStudent Achievement continues to be a source of concern.
Reading
• Low proficiency (less than 50%) in reading across grade levels as defined by the 2012-2013 EOG data. Stough is also below the district average in grades3-5.• Based on EOG data, our overall reading proficiency was 2% lower than the state and 12% lower than the district.• AMO- met expected growth for all students in reading• There is a significant achievement gap between white students and other subgroups. (22%)Math
• On the EOG 2012-2013, all students performed lower than Northern area and county.• There is a significant achievement gap between white students and other sub groups (21%).• However, we are making growth based on EVASS data. Parent Communication
There is a need for increase communication with parents, especially parents of ESSL/LEP as well as economically disadvantaged students.
There is limited data collected about parent involvement in the school.

School Improvement Plan
Membership of School Improvement TeamSchool: Stough ESPlan Year 2014-2016Principal: Cheryl StidhamDate: Aug - 2014
Page 7 of 24
SIP Team MembersName School Based Job Title
1 Barbara Best Teacher2 Becky Jarman Teacher3 Cheryl Stidham Principal4 Chris Maxwell Instructional Support Personnel5 Cindy Linton Teacher6 Jackie Mills Teacher7 Jennifer Arnold Teacher8 Jo Wiles Parent9 Kathrine Willis Teacher Assistant10 Katie Cox Teacher11 Matthew Hooker Teacher12 Shannon Wheeler Instructional Support Personnel13 William Helfrich Assistant Principal

School Improvement Plan
Mission, Vision and Value StatementsSchool: Stough ESPlan Year 2014-2016Date: Jun - 2014
Page 8 of 24
Mission Statement:Stough Elementary - Where we engage, empower, and educate.
Vision Statement:Stough Elementary will become a school of academic excellence that collaborates within the local andglobal community.
Value Statement:- Best educational practices- Teamwork- Responsibilities- A safe and orderly environment- Good character traits- Respecting our differences- Healthy lifestyle- 21st century skills
School Improvement Plan
Summary of Goals, Key Processes and Action StepsSchool: Stough ESPlan Year 2014-2016LEA: Wake County (920)
Page 9 of 24
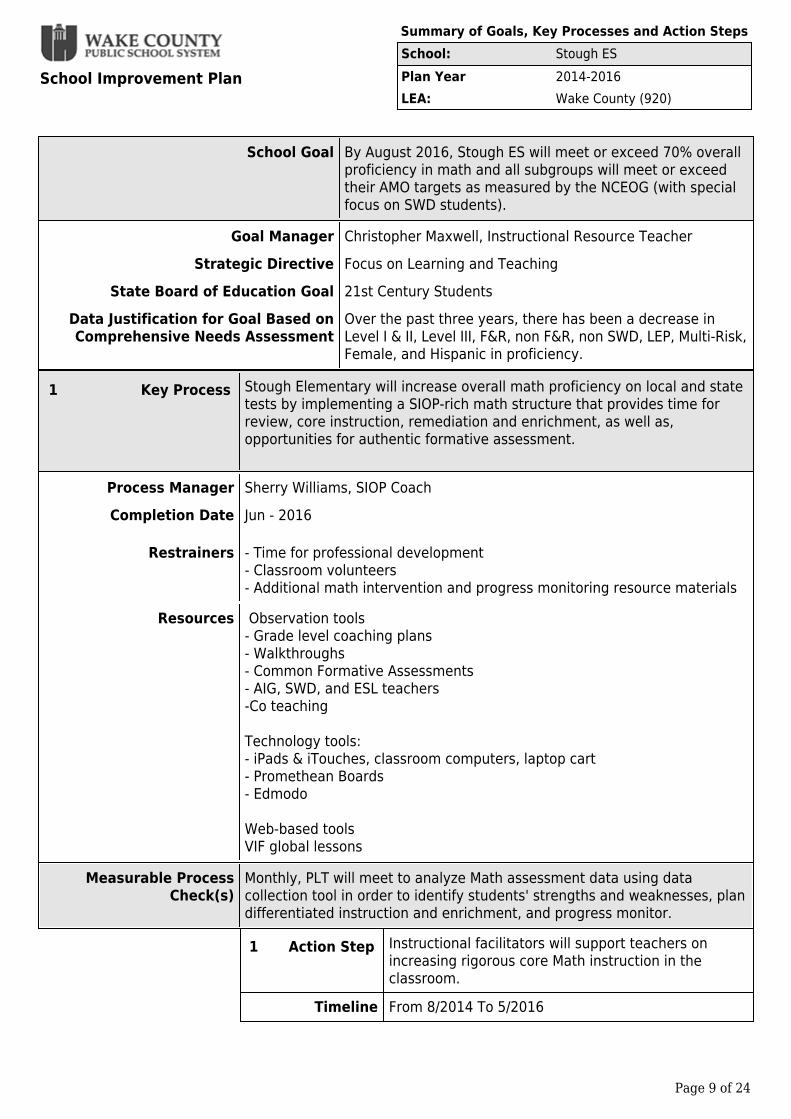
School Goal By August 2016, Stough ES will meet or exceed 70% overallproficiency in math and all subgroups will meet or exceedtheir AMO targets as measured by the NCEOG (with specialfocus on SWD students).
Goal Manager Christopher Maxwell, Instructional Resource TeacherStrategic Directive Focus on Learning and Teaching
State Board of Education Goal 21st Century StudentsData Justification for Goal Based onComprehensive Needs Assessment
Over the past three years, there has been a decrease inLevel I & II, Level III, F&R, non F&R, non SWD, LEP, Multi-Risk,Female, and Hispanic in proficiency.
1 Key Process Stough Elementary will increase overall math proficiency on local and statetests by implementing a SIOP-rich math structure that provides time forreview, core instruction, remediation and enrichment, as well as,opportunities for authentic formative assessment.
Process Manager Sherry Williams, SIOP CoachCompletion Date Jun - 2016
Restrainers - Time for professional development- Classroom volunteers- Additional math intervention and progress monitoring resource materials
Resources Observation tools- Grade level coaching plans- Walkthroughs- Common Formative Assessments- AIG, SWD, and ESL teachers-Co teaching
Technology tools:- iPads & iTouches, classroom computers, laptop cart- Promethean Boards- Edmodo
Web-based tools VIF global lessons
Measurable ProcessCheck(s)
Monthly, PLT will meet to analyze Math assessment data using datacollection tool in order to identify students' strengths and weaknesses, plandifferentiated instruction and enrichment, and progress monitor.
1 Action Step Instructional facilitators will support teachers onincreasing rigorous core Math instruction in theclassroom.
Timeline From 8/2014 To 5/2016

School Improvement Plan
Summary of Goals, Key Processes and Action StepsSchool: Stough ESPlan Year 2014-2016LEA: Wake County (920)
Page 10 of 24
2 Action Step Teachers will attend on-going professionaldevelopment and coaching sessions with SIOP coach.
Timeline From 9/2014 To 6/2016
3 Action Step Teachers will implement research based programs toimprove and track students’ math fact fluency.
Timeline From 8/2014 To 12/2014
4 Action Step Based on common assessment data, teachers willgroup students for targeted intervention andenrichment.
Timeline From 9/2014 To 6/2016
2 Key Process Using the backwards design model, staff will align their math planning,instruction and common assessments.
Process Manager Christopher Maxwell, Instructional Resource TeacherCompletion Date Jun - 2015
Restrainers Time for Professional development and planning
Resources Observation tools- Grade level coaching plans- Walkthroughs- Common Formative Assessmen
Technology tools:- Learning Response devices- iPads & iTouches, classroom computers, laptop cart- Promethean Boards- Edmodo
Web-based tools VIF global lessons
Measurable ProcessCheck(s) Monthly PLTs will analyze assessment data
1 Action Step Instructional facilitators will train staff on creatingeffective common assessments
Timeline From 8/2014 To 1/2015
2 Action Step Instructional facilitators will provide training on howto effectively implement standards based grading.
Timeline From 8/2014 To 12/2014

School Improvement Plan
Summary of Goals, Key Processes and Action StepsSchool: Stough ESPlan Year 2014-2016LEA: Wake County (920)
Page 11 of 24
3 Action Step Instructional facilitators will provide training on howto hold effective PLTs based on the DuFour model.
Timeline From 6/2014 To 12/2014
4 Action Step During PLT, teachers will create common formativeassessments and align their instruction in response tostudent data.
Timeline From 8/2014 To 6/2015
3 Key Process Staff will explicitly teach key math academic vocabulary K-5 as part of theirdaily math instruction.
Process Manager Rebecca Jarman, 5th Grade TeacherCompletion Date Jun - 2015
Restrainers
Resources Grade level specific math vocabulary word wall cardsWCPSS grade specific math vocabulary lists
Measurable ProcessCheck(s)
Monthly, PLT will meet to analyze math pacing guides, unit overviews, andgrade level math vocabulary lists to determine key vocabulary to be taughtfor each cluster. Walk-through checklists will be used to determine howteachers are implementing vocabulary into daily instruction.
1 Action Step Teachers will display and use math word/realia wallsto strengthen core instruction.
Timeline From 8/2014 To 6/2016
2 Action Step Instructional facilitators will train staff on how toeffectively embed key math vocabulary into theirdaily instruction.
Timeline From 8/2014 To 1/2015

School Improvement Plan
Summary of Goals, Key Processes and Action StepsSchool: Stough ESPlan Year 2014-2016LEA: Wake County (920)
Page 12 of 24
School Goal By August 2015, Stough ES will meet or exceed 70% overallproficiency in reading and all subgroups will meet or exceedtheir AMO targets as measured by the NCEOG (with specialfocus on SWD students)..
Goal Manager PrincipalStrategic Directive Focus on Learning and Teaching
State Board of Education Goal 21st Century StudentsData Justification for Goal Based onComprehensive Needs Assessment
Over the past three years, there has been a decrease in LEP,SWD, Hispanic, Black, F&R, non-F&R, Level IV (AIG andnon-AIG) in growth and there has been a decrease in Level I& II, LEP, SWD, and Hispanic in proficiency.
1 Key Process Stough will increase the overall Reading proficiency on local and state testsby implementing Common Core Writer's workshop, differentiated strategygroups with focus on the fundamentals of writing, and integration of writingacross the curriculum in all classrooms grades K-5.
Process Manager Shannon Wheeler, Literacy CoachCompletion Date Jun - 2016
Restrainers - Time outside direct instruction- Classroom volunteers
Resources - Florida Center for Reading Research intervention activites- Lucy Caulkins Writing Kits- Earaborics- Letter Land- Grade level coaching plans- Walkthroughs- Common Formative Assessments- AIG, SWD, and ESL teachers-Co teaching
Technology tools:- Learning Response devices- iPads & iTouches, classroom computers, laptop cart- Promethean Boards- Edmodo
Web-based tools VIF global lessons
Measurable ProcessCheck(s)
Monthly, PLT will meet to analyze student writing samples and exemplarsto identify students' strengths and weaknesses, plan differentiatedintervention and enrichment, and progress monitor.

School Improvement Plan
Summary of Goals, Key Processes and Action StepsSchool: Stough ESPlan Year 2014-2016LEA: Wake County (920)
Page 13 of 24
1 Action Step Instructional facilitators will provide ongoing trainingto staff on the structure of Common Core Writer'sWorkshop using the Lucy Caulkins Writing Kits.
Timeline From 8/2014 To 6/2016
2 Action Step Teachers will collaborate during grade level planningto provide differentiated writing instruction across allcore subjects, including specials.
Timeline From 8/2014 To 6/2016
3 Action Step Writing opportunities will be included on allassessments and throughout the instructional day inreading, math, science, and social studies.
Timeline From 8/2014 To 6/2016
4 Action Step Grade levels will analyze student writing samples as acollaborative team to allow for grade levelconsistency.
Timeline From 8/2014 To 6/2016
2 Key Process Using the backwards design model, staff will align ELA planning, instructionand assessments.
Process Manager Christopher Maxwell, Instructional Resource TeacherCompletion Date Jun - 2014
Restrainers - Time for professional development
Resources Observation tools- Formative assessments- Running record data- mClass data- EVAAS data- Data from learning rounds- PLT minutes- We wish to utilize all budget flexibilities allowed by DPI, general statues,applicable laws and local policies.
Technology tools:- iPads & iTouches, classroom computers, laptop cart- Promethean Boards- Edmodo- VIF Global lessons
Measurable ProcessCheck(s) Staff will analyze Common Assessments, Case 21, and mCLASS data on a
monthly basis (using a common data collection tool) in order to alignlearning objectives, inform instruction, and ensure student growth.

School Improvement Plan
Summary of Goals, Key Processes and Action StepsSchool: Stough ESPlan Year 2014-2016LEA: Wake County (920)
Page 14 of 24
1 Action Step Instructional facilitators will train staff on creatingeffective common assessments.
Timeline From 8/2014 To 6/2014
2 Action Step Instructional facilitators will provide training on howto effectively implement standards-based grading.
Timeline From 8/2014 To 1/2014
3 Action Step Instructional facilitators will provide training on howto hold effective PLT based on the DuFour model.
Timeline From 8/2014 To 12/2014
4 Action Step During PLT, teachers will create common formativeassessments and align their instruction in response tostudent data.
Timeline From 8/2014 To 6/2015

School Improvement Plan
Summary of Goals, Key Processes and Action StepsSchool: Stough ESPlan Year 2014-2016LEA: Wake County (920)
Page 15 of 24
School Goal By June 2016, Stough Elementary will have a satisfactionrating of 90% with the implementation of PBIS as measuredby teacher, student, and parent surveys.
Goal Manager William Helfrich, Assistant PrincipalStrategic Directive Retaining, Recruiting, and Training High Quality Employees
State Board of Education Goal Healthy Responsible StudentsData Justification for Goal Based onComprehensive Needs Assessment
There is a lack of data in this area, and we need to createschool-based surveys to generate a baseline for this goal.
1 Key Process Stough will improve communication and engagement with parents andcommunity partners.
Process Manager Parent LiaisonCompletion Date Jun - 2016
Restrainers TimeParent representativesTranslatorsTransportation
Resources parent representativesPTAStudent Support Services - on campus nurse and social worker
Measurable ProcessCheck(s)
Quarterly, staff will analyze parent surveys, attendance data as well asParent Outreach committee notes and recommendations.
1 Action Step In collaboration with the PTA, Stough will create aParent Outreach committee that targets the ESL/LEPpopulation (especially Latino) and Socially/Economically Disadvantaged groups.
Timeline From 1/2015 To 6/2016
2 Action Step Parents will be invited to student performances thatshowcase creativity and academic progress duringthe Fall, Winter, and Spring.
Timeline From 8/2014 To 6/2016
3 Action Step Each Friday, administration will communicate withparents via a school messenger phone call.
Timeline From 8/2014 To 6/2016
4 Action Step Teachers will work with social worker to continue toimprove attendance and monitor student days oncampus.
Timeline From 8/2014 To 6/2016

School Improvement Plan
Summary of Goals, Key Processes and Action StepsSchool: Stough ESPlan Year 2014-2016LEA: Wake County (920)
Page 16 of 24
2 Key Process All teachers will implement and practice PBIS and Character Education intheir classrooms and throughout the school.
Process Manager Rachel Deakin, PBIS ChairCompletion Date Jun - 2016
Restrainers - Staff turnover- Time for paperwork
Resources - PBIS program- Duty free lunch and planning- Safe and Orderly Schools Plan- Character Education Plan
Measurable ProcessCheck(s)
Quarterly, the Learning Walk-through team and PBIS Committee willanalyze the implementation and effectiveness of PBIS and CharacterEducation, through a checklist and SIRS data to decrease the number ofstudent referrals.
1 Action Step Under the leadership of PBIS committee, thecommittee will create a learning walk- through rubricor checklist.
Timeline From 1/2015 To 12/2015
2 Action Step Under the leadership of PBIS committee, all staff willbe trained in PBIS and Character Education at thebeginning of each school year and revisited eachquarter to assess progress and areas of support.
Timeline From 8/2014 To 2/2015
3 Action Step The PBIS committee will create a resource website forteachers to access PBIS and Character Educationlesson plans, strategies, and resources (e.g. hats off).
Timeline From 8/2014 To 8/2015
4 Action Step Each quarter, teachers will recognize students foracademic and good character in an awards ceremony.
Timeline From 10/2014 To 6/2016
5 Action Step Under the leadership of the PBIS Committee, parentsand students will be provided a quarterly survey toassess understanding of school expectations and PBISmodel, as well as, to determine areas for continuedsupport.
Timeline From 1/2015 To 6/2016

School Improvement Plan
Waiver RequestSchool: Stough ESPlan Year 2014-2016
Page 17 of 24
Date Aug - 2014Waiver RequestedNone requestedHow will this waiver impact school improvement?NonePlease indicate the type of waiver: LocalPlease indicate the policy to be waived none

School Improvement Plan
Summary Sheet of Professional Development ActivitiesSchool: Stough ESPlan Year 2014-2016School Year: 2014-2015
Page 18 of 24
Development Activities for Topic: Participants: Goal Supported: Supporting Data:Effective PLT basedon the DuFourmodel
All staff By June 2016, all subgroupsat Stough Elementarywill increase proficiency by10% in Reading and Mathas measured by the ABCgrowth data, and allsubgroups will reach theirAMO proficiency targets.
Over the past threeyears, there has been adecrease in LEP, SWD,Hispanic, Black, F&R, non-F&R,Level IV (AIG and non-AIG) ingrowth and there has been adecrease in Level I & II, LEP,SWD, and Hispanicin proficiency.
Creating effectivecommonassessments.
Classroom teachersand interventionstaff
By June 2016, all subgroupsat Stough Elementarywill increase proficiency by10% in Reading and Mathas measured by the ABCgrowth data, and allsubgroups will reach theirAMO proficiency targets.
Over the past threeyears, there has been adecrease in LEP, SWD,Hispanic, Black, F&R, non-F&R,Level IV (AIG and non-AIG) ingrowth and there has been adecrease in Level I & II, LEP,SWD, and Hispanicin proficiency.
Usingand implementingthe SIOP model
All staff By June 2016, all subgroupsat Stough Elementarywill increase proficiency by10% in Reading and Mathas measured by the ABCgrowth data, and allsubgroups will reach theirAMO proficiency targets.
Over the past threeyears, there has been adecrease in LEP, SWD,Hispanic, Black, F&R, non-F&R,Level IV (AIG and non-AIG) ingrowth and there has been adecrease in Level I & II, LEP,SWD, and Hispanicin proficiency.
Technologyintegration acrossthe curriculumthrough the use ofidentified tools
All staff By June 2016, all subgroupsat Stough Elementarywill increase proficiency by10% in Reading and Mathas measured by the ABCgrowth data, and allsubgroups will reach theirAMO proficiency targets.
Over the past threeyears, there has been adecrease in LEP, SWD,Hispanic, Black, F&R, non-F&R,Level IV (AIG and non-AIG) ingrowth and there has been adecrease in Level I & II, LEP,SWD, and Hispanicin proficiency.
PBIS and CharacterEducation
All Staff By June 2016, StoughElementary will have asatisfaction rating of 90%and increase parentinvolvement by 10% asmeasured by teacher,student, and parent surveysas well as school-sponsoredprogram attendance data.
There is a lack of data in thisarea, and we need tocreate school-based surveys togenerate a baseline for thisgoal.

School Improvement Plan
Summary Sheet of Professional Development ActivitiesSchool: Stough ESPlan Year 2014-2016School Year: 2015-2016
Page 19 of 24
Development Activities for Topic: Participants: Goal Supported: Supporting Data:

School Improvement Plan
Intervention Planning MatrixSchool: Stough ESPlan Year 2014-2016School Year: 2014-2015
Page 20 of 24
Reading Math Behavior
Student Identification
• Data used to determine student need willinclude the following: running records,mCLASS , initial kindergarten assessmentdata, digging deeper assessments, reportcard data, Case 21 and EOG scores• mCLASS data and digging deeperassessments will be used to identify studenteligibility• Once students have been identified asbelow benchmark, the intervention team willcollaborate with ESL, classroom teacher,special education and administration todetermine which service(s) would best meetthe student’s needs• mCLASS Progress Monitoring data will becollected 10-20 days and analyzed duringgrade level PLTs to ensure all students notachieving “at benchmark” are makingadequate growth• During monthly collaboration, teachers willnotify Tier II interventionists of any newstudents that are below benchmark afterexamining their weekly classroom andmCLASS data• Students will be served and their data willbe monitored on a daily/weekly basis by theirclassroom teacher• Students will be served and their data willbe monitored on a daily/weekly basis by theirTier II interventionistStudents will exit the intervention processwhen benchmark is achieved, maintained,and through mutual agreement of classroomteacher, and Tier II interventionist
• Data used to determine student need willinclude the following: assessment data,report card data, Case 21 and EOG scores• Teachers complete classroom rankingforms adapted from the WCPSS Title Idepartment for BOY• Once students have been identified asbelow benchmark, the intervention team willcollaborate with ESL, classroom teacher,special education and administration todetermine which service(s) would best meetthe student’s needs• Classroom ranking forms (BOY), includingWCPSS formative assessments, will beupdated during collaboration to ensure allstudents not achieving “at benchmark” aremaking adequate growth. • During collaboration, classroom teachers/tier II interventionists will discuss studentsthat are below benchmark after examiningtheir weekly classroom data.• Intensive and strategic students will beserved and their data will be monitored on adaily/weekly basis by their Tier IIinterventionist, classroom teacher and/orbest service team.• Students will exit the intervention processwhen benchmark is achieved, maintained,and through mutual agreement of classroom,grade level teacher, and Tier IIinterventionist.
• SIRS discipline data: documentation ofMinor offenses, Major office disciplinereferrals (ODRs), suspension data; RtI-Bbehavioral screenings and universal ratings;attendance data; teacher/parent feedback• Students who have a pattern of minoroffenses or at least two major officediscipline referrals; students who score belowstandard on both a behavioral screening anduniversal rating; students missing at least 10days of school over a 9 week period;students referred by teacher or parent• Discipline data will be reviewed monthlyduring Kid Talk and PBIS team meetings;behavior screenings will take place at thebeginning, middle, and towards the end ofthe year; based on the screening results,universal ratings will be completed ormodified for students not meetingbenchmark; attendance data will bereviewed weekly; and student referrals willbe reviewed by the Tier II team whenreceived• Discipline data (minor and major incidents)is recorded in SIRS. PLTs review overarchinggrade level data during Kid Talk and delvedeeper into specific student data as neededfor problem solving. The PBIS Team and TierII team also review SIRS data monthly andshare updates and recommendations withstaff. Data is analyzed by all teams usingthe TIPS process.• Students referred through Kid Talk, whohave had at least two major referrals, orhave been referred by a staff member orparent will be reviewed by the Tier II teamand recommended for prescribed classroominterventions or possibly receive brief SocialSkills instruction. Students will be assessedagain one month later and those respondingto the intervention(s) will be graduallyreleased and/or exited. Students notresponding to this intervention(s) will beconsidered for more intensive and specificSocial Skills instruction during EnrichmentTime and/or participate inCheck-In/Check-Out (CICO). Once studentsare able to earn 80% of their expected dailypoints over a one month period, the studentwill be gradually faded off (i.e., the duration,intensity, and frequency will decrease) untilskills can be generalized across all areas.

School Improvement Plan
Intervention Planning MatrixSchool: Stough ESPlan Year 2014-2016School Year: 2014-2015
Page 21 of 24
Reading Math Behavior
Intervention Structure
• Our service intervention delivery will be ahybrid of pull out, push-in, and co-teachingclassrooms with grade levelteachers, interventionists, specialists andteacher assistants providing all instruction.• Interventionists will collaborate withassigned grade level teachers and any otherswho contribute to the student’s literacyeducation to determine student goals eachmonth.• Interventionists will attend weekly PLTswith assigned grade levels and hold quarterlyPLTs to discuss student growth.• Y-achievers and all other after schooltutoring programs will continue toservice students that need additional support
• Our service intervention delivery will be ahybrid of pull out, push-in, and co-teachingclassrooms with grade level teachers,interventionists, specialists and teacherassistants providing all instruction. • Students will receive math intervention aminimum of 20 minutes per day, 2-5 timesper week (depending on the RtI tier ofinstruction). • Interventionists will collaborate withassigned grade level teachers and any otherswho contribute to the student’s matheducation to determine student goals eachmonth.• Interventionists will attend weekly PLTswith assigned grade levels and hold quarterlyTitle I PLTs to discuss student growth.• Stough Achievers, specialist, tutors, andafter school Title 1 tutoring programs willcontinue to service students that needadditional support.
• Once a month during PLTS, teams use theirTIPS guiding document to help conduct KidTalk.• Once a quarter during SIP meetings, wholeschool and grade level data is reviewed. PLTs meet the next day to further reviewgrade level discipline trends and use TIPS forproblem solving to make adjustments.• The Tier II team and PBIS team hasrepresentation from all grade levels and worktogether to review data and assess fidelity ofbehavioral instruction and intervention.• Core behavioral lessons (Tell, Show,Practice format) are directly delivered asneeded based on grade level data.• Students earmarked for Social SkillsInstruction are taught behavior specificlessons separately during Enrichment Timeusing the I Do, We Do, You Do format.• Students receiving CICO are reinforced andtaught using a capacity building coachingmodel by the coordinator they check in orout with daily.

School Improvement Plan
Intervention Planning MatrixSchool: Stough ESPlan Year 2014-2016School Year: 2014-2015
Page 22 of 24
Reading Math Behavior
Instruction
• Interventionists will use assessment dataand collaboration to drive their dailyinstruction.• Interventionists will use research-basedliteracy programs and materials, in additionto the Common Core, with all students. • Students will receive services in a hybridformat of pull out and push-in. Interventionists will plan collaborativelyusing the Common Core benchmarks forreading instruction. The lessons will containboth general reading standards as well asspecific, skill-based measures for each child. When being served in a small group setting,the group size will not exceed six students. • To guide intervention groups and length ofservice, the RtI/MTSS model format (TierI=differentiated classroom instruction; TierII=20-30 minutes of additional instruction,2-3 times per week; Tier III=45-60 minutes ofadditional instruction, 3-5 times per week)will be used for student-teacher ratios andtimelines. Students will remain on tiers aslong as they are making progress. Ifstudents no longer show growth, they will bemoved to a more intensive tier of instruction. • Interventionists will attend weeklycollaboration, PLT’s, grade level planningmeetings and parent conferences (as needed)to report student data and academicprogress.
• Interventionists will use assessment dataand collaboration to drive their dailyinstruction.• Interventionists will use research-basedmathematics programs and materials, inaddition to the Common Core. • Students will receive services in a hybridformat of pull out and push-in. Interventionists will plan collaborativelyusing the Common Core benchmarks formath instruction. The lessons will containboth general math standards as well asspecific, skill-based measures for each child. When being served in a small group setting,the group size will not exceed six students. • To guide intervention groups and length ofservice, the RtI/MTSS model format (TierI=classroom instruction; Tier II=20-30minutes of additional instruction, 2-3 timesper week; Tier III=45-60 minutes ofadditional instruction, 3-5 times per week)will be used for student-teacher ratios andtimelines. Students will remain on tiers aslong as they are making progress. Ifstudents no longer show growth, they will bemoved to a more intensive tier of instruction. • Interventionists will attend weeklycollaboration, PLT’s, grade level planningmeetings and parent conferences (as needed)to report student data and academicprogress
• Once a month during PLTS, teams use theirTIPS guiding document to help conduct KidTalk.• Once a quarter during SIP meetings, wholeschool and grade level data is reviewed. PLTs meet the next day to further reviewgrade level discipline trends and use TIPS forproblem solving to make adjustments.• The Tier II team and PBIS team hasrepresentation from all grade levels and worktogether to review data and assess fidelity ofbehavioral instruction and intervention.• Core behavioral lessons (Tell, Show,Practice format) are directly delivered asneeded based on grade level data.• Students earmarked for Social SkillsInstruction are taught behavior specificlessons separately during Enrichment Timeusing the I Do, We Do, You Do format.• Students receiving CICO are reinforced andtaught using a capacity building coachingmodel by the coordinator they check in orout with daily.
Assessment
• Fountas and Pinnell assessment kits andmCLASS literacy measures will be used toassess students for reading. Students will beassessed beginning, middle, and end of theyear or when deemed necessary by theinterventionist or classroom teacher.• Teacher created and/or WCPSS formativeand summative assessments will be used toprogress monitor students every 10-20 days.• In addition, the following assessments willbe given in response to student response tointervention: Names Test, Letter/Sound ID,Print Concepts, High Frequency Words Test,and the PAST.
• mCLASS, Case 21 data will be used toassess students for math. Students will beassessed beginning, middle, and end of yearor when deemed necessary by theinterventionists or classroom teacher.• Teacher created or WCPSS formative andsummative assessments.
• mCLASS, Case 21 data will be used toassess students for math. Students will beassessed beginning, middle, and end of yearor when deemed necessary by theinterventionists or classroom teacher.• Teacher created or WCPSS formative andsummative assessments.

School Improvement Plan
Intervention Planning MatrixSchool: Stough ESPlan Year 2014-2016School Year: 2014-2015
Page 23 of 24
Reading Math Behavior
Curriculum/Resources
• mCLASS, Fountas and Pinnell BenchmarkAssessment Kits• Leveled Readers• Early Reading Intervention Materials thathave been research-based• iPads and iPod Touches will be used as anadditional and supplemental resource• Inventory will be kept on all Title I materialsand updated yearly• 100% Literacy Coach to work with all gradelevel teachers on the implementation ofbest-practice reading instruction, curriculumalignment, and research-based interventionstrategies.• Addition of a full-time Instruction ResourceTeacher (IRT).
• Houghton Mifflin Math Expressions as italigns to the Common Core• Mathematics Intervention Materials thathave been research-based (i.e. NumberWorlds, iReady, etc.)• iPads and iPod Touches will be used as anadditional and supplemental resource• Inventory will be kept on all Title I materialsand updated yearly• Addition of a full-time Instruction ResourceTeacher (IRT).
• Character Education• PBIS• Social Skills Instruction/Training• Check-In/Check-Out

School Improvement Plan
Intervention Planning MatrixSchool: Stough ESPlan Year 2014-2016School Year: 2015-2016
Page 24 of 24
Reading Math BehaviorStudent IdentificationInterventionStructureInstructionAssessmentCurriculum/Resources