Embed Size (px)
Citation preview
Comprehensive Mobility Plan
Back to Basics Kolkata Metropolitan Area
Infrastructure Development Finance Company Ltd.
Superior Global Infrastructure Consulting Pvt Ltd.
August, 2008
COMPREHENSIVE MOBILITY PLAN FOR KMA i EXECUTIVE SUMMARY – BACK TO BASICS
EXECUTIVE SUMMARY
BACK TO BASICS
The Comprehensive Mobility Plan of Kolkata Metropolitan Area (KMA) is an initiative of the
Government of West Bengal to address the growing traffic congestion in the study area. The
scope called for identifying the capital investment required to reduce the congestion and to derive
a set of potential strategies to address the future demand. Kolkata Metropolitan Area (KMA) has an area of 1875 sq. km.; with a population of 16.7 million people at a density of 7,978 persons per sq. km.; comprising 3 Municipal Corporations; 38 Municipalities and 22 Panchayat Samities.
The uniqueness of the methodology is to achieve these goals through understanding the vision behind the evolution of the city and compare it with the present conditions. In order
to assess the current transportation scenario, various primary and secondary surveys along with
stake holders meeting and consultations were conducted. Review of previously done studies was
also undertaken.
GOALS • Congestion Mitigation
• Safety and Security
• Improved Air Quality
• Improved Quality of Life
• Improved Opportunities for Economic Development
VISION Seamless inter-modal transfer and single travel experience to the commuter by connecting various transportation modes including non-motorized transport in a safe, comfortable, secure and timely manner. To evolve an integrated transportation system that contributes to the city’s productivity and improves the communities’ quality of life with minimal environmental impact.
COMPREHENSIVE MOBILITY PLAN FOR KMA ii EXECUTIVE SUMMARY – BACK TO BASICS
BACKGROUND
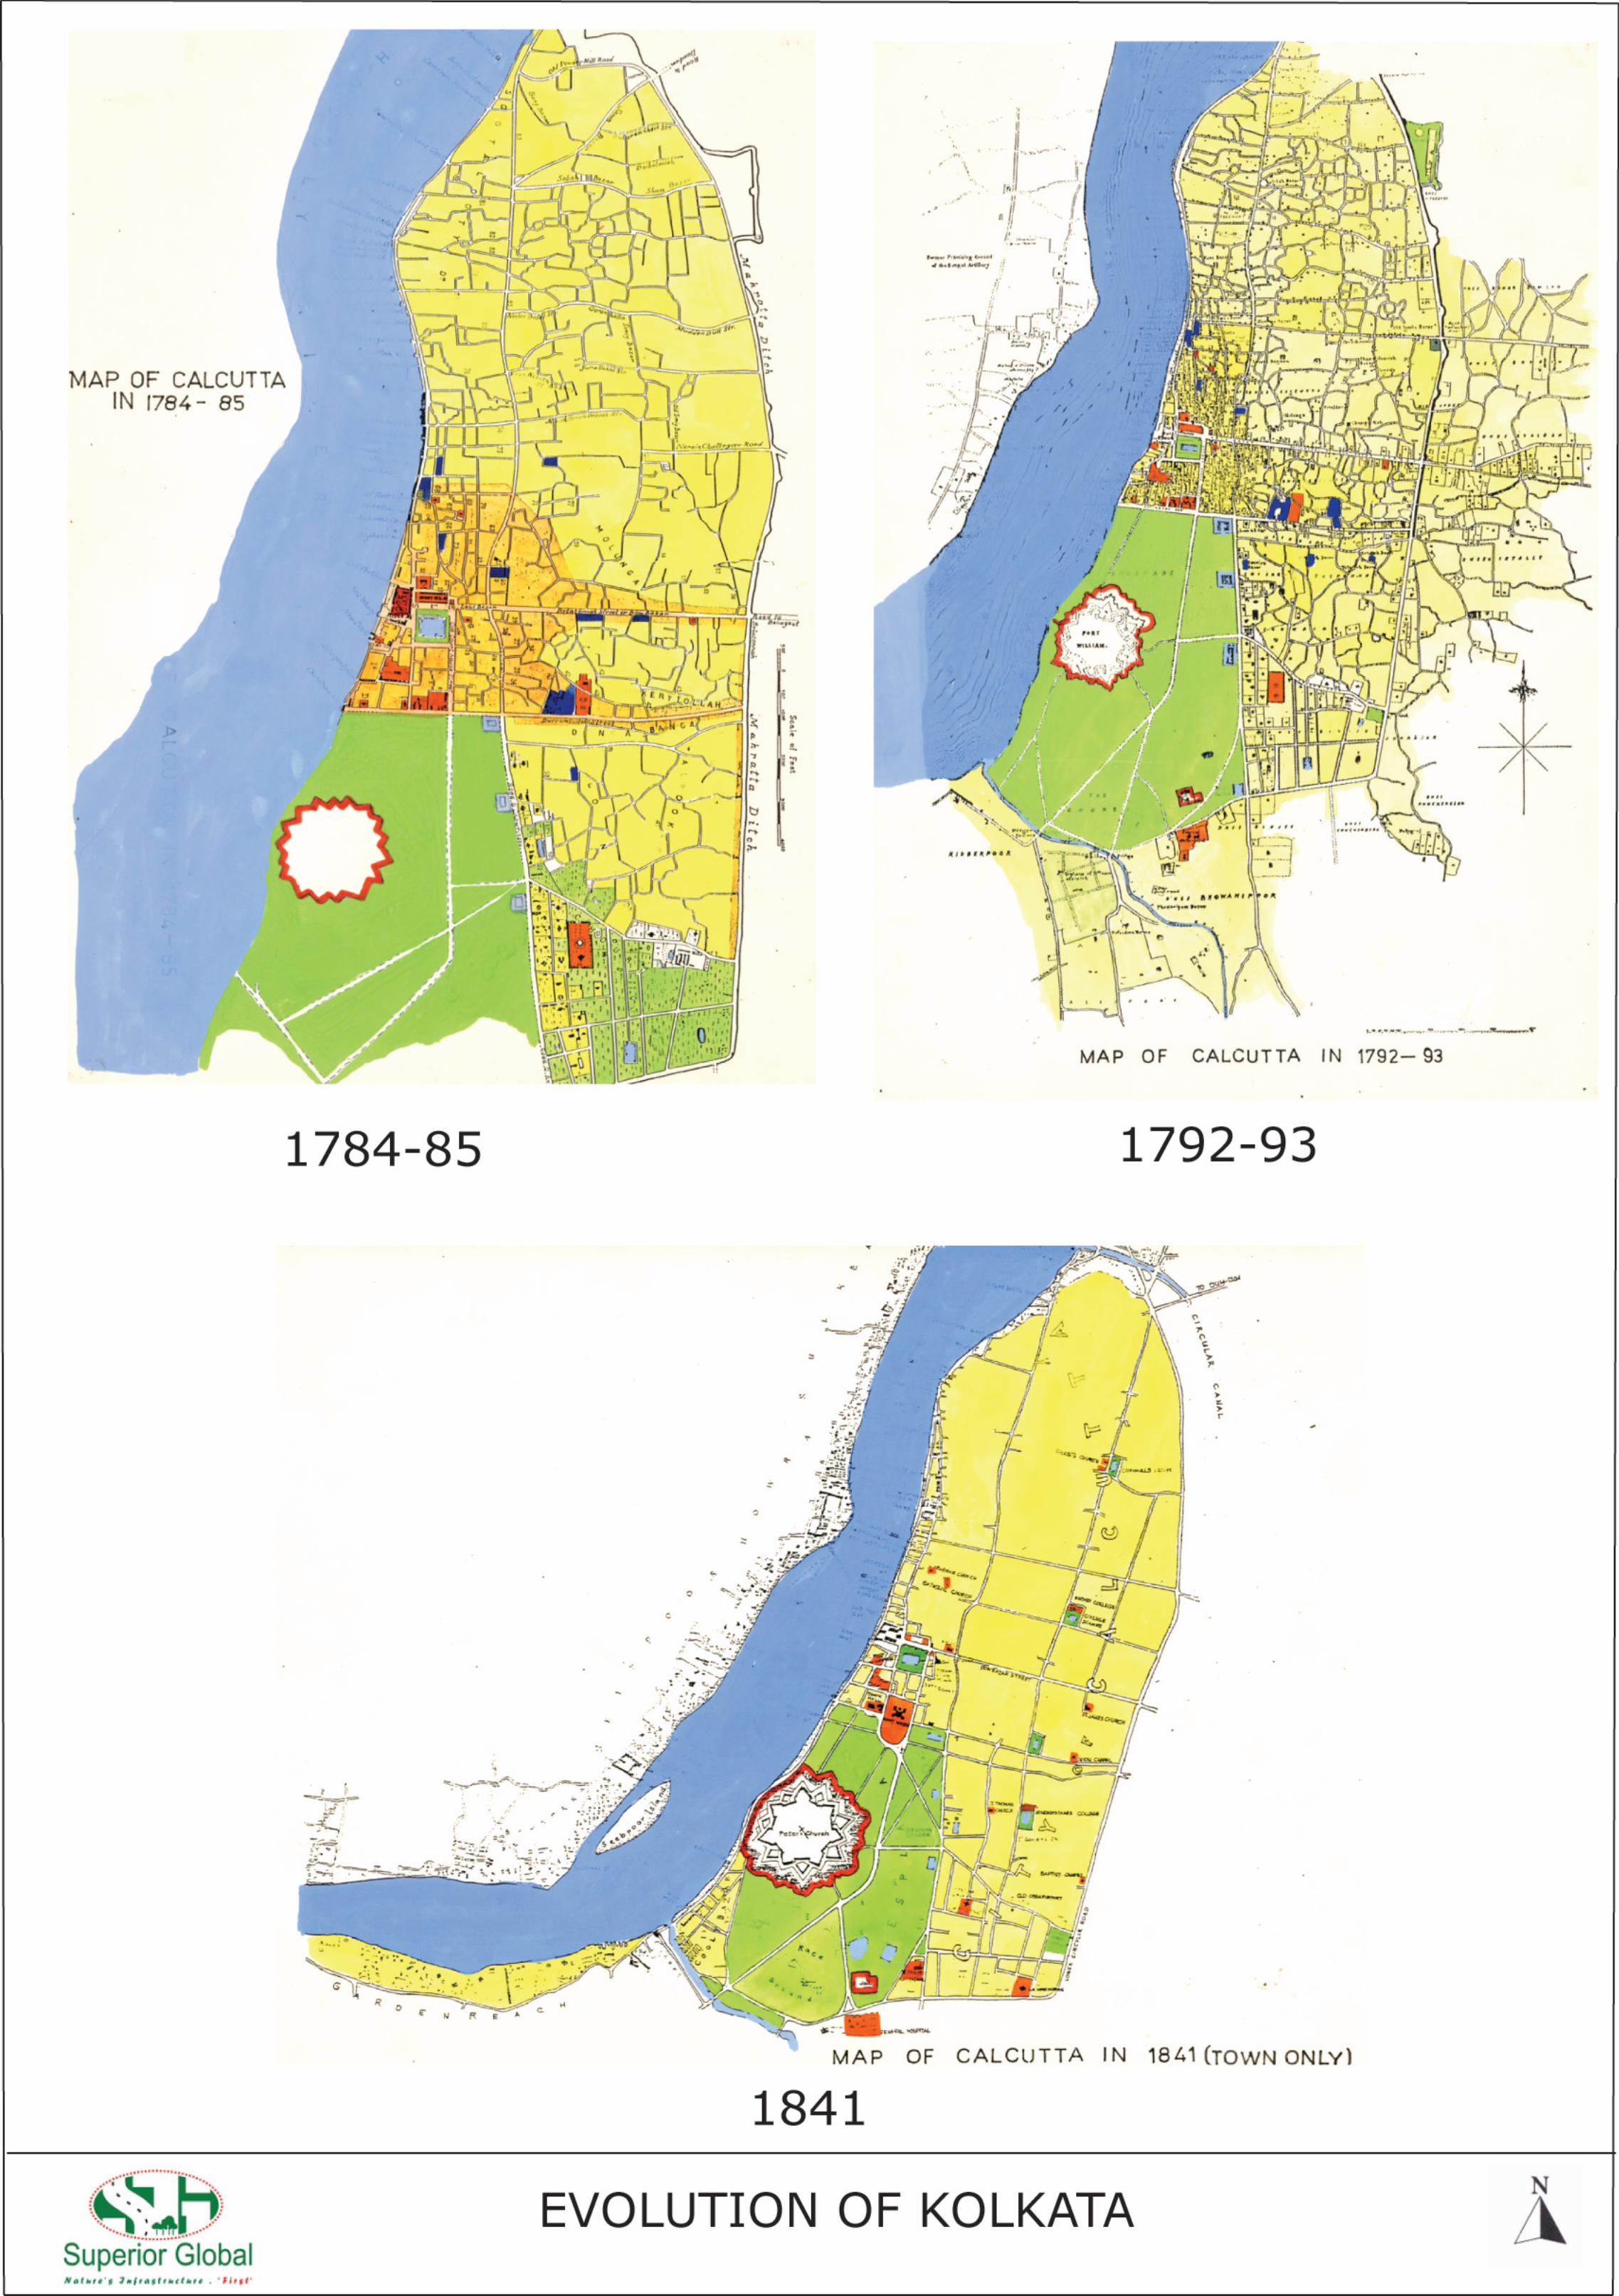
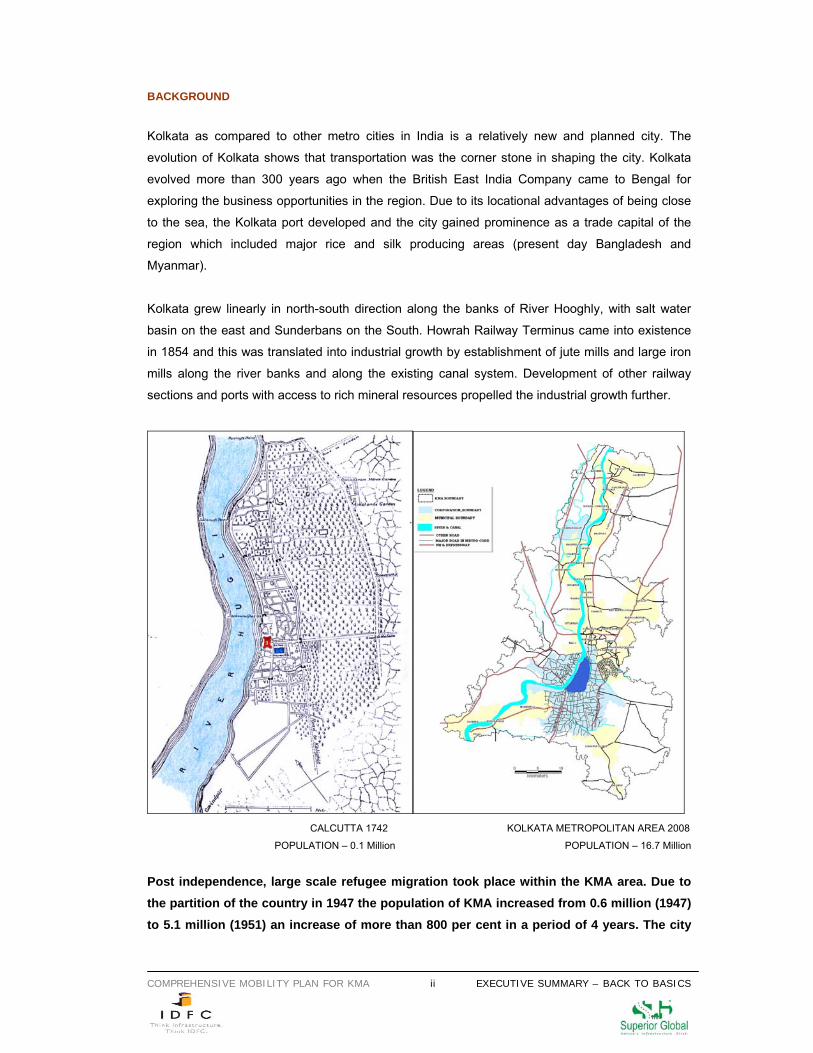
Kolkata as compared to other metro cities in India is a relatively new and planned city. The
evolution of Kolkata shows that transportation was the corner stone in shaping the city. Kolkata
evolved more than 300 years ago when the British East India Company came to Bengal for
exploring the business opportunities in the region. Due to its locational advantages of being close
to the sea, the Kolkata port developed and the city gained prominence as a trade capital of the
region which included major rice and silk producing areas (present day Bangladesh and
Myanmar).
Kolkata grew linearly in north-south direction along the banks of River Hooghly, with salt water
basin on the east and Sunderbans on the South. Howrah Railway Terminus came into existence
in 1854 and this was translated into industrial growth by establishment of jute mills and large iron
mills along the river banks and along the existing canal system. Development of other railway
sections and ports with access to rich mineral resources propelled the industrial growth further.
CALCUTTA 1742 KOLKATA METROPOLITAN AREA 2008
POPULATION – 0.1 Million POPULATION – 16.7 Million
Post independence, large scale refugee migration took place within the KMA area. Due to the partition of the country in 1947 the population of KMA increased from 0.6 million (1947) to 5.1 million (1951) an increase of more than 800 per cent in a period of 4 years. The city
COMPREHENSIVE MOBILITY PLAN FOR KMA iii EXECUTIVE SUMMARY – BACK TO BASICS
has not recovered from that unplanned increase till today. The Bangladesh war in 1971 put
added pressure on the already over-stressed capital starved infrastructure. EXISTING CONDITION
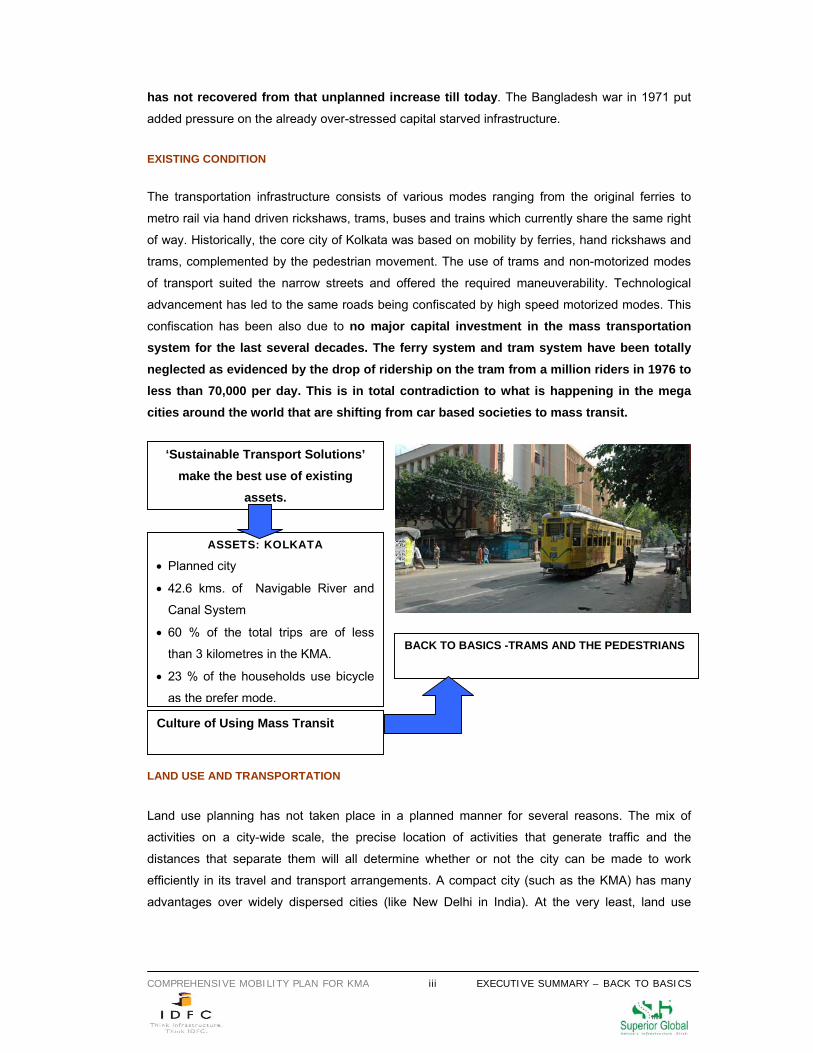
The transportation infrastructure consists of various modes ranging from the original ferries to
metro rail via hand driven rickshaws, trams, buses and trains which currently share the same right
of way. Historically, the core city of Kolkata was based on mobility by ferries, hand rickshaws and
trams, complemented by the pedestrian movement. The use of trams and non-motorized modes
of transport suited the narrow streets and offered the required maneuverability. Technological
advancement has led to the same roads being confiscated by high speed motorized modes. This
confiscation has been also due to no major capital investment in the mass transportation system for the last several decades. The ferry system and tram system have been totally neglected as evidenced by the drop of ridership on the tram from a million riders in 1976 to less than 70,000 per day. This is in total contradiction to what is happening in the mega cities around the world that are shifting from car based societies to mass transit.
LAND USE AND TRANSPORTATION
Land use planning has not taken place in a planned manner for several reasons. The mix of
activities on a city-wide scale, the precise location of activities that generate traffic and the
distances that separate them will all determine whether or not the city can be made to work
efficiently in its travel and transport arrangements. A compact city (such as the KMA) has many
advantages over widely dispersed cities (like New Delhi in India). At the very least, land use
ASSETS: KOLKATA
• Planned city
• 42.6 kms. of Navigable River and
Canal System
• 60 % of the total trips are of less
than 3 kilometres in the KMA.
• 23 % of the households use bicycle
as the prefer mode.
‘Sustainable Transport Solutions’ make the best use of existing
assets.
BACK TO BASICS -TRAMS AND THE PEDESTRIANS
Culture of Using Mass Transit
COMPREHENSIVE MOBILITY PLAN FOR KMA iv EXECUTIVE SUMMARY – BACK TO BASICS
planning has to capitalize on these advantages by resisting urban sprawl and by maintaining
wetlands , green areas, water bodies and maximizing use of existing facilities.
The standard guidelines for determining transportation improvement projects will be difficult to
adhere to in Kolkata because of the nature of the city as highlighted in the report. During the
evolution of the city the founding fathers had planned the city based on river / canal as the main
transport system which was later augmented by the rail based tram system. The current nature of
determining the need for transportation based on UDPFI guidelines projects is difficult to apply
(which proposes a minimum of 15-18% of land use for transportation) where as Kolkata has a
mere 6% of land under transport use, with a whole gamut of modes from hand pulled carts to
tractor trailer trucks sharing the same carriageway.
The transportation movement within the study area is determined by various activities. The traffic
and transportation department struggles to reduce congestion during peak hours by mandating
the freight movement of trucks into / out of the city during the off peak hours of the night to early
morning. This greatly helps in reducing the congestion during the AM and PM peaks when the
office / school commuters are of paramount importance. Any change to these timings will gridlock
the existing congested transportation network which has a ‘D’ level of service.
Further the trucks entering the study area, especially the metro core in the night, have limited
turnaround time. These results in the trucks being parked on the streets, serviced by hand pulled
carts for loading and other services being provided to the crew. This creates activities around the
parked trucks further reducing the carriage width and further reducing the number of vehicles that
can potentially use the thorough fare.
The Plan recommends new developments that will attract many people to be steered to points of
maximum public transport accessibility in form of transit oriented development. Public transport
facilities would be in form of metro (extended network), light rail transit (TRAM), circular rail,
suburban rail, buses and ferries. Where new developments are contemplated and TRAM/metro
lines are absent, the TRAM should be put in place first and ahead of the development. School
Special Trams have been proposed to provide safe and environment friendly mode of travel for
the children. This would also reduce the traffic congestions during the peak hours.
PLAN COMPONENTS
Corridor efficiencies, safer regional roadways, connectivity between modes, improved port access,
introducing Intelligent Transportation System (ITS) network, congestion management and high
capacity transit are important components of the Plan. The Plan intent of this report is to shift the modal spilt between private vehicles and pedestrian/mass transit from 20 - 80 to 10 - 90
COMPREHENSIVE MOBILITY PLAN FOR KMA v EXECUTIVE SUMMARY – BACK TO BASICS
per cent, by establishing an interlinked network of mass transit in the city. This would be
done through extension of the existing north south metro corridor and supplementing it through
proposed east west corridor. The improvement of the existing level of service of the road network
as well as to provide faster and more comfortable ride in sync with the heritage character of the
city, elevated Light Rail Transit System is proposed. The proposal for the ring road would reduce
the stress on the linear network of the city and would also supplement the proposed north-south
and east-west corridor. All new metro stations should be designed to handle 8 to 10 coaches of
metro train. Study should be carried out to link the airport with the East -West corridor. This would
also give new direction to the city expansion.
Proposal for capacity and technical augmentation of the port and relocation of storage depots from
the city core to the periphery of the city, the need for segregation of freight and passenger
movement has been supplemented by the proposed outer ring road and augmentation of highway
corridors. It has been proposed to establish the missing links of circular railway and suburban
railways and for providing increased comfort level in passenger trains, special vendor trains in
morning and evening slots have been proposed.
To improve the speed of vehicular movement, road infrastructure improvement and traffic
segregation has been proposed. The vehicular density on the roads would be reduced by high
occupancy vehicles plying on ring road and major arterial roads.
Considering that all of these proposals need to be demand-driven, more than 200 potential nodes have been identified out of which approximately 40 would have the potential to be developed as Transit Oriented Development with high FAR and change of surrounding land use, high density nodes are the only sustainable city model.
The performance of transportation system affects public policy concerns air quality, social equity,
land use, urban growth, economic development, safety, and security. The Comprehensive Mobility Plan (CMP) for the Kolkata Metropolitan Area recognizes and reinforces the critical
links between transportation and other societal goals.
This plan does not attempt to merely build our way out of congestion, but adopts strategies to
manage growth and strategically invest for better movement of people and goods. Using current
information and data, the CMP identifies combined need of over Rs. 10,420 crore of transportation
investments, from funded and existing assets. The concept will work towards giving the city back to the people. This investment over the next 18 years will build the city’s economy, meet citizen’s social and recreational needs, and enhance personal health and safety. The
transportation infrastructure investments would be supported by the Central and State
governments and private investors (PPP model).
COMPREHENSIVE MOBILITY PLAN FOR KMA vi EXECUTIVE SUMMARY – BACK TO BASICS
The CMP increases the mobility of people and freight which is fundamental to the functioning of
the city by;
• Facilitating freight storage and movement by building warehouse facilities on the outskirts of the city
• Establishing east west road links and reinforcing north south links by construction of bypasses and flyovers
• Synchronizing inter modal transfers
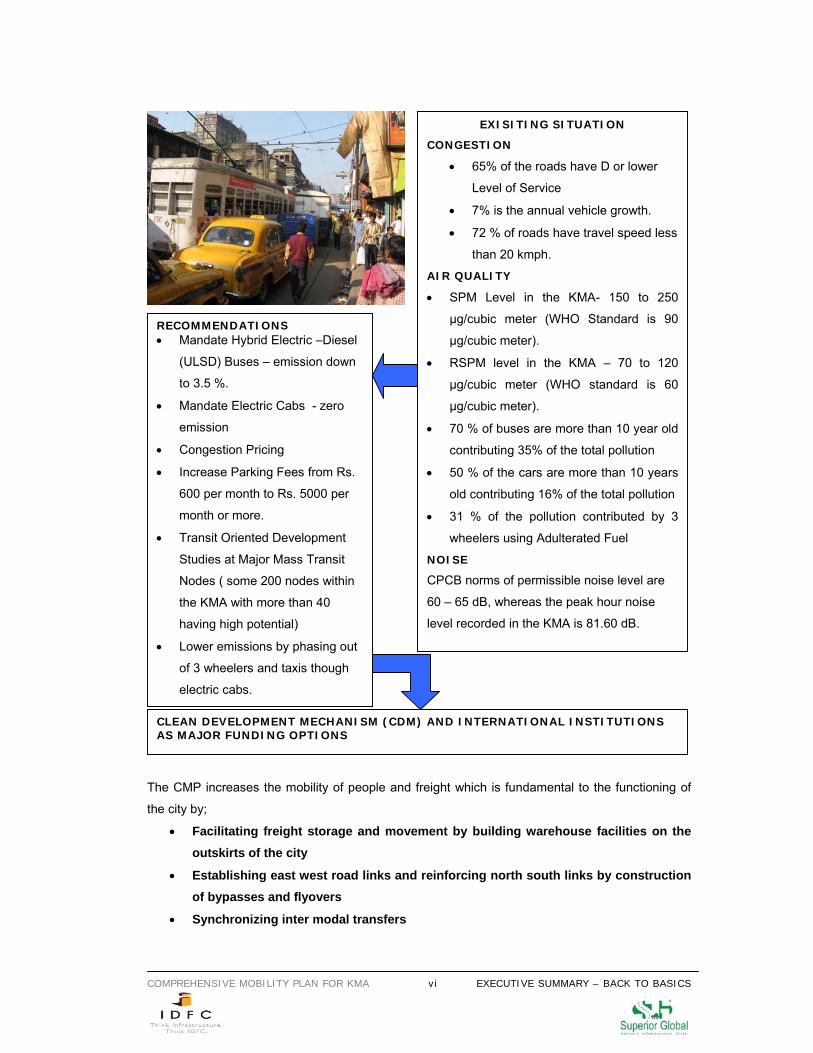
EXISITING SITUATION
CONGESTION
• 65% of the roads have D or lower
Level of Service
• 7% is the annual vehicle growth.
• 72 % of roads have travel speed less
than 20 kmph.
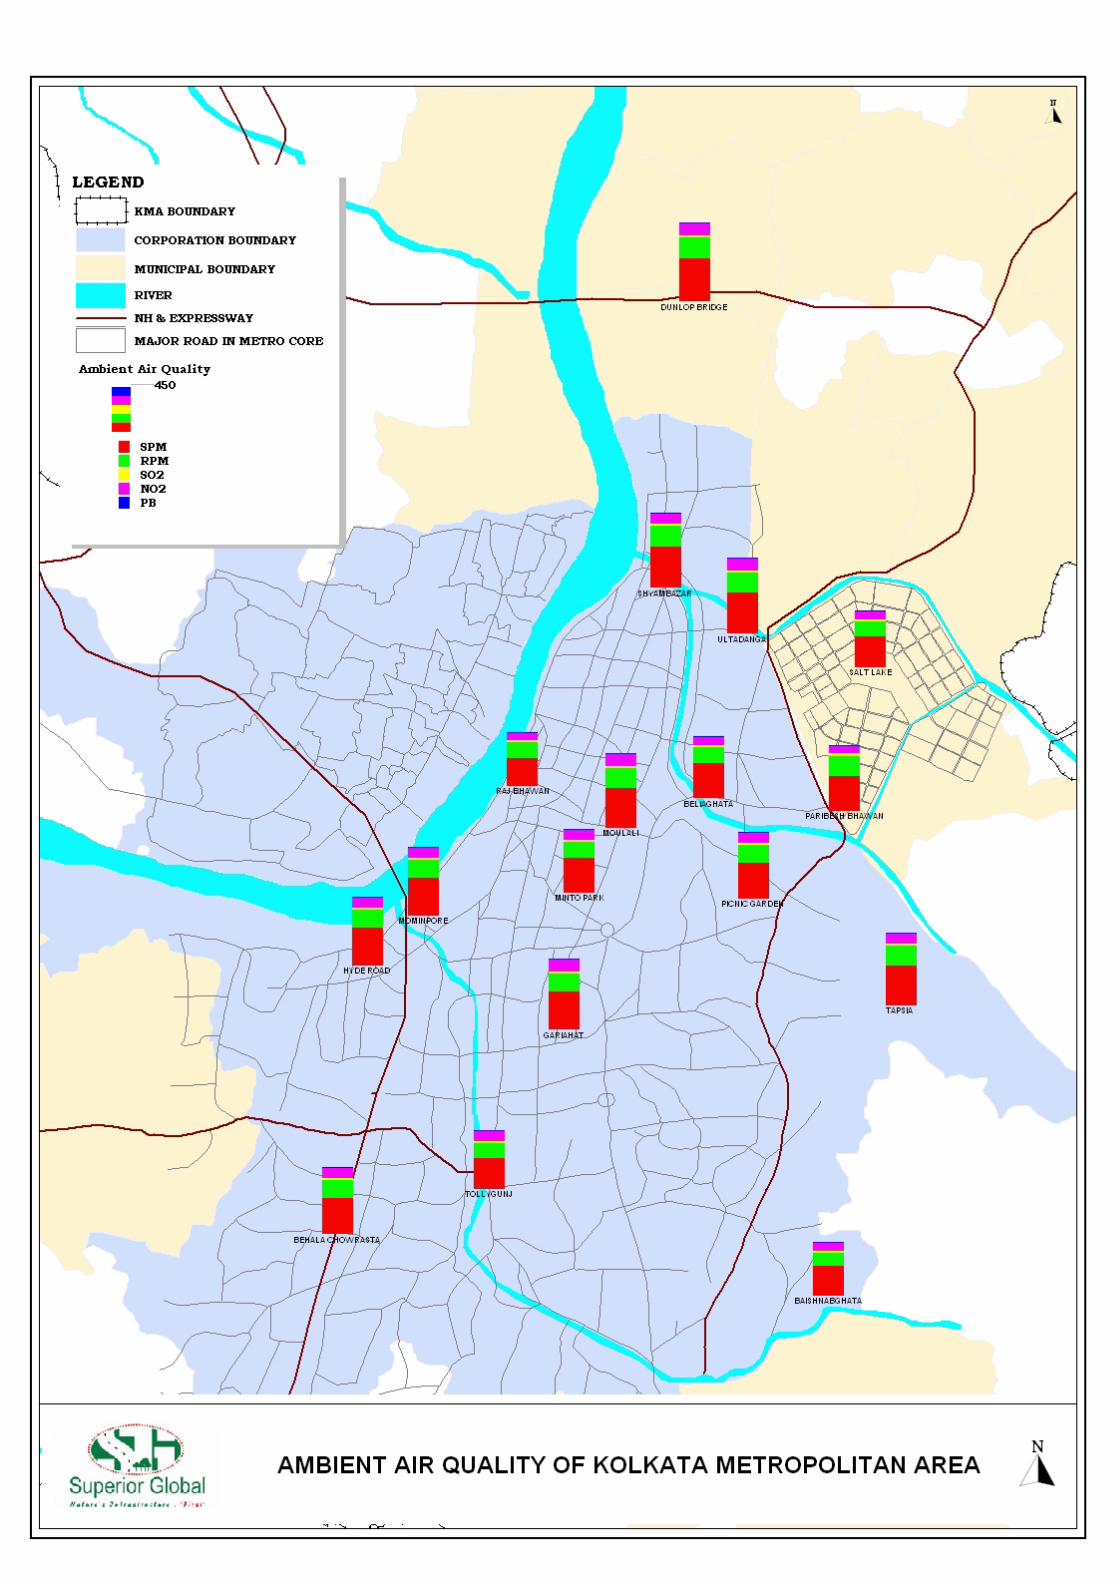
AIR QUALITY
• SPM Level in the KMA- 150 to 250
μg/cubic meter (WHO Standard is 90
μg/cubic meter).
• RSPM level in the KMA – 70 to 120
μg/cubic meter (WHO standard is 60
μg/cubic meter).
• 70 % of buses are more than 10 year old
contributing 35% of the total pollution
• 50 % of the cars are more than 10 years
old contributing 16% of the total pollution
• 31 % of the pollution contributed by 3
wheelers using Adulterated Fuel
NOISE
CPCB norms of permissible noise level are
60 – 65 dB, whereas the peak hour noise
level recorded in the KMA is 81.60 dB.
RECOMMENDATIONS • Mandate Hybrid Electric –Diesel
(ULSD) Buses – emission down
to 3.5 %.
• Mandate Electric Cabs - zero
emission
• Congestion Pricing
• Increase Parking Fees from Rs.
600 per month to Rs. 5000 per
month or more.
• Transit Oriented Development
Studies at Major Mass Transit
Nodes ( some 200 nodes within
the KMA with more than 40
having high potential)
• Lower emissions by phasing out
of 3 wheelers and taxis though
electric cabs.
CLEAN DEVELOPMENT MECHANISM (CDM) AND INTERNATIONAL INSTITUTIONS AS MAJOR FUNDING OPTIONS
COMPREHENSIVE MOBILITY PLAN FOR KMA vii EXECUTIVE SUMMARY – BACK TO BASICS
• Allocating movement corridors for each mode based on traffic volume.
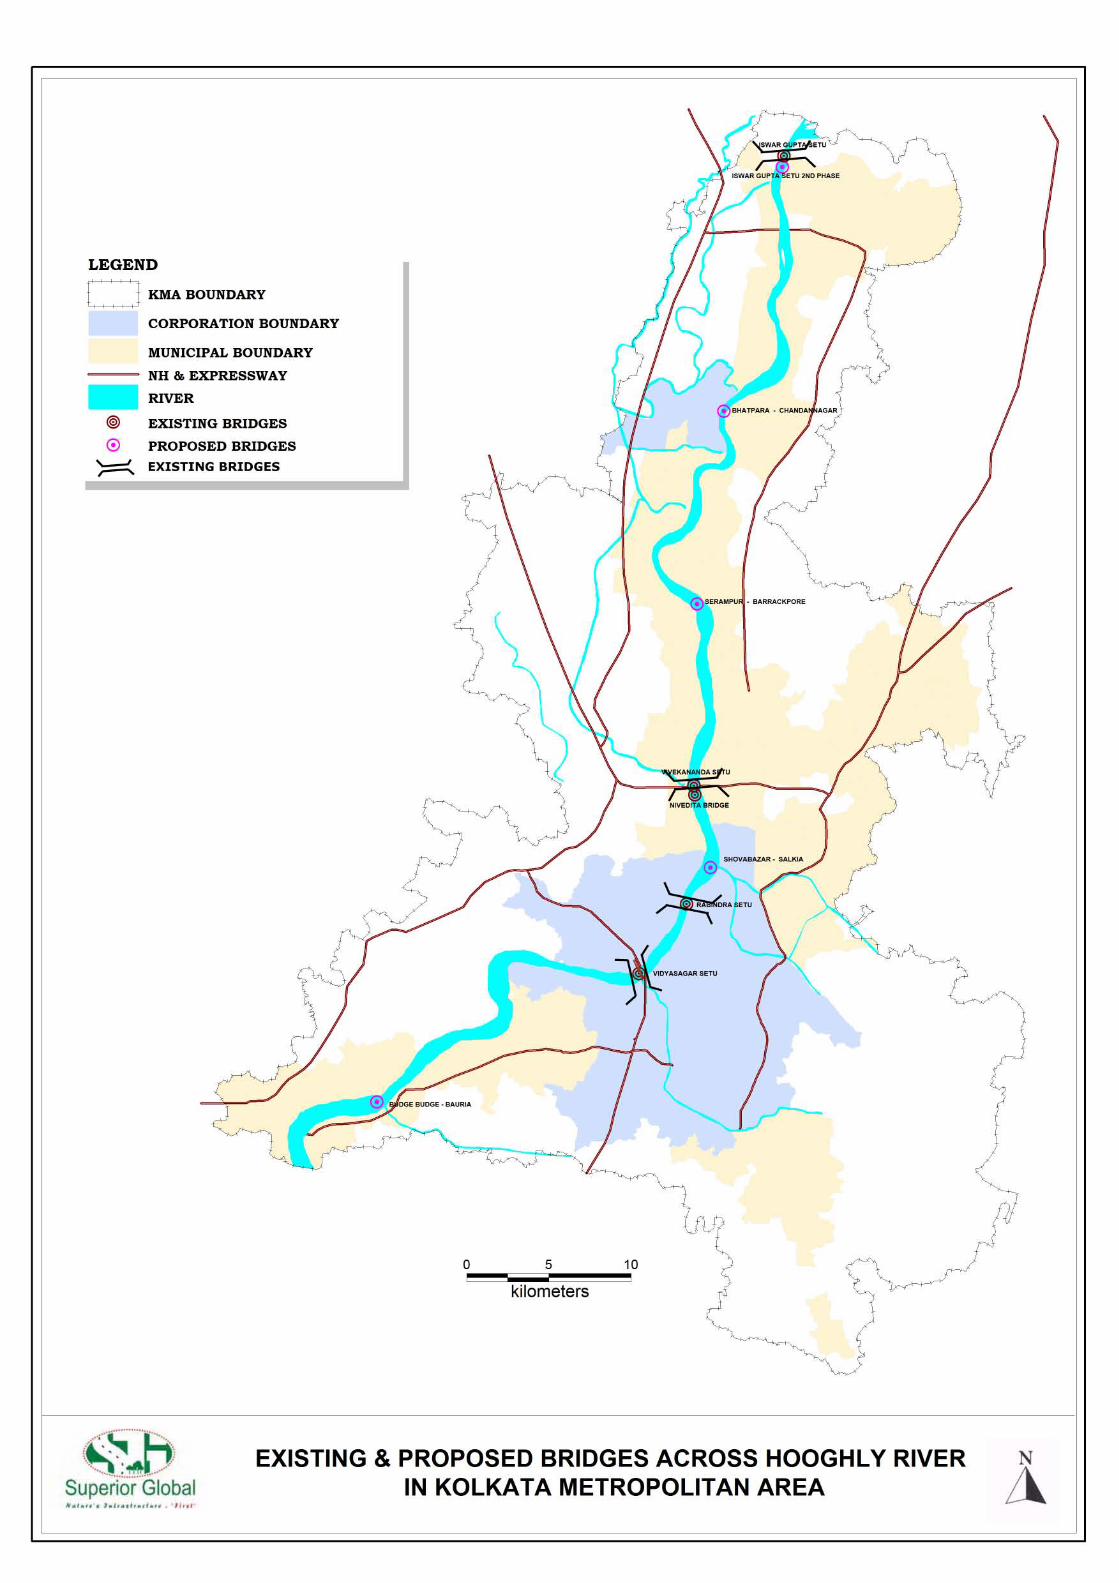
• Increasing trans-river connectivity by construction of new bridges with appropriate spatial distribution.
• Mandating all transportation infrastructures to universally accessible in accordance to Indian Disability Act, 1995.
The current emissions are 378 tons/day. The projected emission in 2025 will be 240 per cent more
than the present day emission i.e. 749 tons/day and reduction after implementing the CMP
recommendations will be of the scale of 159 tons/day. PROPOSED MAJOR TRANSPORTATION STUDIES
60 per cent of the total trips generated in the KMA covering less than 3 km. distance, people
prefer to walk or use bicycles for commuting. Thus, it is the social responsibility of the State to
cater to the masses and focus on facilitating pedestrian and bicycle movement and improvement
of the mass transit systems. Detailed studies for achieving this objective would be as follows:
o ‘Transit Oriented Development’ at major Inter Modal Transfer Points
o Study on Integrating Mass Transit Systems including merging of existing Tram System and
Circular Rail System with emphasis on dedicated RoW to increase throughput efficiency.
o Study on ‘Integration of Mass Transit System with Howrah Station and Sealdah Station’
This study would be in conjunction with Ministry of Railways project for renovating Howrah
Station and its precincts for achieving a World-Class Station1 distinction.
1 Howrah station is one of the nineteen stations that have been selected for converting into World Class Stations by the Ministry of Railways.
• 48 new Bus Terminals
• 16 new Freight Terminals
• 320 kilometers of new roads
• 380 kilometers of road widening
• 13 new off-street parking
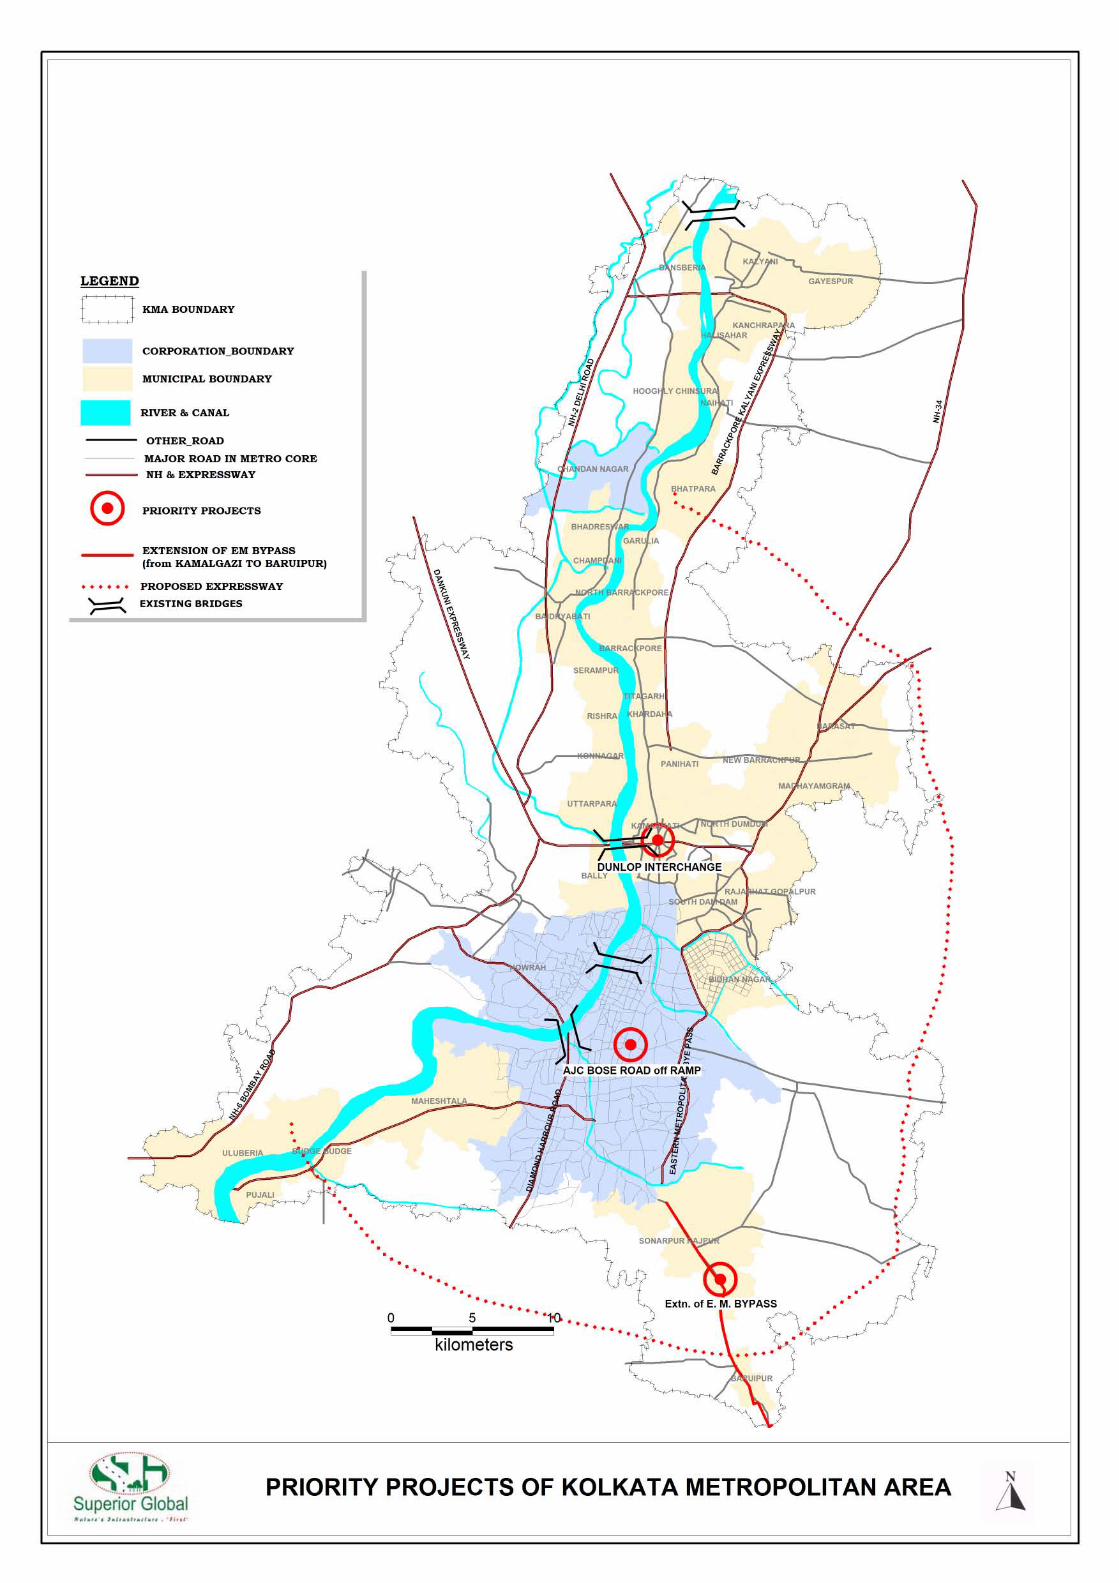
MAJOR INFRASTRUCTURE PROPOSALS
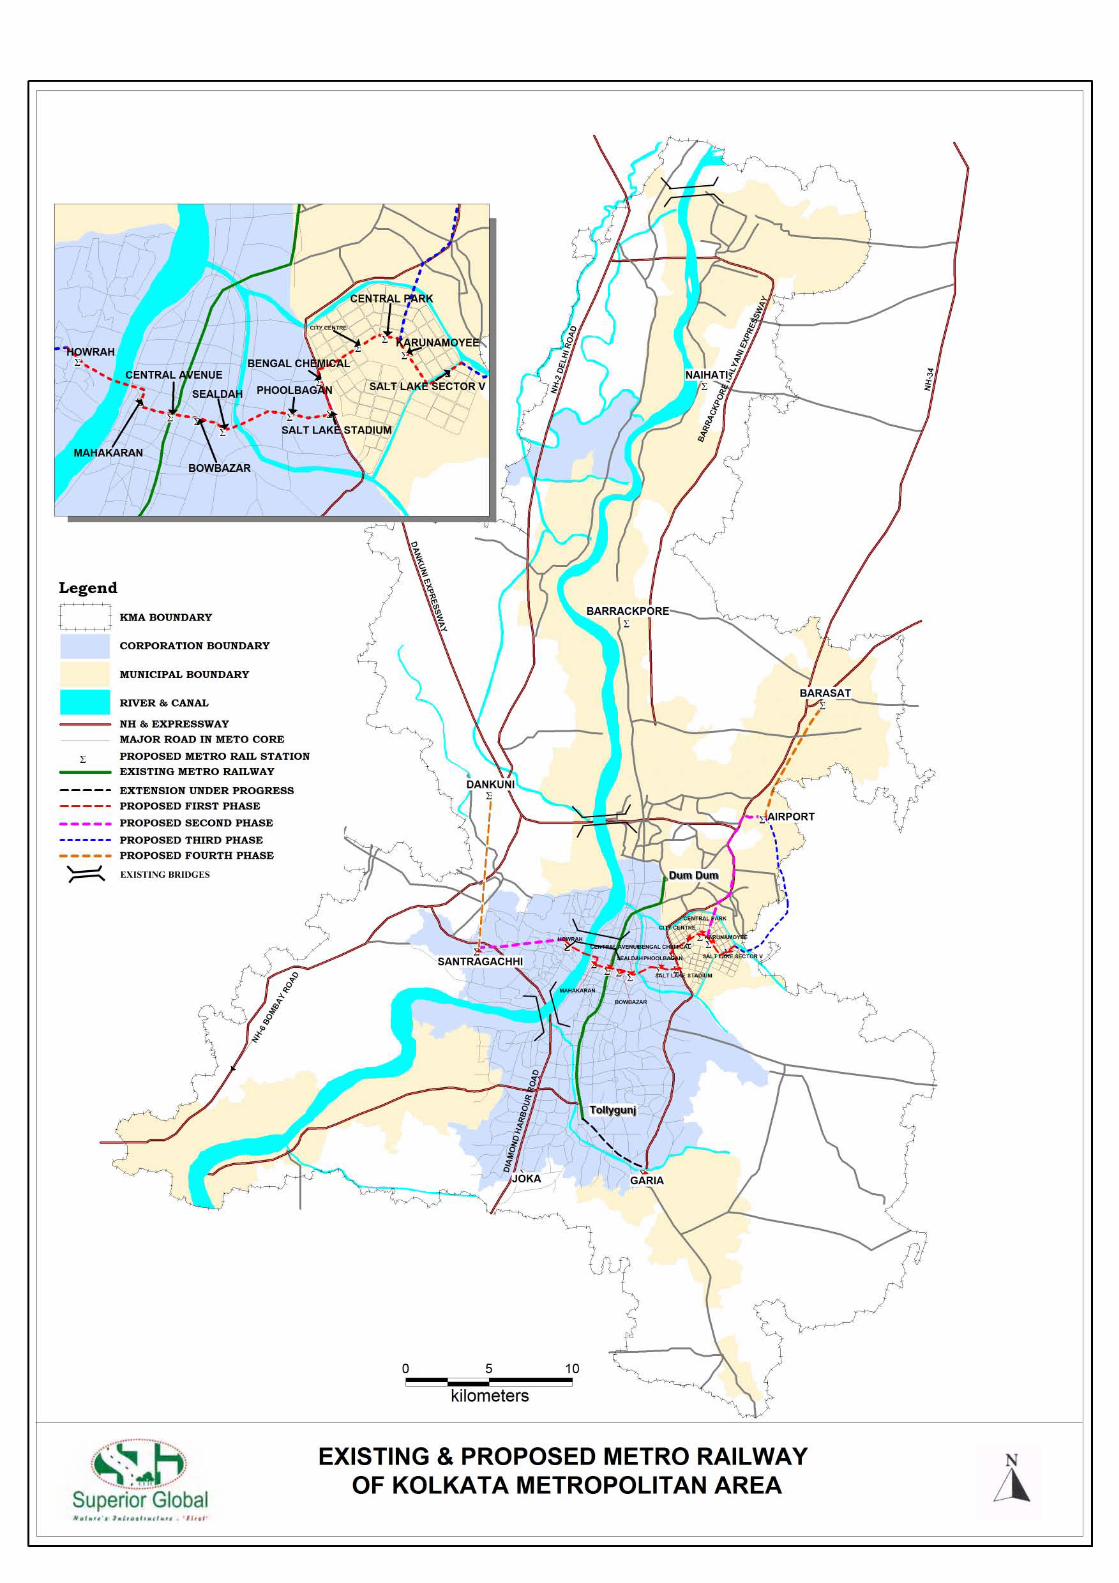
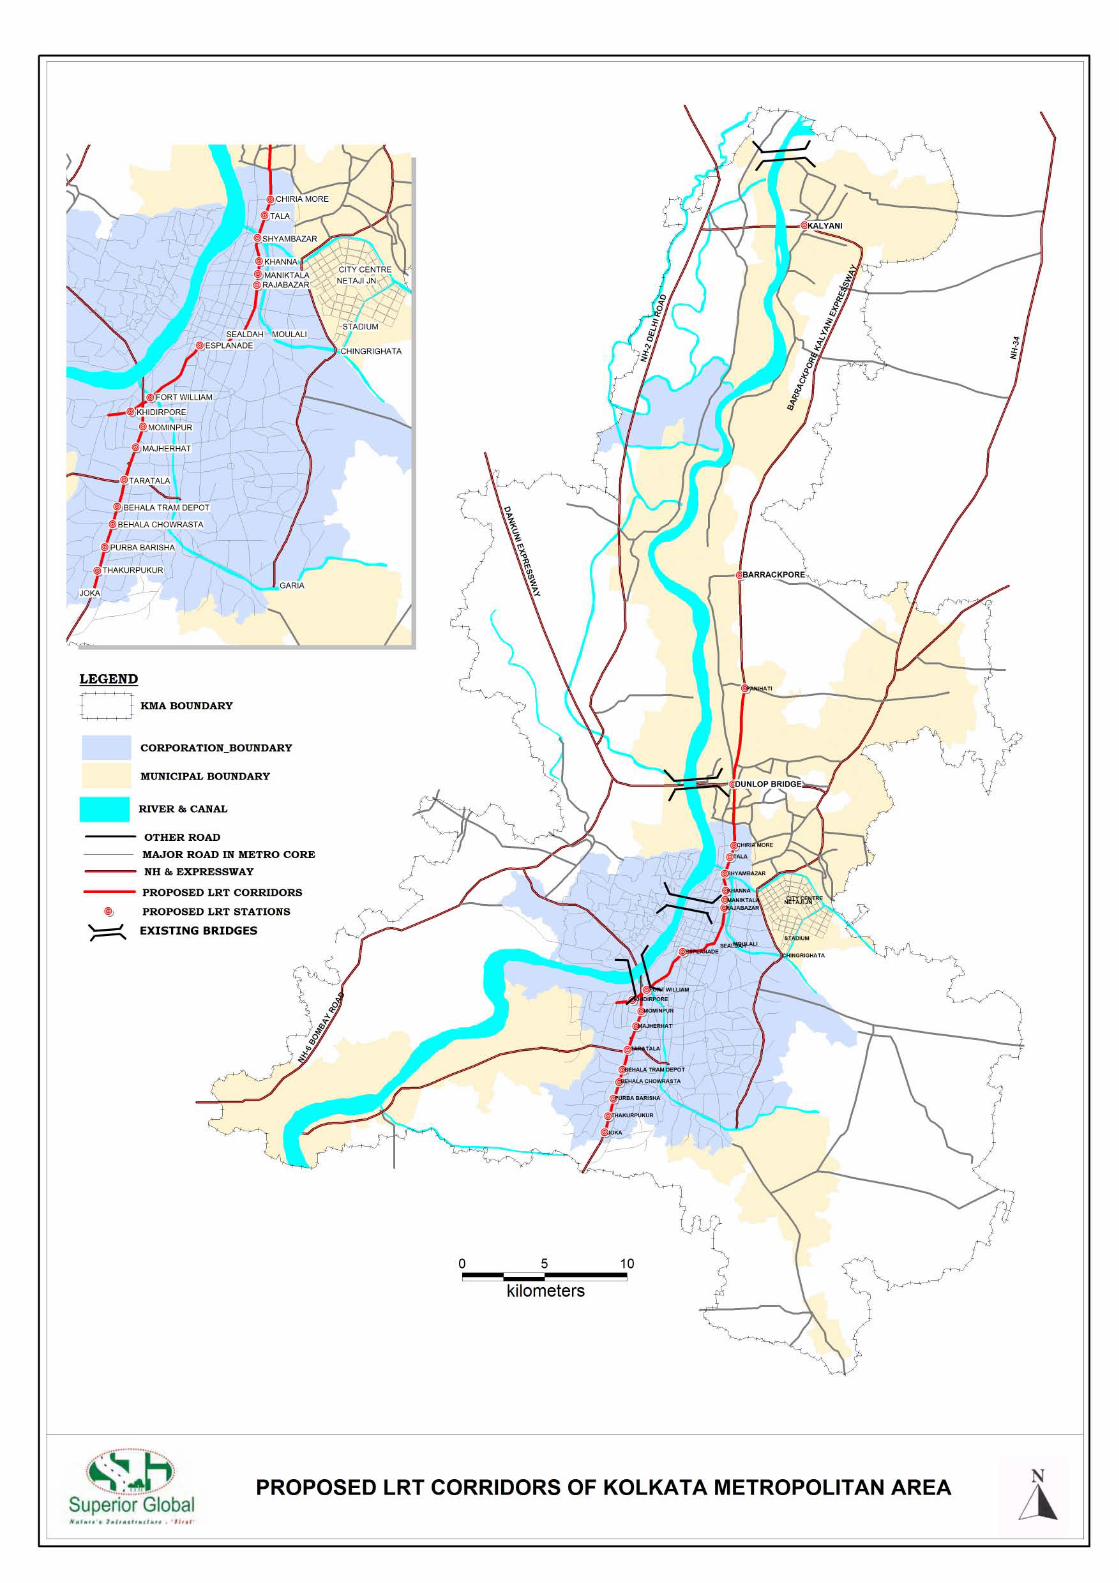
• Extension of proposed East West metro corridor from Howrah to Dankuni via
Santragachi and Salt Lake to Barasat via Airport using two alignments one through the
VIP Road and one through Rajarhaat
• Extension of North South metro corridor from Tollygunj to Thakurpukur
• Elevated pedestrian corridor connecting Howrah station, Sealdah station and B. B. D.
Bagh
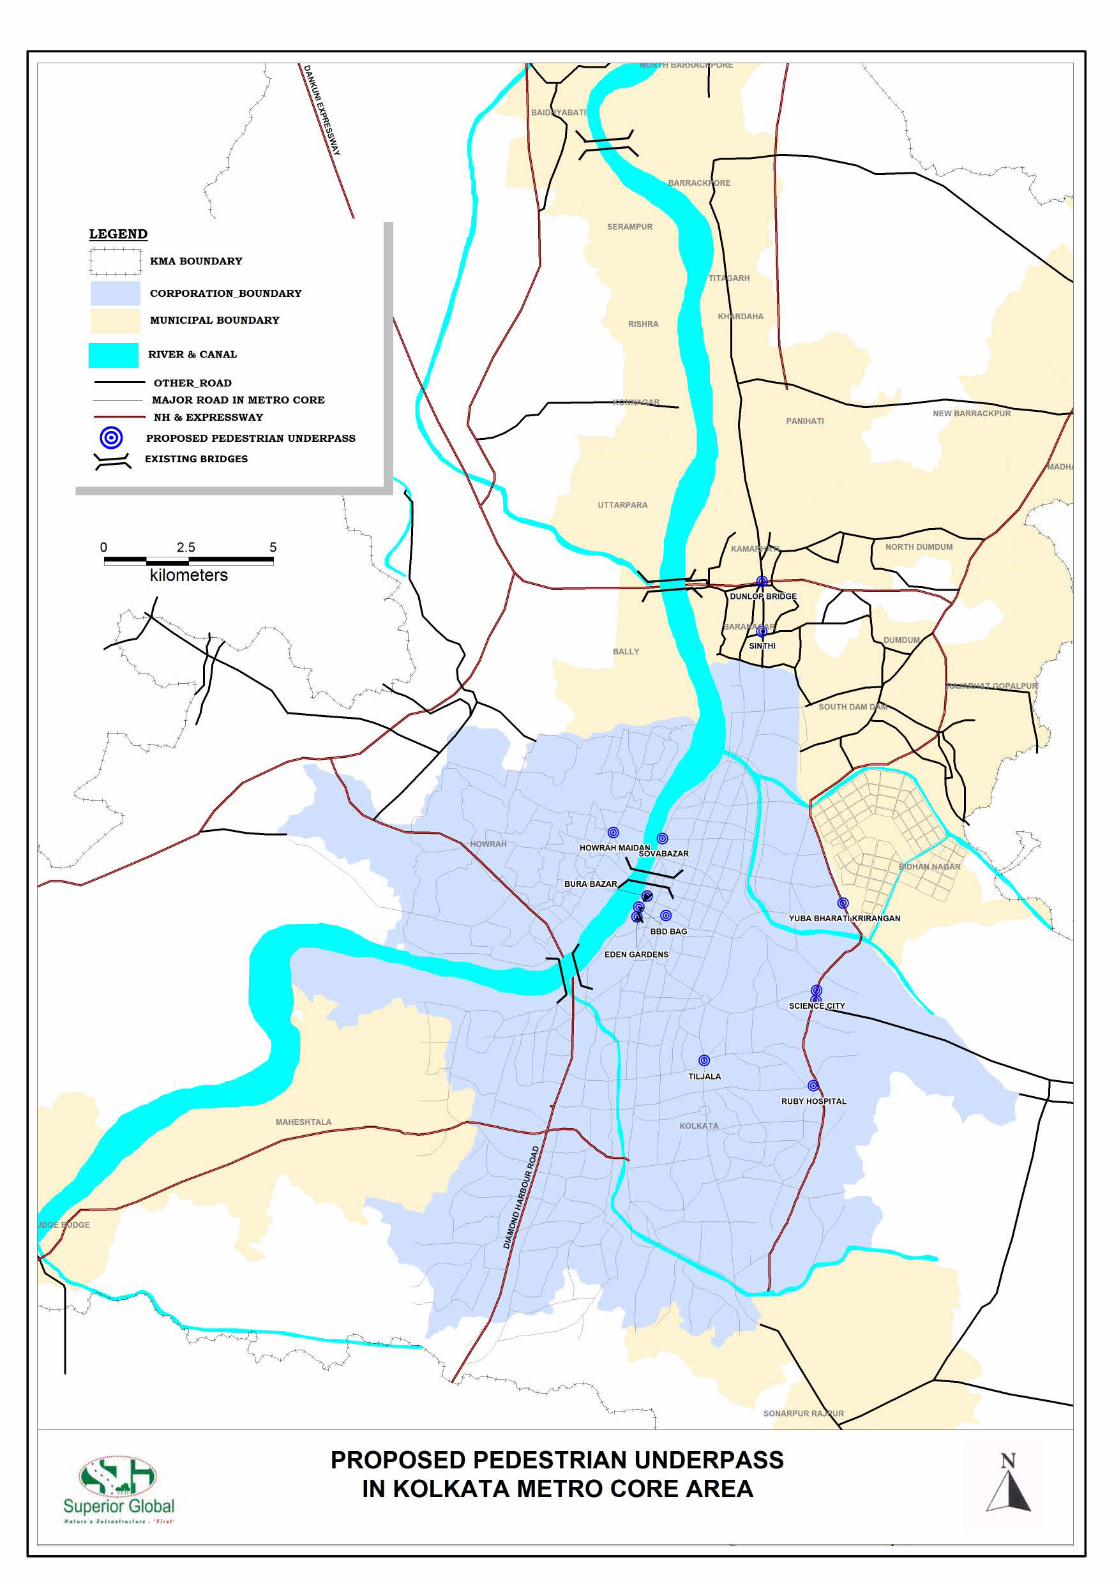
• 16 Pedestrian underpass and walkways
• LRT system within Rajarhaat
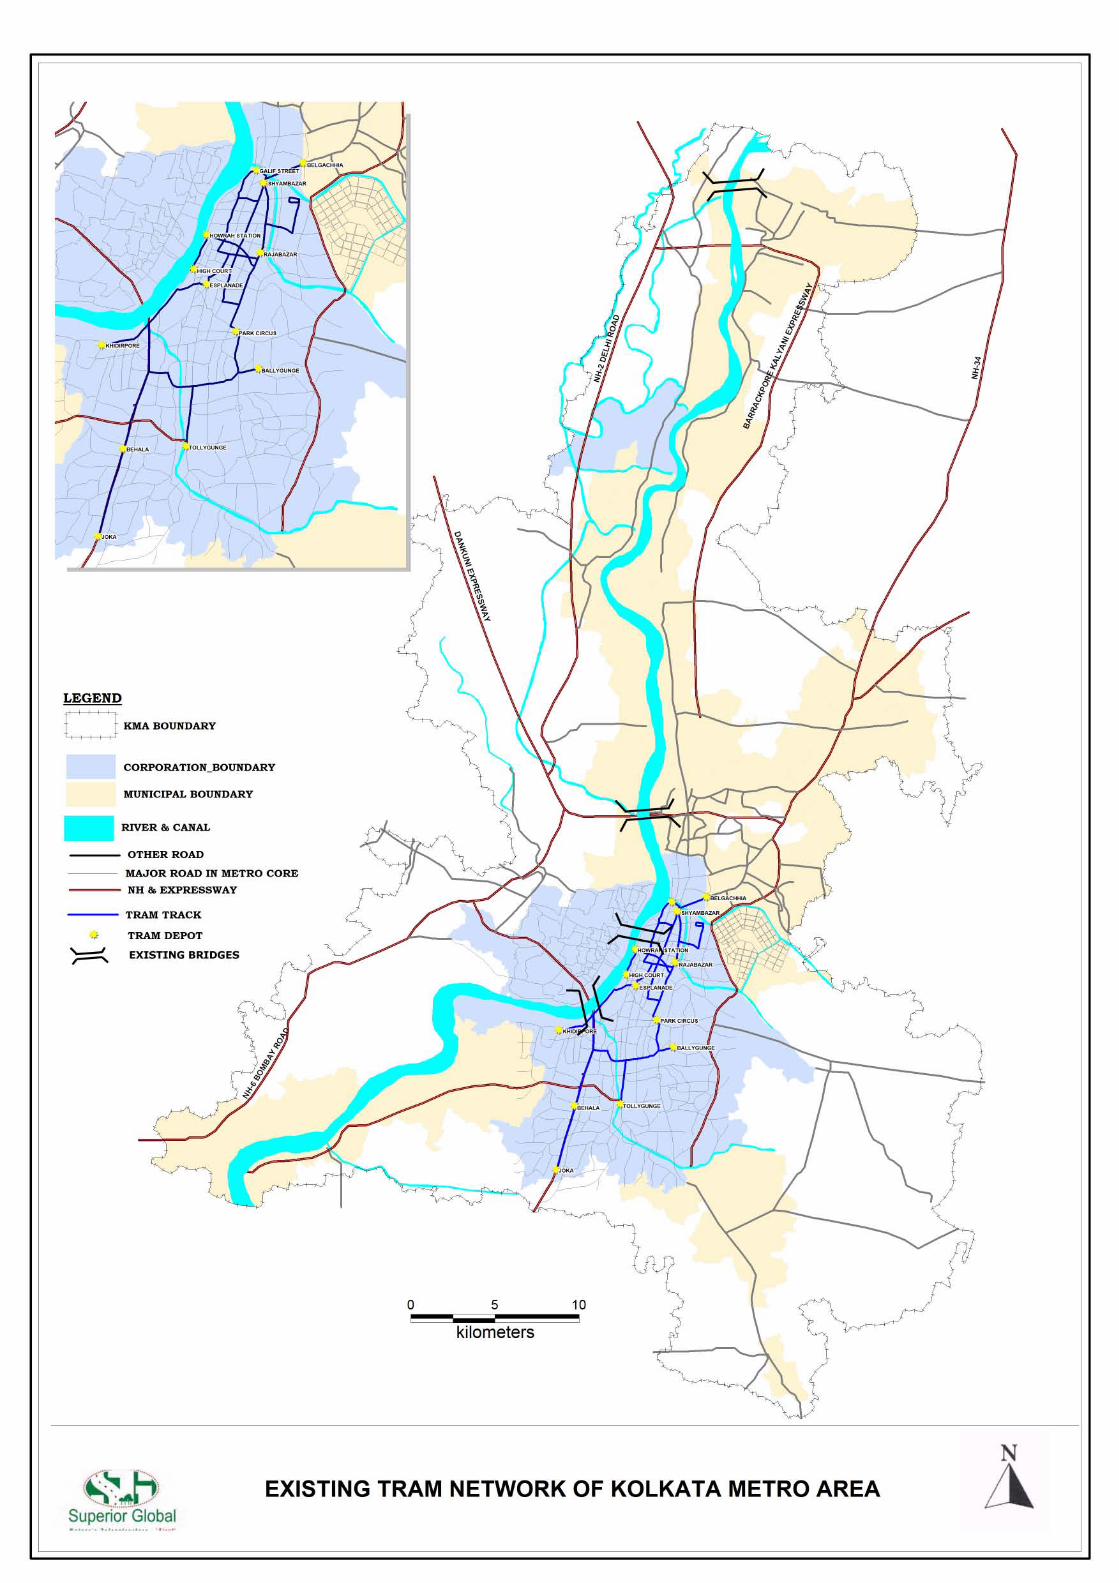
• 36 kilometers of new tram alignment
• Route rationalization of suburban railways
• 5 new transriver bridges over River Hooghly
• Mandating no car zone: New Market Area, Grand Street, B. B. D. Bag Area, Lalbazar Area, Ezra Street, Kalighat Temple
Road, Bowbazar Street
• 48 new Bus Terminals
• 16 new Freight Terminals
• 320 kilometers of new roads
• 380 kilometers of road widening
• 13 new off-street parking
COMPREHENSIVE MOBILITY PLAN FOR KMA viii EXECUTIVE SUMMARY – BACK TO BASICS
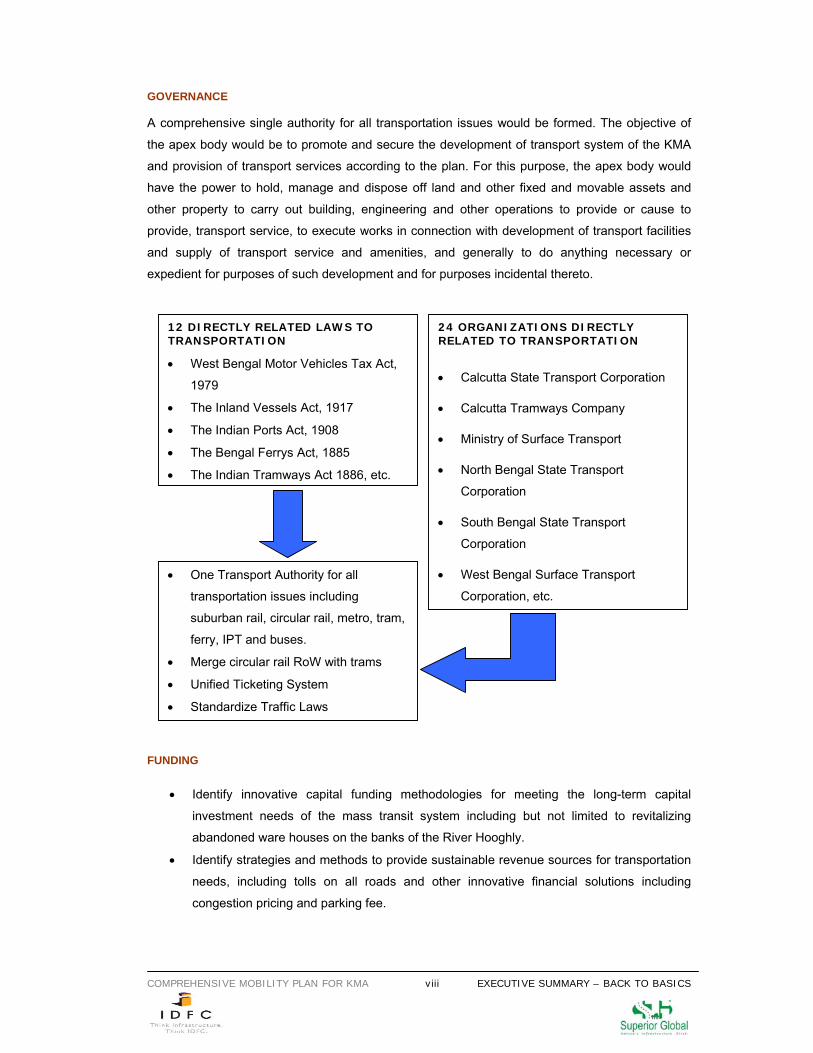
GOVERNANCE
A comprehensive single authority for all transportation issues would be formed. The objective of
the apex body would be to promote and secure the development of transport system of the KMA
and provision of transport services according to the plan. For this purpose, the apex body would
have the power to hold, manage and dispose off land and other fixed and movable assets and
other property to carry out building, engineering and other operations to provide or cause to
provide, transport service, to execute works in connection with development of transport facilities
and supply of transport service and amenities, and generally to do anything necessary or
expedient for purposes of such development and for purposes incidental thereto.
FUNDING
• Identify innovative capital funding methodologies for meeting the long-term capital
investment needs of the mass transit system including but not limited to revitalizing
abandoned ware houses on the banks of the River Hooghly.
• Identify strategies and methods to provide sustainable revenue sources for transportation
needs, including tolls on all roads and other innovative financial solutions including
congestion pricing and parking fee.
• One Transport Authority for all
transportation issues including
suburban rail, circular rail, metro, tram,
ferry, IPT and buses.
• Merge circular rail RoW with trams
• Unified Ticketing System
• Standardize Traffic Laws
12 DIRECTLY RELATED LAWS TO TRANSPORTATION
• West Bengal Motor Vehicles Tax Act,
1979
• The Inland Vessels Act, 1917
• The Indian Ports Act, 1908
• The Bengal Ferrys Act, 1885
• The Indian Tramways Act 1886, etc.
24 ORGANIZATIONS DIRECTLY RELATED TO TRANSPORTATION
• Calcutta State Transport Corporation
• Calcutta Tramways Company
• Ministry of Surface Transport
• North Bengal State Transport
Corporation
• South Bengal State Transport
Corporation
• West Bengal Surface Transport
Corporation, etc.
COMPREHENSIVE MOBILITY PLAN FOR KMA ix EXECUTIVE SUMMARY – BACK TO BASICS
• Develop a policy that defines the state’s role and level of investment in public
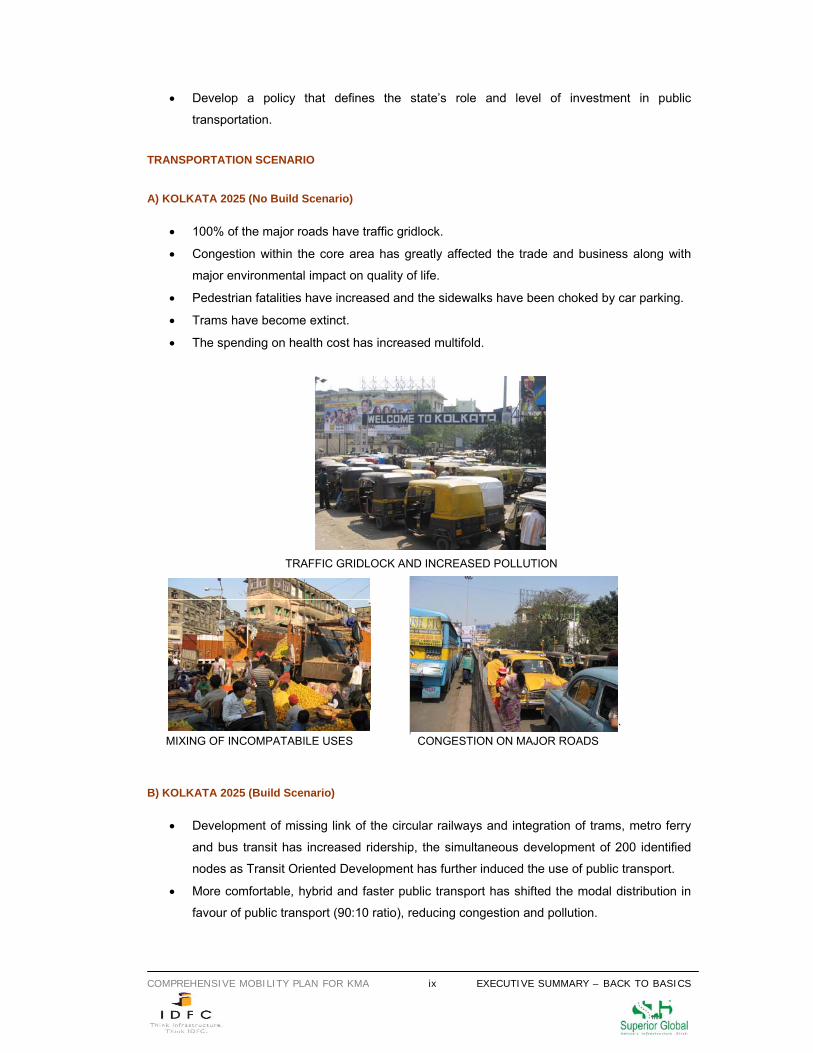
transportation. TRANSPORTATION SCENARIO A) KOLKATA 2025 (No Build Scenario)
• 100% of the major roads have traffic gridlock.
• Congestion within the core area has greatly affected the trade and business along with
major environmental impact on quality of life.
• Pedestrian fatalities have increased and the sidewalks have been choked by car parking.
• Trams have become extinct.
• The spending on health cost has increased multifold.
TRAFFIC GRIDLOCK AND INCREASED POLLUTION
` MIXING OF INCOMPATABILE USES CONGESTION ON MAJOR ROADS B) KOLKATA 2025 (Build Scenario)
• Development of missing link of the circular railways and integration of trams, metro ferry
and bus transit has increased ridership, the simultaneous development of 200 identified
nodes as Transit Oriented Development has further induced the use of public transport.
• More comfortable, hybrid and faster public transport has shifted the modal distribution in
favour of public transport (90:10 ratio), reducing congestion and pollution.
COMPREHENSIVE MOBILITY PLAN FOR KMA x EXECUTIVE SUMMARY – BACK TO BASICS
• High parking and congestion pricing for different areas has reduced traffic in the city core
resulting in better air quality.
• 5 new proposed trans-river bridges has increased the east west connectivity within the
KMA area reducing the pressure on existing four bridges, simultaneously reducing the
load from the existing network.
• Improvements within the road geometric design with compulsory cycle tracks and
walkways along the major arterial road has enhanced the speed of the vehicles as well as
reduced health costs.
• Development of these TOD proposals of the mobility plan has reduced urban sprawl and
has induced capital investments.
• A single apex body has resulted towards better and efficient implementation of all
transportation issues.
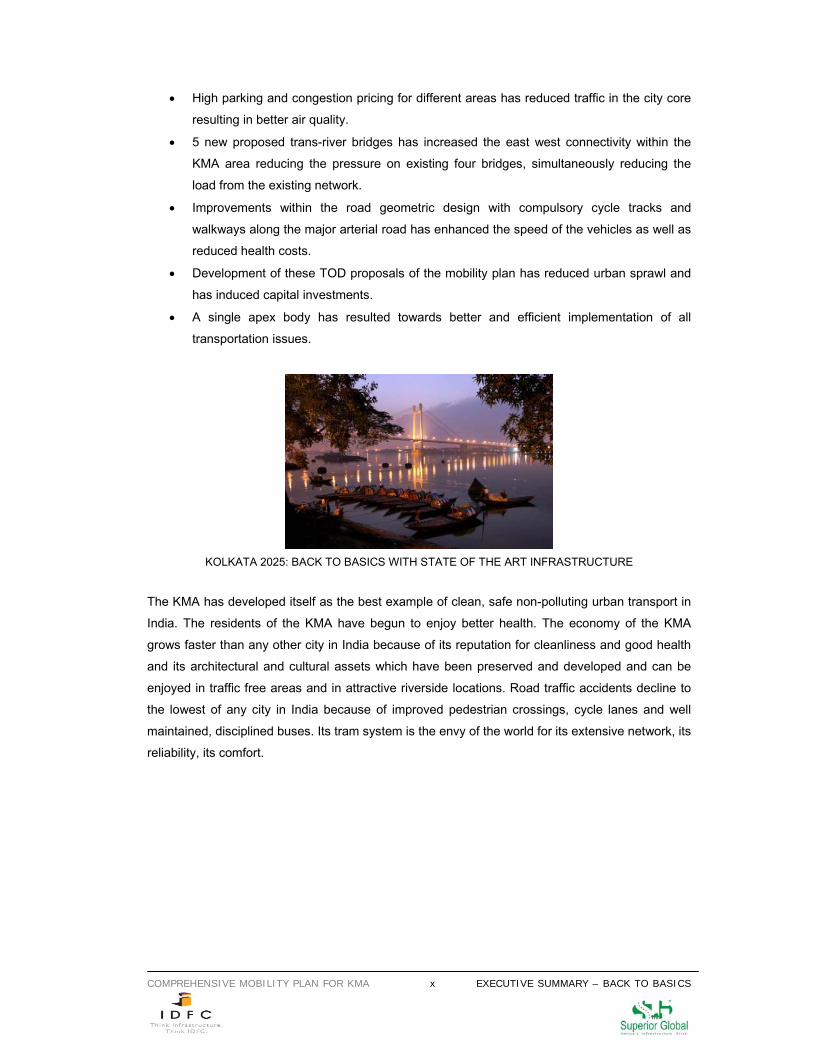
KOLKATA 2025: BACK TO BASICS WITH STATE OF THE ART INFRASTRUCTURE
The KMA has developed itself as the best example of clean, safe non-polluting urban transport in
India. The residents of the KMA have begun to enjoy better health. The economy of the KMA
grows faster than any other city in India because of its reputation for cleanliness and good health
and its architectural and cultural assets which have been preserved and developed and can be
enjoyed in traffic free areas and in attractive riverside locations. Road traffic accidents decline to
the lowest of any city in India because of improved pedestrian crossings, cycle lanes and well
maintained, disciplined buses. Its tram system is the envy of the world for its extensive network, its
reliability, its comfort.
COMPREHENSIVE MOBILITY PLAN FOR KMA xi CONTENTS
CONTENTS Name Page No.
EXECUTIVE SUMMARY i
CONTENTS xi
LIST OF TABLES xiii
LIST OF FIGURES xv
LIST OF ANNEXURES xvi
ABBREVIATIONS xvii
No. Name Page No. CHAPTER 1 INTRODUCTION 1
CHAPTER 2 STUDY AREA CHARACTERISTICS 9
CHAPTER 3 ROAD NETWORK AND TRAVEL
CHARACTERISTICS 20
CHAPTER 4 MASS RAPID TRANSIT SYSTEM 35
CHAPTER 5 SUBURBAN RAIL 50
CHAPTER 6 INTRA PARATRANSIT 55
CHAPTER 7 PEDESTRIAN AND BICYCLE MOVEMENT 61
CHAPTER 8 PARKING 64
COMPREHENSIVE MOBILITY PLAN FOR KMA xii CONTENTS
CHAPTER 9 FREIGHT 69
CHAPTER 10 ENVIRONMENT 76
CHAPTER 11 PROBLEMS AND ISSUES 82
CHAPTER 12 FUTURE TRAVEL AND TRANSPORT
DEMAND PROJECTIONS 85
CHAPTER 13 RECOMMENDATIONS 90
COMPREHENSIVE MOBILITY PLAN FOR KMA xiii CONTENTS
LIST OF TABLES
TABLE NUMBER TABLE NAME
TABLE 1.1 Methodology and Assignment of Tasks
TABLE 2.1 Population Growth, KMA
TABLE 2.2 Industrial Units and Employment
TABLE 2.3 KMA’S Share in State Domestic Product of West Bengal
TABLE 2.4 Land Use Pattern in KMA (1961-1990)
TABLE 2.5 Land Use Classification
TABLE 2.6 Arterial Road Length by Road Types in KMA
TABLE 2.7 Main Agencies/Stakeholders in KMA
TABLE 3.1 Salient Network Characteristics of Major Roads
TABLE 3.2 Traffic Volume Counts on The Major Corridors of KMA
TABLE 3.3 Traffic Composition on Major Roads in The Core Area
TABLE 3.4 Peak Hour Traffic and Corridor Speed
TABLE 3.5 Trans- River Vehicular Traffic
TABLE 3.6 Growth of Transit Passengers in KMA (on an average weekday; in lakhs)
TABLE 3.7 Total Number of Registered Vehicles in The KMA
TABLE 3.8 Lanes - Speed Profile
TABLE 3.9 Speed Profile on The Basis of Divided and Undivided Carriage Way (In Km)
TABLE 3.10 Year Wise Road Accident
TABLE 3.11 Income Distribution of Households in KMA
TABLE 3.12 Households Owning Different Categories of Vehicles in KMA
TABLE 3.13 Distribution of Income Groups by Mode of Transit Transport Used
TABLE 3.14 Distribution of Trips by Trip Purpose in KMA
TABLE 3.15 Trip Length Distribution of Work Trips in KMA
TABLE 3.16 Trip Length Distribution of Educational Trips in KMA
TABLE 3.18 Average Occupancy of Predominant Modes
TABLE 3.17 Purpose of Journey and Mode of Transport Used
TABLE 4.1 Variation in Headways of Metro Railway
TABLE 4.2 Growth in Passenger Volume in Metro Railway
TABLE 4.3 Train Late/ Detention Due to Rolling Stock
TABLE 4.4 Metro Rail Benefits
TABLE 4.5 Revenue and Operating Expenditures of CTC (RS. million)
TABLE 4.6 Circular Railway Running Times between Stations
TABLE 4.7 SBSTC: Profile of City Services
TABLE 4.8 WBSTC: Type OF Bus Service
TABLE 4.9 CSTC: Number of Buses and Routes Operated
COMPREHENSIVE MOBILITY PLAN FOR KMA xiv CONTENTS
TABLE 4.10 CSTC: Profile of City Services
TABLE 4.11 Profile of Private Bus Services
TABLE 4.12 Profile of Mini Bus Services
TABLE 4.13 Information Regarding Mini Bus Routes under RTA, Howrah
TABLE 4.14 Information Regarding Stage Carriage Bus Routes Under RTA Howrah
TABLE 4.15 Information Regarding Stage Carriage Express Bus Routes Under RTA Howrah
TABLE 4.16 Number of Vessels and Jetties Operational in KMA
TABLE 4.17 Total Number of Passengers Served by Ferry Services
TABLE 5.1 Growth of Suburban Passengers in KMA
TABLE 5.2 Growth of Number of Passengers Using Howrah and Sealdah Railway Stations
TABLE 6.1 Trip Distribution Among Various Modes
TABLE 6.2 Break-up of Total Paratransit Trips in KMA
TABLE 6.3 Movement of Passengers Within KMA
TABLE 7.1 Vehicle Ownership in the KMA
TABLE 9.1 Freight Movement by Road
TABLE 9.2 Container Freight Handling of Kolkata Dock System in TEUS
TABLE 9.3 Inward Rakes Dealt at Terminals of Sealdah Division TABLE 9.4 Inward Rakes Dealt at Terminals of Howrah Division
TABLE 10.1 KMA Vehicle Age Distribution 2003
TABLE 10.2 Estimated Vehicle Emissions Load in Metropolitan Cities, 2005
TABLE 10.3 Mortality Rates Due to Air Pollution in KMA
TABLE 10.4 Noise Limit for Vehicles
TABLE 10.5 Noise Levels
TABLE 12.1 Projected Population for KMA
TABLE 12.2 Projected Growth of Registration on Motorized Vehicles in KMA
TABLE 12.3 Estimated Freight Traffic in KMA
TABLE 12.4 Projected Growth of Passengers Using Howrah and
Sealdah Railway Stations
TABLE 12.5 Projected Growths of Suburban Passengers in KMA
TABLE 12.6 Projected Growth of Passengers Traveling by Air in KMA
TABLE 12.7 Projected Passenger Volume for Public Transport
TABLE 12.8 Projected Tran-river Traffic Volume in KMA
TABLE 13.1 Share of Air Pollution from Different Modes
COMPREHENSIVE MOBILITY PLAN FOR KMA xv CONTENTS
LIST OF FIGURES
FIGURE NUMBER FIGURE NAME
FIGURE 3.1 Traffic Composition on Major Corridors
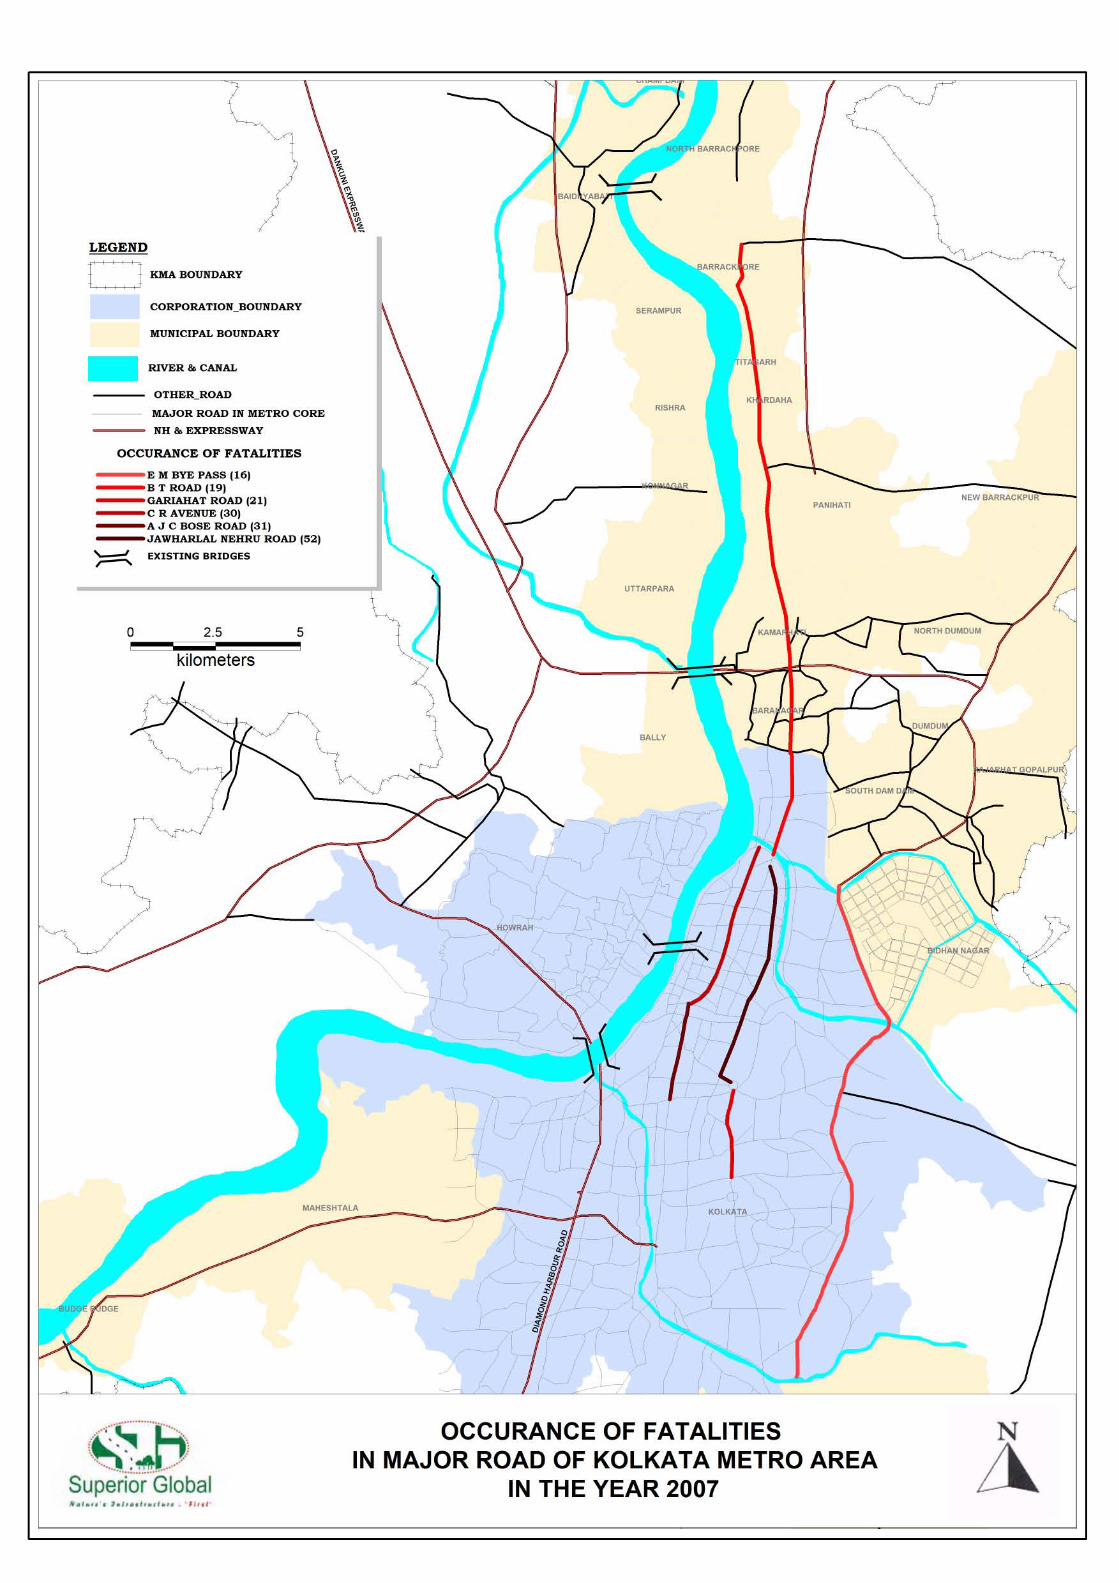
FIGURE 3.2 Accident Prone Roads
FIGURE 4.1 Trip Distribution in KMA, 2008
FIGURE 4.2 Total Number of Passengers Served by Ferry Services
FIGURE 5.1 Existing Suburban Network in Kolkata
FIGURE 9.1 Traffic Handling of Kolkata Dock System
FIGURE 9.2 Goods Received by Different Modes for Export at Kolkata Port
FIGURE 9.3 Percentage of Goods Dispatched by Different Modes for Imports at Kolkata Port FIGURE 9.4 Cargo Movement by Air FIGURE 10.1 Vehicle-Type Contributions to Pollutant in KMA, 2003
FIGURE 10.2 Level of Pollutants in KMA
FIGURE 13.1 Comprehensive Mobility Plan Concept
FIGURE 13.2 Comprehensive Strategy for Enhancing Mobility
COMPREHENSIVE MOBILITY PLAN FOR KMA xvi CONTENTS
LIST OF ANNEXURES ANNEXURE NUMBER ANNEXURE NAME
ANNEXURE I Node Wise Road Inventory of KMA
ANNEXURE II Speed and lengths of Arterial Roads of KMA
ANNEXURE III Traffic Violations in KMA
ANNEXURE IV Level of Service Criteria
ANNEXURE V Number OF Passengers Served BY Ferry Services Operated within
KMA
ANNEXURE VI Increase in the No. of IPT Registration
ANNEXURE VII On-Street Parking in East to West Direction
ANNEXURE VIII On-Street Parking in North to South Direction
ANNEXURE IX Freight Handling at Kolkata Port
ANNEXURE X National Ambient Air Quality Standards
ANNEXURE XI Detailed Design Guidelines
COMPREHENSIVE MOBILITY PLAN FOR KMA xvii CONTENTS
ABBREVIATIONS AJC Bose Acharya Jagdish Chandra Bose Road
BT Road Barrackpore Trunk Road
BK Expressway Barrackpore Kalyani Expressway
BB Ganguly Street Bipin Behari Ganguly Street
CR Avenue Chitranjan Avenue
CIT Road Calcutta Improvement Trust
CSTC Calcutta State Transport Corporation
CBD Central Business District
CIWTC Central Inland Water Transport Corporation
CTC Calcutta Tramways Company
CPCB Central Pollution Control Board
dB Decibel
DPR Detailed Project Report
EIA Environmental Impact Assessment
EM By Pass Eastern Metropolitan Bypass
GoWB Government of West Bengal
GT road Grand Trunk Road
HNJPSS Hoogly Nadi Jalapath Parivahan Samabaya Samiti
IDFC Infrastructure Development and Finance Corporation
IPT Intra Para Transit
IWT Inland Water Transport
JBIC Japan bank for International Cooperation
JL Nehru road Jawaharlal Nehru Road
KMA Kolkata Metropolitan Area
KMDA Kolkata Metropolitan Development Authority
KMC Kolkata Municipal Corporation
KMPC Kolkata Metropolitan Planning Committee
Kmph Kilometer Per Hour
Kmpl Kilometers Per Litre
KPD Kidderpore Dock
KDS Kolkata Dock System
KK Tagore Road Kali Krishna Tagore Road
LRT Light Rail Tram
MG Road Mahatma Gandhi Road
MoST Ministry of Surface Transport
NBSTC North Bengal State Transport Corporation
NSD Netaji Subhas Dock
COMPREHENSIVE MOBILITY PLAN FOR KMA xviii CONTENTS
N.S.C.B Airport Netaji Subash Chandra Bose Airport
NMV Non Motorized Vehicle
PCU Passenger Car Unit
RTA Regional Transport Authority RSPM Respiratory Suspended Particulate Matter
RPM Respiratory Particulate Matter
R G Kar Road Radha Govind Kar Road
SGI Superior Global Infrastructure Private Ltd.
S. N. Banerjee Road Surendra Nath Banerjee Road
SBSTC South Bengal State Transport Corporation
SIA Social Impact Assessment
UDPFI Urban Development Plan Formulation and Implementation
VIP Road Very Important Person Road
V/C Ratio Volume – Capacity Ratio
WBSTC West Bengal Surface Transport Corporation
WBPCB West Bengal Pollution Control Board
WBIWTC West Bengal Inland Water Transport Corporation
COMPREHENSIVE MOBILITY PLAN FOR KMA 1 INTRODUCTION
CHAPTER 1
INTRODUCTION
1.1 STUDY BACKGROUND
Kolkata (earlier known as Calcutta1), the land of Tagore and Mother Teresa, has been endowed with many
metaphors in the past. From being called the ‘City of Joy’ to the ‘Jewel in The Crown of The British Raj’,
Kolkata has evolved as the cultural capital of India and the economic capital of eastern India.
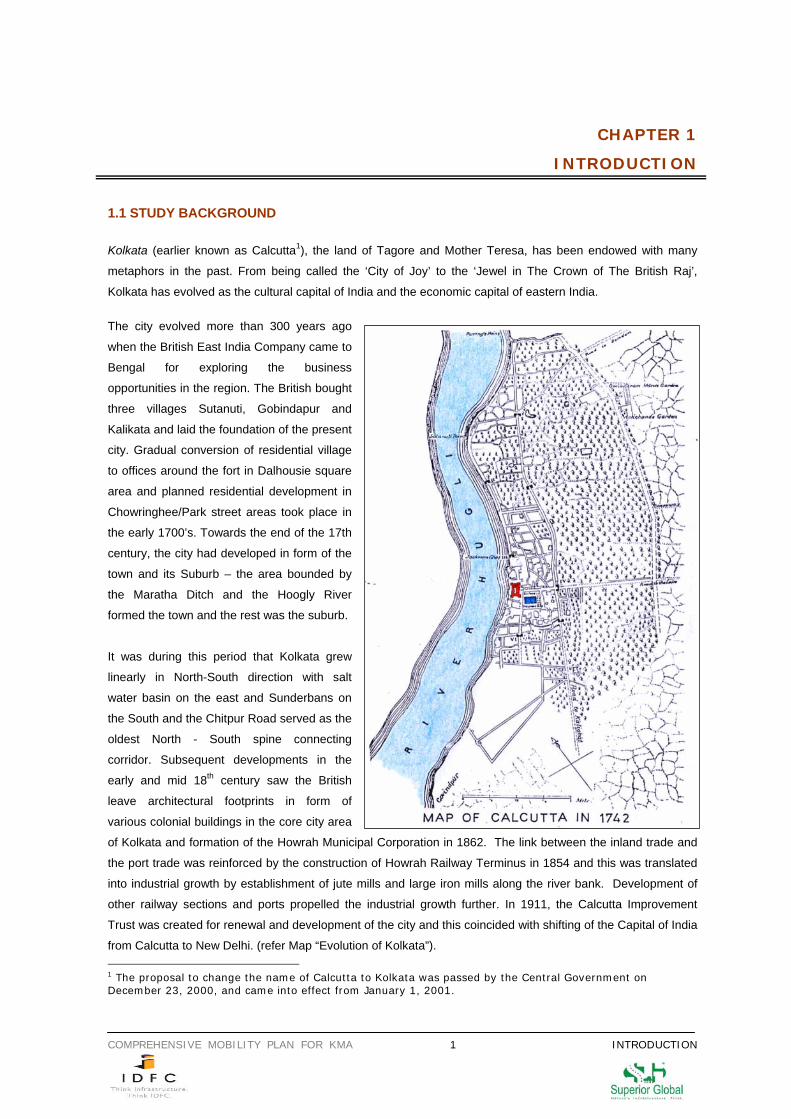
The city evolved more than 300 years ago
when the British East India Company came to
Bengal for exploring the business
opportunities in the region. The British bought
three villages Sutanuti, Gobindapur and
Kalikata and laid the foundation of the present
city. Gradual conversion of residential village
to offices around the fort in Dalhousie square
area and planned residential development in
Chowringhee/Park street areas took place in
the early 1700’s. Towards the end of the 17th
century, the city had developed in form of the
town and its Suburb – the area bounded by
the Maratha Ditch and the Hoogly River
formed the town and the rest was the suburb.
It was during this period that Kolkata grew
linearly in North-South direction with salt
water basin on the east and Sunderbans on
the South and the Chitpur Road served as the
oldest North - South spine connecting
corridor. Subsequent developments in the
early and mid 18th century saw the British
leave architectural footprints in form of
various colonial buildings in the core city area
of Kolkata and formation of the Howrah Municipal Corporation in 1862. The link between the inland trade and
the port trade was reinforced by the construction of Howrah Railway Terminus in 1854 and this was translated
into industrial growth by establishment of jute mills and large iron mills along the river bank. Development of
other railway sections and ports propelled the industrial growth further. In 1911, the Calcutta Improvement
Trust was created for renewal and development of the city and this coincided with shifting of the Capital of India
from Calcutta to New Delhi. (refer Map “Evolution of Kolkata”). 1 The proposal to change the name of Calcutta to Kolkata was passed by the Central Government on December 23, 2000, and came into effect from January 1, 2001.
Kolkata, 1742
COMPREHENSIVE MOBILITY PLAN FOR KMA 2 INTRODUCTION
Post independence, large scale refugee migration plagued Calcutta during the partition of the country in 1947
and the Bangladesh war in 1971 and put the civic infrastructure of the city under unprecedented strain.
Refugee colonies sprang up in Tollygunj and Jadavpur in the south, low lying areas in the east namely, Tangra,
Topsia, Tiljala and Kasba, and suburbs close to Calcutta namely, South Suburban, Garden Reach, North and
South Dumdum, Baranagar, Kamarhati and Panihati.
Since those times, the city has developed into a burgeoning metropolitan of modern India with a dynamic IT
sector, a booming retail market, and a fast expanding industrial hinterland. The GDP of the metropolitan area is
US$ 94 billion and its per capita income is US$ 8,520. IT and related services lead the current economic boom,
and are growing at 70 per cent annually. Despite the economic prosperity of the city, the metropolis of Kolkata
suffers from loss of city wetlands which causes frequent flooding, high levels of air pollution, traffic congestion
and inadequate infrastructure.
The study area, Kolkata Metropolitan Area (KMA) with an area of 1875 sq. km., falls under the jurisdiction of
Kolkata Metropolitan Development Authority (KMDA) which is the agency responsible for planning, promoting
and developing the KMA. With a population size of 16.7 million2 and a density of 7,978 persons per sq. km.3,
the KMA constitutes of multiple administrative units - 3 Municipal Corporations4, 38 Municipalities5 and 22
Panchayat Samities.
Although KMDA has a strong planning legacy, development of the metropolis as a single geographical entity
has not taken place. The expanse of the KMDA has two distinct contrasting parts – first, the urbanized
continuous stretch in a linear pattern on either sides of the river Hoogly and secondly, the rural areas around
the urban conurbation. The concentration of all the economic activities and civic amenities is within the urbanized area and this dependence on a daily basis of the suburban areas on the city core establishes the need of a strong integrated transportation system.
Due to the existence of wetlands along the eastern fringe of the city, the eastward growth was arrested. The
city therefore, grew along a linear north-south corridor. The railway line constructed in north south direction
further accentuated this longitudinal growth. The linear spread of the city also calls for strong north-south links
with access to multiple modes, supported by a network of east-west links and improved trans-river connectivity.
1.2 EVOLUTION OF TRANSPORTATION IN KOLKATA
KMA has a very elaborate public transport system, consisting of train systems - both terrestrial and
underground, trams, buses, ferries and taxis. Quality varies from the state-of-the-art Metro, to the ramshackle
(but very extensive) bus system, with everything from the overworked commuter trains, obsolete trams and
2 Projected Population in 2008. The population of KMA in 2001 as per the Census of India is 14.7 million. 3 Urban India: Understanding The Maximum City, November 2007 4 Chandan Nagar, Howrah and Kolkata 5 Bansberia, Kalyani, Gayeshpur, Kanchrapara, Halisahar, Hoogly Chinsura, Naihaty, Bhatpara, Bhadreswar, Gurulia, Champdan, Baidyabati, North Barrackpore, Barrackpore, Srirampur, Titagarh, Rishra, Khardah, Konnagar, Panihati, Uttarpara, Kamarhati, North Dum Dum, New Barrackpur, Madhyagram, Barasat, Rajarhat, Bidhan Nagar, South Dum Dum, Dum Dum, Baranagar, Baly, Sonarpur/Rajpur, Baruipur, Maheshtala, Budge Budge, Pujali and Uluberia
COMPREHENSIVE MOBILITY PLAN FOR KMA 3 INTRODUCTION
ferries that offer low quality modal choices to the commuters. The most modern and the most ancient forms of
transportation coexist and function in the city, making it very unique indeed.
The transport infrastructure for Kolkata was mainly developed during the period from 1850 to 1930. During this
period the Kolkata port was established, the railway network was installed, the tram services came into
operation and a number of arterial roads were constructed.
The riverine Port of Kolkata is the oldest operating ports in India that was originally constructed by the British
East India Company in the 19th century. The sea route has been the lifeline of Kolkata and it shaped the
economic life, trade and commerce as well as the physical structure of the city. Some of the primary industries
in Kolkata including jute and rice mills were located on the western bank of river Hoogly in Howrah. In mid-
nineteenth century, railways came to support the expansion of trade activities that were taking place from the
port, further inland. One of the railway companies, the Bengal Nagpur Railways made a modest beginning in
1887 by taking over the existing Nagpur - Chattisgarh Railway. It was later extended eastwards and joined the
East Indian Railway at Asansol. By this construction of the main line, a direct route opened up between Kolkata
and Mumbai
After independence, importance of the port decreased due to the Partition of Bengal (1947), reduction in size of
the port hinterland and economic stagnation in eastern India. In the 21st century, due to the economic
revitalization and infrastructure improvements, the port grew swiftly to become the nation's second largest
container port and it was one of India's fastest growing ports in 2004-05. The Port has two distinct dock
systems - Kolkata Docks at Kolkata and a deep water dock at Haldia Dock Complex, Haldia.
The earliest forms of public land transport in the city were palanquins and horse drawn carriages. Other forms
of mass transport were limited to waterways. Even after the Howrah railway station was built in 1854 and even
before the first bridge6 was constructed for connecting the twin cities of Howrah and Kolkata, motorized and
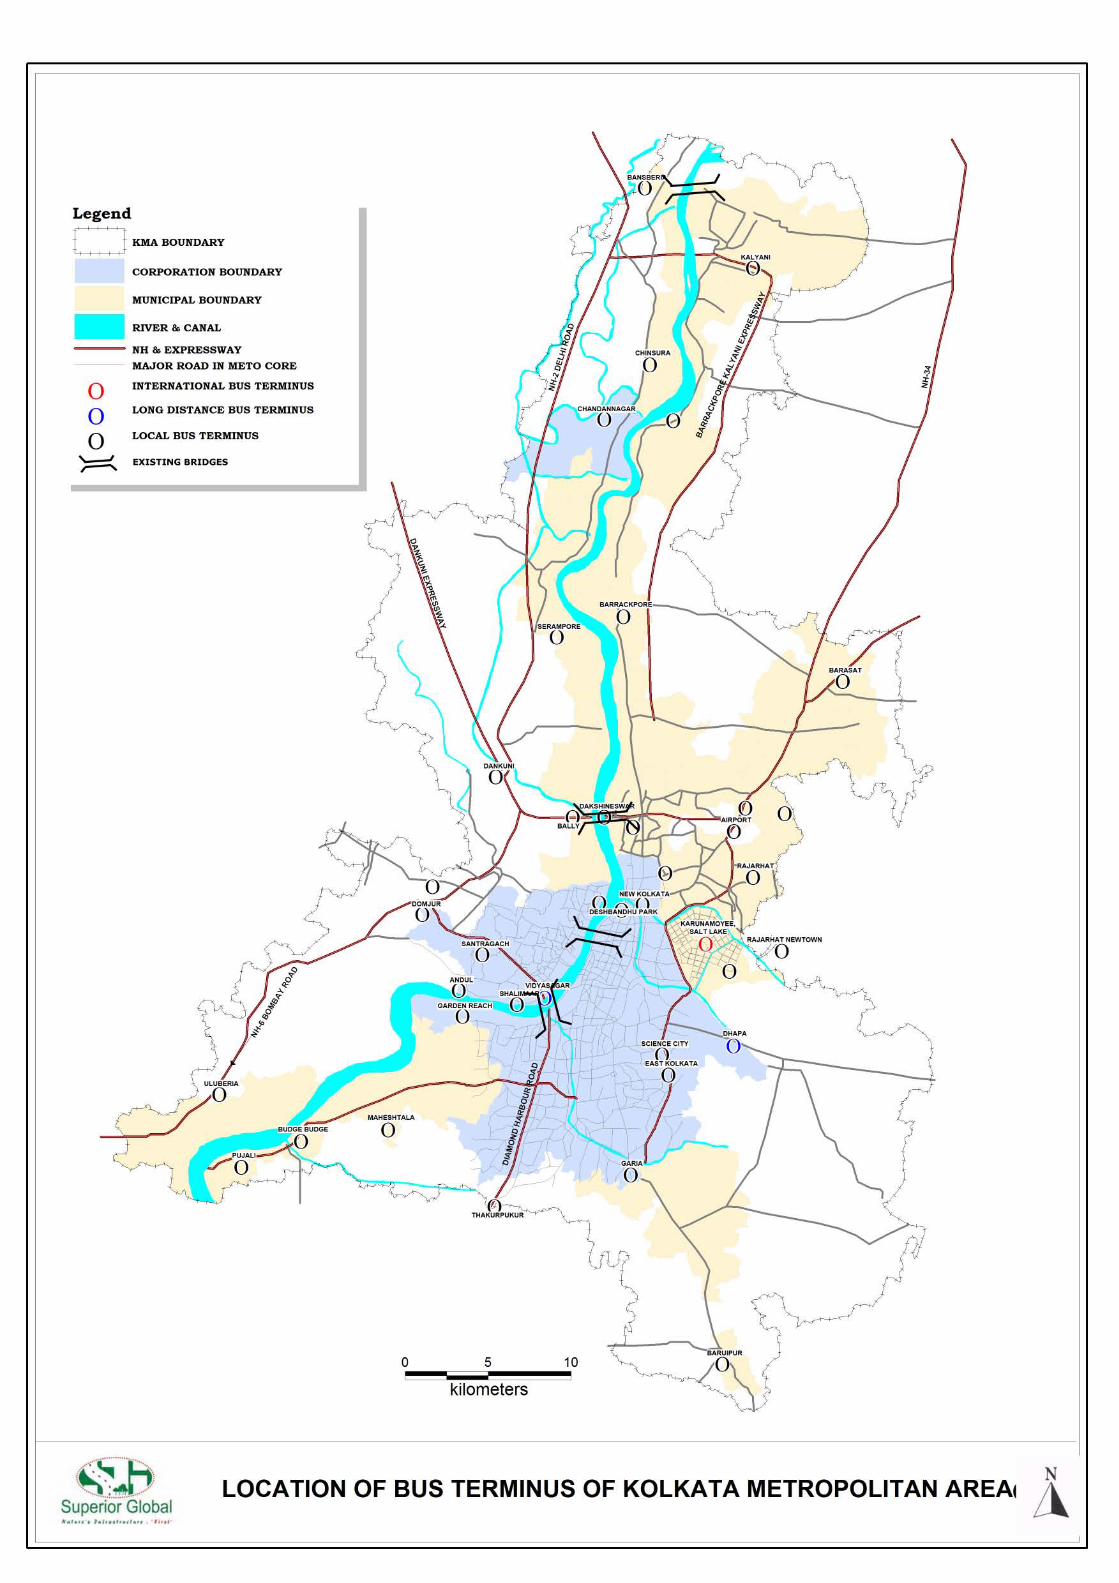
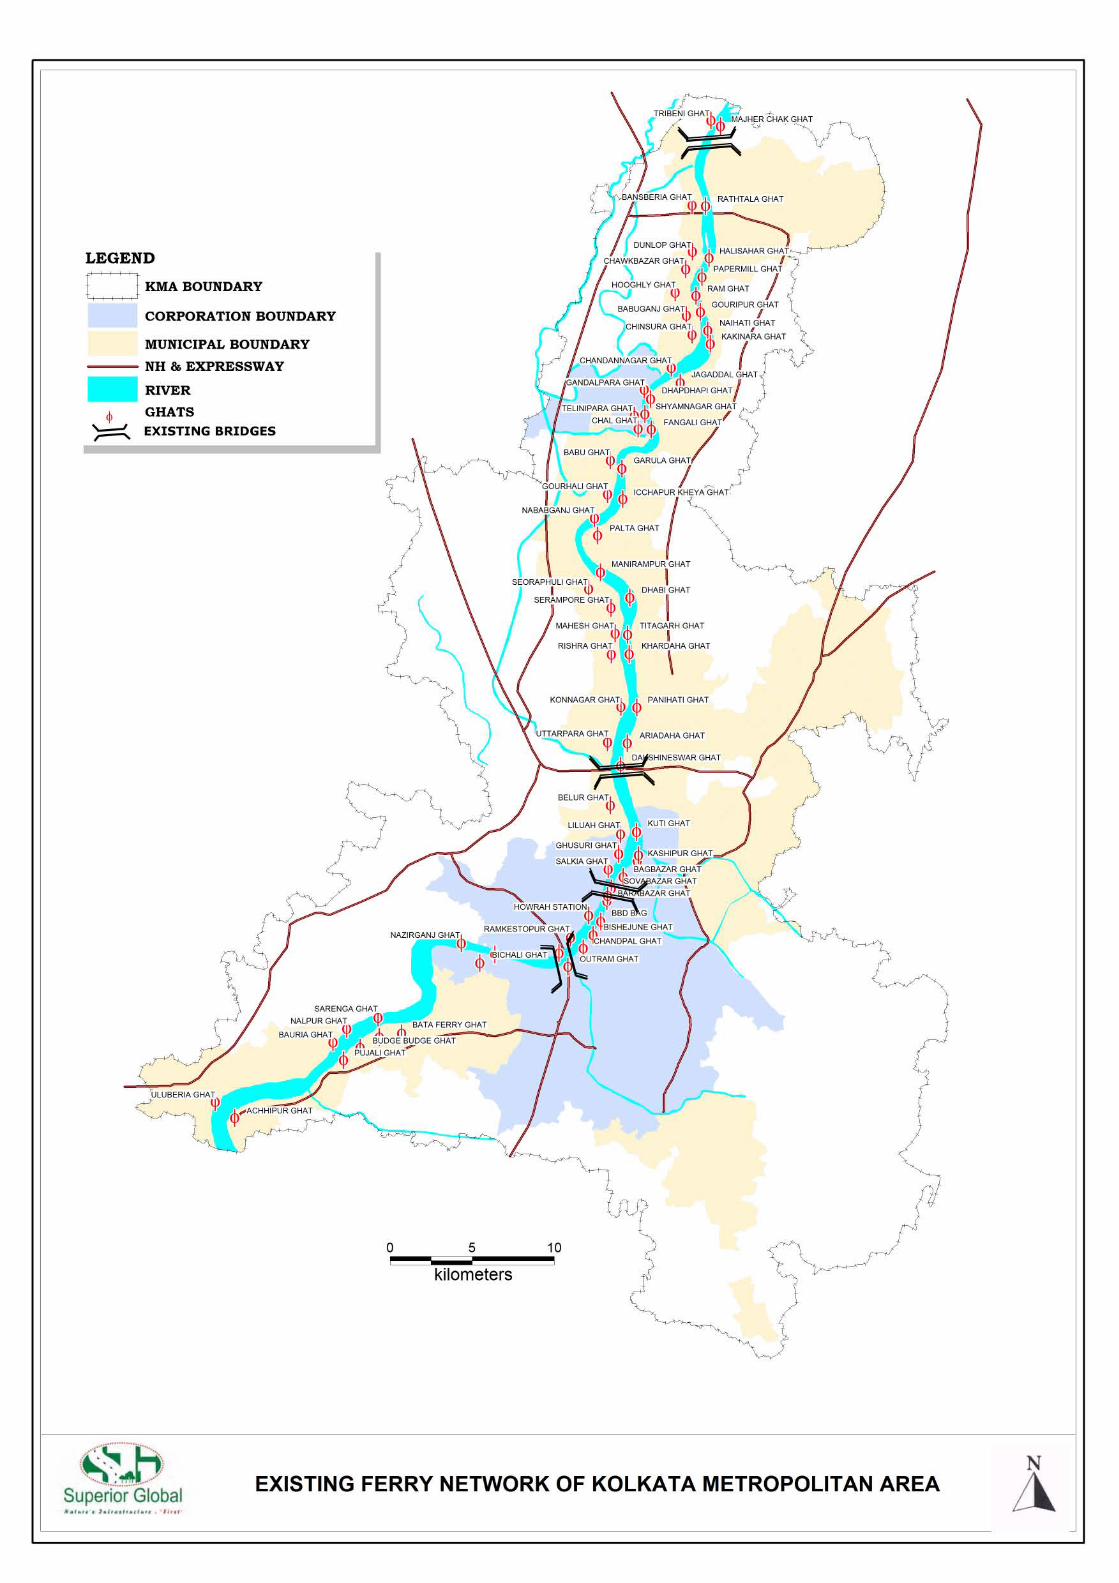
country boats remained a popular form of mass transit. Ferries are still an integral part of the transportation
system of Kolkata and ferry services across and along the Hooghly provide a hassle-free and scenic way to
see many of Kolkata's top attractions. Most of the ferry piers (ghats) are conveniently located near railway
stations or a short walk from other public transport.
By late 1830, three horse drawn omnibuses had been started between Dharmatala and Barrackpur, however, it
was only after 1864 that they became popular. The first truly successful horse-drawn public vehicle was the
tramcar. Towards the end of 19th century tramcar became privatized and Calcutta Tramways Company Ltd.
(CTC) was made in-charge of operations from Sealdah to Dalhousie Square (now B.B.D. Bagh). By 1900s the
Chinese in the city had brought in rickshaws commercially into the city which has now become a prominent
mode of transportation and part of the city image.
More contemporary forms of public transport include the Kolkata Metro (underground rail network) which was
constructed under the Metropolitan Transport Project in 1969 and was renamed as Metro Railway in 1979 after
passing of Metro Railway (Construction and Works) Act, 1978. It was the first underground built in India with
service starting in 1984 and is currently operated by the Indian Railways.
6 Floating Pontoon Bridge, built in 1874 by Sir Bradford Leslie
COMPREHENSIVE MOBILITY PLAN FOR KMA 4 INTRODUCTION
The city also has an extensive heavy rail suburban network operated by the Ministry of Railways, Government
of India. However, these different modes instead of complementing each other for improving the mobility of the
city work in isolation.
There are many areas in the city that have very narrow roads with slow-moving as well as fast moving traffic
plying on them. This is the prime reason that deters the speed of movement and therefore, multiplicity in mode
of travel becomes a curse instead of a boon. In addition to the public modes of travel, there are many privately
owned vehicles operating in Kolkata including cars, two-wheelers and bicycles. Kolkata Municipal Corporation
(KMC) has the highest car density (1,421 cars per sq. km.) as well as second highest car ownership (61 cars
per 1,000 residents) in India7. This high index of vehicles under private ownership is major concern for the
transportation network in the city. This is also reiterated from the fact that road traffic in city streets and on
arterial roads is extremely congested, as a substantial portion (75%) of city transport is dependent of road
based transport systems while the city has only 5.5% land use for transport.
KMA has several other peculiar issues associated with urban transport infrastructure including low road
density, mixed traffic, inadequate public transport systems, limited road maintenance and insufficient traffic
control / management measures. These situations adversely affect the sustainability of urban development in
KMA. Also the population growth has led to rapid increase in congestion and has hampered mobility, adversely
impacting the economic productivity of the city. The linear spatial growth of the city has also put additional
pressure on the existing north south links which has further slowed the pace of movement within the city. It is,
therefore, critical that appropriate investments be made in improving mobility.
1.3 TRANSPORTATION PLANNING LEGACY
Considering all transportation issues, the Kolkata Metropolitan Development Authority (KMDA) prepared a Draft
Traffic and Transportation Master Plan with integration to the Perspective Plan (Vision 2025) in January 2000.
The Draft Traffic and Transportation Master Plan was modified as per the deliberations of the Working Group
constituted by the Chief Secretary Govt. of West Bengal (GoWB) on 6th July 2000. The working group was
represented by officials from KMDA, Transport Department, Public Works (Roads) Department GoWB, Kolkata
Municipal Corporation, Eastern Railways, South Eastern Railways, Kolkata Port Trust, Hoogly River Bridge
Commissioners, District Collectorate (traffic) Kolkata Police, Superintendent of Police Howrah, and Airport
Authority of India. The Draft Master Plan was presented to Kolkata Metropolitan Planning Committee (KMPC)
in December 2001. The Traffic and Transportation, Railways and Waterways sector Committee constituted
under KMPC finalized the Draft Master Plan after detailed scrutiny and with observations from local bodies
within KMA and public representatives in January 2006.
1.4 THE NEED OF THE PRESENT STUDY
A number of studies have been carried out at different points of time to assess the baseline transport situation.
Proposals have also been developed for investments in a number of public transport systems, including an
East – West Metro Rail Corridor and elevated Light Rail Transit (LRT) systems. However, there is, as yet, no
7 Urban India: Understanding The Maximum City, November 2007
COMPREHENSIVE MOBILITY PLAN FOR KMA 5 INTRODUCTION
Comprehensive Mobility Plan that identifies the long term needs in a holistic and complete manner to place all
the individual proposals in a strategic perspective.
Keeping in view the growing importance of the transport sector in the city’s fabric, the Government of West
Bengal (GoWB), through its Department of Traffic and Transport with support of the Ministry of Urban
Development, Government of India, initiated a Comprehensive Mobility Plan for the Kolkata Metropolitan Area
for the horizon year 2025. Infrastructure Development Finance Company Ltd. (IDFC), New Delhi has been
selected and appointed to study and prepare a Comprehensive Mobility Plan for the Kolkata Metropolitan Area
(KMA). The Kolkata Metropolitan Development Authority (KMDA) is a key agency of the client in this case.
IDFC has engaged Superior Global Infrastructure Consulting Pvt. Ltd. (herein “the consultants”) for carrying out
the study.
1.5 OBJECTIVES AND SCOPE OF WORK FOR CMP
1.5.1 OBJECTIVE
The main objectives of the present study are:
• To study the existing traffic and travel characteristics of the study area
• To forecast travel demand for the horizon year 2025
• To identify short, medium and long term transport improvement plans
• To encourage modal shift in favour of public transport and intermediate public transport
• To encourage modal shift in favour of pedestrian movement and Non Motorized Vehicles (NMV) by
providing proper facilities for them
• To focus on economic, environmental and socially sustainable mobility
• To analyze and recommend development of Integrated Mass Transport System
• To recommend institutional changes and implementation mechanisms to enhance customer experience,
reduce trip lengths and transportation modes
1.5.2 SCOPE OF WORK
The consultant shall undertake all aspects of the assignment as has been awarded to IDFC. Scope of Services
to be carried out by the Consultant shall include:
Review all Previous Studies and carry out any additional studies that maybe required
Identify all individual projects recommended by various agencies, including projects for Mass Transit
Systems, Feeder Systems, Parking Complexes, Waterways, Freight Terminals, By-passes, Public
Transit Stations and Inter-change Terminals, Property Development Projects, etc.
Integrate Transportation Proposals for Different Modes and Prepare a Comprehensive Mobility Plan
for Kolkata Metropolitan Area
Develop an Appropriate Phasing and Sequencing Plan
The following reports have been reviewed by the consultants:
Master Plan for Traffic and Transportation in Kolkata Metropolitan Area (2001-2025)
COMPREHENSIVE MOBILITY PLAN FOR KMA 6 INTRODUCTION
Integrated Multi-Modal Public Transport Plan for Calcutta, Traffic and Transport Department, GoWB,
January 2000
City Development Plan Kolkata, KMDA, June 2007
Vision 2025: Perspective Plan of KMA, Draft Final Report, KMDA, December 2005
Study on Vehicular Traffic entering and leaving the Calcutta Metropolitan Area, April 1998
Origin and Destinations of Goods Vehicles Entering and Leaving Calcutta Metropolitan Area,
Transportation Planning and Traffic Engineering Directorate, Transport Department, GoWB,
November 1999
Pilot Study for Project Formation for Urban Transport Development in the Kolkata Metropolitan Area in
India: Final Report, September 2007.
Bus Terminal Route Study in Kolkata, Howrah and Salt Lake, April 2008
Traffic and Transportation In KMC area Development Perspective and Action plan, November 2007
Traffic Study on Vidyasagar Setu, February 2008
Elevated Mass Rapid Transit System-Preliminary Project summary, Kolkata, Transport Department,
Government of West Bengal, March 2005
Air Quality Status of West Bengal-A state of Environment Report, West Bengal Pollution Control
Board, 2004
Urban India-Understanding the Maximum City, London School of Economics, London, 2007
A Study on Transportation by Ferry Services On the River Hoogly(Kalyani to Kakdwip), Transportation
Planning and Traffic Engineering Directorate, Transport Department, GoWB, July 2001
Bus Rapid Transit System Project, Ultadanga to Kamal Gazi, Kolkata – Interim Report, KMDA, June
2008
Improving City Mobility – An Action programme for The KMC Area,Draft, KMC, December 2008
Texas Metropolitan Mobility Plan: Breaking the Gridlock, Texas Department of Transportation, August
2001
Stage Carriage Bus Routes & Special Stage carriage/Mini Bus Routes, Transport Department, GoWB,
January 2005
Proposed Transport Infrastructural Development Projects in and Around KMA, Transportation
Planning and Traffic Engineering Directorate, February, 2008
Study on Vehicular Traffic Entering and Leaving the KMA, CMDA, Transportation Planning and Traffic
Engineering Directorate, April 1998
A study on Passenger Ferry Services on the River Hoogly (Kalyani to Kakdwip), Transportation
Planning and Traffic Engineering Directorate, Transport Department, GoWB, July 2001
Pilot Study for Project Formulation for Urban Transport Development in the KMA in India, Final
Report, Japan Bank for International Cooperation ( JBIC), September 2007
Transit Cooperative Research Programme Reports, Transportation Research Board, National
Research Council, Washington D.C., June 2003
Note on Parking Policy in KMA, Project Planning Unit, KMDA, 2007
Growth or Gridlock? The Economic Case for Traffic Relief and Transit Improvement for A Greater New
York, December 2006
Traffic Study Along EM Bypass and VIP road, Transportation Planning and Traffic Engineering
Directorate, Transport Department, GoWB, January 2007
Bus Terminus/ Route Study , Transport Department, GoWB, April 2008
COMPREHENSIVE MOBILITY PLAN FOR KMA 7 INTRODUCTION
Study on Passenger Traffic Volumes Entering and Leaving the CMA Boundary by Different Modes of
Vehicles, Transportation Planning and Traffic Engineering Directorate, Transport Department, GoWB,
April 1998
Traffic Study Along CR Avenue and JM Avenue, Transportation Planning and Traffic Engineering
Directorate, Transport Department, GoWB, February 2007
Classified Traffic Study on Kolkata Roads – Southern Area, Transportation Planning and Traffic
Engineering Directorate, Transport Department, GoWB, February 2007
Classified Traffic Study on Kolkata Roads – Central Area, Transportation Planning and Traffic
Engineering Directorate, Transport Department, GoWB, February 2006
Classified Traffic Volume on Kolkata Roads – Northern Area, Transportation Planning and Traffic
Engineering Directorate, Transport Department, GoWB, February 2005
Traffic Study on Fly-overs and Adjacent Roads in Kolkata– Southern Area, Transportation Planning
and Traffic Engineering Directorate, Transport Department, GoWB, February 2007
Sustainable Transport Solutions for Calcutta, School of the Built Environment at Liverpool John
Moores University, U.K., August 1996.
1.6 STUDY APPROACH AND METHODOLOGY
‘Comprehensive Mobility Plan’ envisages the KMA as an unified city with well-defined integrated multi-modal
transportation system catering to all cross-sections of the society. The document is a comprehensive study
entailing a series of physical interventions and policies to reinforce the regional connectivity and increase the
mobility within the city.
Transportation being the backbone of all urban development activities, inadequately envisioned, or poorly
delivered, can stunt growth for centuries and take capital investment to other cities. Therefore, the mobility plan
is not only analytical, but also takes a long term view of the financial implications of the transportation
mechanism on the city, including but not limited to the cost of congestion and quality of life and health of the
citizens.
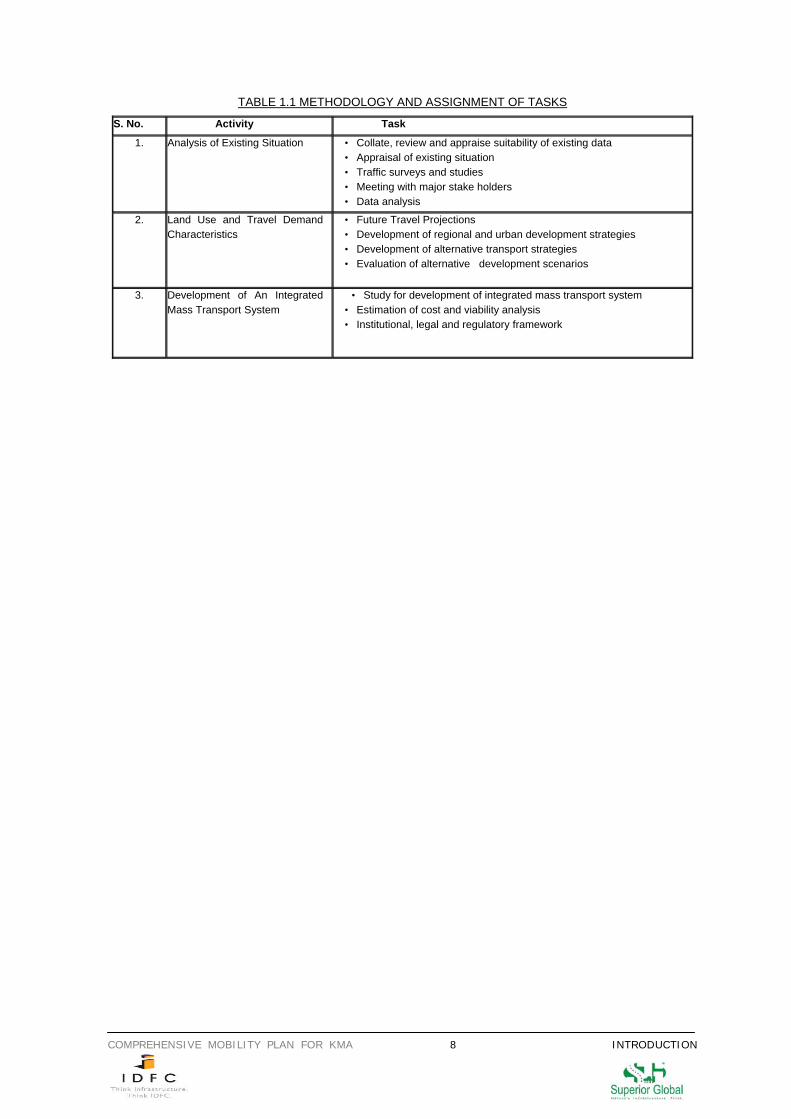
The following methodology has been derived to achieve the above mentioned objectives through a series of
interrelated tasks in a comprehensive manner:
COMPREHENSIVE MOBILITY PLAN FOR KMA 8 INTRODUCTION
TABLE 1.1 METHODOLOGY AND ASSIGNMENT OF TASKS
S. No. Activity Task
1. Analysis of Existing Situation • Collate, review and appraise suitability of existing data • Appraisal of existing situation • Traffic surveys and studies • Meeting with major stake holders • Data analysis
2. Land Use and Travel Demand Characteristics
• Future Travel Projections • Development of regional and urban development strategies • Development of alternative transport strategies • Evaluation of alternative development scenarios
3. Development of An Integrated Mass Transport System
• Study for development of integrated mass transport system • Estimation of cost and viability analysis • Institutional, legal and regulatory framework
COMPREHENSIVE MOBILITY PLAN FOR KMA 9 STUDY AREA CHARACTERISTICS
CHAPTER 2
STUDY AREA CHARACTERISTICS
2.1 REGIONAL SIGNIFICANCE OF KMA The study area, Kolkata Metropolitan Area (KMA) is essentially the metropolitan outfit of the city of Kolkata
and has evolved over an extended period of time. With a vast hinterland and an industrial core, KMA acts as
the main producer and distributor of goods and services in the Eastern Region. Some of the key functions
related to development of the entire country that Kolkata provides are:
i) Acting as the national centre of economic activities including industry, trade and commerce;
ii) Acting as the main centre of capital market for the entire eastern region;
iii) Functioning as a very important regional, national and international node for traffic and transport —
both passenger and freight;
iv) Providing the location for regional headquarters for several Central Government Organisations;
v) Acting as the nerve centre for cultural and recreational activities;
The KMA is also a major manufacturing hub of West Bengal with 90% of jute making capacity and 60% each
of rubber footwear, wagon building and tyre and tube industries, 61% of registered factories in the chemical
industry, 91% of registered factories in the cotton textile industries, 84% of units producing industrial
machinery and 92% of units manufacturing non-electrical machinery; being located in this area.
The KMA is important not only for the 16.69 million people who reside there, but it is also has a regional
significance extending not only to the eastern region but to the whole country. The KMA is surrounded by
areas richly endowed with natural resources - abundant supplies of coal are found in West Bengal and
Jharkhand in addition to the rich deposits of iron ore, manganese, limestone and other minerals found in
northern parts of Orissa. Predominance of these mineral and fossil fuel deposits form the basis for India’s
biggest industrial belt and the centre for India’s iron and steel industry with KMA playing the pivotal role in the
region. KMA, thus, acts as the nerve centre providing the lifelines that link the country together.
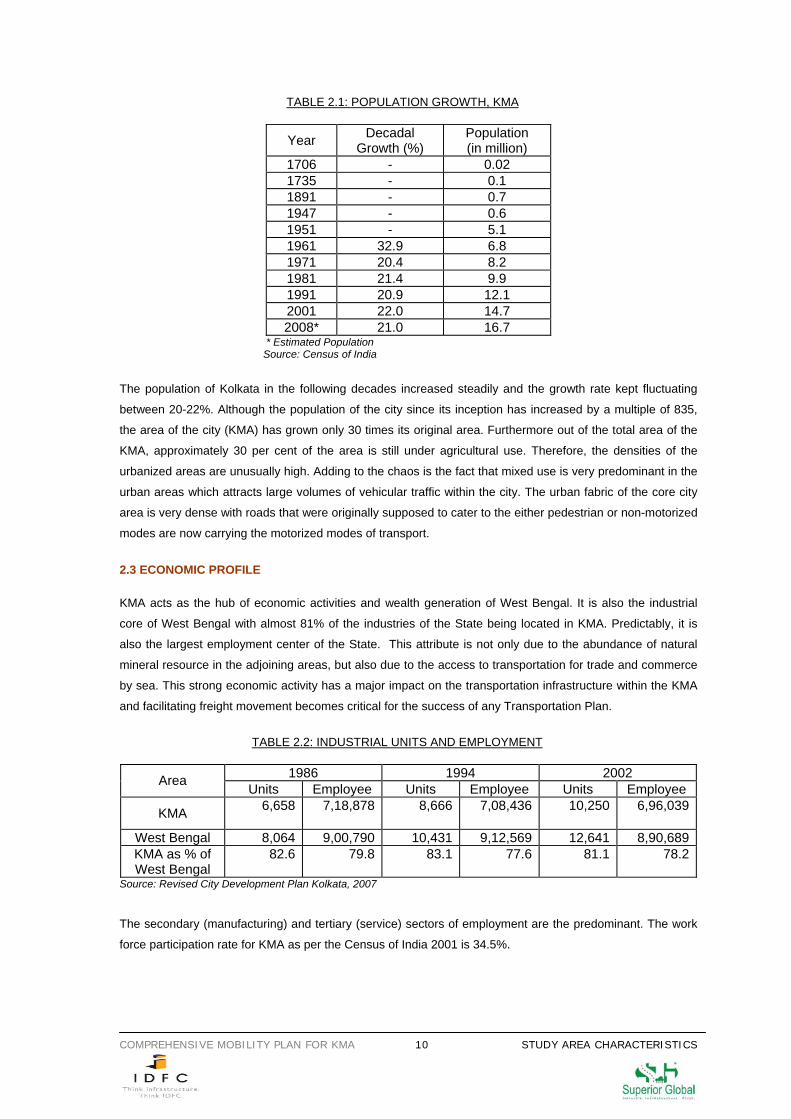
2.2 POPULATION GROWTH The estimated population for 2008 is 16.69 million. Table 2.1 shows the population and decadal growth of
KMA. The population of Kolkata is increased manifold since it’s creation in 1706. A marked increase in population took place from 1947 to 1951, where within a period of five years, Kolkata’s population grew 5.5 times because of the huge refugee influx after the partition of India. The partition also had a
great impact on the trade arrangements between the trilogy formed by the Kolkata, Khulna and Chittagong
ports. After the partition, India lost Khulna and Chittagong as supplements to Kolkata Port. As a result, the
significance of Kolkata Port for trading greatly increased and a large number of ports on the East Coast of
India (Vishakapatnam and Paradip) were developed in terms of equality of market choices. Consequently,
the economic base of Kolkata broadened and the employment opportunities increased, thereby increasing
the migration into the city.
COMPREHENSIVE MOBILITY PLAN FOR KMA 10 STUDY AREA CHARACTERISTICS
TABLE 2.1: POPULATION GROWTH, KMA
Year Decadal Growth (%)
Population (in million)
1706 - 0.02 1735 - 0.1 1891 - 0.7 1947 - 0.6 1951 - 5.1 1961 32.9 6.8 1971 20.4 8.2 1981 21.4 9.9 1991 20.9 12.1 2001 22.0 14.7 2008* 21.0 16.7
* Estimated Population Source: Census of India The population of Kolkata in the following decades increased steadily and the growth rate kept fluctuating
between 20-22%. Although the population of the city since its inception has increased by a multiple of 835,
the area of the city (KMA) has grown only 30 times its original area. Furthermore out of the total area of the
KMA, approximately 30 per cent of the area is still under agricultural use. Therefore, the densities of the
urbanized areas are unusually high. Adding to the chaos is the fact that mixed use is very predominant in the
urban areas which attracts large volumes of vehicular traffic within the city. The urban fabric of the core city
area is very dense with roads that were originally supposed to cater to the either pedestrian or non-motorized
modes are now carrying the motorized modes of transport.
2.3 ECONOMIC PROFILE
KMA acts as the hub of economic activities and wealth generation of West Bengal. It is also the industrial
core of West Bengal with almost 81% of the industries of the State being located in KMA. Predictably, it is
also the largest employment center of the State. This attribute is not only due to the abundance of natural
mineral resource in the adjoining areas, but also due to the access to transportation for trade and commerce
by sea. This strong economic activity has a major impact on the transportation infrastructure within the KMA
and facilitating freight movement becomes critical for the success of any Transportation Plan.
TABLE 2.2: INDUSTRIAL UNITS AND EMPLOYMENT
1986 1994 2002 Area Units Employee Units Employee Units Employee
KMA 6,658 7,18,878 8,666 7,08,436 10,250 6,96,039
West Bengal 8,064 9,00,790 10,431 9,12,569 12,641 8,90,689KMA as % of West Bengal
82.6 79.8 83.1 77.6 81.1 78.2
Source: Revised City Development Plan Kolkata, 2007
The secondary (manufacturing) and tertiary (service) sectors of employment are the predominant. The work
force participation rate for KMA as per the Census of India 2001 is 34.5%.
COMPREHENSIVE MOBILITY PLAN FOR KMA 11 STUDY AREA CHARACTERISTICS
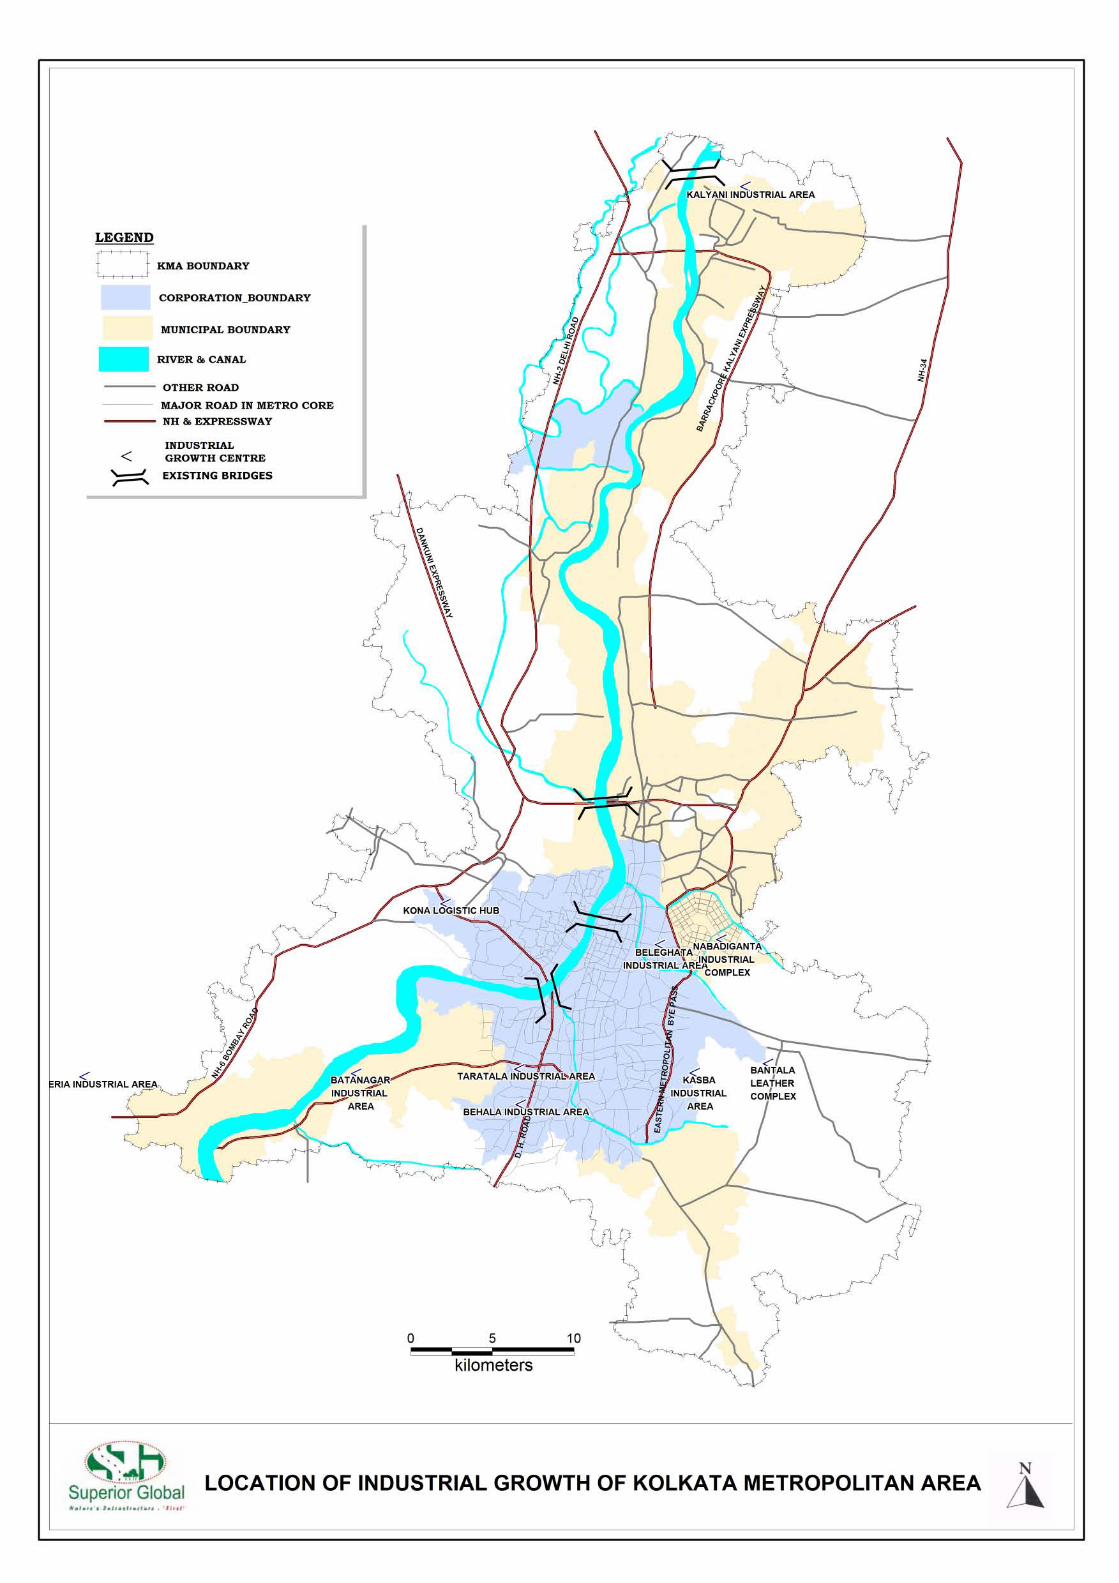
Based on the number of units set up in the KMA and consequent investment during the period 2003-05, the
KMA is a preferred destination for setting up the industrial units. The KMA industrial profile is dominated by
basic metal and alloy industries, metal product and parts, machinery and machine tools, rubber and plastic
industries, jute textiles, cotton textiles and leather and leather products. These kinds of industries are capital
intensive and are in fact, the most polluting industries. Inequitable regional development is also one of the
main reasons for the concentration of development activities, industrial and others in the KMA (refer map
“Location of Industrial Growth of KMA”).
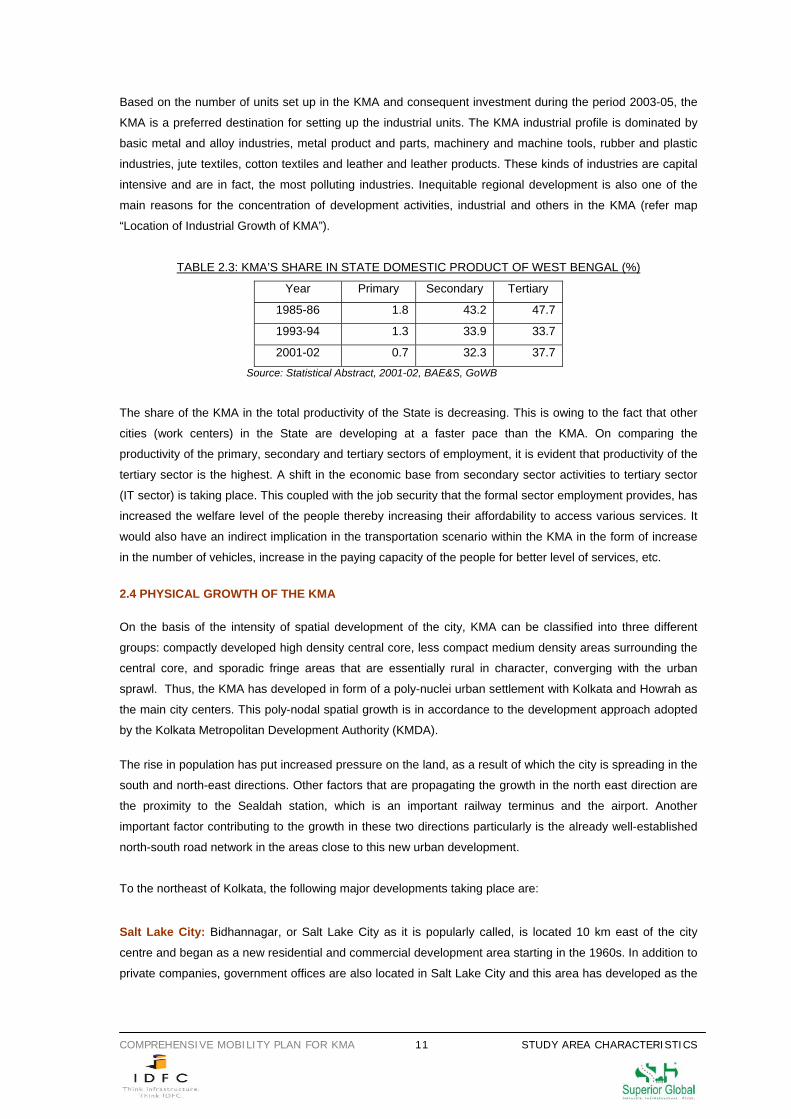
TABLE 2.3: KMA’S SHARE IN STATE DOMESTIC PRODUCT OF WEST BENGAL (%)
Year Primary Secondary Tertiary
1985-86 1.8 43.2 47.7
1993-94 1.3 33.9 33.7
2001-02 0.7 32.3 37.7
Source: Statistical Abstract, 2001-02, BAE&S, GoWB
The share of the KMA in the total productivity of the State is decreasing. This is owing to the fact that other
cities (work centers) in the State are developing at a faster pace than the KMA. On comparing the
productivity of the primary, secondary and tertiary sectors of employment, it is evident that productivity of the
tertiary sector is the highest. A shift in the economic base from secondary sector activities to tertiary sector
(IT sector) is taking place. This coupled with the job security that the formal sector employment provides, has
increased the welfare level of the people thereby increasing their affordability to access various services. It
would also have an indirect implication in the transportation scenario within the KMA in the form of increase
in the number of vehicles, increase in the paying capacity of the people for better level of services, etc.
2.4 PHYSICAL GROWTH OF THE KMA On the basis of the intensity of spatial development of the city, KMA can be classified into three different
groups: compactly developed high density central core, less compact medium density areas surrounding the
central core, and sporadic fringe areas that are essentially rural in character, converging with the urban
sprawl. Thus, the KMA has developed in form of a poly-nuclei urban settlement with Kolkata and Howrah as
the main city centers. This poly-nodal spatial growth is in accordance to the development approach adopted
by the Kolkata Metropolitan Development Authority (KMDA).
The rise in population has put increased pressure on the land, as a result of which the city is spreading in the
south and north-east directions. Other factors that are propagating the growth in the north east direction are
the proximity to the Sealdah station, which is an important railway terminus and the airport. Another
important factor contributing to the growth in these two directions particularly is the already well-established
north-south road network in the areas close to this new urban development.
To the northeast of Kolkata, the following major developments taking place are:
Salt Lake City: Bidhannagar, or Salt Lake City as it is popularly called, is located 10 km east of the city
centre and began as a new residential and commercial development area starting in the 1960s. In addition to
private companies, government offices are also located in Salt Lake City and this area has developed as the
COMPREHENSIVE MOBILITY PLAN FOR KMA 12 STUDY AREA CHARACTERISTICS
tertiary sector employment center in the city. The land area has almost doubled now with the inclusion of
Duttabad, Sukantanagar, Nayapatti and Mahishbathan.
Rajarhat New City: To the east of Salt Lake City, a new township called Rajarhat New City is being
developed. The planned area will consist of a commercial/residential development as well as a natural
reserve park and sports complex. Some roads and new buildings are currently under construction.
To the south of Kolkata, the following development is taking place:
Dankuni, South 24 Parganas: This development is predominantly residential and the proposed employment
center for this area is industrial in nature. The industries coming up in Dankuni are related to agro-food
processing, leather processing and products, chemical and pharmaceuticals, plastic products, IT and ITeS,
animal husbandry etc.
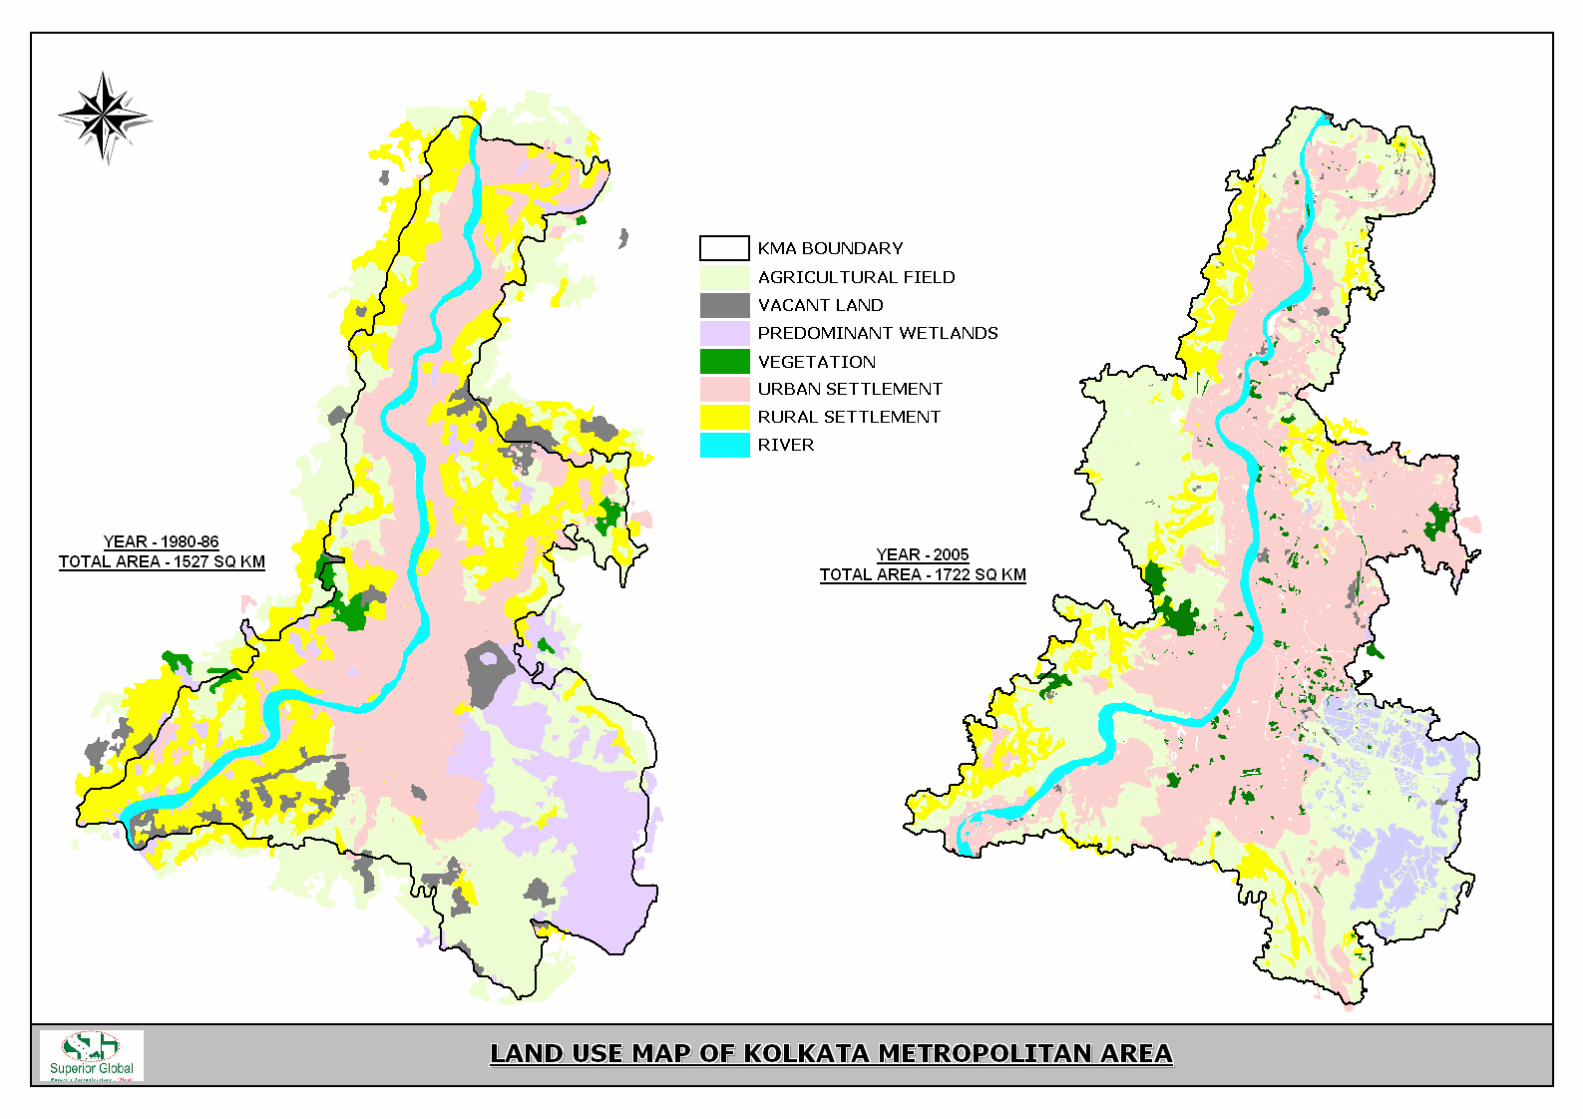
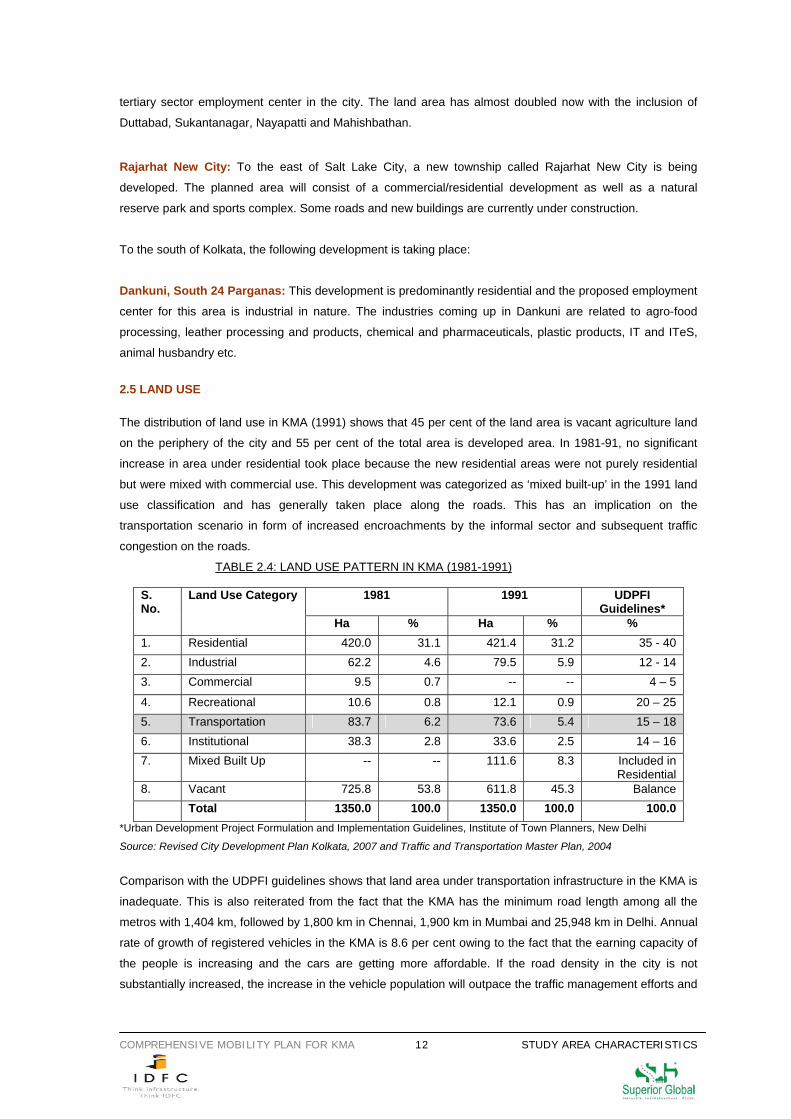
2.5 LAND USE The distribution of land use in KMA (1991) shows that 45 per cent of the land area is vacant agriculture land
on the periphery of the city and 55 per cent of the total area is developed area. In 1981-91, no significant
increase in area under residential took place because the new residential areas were not purely residential
but were mixed with commercial use. This development was categorized as ‘mixed built-up’ in the 1991 land
use classification and has generally taken place along the roads. This has an implication on the
transportation scenario in form of increased encroachments by the informal sector and subsequent traffic
congestion on the roads.
TABLE 2.4: LAND USE PATTERN IN KMA (1981-1991)
1981 1991 UDPFI Guidelines*
S. No.
Land Use Category
Ha % Ha % % 1. Residential 420.0 31.1 421.4 31.2 35 - 40 2. Industrial 62.2 4.6 79.5 5.9 12 - 14 3. Commercial 9.5 0.7 -- -- 4 – 5
4. Recreational 10.6 0.8 12.1 0.9 20 – 25 5. Transportation 83.7 6.2 73.6 5.4 15 – 18 6. Institutional 38.3 2.8 33.6 2.5 14 – 16 7. Mixed Built Up -- -- 111.6 8.3 Included in
Residential 8. Vacant 725.8 53.8 611.8 45.3 Balance Total 1350.0 100.0 1350.0 100.0 100.0
*Urban Development Project Formulation and Implementation Guidelines, Institute of Town Planners, New Delhi
Source: Revised City Development Plan Kolkata, 2007 and Traffic and Transportation Master Plan, 2004
Comparison with the UDPFI guidelines shows that land area under transportation infrastructure in the KMA is
inadequate. This is also reiterated from the fact that the KMA has the minimum road length among all the
metros with 1,404 km, followed by 1,800 km in Chennai, 1,900 km in Mumbai and 25,948 km in Delhi. Annual
rate of growth of registered vehicles in the KMA is 8.6 per cent owing to the fact that the earning capacity of
the people is increasing and the cars are getting more affordable. If the road density in the city is not
substantially increased, the increase in the vehicle population will outpace the traffic management efforts and
COMPREHENSIVE MOBILITY PLAN FOR KMA 13 STUDY AREA CHARACTERISTICS
the transportation situation will deteriorate further. The lack of road density of KMA is also due to the fact that
the core city was never envisaged to become the burgeoning metropolitan that it is today. The roads of the
core city area were always meant for pedestrian movement and for hand drawn or horse drawn carts. These
same roads, with their narrow widths, cater to the fast moving contemporary modes of transport which is the
root cause of most congestion related transportation problems of the modern day Kolkata.
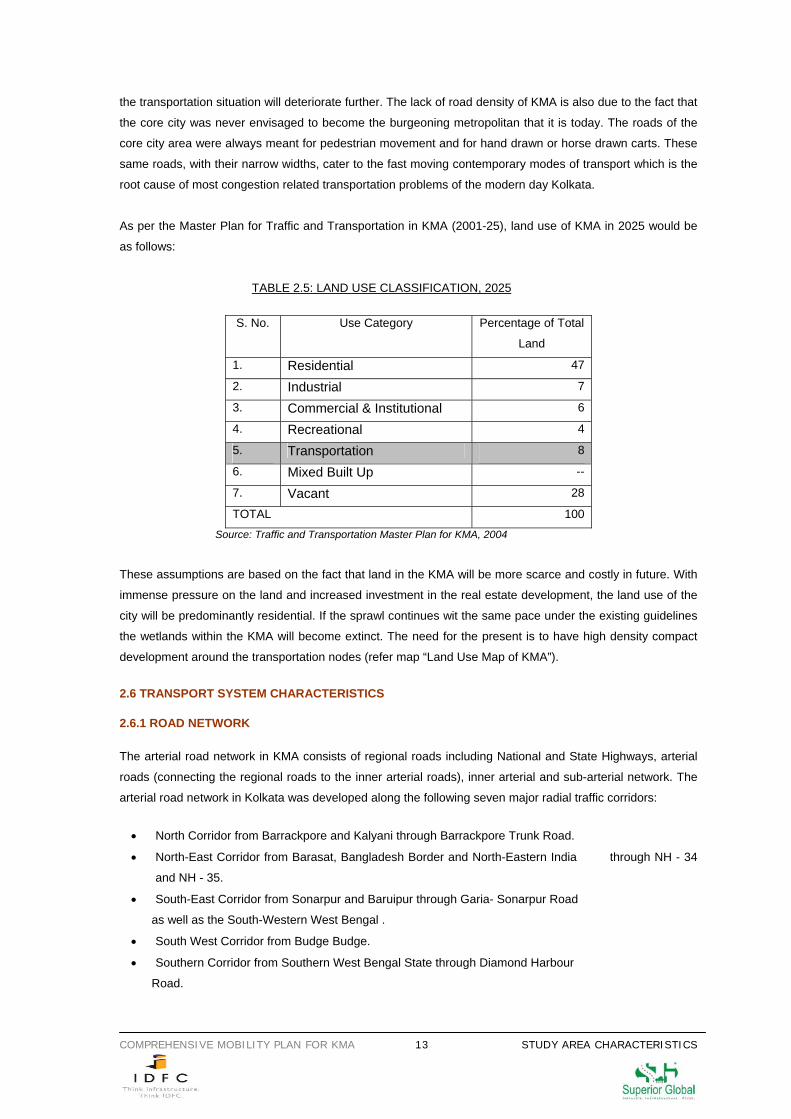
As per the Master Plan for Traffic and Transportation in KMA (2001-25), land use of KMA in 2025 would be
as follows:
TABLE 2.5: LAND USE CLASSIFICATION, 2025
S. No. Use Category Percentage of Total
Land
1. Residential 47
2. Industrial 7
3. Commercial & Institutional 6
4. Recreational 4
5. Transportation 8
6. Mixed Built Up --
7. Vacant 28
TOTAL 100
Source: Traffic and Transportation Master Plan for KMA, 2004
These assumptions are based on the fact that land in the KMA will be more scarce and costly in future. With
immense pressure on the land and increased investment in the real estate development, the land use of the
city will be predominantly residential. If the sprawl continues wit the same pace under the existing guidelines
the wetlands within the KMA will become extinct. The need for the present is to have high density compact
development around the transportation nodes (refer map “Land Use Map of KMA”).
2.6 TRANSPORT SYSTEM CHARACTERISTICS
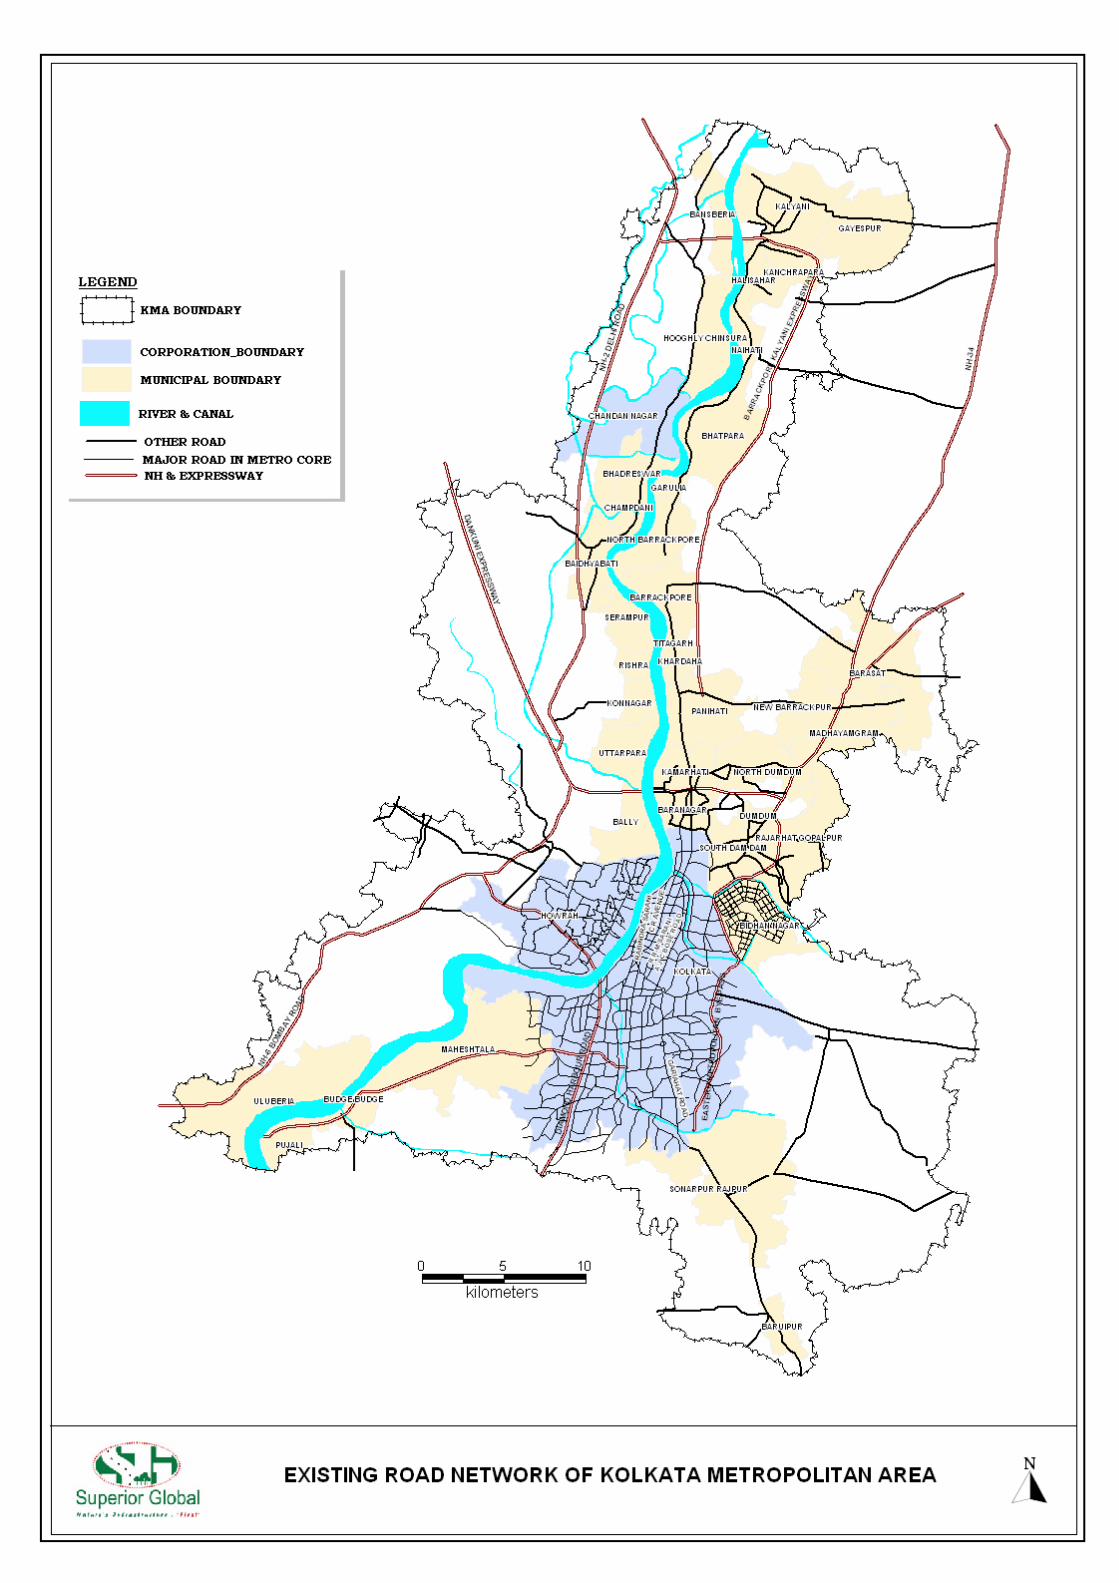
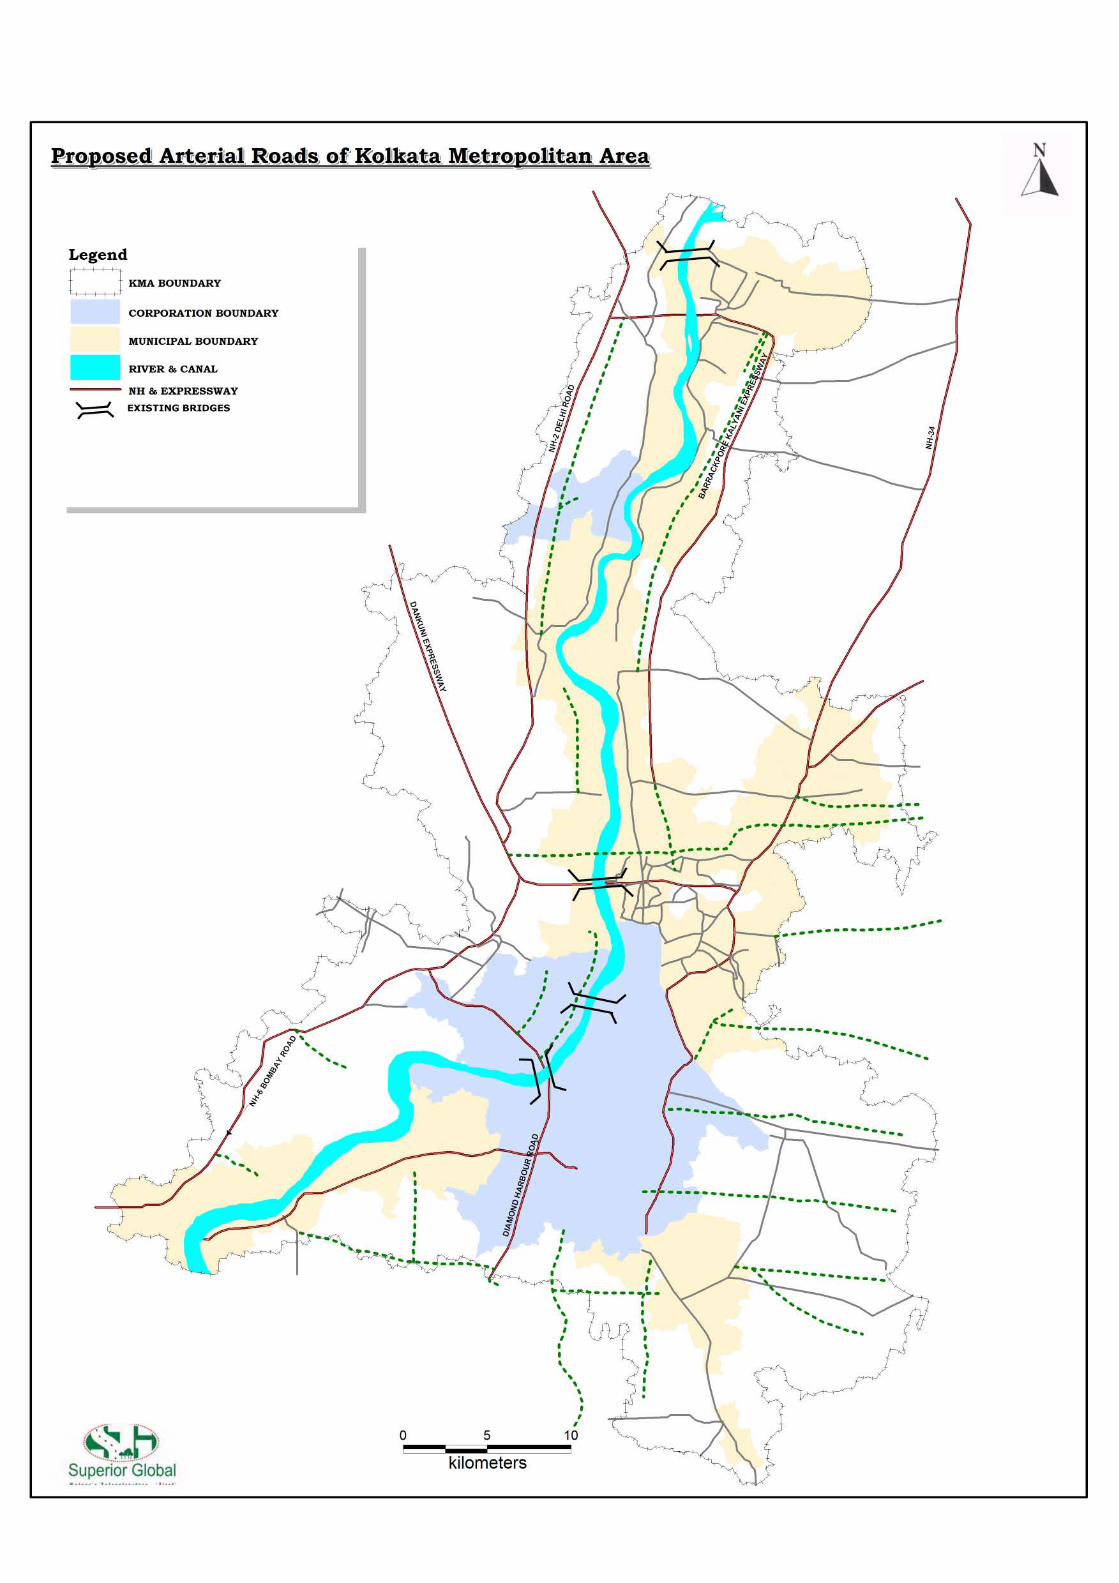
2.6.1 ROAD NETWORK The arterial road network in KMA consists of regional roads including National and State Highways, arterial
roads (connecting the regional roads to the inner arterial roads), inner arterial and sub-arterial network. The
arterial road network in Kolkata was developed along the following seven major radial traffic corridors:
• North Corridor from Barrackpore and Kalyani through Barrackpore Trunk Road.
• North-East Corridor from Barasat, Bangladesh Border and North-Eastern India through NH - 34
and NH - 35.
• South-East Corridor from Sonarpur and Baruipur through Garia- Sonarpur Road
as well as the South-Western West Bengal .
• South West Corridor from Budge Budge.
• Southern Corridor from Southern West Bengal State through Diamond Harbour
Road.
COMPREHENSIVE MOBILITY PLAN FOR KMA 14 STUDY AREA CHARACTERISTICS
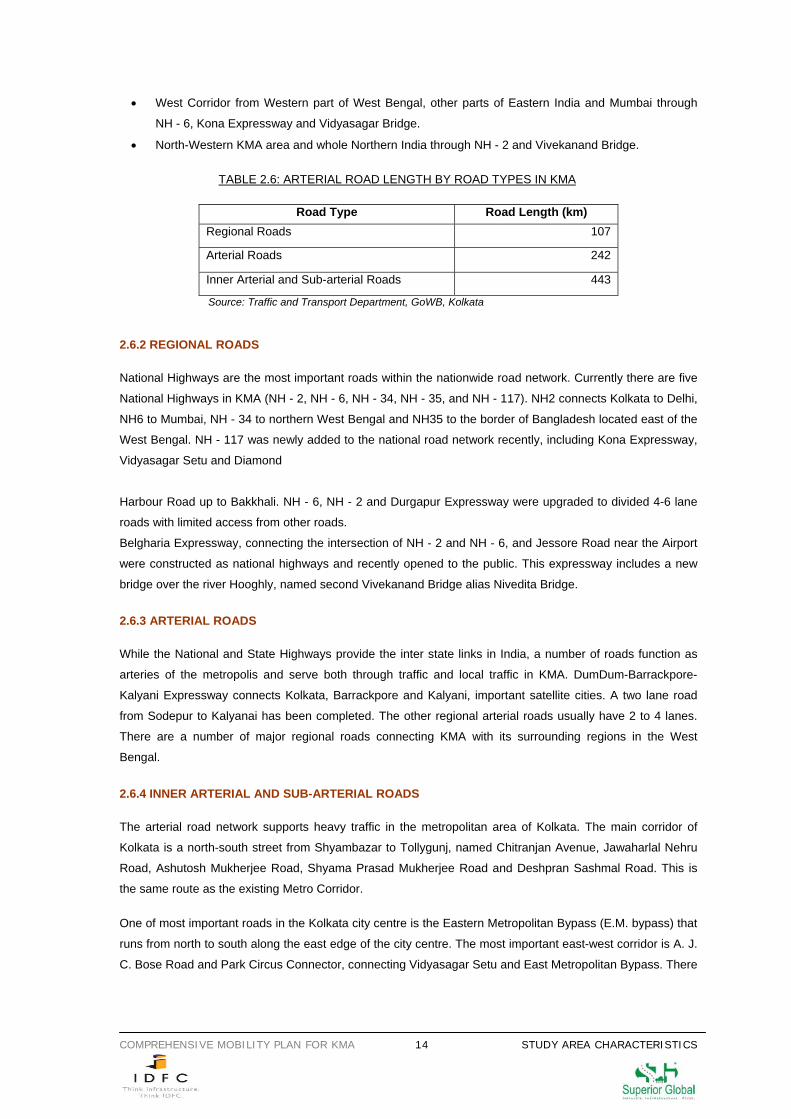
• West Corridor from Western part of West Bengal, other parts of Eastern India and Mumbai through
NH - 6, Kona Expressway and Vidyasagar Bridge.
• North-Western KMA area and whole Northern India through NH - 2 and Vivekanand Bridge.
TABLE 2.6: ARTERIAL ROAD LENGTH BY ROAD TYPES IN KMA
Road Type Road Length (km)
Regional Roads 107
Arterial Roads 242
Inner Arterial and Sub-arterial Roads 443
Source: Traffic and Transport Department, GoWB, Kolkata
2.6.2 REGIONAL ROADS National Highways are the most important roads within the nationwide road network. Currently there are five
National Highways in KMA (NH - 2, NH - 6, NH - 34, NH - 35, and NH - 117). NH2 connects Kolkata to Delhi,
NH6 to Mumbai, NH - 34 to northern West Bengal and NH35 to the border of Bangladesh located east of the
West Bengal. NH - 117 was newly added to the national road network recently, including Kona Expressway,
Vidyasagar Setu and Diamond
Harbour Road up to Bakkhali. NH - 6, NH - 2 and Durgapur Expressway were upgraded to divided 4-6 lane
roads with limited access from other roads.
Belgharia Expressway, connecting the intersection of NH - 2 and NH - 6, and Jessore Road near the Airport
were constructed as national highways and recently opened to the public. This expressway includes a new
bridge over the river Hooghly, named second Vivekanand Bridge alias Nivedita Bridge.
2.6.3 ARTERIAL ROADS While the National and State Highways provide the inter state links in India, a number of roads function as
arteries of the metropolis and serve both through traffic and local traffic in KMA. DumDum-Barrackpore-
Kalyani Expressway connects Kolkata, Barrackpore and Kalyani, important satellite cities. A two lane road
from Sodepur to Kalyanai has been completed. The other regional arterial roads usually have 2 to 4 lanes.
There are a number of major regional roads connecting KMA with its surrounding regions in the West
Bengal.
2.6.4 INNER ARTERIAL AND SUB-ARTERIAL ROADS The arterial road network supports heavy traffic in the metropolitan area of Kolkata. The main corridor of
Kolkata is a north-south street from Shyambazar to Tollygunj, named Chitranjan Avenue, Jawaharlal Nehru
Road, Ashutosh Mukherjee Road, Shyama Prasad Mukherjee Road and Deshpran Sashmal Road. This is
the same route as the existing Metro Corridor.
One of most important roads in the Kolkata city centre is the Eastern Metropolitan Bypass (E.M. bypass) that
runs from north to south along the east edge of the city centre. The most important east-west corridor is A. J.
C. Bose Road and Park Circus Connector, connecting Vidyasagar Setu and East Metropolitan Bypass. There
COMPREHENSIVE MOBILITY PLAN FOR KMA 15 STUDY AREA CHARACTERISTICS
are several other north south and east west streets in the city centre. However, most of the arterial roads are
undivided 4 lane roads.
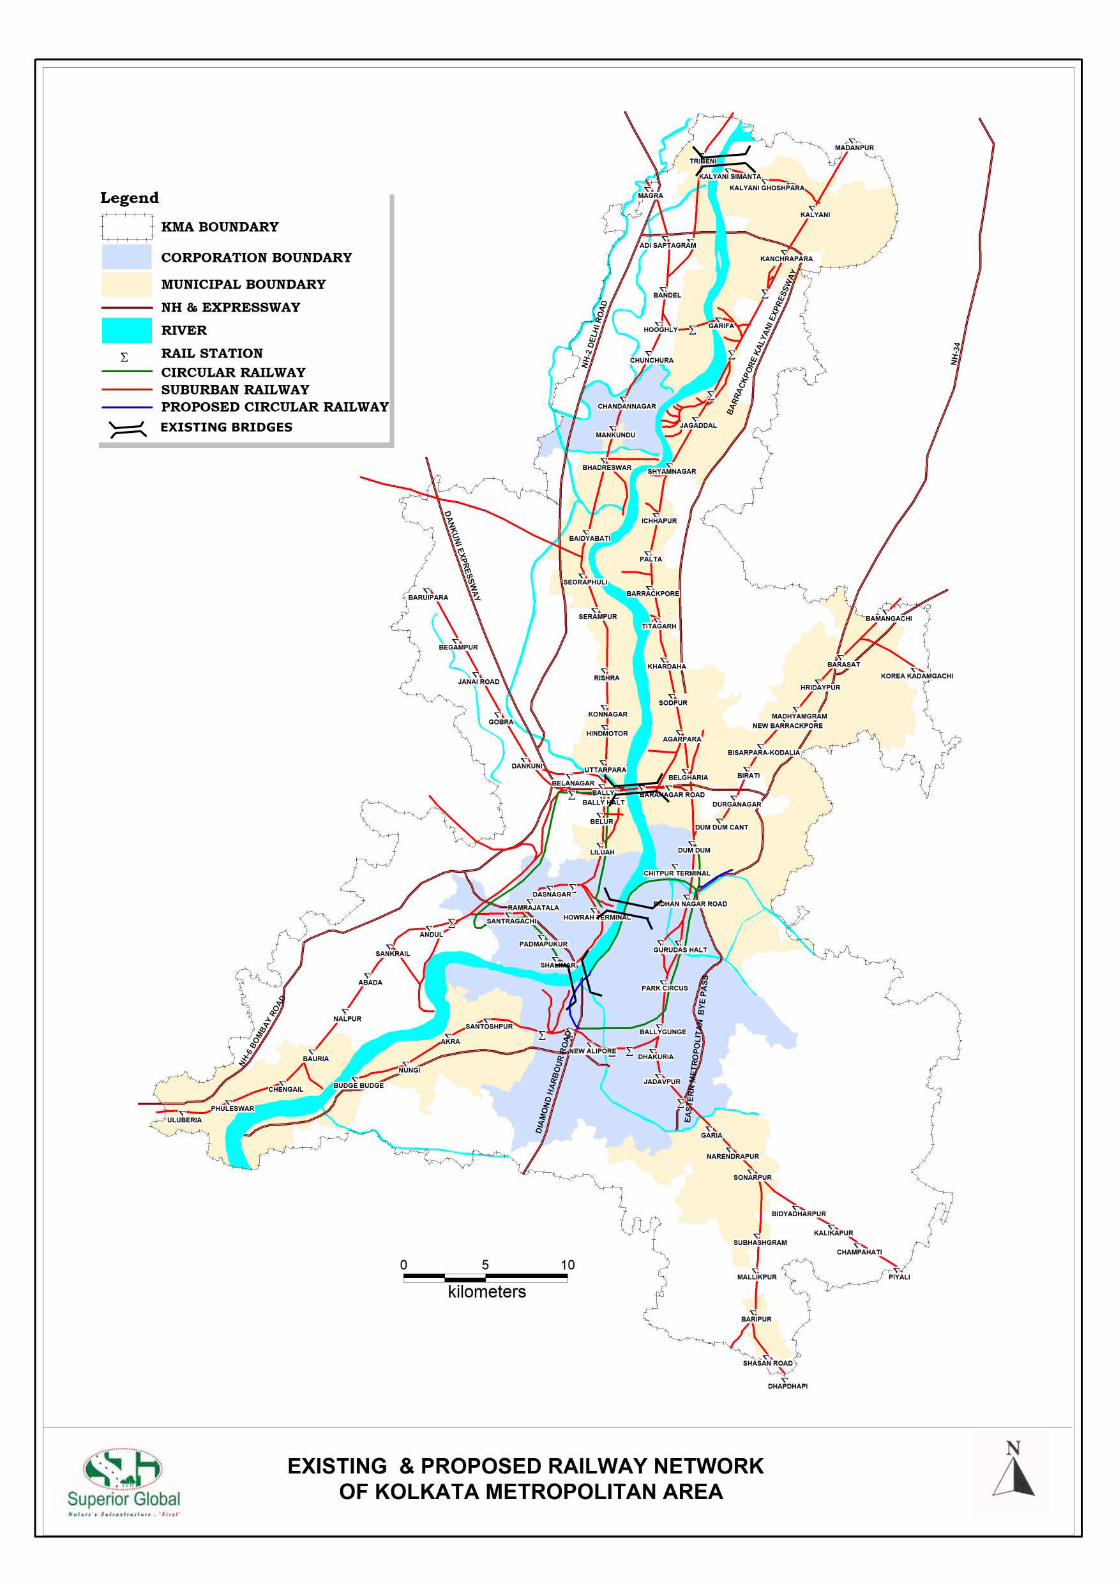
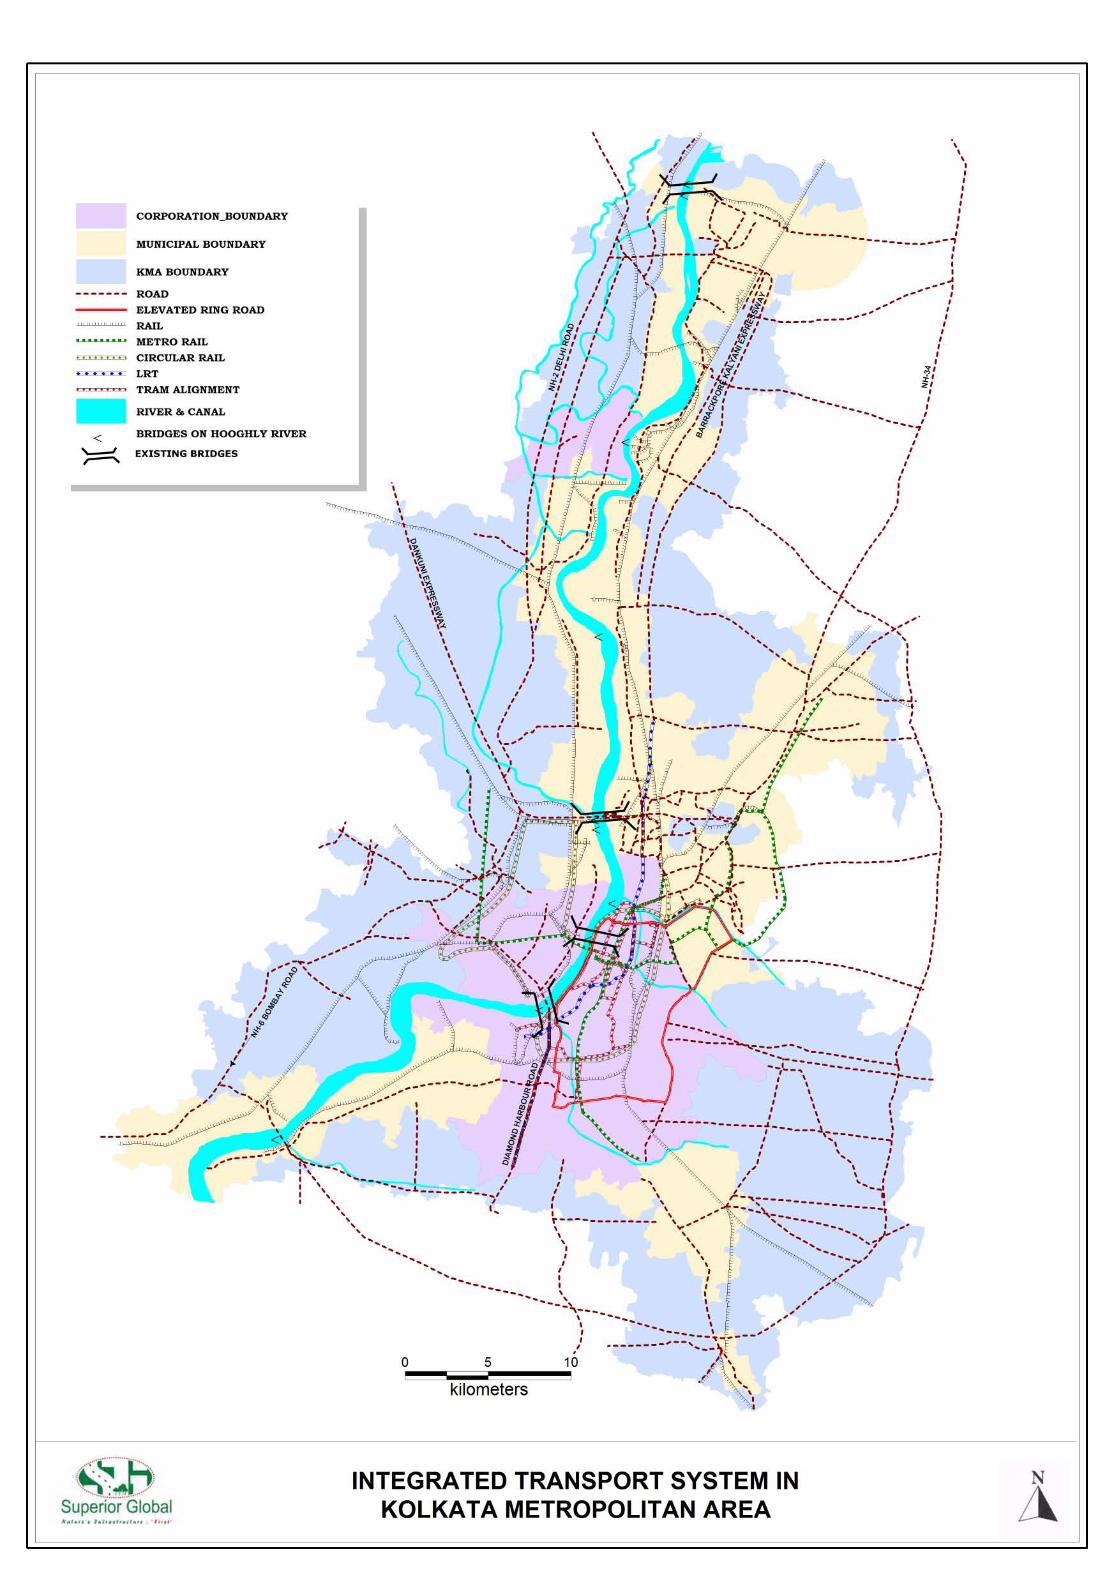
2.6.2 RAIL SYSTEM The rail lines are divided into the suburban railway (Eastern Railway lines; South-Eastern Railway line),
Circular Railway line, and the metro railway line. The rail infrastructure has generally been developed along
the north south city axis in parallel with the growth of the city in these directions. Relatively little infrastructure
accommodates travel on the east west plane despite the rapid expansion that is taking place in this direction
and the resulting increase in trip patterns.
2.6.3 WATER TRANSPORT SYSTEM The River Hooghly runs in the north-south direction dividing the city into two halves. It offers enormous
potential for north-south passenger movement and for improved river crossing facilities to connect Kolkata
with Howrah. Existing cross-river links already provide a much needed service that is efficient but one that
could be improved by full integration into a north-south service. KMA has a system of canals and waterways
that has potential to provide passenger and freight transport for the whole of KMA. In a city where the most
often quoted complaints are about congestion and lack of road space the use of the river and waterways in
combination has enormous potential to improve quality of life and transport choices for the citizens of
Calcutta.
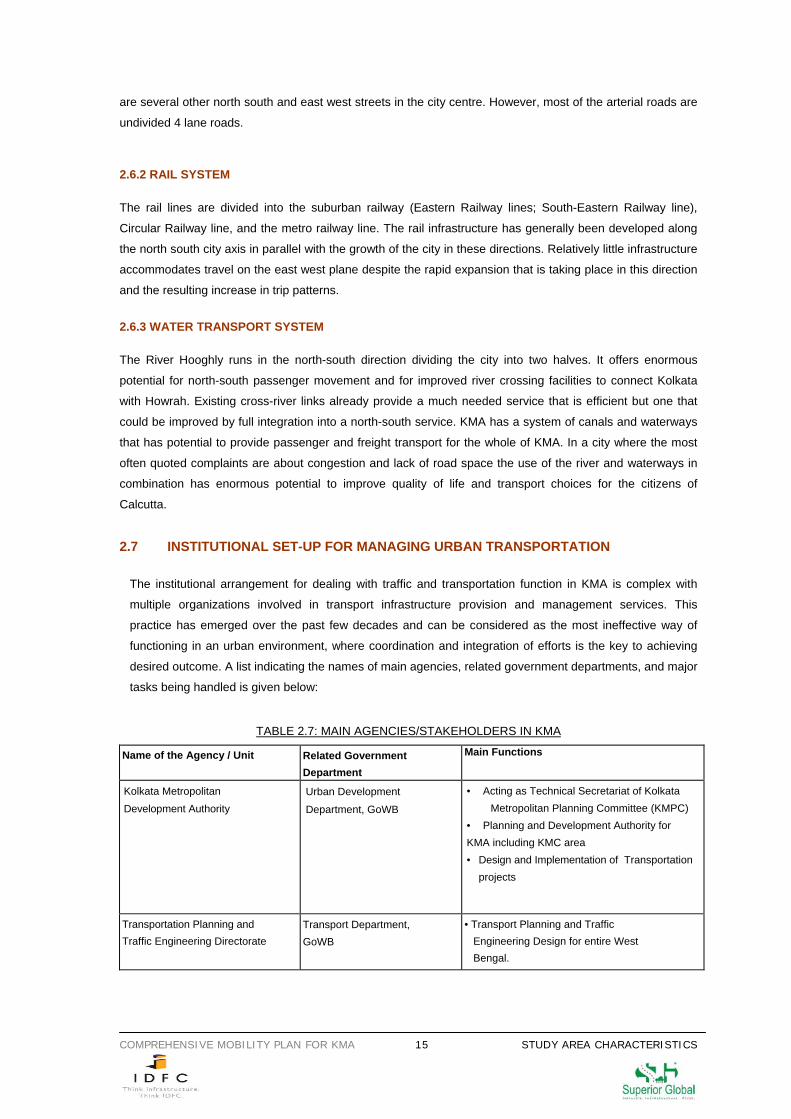
2.7 INSTITUTIONAL SET-UP FOR MANAGING URBAN TRANSPORTATION
The institutional arrangement for dealing with traffic and transportation function in KMA is complex with
multiple organizations involved in transport infrastructure provision and management services. This
practice has emerged over the past few decades and can be considered as the most ineffective way of
functioning in an urban environment, where coordination and integration of efforts is the key to achieving
desired outcome. A list indicating the names of main agencies, related government departments, and major
tasks being handled is given below:
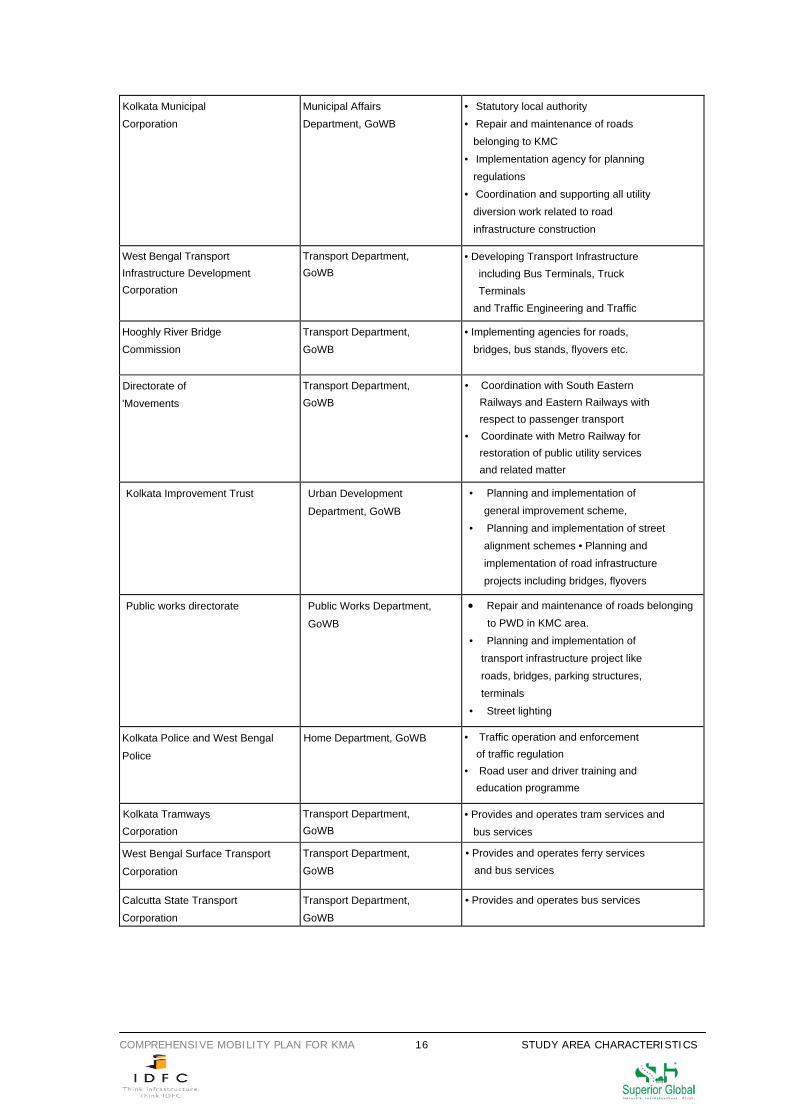
TABLE 2.7: MAIN AGENCIES/STAKEHOLDERS IN KMA
Name of the Agency / Unit Related Government Department
Main Functions
Kolkata Metropolitan Development Authority
Urban Development
Department, GoWB
• Acting as Technical Secretariat of Kolkata Metropolitan Planning Committee (KMPC)
• Planning and Development Authority for KMA including KMC area • Design and Implementation of Transportation
projects
Transportation Planning and Traffic Engineering Directorate
Transport Department, GoWB
• Transport Planning and Traffic Engineering Design for entire West Bengal.
COMPREHENSIVE MOBILITY PLAN FOR KMA 16 STUDY AREA CHARACTERISTICS
Kolkata Municipal Corporation
Municipal Affairs Department, GoWB
• Statutory local authority • Repair and maintenance of roads belonging to KMC • Implementation agency for planning regulations • Coordination and supporting all utility diversion work related to road infrastructure construction
West Bengal Transport Infrastructure Development Corporation
Transport Department, GoWB
• Developing Transport Infrastructure including Bus Terminals, Truck Terminals
and Traffic Engineering and Traffic
Hooghly River Bridge Commission
Transport Department, GoWB
• Implementing agencies for roads, bridges, bus stands, flyovers etc.
Directorate of 'Movements
Transport Department, GoWB
• Coordination with South Eastern Railways and Eastern Railways with respect to passenger transport • Coordinate with Metro Railway for restoration of public utility services and related matter
Kolkata Improvement Trust Urban Development
Department, GoWB
• Planning and implementation of general improvement scheme, • Planning and implementation of street alignment schemes • Planning and implementation of road infrastructure projects including bridges, flyovers
Public works directorate Public Works Department,
GoWB
• Repair and maintenance of roads belonging to PWD in KMC area.
• Planning and implementation of transport infrastructure project like roads, bridges, parking structures, terminals • Street lighting
Kolkata Police and West Bengal
Police
Home Department, GoWB • Traffic operation and enforcement of traffic regulation • Road user and driver training and education programme
Kolkata Tramways Corporation
Transport Department, GoWB
• Provides and operates tram services and bus services
West Bengal Surface Transport
Corporation
Transport Department, GoWB
• Provides and operates ferry services and bus services
Calcutta State Transport Corporation
Transport Department, GoWB
• Provides and operates bus services
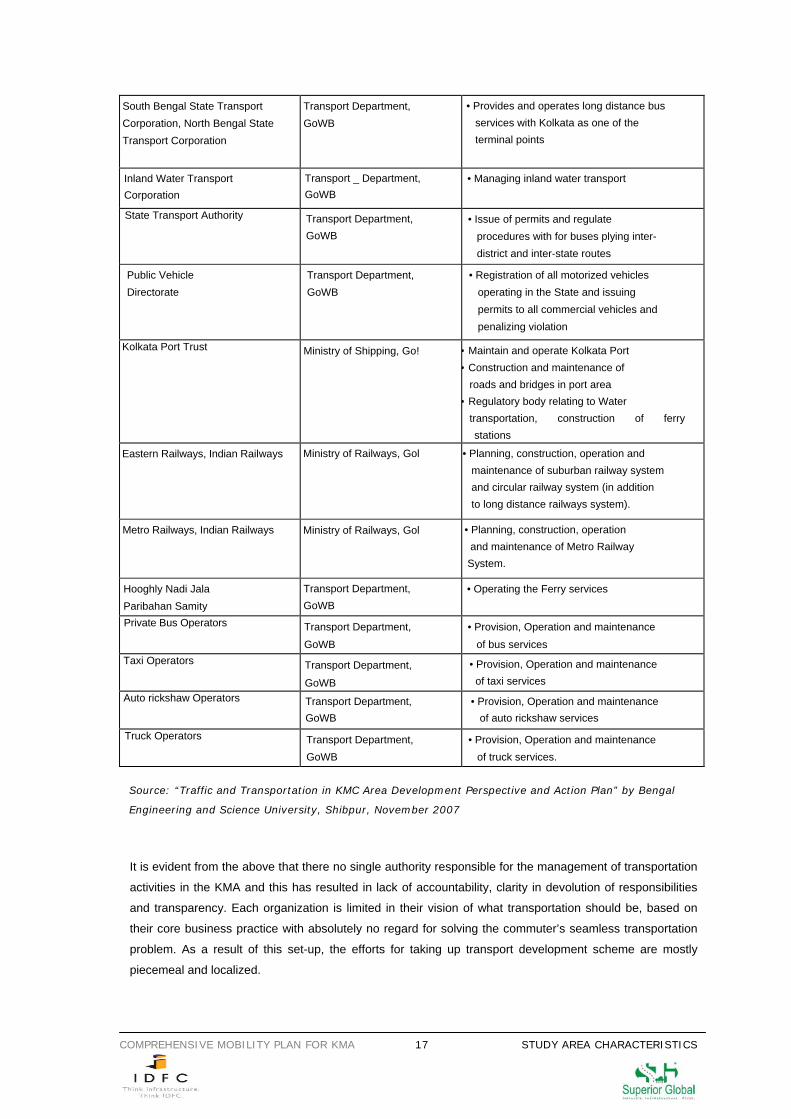
COMPREHENSIVE MOBILITY PLAN FOR KMA 17 STUDY AREA CHARACTERISTICS
South Bengal State Transport Corporation, North Bengal State Transport Corporation
Transport Department, GoWB
• Provides and operates long distance bus services with Kolkata as one of the terminal points
Inland Water Transport Corporation
Transport _ Department, GoWB
• Managing inland water transport
State Transport Authority Transport Department, GoWB
• Issue of permits and regulate procedures with for buses plying inter- district and inter-state routes
Public Vehicle Directorate
Transport Department, GoWB
• Registration of all motorized vehicles operating in the State and issuing permits to all commercial vehicles and penalizing violation
Kolkata Port Trust Ministry of Shipping, Go! • Maintain and operate Kolkata Port • Construction and maintenance of roads and bridges in port area
• Regulatory body relating to Water transportation, construction of ferry stations
Eastern Railways, Indian Railways Ministry of Railways, Gol • Planning, construction, operation and maintenance of suburban railway system and circular railway system (in addition to long distance railways system).
Metro Railways, Indian Railways Ministry of Railways, Gol • Planning, construction, operation and maintenance of Metro Railway System.
Hooghly Nadi Jala Paribahan Samity
Transport Department, GoWB
• Operating the Ferry services
Private Bus Operators Transport Department, GoWB
• Provision, Operation and maintenance of bus services
Taxi Operators Transport Department,
GoWB
• Provision, Operation and maintenance of taxi services
Auto rickshaw Operators Transport Department, GoWB
• Provision, Operation and maintenance of auto rickshaw services
Truck Operators Transport Department, GoWB
• Provision, Operation and maintenance of truck services.
It is evident from the above that there no single authority responsible for the management of transportation
activities in the KMA and this has resulted in lack of accountability, clarity in devolution of responsibilities
and transparency. Each organization is limited in their vision of what transportation should be, based on
their core business practice with absolutely no regard for solving the commuter’s seamless transportation
problem. As a result of this set-up, the efforts for taking up transport development scheme are mostly
piecemeal and localized.
Source: “Traffic and Transportation in KMC Area Development Perspective and Action Plan” by Bengal
Engineering and Science University, Shibpur, November 2007
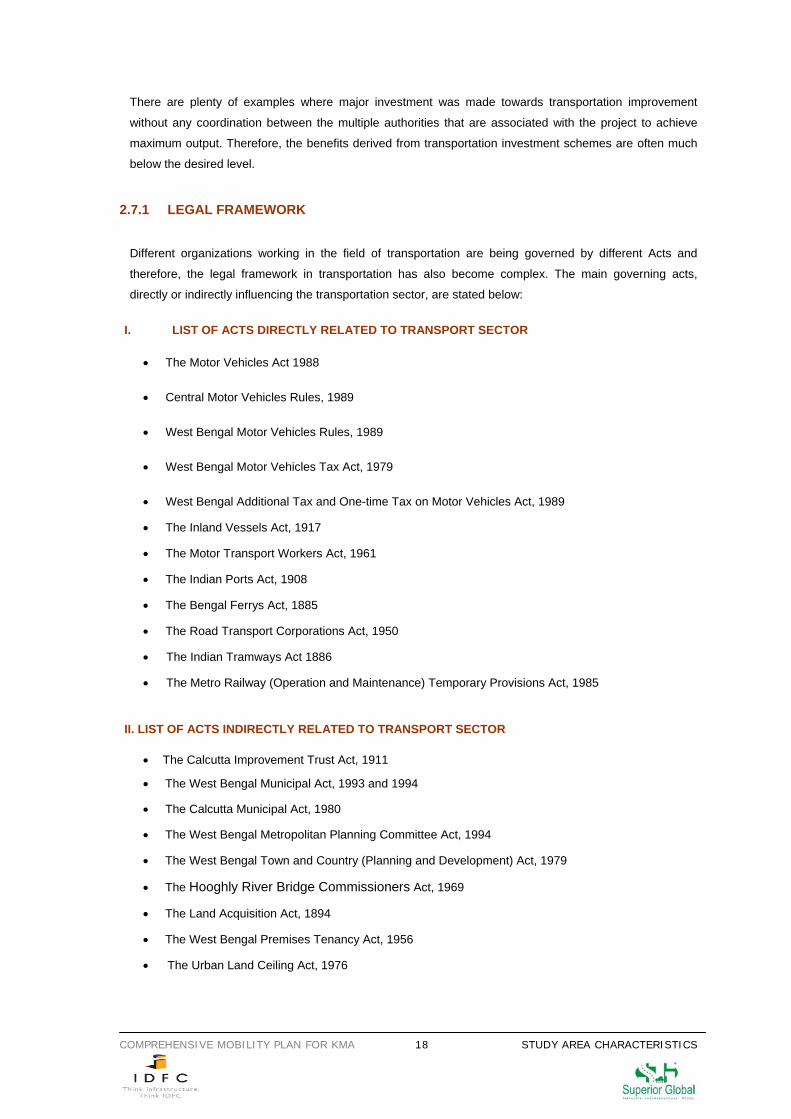
COMPREHENSIVE MOBILITY PLAN FOR KMA 18 STUDY AREA CHARACTERISTICS
There are plenty of examples where major investment was made towards transportation improvement
without any coordination between the multiple authorities that are associated with the project to achieve
maximum output. Therefore, the benefits derived from transportation investment schemes are often much
below the desired level.
2.7.1 LEGAL FRAMEWORK
Different organizations working in the field of transportation are being governed by different Acts and
therefore, the legal framework in transportation has also become complex. The main governing acts,
directly or indirectly influencing the transportation sector, are stated below:
I. LIST OF ACTS DIRECTLY RELATED TO TRANSPORT SECTOR
• The Motor Vehicles Act 1988
• Central Motor Vehicles Rules, 1989
• West Bengal Motor Vehicles Rules, 1989
• West Bengal Motor Vehicles Tax Act, 1979
• West Bengal Additional Tax and One-time Tax on Motor Vehicles Act, 1989
• The Inland Vessels Act, 1917
• The Motor Transport Workers Act, 1961
• The Indian Ports Act, 1908
• The Bengal Ferrys Act, 1885
• The Road Transport Corporations Act, 1950
• The Indian Tramways Act 1886
• The Metro Railway (Operation and Maintenance) Temporary Provisions Act, 1985
II. LIST OF ACTS INDIRECTLY RELATED TO TRANSPORT SECTOR
• The Calcutta Improvement Trust Act, 1911
• The West Bengal Municipal Act, 1993 and 1994
• The Calcutta Municipal Act, 1980
• The West Bengal Metropolitan Planning Committee Act, 1994
• The West Bengal Town and Country (Planning and Development) Act, 1979
• The Hooghly River Bridge Commissioners Act, 1969
• The Land Acquisition Act, 1894
• The West Bengal Premises Tenancy Act, 1956
• The Urban Land Ceiling Act, 1976
COMPREHENSIVE MOBILITY PLAN FOR KMA 19 STUDY AREA CHARACTERISTICS
• The Calcutta Police Act, 1886
• The 74th Constitution Amendment Act, 1992
The problems resulting from multiplicity of organizations in the transport sector have been compounded by
existence of a number of Acts governing, directly or indirectly, the transportation activities in the city. For
improvement of management and regulatory environment in transportation, the institutional and legal reform
measures are to be worked out together in a coordinated manner.
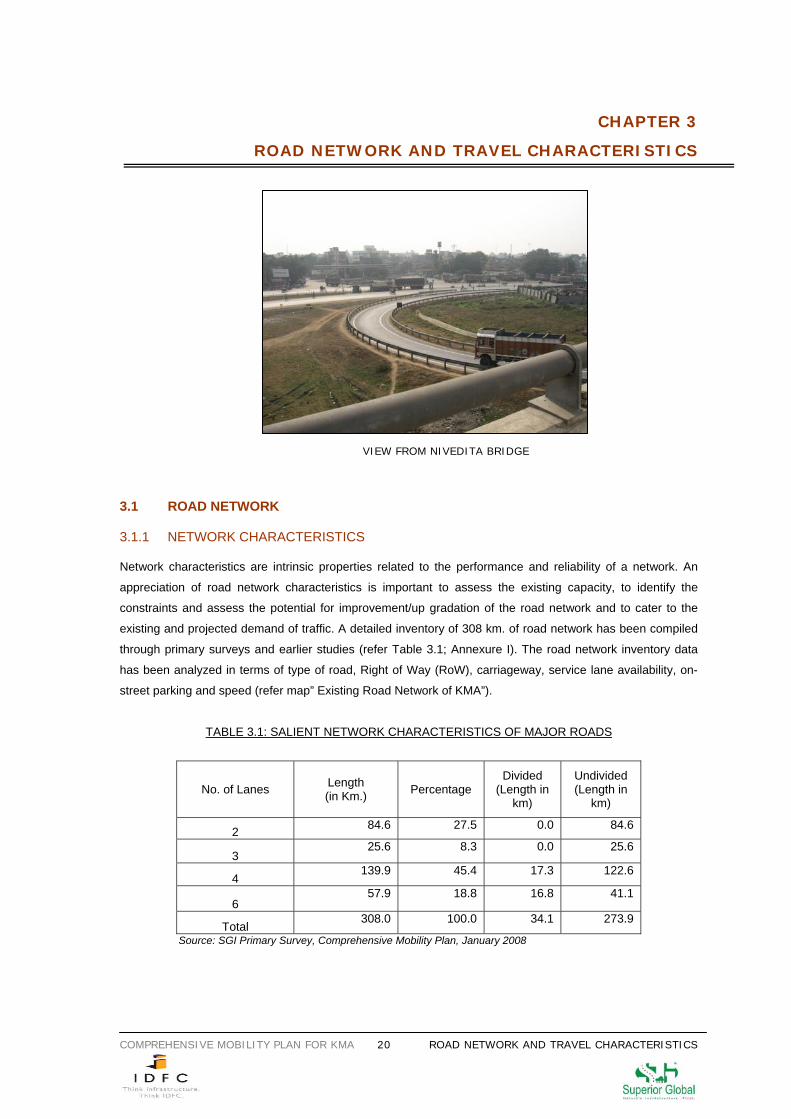
COMPREHENSIVE MOBILITY PLAN FOR KMA 20 ROAD NETWORK AND TRAVEL CHARACTERISTICS
CHAPTER 3
ROAD NETWORK AND TRAVEL CHARACTERISTICS
3.1 ROAD NETWORK 3.1.1 NETWORK CHARACTERISTICS Network characteristics are intrinsic properties related to the performance and reliability of a network. An
appreciation of road network characteristics is important to assess the existing capacity, to identify the
constraints and assess the potential for improvement/up gradation of the road network and to cater to the
existing and projected demand of traffic. A detailed inventory of 308 km. of road network has been compiled
through primary surveys and earlier studies (refer Table 3.1; Annexure I). The road network inventory data
has been analyzed in terms of type of road, Right of Way (RoW), carriageway, service lane availability, on-
street parking and speed (refer map” Existing Road Network of KMA”).
TABLE 3.1: SALIENT NETWORK CHARACTERISTICS OF MAJOR ROADS
No. of Lanes Length (in Km.) Percentage
Divided (Length in
km)
Undivided (Length in
km)
2 84.6 27.5 0.0 84.6
3 25.6 8.3 0.0 25.6
4 139.9 45.4 17.3 122.6
6 57.9 18.8 16.8 41.1
Total 308.0 100.0 34.1 273.9
Source: SGI Primary Survey, Comprehensive Mobility Plan, January 2008
VIEW FROM NIVEDITA BRIDGE
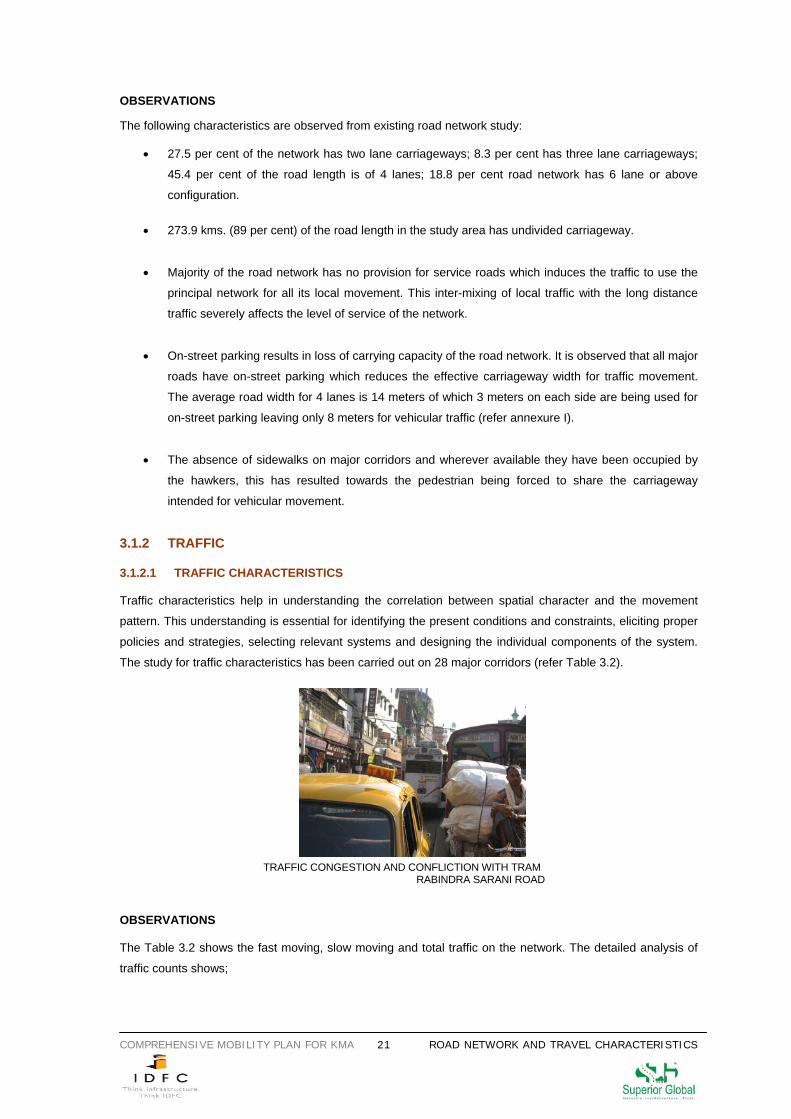
COMPREHENSIVE MOBILITY PLAN FOR KMA 21 ROAD NETWORK AND TRAVEL CHARACTERISTICS
OBSERVATIONS The following characteristics are observed from existing road network study:
• 27.5 per cent of the network has two lane carriageways; 8.3 per cent has three lane carriageways;
45.4 per cent of the road length is of 4 lanes; 18.8 per cent road network has 6 lane or above
configuration.
• 273.9 kms. (89 per cent) of the road length in the study area has undivided carriageway.
• Majority of the road network has no provision for service roads which induces the traffic to use the
principal network for all its local movement. This inter-mixing of local traffic with the long distance
traffic severely affects the level of service of the network.
• On-street parking results in loss of carrying capacity of the road network. It is observed that all major
roads have on-street parking which reduces the effective carriageway width for traffic movement.
The average road width for 4 lanes is 14 meters of which 3 meters on each side are being used for
on-street parking leaving only 8 meters for vehicular traffic (refer annexure I).
• The absence of sidewalks on major corridors and wherever available they have been occupied by
the hawkers, this has resulted towards the pedestrian being forced to share the carriageway
intended for vehicular movement.
3.1.2 TRAFFIC 3.1.2.1 TRAFFIC CHARACTERISTICS Traffic characteristics help in understanding the correlation between spatial character and the movement
pattern. This understanding is essential for identifying the present conditions and constraints, eliciting proper
policies and strategies, selecting relevant systems and designing the individual components of the system.
The study for traffic characteristics has been carried out on 28 major corridors (refer Table 3.2).
TRAFFIC CONGESTION AND CONFLICTION WITH TRAM
RABINDRA SARANI ROAD
OBSERVATIONS The Table 3.2 shows the fast moving, slow moving and total traffic on the network. The detailed analysis of
traffic counts shows;
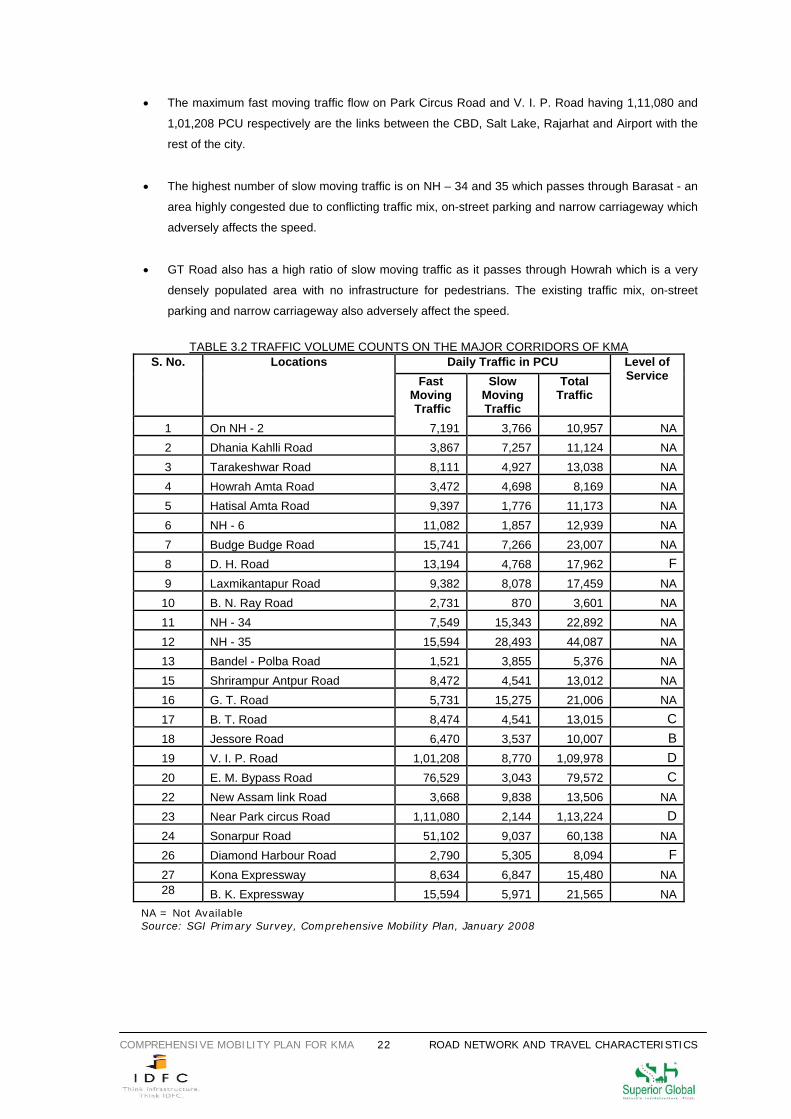
COMPREHENSIVE MOBILITY PLAN FOR KMA 22 ROAD NETWORK AND TRAVEL CHARACTERISTICS
• The maximum fast moving traffic flow on Park Circus Road and V. I. P. Road having 1,11,080 and
1,01,208 PCU respectively are the links between the CBD, Salt Lake, Rajarhat and Airport with the
rest of the city.
• The highest number of slow moving traffic is on NH – 34 and 35 which passes through Barasat - an
area highly congested due to conflicting traffic mix, on-street parking and narrow carriageway which
adversely affects the speed.
• GT Road also has a high ratio of slow moving traffic as it passes through Howrah which is a very
densely populated area with no infrastructure for pedestrians. The existing traffic mix, on-street
parking and narrow carriageway also adversely affect the speed.
TABLE 3.2 TRAFFIC VOLUME COUNTS ON THE MAJOR CORRIDORS OF KMA
Daily Traffic in PCU S. No. Locations Fast
Moving Traffic
Slow Moving Traffic
Total Traffic
Level of Service
1 On NH - 2 7,191 3,766 10,957 NA2 Dhania Kahlli Road 3,867 7,257 11,124 NA3 Tarakeshwar Road 8,111 4,927 13,038 NA4 Howrah Amta Road 3,472 4,698 8,169 NA5 Hatisal Amta Road 9,397 1,776 11,173 NA6 NH - 6 11,082 1,857 12,939 NA7 Budge Budge Road 15,741 7,266 23,007 NA8 D. H. Road 13,194 4,768 17,962 F9 Laxmikantapur Road 9,382 8,078 17,459 NA10 B. N. Ray Road 2,731 870 3,601 NA11 NH - 34 7,549 15,343 22,892 NA12 NH - 35 15,594 28,493 44,087 NA13 Bandel - Polba Road 1,521 3,855 5,376 NA15 Shrirampur Antpur Road 8,472 4,541 13,012 NA16 G. T. Road 5,731 15,275 21,006 NA17 B. T. Road 8,474 4,541 13,015 C 18 Jessore Road 6,470 3,537 10,007 B19 V. I. P. Road 1,01,208 8,770 1,09,978 D20 E. M. Bypass Road 76,529 3,043 79,572 C 22 New Assam link Road 3,668 9,838 13,506 NA23 Near Park circus Road 1,11,080 2,144 1,13,224 D24 Sonarpur Road 51,102 9,037 60,138 NA26 Diamond Harbour Road 2,790 5,305 8,094 F27 Kona Expressway 8,634 6,847 15,480 NA28 B. K. Expressway 15,594 5,971 21,565 NA
NA = Not Available Source: SGI Primary Survey, Comprehensive Mobility Plan, January 2008
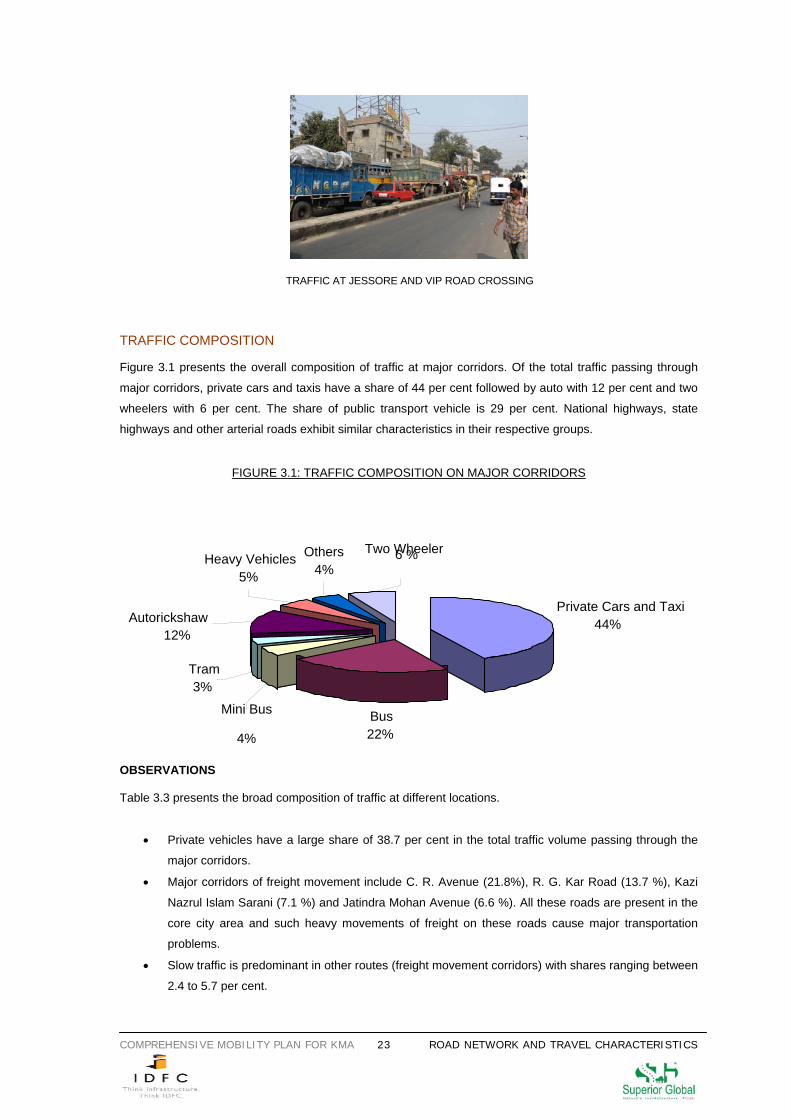
COMPREHENSIVE MOBILITY PLAN FOR KMA 23 ROAD NETWORK AND TRAVEL CHARACTERISTICS
Private Cars and Taxi44%
Heavy Vehicles5%
Autorickshaw 12%
Tram3%
Mini Bus
4%
Others4%
Two Wheeler6 %
Bus22%
TRAFFIC AT JESSORE AND VIP ROAD CROSSING TRAFFIC COMPOSITION Figure 3.1 presents the overall composition of traffic at major corridors. Of the total traffic passing through
major corridors, private cars and taxis have a share of 44 per cent followed by auto with 12 per cent and two
wheelers with 6 per cent. The share of public transport vehicle is 29 per cent. National highways, state
highways and other arterial roads exhibit similar characteristics in their respective groups.
FIGURE 3.1: TRAFFIC COMPOSITION ON MAJOR CORRIDORS
OBSERVATIONS Table 3.3 presents the broad composition of traffic at different locations.
• Private vehicles have a large share of 38.7 per cent in the total traffic volume passing through the
major corridors.
• Major corridors of freight movement include C. R. Avenue (21.8%), R. G. Kar Road (13.7 %), Kazi
Nazrul Islam Sarani (7.1 %) and Jatindra Mohan Avenue (6.6 %). All these roads are present in the
core city area and such heavy movements of freight on these roads cause major transportation
problems.
• Slow traffic is predominant in other routes (freight movement corridors) with shares ranging between
2.4 to 5.7 per cent.
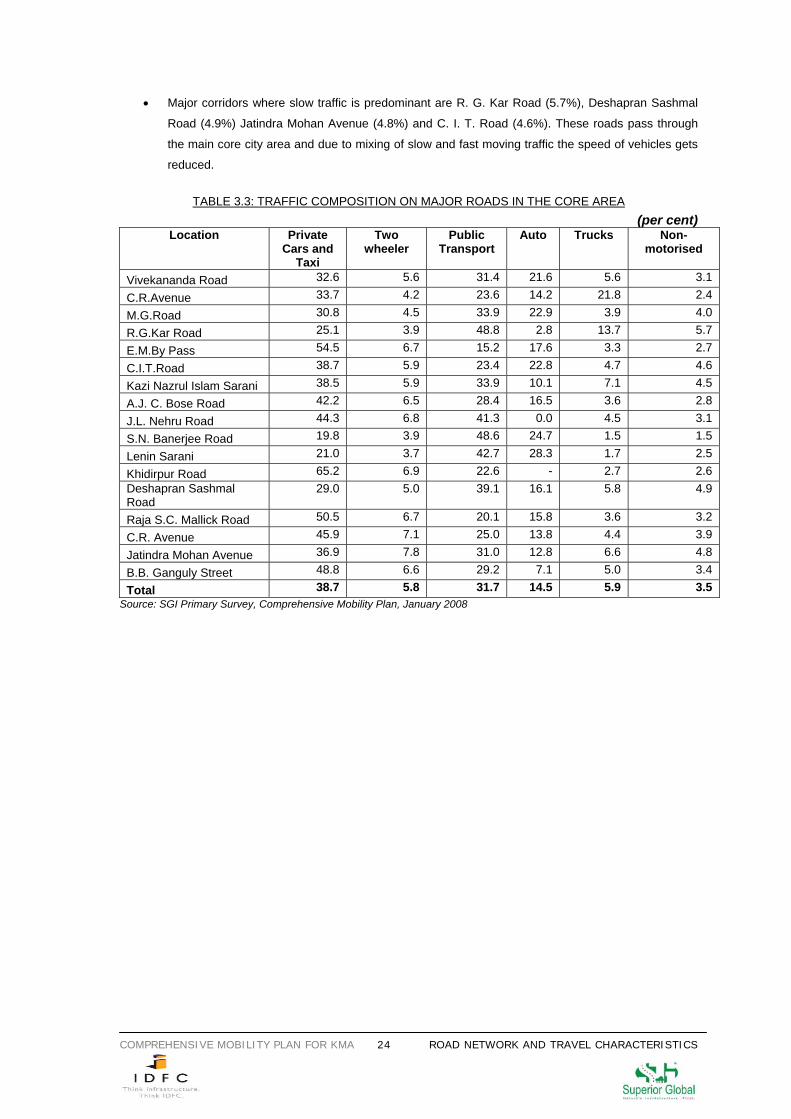
COMPREHENSIVE MOBILITY PLAN FOR KMA 24 ROAD NETWORK AND TRAVEL CHARACTERISTICS
• Major corridors where slow traffic is predominant are R. G. Kar Road (5.7%), Deshapran Sashmal
Road (4.9%) Jatindra Mohan Avenue (4.8%) and C. I. T. Road (4.6%). These roads pass through
the main core city area and due to mixing of slow and fast moving traffic the speed of vehicles gets
reduced.
TABLE 3.3: TRAFFIC COMPOSITION ON MAJOR ROADS IN THE CORE AREA (per cent)
Location Private Cars and
Taxi
Two wheeler
Public Transport
Auto Trucks Non-motorised
Vivekananda Road 32.6 5.6 31.4 21.6 5.6 3.1
C.R.Avenue 33.7 4.2 23.6 14.2 21.8 2.4
M.G.Road 30.8 4.5 33.9 22.9 3.9 4.0
R.G.Kar Road 25.1 3.9 48.8 2.8 13.7 5.7
E.M.By Pass 54.5 6.7 15.2 17.6 3.3 2.7
C.I.T.Road 38.7 5.9 23.4 22.8 4.7 4.6
Kazi Nazrul Islam Sarani 38.5 5.9 33.9 10.1 7.1 4.5
A.J. C. Bose Road 42.2 6.5 28.4 16.5 3.6 2.8
J.L. Nehru Road 44.3 6.8 41.3 0.0 4.5 3.1
S.N. Banerjee Road 19.8 3.9 48.6 24.7 1.5 1.5
Lenin Sarani 21.0 3.7 42.7 28.3 1.7 2.5
Khidirpur Road 65.2 6.9 22.6 - 2.7 2.6 Deshapran Sashmal Road
29.0 5.0 39.1 16.1 5.8 4.9
Raja S.C. Mallick Road 50.5 6.7 20.1 15.8 3.6 3.2
C.R. Avenue 45.9 7.1 25.0 13.8 4.4 3.9
Jatindra Mohan Avenue 36.9 7.8 31.0 12.8 6.6 4.8
B.B. Ganguly Street 48.8 6.6 29.2 7.1 5.0 3.4
Total 38.7 5.8 31.7 14.5 5.9 3.5 Source: SGI Primary Survey, Comprehensive Mobility Plan, January 2008
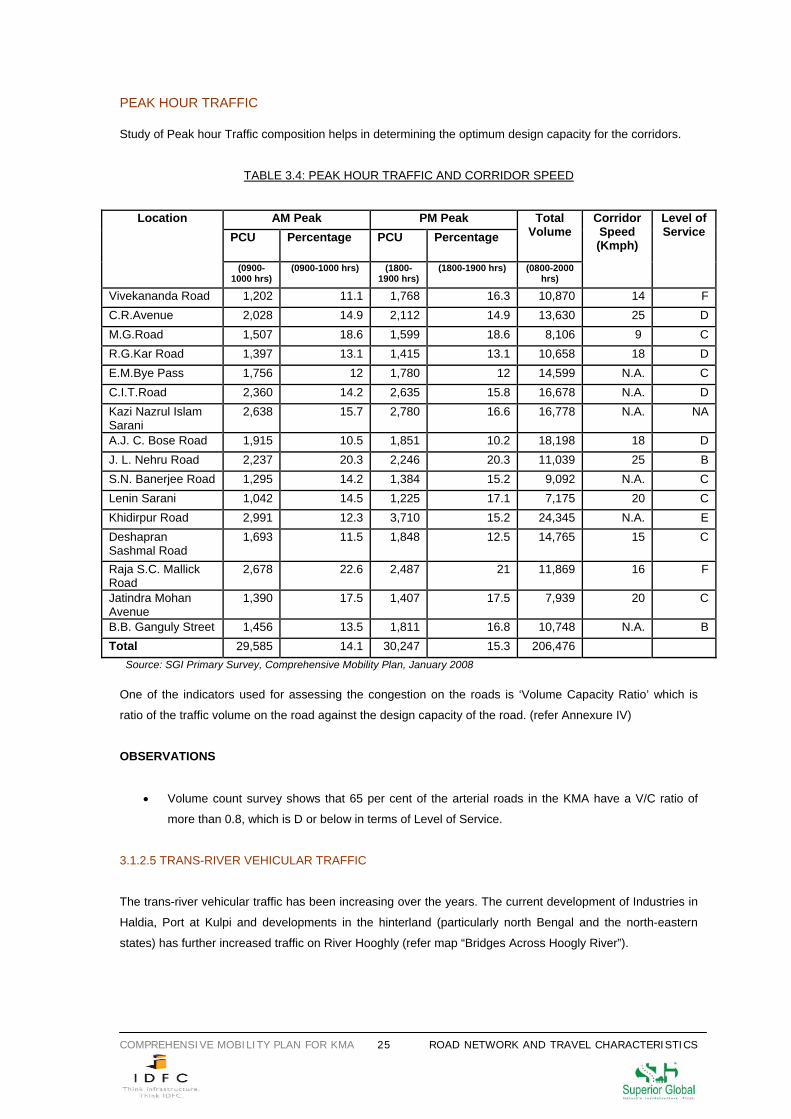
COMPREHENSIVE MOBILITY PLAN FOR KMA 25 ROAD NETWORK AND TRAVEL CHARACTERISTICS
PEAK HOUR TRAFFIC Study of Peak hour Traffic composition helps in determining the optimum design capacity for the corridors.
TABLE 3.4: PEAK HOUR TRAFFIC AND CORRIDOR SPEED
AM Peak PM Peak
PCU Percentage PCU Percentage Total
Volume Location
(0900-1000 hrs)
(0900-1000 hrs) (1800-1900 hrs)
(1800-1900 hrs) (0800-2000 hrs)
Corridor Speed (Kmph)
Level of Service
Vivekananda Road 1,202 11.1 1,768 16.3 10,870 14 FC.R.Avenue 2,028 14.9 2,112 14.9 13,630 25 DM.G.Road 1,507 18.6 1,599 18.6 8,106 9 CR.G.Kar Road 1,397 13.1 1,415 13.1 10,658 18 DE.M.Bye Pass 1,756 12 1,780 12 14,599 N.A. CC.I.T.Road 2,360 14.2 2,635 15.8 16,678 N.A. DKazi Nazrul Islam Sarani
2,638 15.7 2,780 16.6 16,778 N.A. NA
A.J. C. Bose Road 1,915 10.5 1,851 10.2 18,198 18 DJ. L. Nehru Road 2,237 20.3 2,246 20.3 11,039 25 BS.N. Banerjee Road 1,295 14.2 1,384 15.2 9,092 N.A. CLenin Sarani 1,042 14.5 1,225 17.1 7,175 20 CKhidirpur Road 2,991 12.3 3,710 15.2 24,345 N.A. EDeshapran Sashmal Road
1,693 11.5 1,848 12.5 14,765 15 C
Raja S.C. Mallick Road
2,678 22.6 2,487 21 11,869 16 F
Jatindra Mohan Avenue
1,390 17.5 1,407 17.5 7,939 20 C
B.B. Ganguly Street 1,456 13.5 1,811 16.8 10,748 N.A. BTotal 29,585 14.1 30,247 15.3 206,476
Source: SGI Primary Survey, Comprehensive Mobility Plan, January 2008 One of the indicators used for assessing the congestion on the roads is ‘Volume Capacity Ratio’ which is
ratio of the traffic volume on the road against the design capacity of the road. (refer Annexure IV)
OBSERVATIONS
• Volume count survey shows that 65 per cent of the arterial roads in the KMA have a V/C ratio of
more than 0.8, which is D or below in terms of Level of Service.
3.1.2.5 TRANS-RIVER VEHICULAR TRAFFIC
The trans-river vehicular traffic has been increasing over the years. The current development of Industries in
Haldia, Port at Kulpi and developments in the hinterland (particularly north Bengal and the north-eastern
states) has further increased traffic on River Hooghly (refer map “Bridges Across Hoogly River”).
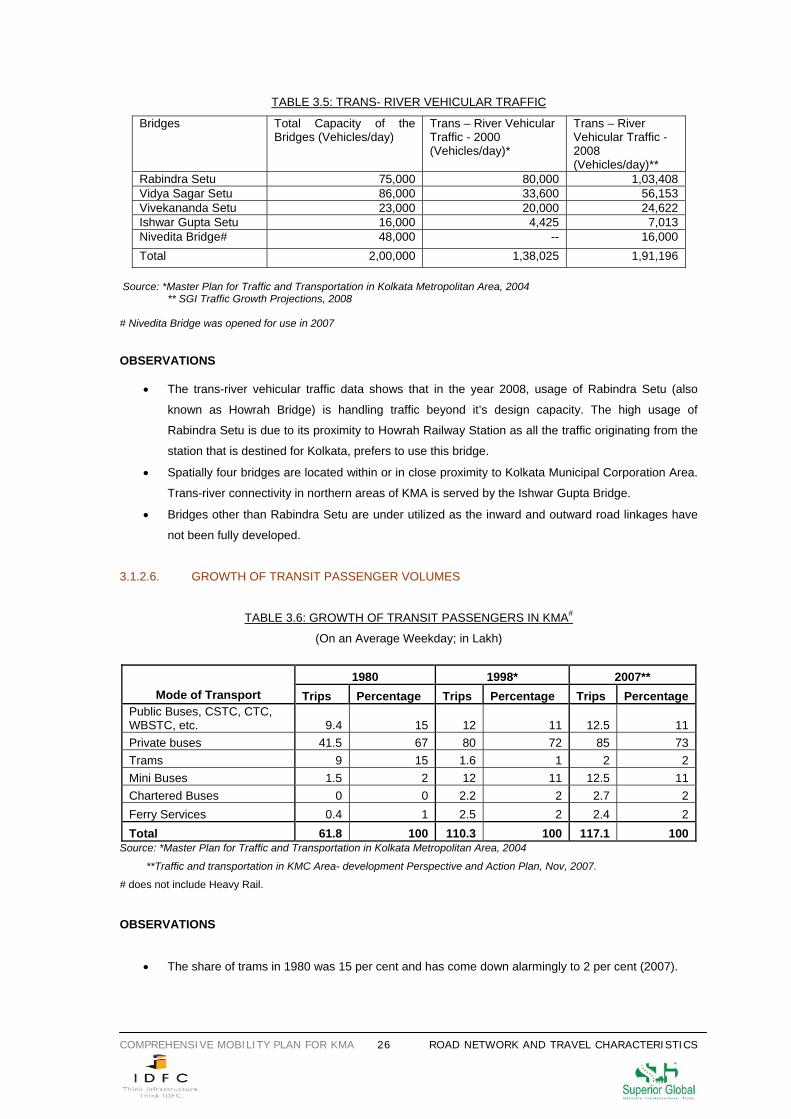
COMPREHENSIVE MOBILITY PLAN FOR KMA 26 ROAD NETWORK AND TRAVEL CHARACTERISTICS
TABLE 3.5: TRANS- RIVER VEHICULAR TRAFFIC
Bridges Total Capacity of the Bridges (Vehicles/day)
Trans – River Vehicular Traffic - 2000 (Vehicles/day)*
Trans – River Vehicular Traffic - 2008 (Vehicles/day)**
Rabindra Setu 75,000 80,000 1,03,408 Vidya Sagar Setu 86,000 33,600 56,153 Vivekananda Setu 23,000 20,000 24,622 Ishwar Gupta Setu 16,000 4,425 7,013 Nivedita Bridge# 48,000 -- 16,000 Total 2,00,000 1,38,025 1,91,196
Source: *Master Plan for Traffic and Transportation in Kolkata Metropolitan Area, 2004
** SGI Traffic Growth Projections, 2008 # Nivedita Bridge was opened for use in 2007 OBSERVATIONS
• The trans-river vehicular traffic data shows that in the year 2008, usage of Rabindra Setu (also
known as Howrah Bridge) is handling traffic beyond it’s design capacity. The high usage of
Rabindra Setu is due to its proximity to Howrah Railway Station as all the traffic originating from the
station that is destined for Kolkata, prefers to use this bridge.
• Spatially four bridges are located within or in close proximity to Kolkata Municipal Corporation Area.
Trans-river connectivity in northern areas of KMA is served by the Ishwar Gupta Bridge.
• Bridges other than Rabindra Setu are under utilized as the inward and outward road linkages have
not been fully developed.
3.1.2.6. GROWTH OF TRANSIT PASSENGER VOLUMES
TABLE 3.6: GROWTH OF TRANSIT PASSENGERS IN KMA#
(On an Average Weekday; in Lakh)
Source: *Master Plan for Traffic and Transportation in Kolkata Metropolitan Area, 2004
**Traffic and transportation in KMC Area- development Perspective and Action Plan, Nov, 2007.
# does not include Heavy Rail.
OBSERVATIONS
• The share of trams in 1980 was 15 per cent and has come down alarmingly to 2 per cent (2007).
1980 1998* 2007** Mode of Transport Trips Percentage Trips Percentage Trips Percentage
Public Buses, CSTC, CTC, WBSTC, etc. 9.4 15 12 11 12.5 11Private buses 41.5 67 80 72 85 73Trams 9 15 1.6 1 2 2 Mini Buses 1.5 2 12 11 12.5 11Chartered Buses 0 0 2.2 2 2.7 2 Ferry Services 0.4 1 2.5 2 2.4 2 Total 61.8 100 110.3 100 117.1 100
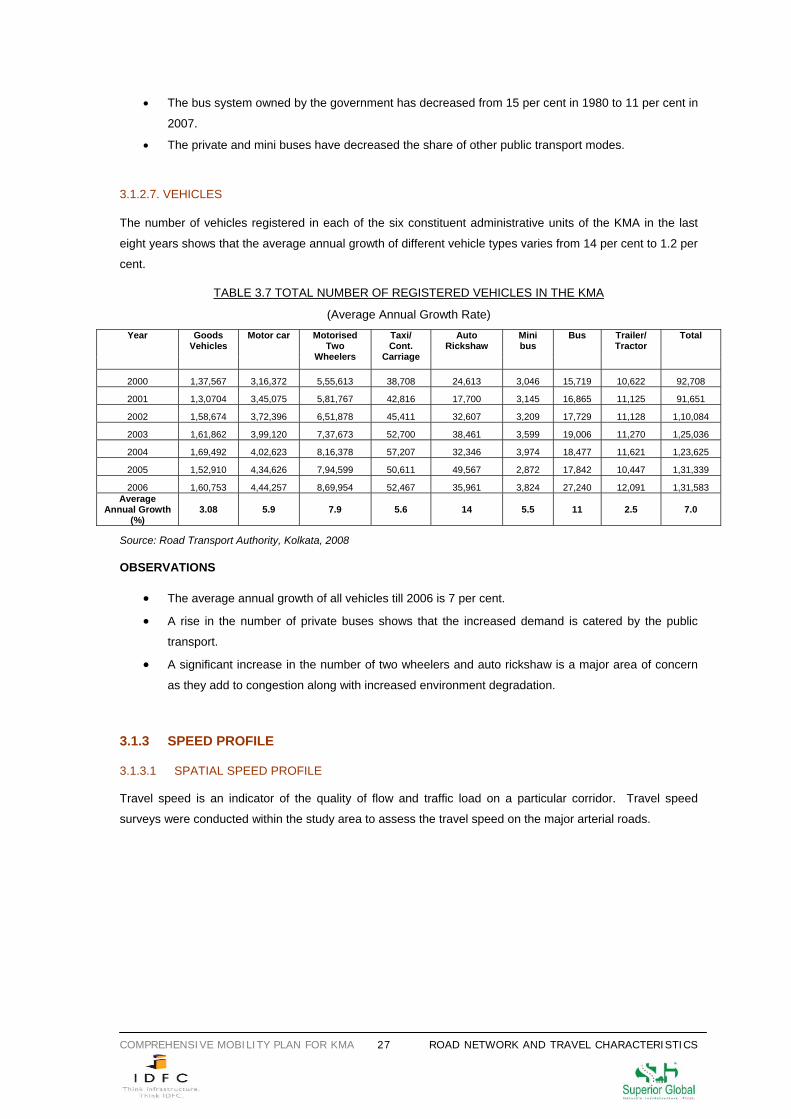
COMPREHENSIVE MOBILITY PLAN FOR KMA 27 ROAD NETWORK AND TRAVEL CHARACTERISTICS
• The bus system owned by the government has decreased from 15 per cent in 1980 to 11 per cent in
2007.
• The private and mini buses have decreased the share of other public transport modes.
3.1.2.7. VEHICLES
The number of vehicles registered in each of the six constituent administrative units of the KMA in the last
eight years shows that the average annual growth of different vehicle types varies from 14 per cent to 1.2 per
cent.
TABLE 3.7 TOTAL NUMBER OF REGISTERED VEHICLES IN THE KMA
(Average Annual Growth Rate) Year Goods
Vehicles Motor car Motorised
Two Wheelers
Taxi/ Cont.
Carriage
Auto Rickshaw
Mini bus
Bus Trailer/ Tractor
Total
2000 1,37,567 3,16,372 5,55,613 38,708 24,613 3,046 15,719 10,622 92,708
2001 1,3,0704 3,45,075 5,81,767 42,816 17,700 3,145 16,865 11,125 91,651
2002 1,58,674 3,72,396 6,51,878 45,411 32,607 3,209 17,729 11,128 1,10,084
2003 1,61,862 3,99,120 7,37,673 52,700 38,461 3,599 19,006 11,270 1,25,036
2004 1,69,492 4,02,623 8,16,378 57,207 32,346 3,974 18,477 11,621 1,23,625
2005 1,52,910 4,34,626 7,94,599 50,611 49,567 2,872 17,842 10,447 1,31,339
2006 1,60,753 4,44,257 8,69,954 52,467 35,961 3,824 27,240 12,091 1,31,583 Average
Annual Growth (%)
3.08 5.9 7.9 5.6 14 5.5 11 2.5 7.0
Source: Road Transport Authority, Kolkata, 2008
OBSERVATIONS
• The average annual growth of all vehicles till 2006 is 7 per cent.
• A rise in the number of private buses shows that the increased demand is catered by the public
transport.
• A significant increase in the number of two wheelers and auto rickshaw is a major area of concern
as they add to congestion along with increased environment degradation.
3.1.3 SPEED PROFILE 3.1.3.1 SPATIAL SPEED PROFILE Travel speed is an indicator of the quality of flow and traffic load on a particular corridor. Travel speed
surveys were conducted within the study area to assess the travel speed on the major arterial roads.
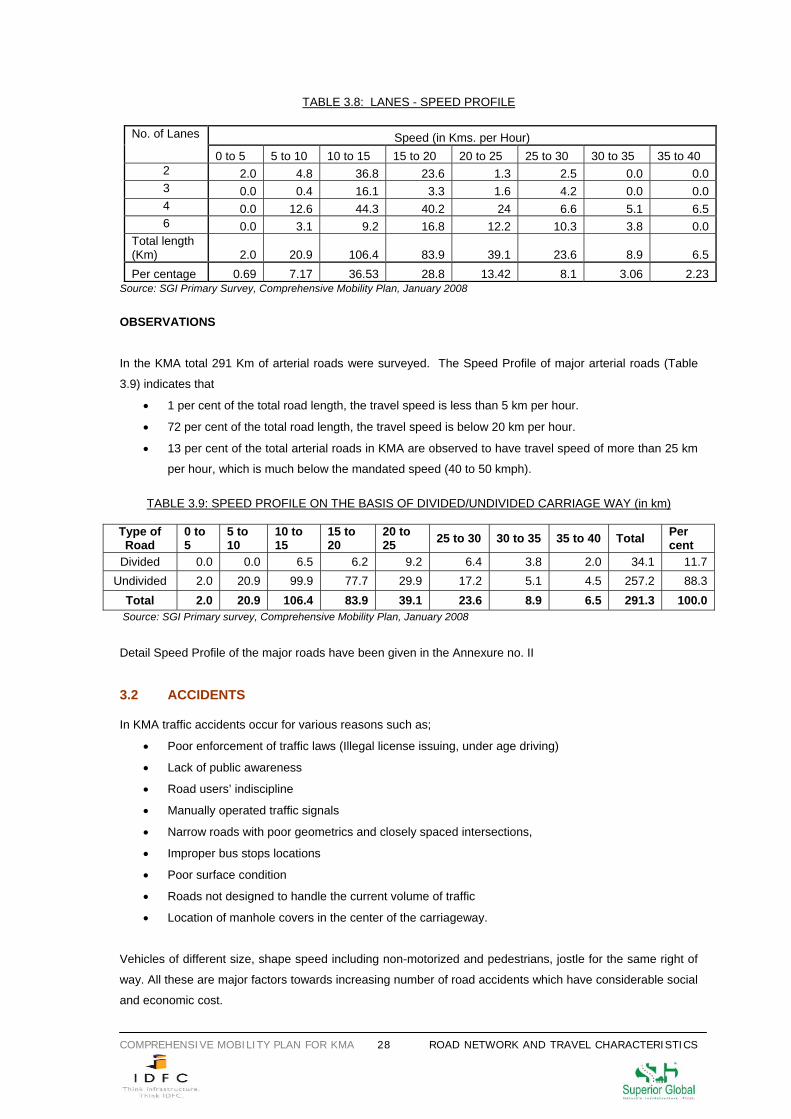
COMPREHENSIVE MOBILITY PLAN FOR KMA 28 ROAD NETWORK AND TRAVEL CHARACTERISTICS
TABLE 3.8: LANES - SPEED PROFILE
Source: SGI Primary Survey, Comprehensive Mobility Plan, January 2008
OBSERVATIONS
In the KMA total 291 Km of arterial roads were surveyed. The Speed Profile of major arterial roads (Table
3.9) indicates that
• 1 per cent of the total road length, the travel speed is less than 5 km per hour.
• 72 per cent of the total road length, the travel speed is below 20 km per hour.
• 13 per cent of the total arterial roads in KMA are observed to have travel speed of more than 25 km
per hour, which is much below the mandated speed (40 to 50 kmph).
TABLE 3.9: SPEED PROFILE ON THE BASIS OF DIVIDED/UNDIVIDED CARRIAGE WAY (in km)
Type of Road
0 to 5
5 to 10
10 to 15
15 to 20
20 to 25 25 to 30 30 to 35 35 to 40 Total Per
cent Divided 0.0 0.0 6.5 6.2 9.2 6.4 3.8 2.0 34.1 11.7
Undivided 2.0 20.9 99.9 77.7 29.9 17.2 5.1 4.5 257.2 88.3 Total 2.0 20.9 106.4 83.9 39.1 23.6 8.9 6.5 291.3 100.0
Source: SGI Primary survey, Comprehensive Mobility Plan, January 2008 Detail Speed Profile of the major roads have been given in the Annexure no. II
3.2 ACCIDENTS
In KMA traffic accidents occur for various reasons such as;
• Poor enforcement of traffic laws (Illegal license issuing, under age driving)
• Lack of public awareness
• Road users’ indiscipline
• Manually operated traffic signals
• Narrow roads with poor geometrics and closely spaced intersections,
• Improper bus stops locations
• Poor surface condition
• Roads not designed to handle the current volume of traffic
• Location of manhole covers in the center of the carriageway.
Vehicles of different size, shape speed including non-motorized and pedestrians, jostle for the same right of
way. All these are major factors towards increasing number of road accidents which have considerable social
and economic cost.
Speed (in Kms. per Hour) No. of Lanes
0 to 5 5 to 10 10 to 15 15 to 20 20 to 25 25 to 30 30 to 35 35 to 40 2 2.0 4.8 36.8 23.6 1.3 2.5 0.0 0.03 0.0 0.4 16.1 3.3 1.6 4.2 0.0 0.04 0.0 12.6 44.3 40.2 24 6.6 5.1 6.56 0.0 3.1 9.2 16.8 12.2 10.3 3.8 0.0
Total length (Km) 2.0 20.9 106.4 83.9 39.1 23.6 8.9 6.5Per centage 0.69 7.17 36.53 28.8 13.42 8.1 3.06 2.23
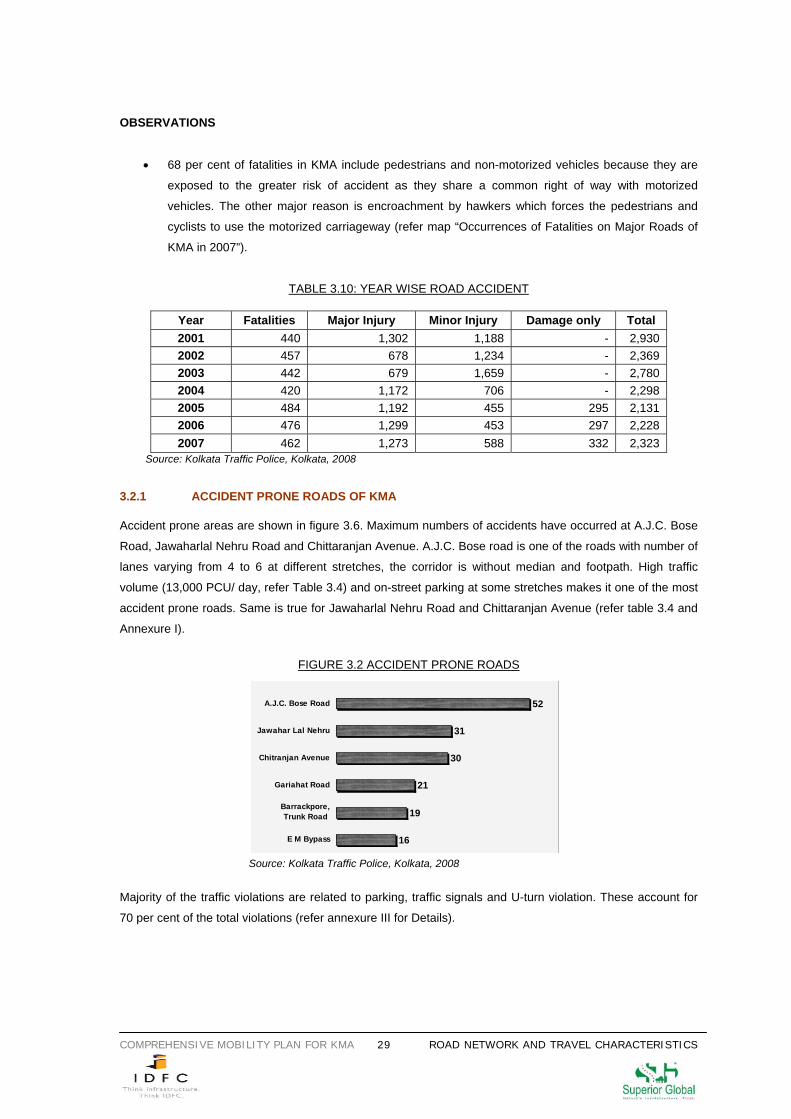
COMPREHENSIVE MOBILITY PLAN FOR KMA 29 ROAD NETWORK AND TRAVEL CHARACTERISTICS
OBSERVATIONS
• 68 per cent of fatalities in KMA include pedestrians and non-motorized vehicles because they are
exposed to the greater risk of accident as they share a common right of way with motorized
vehicles. The other major reason is encroachment by hawkers which forces the pedestrians and
cyclists to use the motorized carriageway (refer map “Occurrences of Fatalities on Major Roads of
KMA in 2007”).
TABLE 3.10: YEAR WISE ROAD ACCIDENT
Year Fatalities Major Injury Minor Injury Damage only Total 2001 440 1,302 1,188 - 2,930 2002 457 678 1,234 - 2,369 2003 442 679 1,659 - 2,780 2004 420 1,172 706 - 2,298 2005 484 1,192 455 295 2,131 2006 476 1,299 453 297 2,228 2007 462 1,273 588 332 2,323
Source: Kolkata Traffic Police, Kolkata, 2008 3.2.1 ACCIDENT PRONE ROADS OF KMA Accident prone areas are shown in figure 3.6. Maximum numbers of accidents have occurred at A.J.C. Bose
Road, Jawaharlal Nehru Road and Chittaranjan Avenue. A.J.C. Bose road is one of the roads with number of
lanes varying from 4 to 6 at different stretches, the corridor is without median and footpath. High traffic
volume (13,000 PCU/ day, refer Table 3.4) and on-street parking at some stretches makes it one of the most
accident prone roads. Same is true for Jawaharlal Nehru Road and Chittaranjan Avenue (refer table 3.4 and
Annexure I).
FIGURE 3.2 ACCIDENT PRONE ROADS
Source: Kolkata Traffic Police, Kolkata, 2008
Majority of the traffic violations are related to parking, traffic signals and U-turn violation. These account for
70 per cent of the total violations (refer annexure III for Details).
16
19
21
30
31
52
E M Bypass
Barrackpore,Trunk Road
Gariahat Road
Chitranjan Avenue
Jawahar Lal Nehru
A.J.C. Bose Road
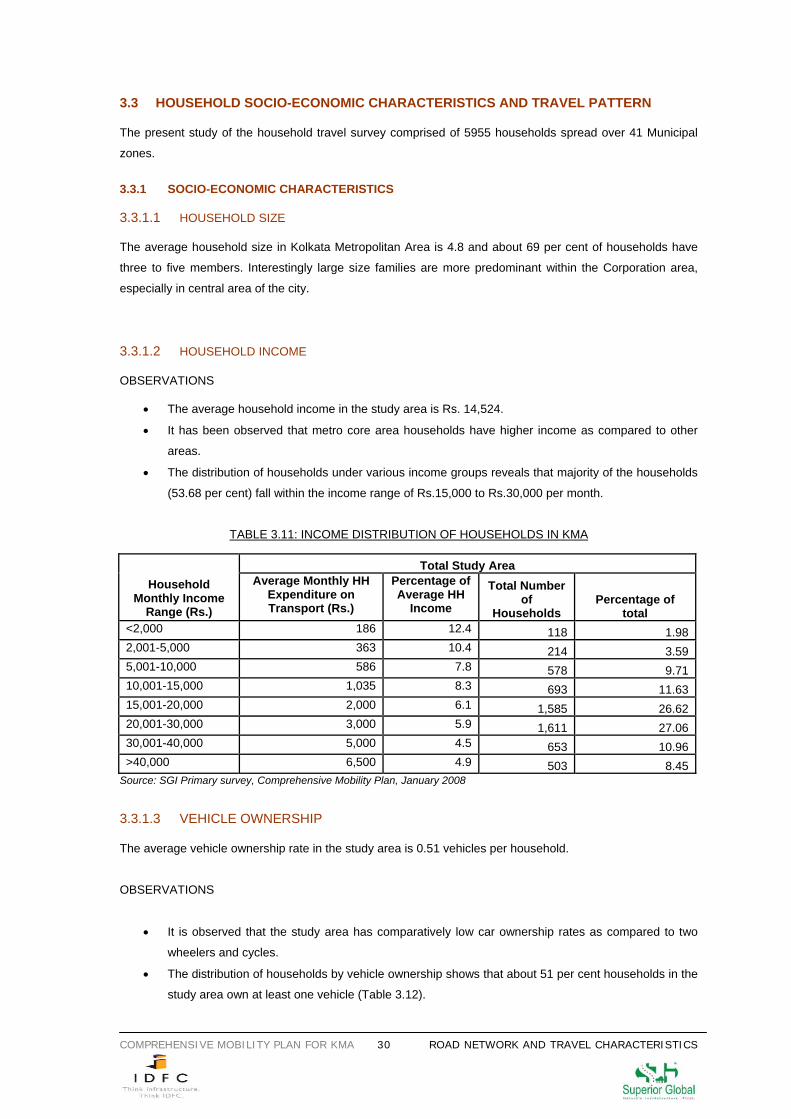
COMPREHENSIVE MOBILITY PLAN FOR KMA 30 ROAD NETWORK AND TRAVEL CHARACTERISTICS
3.3 HOUSEHOLD SOCIO-ECONOMIC CHARACTERISTICS AND TRAVEL PATTERN The present study of the household travel survey comprised of 5955 households spread over 41 Municipal
zones.
3.3.1 SOCIO-ECONOMIC CHARACTERISTICS 3.3.1.1 HOUSEHOLD SIZE The average household size in Kolkata Metropolitan Area is 4.8 and about 69 per cent of households have
three to five members. Interestingly large size families are more predominant within the Corporation area,
especially in central area of the city.
3.3.1.2 HOUSEHOLD INCOME OBSERVATIONS
• The average household income in the study area is Rs. 14,524.
• It has been observed that metro core area households have higher income as compared to other
areas.
• The distribution of households under various income groups reveals that majority of the households
(53.68 per cent) fall within the income range of Rs.15,000 to Rs.30,000 per month.
TABLE 3.11: INCOME DISTRIBUTION OF HOUSEHOLDS IN KMA
Total Study Area Household
Monthly Income Range (Rs.)
Average Monthly HH Expenditure on Transport (Rs.)
Percentage of Average HH
Income
Total Number of
Households Percentage of
total <2,000 186 12.4 118 1.982,001-5,000 363 10.4 214 3.595,001-10,000 586 7.8 578 9.7110,001-15,000 1,035 8.3 693 11.6315,001-20,000 2,000 6.1 1,585 26.6220,001-30,000 3,000 5.9 1,611 27.0630,001-40,000 5,000 4.5 653 10.96>40,000 6,500 4.9 503 8.45
Source: SGI Primary survey, Comprehensive Mobility Plan, January 2008
3.3.1.3 VEHICLE OWNERSHIP
The average vehicle ownership rate in the study area is 0.51 vehicles per household.
OBSERVATIONS
• It is observed that the study area has comparatively low car ownership rates as compared to two
wheelers and cycles.
• The distribution of households by vehicle ownership shows that about 51 per cent households in the
study area own at least one vehicle (Table 3.12).
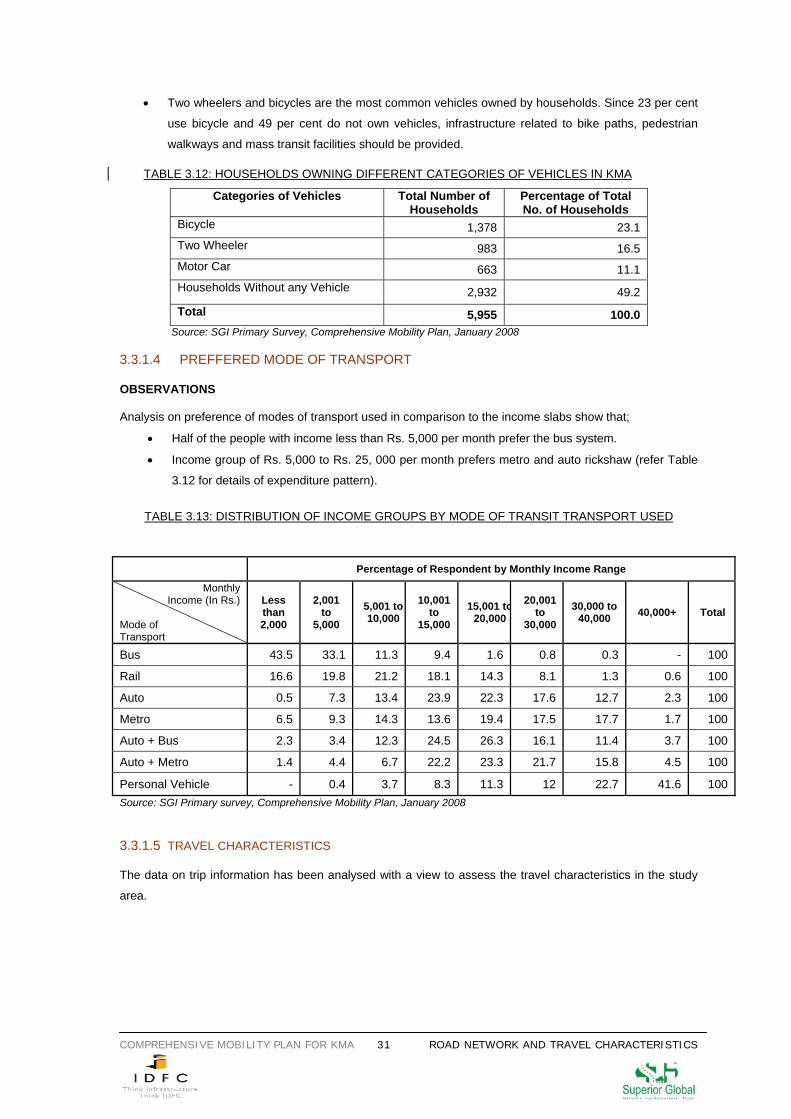
COMPREHENSIVE MOBILITY PLAN FOR KMA 31 ROAD NETWORK AND TRAVEL CHARACTERISTICS
• Two wheelers and bicycles are the most common vehicles owned by households. Since 23 per cent
use bicycle and 49 per cent do not own vehicles, infrastructure related to bike paths, pedestrian
walkways and mass transit facilities should be provided.
TABLE 3.12: HOUSEHOLDS OWNING DIFFERENT CATEGORIES OF VEHICLES IN KMA Categories of Vehicles Total Number of
Households Percentage of Total No. of Households
Bicycle 1,378 23.1 Two Wheeler 983 16.5 Motor Car 663 11.1 Households Without any Vehicle 2,932 49.2 Total 5,955 100.0
Source: SGI Primary Survey, Comprehensive Mobility Plan, January 2008 3.3.1.4 PREFFERED MODE OF TRANSPORT OBSERVATIONS Analysis on preference of modes of transport used in comparison to the income slabs show that;
• Half of the people with income less than Rs. 5,000 per month prefer the bus system.
• Income group of Rs. 5,000 to Rs. 25, 000 per month prefers metro and auto rickshaw (refer Table
3.12 for details of expenditure pattern).
TABLE 3.13: DISTRIBUTION OF INCOME GROUPS BY MODE OF TRANSIT TRANSPORT USED
Source: SGI Primary survey, Comprehensive Mobility Plan, January 2008 3.3.1.5 TRAVEL CHARACTERISTICS The data on trip information has been analysed with a view to assess the travel characteristics in the study
area.
Percentage of Respondent by Monthly Income Range
Monthly Income (In Rs.)
Mode of Transport
Less than 2,000
2,001 to
5,000
5,001 to 10,000
10,001 to
15,000
15,001 to20,000
20,001 to
30,000
30,000 to 40,000 40,000+ Total
Bus 43.5 33.1 11.3 9.4 1.6 0.8 0.3 - 100
Rail 16.6 19.8 21.2 18.1 14.3 8.1 1.3 0.6 100
Auto 0.5 7.3 13.4 23.9 22.3 17.6 12.7 2.3 100
Metro 6.5 9.3 14.3 13.6 19.4 17.5 17.7 1.7 100
Auto + Bus 2.3 3.4 12.3 24.5 26.3 16.1 11.4 3.7 100
Auto + Metro 1.4 4.4 6.7 22.2 23.3 21.7 15.8 4.5 100
Personal Vehicle - 0.4 3.7 8.3 11.3 12 22.7 41.6 100
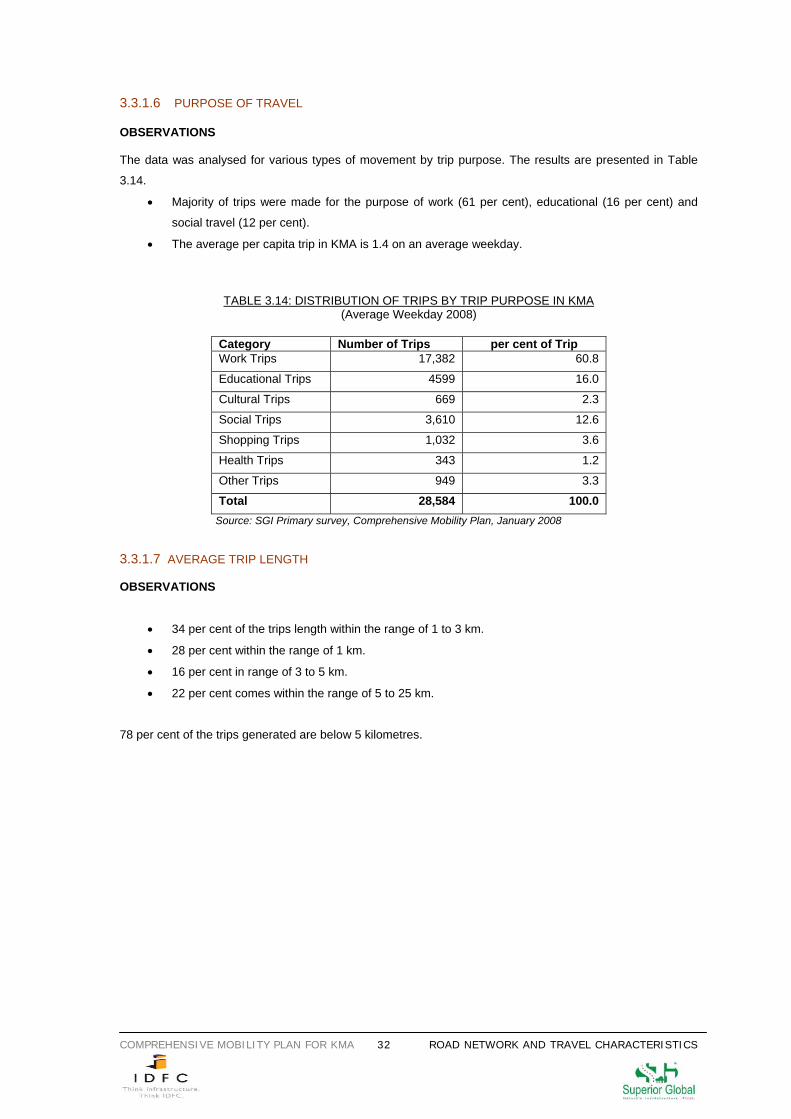
COMPREHENSIVE MOBILITY PLAN FOR KMA 32 ROAD NETWORK AND TRAVEL CHARACTERISTICS
3.3.1.6 PURPOSE OF TRAVEL OBSERVATIONS The data was analysed for various types of movement by trip purpose. The results are presented in Table
3.14.
• Majority of trips were made for the purpose of work (61 per cent), educational (16 per cent) and
social travel (12 per cent).
• The average per capita trip in KMA is 1.4 on an average weekday.
TABLE 3.14: DISTRIBUTION OF TRIPS BY TRIP PURPOSE IN KMA
(Average Weekday 2008)
Category Number of Trips per cent of Trip Work Trips 17,382 60.8
Educational Trips 4599 16.0
Cultural Trips 669 2.3
Social Trips 3,610 12.6
Shopping Trips 1,032 3.6
Health Trips 343 1.2
Other Trips 949 3.3
Total 28,584 100.0 Source: SGI Primary survey, Comprehensive Mobility Plan, January 2008
3.3.1.7 AVERAGE TRIP LENGTH OBSERVATIONS
• 34 per cent of the trips length within the range of 1 to 3 km.
• 28 per cent within the range of 1 km.
• 16 per cent in range of 3 to 5 km.
• 22 per cent comes within the range of 5 to 25 km.
78 per cent of the trips generated are below 5 kilometres.
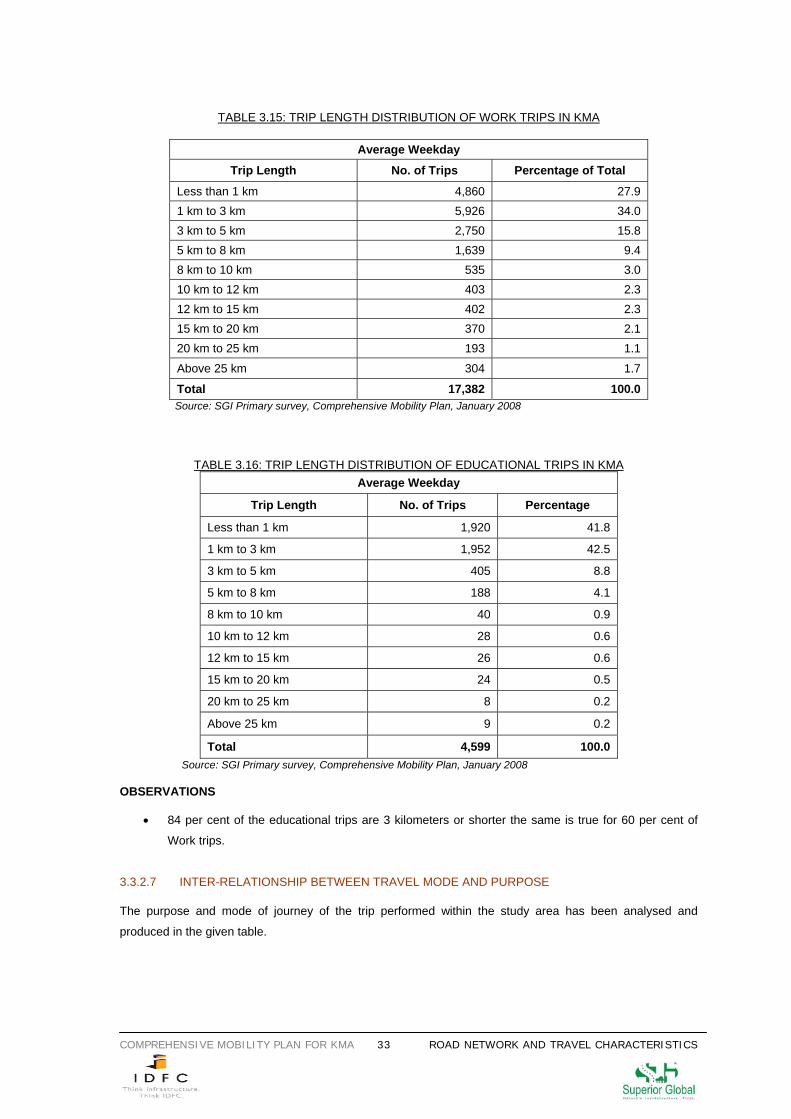
COMPREHENSIVE MOBILITY PLAN FOR KMA 33 ROAD NETWORK AND TRAVEL CHARACTERISTICS
TABLE 3.15: TRIP LENGTH DISTRIBUTION OF WORK TRIPS IN KMA
Average Weekday
Trip Length No. of Trips Percentage of Total
Less than 1 km 4,860 27.9 1 km to 3 km 5,926 34.0 3 km to 5 km 2,750 15.8 5 km to 8 km 1,639 9.4 8 km to 10 km 535 3.0 10 km to 12 km 403 2.3 12 km to 15 km 402 2.3 15 km to 20 km 370 2.1 20 km to 25 km 193 1.1
Above 25 km 304 1.7
Total 17,382 100.0 Source: SGI Primary survey, Comprehensive Mobility Plan, January 2008
TABLE 3.16: TRIP LENGTH DISTRIBUTION OF EDUCATIONAL TRIPS IN KMA Average Weekday
Trip Length No. of Trips Percentage
Less than 1 km 1,920 41.8
1 km to 3 km 1,952 42.5
3 km to 5 km 405 8.8
5 km to 8 km 188 4.1
8 km to 10 km 40 0.9
10 km to 12 km 28 0.6
12 km to 15 km 26 0.6
15 km to 20 km 24 0.5
20 km to 25 km 8 0.2
Above 25 km 9 0.2
Total 4,599 100.0 Source: SGI Primary survey, Comprehensive Mobility Plan, January 2008 OBSERVATIONS
• 84 per cent of the educational trips are 3 kilometers or shorter the same is true for 60 per cent of
Work trips.
3.3.2.7 INTER-RELATIONSHIP BETWEEN TRAVEL MODE AND PURPOSE The purpose and mode of journey of the trip performed within the study area has been analysed and
produced in the given table.
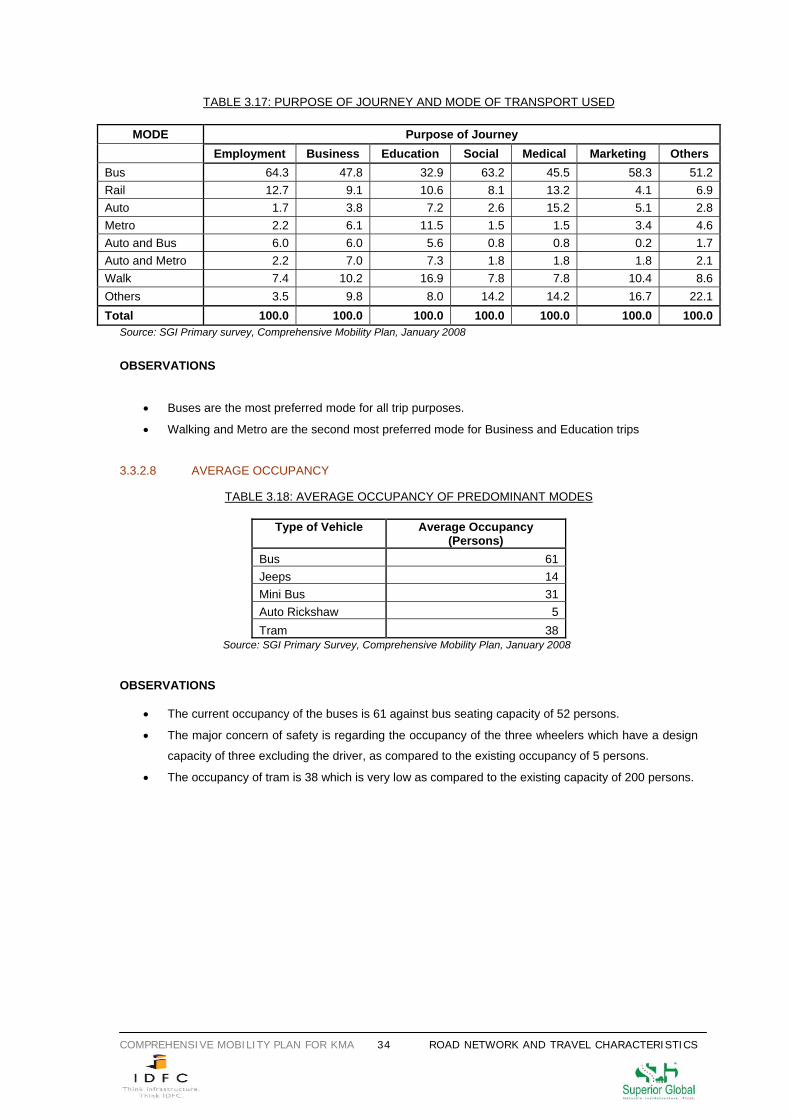
COMPREHENSIVE MOBILITY PLAN FOR KMA 34 ROAD NETWORK AND TRAVEL CHARACTERISTICS
TABLE 3.17: PURPOSE OF JOURNEY AND MODE OF TRANSPORT USED
MODE Purpose of Journey Employment Business Education Social Medical Marketing Others
Bus 64.3 47.8 32.9 63.2 45.5 58.3 51.2Rail 12.7 9.1 10.6 8.1 13.2 4.1 6.9Auto 1.7 3.8 7.2 2.6 15.2 5.1 2.8Metro 2.2 6.1 11.5 1.5 1.5 3.4 4.6Auto and Bus 6.0 6.0 5.6 0.8 0.8 0.2 1.7Auto and Metro 2.2 7.0 7.3 1.8 1.8 1.8 2.1Walk 7.4 10.2 16.9 7.8 7.8 10.4 8.6Others 3.5 9.8 8.0 14.2 14.2 16.7 22.1Total 100.0 100.0 100.0 100.0 100.0 100.0 100.0
Source: SGI Primary survey, Comprehensive Mobility Plan, January 2008 OBSERVATIONS
• Buses are the most preferred mode for all trip purposes.
• Walking and Metro are the second most preferred mode for Business and Education trips
3.3.2.8 AVERAGE OCCUPANCY
TABLE 3.18: AVERAGE OCCUPANCY OF PREDOMINANT MODES
Type of Vehicle Average Occupancy (Persons)
Bus 61Jeeps 14Mini Bus 31Auto Rickshaw 5Tram 38
Source: SGI Primary Survey, Comprehensive Mobility Plan, January 2008
OBSERVATIONS
• The current occupancy of the buses is 61 against bus seating capacity of 52 persons.
• The major concern of safety is regarding the occupancy of the three wheelers which have a design
capacity of three excluding the driver, as compared to the existing occupancy of 5 persons.
• The occupancy of tram is 38 which is very low as compared to the existing capacity of 200 persons.
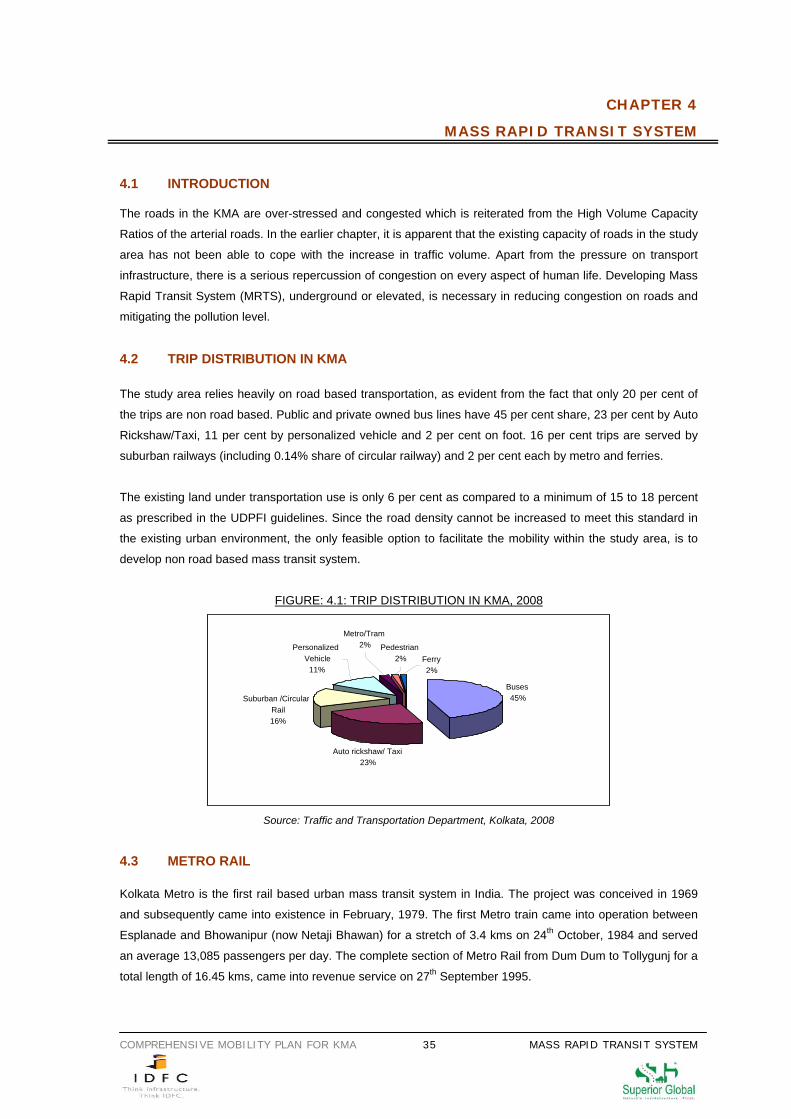
COMPREHENSIVE MOBILITY PLAN FOR KMA 35 MASS RAPID TRANSIT SYSTEM
CHAPTER 4 MASS RAPID TRANSIT SYSTEM
4.1 INTRODUCTION The roads in the KMA are over-stressed and congested which is reiterated from the High Volume Capacity
Ratios of the arterial roads. In the earlier chapter, it is apparent that the existing capacity of roads in the study
area has not been able to cope with the increase in traffic volume. Apart from the pressure on transport
infrastructure, there is a serious repercussion of congestion on every aspect of human life. Developing Mass
Rapid Transit System (MRTS), underground or elevated, is necessary in reducing congestion on roads and
mitigating the pollution level.
4.2 TRIP DISTRIBUTION IN KMA
The study area relies heavily on road based transportation, as evident from the fact that only 20 per cent of
the trips are non road based. Public and private owned bus lines have 45 per cent share, 23 per cent by Auto
Rickshaw/Taxi, 11 per cent by personalized vehicle and 2 per cent on foot. 16 per cent trips are served by
suburban railways (including 0.14% share of circular railway) and 2 per cent each by metro and ferries.
The existing land under transportation use is only 6 per cent as compared to a minimum of 15 to 18 percent
as prescribed in the UDPFI guidelines. Since the road density cannot be increased to meet this standard in
the existing urban environment, the only feasible option to facilitate the mobility within the study area, is to
develop non road based mass transit system.
FIGURE: 4.1: TRIP DISTRIBUTION IN KMA, 2008
Source: Traffic and Transportation Department, Kolkata, 2008
4.3 METRO RAIL Kolkata Metro is the first rail based urban mass transit system in India. The project was conceived in 1969
and subsequently came into existence in February, 1979. The first Metro train came into operation between
Esplanade and Bhowanipur (now Netaji Bhawan) for a stretch of 3.4 kms on 24th October, 1984 and served
an average 13,085 passengers per day. The complete section of Metro Rail from Dum Dum to Tollygunj for a
total length of 16.45 kms, came into revenue service on 27th September 1995.
Buses45%
PersonalizedVehicle
11%
Metro/Tram2% Pedestrian
2% Ferry2%
Suburban /Circular Rail 16%
Auto rickshaw/ Taxi23%
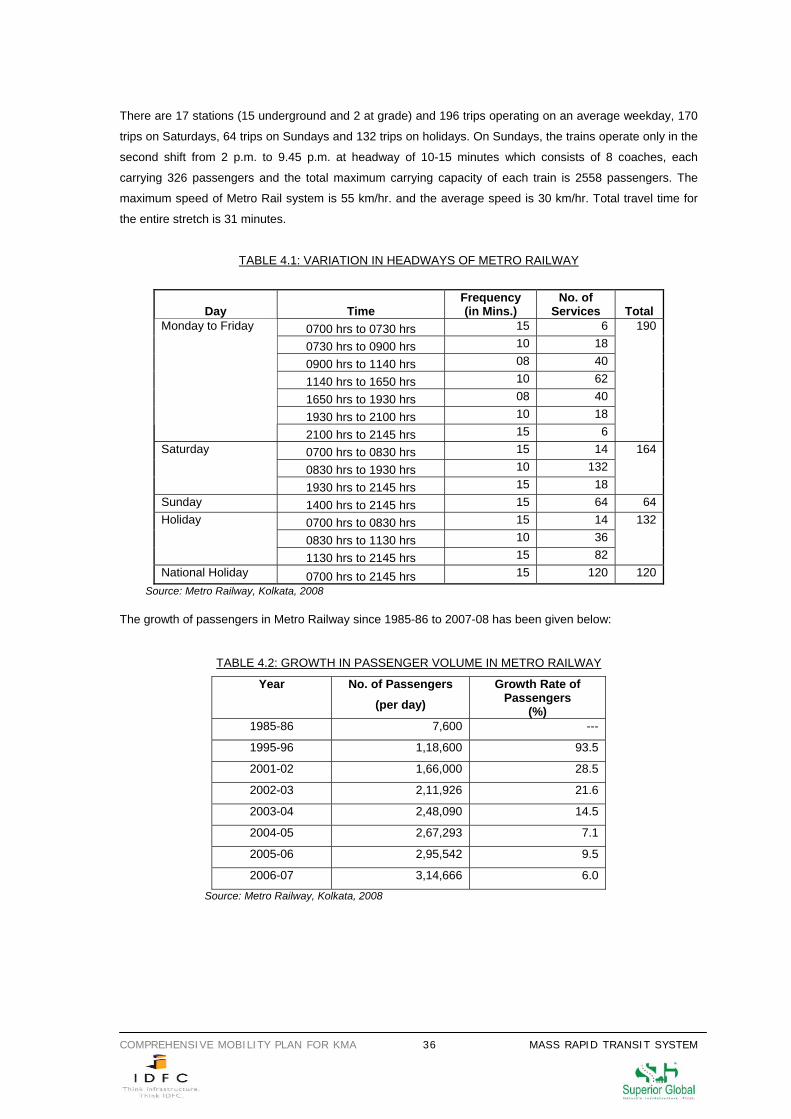
COMPREHENSIVE MOBILITY PLAN FOR KMA 36 MASS RAPID TRANSIT SYSTEM
There are 17 stations (15 underground and 2 at grade) and 196 trips operating on an average weekday, 170
trips on Saturdays, 64 trips on Sundays and 132 trips on holidays. On Sundays, the trains operate only in the
second shift from 2 p.m. to 9.45 p.m. at headway of 10-15 minutes which consists of 8 coaches, each
carrying 326 passengers and the total maximum carrying capacity of each train is 2558 passengers. The
maximum speed of Metro Rail system is 55 km/hr. and the average speed is 30 km/hr. Total travel time for
the entire stretch is 31 minutes.
TABLE 4.1: VARIATION IN HEADWAYS OF METRO RAILWAY
Day Time Frequency (in Mins.)
No. of Services Total
0700 hrs to 0730 hrs 15 6
0730 hrs to 0900 hrs 10 18
0900 hrs to 1140 hrs 08 40
1140 hrs to 1650 hrs 10 62
1650 hrs to 1930 hrs 08 40
1930 hrs to 2100 hrs 10 18
Monday to Friday
2100 hrs to 2145 hrs 15 6
190
0700 hrs to 0830 hrs 15 14
0830 hrs to 1930 hrs 10 132 Saturday
1930 hrs to 2145 hrs 15 18
164
Sunday 1400 hrs to 2145 hrs 15 64 64
0700 hrs to 0830 hrs 15 14
0830 hrs to 1130 hrs 10 36 Holiday
1130 hrs to 2145 hrs 15 82
132
National Holiday 0700 hrs to 2145 hrs 15 120 120 Source: Metro Railway, Kolkata, 2008 The growth of passengers in Metro Railway since 1985-86 to 2007-08 has been given below:
TABLE 4.2: GROWTH IN PASSENGER VOLUME IN METRO RAILWAY
Year No. of Passengers (per day)
Growth Rate of Passengers
(%) 1985-86 7,600 ---
1995-96 1,18,600 93.5
2001-02 1,66,000 28.5
2002-03 2,11,926 21.6
2003-04 2,48,090 14.5
2004-05 2,67,293 7.1
2005-06 2,95,542 9.5
2006-07 3,14,666 6.0
Source: Metro Railway, Kolkata, 2008
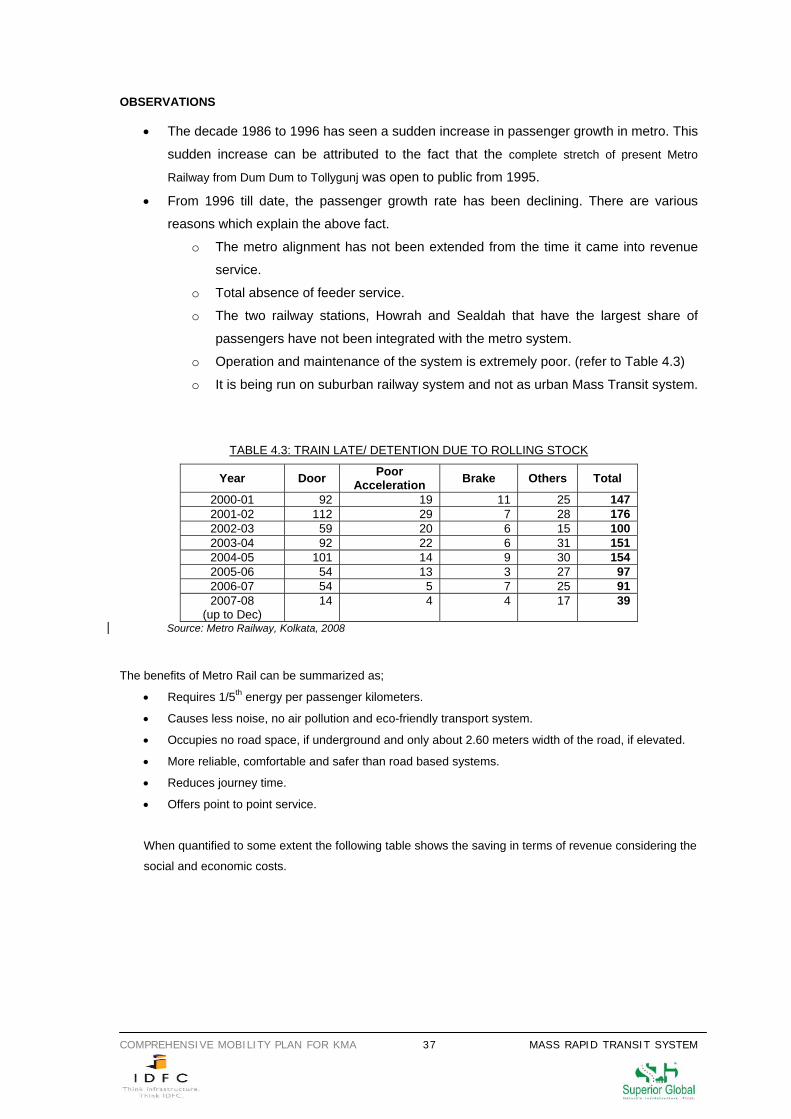
COMPREHENSIVE MOBILITY PLAN FOR KMA 37 MASS RAPID TRANSIT SYSTEM
OBSERVATIONS
• The decade 1986 to 1996 has seen a sudden increase in passenger growth in metro. This
sudden increase can be attributed to the fact that the complete stretch of present Metro
Railway from Dum Dum to Tollygunj was open to public from 1995.
• From 1996 till date, the passenger growth rate has been declining. There are various
reasons which explain the above fact.
o The metro alignment has not been extended from the time it came into revenue
service.
o Total absence of feeder service.
o The two railway stations, Howrah and Sealdah that have the largest share of
passengers have not been integrated with the metro system.
o Operation and maintenance of the system is extremely poor. (refer to Table 4.3)
o It is being run on suburban railway system and not as urban Mass Transit system.
TABLE 4.3: TRAIN LATE/ DETENTION DUE TO ROLLING STOCK
Year Door Poor Acceleration Brake Others Total
2000-01 92 19 11 25 147 2001-02 112 29 7 28 176 2002-03 59 20 6 15 100 2003-04 92 22 6 31 151 2004-05 101 14 9 30 154 2005-06 54 13 3 27 97 2006-07 54 5 7 25 91 2007-08
(up to Dec) 14 4 4 17 39
Source: Metro Railway, Kolkata, 2008
The benefits of Metro Rail can be summarized as;
• Requires 1/5th energy per passenger kilometers.
• Causes less noise, no air pollution and eco-friendly transport system.
• Occupies no road space, if underground and only about 2.60 meters width of the road, if elevated.
• More reliable, comfortable and safer than road based systems.
• Reduces journey time.
• Offers point to point service.
When quantified to some extent the following table shows the saving in terms of revenue considering the
social and economic costs.
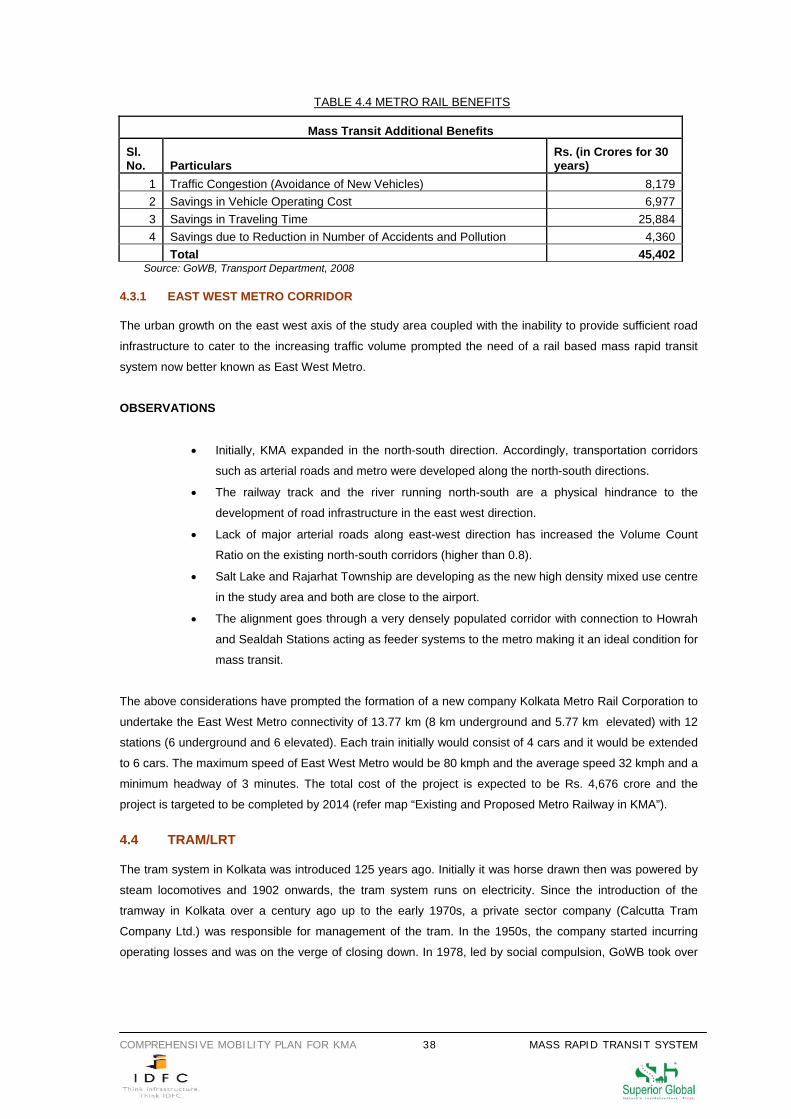
COMPREHENSIVE MOBILITY PLAN FOR KMA 38 MASS RAPID TRANSIT SYSTEM
TABLE 4.4 METRO RAIL BENEFITS
Mass Transit Additional Benefits
Sl. No. Particulars
Rs. (in Crores for 30 years)
1 Traffic Congestion (Avoidance of New Vehicles) 8,1792 Savings in Vehicle Operating Cost 6,9773 Savings in Traveling Time 25,8844 Savings due to Reduction in Number of Accidents and Pollution 4,360 Total 45,402
Source: GoWB, Transport Department, 2008 4.3.1 EAST WEST METRO CORRIDOR The urban growth on the east west axis of the study area coupled with the inability to provide sufficient road
infrastructure to cater to the increasing traffic volume prompted the need of a rail based mass rapid transit
system now better known as East West Metro.
OBSERVATIONS
• Initially, KMA expanded in the north-south direction. Accordingly, transportation corridors
such as arterial roads and metro were developed along the north-south directions.
• The railway track and the river running north-south are a physical hindrance to the
development of road infrastructure in the east west direction.
• Lack of major arterial roads along east-west direction has increased the Volume Count
Ratio on the existing north-south corridors (higher than 0.8).
• Salt Lake and Rajarhat Township are developing as the new high density mixed use centre
in the study area and both are close to the airport.
• The alignment goes through a very densely populated corridor with connection to Howrah
and Sealdah Stations acting as feeder systems to the metro making it an ideal condition for
mass transit.
The above considerations have prompted the formation of a new company Kolkata Metro Rail Corporation to
undertake the East West Metro connectivity of 13.77 km (8 km underground and 5.77 km elevated) with 12
stations (6 underground and 6 elevated). Each train initially would consist of 4 cars and it would be extended
to 6 cars. The maximum speed of East West Metro would be 80 kmph and the average speed 32 kmph and a
minimum headway of 3 minutes. The total cost of the project is expected to be Rs. 4,676 crore and the
project is targeted to be completed by 2014 (refer map “Existing and Proposed Metro Railway in KMA”).
4.4 TRAM/LRT The tram system in Kolkata was introduced 125 years ago. Initially it was horse drawn then was powered by
steam locomotives and 1902 onwards, the tram system runs on electricity. Since the introduction of the
tramway in Kolkata over a century ago up to the early 1970s, a private sector company (Calcutta Tram
Company Ltd.) was responsible for management of the tram. In the 1950s, the company started incurring
operating losses and was on the verge of closing down. In 1978, led by social compulsion, GoWB took over
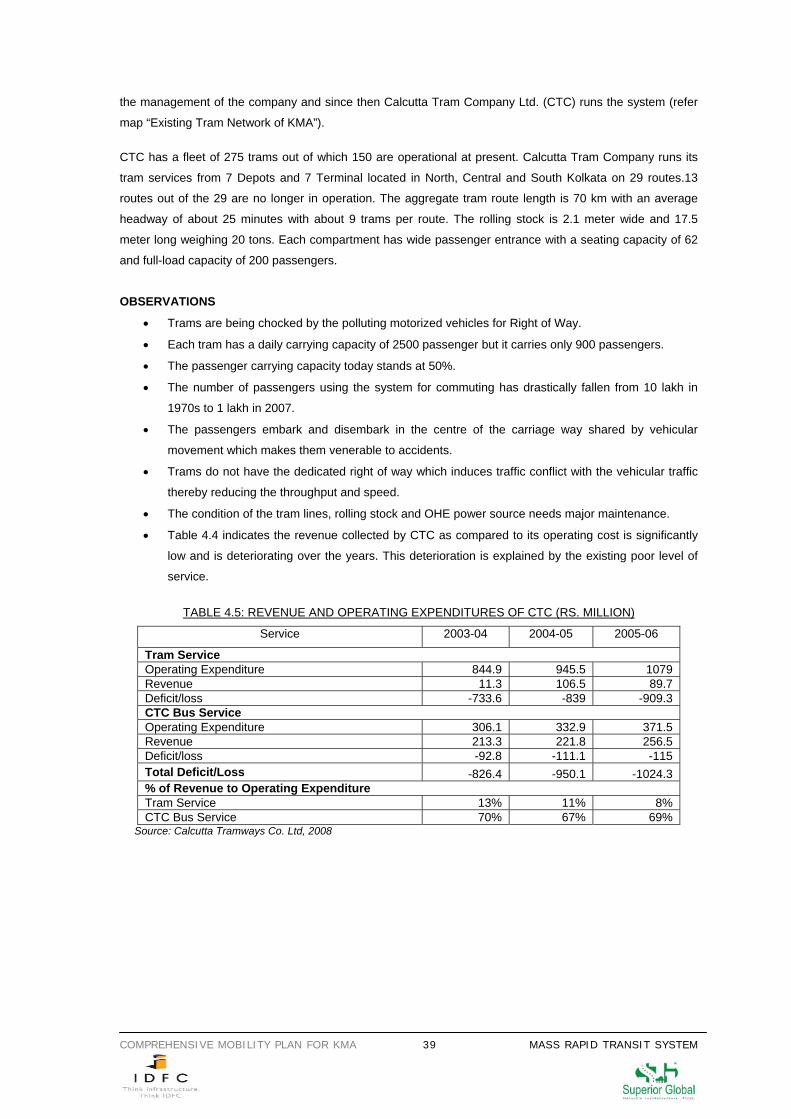
COMPREHENSIVE MOBILITY PLAN FOR KMA 39 MASS RAPID TRANSIT SYSTEM
the management of the company and since then Calcutta Tram Company Ltd. (CTC) runs the system (refer
map “Existing Tram Network of KMA”).
CTC has a fleet of 275 trams out of which 150 are operational at present. Calcutta Tram Company runs its
tram services from 7 Depots and 7 Terminal located in North, Central and South Kolkata on 29 routes.13
routes out of the 29 are no longer in operation. The aggregate tram route length is 70 km with an average
headway of about 25 minutes with about 9 trams per route. The rolling stock is 2.1 meter wide and 17.5
meter long weighing 20 tons. Each compartment has wide passenger entrance with a seating capacity of 62
and full-load capacity of 200 passengers.
OBSERVATIONS
• Trams are being chocked by the polluting motorized vehicles for Right of Way.
• Each tram has a daily carrying capacity of 2500 passenger but it carries only 900 passengers.
• The passenger carrying capacity today stands at 50%.
• The number of passengers using the system for commuting has drastically fallen from 10 lakh in
1970s to 1 lakh in 2007.
• The passengers embark and disembark in the centre of the carriage way shared by vehicular
movement which makes them venerable to accidents.
• Trams do not have the dedicated right of way which induces traffic conflict with the vehicular traffic
thereby reducing the throughput and speed.
• The condition of the tram lines, rolling stock and OHE power source needs major maintenance.
• Table 4.4 indicates the revenue collected by CTC as compared to its operating cost is significantly
low and is deteriorating over the years. This deterioration is explained by the existing poor level of
service.
TABLE 4.5: REVENUE AND OPERATING EXPENDITURES OF CTC (RS. MILLION)
Service 2003-04 2004-05 2005-06
Tram Service Operating Expenditure 844.9 945.5 1079 Revenue 11.3 106.5 89.7 Deficit/loss -733.6 -839 -909.3 CTC Bus Service Operating Expenditure 306.1 332.9 371.5 Revenue 213.3 221.8 256.5 Deficit/loss -92.8 -111.1 -115 Total Deficit/Loss -826.4 -950.1 -1024.3 % of Revenue to Operating Expenditure Tram Service 13% 11% 8% CTC Bus Service 70% 67% 69%
Source: Calcutta Tramways Co. Ltd, 2008
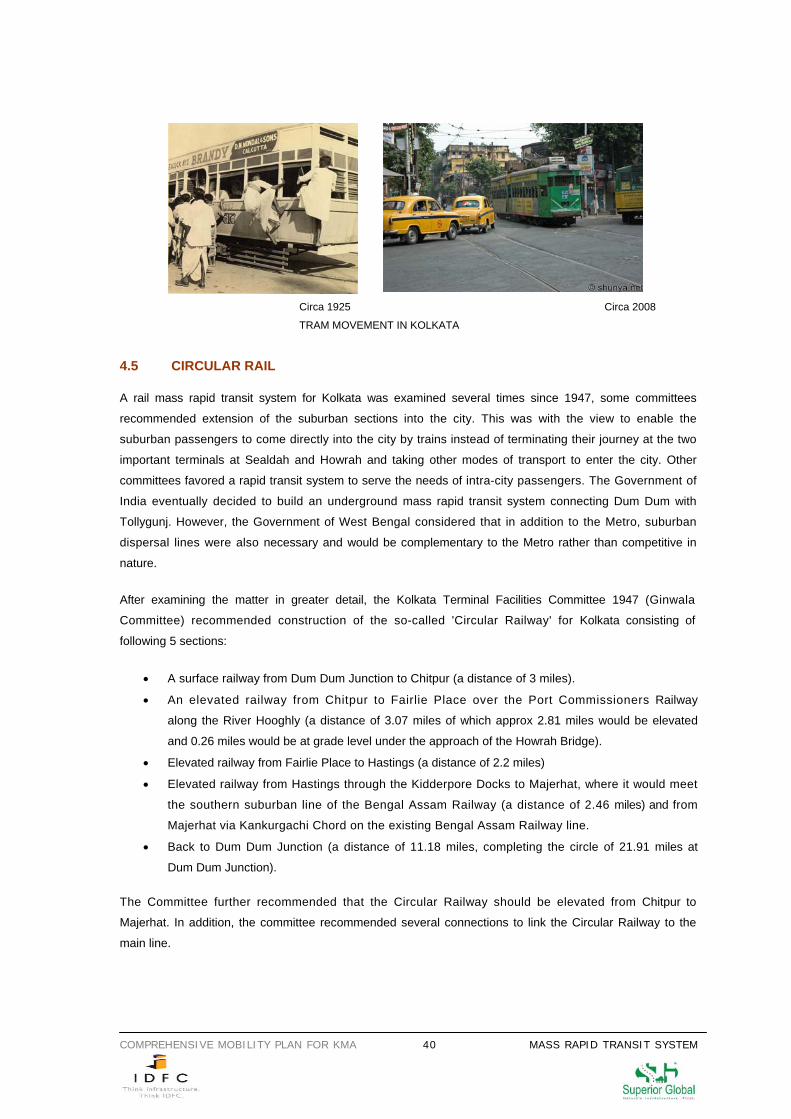
COMPREHENSIVE MOBILITY PLAN FOR KMA 40 MASS RAPID TRANSIT SYSTEM
Circa 1925 Circa 2008
TRAM MOVEMENT IN KOLKATA
4.5 CIRCULAR RAIL
A rail mass rapid transit system for Kolkata was examined several times since 1947, some committees
recommended extension of the suburban sections into the city. This was with the view to enable the
suburban passengers to come directly into the city by trains instead of terminating their journey at the two
important terminals at Sealdah and Howrah and taking other modes of transport to enter the city. Other
committees favored a rapid transit system to serve the needs of intra-city passengers. The Government of
India eventually decided to build an underground mass rapid transit system connecting Dum Dum with
Tollygunj. However, the Government of West Bengal considered that in addition to the Metro, suburban
dispersal lines were also necessary and would be complementary to the Metro rather than competitive in
nature.
After examining the matter in greater detail, the Kolkata Terminal Facilities Committee 1947 (Ginwala
Committee) recommended construction of the so-called 'Circular Railway' for Kolkata consisting of
following 5 sections:
• A surface railway from Dum Dum Junction to Chitpur (a distance of 3 miles).
• An elevated railway from Chitpur to Fairlie Place over the Port Commissioners Railway
along the River Hooghly (a distance of 3.07 miles of which approx 2.81 miles would be elevated
and 0.26 miles would be at grade level under the approach of the Howrah Bridge).
• Elevated railway from Fairlie Place to Hastings (a distance of 2.2 miles)
• Elevated railway from Hastings through the Kidderpore Docks to Majerhat, where it would meet
the southern suburban line of the Bengal Assam Railway (a distance of 2.46 miles) and from
Majerhat via Kankurgachi Chord on the existing Bengal Assam Railway line.
• Back to Dum Dum Junction (a distance of 11.18 miles, completing the circle of 21.91 miles at
Dum Dum Junction).
The Committee further recommended that the Circular Railway should be elevated from Chitpur to
Majerhat. In addition, the committee recommended several connections to link the Circular Railway to the
main line.
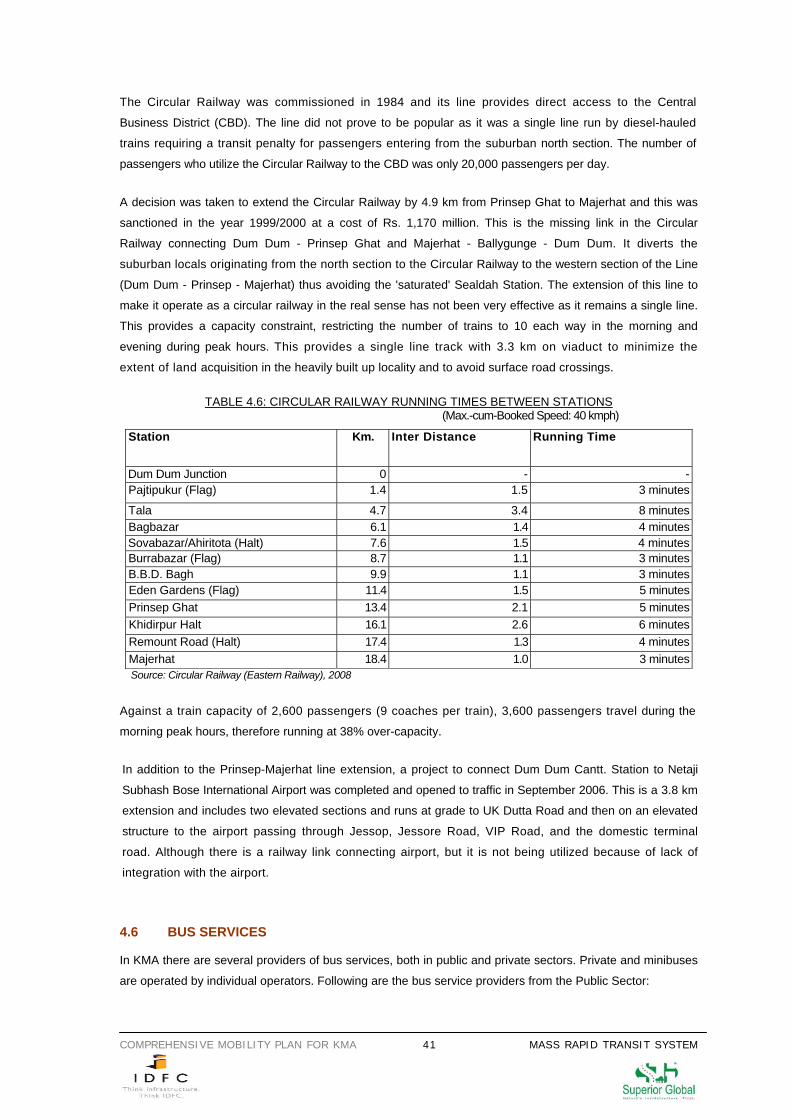
COMPREHENSIVE MOBILITY PLAN FOR KMA 41 MASS RAPID TRANSIT SYSTEM
The Circular Railway was commissioned in 1984 and its line provides direct access to the Central
Business District (CBD). The line did not prove to be popular as it was a single line run by diesel-hauled
trains requiring a transit penalty for passengers entering from the suburban north section. The number of
passengers who utilize the Circular Railway to the CBD was only 20,000 passengers per day.
A decision was taken to extend the Circular Railway by 4.9 km from Prinsep Ghat to Majerhat and this was
sanctioned in the year 1999/2000 at a cost of Rs. 1,170 million. This is the missing link in the Circular
Railway connecting Dum Dum - Prinsep Ghat and Majerhat - Ballygunge - Dum Dum. It diverts the
suburban locals originating from the north section to the Circular Railway to the western section of the Line
(Dum Dum - Prinsep - Majerhat) thus avoiding the 'saturated' Sealdah Station. The extension of this line to
make it operate as a circular railway in the real sense has not been very effective as it remains a single line.
This provides a capacity constraint, restricting the number of trains to 10 each way in the morning and
evening during peak hours. This provides a single line track with 3.3 km on viaduct to minimize the
extent of land acquisition in the heavily built up locality and to avoid surface road crossings.
TABLE 4.6: CIRCULAR RAILWAY RUNNING TIMES BETWEEN STATIONS
(Max.-cum-Booked Speed: 40 kmph)
Station Km. Inter Distance Running Time
Dum Dum Junction 0 - -Pajtipukur (Flag) 1.4 1.5 3 minutes
Tala 4.7 3.4 8 minutesBagbazar 6.1 1.4 4 minutesSovabazar/Ahiritota (Halt) 7.6 1.5 4 minutesBurrabazar (Flag) 8.7 1.1 3 minutesB.B.D. Bagh 9.9 1.1 3 minutesEden Gardens (Flag) 11.4 1.5 5 minutesPrinsep Ghat 13.4 2.1 5 minutesKhidirpur Halt 16.1 2.6 6 minutesRemount Road (Halt) 17.4 1.3 4 minutesMajerhat 18.4 1.0 3 minutes Source: Circular Railway (Eastern Railway), 2008
Against a train capacity of 2,600 passengers (9 coaches per train), 3,600 passengers travel during the
morning peak hours, therefore running at 38% over-capacity.
In addition to the Prinsep-Majerhat line extension, a project to connect Dum Dum Cantt. Station to Netaji
Subhash Bose International Airport was completed and opened to traffic in September 2006. This is a 3.8 km
extension and includes two elevated sections and runs at grade to UK Dutta Road and then on an elevated
structure to the airport passing through Jessop, Jessore Road, VIP Road, and the domestic terminal
road. Although there is a railway link connecting airport, but it is not being utilized because of lack of
integration with the airport.
4.6 BUS SERVICES In KMA there are several providers of bus services, both in public and private sectors. Private and minibuses
are operated by individual operators. Following are the bus service providers from the Public Sector:
COMPREHENSIVE MOBILITY PLAN FOR KMA 42 MASS RAPID TRANSIT SYSTEM
• Calcutta State Transport Corporation (CSTC);
• Calcutta Tramways Company (CTC);
• West Bengal Surface Transport Corporation (WBSTC);
• South Bengal State Transport Corporation (SBSTC);
• North Bengal State Transport Corporation (NBSTC);
In the private sector, there are a large number of passenger bus and minibus operators with a small fleet
each (often one or two buses each) plying on routes as specified by the Transport Department. Besides
these, chartered buses carry a large number of passengers in the metropolitan area.
Calcutta State Transport Corporation (CSTC), Calcutta Tramways Company (CTC), West Bengal Surface
Transport Corporation (WBSTC) operates mainly in KMA. CTC provides bus services in addition to tram
services. WBSTC is the provider of ferry services across the River Hooghly as well as bus services. The
other transport providers, South Bengal State Transport Corporation (SBSTC) and North Bengal State
Transport Corporation (NBSTC) operate long distance buses with Kolkata as one of the terminal points.
OBSERVATIONS
• There is institutional fragmentation in the provision of passenger bus services. CSTC, CTC (bus
services) and WBSTC are all state owned and operated bus services. CTC, which primarily was
provider of tram services for over a century has also started providing passenger bus services since
1978.
• The bus sector in Kolkata has a large number of small operators who offer their services in an
unorganized manner.
• The lack of organization of the disparate operators leads to the absence of any form of control in
terms of passengers carried or fares paid. On the one hand this encourages fares to be pocketed by
drivers or conductors; on the other hand, no true idea of taxes to be paid is given.
• The high number of obsolete or extremely old buses in operation is a major cause of congestion,
pollution and traffic accidents. This situation is made even more serious due to the non-existence of
obligatory mechanical revisions and absence of a culture of preventive fleet maintenance within the
private companies. In all cases, these scenarios of urban transport impose a heavy cost on society.
West Bengal Surface Transport Corporation (WBSTC) and South Bengal State Transport Corporation
(SBSTC) mostly provide services between suburban area and the city. WBSTC links the city to different
Ferry Ghats within as well as outside Kolkata. SBSTC had a fairly strong presence in the city service few
years back, but the number of buses with service within Kolkata is now limited.
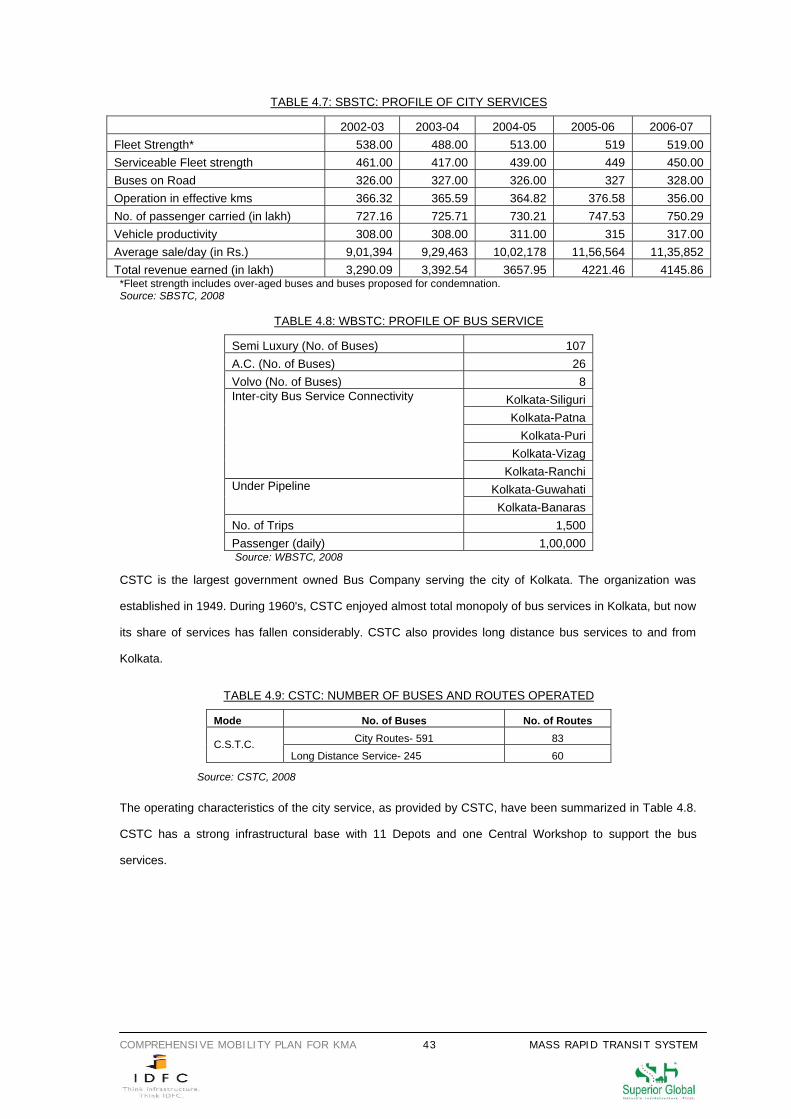
COMPREHENSIVE MOBILITY PLAN FOR KMA 43 MASS RAPID TRANSIT SYSTEM
TABLE 4.7: SBSTC: PROFILE OF CITY SERVICES
2002-03 2003-04 2004-05 2005-06 2006-07 Fleet Strength* 538.00 488.00 513.00 519 519.00 Serviceable Fleet strength 461.00 417.00 439.00 449 450.00 Buses on Road 326.00 327.00 326.00 327 328.00 Operation in effective kms 366.32 365.59 364.82 376.58 356.00 No. of passenger carried (in lakh) 727.16 725.71 730.21 747.53 750.29 Vehicle productivity 308.00 308.00 311.00 315 317.00 Average sale/day (in Rs.) 9,01,394 9,29,463 10,02,178 11,56,564 11,35,852 Total revenue earned (in lakh) 3,290.09 3,392.54 3657.95 4221.46 4145.86 *Fleet strength includes over-aged buses and buses proposed for condemnation. Source: SBSTC, 2008
TABLE 4.8: WBSTC: PROFILE OF BUS SERVICE
Semi Luxury (No. of Buses) 107 A.C. (No. of Buses) 26 Volvo (No. of Buses) 8
Kolkata-Siliguri Kolkata-Patna
Kolkata-Puri Kolkata-Vizag
Inter-city Bus Service Connectivity
Kolkata-Ranchi Kolkata-Guwahati Under Pipeline
Kolkata-Banaras No. of Trips 1,500 Passenger (daily) 1,00,000
Source: WBSTC, 2008
CSTC is the largest government owned Bus Company serving the city of Kolkata. The organization was
established in 1949. During 1960's, CSTC enjoyed almost total monopoly of bus services in Kolkata, but now
its share of services has fallen considerably. CSTC also provides long distance bus services to and from
Kolkata.
TABLE 4.9: CSTC: NUMBER OF BUSES AND ROUTES OPERATED
Mode No. of Buses No. of Routes City Routes- 591 83 C.S.T.C.
Long Distance Service- 245 60
Source: CSTC, 2008
The operating characteristics of the city service, as provided by CSTC, have been summarized in Table 4.8.
CSTC has a strong infrastructural base with 11 Depots and one Central Workshop to support the bus
services.
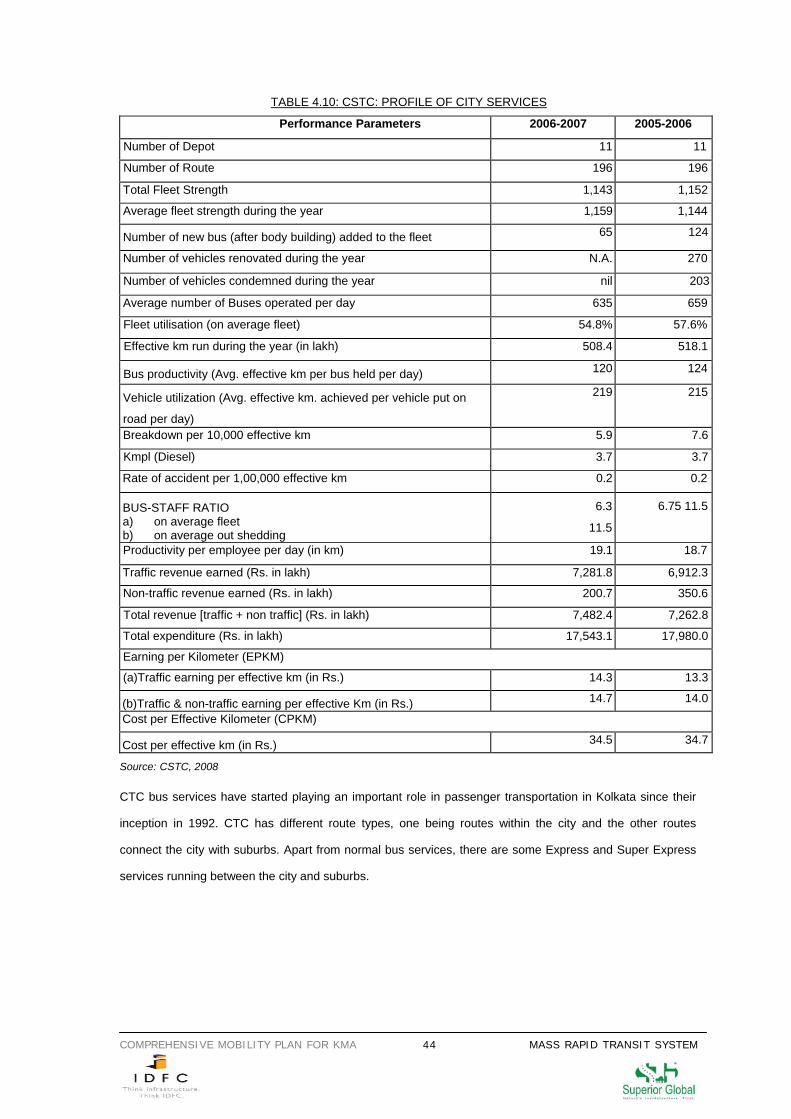
COMPREHENSIVE MOBILITY PLAN FOR KMA 44 MASS RAPID TRANSIT SYSTEM
TABLE 4.10: CSTC: PROFILE OF CITY SERVICES
Performance Parameters 2006-2007 2005-2006
Number of Depot 11 11
Number of Route 196 196
Total Fleet Strength 1,143 1,152
Average fleet strength during the year 1,159 1,144
Number of new bus (after body building) added to the fleet 65 124
Number of vehicles renovated during the year N.A. 270
Number of vehicles condemned during the year nil 203
Average number of Buses operated per day 635 659
Fleet utilisation (on average fleet) 54.8% 57.6%
Effective km run during the year (in lakh) 508.4 518.1
Bus productivity (Avg. effective km per bus held per day) 120 124
Vehicle utilization (Avg. effective km. achieved per vehicle put on
road per day)
219 215
Breakdown per 10,000 effective km 5.9 7.6
Kmpl (Diesel) 3.7 3.7
Rate of accident per 1,00,000 effective km 0.2 0.2
BUS-STAFF RATIO a) on average fleet b) on average out shedding
6.3
11.5
6.75 11.5
Productivity per employee per day (in km) 19.1 18.7
Traffic revenue earned (Rs. in lakh) 7,281.8 6,912.3
Non-traffic revenue earned (Rs. in lakh) 200.7 350.6
Total revenue [traffic + non traffic] (Rs. in lakh) 7,482.4 7,262.8
Total expenditure (Rs. in lakh) 17,543.1 17,980.0
Earning per Kilometer (EPKM)
(a)Traffic earning per effective km (in Rs.) 14.3 13.3
(b)Traffic & non-traffic earning per effective Km (in Rs.) 14.7 14.0
Cost per Effective Kilometer (CPKM)
Cost per effective km (in Rs.) 34.5 34.7
Source: CSTC, 2008
CTC bus services have started playing an important role in passenger transportation in Kolkata since their
inception in 1992. CTC has different route types, one being routes within the city and the other routes
connect the city with suburbs. Apart from normal bus services, there are some Express and Super Express
services running between the city and suburbs.
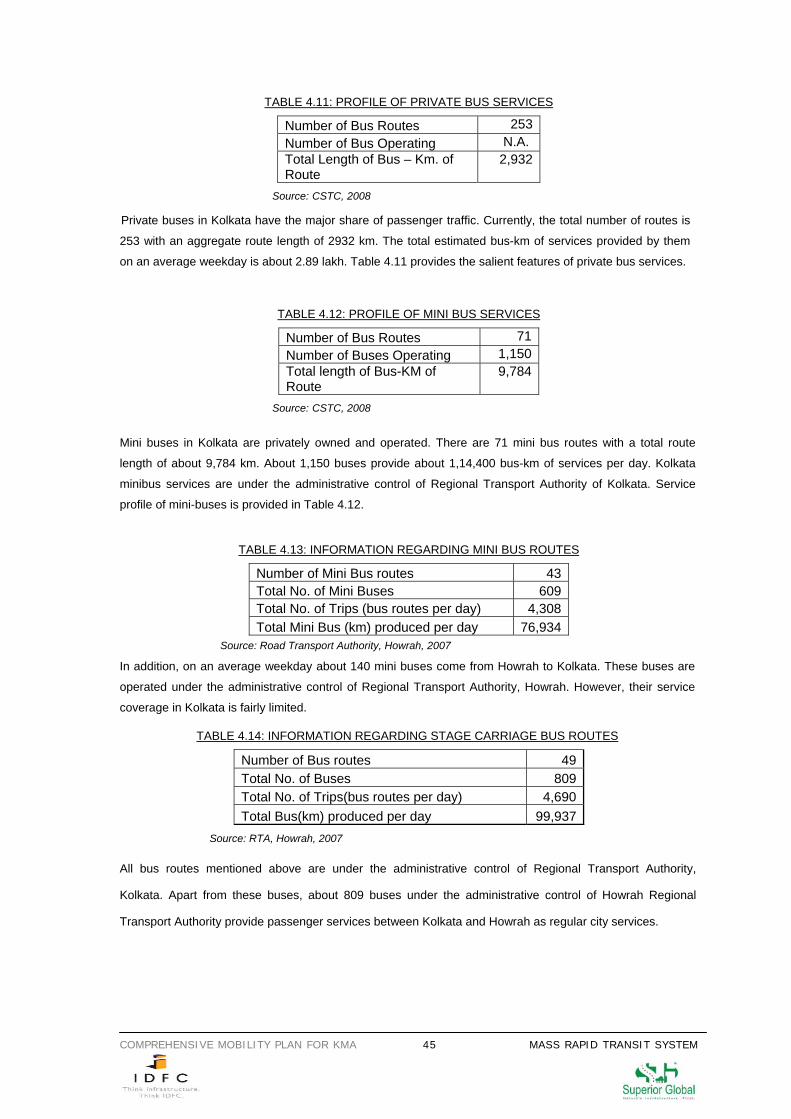
COMPREHENSIVE MOBILITY PLAN FOR KMA 45 MASS RAPID TRANSIT SYSTEM
TABLE 4.11: PROFILE OF PRIVATE BUS SERVICES
Number of Bus Routes 253Number of Bus Operating N.A. Total Length of Bus – Km. of Route
2,932
Source: CSTC, 2008
Private buses in Kolkata have the major share of passenger traffic. Currently, the total number of routes is
253 with an aggregate route length of 2932 km. The total estimated bus-km of services provided by them
on an average weekday is about 2.89 lakh. Table 4.11 provides the salient features of private bus services.
TABLE 4.12: PROFILE OF MINI BUS SERVICES
Number of Bus Routes 71Number of Buses Operating 1,150Total length of Bus-KM of Route
9,784
Source: CSTC, 2008 Mini buses in Kolkata are privately owned and operated. There are 71 mini bus routes with a total route
length of about 9,784 km. About 1,150 buses provide about 1,14,400 bus-km of services per day. Kolkata
minibus services are under the administrative control of Regional Transport Authority of Kolkata. Service
profile of mini-buses is provided in Table 4.12.
TABLE 4.13: INFORMATION REGARDING MINI BUS ROUTES
Number of Mini Bus routes 43 Total No. of Mini Buses 609 Total No. of Trips (bus routes per day) 4,308 Total Mini Bus (km) produced per day 76,934
Source: Road Transport Authority, Howrah, 2007
In addition, on an average weekday about 140 mini buses come from Howrah to Kolkata. These buses are
operated under the administrative control of Regional Transport Authority, Howrah. However, their service
coverage in Kolkata is fairly limited.
TABLE 4.14: INFORMATION REGARDING STAGE CARRIAGE BUS ROUTES
Number of Bus routes 49 Total No. of Buses 809 Total No. of Trips(bus routes per day) 4,690 Total Bus(km) produced per day 99,937
Source: RTA, Howrah, 2007
All bus routes mentioned above are under the administrative control of Regional Transport Authority,
Kolkata. Apart from these buses, about 809 buses under the administrative control of Howrah Regional
Transport Authority provide passenger services between Kolkata and Howrah as regular city services.
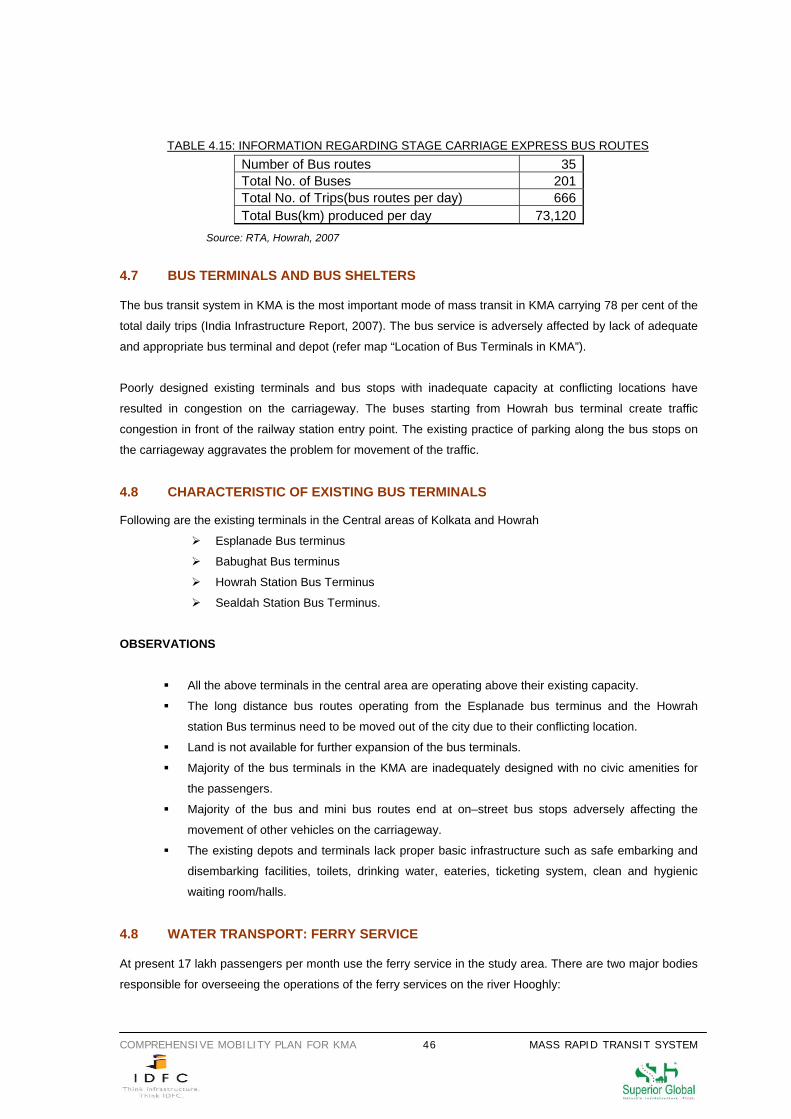
COMPREHENSIVE MOBILITY PLAN FOR KMA 46 MASS RAPID TRANSIT SYSTEM
TABLE 4.15: INFORMATION REGARDING STAGE CARRIAGE EXPRESS BUS ROUTES Number of Bus routes 35 Total No. of Buses 201 Total No. of Trips(bus routes per day) 666 Total Bus(km) produced per day 73,120
Source: RTA, Howrah, 2007
4.7 BUS TERMINALS AND BUS SHELTERS The bus transit system in KMA is the most important mode of mass transit in KMA carrying 78 per cent of the
total daily trips (India Infrastructure Report, 2007). The bus service is adversely affected by lack of adequate
and appropriate bus terminal and depot (refer map “Location of Bus Terminals in KMA”).
Poorly designed existing terminals and bus stops with inadequate capacity at conflicting locations have
resulted in congestion on the carriageway. The buses starting from Howrah bus terminal create traffic
congestion in front of the railway station entry point. The existing practice of parking along the bus stops on
the carriageway aggravates the problem for movement of the traffic.
4.8 CHARACTERISTIC OF EXISTING BUS TERMINALS Following are the existing terminals in the Central areas of Kolkata and Howrah
Esplanade Bus terminus
Babughat Bus terminus
Howrah Station Bus Terminus
Sealdah Station Bus Terminus.
OBSERVATIONS
All the above terminals in the central area are operating above their existing capacity.
The long distance bus routes operating from the Esplanade bus terminus and the Howrah
station Bus terminus need to be moved out of the city due to their conflicting location.
Land is not available for further expansion of the bus terminals.
Majority of the bus terminals in the KMA are inadequately designed with no civic amenities for
the passengers.
Majority of the bus and mini bus routes end at on–street bus stops adversely affecting the
movement of other vehicles on the carriageway.
The existing depots and terminals lack proper basic infrastructure such as safe embarking and
disembarking facilities, toilets, drinking water, eateries, ticketing system, clean and hygienic
waiting room/halls.
4.8 WATER TRANSPORT: FERRY SERVICE At present 17 lakh passengers per month use the ferry service in the study area. There are two major bodies
responsible for overseeing the operations of the ferry services on the river Hooghly:
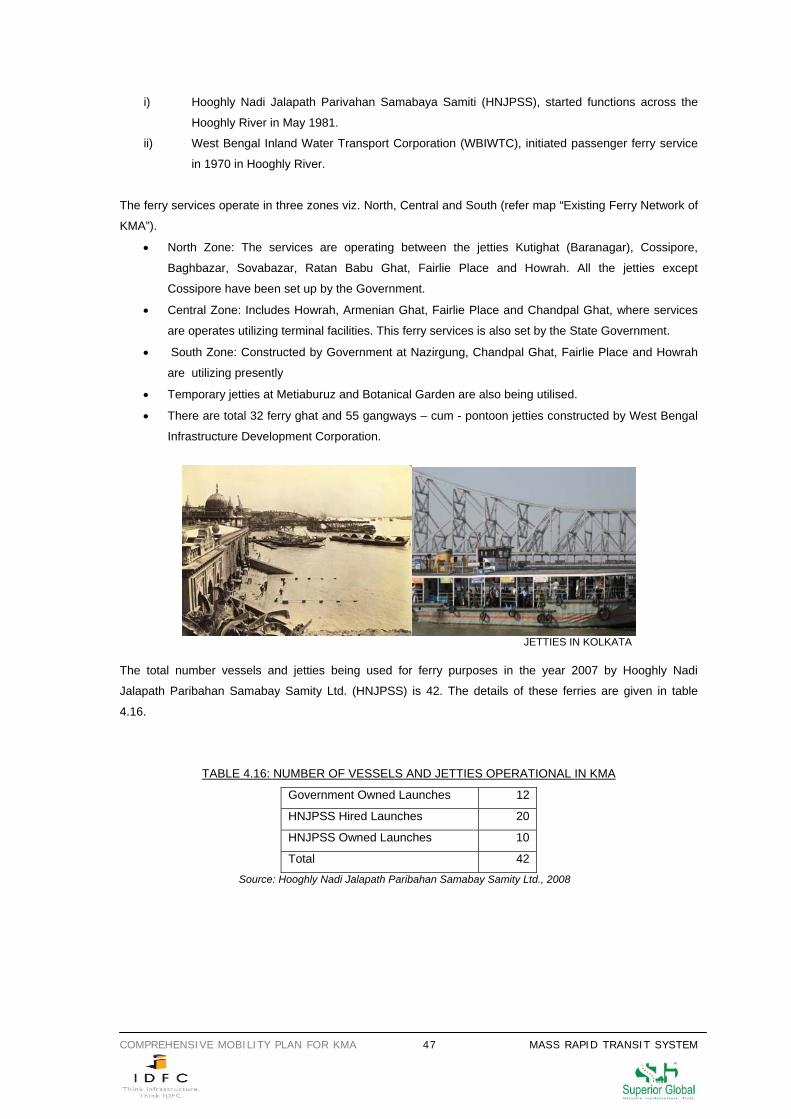
COMPREHENSIVE MOBILITY PLAN FOR KMA 47 MASS RAPID TRANSIT SYSTEM
i) Hooghly Nadi Jalapath Parivahan Samabaya Samiti (HNJPSS), started functions across the
Hooghly River in May 1981.
ii) West Bengal Inland Water Transport Corporation (WBIWTC), initiated passenger ferry service
in 1970 in Hooghly River.
The ferry services operate in three zones viz. North, Central and South (refer map “Existing Ferry Network of
KMA”).
• North Zone: The services are operating between the jetties Kutighat (Baranagar), Cossipore,
Baghbazar, Sovabazar, Ratan Babu Ghat, Fairlie Place and Howrah. All the jetties except
Cossipore have been set up by the Government.
• Central Zone: Includes Howrah, Armenian Ghat, Fairlie Place and Chandpal Ghat, where services
are operates utilizing terminal facilities. This ferry services is also set by the State Government.
• South Zone: Constructed by Government at Nazirgung, Chandpal Ghat, Fairlie Place and Howrah
are utilizing presently
• Temporary jetties at Metiaburuz and Botanical Garden are also being utilised.
• There are total 32 ferry ghat and 55 gangways – cum - pontoon jetties constructed by West Bengal
Infrastructure Development Corporation.
JETTIES IN KOLKATA
The total number vessels and jetties being used for ferry purposes in the year 2007 by Hooghly Nadi
Jalapath Paribahan Samabay Samity Ltd. (HNJPSS) is 42. The details of these ferries are given in table
4.16.
TABLE 4.16: NUMBER OF VESSELS AND JETTIES OPERATIONAL IN KMA
Government Owned Launches 12
HNJPSS Hired Launches 20
HNJPSS Owned Launches 10
Total 42
Source: Hooghly Nadi Jalapath Paribahan Samabay Samity Ltd., 2008
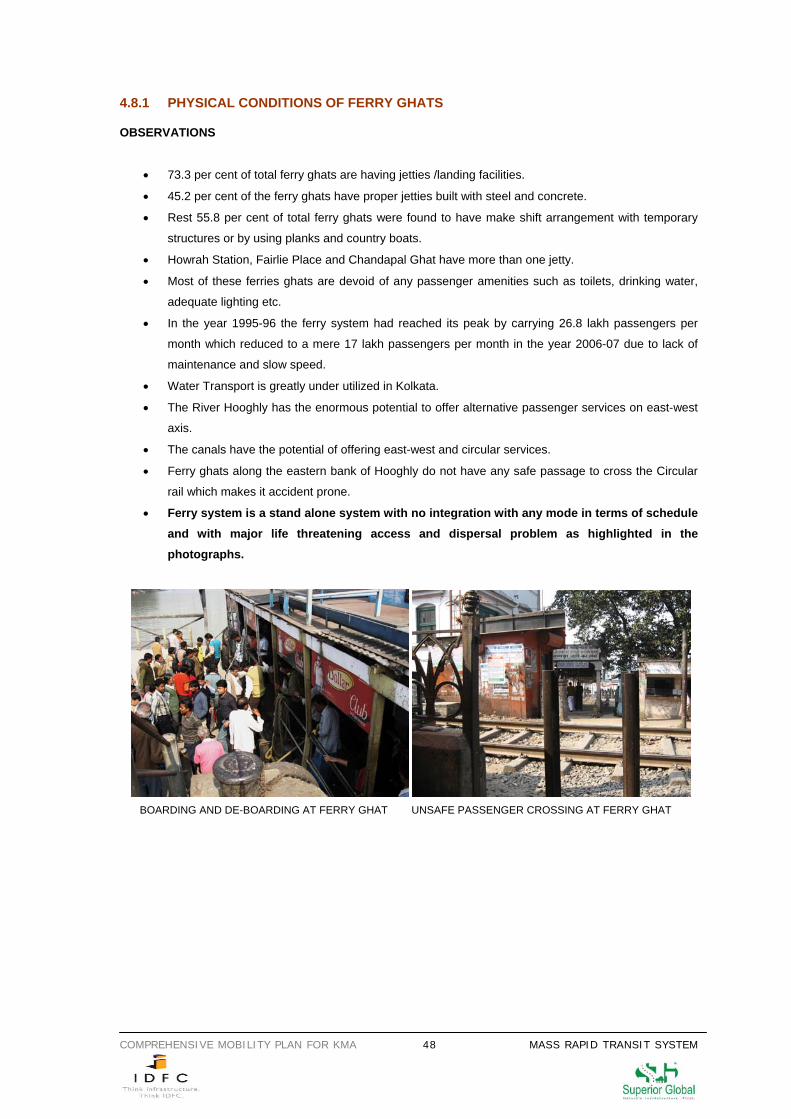
COMPREHENSIVE MOBILITY PLAN FOR KMA 48 MASS RAPID TRANSIT SYSTEM
4.8.1 PHYSICAL CONDITIONS OF FERRY GHATS OBSERVATIONS
• 73.3 per cent of total ferry ghats are having jetties /landing facilities.
• 45.2 per cent of the ferry ghats have proper jetties built with steel and concrete.
• Rest 55.8 per cent of total ferry ghats were found to have make shift arrangement with temporary
structures or by using planks and country boats.
• Howrah Station, Fairlie Place and Chandapal Ghat have more than one jetty.
• Most of these ferries ghats are devoid of any passenger amenities such as toilets, drinking water,
adequate lighting etc.
• In the year 1995-96 the ferry system had reached its peak by carrying 26.8 lakh passengers per
month which reduced to a mere 17 lakh passengers per month in the year 2006-07 due to lack of
maintenance and slow speed.
• Water Transport is greatly under utilized in Kolkata.
• The River Hooghly has the enormous potential to offer alternative passenger services on east-west
axis.
• The canals have the potential of offering east-west and circular services.
• Ferry ghats along the eastern bank of Hooghly do not have any safe passage to cross the Circular
rail which makes it accident prone.
• Ferry system is a stand alone system with no integration with any mode in terms of schedule and with major life threatening access and dispersal problem as highlighted in the photographs.
BOARDING AND DE-BOARDING AT FERRY GHAT UNSAFE PASSENGER CROSSING AT FERRY GHAT
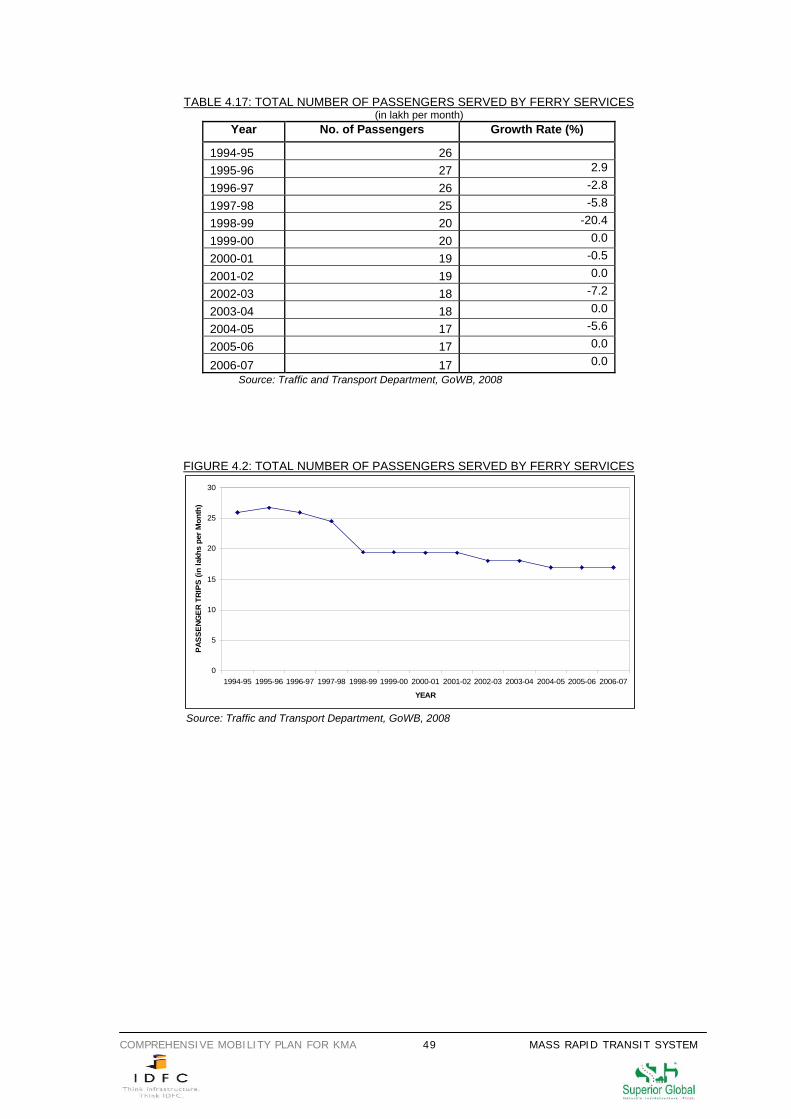
COMPREHENSIVE MOBILITY PLAN FOR KMA 49 MASS RAPID TRANSIT SYSTEM
TABLE 4.17: TOTAL NUMBER OF PASSENGERS SERVED BY FERRY SERVICES (in lakh per month)
Year No. of Passengers Growth Rate (%)
1994-95 26 1995-96 27 2.9
1996-97 26 -2.8
1997-98 25 -5.8
1998-99 20 -20.4
1999-00 20 0.0
2000-01 19 -0.5
2001-02 19 0.0
2002-03 18 -7.2
2003-04 18 0.0
2004-05 17 -5.6
2005-06 17 0.0
2006-07 17 0.0 Source: Traffic and Transport Department, GoWB, 2008
FIGURE 4.2: TOTAL NUMBER OF PASSENGERS SERVED BY FERRY SERVICES
0
5
10
15
20
25
30
1994-95 1995-96 1996-97 1997-98 1998-99 1999-00 2000-01 2001-02 2002-03 2003-04 2004-05 2005-06 2006-07
YEAR
PAS
SE
NG
ER
TR
IPS
(in
lakh
s pe
r M
onth
)
Source: Traffic and Transport Department, GoWB, 2008
COMPREHENSIVE MOBILITY PLAN FOR KMA 50 SUBURBAN RAIL
CHAPTER 5
SUBURBAN RAIL
5.1 SUBURBAN RAIL The suburban railway service are the lifeline if the KMA bringing workers as well as small
vendors to the metropolis to keep it ticking. The suburban railway services in Kolkata are
operated by Ministry of Railways (MOR) -Eastern Railway (ER) and South Eastern Railway
(SER) divisions. The Kolkata Metro Railway is also under MOR. There is a separate Circular
Railway corridor in the city also operated by ER.
The suburban railway system comes under the ambit of Eastern Railway except 116 km of
track from Howrah to Kharagpur and 30 km from Howrah to Bargachia, which are operated by
South Eastern Railway. Howrah and Sealdah are the major railway terminals of KMA. In total,
there are 12 rail alignments and 105 suburban passenger railway stations placed at an average
interval of 2 to 2.5 km. Apart from the above two major terminal stations, there are some
other important stations within the study area which are:
i) Ballygunj
ii) Dum Dum
iii) Naihati
iv) Bandel
v) Sheoraphuli
vi) Sonapur
vii) Baruipur
viii) Barasat
ix) Santragachhi
x) Chitpur
xi) Park circus station
Figure 5.1 shows the railway network developed within the KMA.
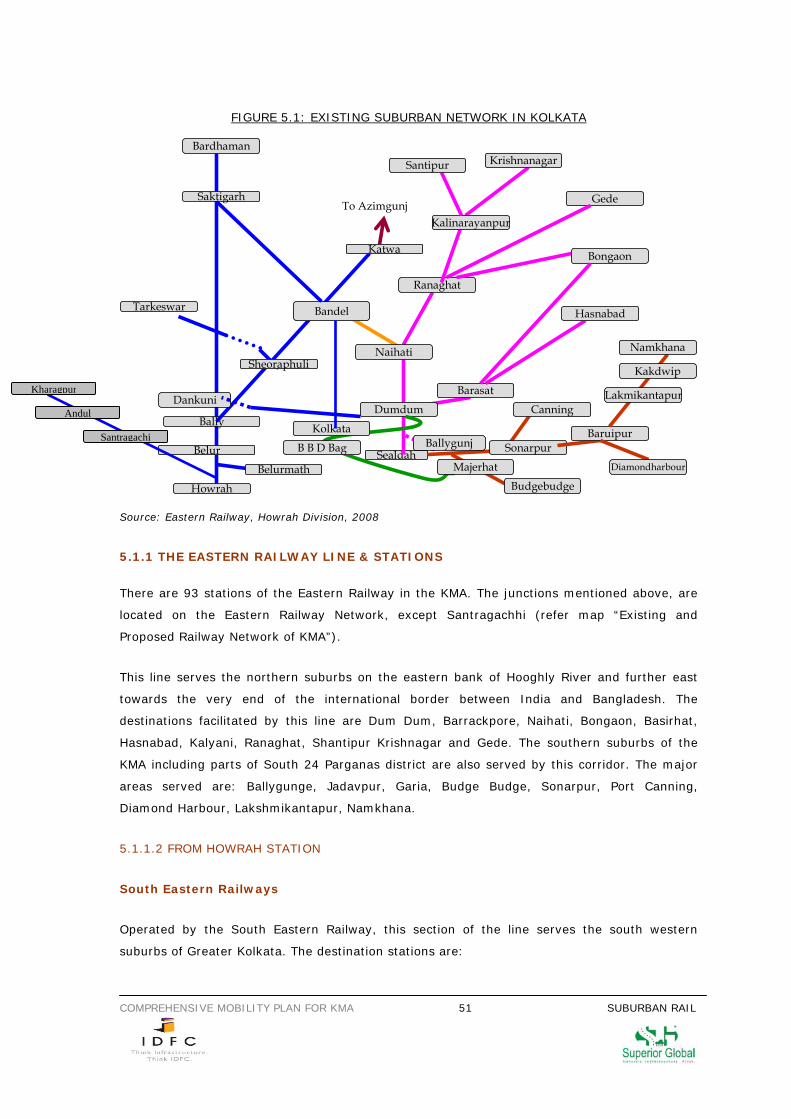
COMPREHENSIVE MOBILITY PLAN FOR KMA 51 SUBURBAN RAIL
FIGURE 5.1: EXISTING SUBURBAN NETWORK IN KOLKATA
Howrah
Belur
Bally
Sheoraphuli
Belurmath
Bandel
Gede
Katwa
To AzimgunjSaktigarh
Tarkeswar
Sealdah
Ranaghat
Naihati
Krishnanagar
Kalinarayanpur
Santipur
Bongaon
Barasat
Hasnabad
Sonarpur
Canning
Baruipur
Namkhana
Kakdwip
Lakmikantapur
Diamondharbour
Dumdum
Bardhaman
Kolkata
B B D Bag
Majerhat
Budgebudge
Dankuni
Ballygunj
Source: Eastern Railway, Howrah Division, 2008 5.1.1 THE EASTERN RAILWAY LINE & STATIONS
There are 93 stations of the Eastern Railway in the KMA. The junctions mentioned above, are
located on the Eastern Railway Network, except Santragachhi (refer map “Existing and
Proposed Railway Network of KMA”).
This line serves the northern suburbs on the eastern bank of Hooghly River and further east
towards the very end of the international border between India and Bangladesh. The
destinations facilitated by this line are Dum Dum, Barrackpore, Naihati, Bongaon, Basirhat,
Hasnabad, Kalyani, Ranaghat, Shantipur Krishnagar and Gede. The southern suburbs of the
KMA including parts of South 24 Parganas district are also served by this corridor. The major
areas served are: Ballygunge, Jadavpur, Garia, Budge Budge, Sonarpur, Port Canning,
Diamond Harbour, Lakshmikantapur, Namkhana.
5.1.1.2 FROM HOWRAH STATION
South Eastern Railways
Operated by the South Eastern Railway, this section of the line serves the south western
suburbs of Greater Kolkata. The destination stations are:
Kharagpur
Santragachi
Andul
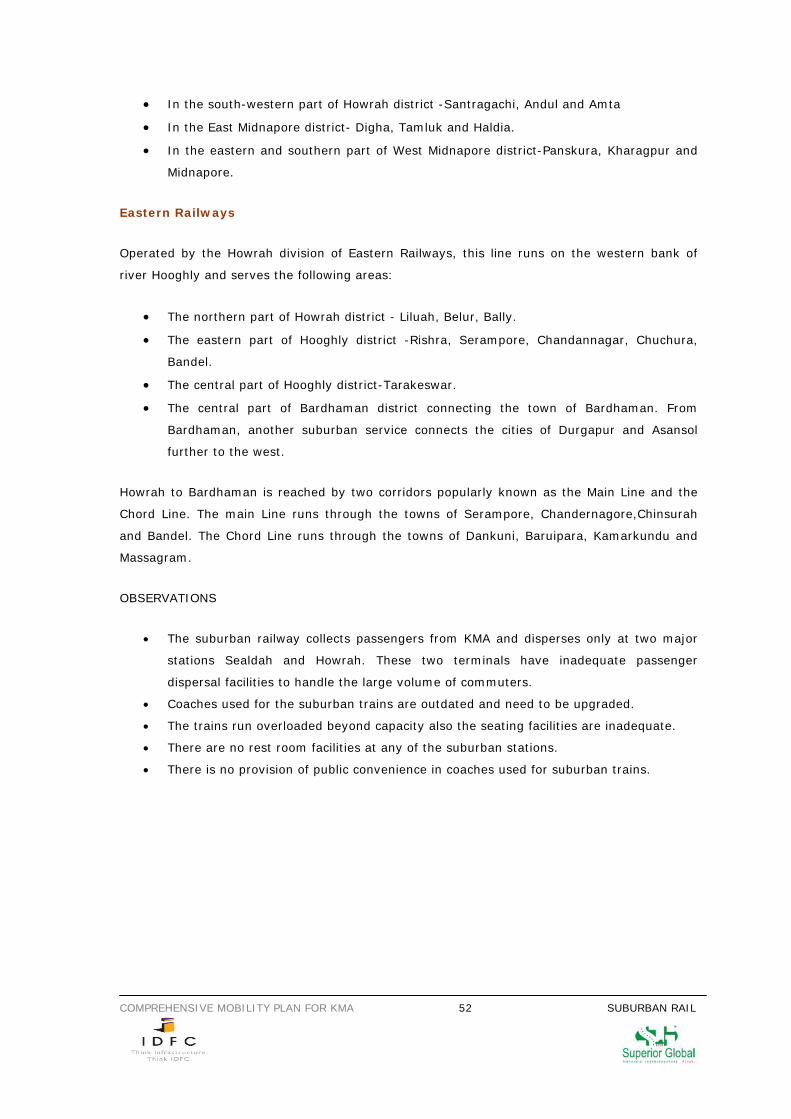
COMPREHENSIVE MOBILITY PLAN FOR KMA 52 SUBURBAN RAIL
• In the south-western part of Howrah district -Santragachi, Andul and Amta
• In the East Midnapore district- Digha, Tamluk and Haldia.
• In the eastern and southern part of West Midnapore district-Panskura, Kharagpur and
Midnapore.
Eastern Railways
Operated by the Howrah division of Eastern Railways, this line runs on the western bank of
river Hooghly and serves the following areas:
• The northern part of Howrah district - Liluah, Belur, Bally.
• The eastern part of Hooghly district -Rishra, Serampore, Chandannagar, Chuchura,
Bandel.
• The central part of Hooghly district-Tarakeswar.
• The central part of Bardhaman district connecting the town of Bardhaman. From
Bardhaman, another suburban service connects the cities of Durgapur and Asansol
further to the west.
Howrah to Bardhaman is reached by two corridors popularly known as the Main Line and the
Chord Line. The main Line runs through the towns of Serampore, Chandernagore,Chinsurah
and Bandel. The Chord Line runs through the towns of Dankuni, Baruipara, Kamarkundu and
Massagram.
OBSERVATIONS
• The suburban railway collects passengers from KMA and disperses only at two major
stations Sealdah and Howrah. These two terminals have inadequate passenger
dispersal facilities to handle the large volume of commuters.
• Coaches used for the suburban trains are outdated and need to be upgraded.
• The trains run overloaded beyond capacity also the seating facilities are inadequate.
• There are no rest room facilities at any of the suburban stations.
• There is no provision of public convenience in coaches used for suburban trains.
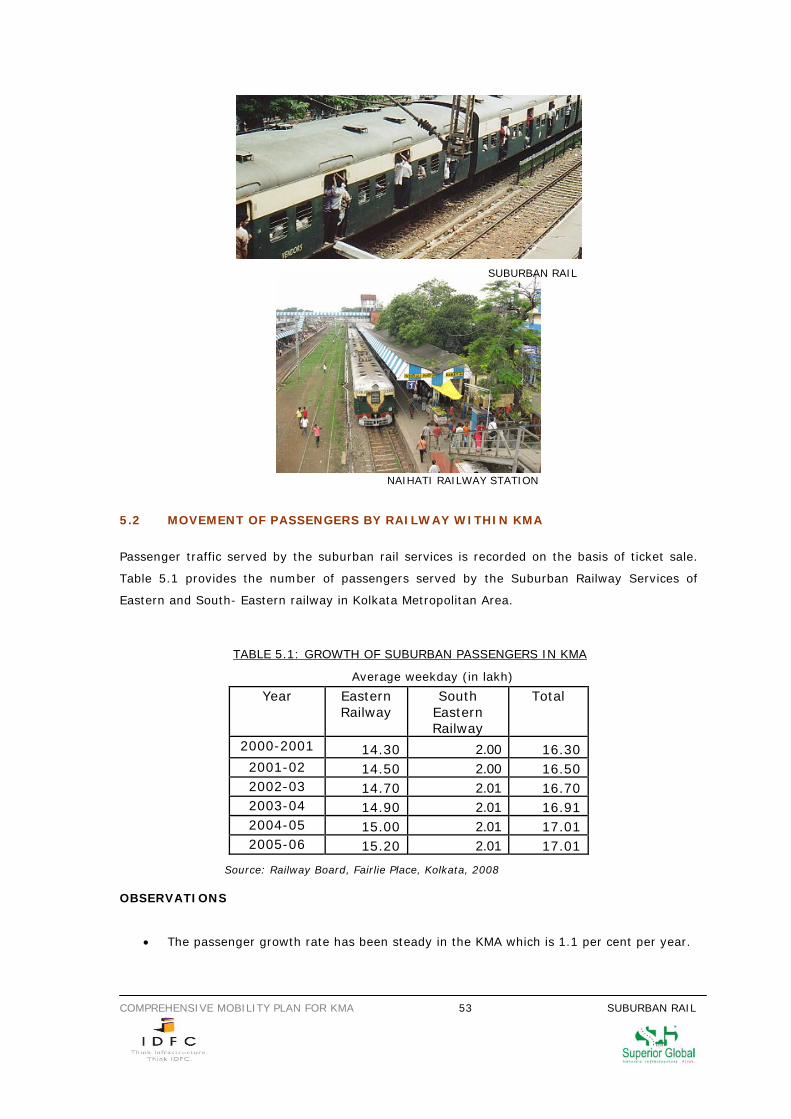
COMPREHENSIVE MOBILITY PLAN FOR KMA 53 SUBURBAN RAIL
NAIHATI RAILWAY STATION
5.2 MOVEMENT OF PASSENGERS BY RAILWAY WITHIN KMA
Passenger traffic served by the suburban rail services is recorded on the basis of ticket sale.
Table 5.1 provides the number of passengers served by the Suburban Railway Services of
Eastern and South- Eastern railway in Kolkata Metropolitan Area.
TABLE 5.1: GROWTH OF SUBURBAN PASSENGERS IN KMA
Average weekday (in lakh)
Year Eastern Railway
South Eastern Railway
Total
2000-2001 14.30 2.00 16.30 2001-02 14.50 2.00 16.50 2002-03 14.70 2.01 16.70 2003-04 14.90 2.01 16.91 2004-05 15.00 2.01 17.01 2005-06 15.20 2.01 17.01
Source: Railway Board, Fairlie Place, Kolkata, 2008
OBSERVATIONS
• The passenger growth rate has been steady in the KMA which is 1.1 per cent per year.
SUBURBAN RAIL
COMPREHENSIVE MOBILITY PLAN FOR KMA 54 SUBURBAN RAIL
• Passenger carried by suburban rail in 2005-06 is about 10 per cent of the total
population.
TABLE 5.2: GROWTH OF NUMBER OF PASSENGERS USING HOWRAH AND SEALDAH
RAILWAY STATIONS Average weekdays (Passengers in Lakhs)
Year Howrah Sealdah Total 2000-01 11.5 17.3 28.8 2001-02 11.7 19.0 30.7 2002-03 11.9 20.8 32.7 2003-04 12.1 22.8 34.9 2004-05 12.3 25.0 37.3 2005-06 12.5 27.4 39.9
Source: Railway Board, Fairlie Place, Kolkata, 2008
OBSERVATIONS
• The pressure on Sealdah Station has been increasing rapidly at an annual growth rate
of 5.8 per cent.
• 150,000 passenger use the Howrah station during the peak hour on an average
working week day.
• These stations are not integrated properly with other modes of transport.
• The terminal stations do not have an effective mass transit based Passenger Dispersal
System.
• There is need towards conservation and upgradation of the urban design and
architecture of Howarh railway Station.
• Long waiting time at Ticketing Booth
• Bottleneck situation at Chandmari and Banaras Bridge
• large parcel movement on the platform impacts passenger flow
• Issues of parcel security
• Water spill from the fish containers movement makes the platforms unsanitary and
unsafe.
In an ideal public dispersal system fast and easy dispersal of passengers is supposed to
happen within the station as well as from the station to other modes of transportation. To
increase this speed, time bound synchronization with other modes, along with easy access
to public transport through allowing buses and taxis within the station area for boarding
and de-boarding of passengers are required to be induced at the design level only. This
seamless movements needs to be developed in coordination of other transportation
facilities. Need for such a fast passenger dispersal at major stations and terminals like
Howrah and Sealdah has already been felt. In regard of these needs, a pilot project of Rs.
100 crore has been already launched for the Santragachi station and project is at a DPR
stage for DUM DUM Station. Such a passenger dispersal system will include facilities like
bus terminals, taxi stands and subways.
Source: http://www.projectsmonitor.com, February 20, 2006; Express News Service July 31, 2008
COMPREHENSIVE MOBILITY PLAN FOR KMA 55 INTRA PARATRANSIT
CHAPTER 6
INTRA PARATRANSIT
6.1 PARATRANSIT MODES Historically, Kolkata was designed as a city based on pedestrian movement and mass transit system in the
form of tram. Cycle rickshaws and hand pulled rickshaws supported the need of the city considering the
narrow streets and the required maneuverability. With the passage of time, negligence towards the required
up gradation of the technology resulted in the decline in rider ship of trams along with rhetoric for pulling out
trams induced importance of IPTs in the metropolitan transportation system.
IPTs in the study area consist of modes ranging from taxies, auto rickshaws, cycle rickshaws to hand pulled
rickshaws. Out of these major four modes, the policies in the recent past have tried to reduce the use of
environment friendly cycle rickshaws and hand pulled rickshaws thereby promoting the taxis and auto
rickshaws.
A review of the growth of vehicles in the last 20 years in KMC shows increase in the number of trips but the
share of IPT has decreased.
TABLE 6.1 TRIP DISTRIBUTION AMONG VARIOUS MODES
KMC Taxi Bus Paratransit Other
1985* 2 67 14 14
1998** 0.05 46 6 47.4 2007*** 2 78 5.6 16
Source: * "Urban Transit System: Guidelines for Examining Options" by Alan Armstrong Wright, World Bank
technical papers No. 52, May 1986, mentioned in "Urban Transport Development with Particular
Reference to Developing Countries", United Nations, 1989
** Kolkata Metropolitan Area, Revised City Development Plan, Kolkata (2007)
*** Urban India-Understanding the Maximum City, London School of Economics (2007), London.
OBSERVATIONS
• Paratransit passenger movement in the KMA for the year 1997-98 shows that, total 21.3 lakhs
passengers were carried per day. The break-up showing the numbers of passengers carried by
various paratransit modes are given in the Table 6.2.
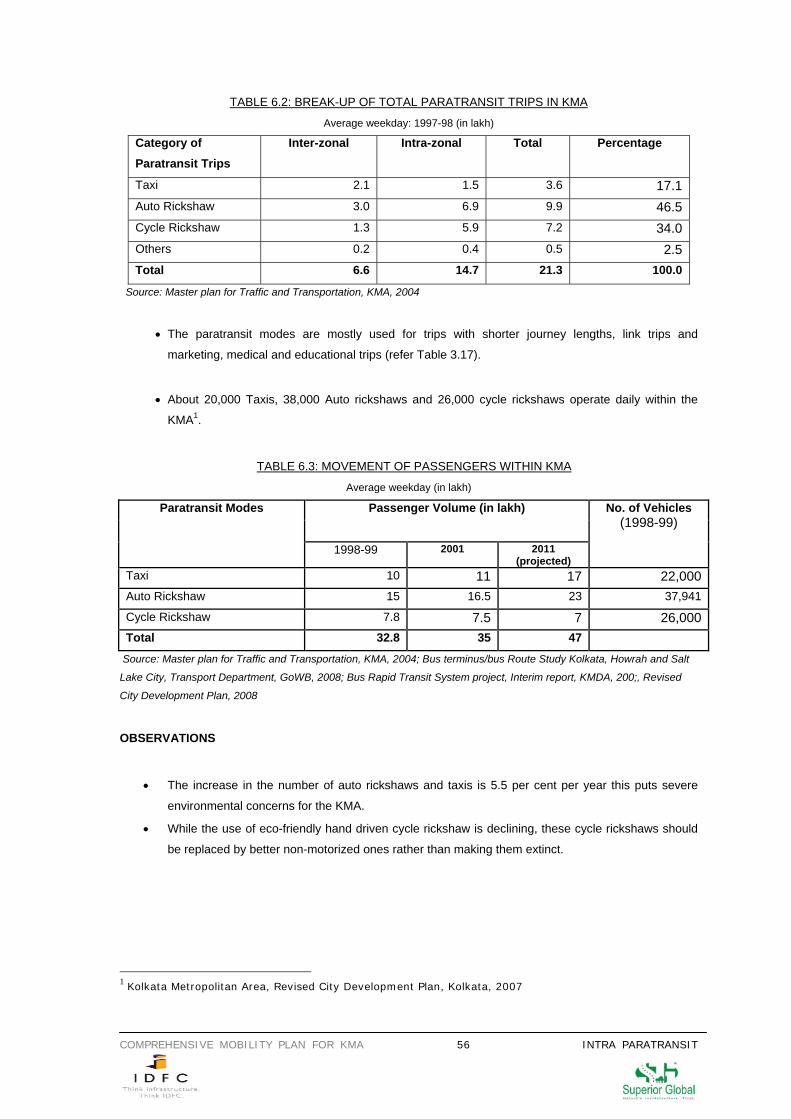
COMPREHENSIVE MOBILITY PLAN FOR KMA 56 INTRA PARATRANSIT
TABLE 6.2: BREAK-UP OF TOTAL PARATRANSIT TRIPS IN KMA
Average weekday: 1997-98 (in lakh)
Category of Paratransit Trips
Inter-zonal Intra-zonal Total Percentage
Taxi 2.1 1.5 3.6 17.1Auto Rickshaw 3.0 6.9 9.9 46.5Cycle Rickshaw 1.3 5.9 7.2 34.0Others 0.2 0.4 0.5 2.5Total 6.6 14.7 21.3 100.0
Source: Master plan for Traffic and Transportation, KMA, 2004
• The paratransit modes are mostly used for trips with shorter journey lengths, link trips and
marketing, medical and educational trips (refer Table 3.17).
• About 20,000 Taxis, 38,000 Auto rickshaws and 26,000 cycle rickshaws operate daily within the
KMA1.
TABLE 6.3: MOVEMENT OF PASSENGERS WITHIN KMA
Average weekday (in lakh)
Passenger Volume (in lakh) Paratransit Modes
1998-99 2001 2011 (projected)
No. of Vehicles (1998-99)
Taxi 10 11 17 22,000Auto Rickshaw 15 16.5 23 37,941
Cycle Rickshaw 7.8 7.5 7 26,000Total 32.8 35 47
Source: Master plan for Traffic and Transportation, KMA, 2004; Bus terminus/bus Route Study Kolkata, Howrah and Salt
Lake City, Transport Department, GoWB, 2008; Bus Rapid Transit System project, Interim report, KMDA, 200;, Revised
City Development Plan, 2008
OBSERVATIONS
• The increase in the number of auto rickshaws and taxis is 5.5 per cent per year this puts severe
environmental concerns for the KMA.
• While the use of eco-friendly hand driven cycle rickshaw is declining, these cycle rickshaws should
be replaced by better non-motorized ones rather than making them extinct.
1 Kolkata Metropolitan Area, Revised City Development Plan, Kolkata, 2007
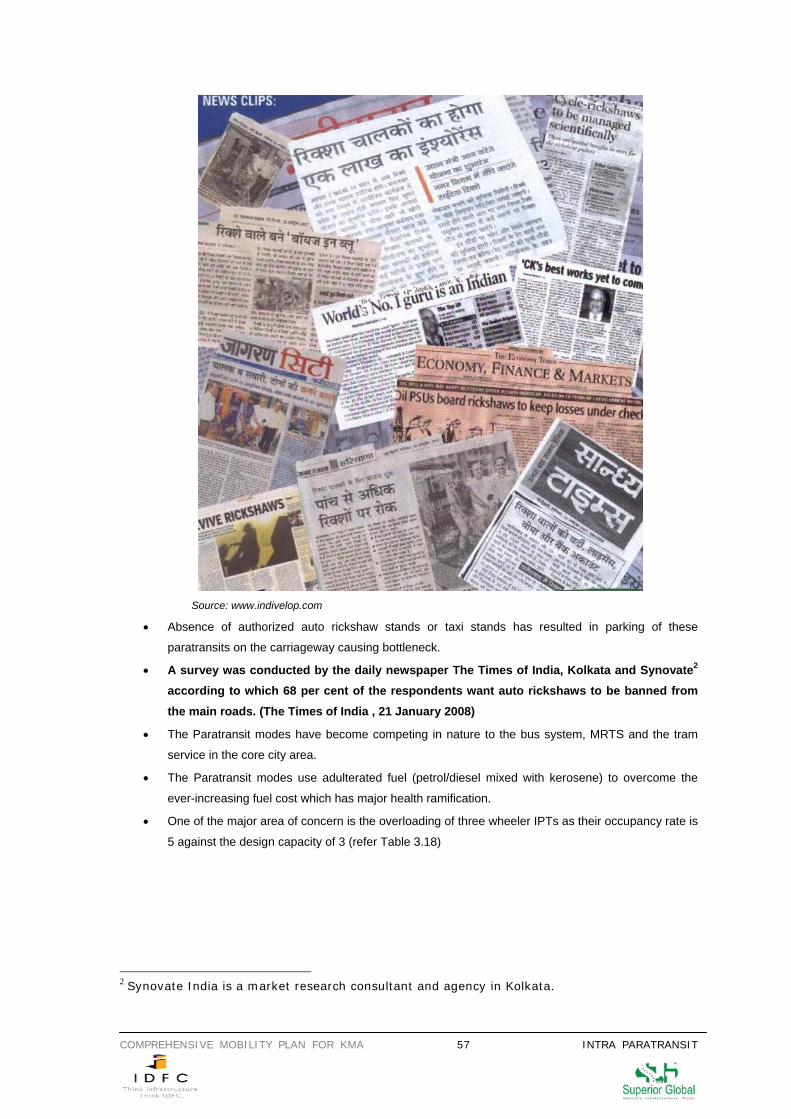
COMPREHENSIVE MOBILITY PLAN FOR KMA 57 INTRA PARATRANSIT
Source: www.indivelop.com
• Absence of authorized auto rickshaw stands or taxi stands has resulted in parking of these
paratransits on the carriageway causing bottleneck.
• A survey was conducted by the daily newspaper The Times of India, Kolkata and Synovate2 according to which 68 per cent of the respondents want auto rickshaws to be banned from the main roads. (The Times of India , 21 January 2008)
• The Paratransit modes have become competing in nature to the bus system, MRTS and the tram
service in the core city area.
• The Paratransit modes use adulterated fuel (petrol/diesel mixed with kerosene) to overcome the
ever-increasing fuel cost which has major health ramification.
• One of the major area of concern is the overloading of three wheeler IPTs as their occupancy rate is
5 against the design capacity of 3 (refer Table 3.18)
2 Synovate India is a market research consultant and agency in Kolkata.
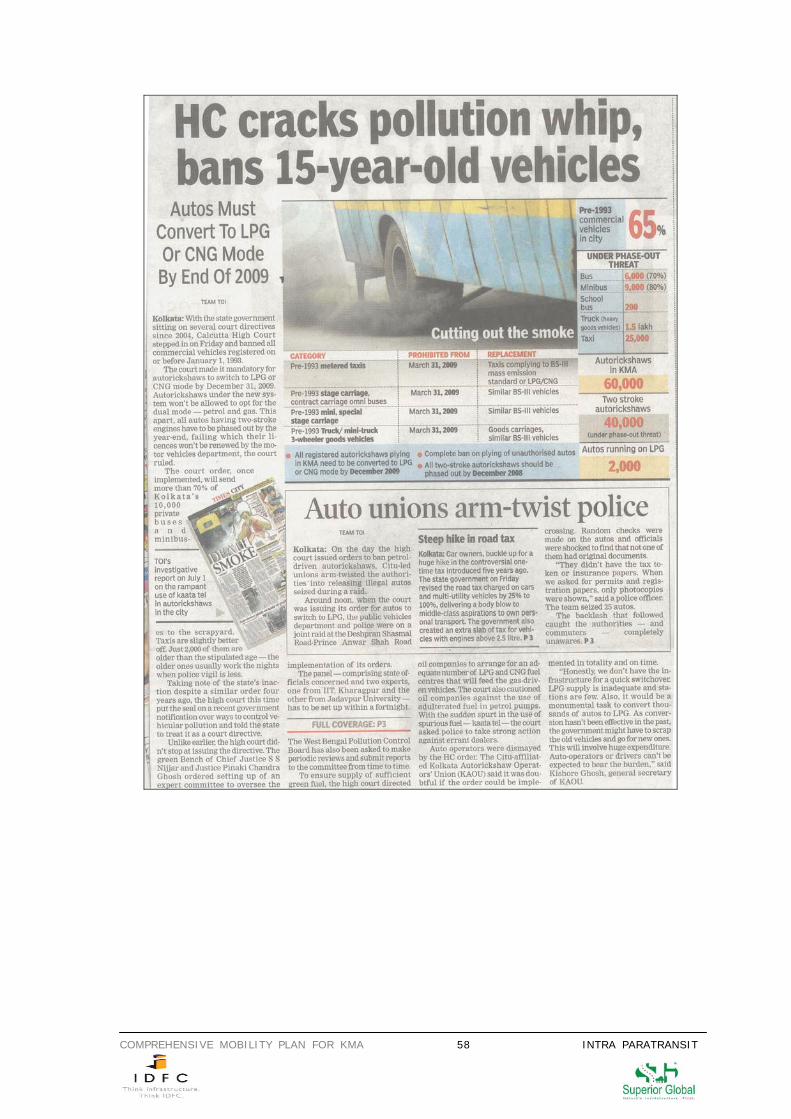
COMPREHENSIVE MOBILITY PLAN FOR KMA 58 INTRA PARATRANSIT
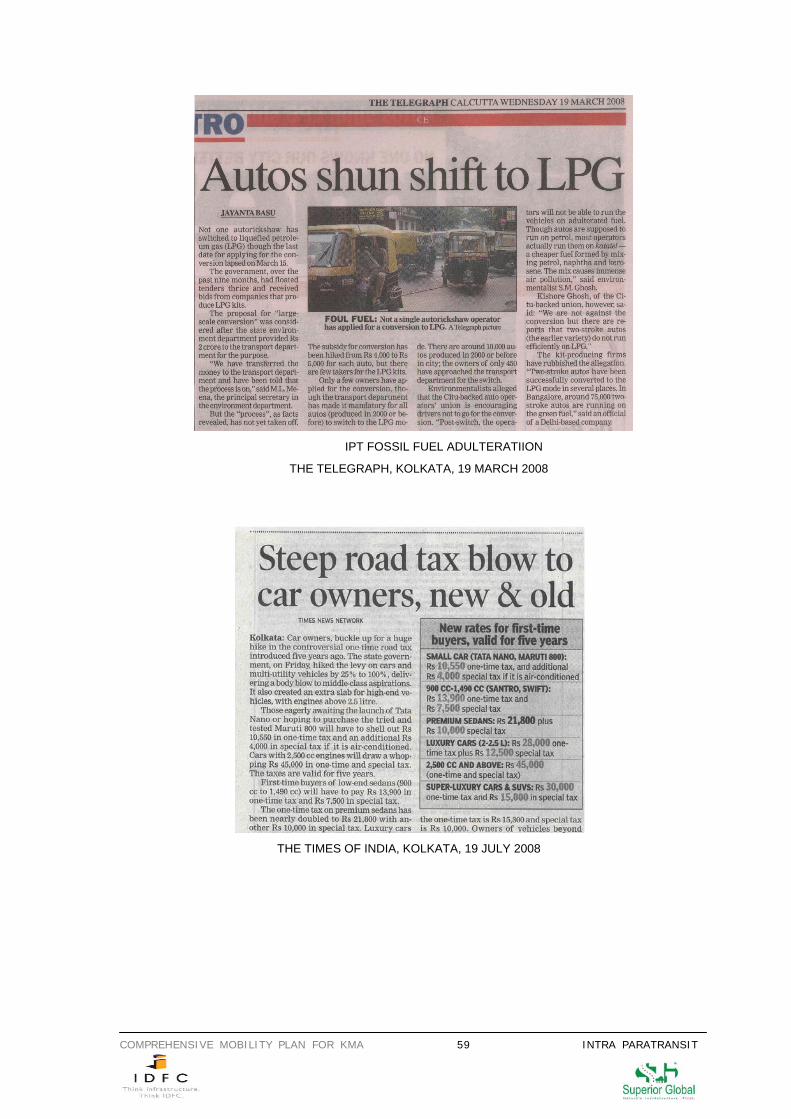
COMPREHENSIVE MOBILITY PLAN FOR KMA 59 INTRA PARATRANSIT
IPT FOSSIL FUEL ADULTERATIION
THE TELEGRAPH, KOLKATA, 19 MARCH 2008
THE TIMES OF INDIA, KOLKATA, 19 JULY 2008
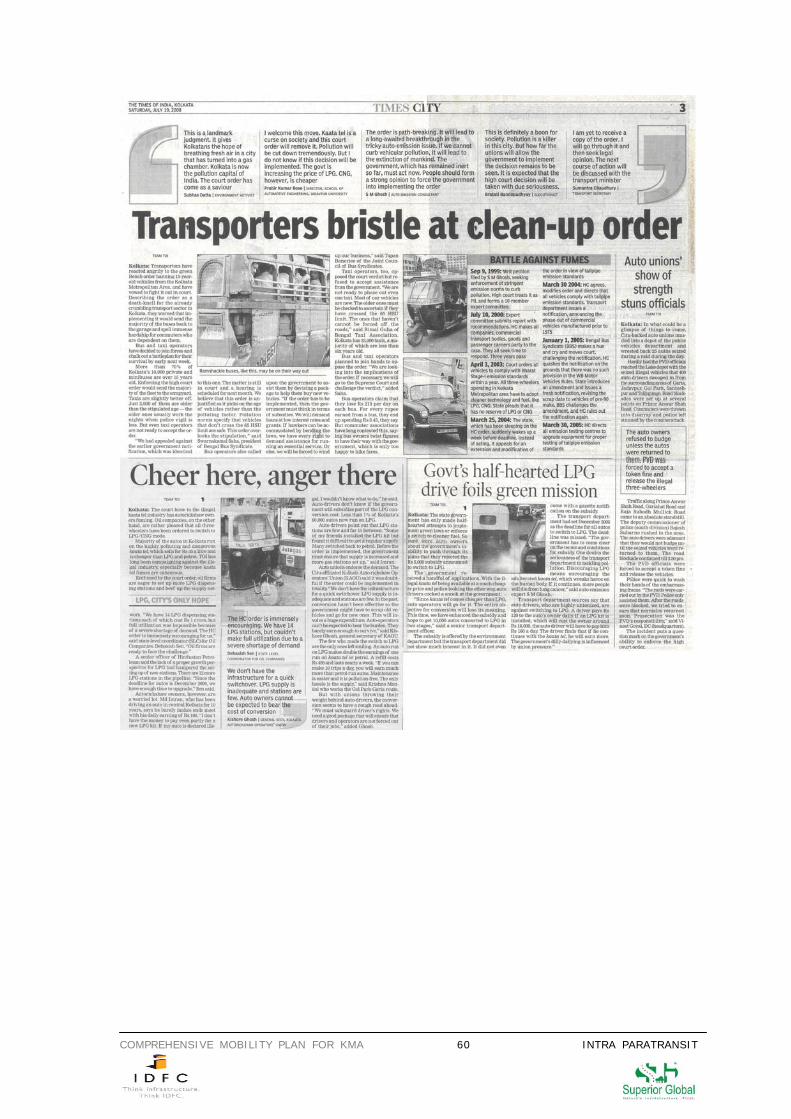
COMPREHENSIVE MOBILITY PLAN FOR KMA 60 INTRA PARATRANSIT
COMPREHENSIVE MOBILITY PLAN FOR KMA 61 PEDESTRIAN AND BICYCLE MOVEMENT
CHAPTER 7
PEDESTRIAN AND BICYCLE MOVEMENT
7.1 PEDESTRIAN: EXISTING SCENARIO Kolkata was planned as a city based on pedestrian movement for shorter distance and using efficient public
transport in the form of trams and ferries (rail based and water based transport) for longer distance. In due
course of time, the city roads were hijacked by the motorcars, buses and IPT’s. On the contrary tramways and pedestrians have been branded as a major cause for congestion. This trend has not only increased
the pollution and environmental degradation of the city but vanishing sidewalks has led to increase in
pedestrian fatalities. A recent move by the KMC to reduce the sidewalk’s width from 4.5 meters to less than 2
meters has only added to the chaos. Footpaths have reduced to an extent of 50 to 70 per cent and 30
percent are in bad shape due to frequent digging and poor maintenance. (refer Times City, The Times of
India, 25 April, 2008 p.1).
PEDESTRIAN VOLUME SURVEY One of the heaviest pedestrian traffic movements in the KMA occurs between Sealdah station and B. B. D.
Bag. In order to measure the volume of traffic quantitatively a 12 hour survey was carried out at different
locations. The pedestrian volume was counted at following locations on B. B. Ganguly Street: (refer map
“Pedestrian Traffic Volume Count: B.B.D. Bagh Sealdah Corridor”)
1. East of Amherst Street Crossing
2. West of College Street Crossing
3. East of Rabindra Sarani
The pedestrian volume was also counted on M. G. Road, East of Suryasen Street i.e. Near Purabi Cinema at
the following locations:
1. Surya Sen Street immediately to the east of the College Square
2. Prem Chand Boral Street immediately east of the College Square
3. Eden Hospital Road
OBSERVATIONS
2,90,000 pedestrians were observed from Sealdah Stations via. B.B. Ganguly Street and Surya Sen Street.
The results of the survey highlight three distinct patterns of pedestrian movements:
• There is continuous flow of pedestrians between Sealdah Stations and B. B. Bag via B. B. Ganguly
Street, though in a tapered proportion.
• Major pedestrian movement was also observed between Amherst Street and Prem Chand Boral
Street towards Eden Hospital Road.
• A concentrated pedestrian movement was observed via Surya Sen Street and M. G. Road to
Sealdah Station which was 20 per cent of the total pedestrian volume.
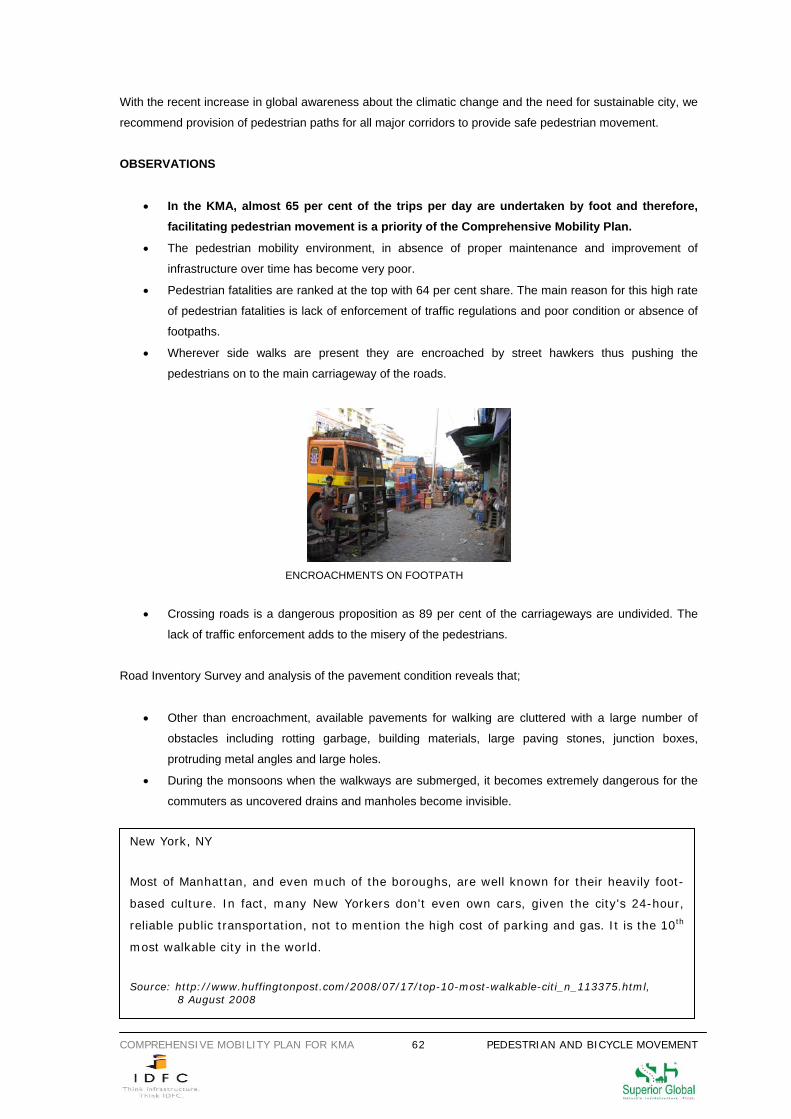
COMPREHENSIVE MOBILITY PLAN FOR KMA 62 PEDESTRIAN AND BICYCLE MOVEMENT
With the recent increase in global awareness about the climatic change and the need for sustainable city, we
recommend provision of pedestrian paths for all major corridors to provide safe pedestrian movement.
OBSERVATIONS
• In the KMA, almost 65 per cent of the trips per day are undertaken by foot and therefore, facilitating pedestrian movement is a priority of the Comprehensive Mobility Plan.
• The pedestrian mobility environment, in absence of proper maintenance and improvement of
infrastructure over time has become very poor.
• Pedestrian fatalities are ranked at the top with 64 per cent share. The main reason for this high rate
of pedestrian fatalities is lack of enforcement of traffic regulations and poor condition or absence of
footpaths.
• Wherever side walks are present they are encroached by street hawkers thus pushing the
pedestrians on to the main carriageway of the roads.
ENCROACHMENTS ON FOOTPATH
• Crossing roads is a dangerous proposition as 89 per cent of the carriageways are undivided. The
lack of traffic enforcement adds to the misery of the pedestrians.
Road Inventory Survey and analysis of the pavement condition reveals that;
• Other than encroachment, available pavements for walking are cluttered with a large number of
obstacles including rotting garbage, building materials, large paving stones, junction boxes,
protruding metal angles and large holes.
• During the monsoons when the walkways are submerged, it becomes extremely dangerous for the
commuters as uncovered drains and manholes become invisible.
New York, NY
Most of Manhattan, and even much of the boroughs, are well known for their heavily foot-
based culture. In fact, many New Yorkers don't even own cars, given the city's 24-hour,
reliable public transportation, not to mention the high cost of parking and gas. It is the 10th
most walkable city in the world.
Source: http://www.huffingtonpost.com/2008/07/17/top-10-most-walkable-citi_n_113375.html, 8 August 2008
COMPREHENSIVE MOBILITY PLAN FOR KMA 63 PEDESTRIAN AND BICYCLE MOVEMENT
7.2 BICYCLE MOVEMENT IN KOLKATA: EXISTING SCENARIO The KMA has comparatively low car ownership ratio as compared to two wheelers and cycles. Bicycle is
most commonly used as about 23 per cent of households use this mode of transport for daily trips whereas
45.58 per cent households own bicycle. The detail of vehicle ownership pattern is presented in below table:
TABLE 7.1: VEHICLE OWNERSHIP IN THE KMA
Sample Households Type of Vehicles
Number %
Households Owing Any Vehicle
(%) Bicycle 1,378 23.1 45.6
Two Wheeler 983 16.5 32.5
Motor Car 663 11.1 21.9
None 2,932 49.2 --
Total 5,955 100.0 100.0 Source: SGI Primary Survey, Comprehensive Mobility Plan, January 2008
OBSERVATIONS
• The average distance traveled by the bicycle for all trips comes out to be 3 kilometers (refer table
3.15 and 3.16).
There is a need to create a network of cycle routes, physically segregated from vehicular traffic on all main
roads in KMA including residential areas to schools, hospitals, shopping centers, universities, office
complexes and railway/metro/tram stations. While preparing the Detailed Project Report for the upgradation
and improvement of all the major roads a mandatory provision needs to be made regarding providing
sidewalks and cycle tracks.
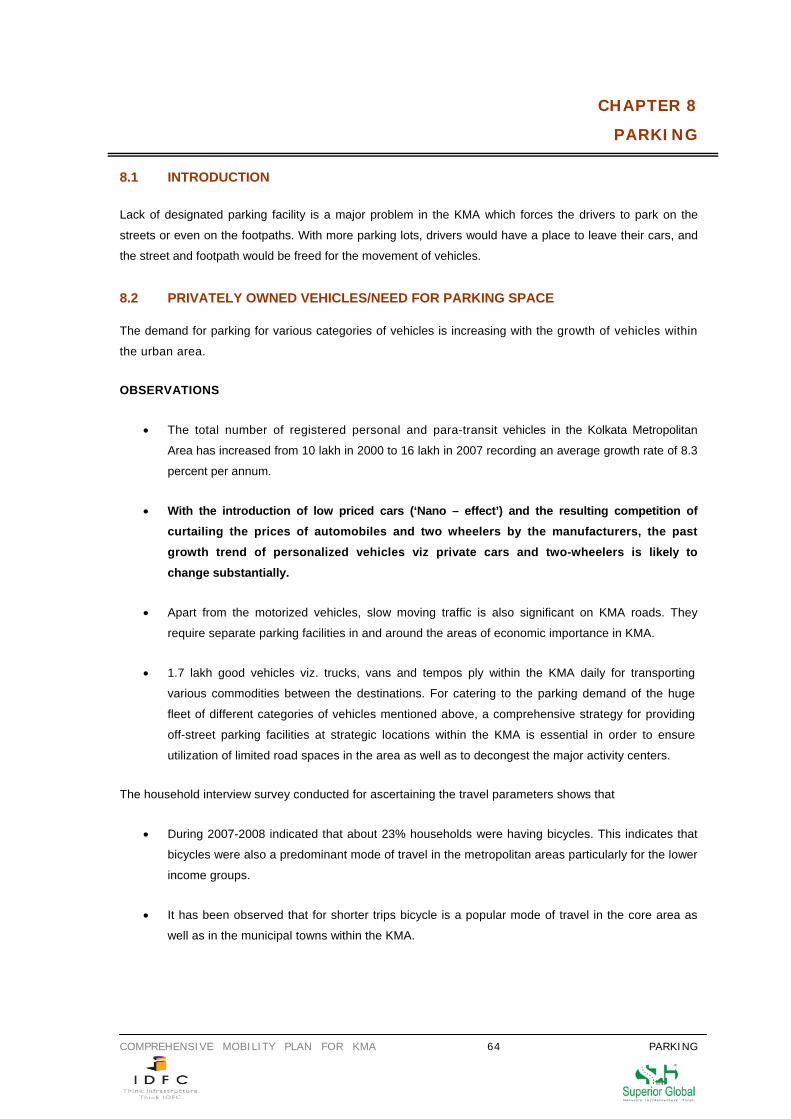
COMPREHENSIVE MOBILITY PLAN FOR KMA 64 PARKING
CHAPTER 8
PARKING 8.1 INTRODUCTION Lack of designated parking facility is a major problem in the KMA which forces the drivers to park on the
streets or even on the footpaths. With more parking lots, drivers would have a place to leave their cars, and
the street and footpath would be freed for the movement of vehicles.
8.2 PRIVATELY OWNED VEHICLES/NEED FOR PARKING SPACE
The demand for parking for various categories of vehicles is increasing with the growth of vehicles within
the urban area.
OBSERVATIONS
• The total number of registered personal and para-transit vehicles in the Kolkata Metropolitan
Area has increased from 10 lakh in 2000 to 16 lakh in 2007 recording an average growth rate of 8.3
percent per annum.
• With the introduction of low priced cars (‘Nano – effect’) and the resulting competition of curtailing the prices of automobiles and two wheelers by the manufacturers, the past growth trend of personalized vehicles viz private cars and two-wheelers is likely to change substantially.
• Apart from the motorized vehicles, slow moving traffic is also significant on KMA roads. They
require separate parking facilities in and around the areas of economic importance in KMA.
• 1.7 lakh good vehicles viz. trucks, vans and tempos ply within the KMA daily for transporting
various commodities between the destinations. For catering to the parking demand of the huge
fleet of different categories of vehicles mentioned above, a comprehensive strategy for providing
off-street parking facilities at strategic locations within the KMA is essential in order to ensure
utilization of limited road spaces in the area as well as to decongest the major activity centers.
The household interview survey conducted for ascertaining the travel parameters shows that
• During 2007-2008 indicated that about 23% households were having bicycles. This indicates that
bicycles were also a predominant mode of travel in the metropolitan areas particularly for the lower
income groups.
• It has been observed that for shorter trips bicycle is a popular mode of travel in the core area as
well as in the municipal towns within the KMA.
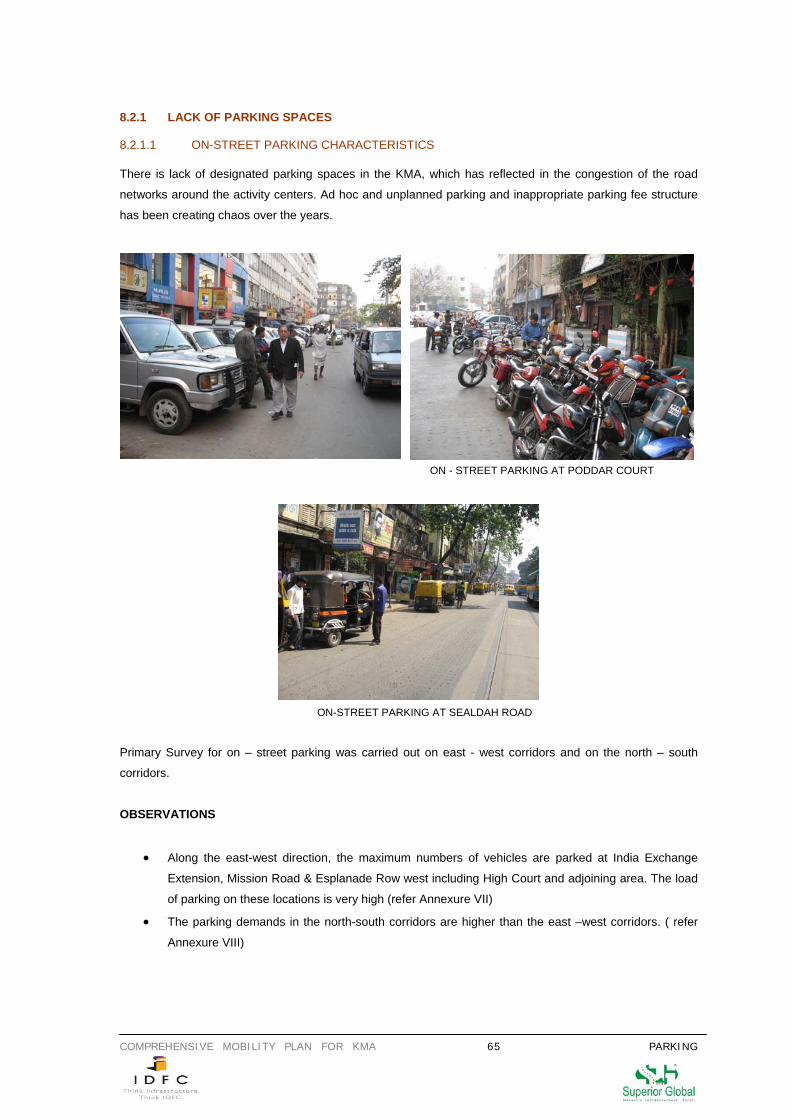
COMPREHENSIVE MOBILITY PLAN FOR KMA 65 PARKING
8.2.1 LACK OF PARKING SPACES 8.2.1.1 ON-STREET PARKING CHARACTERISTICS There is lack of designated parking spaces in the KMA, which has reflected in the congestion of the road
networks around the activity centers. Ad hoc and unplanned parking and inappropriate parking fee structure
has been creating chaos over the years.
ON - STREET PARKING AT PODDAR COURT
ON-STREET PARKING AT SEALDAH ROAD
Primary Survey for on – street parking was carried out on east - west corridors and on the north – south
corridors.
OBSERVATIONS
• Along the east-west direction, the maximum numbers of vehicles are parked at India Exchange
Extension, Mission Road & Esplanade Row west including High Court and adjoining area. The load
of parking on these locations is very high (refer Annexure VII)
• The parking demands in the north-south corridors are higher than the east –west corridors. ( refer
Annexure VIII)
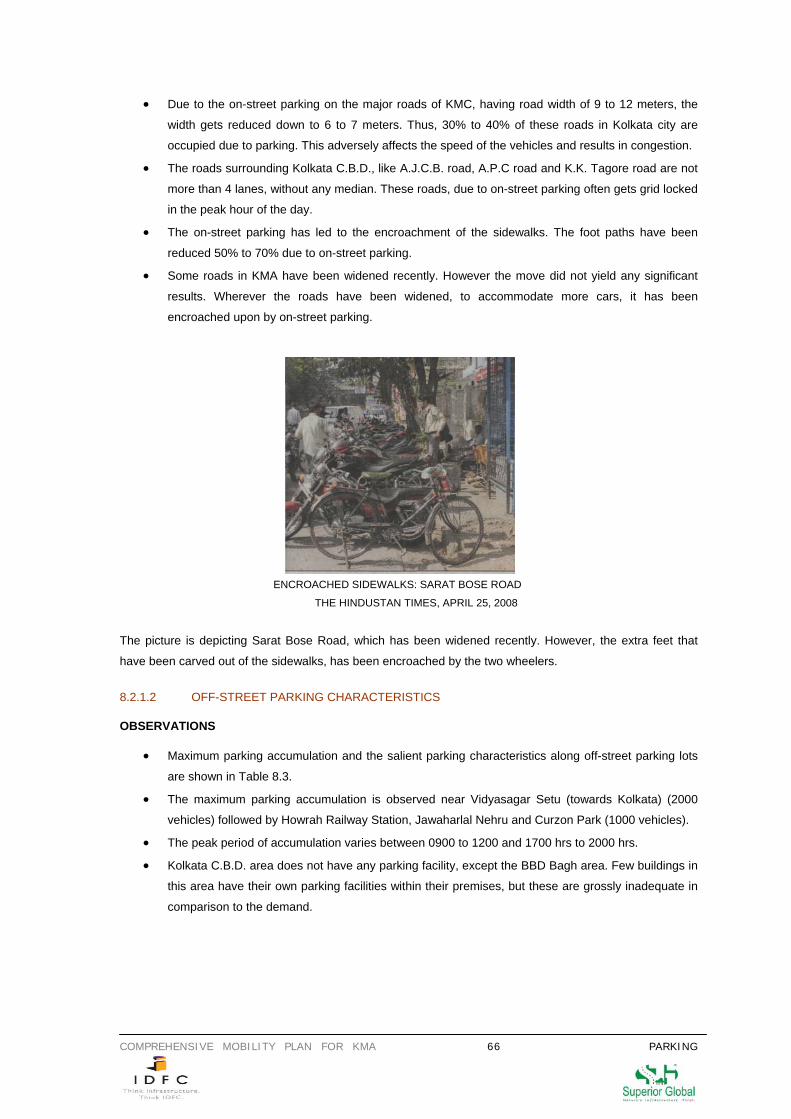
COMPREHENSIVE MOBILITY PLAN FOR KMA 66 PARKING
• Due to the on-street parking on the major roads of KMC, having road width of 9 to 12 meters, the
width gets reduced down to 6 to 7 meters. Thus, 30% to 40% of these roads in Kolkata city are
occupied due to parking. This adversely affects the speed of the vehicles and results in congestion.
• The roads surrounding Kolkata C.B.D., like A.J.C.B. road, A.P.C road and K.K. Tagore road are not
more than 4 lanes, without any median. These roads, due to on-street parking often gets grid locked
in the peak hour of the day.
• The on-street parking has led to the encroachment of the sidewalks. The foot paths have been
reduced 50% to 70% due to on-street parking.
• Some roads in KMA have been widened recently. However the move did not yield any significant
results. Wherever the roads have been widened, to accommodate more cars, it has been
encroached upon by on-street parking.
ENCROACHED SIDEWALKS: SARAT BOSE ROAD
THE HINDUSTAN TIMES, APRIL 25, 2008
The picture is depicting Sarat Bose Road, which has been widened recently. However, the extra feet that
have been carved out of the sidewalks, has been encroached by the two wheelers.
8.2.1.2 OFF-STREET PARKING CHARACTERISTICS OBSERVATIONS
• Maximum parking accumulation and the salient parking characteristics along off-street parking lots
are shown in Table 8.3. • The maximum parking accumulation is observed near Vidyasagar Setu (towards Kolkata) (2000
vehicles) followed by Howrah Railway Station, Jawaharlal Nehru and Curzon Park (1000 vehicles). • The peak period of accumulation varies between 0900 to 1200 and 1700 hrs to 2000 hrs. • Kolkata C.B.D. area does not have any parking facility, except the BBD Bagh area. Few buildings in
this area have their own parking facilities within their premises, but these are grossly inadequate in
comparison to the demand.
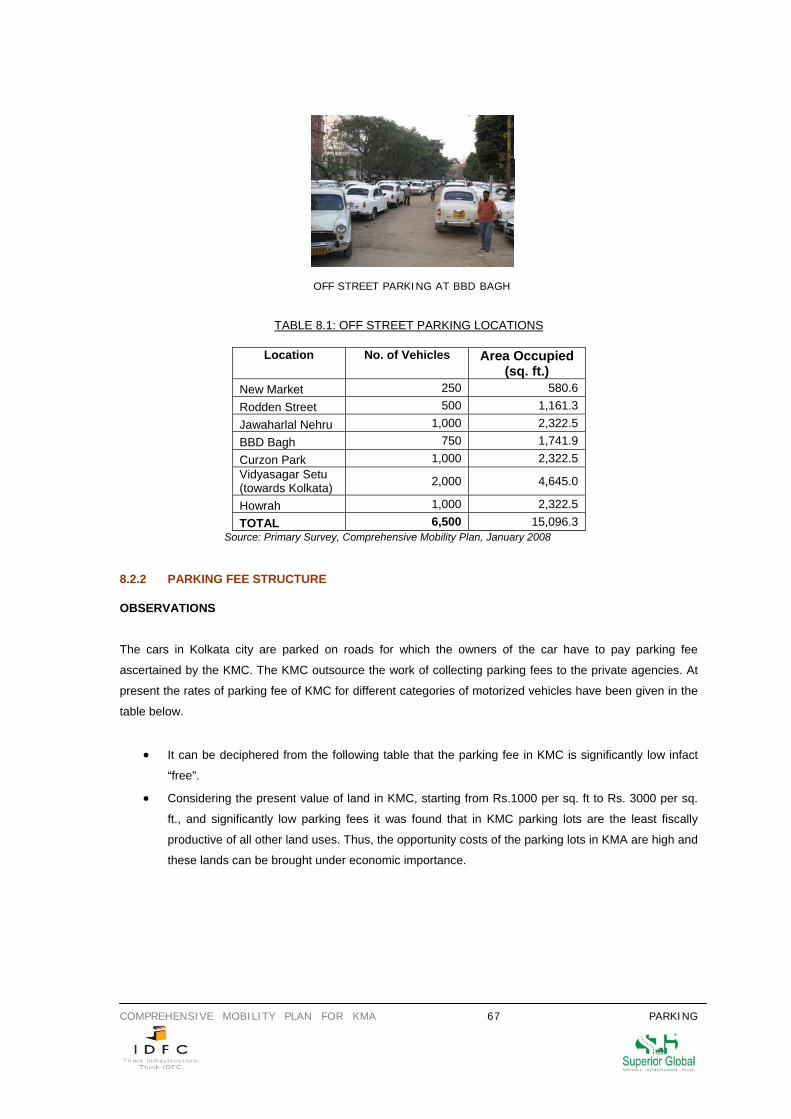
COMPREHENSIVE MOBILITY PLAN FOR KMA 67 PARKING
TABLE 8.1: OFF STREET PARKING LOCATIONS
Location No. of Vehicles Area Occupied (sq. ft.)
New Market 250 580.6 Rodden Street 500 1,161.3 Jawaharlal Nehru 1,000 2,322.5 BBD Bagh 750 1,741.9 Curzon Park 1,000 2,322.5 Vidyasagar Setu (towards Kolkata) 2,000 4,645.0
Howrah 1,000 2,322.5 TOTAL 6,500 15,096.3
Source: Primary Survey, Comprehensive Mobility Plan, January 2008
8.2.2 PARKING FEE STRUCTURE OBSERVATIONS
The cars in Kolkata city are parked on roads for which the owners of the car have to pay parking fee
ascertained by the KMC. The KMC outsource the work of collecting parking fees to the private agencies. At
present the rates of parking fee of KMC for different categories of motorized vehicles have been given in the
table below.
• It can be deciphered from the following table that the parking fee in KMC is significantly low infact
“free”.
• Considering the present value of land in KMC, starting from Rs.1000 per sq. ft to Rs. 3000 per sq.
ft., and significantly low parking fees it was found that in KMC parking lots are the least fiscally
productive of all other land uses. Thus, the opportunity costs of the parking lots in KMA are high and
these lands can be brought under economic importance.
OFF STREET PARKING AT BBD BAGH
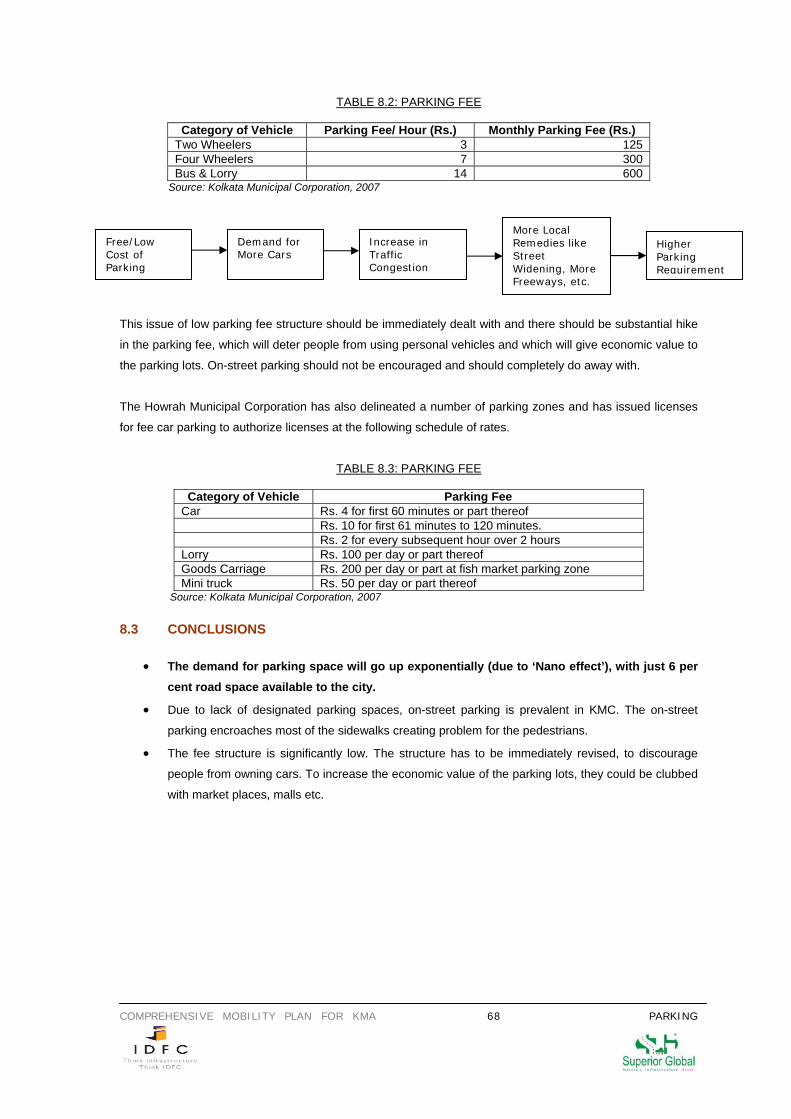
COMPREHENSIVE MOBILITY PLAN FOR KMA 68 PARKING
TABLE 8.2: PARKING FEE
Category of Vehicle Parking Fee/ Hour (Rs.) Monthly Parking Fee (Rs.) Two Wheelers 3 125 Four Wheelers 7 300 Bus & Lorry 14 600
Source: Kolkata Municipal Corporation, 2007
This issue of low parking fee structure should be immediately dealt with and there should be substantial hike
in the parking fee, which will deter people from using personal vehicles and which will give economic value to
the parking lots. On-street parking should not be encouraged and should completely do away with.
The Howrah Municipal Corporation has also delineated a number of parking zones and has issued licenses
for fee car parking to authorize licenses at the following schedule of rates.
TABLE 8.3: PARKING FEE
Category of Vehicle Parking Fee Car Rs. 4 for first 60 minutes or part thereof Rs. 10 for first 61 minutes to 120 minutes. Rs. 2 for every subsequent hour over 2 hours Lorry Rs. 100 per day or part thereof Goods Carriage Rs. 200 per day or part at fish market parking zone Mini truck Rs. 50 per day or part thereof
Source: Kolkata Municipal Corporation, 2007
8.3 CONCLUSIONS
• The demand for parking space will go up exponentially (due to ‘Nano effect’), with just 6 per cent road space available to the city.
• Due to lack of designated parking spaces, on-street parking is prevalent in KMC. The on-street
parking encroaches most of the sidewalks creating problem for the pedestrians.
• The fee structure is significantly low. The structure has to be immediately revised, to discourage
people from owning cars. To increase the economic value of the parking lots, they could be clubbed
with market places, malls etc.
Demand for More Cars
Increase in Traffic Congestion
More Local Remedies like Street Widening, More Freeways, etc.
Free/Low Cost of Parking
Higher Parking Requirement
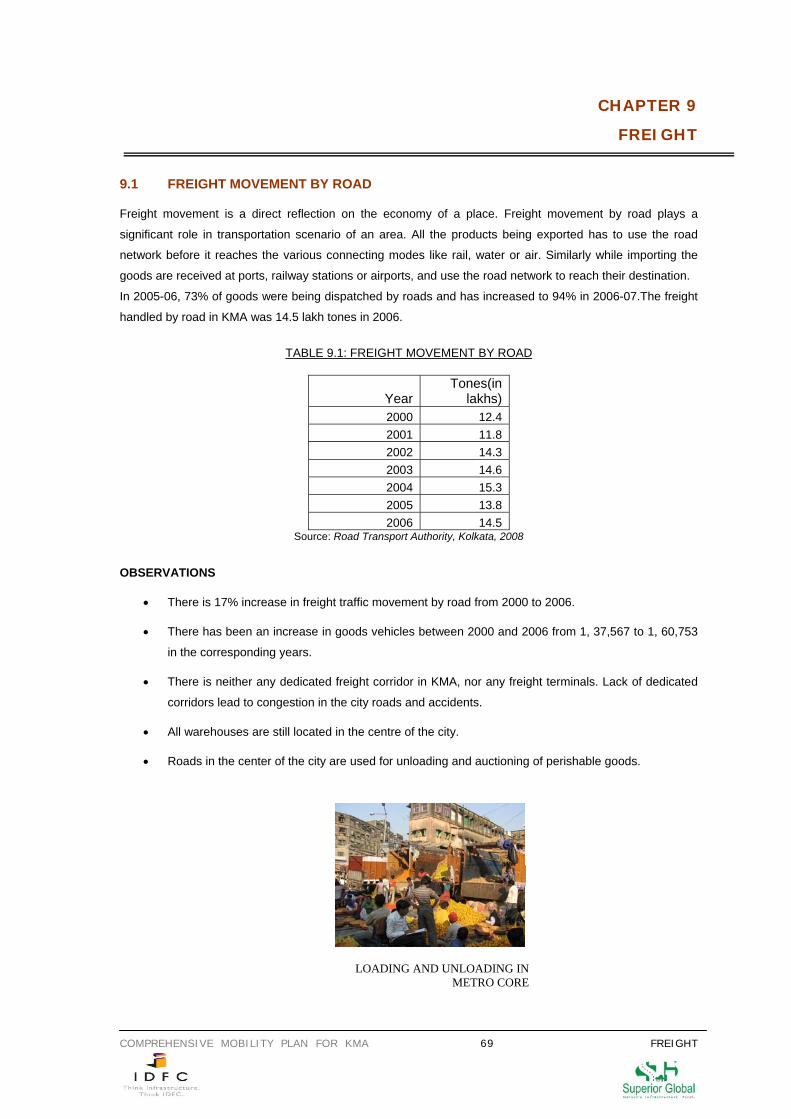
COMPREHENSIVE MOBILITY PLAN FOR KMA 69 FREIGHT
CHAPTER 9
FREIGHT
9.1 FREIGHT MOVEMENT BY ROAD Freight movement is a direct reflection on the economy of a place. Freight movement by road plays a
significant role in transportation scenario of an area. All the products being exported has to use the road
network before it reaches the various connecting modes like rail, water or air. Similarly while importing the
goods are received at ports, railway stations or airports, and use the road network to reach their destination.
In 2005-06, 73% of goods were being dispatched by roads and has increased to 94% in 2006-07.The freight
handled by road in KMA was 14.5 lakh tones in 2006.
TABLE 9.1: FREIGHT MOVEMENT BY ROAD
YearTones(in
lakhs)2000 12.4 2001 11.8 2002 14.3 2003 14.6 2004 15.3 2005 13.8 2006 14.5
Source: Road Transport Authority, Kolkata, 2008 OBSERVATIONS
• There is 17% increase in freight traffic movement by road from 2000 to 2006.
• There has been an increase in goods vehicles between 2000 and 2006 from 1, 37,567 to 1, 60,753
in the corresponding years.
• There is neither any dedicated freight corridor in KMA, nor any freight terminals. Lack of dedicated
corridors lead to congestion in the city roads and accidents.
• All warehouses are still located in the centre of the city.
• Roads in the center of the city are used for unloading and auctioning of perishable goods.
LOADING AND UNLOADING IN METRO CORE
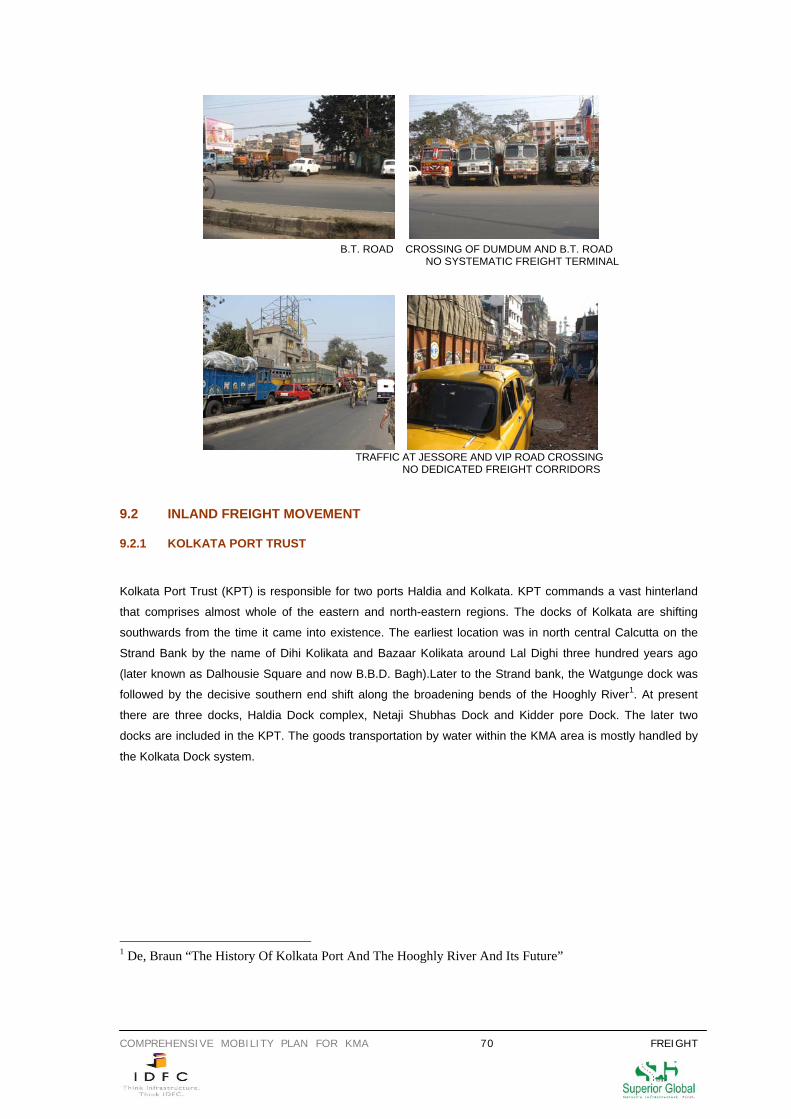
COMPREHENSIVE MOBILITY PLAN FOR KMA 70 FREIGHT
B.T. ROAD CROSSING OF DUMDUM AND B.T. ROAD NO SYSTEMATIC FREIGHT TERMINAL TRAFFIC AT JESSORE AND VIP ROAD CROSSING NO DEDICATED FREIGHT CORRIDORS 9.2 INLAND FREIGHT MOVEMENT 9.2.1 KOLKATA PORT TRUST
Kolkata Port Trust (KPT) is responsible for two ports Haldia and Kolkata. KPT commands a vast hinterland
that comprises almost whole of the eastern and north-eastern regions. The docks of Kolkata are shifting
southwards from the time it came into existence. The earliest location was in north central Calcutta on the
Strand Bank by the name of Dihi Kolikata and Bazaar Kolikata around Lal Dighi three hundred years ago
(later known as Dalhousie Square and now B.B.D. Bagh).Later to the Strand bank, the Watgunge dock was
followed by the decisive southern end shift along the broadening bends of the Hooghly River1. At present
there are three docks, Haldia Dock complex, Netaji Shubhas Dock and Kidder pore Dock. The later two
docks are included in the KPT. The goods transportation by water within the KMA area is mostly handled by
the Kolkata Dock system.
1 De, Braun “The History Of Kolkata Port And The Hooghly River And Its Future”
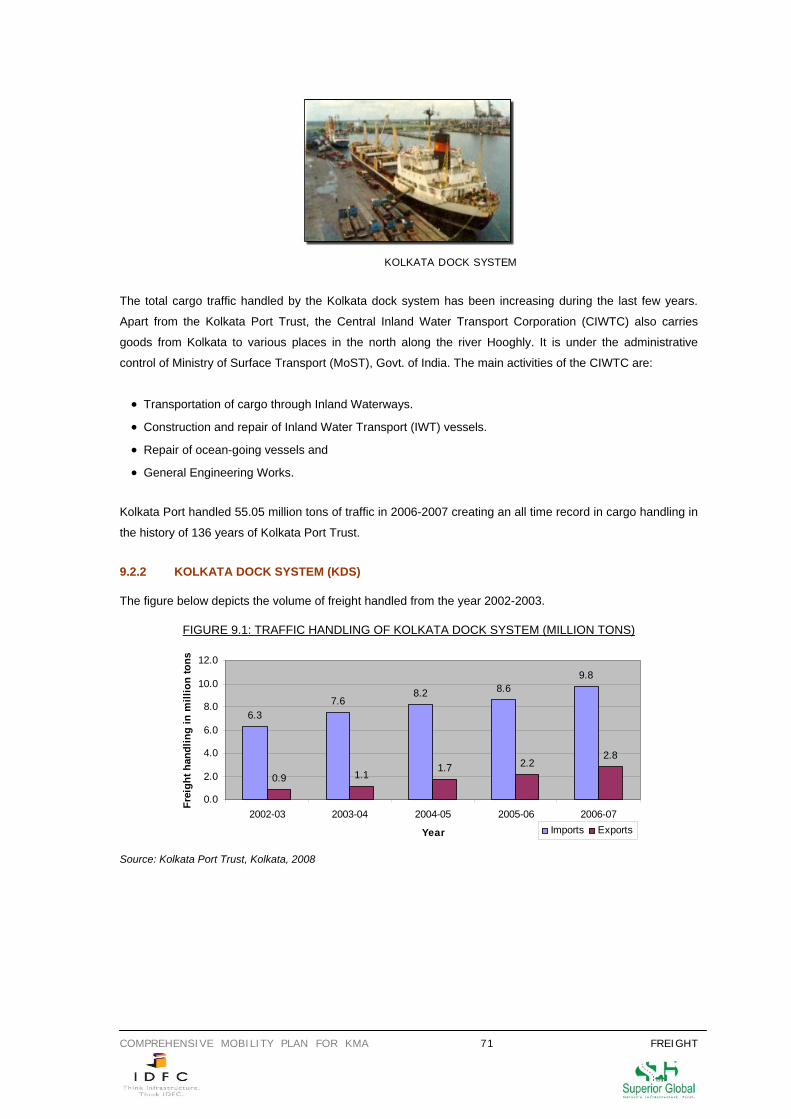
COMPREHENSIVE MOBILITY PLAN FOR KMA 71 FREIGHT
The total cargo traffic handled by the Kolkata dock system has been increasing during the last few years.
Apart from the Kolkata Port Trust, the Central Inland Water Transport Corporation (CIWTC) also carries
goods from Kolkata to various places in the north along the river Hooghly. It is under the administrative
control of Ministry of Surface Transport (MoST), Govt. of India. The main activities of the CIWTC are:
• Transportation of cargo through Inland Waterways.
• Construction and repair of Inland Water Transport (IWT) vessels.
• Repair of ocean-going vessels and
• General Engineering Works.
Kolkata Port handled 55.05 million tons of traffic in 2006-2007 creating an all time record in cargo handling in
the history of 136 years of Kolkata Port Trust.
9.2.2 KOLKATA DOCK SYSTEM (KDS) The figure below depicts the volume of freight handled from the year 2002-2003.
FIGURE 9.1: TRAFFIC HANDLING OF KOLKATA DOCK SYSTEM (MILLION TONS)
6.37.6
8.2 8.69.8
0.9 1.11.7 2.2
2.8
0.0
2.0
4.0
6.0
8.0
10.0
12.0
2002-03 2003-04 2004-05 2005-06 2006-07
Year
Frei
ght h
andl
ing
in m
illio
n to
ns
Imports Exports
Source: Kolkata Port Trust, Kolkata, 2008
KOLKATA DOCK SYSTEM
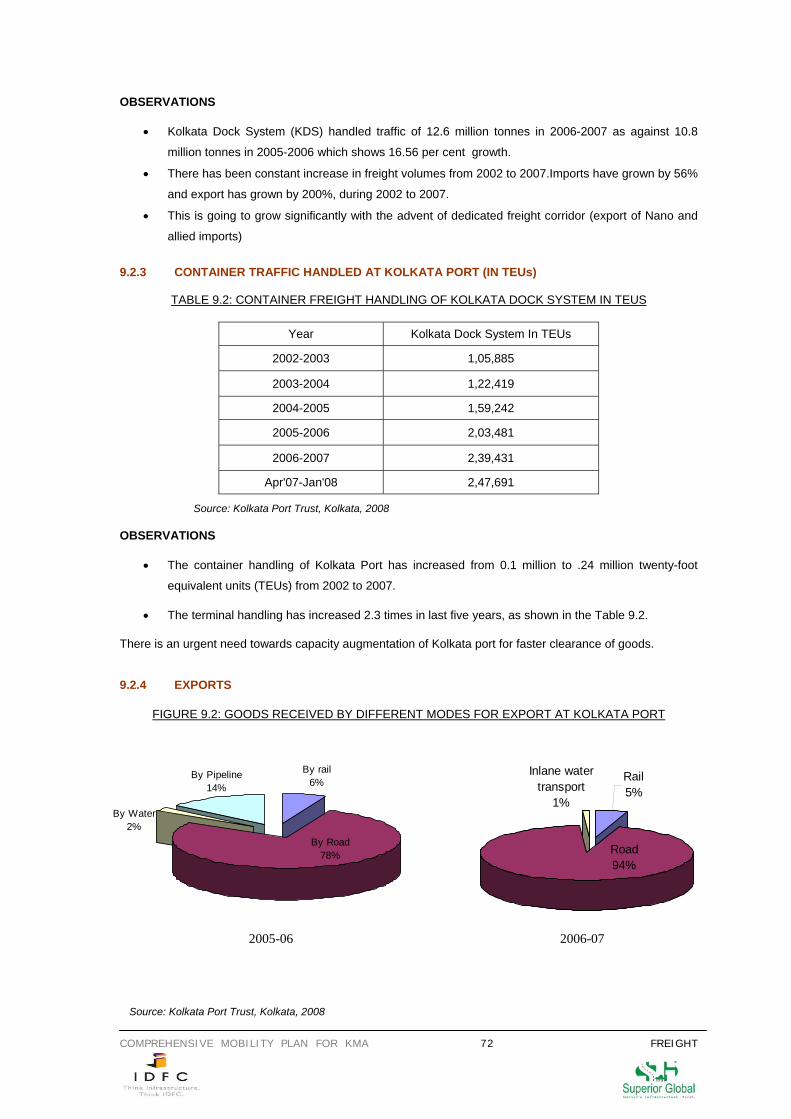
COMPREHENSIVE MOBILITY PLAN FOR KMA 72 FREIGHT
OBSERVATIONS
• Kolkata Dock System (KDS) handled traffic of 12.6 million tonnes in 2006-2007 as against 10.8
million tonnes in 2005-2006 which shows 16.56 per cent growth.
• There has been constant increase in freight volumes from 2002 to 2007.Imports have grown by 56%
and export has grown by 200%, during 2002 to 2007.
• This is going to grow significantly with the advent of dedicated freight corridor (export of Nano and
allied imports)
9.2.3 CONTAINER TRAFFIC HANDLED AT KOLKATA PORT (IN TEUs)
TABLE 9.2: CONTAINER FREIGHT HANDLING OF KOLKATA DOCK SYSTEM IN TEUS
Year Kolkata Dock System In TEUs
2002-2003 1,05,885
2003-2004 1,22,419
2004-2005 1,59,242
2005-2006 2,03,481
2006-2007 2,39,431
Apr'07-Jan'08 2,47,691
Source: Kolkata Port Trust, Kolkata, 2008
OBSERVATIONS
• The container handling of Kolkata Port has increased from 0.1 million to .24 million twenty-foot
equivalent units (TEUs) from 2002 to 2007.
• The terminal handling has increased 2.3 times in last five years, as shown in the Table 9.2.
There is an urgent need towards capacity augmentation of Kolkata port for faster clearance of goods.
9.2.4 EXPORTS
FIGURE 9.2: GOODS RECEIVED BY DIFFERENT MODES FOR EXPORT AT KOLKATA PORT
Road94%
Inlane water transport
1%
Rail5%
By Water2%
By rail6%
By Road78%
By Pipeline14%
2005-06 2006-07
Source: Kolkata Port Trust, Kolkata, 2008
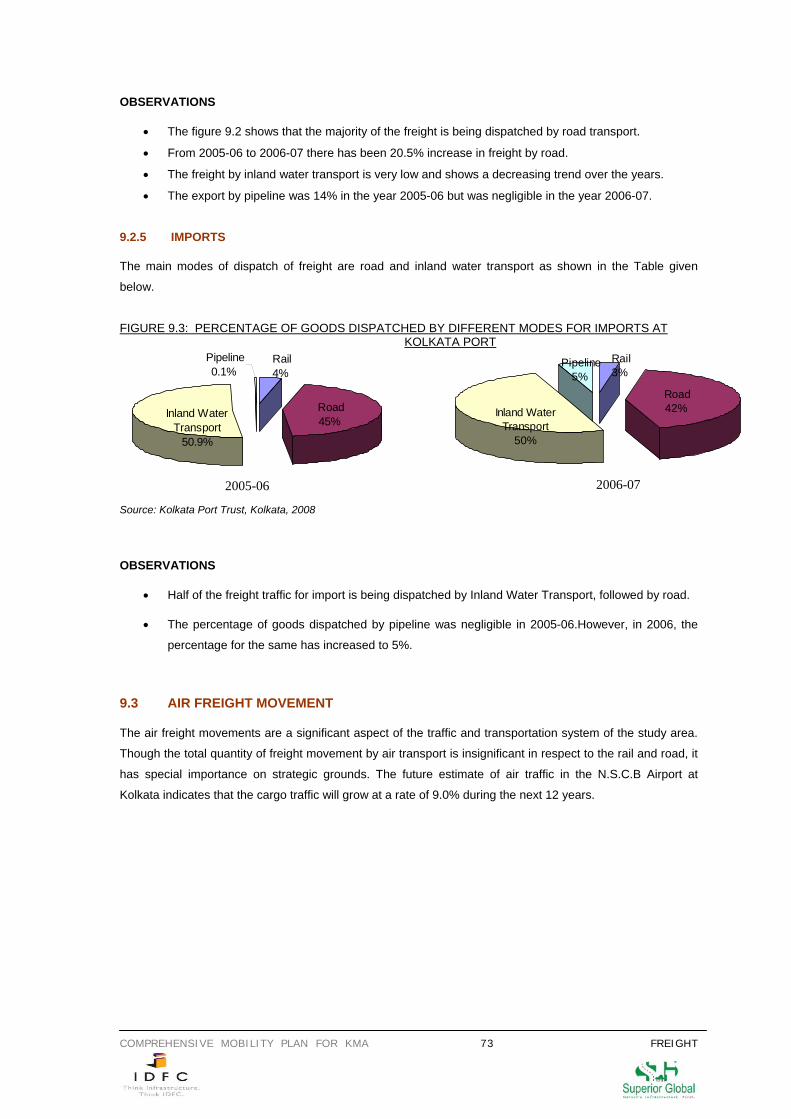
COMPREHENSIVE MOBILITY PLAN FOR KMA 73 FREIGHT
Inland Water Transport
50.9%
Pipeline0.1%
Rail4%
Road45%
Rail3%
Pipeline5%
Inland Water Transport
50%
Road42%
OBSERVATIONS
• The figure 9.2 shows that the majority of the freight is being dispatched by road transport.
• From 2005-06 to 2006-07 there has been 20.5% increase in freight by road.
• The freight by inland water transport is very low and shows a decreasing trend over the years.
• The export by pipeline was 14% in the year 2005-06 but was negligible in the year 2006-07.
9.2.5 IMPORTS The main modes of dispatch of freight are road and inland water transport as shown in the Table given
below.
FIGURE 9.3: PERCENTAGE OF GOODS DISPATCHED BY DIFFERENT MODES FOR IMPORTS AT KOLKATA PORT
Source: Kolkata Port Trust, Kolkata, 2008
OBSERVATIONS
• Half of the freight traffic for import is being dispatched by Inland Water Transport, followed by road.
• The percentage of goods dispatched by pipeline was negligible in 2005-06.However, in 2006, the
percentage for the same has increased to 5%.
9.3 AIR FREIGHT MOVEMENT The air freight movements are a significant aspect of the traffic and transportation system of the study area.
Though the total quantity of freight movement by air transport is insignificant in respect to the rail and road, it
has special importance on strategic grounds. The future estimate of air traffic in the N.S.C.B Airport at
Kolkata indicates that the cargo traffic will grow at a rate of 9.0% during the next 12 years.
2006-07 2005-06
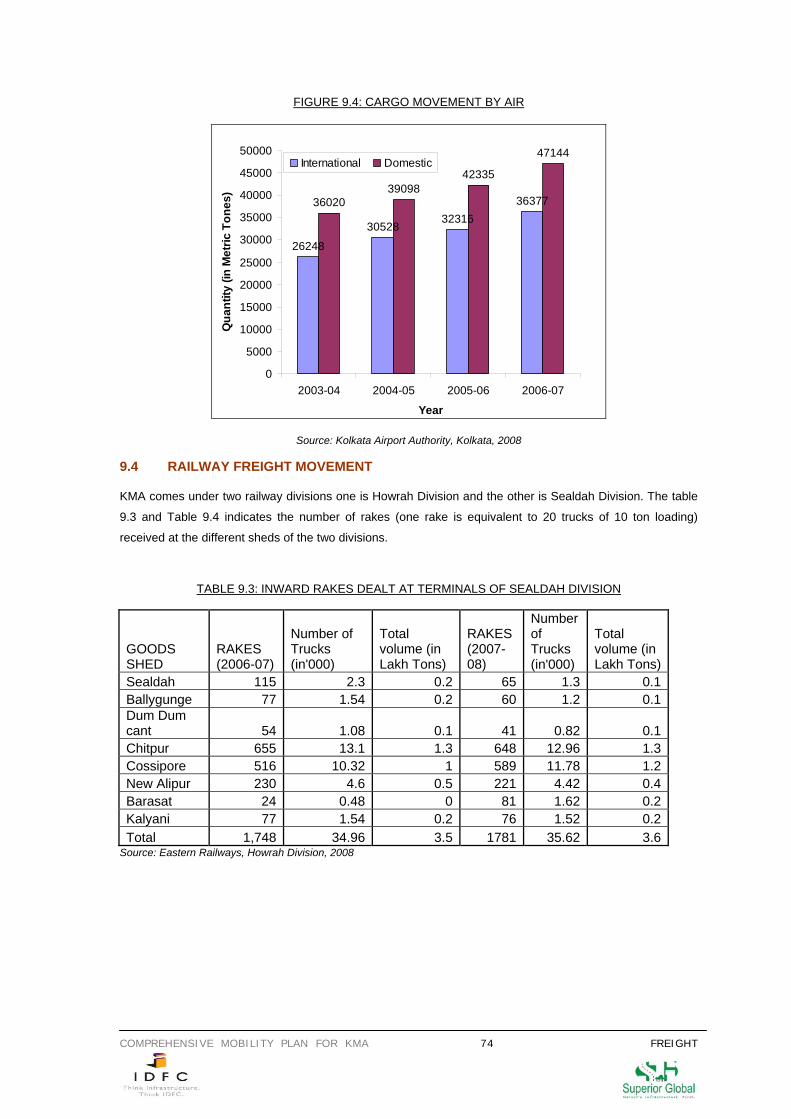
COMPREHENSIVE MOBILITY PLAN FOR KMA 74 FREIGHT
FIGURE 9.4: CARGO MOVEMENT BY AIR
26248
3052832316
363773602039098
42335
47144
0
5000
10000
15000
20000
25000
30000
35000
40000
45000
50000
2003-04 2004-05 2005-06 2006-07
Year
Qua
ntity
(in
Met
ric T
ones
)
International Domestic
Source: Kolkata Airport Authority, Kolkata, 2008 9.4 RAILWAY FREIGHT MOVEMENT KMA comes under two railway divisions one is Howrah Division and the other is Sealdah Division. The table
9.3 and Table 9.4 indicates the number of rakes (one rake is equivalent to 20 trucks of 10 ton loading)
received at the different sheds of the two divisions.
TABLE 9.3: INWARD RAKES DEALT AT TERMINALS OF SEALDAH DIVISION
GOODS SHED
RAKES (2006-07)
Number of Trucks (in'000)
Total volume (in Lakh Tons)
RAKES (2007-08)
Number of Trucks (in'000)
Total volume (in Lakh Tons)
Sealdah 115 2.3 0.2 65 1.3 0.1Ballygunge 77 1.54 0.2 60 1.2 0.1Dum Dum cant 54 1.08 0.1 41 0.82 0.1Chitpur 655 13.1 1.3 648 12.96 1.3Cossipore 516 10.32 1 589 11.78 1.2New Alipur 230 4.6 0.5 221 4.42 0.4Barasat 24 0.48 0 81 1.62 0.2Kalyani 77 1.54 0.2 76 1.52 0.2Total 1,748 34.96 3.5 1781 35.62 3.6
Source: Eastern Railways, Howrah Division, 2008
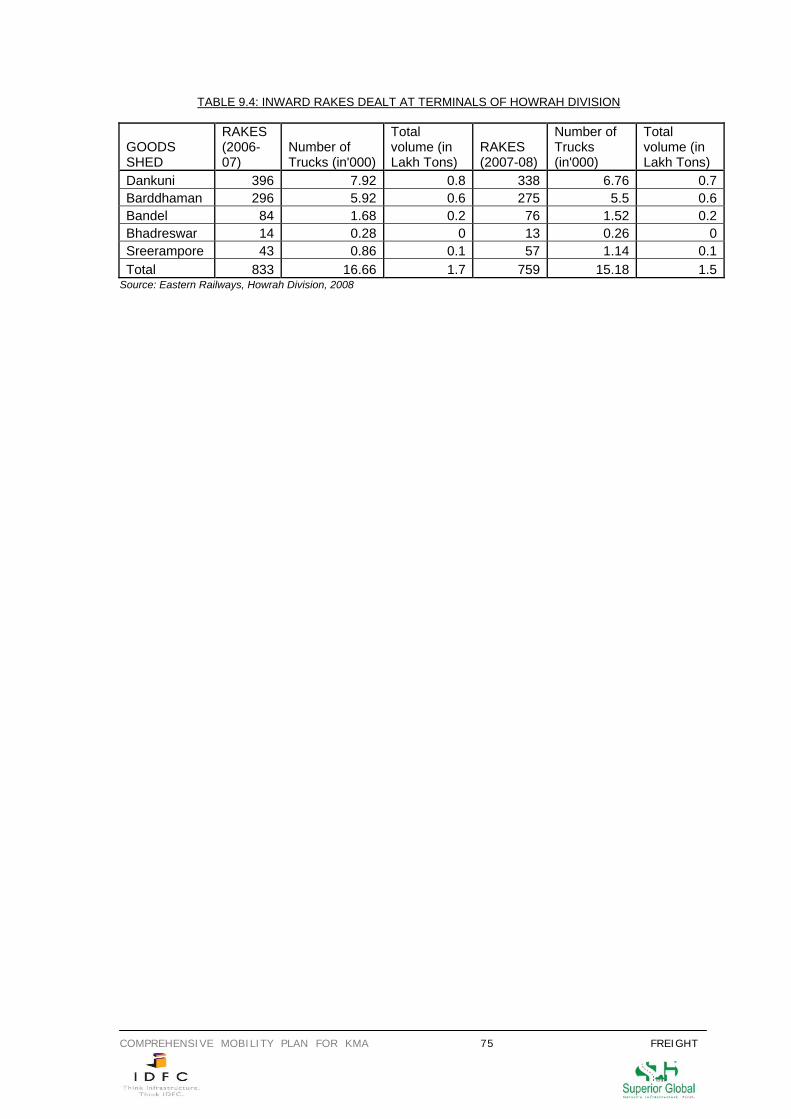
COMPREHENSIVE MOBILITY PLAN FOR KMA 75 FREIGHT
TABLE 9.4: INWARD RAKES DEALT AT TERMINALS OF HOWRAH DIVISION
GOODS SHED
RAKES (2006-07)
Number of Trucks (in'000)
Total volume (in Lakh Tons)
RAKES (2007-08)
Number of Trucks (in'000)
Total volume (in Lakh Tons)
Dankuni 396 7.92 0.8 338 6.76 0.7Barddhaman 296 5.92 0.6 275 5.5 0.6Bandel 84 1.68 0.2 76 1.52 0.2Bhadreswar 14 0.28 0 13 0.26 0Sreerampore 43 0.86 0.1 57 1.14 0.1Total 833 16.66 1.7 759 15.18 1.5
Source: Eastern Railways, Howrah Division, 2008
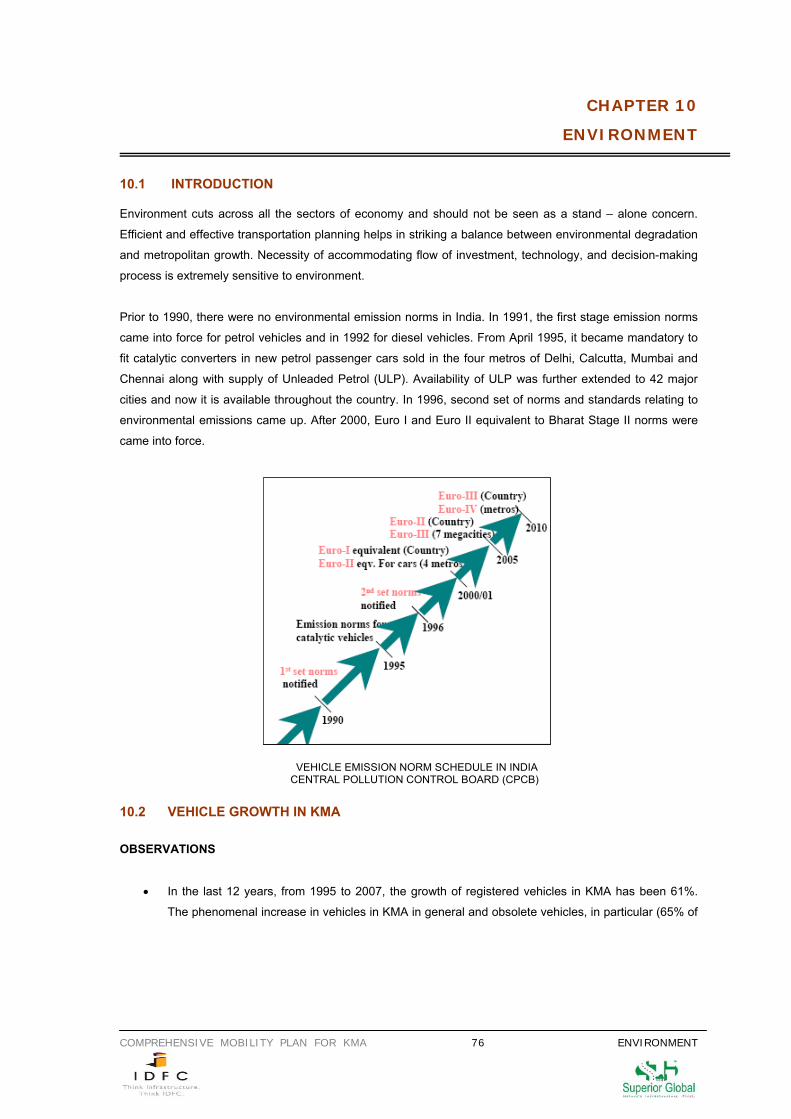
COMPREHENSIVE MOBILITY PLAN FOR KMA 76 ENVIRONMENT
CHAPTER 10
ENVIRONMENT
10.1 INTRODUCTION Environment cuts across all the sectors of economy and should not be seen as a stand – alone concern.
Efficient and effective transportation planning helps in striking a balance between environmental degradation
and metropolitan growth. Necessity of accommodating flow of investment, technology, and decision-making
process is extremely sensitive to environment.
Prior to 1990, there were no environmental emission norms in India. In 1991, the first stage emission norms
came into force for petrol vehicles and in 1992 for diesel vehicles. From April 1995, it became mandatory to
fit catalytic converters in new petrol passenger cars sold in the four metros of Delhi, Calcutta, Mumbai and
Chennai along with supply of Unleaded Petrol (ULP). Availability of ULP was further extended to 42 major
cities and now it is available throughout the country. In 1996, second set of norms and standards relating to
environmental emissions came up. After 2000, Euro I and Euro II equivalent to Bharat Stage II norms were
came into force.
VEHICLE EMISSION NORM SCHEDULE IN INDIA CENTRAL POLLUTION CONTROL BOARD (CPCB)
10.2 VEHICLE GROWTH IN KMA OBSERVATIONS
• In the last 12 years, from 1995 to 2007, the growth of registered vehicles in KMA has been 61%.
The phenomenal increase in vehicles in KMA in general and obsolete vehicles, in particular (65% of
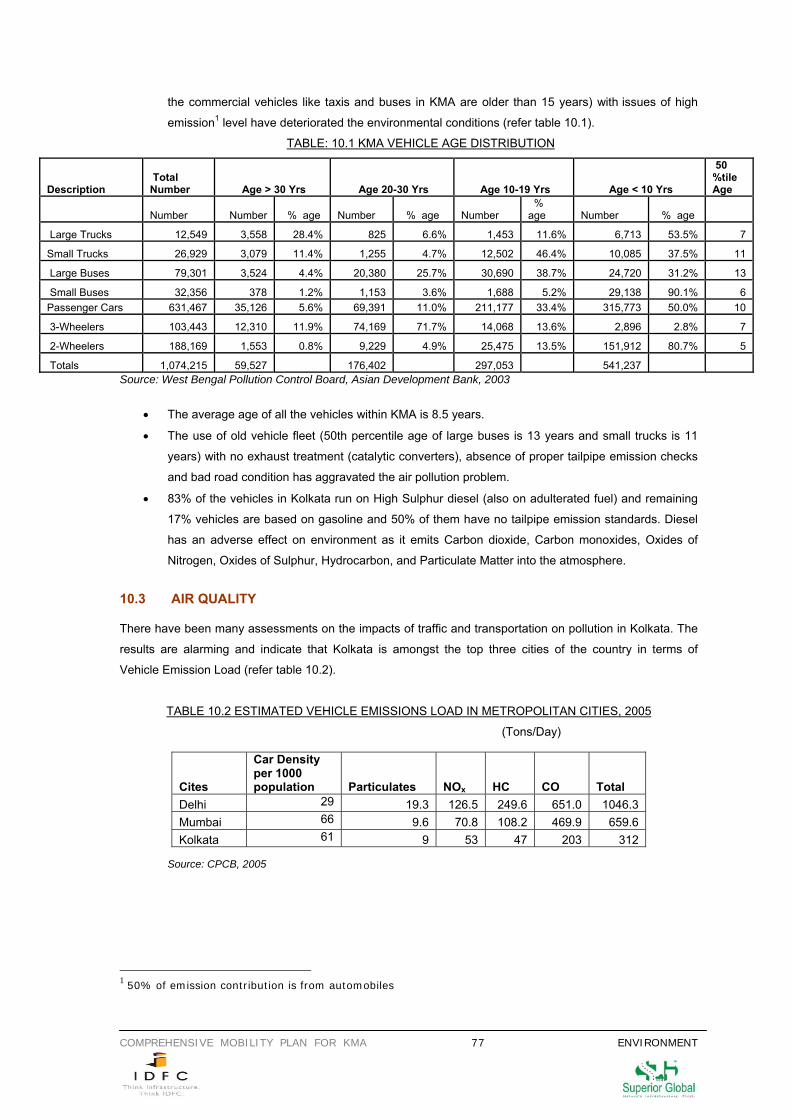
COMPREHENSIVE MOBILITY PLAN FOR KMA 77 ENVIRONMENT
the commercial vehicles like taxis and buses in KMA are older than 15 years) with issues of high
emission1 level have deteriorated the environmental conditions (refer table 10.1).
TABLE: 10.1 KMA VEHICLE AGE DISTRIBUTION
Source: West Bengal Pollution Control Board, Asian Development Bank, 2003
• The average age of all the vehicles within KMA is 8.5 years.
• The use of old vehicle fleet (50th percentile age of large buses is 13 years and small trucks is 11
years) with no exhaust treatment (catalytic converters), absence of proper tailpipe emission checks
and bad road condition has aggravated the air pollution problem.
• 83% of the vehicles in Kolkata run on High Sulphur diesel (also on adulterated fuel) and remaining
17% vehicles are based on gasoline and 50% of them have no tailpipe emission standards. Diesel
has an adverse effect on environment as it emits Carbon dioxide, Carbon monoxides, Oxides of
Nitrogen, Oxides of Sulphur, Hydrocarbon, and Particulate Matter into the atmosphere.
10.3 AIR QUALITY There have been many assessments on the impacts of traffic and transportation on pollution in Kolkata. The
results are alarming and indicate that Kolkata is amongst the top three cities of the country in terms of
Vehicle Emission Load (refer table 10.2).
TABLE 10.2 ESTIMATED VEHICLE EMISSIONS LOAD IN METROPOLITAN CITIES, 2005
(Tons/Day)
Source: CPCB, 2005
1 50% of emission contribution is from automobiles
Description Total Number Age > 30 Yrs Age 20-30 Yrs Age 10-19 Yrs Age < 10 Yrs
50 %tile Age
Number Number % age Number % age Number % age Number % age
Large Trucks 12,549 3,558 28.4% 825 6.6% 1,453 11.6% 6,713 53.5% 7
Small Trucks 26,929 3,079 11.4% 1,255 4.7% 12,502 46.4% 10,085 37.5% 11
Large Buses 79,301 3,524 4.4% 20,380 25.7% 30,690 38.7% 24,720 31.2% 13
Small Buses 32,356 378 1.2% 1,153 3.6% 1,688 5.2% 29,138 90.1% 6 Passenger Cars 631,467 35,126 5.6% 69,391 11.0% 211,177 33.4% 315,773 50.0% 10
3-Wheelers 103,443 12,310 11.9% 74,169 71.7% 14,068 13.6% 2,896 2.8% 7
2-Wheelers 188,169 1,553 0.8% 9,229 4.9% 25,475 13.5% 151,912 80.7% 5
Totals 1,074,215 59,527 176,402 297,053 541,237
Cites
Car Density per 1000 population Particulates NOx HC CO Total
Delhi 29 19.3 126.5 249.6 651.0 1046.3 Mumbai 66 9.6 70.8 108.2 469.9 659.6 Kolkata 61 9 53 47 203 312
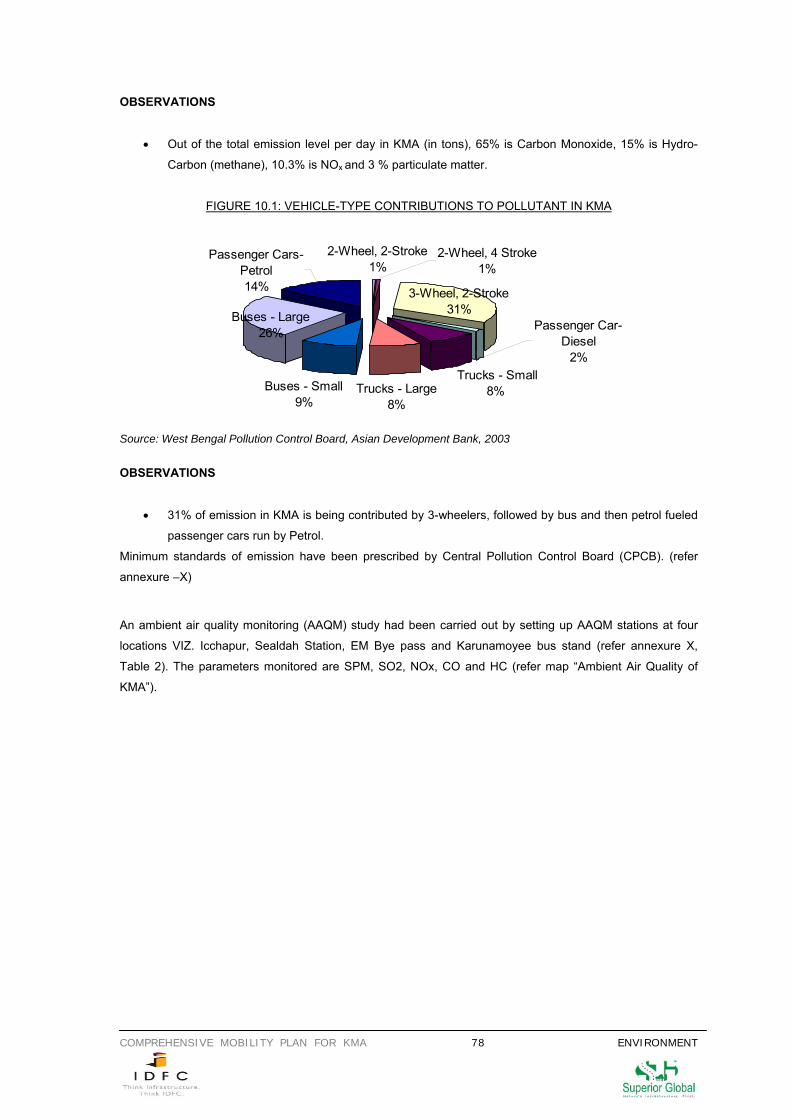
COMPREHENSIVE MOBILITY PLAN FOR KMA 78 ENVIRONMENT
2-Wheel, 2-Stroke1%
Buses - Large26% Passenger Car-
Diesel 2%
Trucks - Large8%
Trucks - Small8%
3-Wheel, 2-Stroke31%
2-Wheel, 4 Stroke1%
Passenger Cars-Petrol14%
Buses - Small9%
OBSERVATIONS
• Out of the total emission level per day in KMA (in tons), 65% is Carbon Monoxide, 15% is Hydro-
Carbon (methane), 10.3% is NOx and 3 % particulate matter.
FIGURE 10.1: VEHICLE-TYPE CONTRIBUTIONS TO POLLUTANT IN KMA
Source: West Bengal Pollution Control Board, Asian Development Bank, 2003
OBSERVATIONS
• 31% of emission in KMA is being contributed by 3-wheelers, followed by bus and then petrol fueled
passenger cars run by Petrol.
Minimum standards of emission have been prescribed by Central Pollution Control Board (CPCB). (refer
annexure –X)
An ambient air quality monitoring (AAQM) study had been carried out by setting up AAQM stations at four
locations VIZ. Icchapur, Sealdah Station, EM Bye pass and Karunamoyee bus stand (refer annexure X,
Table 2). The parameters monitored are SPM, SO2, NOx, CO and HC (refer map “Ambient Air Quality of
KMA”).
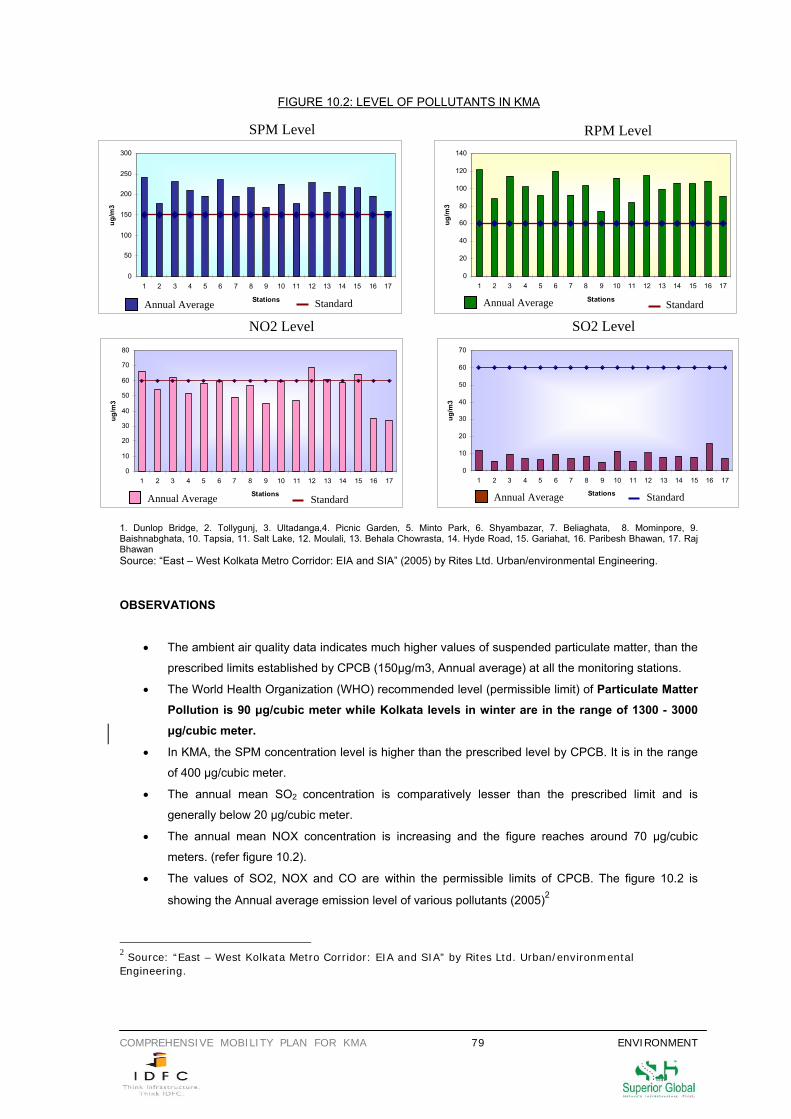
COMPREHENSIVE MOBILITY PLAN FOR KMA 79 ENVIRONMENT
FIGURE 10.2: LEVEL OF POLLUTANTS IN KMA
1. Dunlop Bridge, 2. Tollygunj, 3. Ultadanga,4. Picnic Garden, 5. Minto Park, 6. Shyambazar, 7. Beliaghata, 8. Mominpore, 9. Baishnabghata, 10. Tapsia, 11. Salt Lake, 12. Moulali, 13. Behala Chowrasta, 14. Hyde Road, 15. Gariahat, 16. Paribesh Bhawan, 17. Raj Bhawan Source: “East – West Kolkata Metro Corridor: EIA and SIA” (2005) by Rites Ltd. Urban/environmental Engineering. OBSERVATIONS
• The ambient air quality data indicates much higher values of suspended particulate matter, than the
prescribed limits established by CPCB (150μg/m3, Annual average) at all the monitoring stations.
• The World Health Organization (WHO) recommended level (permissible limit) of Particulate Matter Pollution is 90 μg/cubic meter while Kolkata levels in winter are in the range of 1300 - 3000 μg/cubic meter.
• In KMA, the SPM concentration level is higher than the prescribed level by CPCB. It is in the range
of 400 μg/cubic meter.
• The annual mean SO2 concentration is comparatively lesser than the prescribed limit and is
generally below 20 μg/cubic meter.
• The annual mean NOX concentration is increasing and the figure reaches around 70 μg/cubic
meters. (refer figure 10.2).
• The values of SO2, NOX and CO are within the permissible limits of CPCB. The figure 10.2 is
showing the Annual average emission level of various pollutants (2005)2
2 Source: “East – West Kolkata Metro Corridor: EIA and SIA” by Rites Ltd. Urban/environmental Engineering.
0
50
100
150
200
250
300
1 2 3 4 5 6 7 8 9 10 11 12 13 14 15 16 17
Stations
ug/m
3
Annual Average Standard
SPM Level
0
20
40
60
80
100
120
140
1 2 3 4 5 6 7 8 9 10 11 12 13 14 15 16 17
Stations
ug/m
3
Annual Average Standard
RPM Level
0
10
20
30
40
50
60
70
80
1 2 3 4 5 6 7 8 9 10 11 12 13 14 15 16 17
Stations
ug/m
3
Annual Average Standard
NO2 Level SO2 Level
0
10
20
30
40
50
60
70
1 2 3 4 5 6 7 8 9 10 11 12 13 14 15 16 17
Stations
ug/m
3
Annual Average Standard
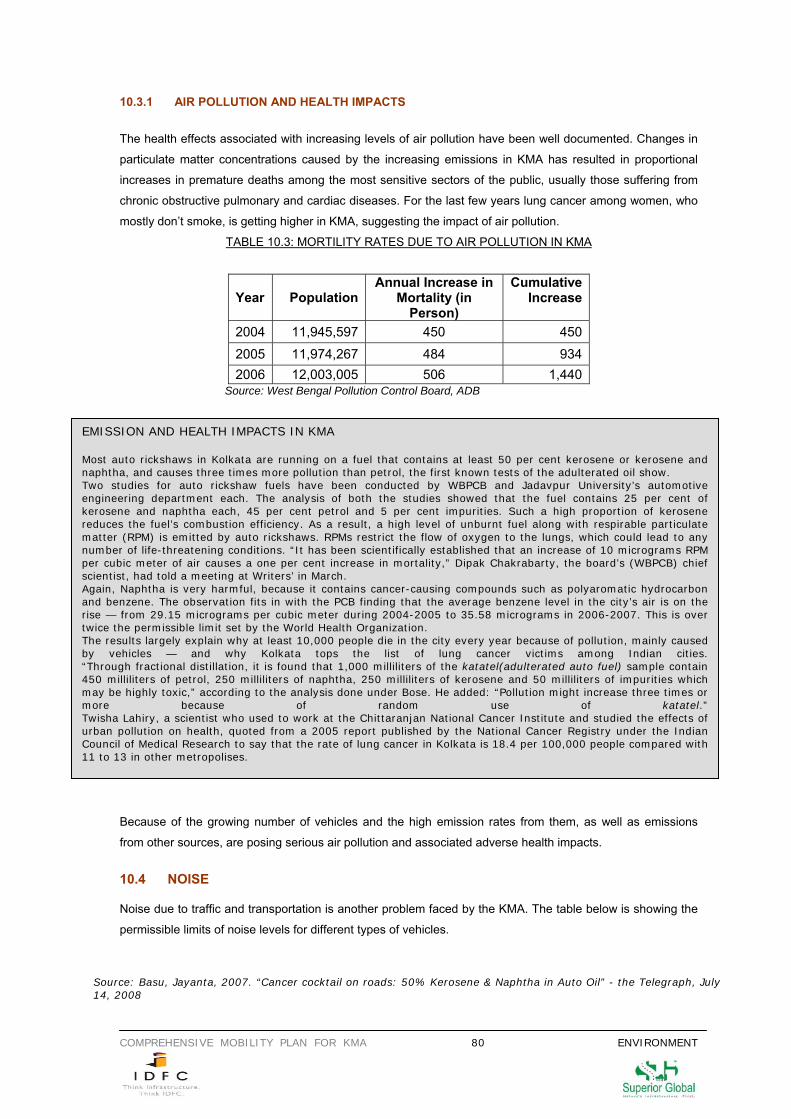
COMPREHENSIVE MOBILITY PLAN FOR KMA 80 ENVIRONMENT
10.3.1 AIR POLLUTION AND HEALTH IMPACTS The health effects associated with increasing levels of air pollution have been well documented. Changes in
particulate matter concentrations caused by the increasing emissions in KMA has resulted in proportional
increases in premature deaths among the most sensitive sectors of the public, usually those suffering from
chronic obstructive pulmonary and cardiac diseases. For the last few years lung cancer among women, who
mostly don’t smoke, is getting higher in KMA, suggesting the impact of air pollution.
TABLE 10.3: MORTILITY RATES DUE TO AIR POLLUTION IN KMA
Year Population Annual Increase in
Mortality (in Person)
Cumulative Increase
2004 11,945,597 450 450
2005 11,974,267 484 934 2006 12,003,005 506 1,440
Source: West Bengal Pollution Control Board, ADB
Because of the growing number of vehicles and the high emission rates from them, as well as emissions
from other sources, are posing serious air pollution and associated adverse health impacts.
10.4 NOISE Noise due to traffic and transportation is another problem faced by the KMA. The table below is showing the
permissible limits of noise levels for different types of vehicles.
EMISSION AND HEALTH IMPACTS IN KMA Most auto rickshaws in Kolkata are running on a fuel that contains at least 50 per cent kerosene or kerosene and naphtha, and causes three times more pollution than petrol, the first known tests of the adulterated oil show. Two studies for auto rickshaw fuels have been conducted by WBPCB and Jadavpur University’s automotive engineering department each. The analysis of both the studies showed that the fuel contains 25 per cent of kerosene and naphtha each, 45 per cent petrol and 5 per cent impurities. Such a high proportion of kerosene reduces the fuel’s combustion efficiency. As a result, a high level of unburnt fuel along with respirable particulate matter (RPM) is emitted by auto rickshaws. RPMs restrict the flow of oxygen to the lungs, which could lead to any number of life-threatening conditions. “It has been scientifically established that an increase of 10 micrograms RPM per cubic meter of air causes a one per cent increase in mortality,” Dipak Chakrabarty, the board’s (WBPCB) chief scientist, had told a meeting at Writers’ in March. Again, Naphtha is very harmful, because it contains cancer-causing compounds such as polyaromatic hydrocarbon and benzene. The observation fits in with the PCB finding that the average benzene level in the city’s air is on the rise — from 29.15 micrograms per cubic meter during 2004-2005 to 35.58 micrograms in 2006-2007. This is over twice the permissible limit set by the World Health Organization. The results largely explain why at least 10,000 people die in the city every year because of pollution, mainly caused by vehicles — and why Kolkata tops the list of lung cancer victims among Indian cities. “Through fractional distillation, it is found that 1,000 milliliters of the katatel(adulterated auto fuel) sample contain 450 milliliters of petrol, 250 milliliters of naphtha, 250 milliliters of kerosene and 50 milliliters of impurities which may be highly toxic,” according to the analysis done under Bose. He added: “Pollution might increase three times or more because of random use of katatel.” Twisha Lahiry, a scientist who used to work at the Chittaranjan National Cancer Institute and studied the effects of urban pollution on health, quoted from a 2005 report published by the National Cancer Registry under the Indian Council of Medical Research to say that the rate of lung cancer in Kolkata is 18.4 per 100,000 people compared with 11 to 13 in other metropolises.
Source: Basu, Jayanta, 2007. “Cancer cocktail on roads: 50% Kerosene & Naphtha in Auto Oil” - the Telegraph, July 14, 2008
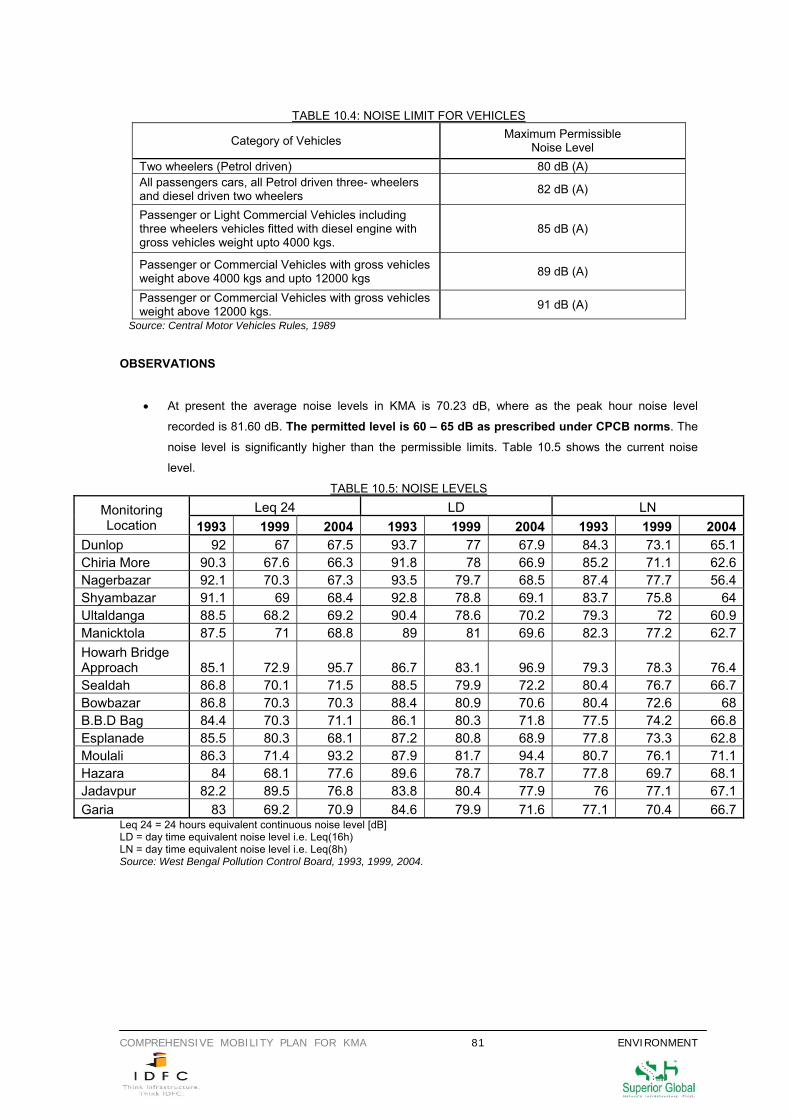
COMPREHENSIVE MOBILITY PLAN FOR KMA 81 ENVIRONMENT
TABLE 10.4: NOISE LIMIT FOR VEHICLES
Category of Vehicles Maximum Permissible Noise Level
Two wheelers (Petrol driven) 80 dB (A) All passengers cars, all Petrol driven three- wheelers and diesel driven two wheelers 82 dB (A)
Passenger or Light Commercial Vehicles including three wheelers vehicles fitted with diesel engine with gross vehicles weight upto 4000 kgs.
85 dB (A)
Passenger or Commercial Vehicles with gross vehicles weight above 4000 kgs and upto 12000 kgs 89 dB (A)
Passenger or Commercial Vehicles with gross vehicles weight above 12000 kgs. 91 dB (A)
Source: Central Motor Vehicles Rules, 1989 OBSERVATIONS
• At present the average noise levels in KMA is 70.23 dB, where as the peak hour noise level
recorded is 81.60 dB. The permitted level is 60 – 65 dB as prescribed under CPCB norms. The
noise level is significantly higher than the permissible limits. Table 10.5 shows the current noise
level.
TABLE 10.5: NOISE LEVELS Leq 24 LD LN Monitoring
Location 1993 1999 2004 1993 1999 2004 1993 1999 2004Dunlop 92 67 67.5 93.7 77 67.9 84.3 73.1 65.1Chiria More 90.3 67.6 66.3 91.8 78 66.9 85.2 71.1 62.6Nagerbazar 92.1 70.3 67.3 93.5 79.7 68.5 87.4 77.7 56.4Shyambazar 91.1 69 68.4 92.8 78.8 69.1 83.7 75.8 64Ultaldanga 88.5 68.2 69.2 90.4 78.6 70.2 79.3 72 60.9Manicktola 87.5 71 68.8 89 81 69.6 82.3 77.2 62.7Howarh Bridge Approach 85.1 72.9 95.7 86.7 83.1 96.9 79.3 78.3 76.4Sealdah 86.8 70.1 71.5 88.5 79.9 72.2 80.4 76.7 66.7Bowbazar 86.8 70.3 70.3 88.4 80.9 70.6 80.4 72.6 68B.B.D Bag 84.4 70.3 71.1 86.1 80.3 71.8 77.5 74.2 66.8Esplanade 85.5 80.3 68.1 87.2 80.8 68.9 77.8 73.3 62.8Moulali 86.3 71.4 93.2 87.9 81.7 94.4 80.7 76.1 71.1Hazara 84 68.1 77.6 89.6 78.7 78.7 77.8 69.7 68.1Jadavpur 82.2 89.5 76.8 83.8 80.4 77.9 76 77.1 67.1Garia 83 69.2 70.9 84.6 79.9 71.6 77.1 70.4 66.7
Leq 24 = 24 hours equivalent continuous noise level [dB] LD = day time equivalent noise level i.e. Leq(16h) LN = day time equivalent noise level i.e. Leq(8h) Source: West Bengal Pollution Control Board, 1993, 1999, 2004.
COMPREHENSIVE MOBILITY PLAN FOR KMA 82 PROBLEMS AND ISSUES
CHAPTER 11
PROBLEMS AND ISSUES
Congestion, parking problems and non integrated Mass Rapid Transit System with obsolete technologies
and aged fleet are some of the common issues of KMA. In the absence of proper governance time to time
policy formulation and implementation has not been done in the recent decades. The chapter summarizes
some of the issues and problems of the existing transportation infrastructure in KMA. This has been
consciously done to provide a streamlined unidirectional approach for the proposals.
11.1 ROAD NETWORK
• Only 5 % of the KMA land is under transportation use.
• High V/C ratio on the arterial roads in the KMA, resulting in traffic congestion and low speed.
• Absence of ring road in the KMA, no high-speed alternate route available to bypass the congested
core area.
• Uncoordinated road infrastructure planning.
• Inadequately designed and maintained carriageways and intersections.
• Lack of traffic facilities (e.g., traffic signals and U-turns).
11.2 MASS RAPID TRANSIT SYSTEM
• Underutilised.
• The MRTS system in KMA does not provides point to point connectivity.
• Poorly managed metro system has very low mean distance between failure, old technology and
very poor headway.
• No integration of the metro with other surface transit modes.
• No dedicated senior management cadre.
• Metro is not a focus area of the parent body which is Ministry of Railway.
11.3 TRAM SYSTEM
• Point to point connectivity has been disrupted.
• Absence of segregated Right of Way leads to conflict between the tram and the vehicular traffic.
• Poor level of service in terms of speed, frequency, headway between trams (25-30 minutes), poorly
maintained.
• No capital infusion for the last 50 years has led to obsolete technology.
• No designated facility for passenger embarkation and dispersal.
COMPREHENSIVE MOBILITY PLAN FOR KMA 83 PROBLEMS AND ISSUES
11.4 CIRCULAR RAIL
• Coaches used for the suburban trains are outdated and need to be upgraded.
• The trains run overloaded beyond capacity also the seating facilities are inadequate.
• There are no rest room facilities at any of the suburban stations.
• There is no provision of public convenience in coaches used for suburban trains.
• Long waiting time at Ticketing Booth
• Bottleneck situation at Chandmari and Banaras Bridge
11.5 BUS SERVICE
• Lack of coordination between operating agencies.
• Obsolete and poorly maintained bus fleet.
• Lack of bus terminals resulting in on-street parking of the buses.
• Routes not rationalized.
• Bus stops are not properly located.
• Poor level of service in terms of the carrying capacity of each bus and the strength of the bus fleet.
• Bus drivers are abused traffic rules.
• Buses reasons.
11.6 FERRY
• No integration with other modes
• Temporary jetties being used in many places are very unsafe specially in the rainy slopes.
• Speed of existing ferries is very slow.
• Ferries not operating for establishing connectivity along the river bank
• Oil spill from ferries owing to their age and insensitivity towards adoption of newer technology has
environmental implications.
• Lack of sufficient numbers of permanent jetties
• Lack of passenger amenities at ferry ghats.
• No civic amenities on the ferries.
• Inadequate ticketing facilities.
11.7 SUBURBAN RAIL
• Long waiting time.
• Cluttered thorough fare impacting passenger flow
• Bottleneck situation at chandmari and banaras bridge.
• Large parcel movement on the platform impacting passenger flow.
COMPREHENSIVE MOBILITY PLAN FOR KMA 84 PROBLEMS AND ISSUES
• Parcel security issues
• Water spill from the fish containers movement -unsanitary and unsafe.
• Railway stations are not integrated properly with Public Transport.
• Lack of passenger facilities at the stations.
11.8 PEDESTRIAN AND BICYCLE
• Footpath/sidewalks encroached by hawkers.
• Pedestrians at mercy of automobile.
• Absence of bicycle paths.
• Lack of pedestrian underpasses and over bridges for crossing the road.
• No enforcement.
11.9 PARKING CHARACTERISTICS
• Lack of parking Facilities.
• On-street parking.
• Non existence of parking rules.
• Relatively “Free” parking fee structure.
11.10 FREIGHT MOVEMENT KOLKATA PORT
• Over utilization of existing facilities.
• Lack of technological augmentation.
• Lack of freight terminals.
11.11 ENVIRONMENT
• High level of SPM/RPM in the city.
• High level of Noise Pollution.
• Adulterated fuel used by three wheelers.
• Massive adulterated vehicles running in KMA.
• No tail pipe emission controls i.e. no catalytic converters.
• Lack of stringent implementation of emission norms for vehicles.
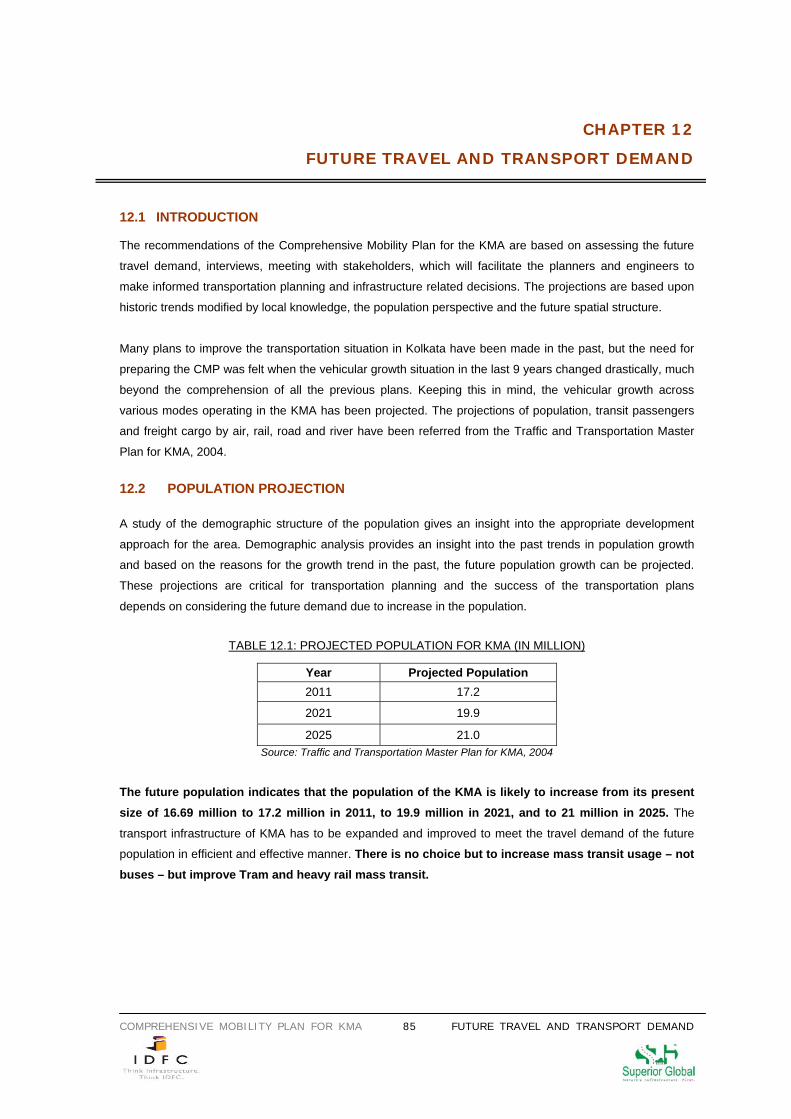
COMPREHENSIVE MOBILITY PLAN FOR KMA 85 FUTURE TRAVEL AND TRANSPORT DEMAND
CHAPTER 12
FUTURE TRAVEL AND TRANSPORT DEMAND
12.1 INTRODUCTION The recommendations of the Comprehensive Mobility Plan for the KMA are based on assessing the future
travel demand, interviews, meeting with stakeholders, which will facilitate the planners and engineers to
make informed transportation planning and infrastructure related decisions. The projections are based upon
historic trends modified by local knowledge, the population perspective and the future spatial structure.
Many plans to improve the transportation situation in Kolkata have been made in the past, but the need for
preparing the CMP was felt when the vehicular growth situation in the last 9 years changed drastically, much
beyond the comprehension of all the previous plans. Keeping this in mind, the vehicular growth across
various modes operating in the KMA has been projected. The projections of population, transit passengers
and freight cargo by air, rail, road and river have been referred from the Traffic and Transportation Master
Plan for KMA, 2004.
12.2 POPULATION PROJECTION
A study of the demographic structure of the population gives an insight into the appropriate development
approach for the area. Demographic analysis provides an insight into the past trends in population growth
and based on the reasons for the growth trend in the past, the future population growth can be projected.
These projections are critical for transportation planning and the success of the transportation plans
depends on considering the future demand due to increase in the population.
TABLE 12.1: PROJECTED POPULATION FOR KMA (IN MILLION)
Year Projected Population 2011 17.2
2021 19.9
2025 21.0 Source: Traffic and Transportation Master Plan for KMA, 2004
The future population indicates that the population of the KMA is likely to increase from its present size of 16.69 million to 17.2 million in 2011, to 19.9 million in 2021, and to 21 million in 2025. The
transport infrastructure of KMA has to be expanded and improved to meet the travel demand of the future
population in efficient and effective manner. There is no choice but to increase mass transit usage – not buses – but improve Tram and heavy rail mass transit.
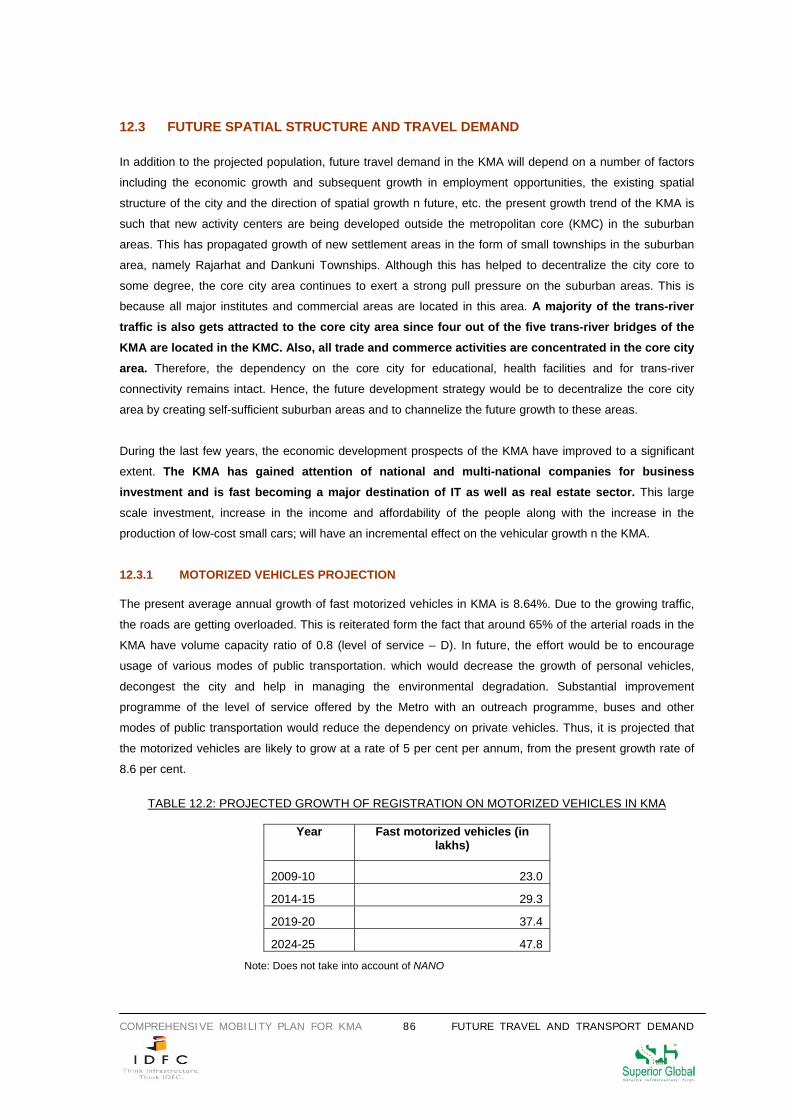
COMPREHENSIVE MOBILITY PLAN FOR KMA 86 FUTURE TRAVEL AND TRANSPORT DEMAND
12.3 FUTURE SPATIAL STRUCTURE AND TRAVEL DEMAND
In addition to the projected population, future travel demand in the KMA will depend on a number of factors
including the economic growth and subsequent growth in employment opportunities, the existing spatial
structure of the city and the direction of spatial growth n future, etc. the present growth trend of the KMA is
such that new activity centers are being developed outside the metropolitan core (KMC) in the suburban
areas. This has propagated growth of new settlement areas in the form of small townships in the suburban
area, namely Rajarhat and Dankuni Townships. Although this has helped to decentralize the city core to
some degree, the core city area continues to exert a strong pull pressure on the suburban areas. This is
because all major institutes and commercial areas are located in this area. A majority of the trans-river traffic is also gets attracted to the core city area since four out of the five trans-river bridges of the KMA are located in the KMC. Also, all trade and commerce activities are concentrated in the core city area. Therefore, the dependency on the core city for educational, health facilities and for trans-river
connectivity remains intact. Hence, the future development strategy would be to decentralize the core city
area by creating self-sufficient suburban areas and to channelize the future growth to these areas.
During the last few years, the economic development prospects of the KMA have improved to a significant
extent. The KMA has gained attention of national and multi-national companies for business investment and is fast becoming a major destination of IT as well as real estate sector. This large
scale investment, increase in the income and affordability of the people along with the increase in the
production of low-cost small cars; will have an incremental effect on the vehicular growth n the KMA.
12.3.1 MOTORIZED VEHICLES PROJECTION The present average annual growth of fast motorized vehicles in KMA is 8.64%. Due to the growing traffic,
the roads are getting overloaded. This is reiterated form the fact that around 65% of the arterial roads in the
KMA have volume capacity ratio of 0.8 (level of service – D). In future, the effort would be to encourage
usage of various modes of public transportation. which would decrease the growth of personal vehicles,
decongest the city and help in managing the environmental degradation. Substantial improvement
programme of the level of service offered by the Metro with an outreach programme, buses and other
modes of public transportation would reduce the dependency on private vehicles. Thus, it is projected that
the motorized vehicles are likely to grow at a rate of 5 per cent per annum, from the present growth rate of
8.6 per cent.
TABLE 12.2: PROJECTED GROWTH OF REGISTRATION ON MOTORIZED VEHICLES IN KMA
Year Fast motorized vehicles (in
lakhs)
2009-10 23.0
2014-15 29.3
2019-20 37.4
2024-25 47.8
Note: Does not take into account of NANO
COMPREHENSIVE MOBILITY PLAN FOR KMA 87 FUTURE TRAVEL AND TRANSPORT DEMAND
12.3.2 TRANSIT PASSENGERS PROJECTION According to the Perspective Plan of CMA: 2025, the transit passengers are likely to increase at the rate of 3
per cent. It is estimated that the total transit trips by all modes of transit vehicles will be about 235 lakhs per
day in 2011 and in 2025, it will be 322 lakh per day.
To accommodate an increase of almost 100 lakh trips per day, a two fold strategy needs to be adopted.
Firstly, the existing road network needs to be urgently upgraded and augmented. Secondly, the usage of
public transport needs to be increased by establishing an efficient and inter-linked public transportation
system, through bus, light rail transit (LRT), metro rail, trams, ferry etc., which would help in reducing the
congestion.
12.3.3 FREIGHT TRAFFIC PROJECTION The projected freight traffic in 2011 would be 124.7 million ton and in 2025, it would be 169.8 million ton. The
table below is showing the modal distribution of freight movement:
TABLE 12.3: ESTIMATED FREIGHT TRAFFIC IN KMA
Mode of Transport Road Rail River
Year 2011 2025 2011 2025 2011 2025
Freight Movement (in million ton) 103.0 123.0 19.9 28.8 12.0 13.0
Source: Vision 2025, Perspective Plan of CMA: 2025, December 2004
Handling 123.0 million ton of cargo efficiently by road establishes the need for separate corridors for freight
movement in order to avoid mixing of domestic and freight traffic. This type of intervention would improve the
efficiency of the transportation system in the KMA. According to the Airport Authority of India, 61,000 tons of
international cargo and 64,000 tons of domestic cargo would be handled in 2012 which would further
increase the load of freight movement on the roads. In addition to this, 30 per cent of the traffic entering the
KMC (including freight traffic) is not destined for KMC. In absence of alternate routes, this through traffic
adds to the traffic volume on the narrow congested roads of the KMC. Providing alternate routes for freight
movement would also help in decongesting the core city area to a great extent.
12.3.4 GROWTH OF PASSENGERS ENTERING AND EXITING KMA 12.3.4.1 BY RAILWAY The estimated growth of persons entering or leaving the KMA by railways in 2025 is 173.3 million, which is
almost three times the passenger movement by railways in 2009-10. Around 90 per cent of the passengers
would be commuting via Sealdah station while 10 per cent of the movement would be through Howrah
station. The increase in passenger movement towards/from Howrah station has a direct implication on the
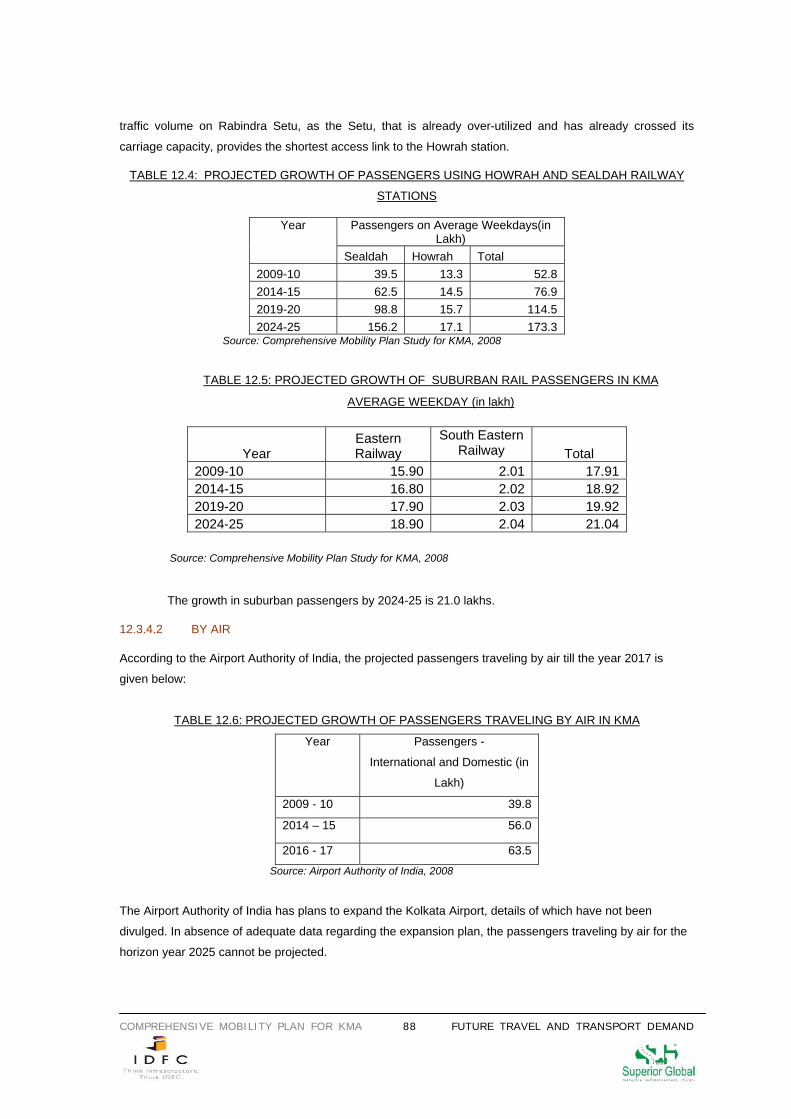
COMPREHENSIVE MOBILITY PLAN FOR KMA 88 FUTURE TRAVEL AND TRANSPORT DEMAND
traffic volume on Rabindra Setu, as the Setu, that is already over-utilized and has already crossed its
carriage capacity, provides the shortest access link to the Howrah station.
TABLE 12.4: PROJECTED GROWTH OF PASSENGERS USING HOWRAH AND SEALDAH RAILWAY
STATIONS
Passengers on Average Weekdays(in Lakh)
Year
Sealdah Howrah Total 2009-10 39.5 13.3 52.8 2014-15 62.5 14.5 76.9 2019-20 98.8 15.7 114.5 2024-25 156.2 17.1 173.3
Source: Comprehensive Mobility Plan Study for KMA, 2008
TABLE 12.5: PROJECTED GROWTH OF SUBURBAN RAIL PASSENGERS IN KMA
AVERAGE WEEKDAY (in lakh)
Source: Comprehensive Mobility Plan Study for KMA, 2008
The growth in suburban passengers by 2024-25 is 21.0 lakhs.
12.3.4.2 BY AIR According to the Airport Authority of India, the projected passengers traveling by air till the year 2017 is
given below:
TABLE 12.6: PROJECTED GROWTH OF PASSENGERS TRAVELING BY AIR IN KMA
Year Passengers -
International and Domestic (in
Lakh)
2009 - 10 39.8
2014 – 15 56.0
2016 - 17 63.5
Source: Airport Authority of India, 2008
The Airport Authority of India has plans to expand the Kolkata Airport, details of which have not been
divulged. In absence of adequate data regarding the expansion plan, the passengers traveling by air for the
horizon year 2025 cannot be projected.
Year Eastern Railway
South Eastern Railway Total
2009-10 15.90 2.01 17.91 2014-15 16.80 2.02 18.92 2019-20 17.90 2.03 19.92 2024-25 18.90 2.04 21.04
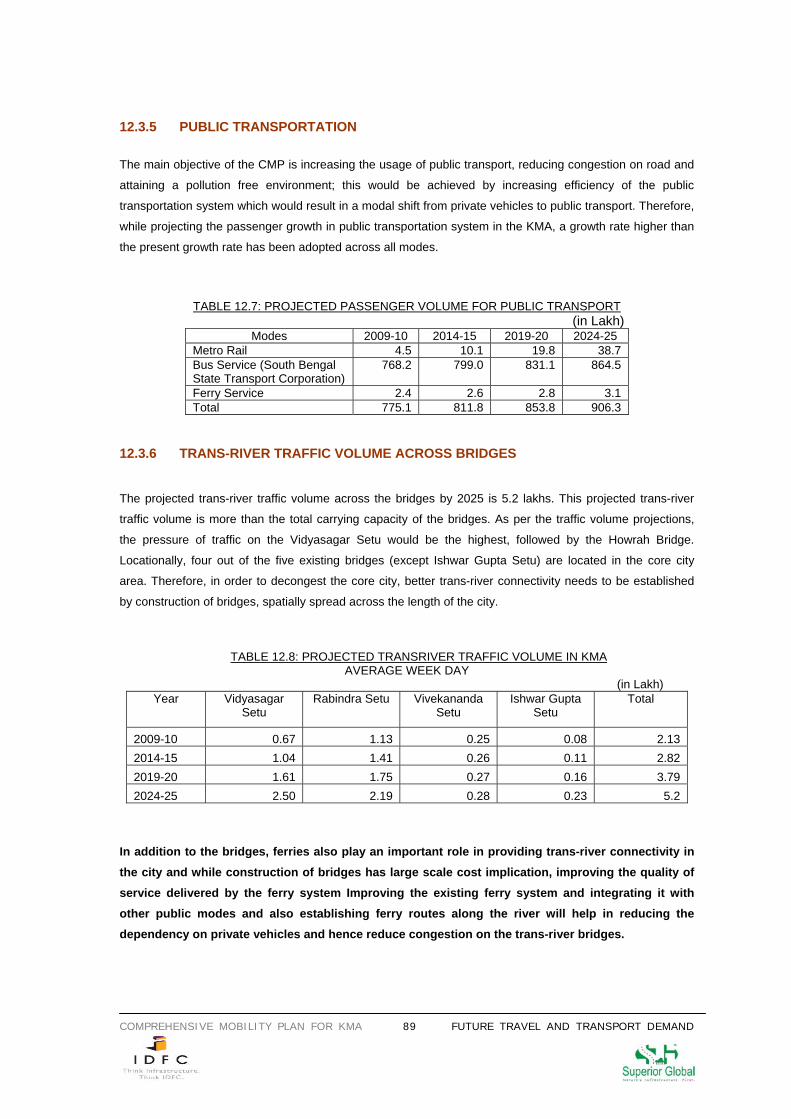
COMPREHENSIVE MOBILITY PLAN FOR KMA 89 FUTURE TRAVEL AND TRANSPORT DEMAND
12.3.5 PUBLIC TRANSPORTATION The main objective of the CMP is increasing the usage of public transport, reducing congestion on road and
attaining a pollution free environment; this would be achieved by increasing efficiency of the public
transportation system which would result in a modal shift from private vehicles to public transport. Therefore,
while projecting the passenger growth in public transportation system in the KMA, a growth rate higher than
the present growth rate has been adopted across all modes.
TABLE 12.7: PROJECTED PASSENGER VOLUME FOR PUBLIC TRANSPORT (in Lakh)
Modes 2009-10 2014-15 2019-20 2024-25 Metro Rail 4.5 10.1 19.8 38.7 Bus Service (South Bengal State Transport Corporation)
768.2 799.0 831.1 864.5
Ferry Service 2.4 2.6 2.8 3.1 Total 775.1 811.8 853.8 906.3
12.3.6 TRANS-RIVER TRAFFIC VOLUME ACROSS BRIDGES The projected trans-river traffic volume across the bridges by 2025 is 5.2 lakhs. This projected trans-river
traffic volume is more than the total carrying capacity of the bridges. As per the traffic volume projections,
the pressure of traffic on the Vidyasagar Setu would be the highest, followed by the Howrah Bridge.
Locationally, four out of the five existing bridges (except Ishwar Gupta Setu) are located in the core city
area. Therefore, in order to decongest the core city, better trans-river connectivity needs to be established
by construction of bridges, spatially spread across the length of the city.
TABLE 12.8: PROJECTED TRANSRIVER TRAFFIC VOLUME IN KMA
AVERAGE WEEK DAY (in Lakh)
Year Vidyasagar Setu
Rabindra Setu
Vivekananda Setu
Ishwar Gupta Setu
Total
2009-10 0.67 1.13 0.25 0.08 2.13 2014-15 1.04 1.41 0.26 0.11 2.82 2019-20 1.61 1.75 0.27 0.16 3.79 2024-25 2.50 2.19 0.28 0.23 5.2
In addition to the bridges, ferries also play an important role in providing trans-river connectivity in the city and while construction of bridges has large scale cost implication, improving the quality of service delivered by the ferry system Improving the existing ferry system and integrating it with other public modes and also establishing ferry routes along the river will help in reducing the dependency on private vehicles and hence reduce congestion on the trans-river bridges.
COMPREHENSIVE MOBILITY PLAN FOR KMA 90 RECOMMENDATIONS
CHAPTER 13
RECOMMENDATIONS
13.1 INTRODUCTION
The strength of KMA is that it has a strong ‘public transport travel culture’. People of all economic classes
prefer to use public transport more than private vehicles. This is reiterated from the fact that 80 per cent of
the total passenger volume uses public transport for commuting. This culture needs to be promoted further
by improvising this mode of travel by providing better infrastructure and services in terms of frequency. Also,
a better inter modal integration is desired to facilitate travel with higher level and comfort of accessibility and
this is the goal of this Comprehensive Mobility Plan – 90 per cent of the total passenger volume would use
public transport by the year 2025. This goal is also in accordance with the objective of the Comprehensive
Mobility Plan that the transportation network of Kolkata would have minimal environmental impact.
Since transportation is the most important urban facility for the KMA and its hinterland, immediate redressal
of the transportation issues are critical to improving the productivity of the city. During the past several
decades, there have been some investments in development of transportation network for the different
modes1. However, these were mostly addressed to individual component development without considering
the mobility of the city as one single issue.
To meet the future demand (2025: 27 million per day), there is a need to establish an integrated
transportation system for supporting the new growth such that all operational modes of transportation
function in a complementary manner. The goal for increasing mobility in the Kolkata Metropolitan Area (KMA)
is “to develop a balanced, integrated and multi-modal transportation system which provides equity,
accessibility and mobility to all users, thereby serving the existing and future needs of the KMA in a
sustainable manner”, yielding the greatest good, not only from a transportation standpoint but also for
the overall quality of life for the users and residents.
1 Source: Planning Commission of India, Tenth Five Year Plan 2002-07.
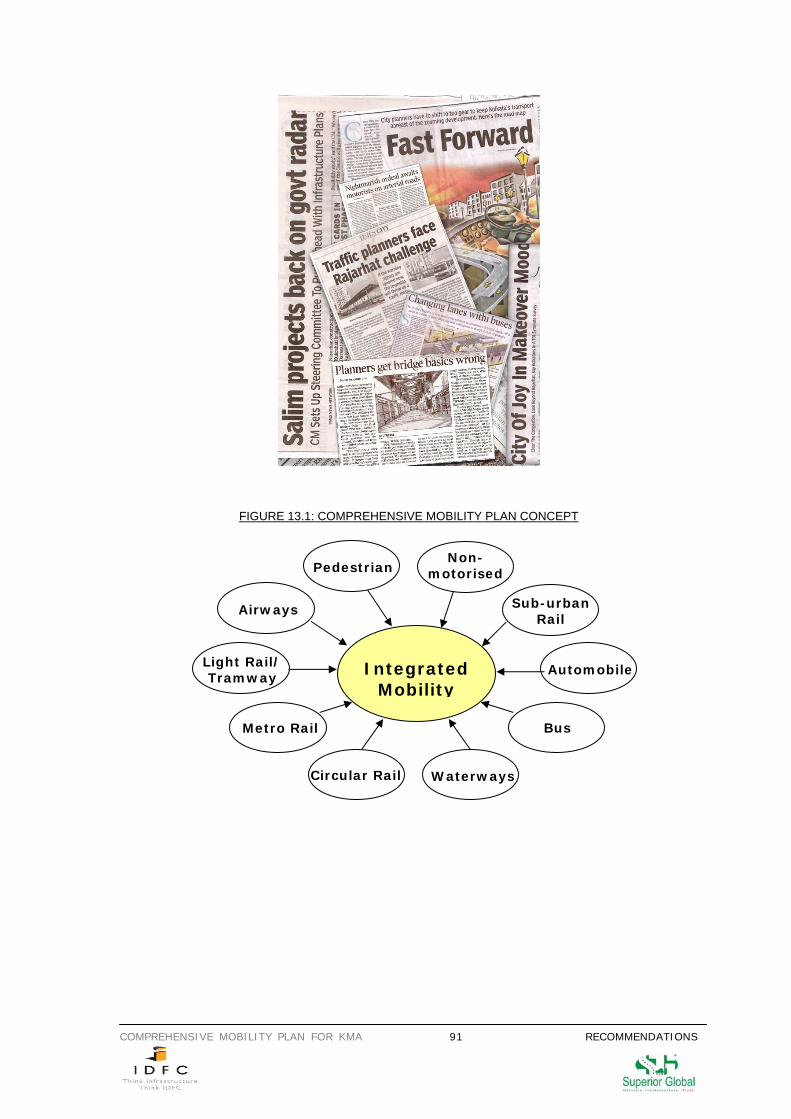
COMPREHENSIVE MOBILITY PLAN FOR KMA 91 RECOMMENDATIONS
FIGURE 13.1: COMPREHENSIVE MOBILITY PLAN CONCEPT
Pedestrian Non-
motorised
Airways
Light Rail/ Tramway
Metro Rail
Circular Rail
Integrated Mobility
Automobile
Waterways
Bus
Sub-urban Rail
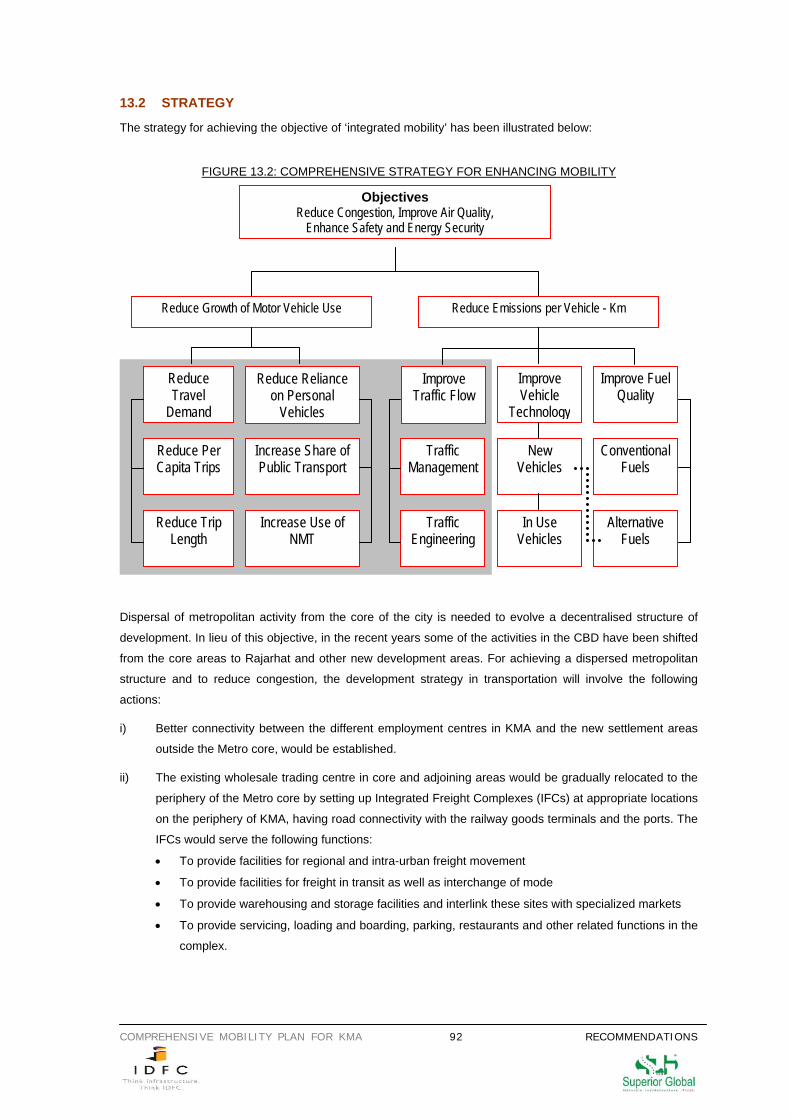
COMPREHENSIVE MOBILITY PLAN FOR KMA 92 RECOMMENDATIONS
13.2 STRATEGY
The strategy for achieving the objective of ‘integrated mobility’ has been illustrated below:
FIGURE 13.2: COMPREHENSIVE STRATEGY FOR ENHANCING MOBILITY
Dispersal of metropolitan activity from the core of the city is needed to evolve a decentralised structure of
development. In lieu of this objective, in the recent years some of the activities in the CBD have been shifted
from the core areas to Rajarhat and other new development areas. For achieving a dispersed metropolitan
structure and to reduce congestion, the development strategy in transportation will involve the following
actions:
i) Better connectivity between the different employment centres in KMA and the new settlement areas
outside the Metro core, would be established.
ii) The existing wholesale trading centre in core and adjoining areas would be gradually relocated to the
periphery of the Metro core by setting up Integrated Freight Complexes (IFCs) at appropriate locations
on the periphery of KMA, having road connectivity with the railway goods terminals and the ports. The
IFCs would serve the following functions:
• To provide facilities for regional and intra-urban freight movement
• To provide facilities for freight in transit as well as interchange of mode
• To provide warehousing and storage facilities and interlink these sites with specialized markets
• To provide servicing, loading and boarding, parking, restaurants and other related functions in the
complex.
Objectives Reduce Congestion, Improve Air Quality,
Enhance Safety and Energy Security
Reduce Emissions per Vehicle - Km Reduce Growth of Motor Vehicle Use
Improve Traffic Flow
Improve Vehicle
Technology
Improve Fuel Quality
Reduce Reliance on Personal
Vehicles
Reduce Travel
Demand
Reduce Per Capita Trips
Reduce Trip Length
Increase Share of Public Transport
Increase Use of NMT
Traffic Management
Traffic Engineering
New Vehicles
In Use Vehicles
Conventional Fuels
Alternative Fuels
COMPREHENSIVE MOBILITY PLAN FOR KMA 93 RECOMMENDATIONS
iii) The improvement of circulation and traffic operation in the core area, particularly in the CBD and other
key areas would be considered. The measures for improving the traffic and transit efficiency in such
areas shall include:
a) Decongesting the city core by effective utilisation of the by-passes and connecting roads
b) Traffic management strategies like restricting the movement of vehicular traffic in specific areas in
the CBD during specific hours of the day and banning the entry of cars in such areas, would be
considered to bring down the congestion level. This action would be supplemented with high
frequency transit services in the area and provision of parking facilities in the periphery of the
restricted zones. Higher parking fees on the existing parking facilities will discourage the vehicular
traffic.
PRIORITY TO PUBLIC TRANSIT
Whilst a majority of the passengers in the KMA use public transport, due to the poor service level and lack of
interlinking modes, people are left with no choice but to shift from public to private modes. The operations of
Mass Rapid Transit System (MRTS) would be improved for increased mobility, enhanced safety and reduced
congestion. This would be achieved through a number of measures such as:
i) The number of buses and minibuses would be increased, high capacity buses would be introduced
and the routes would be extended to cater to the peripheral areas also.
ii) The railway network would also be extended and the services intensified so that the areas within the
metropolis are served by the railway system.
iii) Freight and passenger movement would be segregated for ease and convenience. Regular
maintenance of such corridors would be given priority so that the journeys of passengers become
more comfortable and safe. To ensure fast movement of transit vehicles, on street parking along major
transit corridors would be banned.(refer proposals of parking and road network)
iv) The existing transfer points between the different modes of passenger transport viz. road, rail and
water would be provided with passenger dispersal facilities such as parking areas for surface transit
vehicles, exclusive right of way for movement of passengers, proper channelization of vehicular traffic,
among others.
v) The existing ferry services would be strengthened by providing more number of vessels, improved
jetties and better dispersal facilities for passengers. The ferry services would be intensified at locations
along the desired trans-river passenger routes. Ferry services between Serampore – Barrackpore and
Chandannagar – Bhatpara are likely to have excessive growth of passengers in future years, therefore
the ferry services have to be augmented to meet the future increase in demand. Also, a number of
new ferry crossing points would be developed in KMA. (refer section bridges across river Hooghly)
vi) Efforts would be made to introduce integrated route structure of all the transit modes with particular
attention to provide feeder bus and tram routes to metro rail and suburban rail stations.
vii) The development of Light Rail Transit (LRT) by redeveloping the existing tram system and linking it
with the existing circular rail corridors would establish connectivity with new areas within the KMA and
would increase the mobility of the city.
COMPREHENSIVE MOBILITY PLAN FOR KMA 94 RECOMMENDATIONS
ENVIRONMENTAL CONSIDERATIONS AND FUEL AND ENERGY ASPECTS
For the development of the future transportation network, adequate attention would be given to prevent
environmental degradation. The areas within the metro core have high pollution levels. Inadequate
accessibility and poor service levels create environmental hazards. This would be minimized by developing
proper transportation linkages and promoting use of electric cars and ultra low sulphur diesel (ULSD) for
reducing oil consumption and reducing environmental pollution.
NON-MOTORIZED TRAVEL (NMT)
The transportation system of KMA would be improved and made environment friendly by providing a system
of interconnected and safe bicycle tracks, pedestrian facilities and walkways. The overall strategy would be:
• To create an environment conducive to the use of bicycles by providing adequate facilities and to
develop these as attractive recreational opportunity also.
• To provide unimpeded and appropriately-designated pedestrian travel whenever feasible viz.
pedestrian crossings at intersections and activity centers.
13.3 RECOMMENDATIONS
The Comprehensive Mobility Plan envisages the following attributes for the transportation system of the
KMA:
• A balanced, integrated and multi-modal transportation system, which provides equity, accessibility and
mobility to all users thus serving the existing and future needs of the KMA.
• An environmentally sensitive transportation system that supports existing and future patterns of land
development enhances the quality of life in the KMA.
• A transportation system that stimulates economic development, and establishes a spirit of commitment
to interagency coordination.
13.3.1 ENHANCE MOBILITY – INTEGRATING ALL MODES OF TRANSPORT
The Plan aims at providing seamless transfer of passengers across different modes of travel. It is therefore,
proposed that the different modes operating in Kolkata function in unison. To increase the efficiency of the
transportation system, time-bound synchronisation between different modes of travel would be planned such
that the more and more people are lured into using public transport and the journey from the place of origin
to the destination becomes one single trip rather a number of successive trips. The coordination between the
transportation modes should also be complemented by availability of multiple affordable travel options at
each interchange.
At the operational level, the different modes would be integrated by
o Point of Interchange – The ‘Point of Interchange’ across all transportation modes would be
designated in the city. Each point would have multiple choices of public transit modes for the
commuter to access.
COMPREHENSIVE MOBILITY PLAN FOR KMA 95 RECOMMENDATIONS
o The mobility in KMA would be enhanced by having Transit Oriented Development (TOD) around
‘Points of Interchange’ of the mass transit modes, i.e. higher density mixed–use around transport
nodes which would result in reduced time to travel, increase in usage and cost-efficiency of public
transport. The resultant high density areas shall have access to adequate Fire and Emergency
Services2 which would prove effective for fire prevention, fire fighting and safe evacuation measures
to life and property.
o Synchronizing Operational Timing – In order to provide the commuter with ‘a single travel
experience’, the timing of each mode would be synchronized at the point of interchange. This would
also facilitate effective passenger dispersal at the transportation nodes.
o Higher Frequency Schedule at Peak Hours - The frequency of the public transit modes would be
higher during the peak hours.
o Allocating movement corridors for each mode according to the traffic volume on the different routes – Routes would be categorized according to their congestion level depending on
the Volume Capacity Ratio (V/C) of each route. The modes of public transport operating on each
route would be according to the volume of traffic on each route and the need for congestion
mitigation. This would also ensure that each mode is optimally utilized and its operations are
financially sustainable.
The CMP proposes to enhance and expand economic opportunity through out the entire metropolitan
area by the proposed projects which are in conjunction with the ongoing and proposed commercial and
residential developments.
13.3.2 MASS TRANSIT BY METRO, SUBURBAN RAIL, CIRCULAR RAIL, LIGHT RAIL TRANSIT (LRT)/ TRAMS, BUS SERVICE, INTRA PARA TRANSIT MODES (IPT) AND FERRIES
o Extension of proposed East West metro corridor from Howrah to Dankuni via Santragachi and
Salt Lake to Barasat via Airport using two alignments one through the VIP Road and one
through Rajarhaat
o Extension of North South metro corridor from Tollygunj to Thakurpukur
o Study should be carried out to link the airport with the East -West corridor.
o All new metro stations should be designed to handle 8 to 10 coaches of metro train.
o Establishing missing links of suburban rail and route rationalization
o Circular Rail - establishing the missing links
o Tram– new north-south elevated corridor(refer map “Proposed LRT Corridors of KMA”), LRT
system within Rajarhaat
o Trams – upgrading the existing level of service,
o School Special Trams: These would be operated to provide safe and environment friendly
mode of travel and reduce the traffic congestion during the peak hours.
2 The Standing Fire Advisory Council of Government of India has laid down the norms pertaining to response time of 3 minutes in urban areas and 20 minutes in rural areas for Fire and Emergency Services.
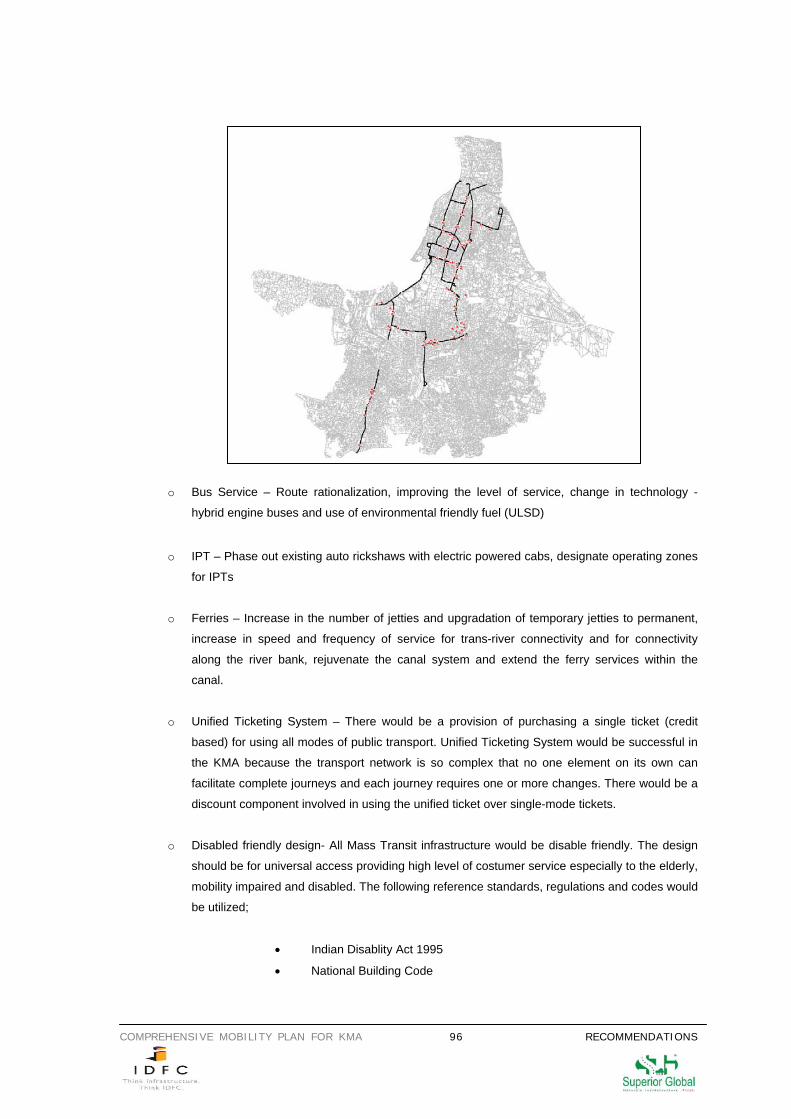
COMPREHENSIVE MOBILITY PLAN FOR KMA 96 RECOMMENDATIONS
o Bus Service – Route rationalization, improving the level of service, change in technology -
hybrid engine buses and use of environmental friendly fuel (ULSD)
o IPT – Phase out existing auto rickshaws with electric powered cabs, designate operating zones
for IPTs
o Ferries – Increase in the number of jetties and upgradation of temporary jetties to permanent,
increase in speed and frequency of service for trans-river connectivity and for connectivity
along the river bank, rejuvenate the canal system and extend the ferry services within the
canal.
o Unified Ticketing System – There would be a provision of purchasing a single ticket (credit
based) for using all modes of public transport. Unified Ticketing System would be successful in
the KMA because the transport network is so complex that no one element on its own can
facilitate complete journeys and each journey requires one or more changes. There would be a
discount component involved in using the unified ticket over single-mode tickets.
o Disabled friendly design- All Mass Transit infrastructure would be disable friendly. The design
should be for universal access providing high level of costumer service especially to the elderly,
mobility impaired and disabled. The following reference standards, regulations and codes would
be utilized;
• Indian Disablity Act 1995
• National Building Code
SCHOOL SPECIAL TRAM ROUTE IN KMA
COMPREHENSIVE MOBILITY PLAN FOR KMA 97 RECOMMENDATIONS
• Guidelines and space standards for barrier free built environment for
disabled and elderly persons – 1998, C.P.W.D., Ministry of Urban Affairs
and Employment, India
• American for Disabilities Act (ADA)
• ADA Accessibility Guidelines for Buildings and Facilities(ADAAG), 1998
• International Building Code
13.3.3 ROAD NETWORK
The Plan envisages facilitating faster and convenient movement of people and goods and not vehicles. The
recommendations of this Plan aim at promoting mass transit modes of movement which would move the
larger mass of commuters and simultaneously limit the increase of traffic volume on the roads. Trade and
commerce based activities are the lifeline of Kolkata’s economy and these depend heavily on the freight
movement. The Plan facilitates freight movement by providing alternate routes of movement for freight
movement and segregating domestic and freight traffic to the extent possible. Freight movement would also
supported by various traffic management strategies for achieving more efficiency. The recommendations are
as follows:
o Construction of missing links of the outer ring road (bypass).
o Strengthening the east-west corridor (new arterial roads) (refer map “Proposed Arterial Maps of
KMA”).
o Facilitating traffic movement through construction of new flyovers, entry/exit ramps to access
the existing flyovers.
o Encourage car pooling.
o Loading and unloading from and to the market areas should be enforced during the night only.
13.3.4 ROAD IMPROVEMENT MEASURES, WITH EMPHASIS ON THE CORE CITY AREA
o Road widening and strengthening
o Traffic engineering measures at appropriate places
13.3.5 TRANSPORT INFRASTRUCTURE – BUS (INTER AND INTRA) AND FREIGHT TERMINALS
o Freight terminals would be located on the outskirts of the city near the highways and rail heads
with mass transit connectivity.
o Inter City Bus Terminals would be located in the outskirts of the KMA, preferably away from the
core city area and near the mass transit connectivity.
o Appropriate locations for bus terminals would be identified within the study area to overcome
the on-street parking menace.
o All bus terminals would have access to the mass transit, be facilitated with infrastructure like
information bureau, eateries, toilets, etc.
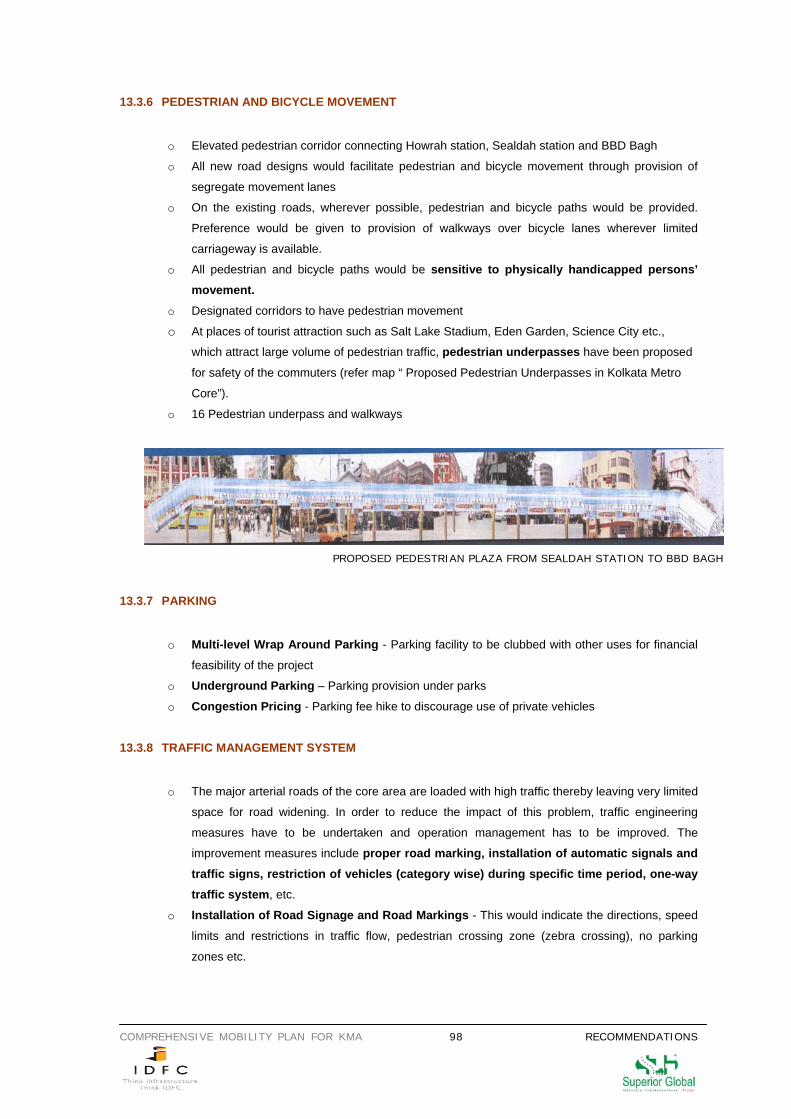
COMPREHENSIVE MOBILITY PLAN FOR KMA 98 RECOMMENDATIONS
13.3.6 PEDESTRIAN AND BICYCLE MOVEMENT
o Elevated pedestrian corridor connecting Howrah station, Sealdah station and BBD Bagh
o All new road designs would facilitate pedestrian and bicycle movement through provision of
segregate movement lanes
o On the existing roads, wherever possible, pedestrian and bicycle paths would be provided.
Preference would be given to provision of walkways over bicycle lanes wherever limited
carriageway is available.
o All pedestrian and bicycle paths would be sensitive to physically handicapped persons’ movement.
o Designated corridors to have pedestrian movement
o At places of tourist attraction such as Salt Lake Stadium, Eden Garden, Science City etc.,
which attract large volume of pedestrian traffic, pedestrian underpasses have been proposed
for safety of the commuters (refer map “ Proposed Pedestrian Underpasses in Kolkata Metro
Core”). o 16 Pedestrian underpass and walkways
13.3.7 PARKING
o Multi-level Wrap Around Parking - Parking facility to be clubbed with other uses for financial
feasibility of the project
o Underground Parking – Parking provision under parks
o Congestion Pricing - Parking fee hike to discourage use of private vehicles
13.3.8 TRAFFIC MANAGEMENT SYSTEM
o The major arterial roads of the core area are loaded with high traffic thereby leaving very limited
space for road widening. In order to reduce the impact of this problem, traffic engineering
measures have to be undertaken and operation management has to be improved. The
improvement measures include proper road marking, installation of automatic signals and traffic signs, restriction of vehicles (category wise) during specific time period, one-way traffic system, etc.
o Installation of Road Signage and Road Markings - This would indicate the directions, speed
limits and restrictions in traffic flow, pedestrian crossing zone (zebra crossing), no parking
zones etc.
PROPOSED PEDESTRIAN PLAZA FROM SEALDAH STATION TO BBD BAGH
COMPREHENSIVE MOBILITY PLAN FOR KMA 99 RECOMMENDATIONS
o Emphasizing tidal one-way system - This system is operational in Kolkata since 1984. Some
specific streets are one way from 0800 to 1400 hrs and in reverse way from 1400 to 2200 hrs.
After 2200 hrs, these streets become open for two-way traffic movement. This is considered as
a successful tool for traffic management but at places, many one way pairs are unbalanced in
terms of road width, for e.g. pairing of Park Street (wide) with Shakespeare Sarani (narrow)3.
There is a need to establish tidal one way flow system all over the KMA.
o Installation of pedestrian guard rails on footpaths and on medians at selected locations for the
restricting the pedestrian interferences to the vehicular traffic flow.
o Initiation of special street lights to highlight the inter-sections during night hours.
o Improvement of major intersections for proper turning, site distance and channelization of
traffic.
o Enforcement of stringent traffic measurement (restricting slow moving vehicles on arterial
roads and transit corridors) to ensure smooth flow of vehicular and pedestrians traffic.
o Introduction of ITS (Intelligent Transportation System), would ensure added information
and communication technology with proper transport infrastructure, thus increase over all
transport efficiency such as times factors, vehicle load, transportation times, safety,
improvement and fuel consumption.
o No Traffic Zones (Pedestrian Zones) – Delineate zones in the city were no vehicular traffic
would be allowed to enter.
13.3.9 CAPACITY BUILDING OF THE RESOURCE PERSONS AND INFORMATION DISSEMINATION
o Traffic Engineering and Management
o Introducing ‘ITS’ in Traffic and Transportation Management
o Signage and Street Furniture
o Green Technologies for Infrastructure Development
o Motor Training School
o Training for Traffic Police
o Driver Training
o Road User Education Campaigns and Programme
o Road User Education in Primary and Secondary Schools
13.3.10 PROPOSED TRANSPORTATION STUDIES
With 60 per cent of the total trips generated in the KMA covering less than 3 km. distance, people prefer to
walk or use bicycles for commuting. Thus, it is the social responsibility of the State to cater to the masses
and focus on facilitating pedestrian and bicycle movement and improvement of the mass transit systems.
Detailed studies for achieving this objective would be as follows:
o ‘TOD’ at major Inter Modal Transfer Points
3 Source: Urban Transportation Development in the Kolkata Metropolitan Area in India: Japan Bank for International Cooperation, 2007.
COMPREHENSIVE MOBILITY PLAN FOR KMA 100 RECOMMENDATIONS
o Feeder Transport Network for Mass Rapid Transit Systems (MRTS) with speed emphasis on
existing tram system at circular rail system including merger of both.
o Study on Signages and enforcement
o Study on ‘Integration of Mass Transit System with Howrah Station and Sealdah Station’
This study would be subsequent to renovating Howrah Station and its precincts for achieving a
World-Class Station4 distinction.
o Study on Identifying Vehicle–free Avenues on Weekends
A separate study to identify certain avenues in the KMA, that would be made traffic free
(motorized vehicle free) on weekends and be used for promoting as socio-cultural activities.
13.3.11 GOVERANANCE
Integration of all modes of transport at the governance level, as well as at the operational level, is critical to
the successful implementation of the CMP. The Plan recommends formation of an unified authority – KMA
Transportation Board, which would oversee the functions of all other existing authorities responsible for the
various transport modes. Systemic changes would be made in to ensure effective implementation of the CMP
and improve the delivery of well managed transportation services in the city. This is the single most pressing
reform essential to fertilize all others. A tiered conceptual model is suggested with the KMA Transport Board
at the apex, KMA Integrated Multi Modal Transport Authority at the second level followed by all other
transportation authorities.
The objective of the apex body would be to promote and secure the development of transport system of KMA
and provision of transport services according to plan. For this purpose, the apex body would have the power
to hold, manage and dispose off land and other fixed and movable assets and other property to carry out
building, engineering and other operations to provide or cause to provide, transport service, to execute works
in connection with development of transport facilities and supply of transport service and amenities, and
generally to do anything necessary or expedient for purposes of such development and for purposes
incidental thereto.
13.3.12 ENVIRONMENT
The plan emphasizes on the following:
• Promoting Non Polluting Modes of Transport and Fuel Efficient Vehicles
• Energy conservation
• Suatainability
Assessing and mitigating project related traffic impacts, is one of the most challenging issues facing public
agencies and the private sector. Gaining an understanding of the traffic impact assessment process is critical
to successfully manage land development and transportation projects. The CMP of Kolkata recommends
transportation proposals that would have minimal environmental impact. These proposals would be
sensitive to preserving the city’s natural resources like the river, the canal system and the natural drainage
4 Howrah station is one of the nineteen stations that have been selected for converting into World Class Stations by the Ministry of Railways.
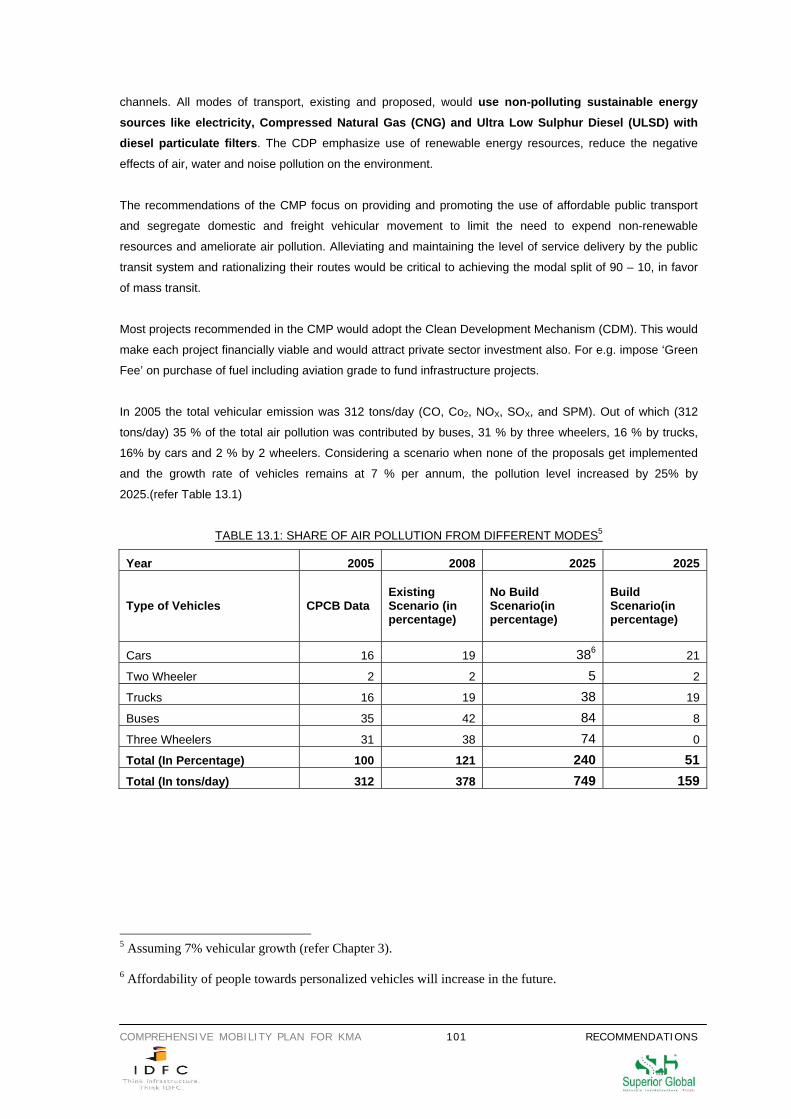
COMPREHENSIVE MOBILITY PLAN FOR KMA 101 RECOMMENDATIONS
channels. All modes of transport, existing and proposed, would use non-polluting sustainable energy sources like electricity, Compressed Natural Gas (CNG) and Ultra Low Sulphur Diesel (ULSD) with diesel particulate filters. The CDP emphasize use of renewable energy resources, reduce the negative
effects of air, water and noise pollution on the environment.
The recommendations of the CMP focus on providing and promoting the use of affordable public transport
and segregate domestic and freight vehicular movement to limit the need to expend non-renewable
resources and ameliorate air pollution. Alleviating and maintaining the level of service delivery by the public
transit system and rationalizing their routes would be critical to achieving the modal split of 90 – 10, in favor
of mass transit.
Most projects recommended in the CMP would adopt the Clean Development Mechanism (CDM). This would
make each project financially viable and would attract private sector investment also. For e.g. impose ‘Green
Fee’ on purchase of fuel including aviation grade to fund infrastructure projects.
In 2005 the total vehicular emission was 312 tons/day (CO, Co2, NOX, SOX, and SPM). Out of which (312
tons/day) 35 % of the total air pollution was contributed by buses, 31 % by three wheelers, 16 % by trucks,
16% by cars and 2 % by 2 wheelers. Considering a scenario when none of the proposals get implemented
and the growth rate of vehicles remains at 7 % per annum, the pollution level increased by 25% by
2025.(refer Table 13.1)
TABLE 13.1: SHARE OF AIR POLLUTION FROM DIFFERENT MODES5
Year 2005 2008 2025 2025
Type of Vehicles CPCB Data Existing Scenario (in percentage)
No Build Scenario(in percentage)
Build Scenario(in percentage)
Cars 16 19 386 21
Two Wheeler 2 2 5 2
Trucks 16 19 38 19
Buses 35 42 84 8
Three Wheelers 31 38 74 0
Total (In Percentage) 100 121 240 51Total (In tons/day) 312 378 749 159
5 Assuming 7% vehicular growth (refer Chapter 3). 6 Affordability of people towards personalized vehicles will increase in the future.
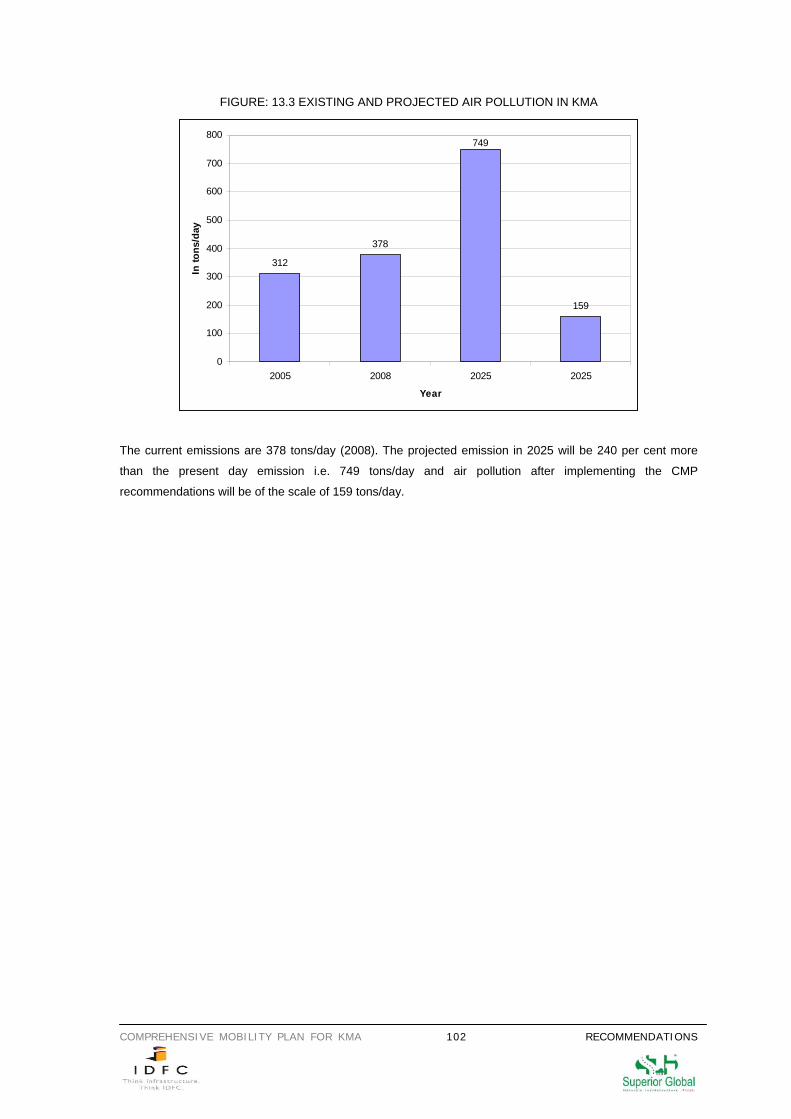
COMPREHENSIVE MOBILITY PLAN FOR KMA 102 RECOMMENDATIONS
FIGURE: 13.3 EXISTING AND PROJECTED AIR POLLUTION IN KMA
312
378
159
749
0
100
200
300
400
500
600
700
800
2005 2008 2025 2025
Year
In to
ns/d
ay
The current emissions are 378 tons/day (2008). The projected emission in 2025 will be 240 per cent more
than the present day emission i.e. 749 tons/day and air pollution after implementing the CMP
recommendations will be of the scale of 159 tons/day.
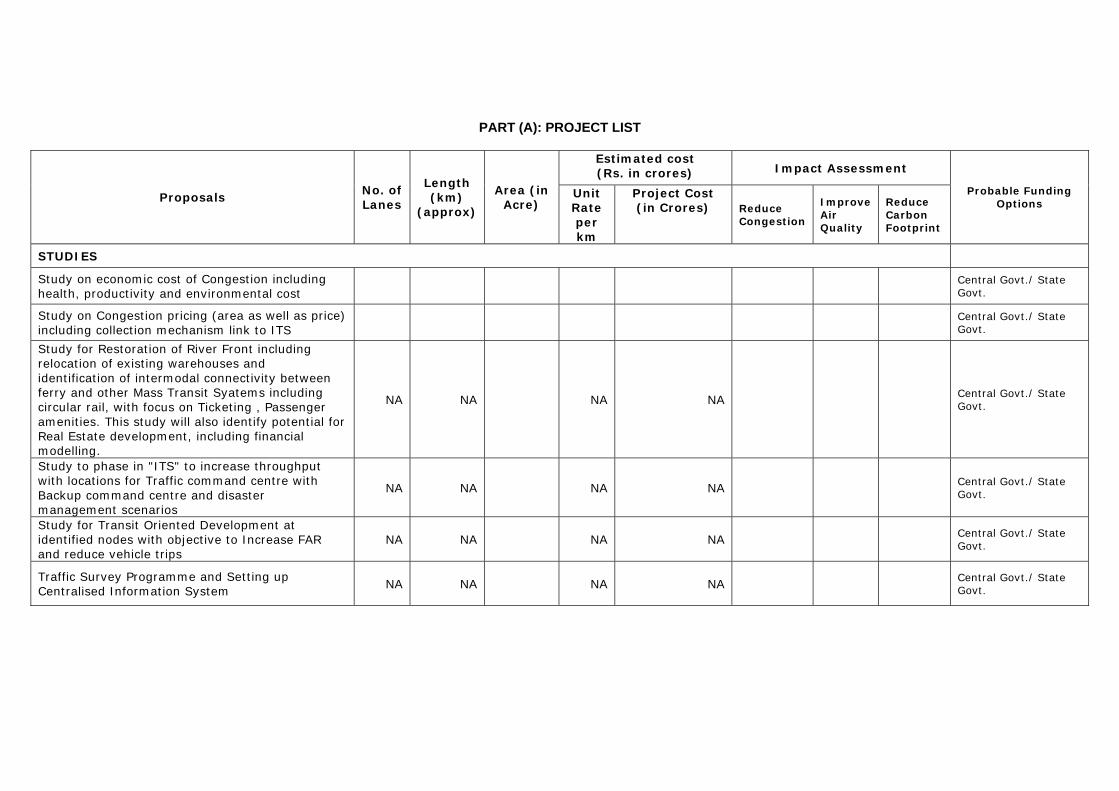
PART (A): PROJECT LIST
Estimated cost (Rs. in crores) Impact Assessment
Proposals No. of Lanes
Length (km)
(approx)
Area (in Acre)
Unit Rate per km
Project Cost (in Crores) Reduce
Congestion
Improve Air Quality
Reduce Carbon Footprint
Probable Funding Options
STUDIES Study on economic cost of Congestion including health, productivity and environmental cost
Central Govt./ State Govt.
Study on Congestion pricing (area as well as price) including collection mechanism link to ITS
Central Govt./ State Govt.
Study for Restoration of River Front including relocation of existing warehouses and identification of intermodal connectivity between ferry and other Mass Transit Syatems including circular rail, with focus on Ticketing , Passenger amenities. This study will also identify potential for Real Estate development, including financial modelling.
NA NA NA NA
Central Govt./ State Govt.
Study to phase in "ITS" to increase throughput with locations for Traffic command centre with Backup command centre and disaster management scenarios
NA NA NA NA
Central Govt./ State Govt.
Study for Transit Oriented Development at identified nodes with objective to Increase FAR and reduce vehicle trips
NA NA NA NA
Central Govt./ State Govt.
Traffic Survey Programme and Setting up Centralised Information System NA NA NA NA
Central Govt./ State Govt.
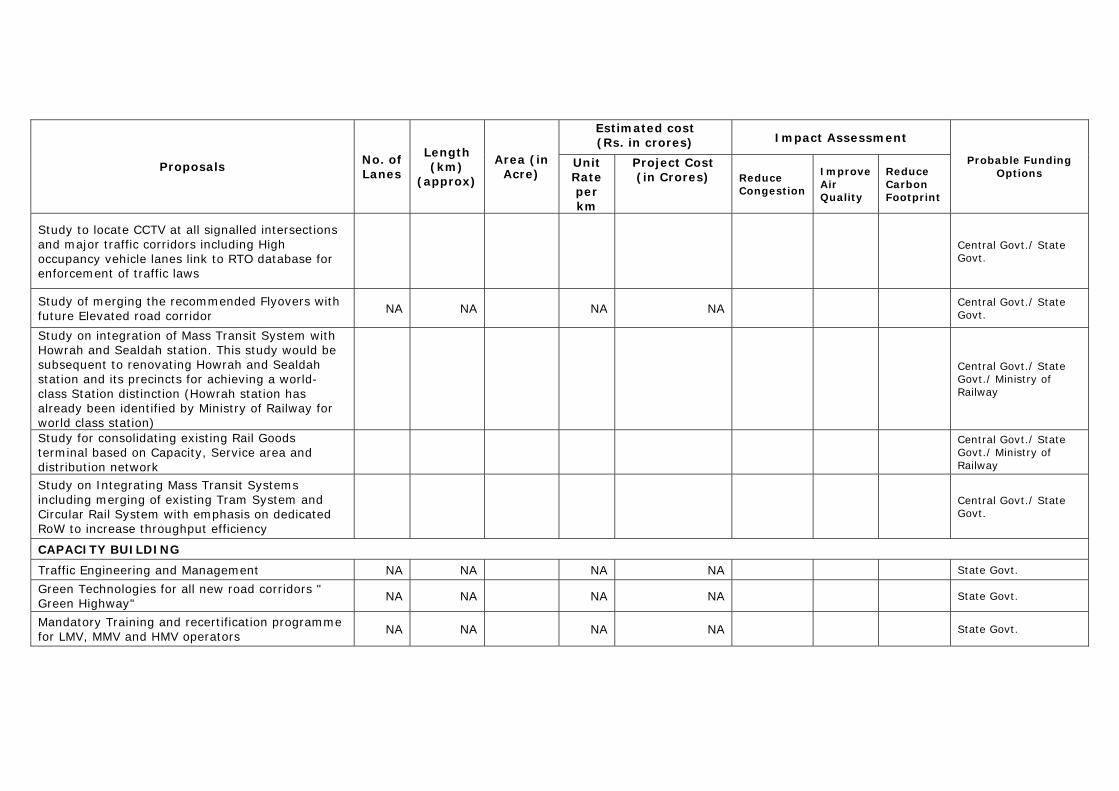
Estimated cost (Rs. in crores) Impact Assessment
Proposals No. of Lanes
Length (km)
(approx)
Area (in Acre)
Unit Rate per km
Project Cost (in Crores) Reduce
Congestion
Improve Air Quality
Reduce Carbon Footprint
Probable Funding Options
Study to locate CCTV at all signalled intersections and major traffic corridors including High occupancy vehicle lanes link to RTO database for enforcement of traffic laws
Central Govt./ State Govt.
Study of merging the recommended Flyovers with future Elevated road corridor
NA NA NA NA Central Govt./ State Govt.
Study on integration of Mass Transit System with Howrah and Sealdah station. This study would be subsequent to renovating Howrah and Sealdah station and its precincts for achieving a world-class Station distinction (Howrah station has already been identified by Ministry of Railway for world class station)
Central Govt./ State Govt./ Ministry of Railway
Study for consolidating existing Rail Goods terminal based on Capacity, Service area and distribution network
Central Govt./ State Govt./ Ministry of Railway
Study on Integrating Mass Transit Systems including merging of existing Tram System and Circular Rail System with emphasis on dedicated RoW to increase throughput efficiency
Central Govt./ State Govt.
CAPACITY BUILDING
Traffic Engineering and Management NA NA NA NA State Govt.
Green Technologies for all new road corridors " Green Highway" NA NA NA NA State Govt.
Mandatory Training and recertification programme for LMV, MMV and HMV operators
NA NA NA NA State Govt.
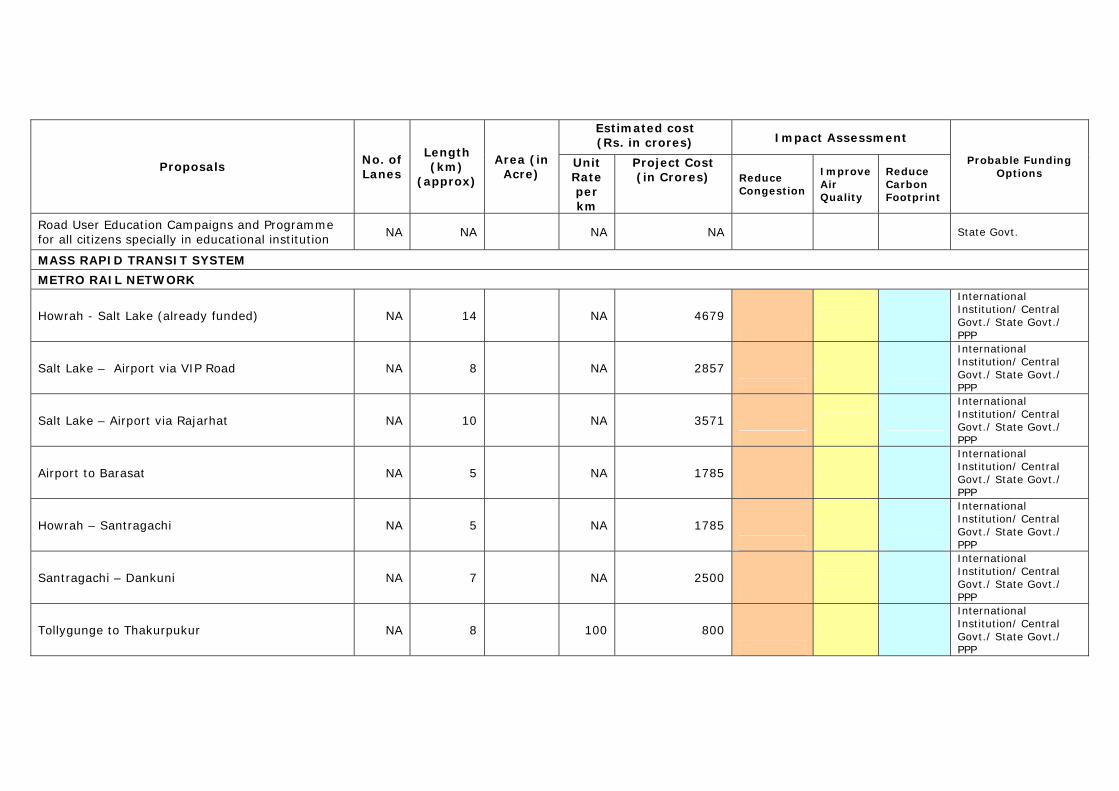
Estimated cost (Rs. in crores) Impact Assessment
Proposals No. of Lanes
Length (km)
(approx)
Area (in Acre)
Unit Rate per km
Project Cost (in Crores) Reduce
Congestion
Improve Air Quality
Reduce Carbon Footprint
Probable Funding Options
Road User Education Campaigns and Programme for all citizens specially in educational institution
NA NA NA NA State Govt.
MASS RAPID TRANSIT SYSTEM
METRO RAIL NETWORK
Howrah - Salt Lake (already funded) NA 14 NA 4679
International Institution/ Central Govt./ State Govt./ PPP
Salt Lake – Airport via VIP Road NA 8 NA 2857
International Institution/ Central Govt./ State Govt./ PPP
Salt Lake – Airport via Rajarhat NA 10 NA 3571
International Institution/ Central Govt./ State Govt./ PPP
Airport to Barasat NA 5 NA 1785
International Institution/ Central Govt./ State Govt./ PPP
Howrah – Santragachi NA 5 NA 1785
International Institution/ Central Govt./ State Govt./ PPP
Santragachi – Dankuni NA 7 NA 2500
International Institution/ Central Govt./ State Govt./ PPP
Tollygunge to Thakurpukur NA 8 100 800
International Institution/ Central Govt./ State Govt./ PPP
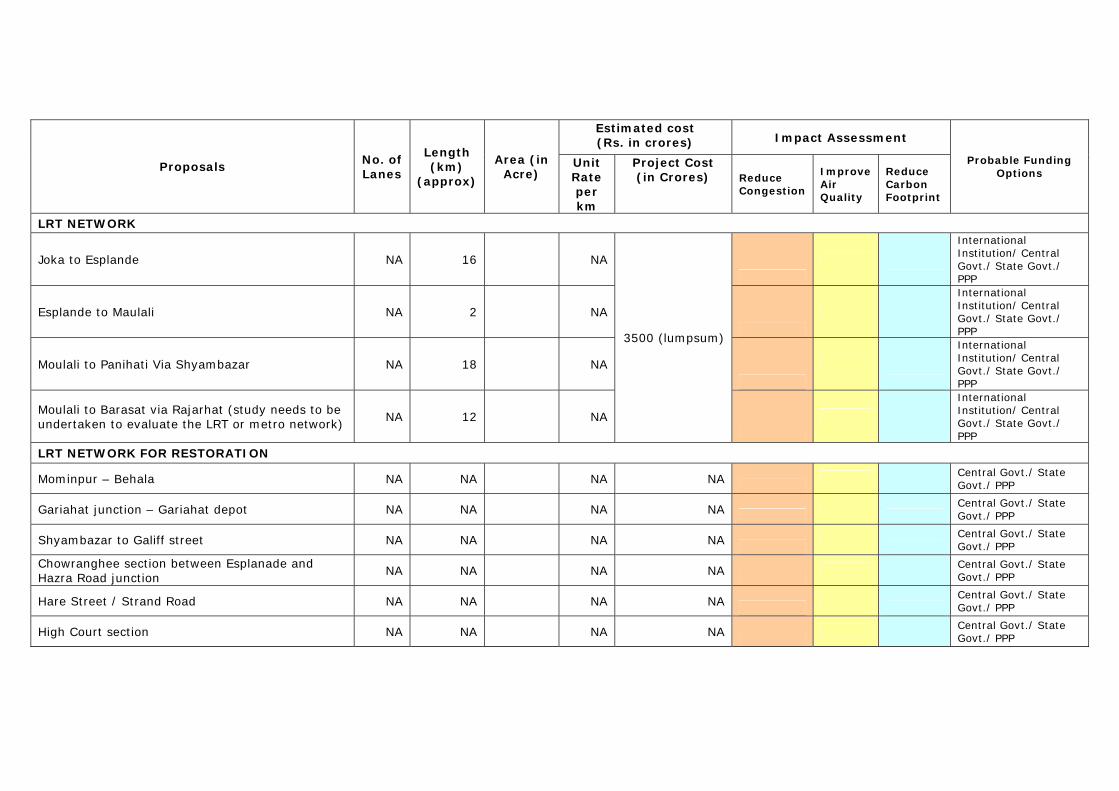
Estimated cost (Rs. in crores) Impact Assessment
Proposals No. of Lanes
Length (km)
(approx)
Area (in Acre)
Unit Rate per km
Project Cost (in Crores) Reduce
Congestion
Improve Air Quality
Reduce Carbon Footprint
Probable Funding Options
LRT NETWORK
Joka to Esplande NA 16 NA
International Institution/ Central Govt./ State Govt./ PPP
Esplande to Maulali NA 2 NA
International Institution/ Central Govt./ State Govt./ PPP
Moulali to Panihati Via Shyambazar NA 18 NA
International Institution/ Central Govt./ State Govt./ PPP
Moulali to Barasat via Rajarhat (study needs to be undertaken to evaluate the LRT or metro network)
NA 12 NA
3500 (lumpsum)
International Institution/ Central Govt./ State Govt./ PPP
LRT NETWORK FOR RESTORATION
Mominpur – Behala NA NA NA NA Central Govt./ State Govt./ PPP
Gariahat junction – Gariahat depot NA NA NA NA Central Govt./ State Govt./ PPP
Shyambazar to Galiff street NA NA NA NA Central Govt./ State Govt./ PPP
Chowranghee section between Esplanade and Hazra Road junction
NA NA NA NA Central Govt./ State Govt./ PPP
Hare Street / Strand Road NA NA NA NA Central Govt./ State Govt./ PPP
High Court section NA NA NA NA Central Govt./ State Govt./ PPP
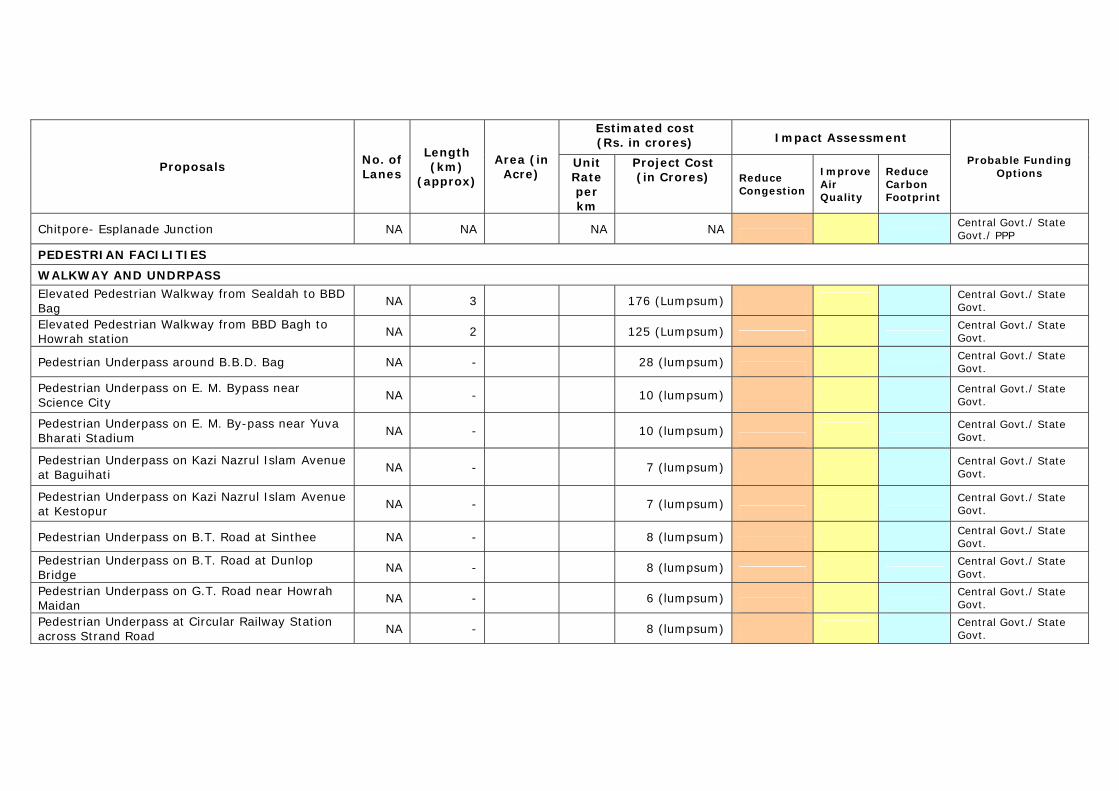
Estimated cost (Rs. in crores) Impact Assessment
Proposals No. of Lanes
Length (km)
(approx)
Area (in Acre)
Unit Rate per km
Project Cost (in Crores) Reduce
Congestion
Improve Air Quality
Reduce Carbon Footprint
Probable Funding Options
Chitpore- Esplanade Junction NA NA NA NA Central Govt./ State Govt./ PPP
PEDESTRIAN FACILITIES
WALKWAY AND UNDRPASS
Elevated Pedestrian Walkway from Sealdah to BBD Bag
NA 3 176 (Lumpsum) Central Govt./ State Govt.
Elevated Pedestrian Walkway from BBD Bagh to Howrah station
NA 2 125 (Lumpsum) Central Govt./ State Govt.
Pedestrian Underpass around B.B.D. Bag NA - 28 (lumpsum) Central Govt./ State Govt.
Pedestrian Underpass on E. M. Bypass near Science City
NA - 10 (lumpsum)
Central Govt./ State Govt.
Pedestrian Underpass on E. M. By-pass near Yuva Bharati Stadium NA - 10 (lumpsum)
Central Govt./ State Govt.
Pedestrian Underpass on Kazi Nazrul Islam Avenue at Baguihati
NA - 7 (lumpsum)
Central Govt./ State Govt.
Pedestrian Underpass on Kazi Nazrul Islam Avenue at Kestopur NA - 7 (lumpsum)
Central Govt./ State Govt.
Pedestrian Underpass on B.T. Road at Sinthee NA - 8 (lumpsum) Central Govt./ State Govt.
Pedestrian Underpass on B.T. Road at Dunlop Bridge
NA - 8 (lumpsum) Central Govt./ State Govt.
Pedestrian Underpass on G.T. Road near Howrah Maidan
NA - 6 (lumpsum) Central Govt./ State Govt.
Pedestrian Underpass at Circular Railway Station across Strand Road
NA - 8 (lumpsum) Central Govt./ State Govt.
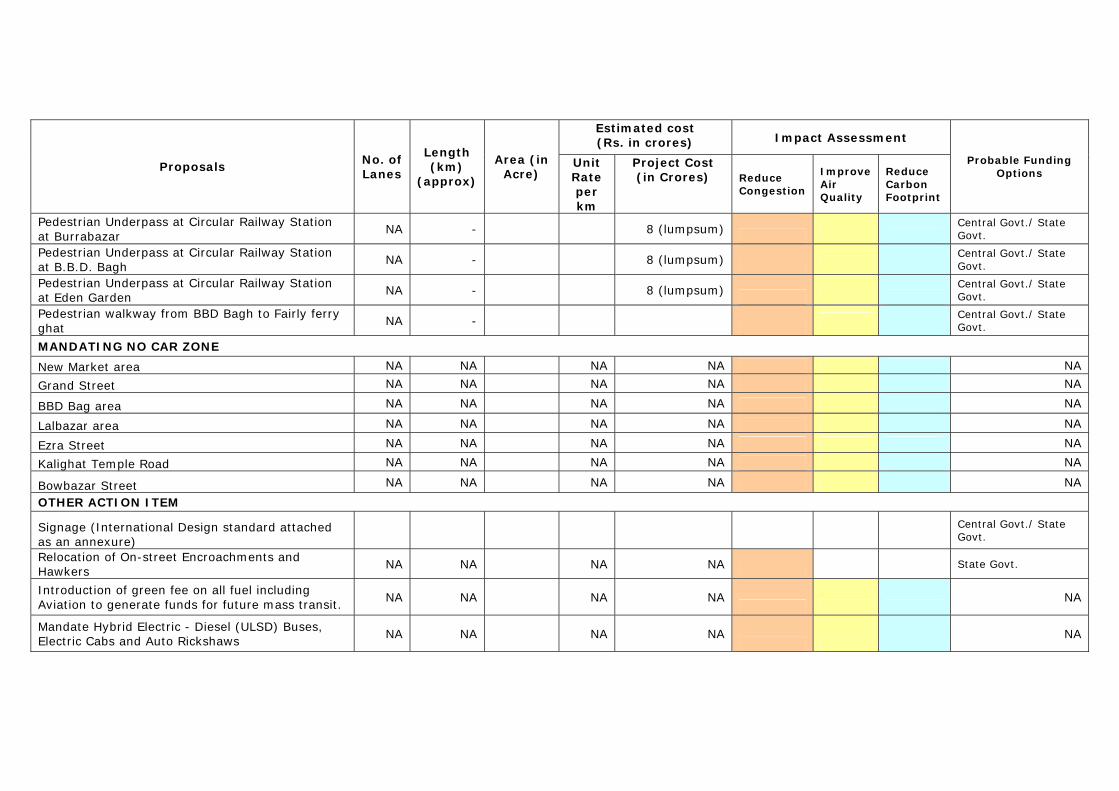
Estimated cost (Rs. in crores) Impact Assessment
Proposals No. of Lanes
Length (km)
(approx)
Area (in Acre)
Unit Rate per km
Project Cost (in Crores) Reduce
Congestion
Improve Air Quality
Reduce Carbon Footprint
Probable Funding Options
Pedestrian Underpass at Circular Railway Station at Burrabazar
NA - 8 (lumpsum) Central Govt./ State Govt.
Pedestrian Underpass at Circular Railway Station at B.B.D. Bagh
NA - 8 (lumpsum) Central Govt./ State Govt.
Pedestrian Underpass at Circular Railway Station at Eden Garden
NA - 8 (lumpsum) Central Govt./ State Govt.
Pedestrian walkway from BBD Bagh to Fairly ferry ghat
NA - Central Govt./ State Govt.
MANDATING NO CAR ZONE
New Market area NA NA NA NA NA
Grand Street NA NA NA NA NA
BBD Bag area NA NA NA NA NA
Lalbazar area NA NA NA NA NA
Ezra Street NA NA NA NA NA
Kalighat Temple Road NA NA NA NA NA
Bowbazar Street NA NA NA NA NA
OTHER ACTION ITEM
Signage (International Design standard attached as an annexure)
Central Govt./ State Govt.
Relocation of On-street Encroachments and Hawkers
NA NA NA NA State Govt.
Introduction of green fee on all fuel including Aviation to generate funds for future mass transit.
NA NA NA NA
NA
Mandate Hybrid Electric - Diesel (ULSD) Buses, Electric Cabs and Auto Rickshaws NA NA NA NA
NA
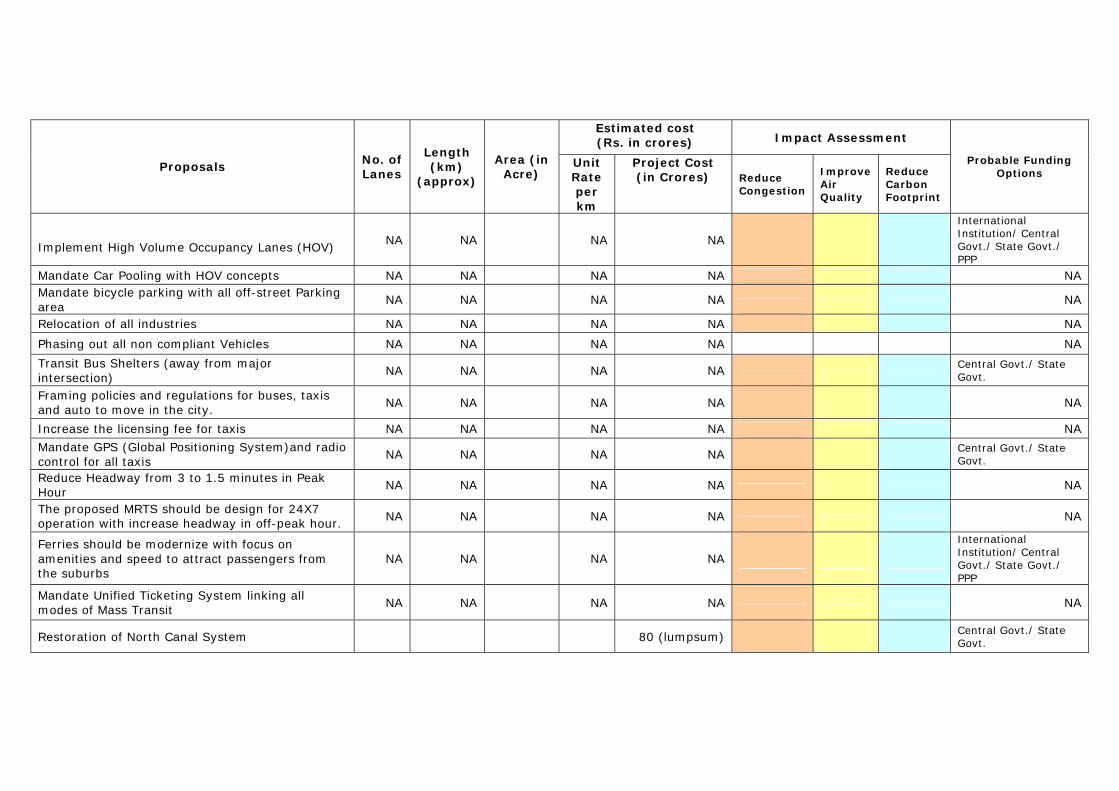
Estimated cost (Rs. in crores) Impact Assessment
Proposals No. of Lanes
Length (km)
(approx)
Area (in Acre)
Unit Rate per km
Project Cost (in Crores) Reduce
Congestion
Improve Air Quality
Reduce Carbon Footprint
Probable Funding Options
Implement High Volume Occupancy Lanes (HOV)
NA NA NA NA
International Institution/ Central Govt./ State Govt./ PPP
Mandate Car Pooling with HOV concepts NA NA NA NA NA Mandate bicycle parking with all off-street Parking area
NA NA NA NA NA
Relocation of all industries NA NA NA NA NA
Phasing out all non compliant Vehicles NA NA NA NA NA
Transit Bus Shelters (away from major intersection)
NA NA NA NA Central Govt./ State Govt.
Framing policies and regulations for buses, taxis and auto to move in the city. NA NA NA NA NA
Increase the licensing fee for taxis NA NA NA NA NA
Mandate GPS (Global Positioning System)and radio control for all taxis
NA NA NA NA Central Govt./ State Govt.
Reduce Headway from 3 to 1.5 minutes in Peak Hour
NA NA NA NA NA
The proposed MRTS should be design for 24X7 operation with increase headway in off-peak hour. NA NA NA NA NA
Ferries should be modernize with focus on amenities and speed to attract passengers from the suburbs
NA NA NA NA
International Institution/ Central Govt./ State Govt./ PPP
Mandate Unified Ticketing System linking all modes of Mass Transit NA NA NA NA
NA
Restoration of North Canal System 80 (lumpsum) Central Govt./ State Govt.
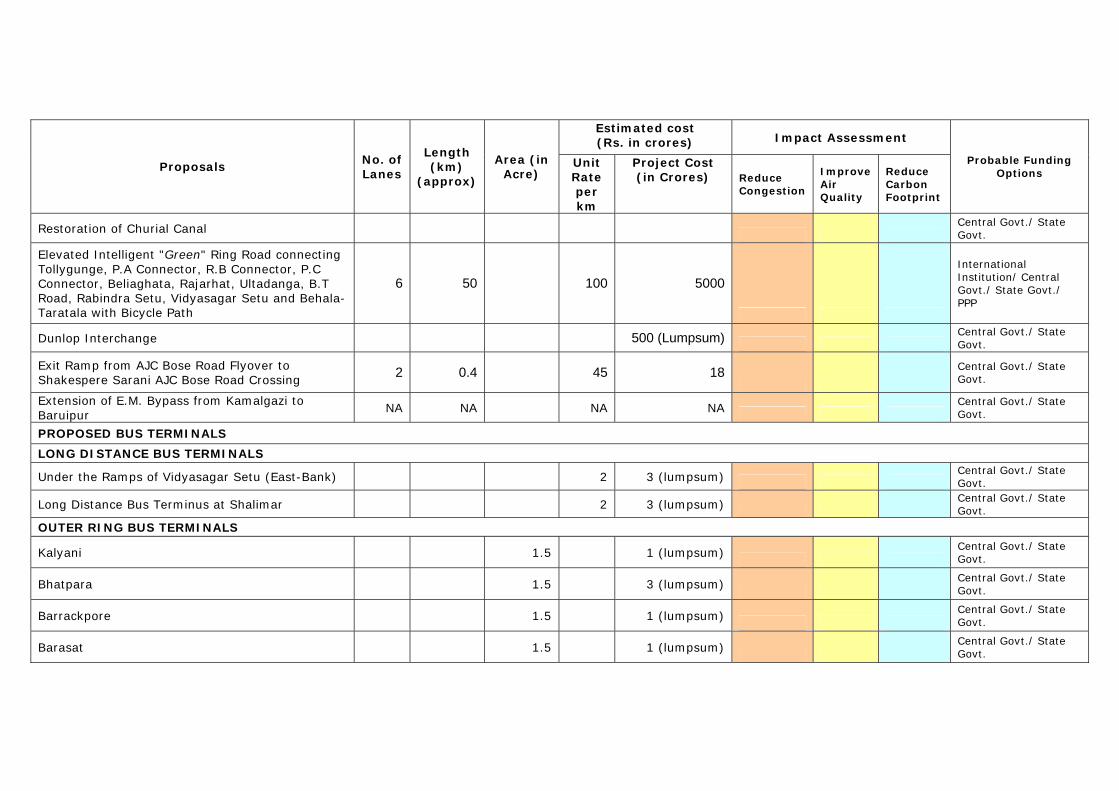
Estimated cost (Rs. in crores) Impact Assessment
Proposals No. of Lanes
Length (km)
(approx)
Area (in Acre)
Unit Rate per km
Project Cost (in Crores) Reduce
Congestion
Improve Air Quality
Reduce Carbon Footprint
Probable Funding Options
Restoration of Churial Canal Central Govt./ State Govt.
Elevated Intelligent "Green" Ring Road connecting Tollygunge, P.A Connector, R.B Connector, P.C Connector, Beliaghata, Rajarhat, Ultadanga, B.T Road, Rabindra Setu, Vidyasagar Setu and Behala-Taratala with Bicycle Path
6 50 100 5000
International Institution/ Central Govt./ State Govt./ PPP
Dunlop Interchange 500 (Lumpsum) Central Govt./ State Govt.
Exit Ramp from AJC Bose Road Flyover to Shakespere Sarani AJC Bose Road Crossing
2 0.4 45 18
Central Govt./ State Govt.
Extension of E.M. Bypass from Kamalgazi to Baruipur
NA NA NA NA Central Govt./ State Govt.
PROPOSED BUS TERMINALS
LONG DISTANCE BUS TERMINALS
Under the Ramps of Vidyasagar Setu (East-Bank) 2 3 (lumpsum) Central Govt./ State Govt.
Long Distance Bus Terminus at Shalimar 2 3 (lumpsum) Central Govt./ State Govt.
OUTER RING BUS TERMINALS
Kalyani 1.5 1 (lumpsum) Central Govt./ State Govt.
Bhatpara 1.5 3 (lumpsum) Central Govt./ State Govt.
Barrackpore 1.5 1 (lumpsum) Central Govt./ State Govt.
Barasat 1.5 1 (lumpsum) Central Govt./ State Govt.
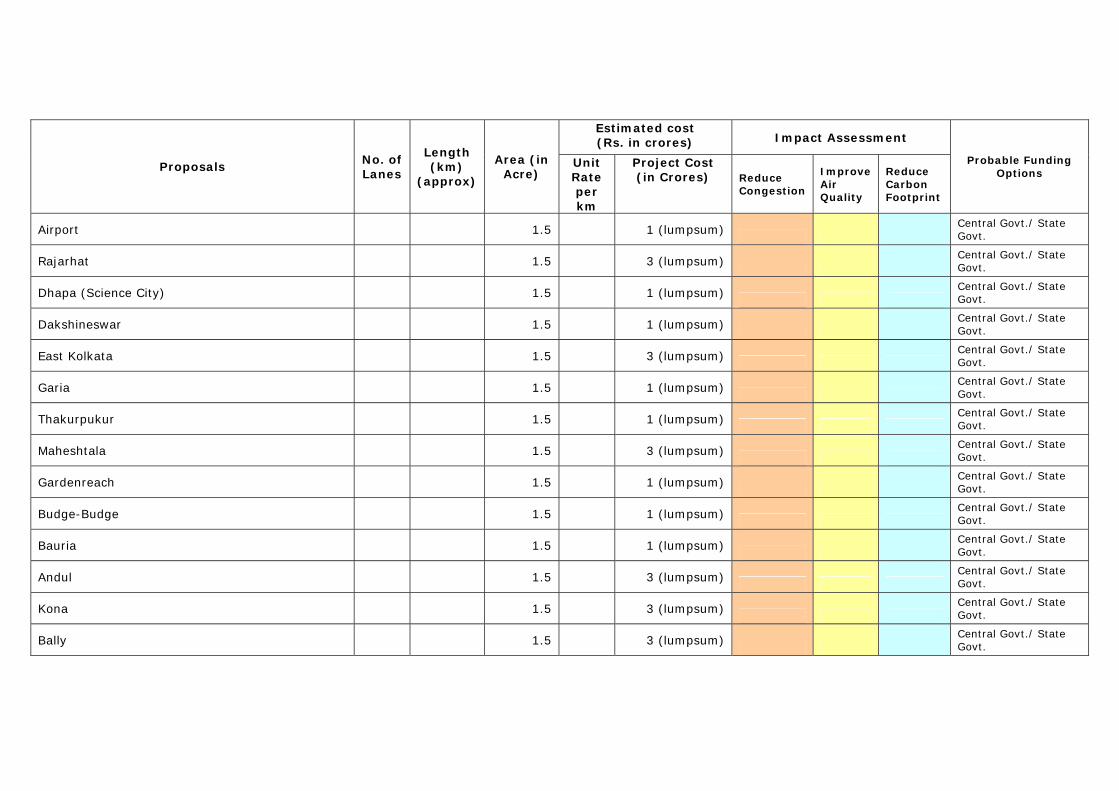
Estimated cost (Rs. in crores) Impact Assessment
Proposals No. of Lanes
Length (km)
(approx)
Area (in Acre)
Unit Rate per km
Project Cost (in Crores) Reduce
Congestion
Improve Air Quality
Reduce Carbon Footprint
Probable Funding Options
Airport 1.5 1 (lumpsum) Central Govt./ State Govt.
Rajarhat 1.5 3 (lumpsum) Central Govt./ State Govt.
Dhapa (Science City) 1.5 1 (lumpsum) Central Govt./ State Govt.
Dakshineswar 1.5 1 (lumpsum) Central Govt./ State Govt.
East Kolkata 1.5 3 (lumpsum) Central Govt./ State Govt.
Garia 1.5 1 (lumpsum) Central Govt./ State Govt.
Thakurpukur 1.5 1 (lumpsum) Central Govt./ State Govt.
Maheshtala 1.5 3 (lumpsum) Central Govt./ State Govt.
Gardenreach 1.5 1 (lumpsum) Central Govt./ State Govt.
Budge-Budge 1.5 1 (lumpsum) Central Govt./ State Govt.
Bauria 1.5 1 (lumpsum) Central Govt./ State Govt.
Andul 1.5 3 (lumpsum) Central Govt./ State Govt.
Kona 1.5 3 (lumpsum) Central Govt./ State Govt.
Bally 1.5 3 (lumpsum) Central Govt./ State Govt.
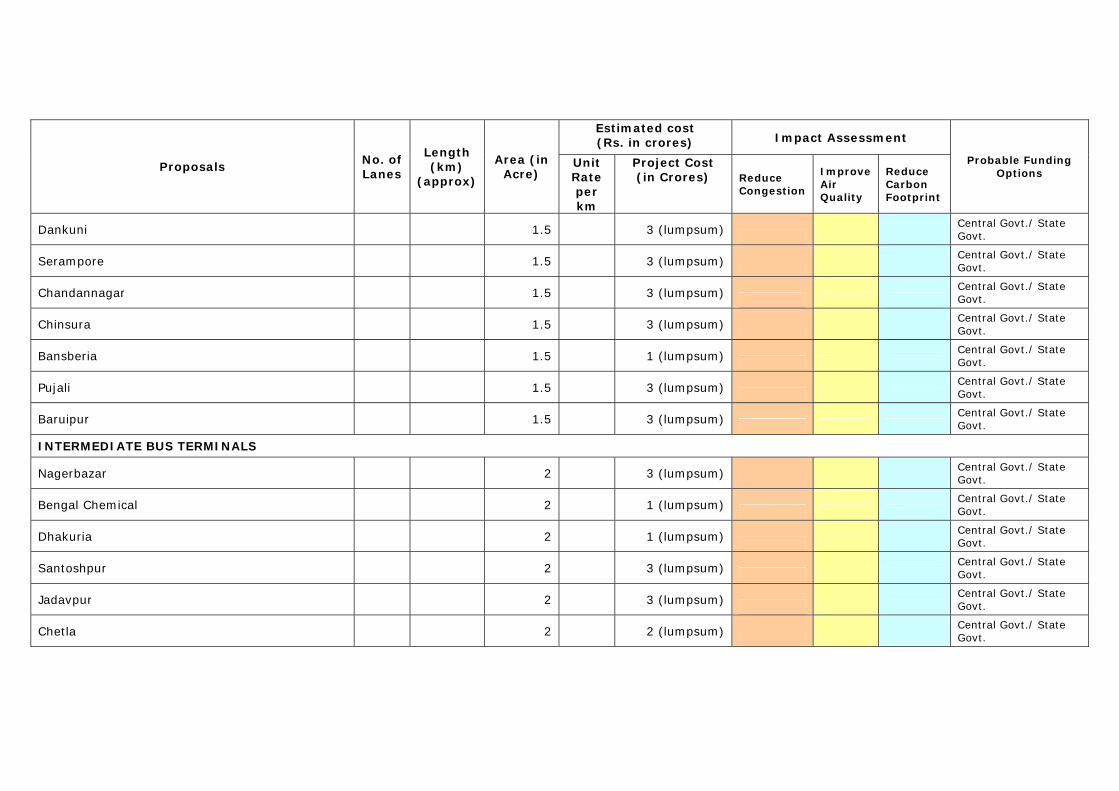
Estimated cost (Rs. in crores) Impact Assessment
Proposals No. of Lanes
Length (km)
(approx)
Area (in Acre)
Unit Rate per km
Project Cost (in Crores) Reduce
Congestion
Improve Air Quality
Reduce Carbon Footprint
Probable Funding Options
Dankuni 1.5 3 (lumpsum) Central Govt./ State Govt.
Serampore 1.5 3 (lumpsum) Central Govt./ State Govt.
Chandannagar 1.5 3 (lumpsum) Central Govt./ State Govt.
Chinsura 1.5 3 (lumpsum) Central Govt./ State Govt.
Bansberia 1.5 1 (lumpsum) Central Govt./ State Govt.
Pujali 1.5 3 (lumpsum) Central Govt./ State Govt.
Baruipur 1.5 3 (lumpsum) Central Govt./ State Govt.
INTERMEDIATE BUS TERMINALS
Nagerbazar 2 3 (lumpsum) Central Govt./ State Govt.
Bengal Chemical 2 1 (lumpsum) Central Govt./ State Govt.
Dhakuria 2 1 (lumpsum) Central Govt./ State Govt.
Santoshpur 2 3 (lumpsum) Central Govt./ State Govt.
Jadavpur 2 3 (lumpsum) Central Govt./ State Govt.
Chetla 2 2 (lumpsum) Central Govt./ State Govt.
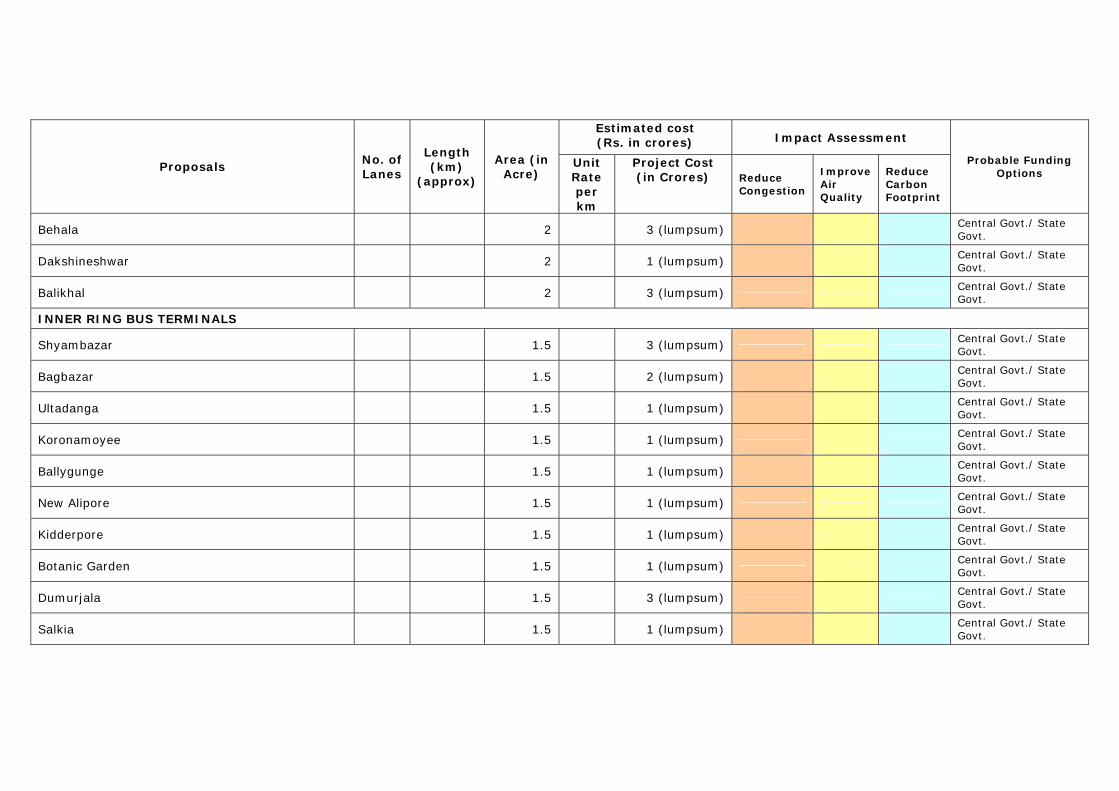
Estimated cost (Rs. in crores) Impact Assessment
Proposals No. of Lanes
Length (km)
(approx)
Area (in Acre)
Unit Rate per km
Project Cost (in Crores) Reduce
Congestion
Improve Air Quality
Reduce Carbon Footprint
Probable Funding Options
Behala 2 3 (lumpsum) Central Govt./ State Govt.
Dakshineshwar 2 1 (lumpsum) Central Govt./ State Govt.
Balikhal 2 3 (lumpsum) Central Govt./ State Govt.
INNER RING BUS TERMINALS
Shyambazar 1.5 3 (lumpsum) Central Govt./ State Govt.
Bagbazar 1.5 2 (lumpsum) Central Govt./ State Govt.
Ultadanga 1.5 1 (lumpsum) Central Govt./ State Govt.
Koronamoyee 1.5 1 (lumpsum) Central Govt./ State Govt.
Ballygunge 1.5 1 (lumpsum) Central Govt./ State Govt.
New Alipore 1.5 1 (lumpsum) Central Govt./ State Govt.
Kidderpore 1.5 1 (lumpsum) Central Govt./ State Govt.
Botanic Garden 1.5 1 (lumpsum) Central Govt./ State Govt.
Dumurjala 1.5 3 (lumpsum) Central Govt./ State Govt.
Salkia 1.5 1 (lumpsum) Central Govt./ State Govt.
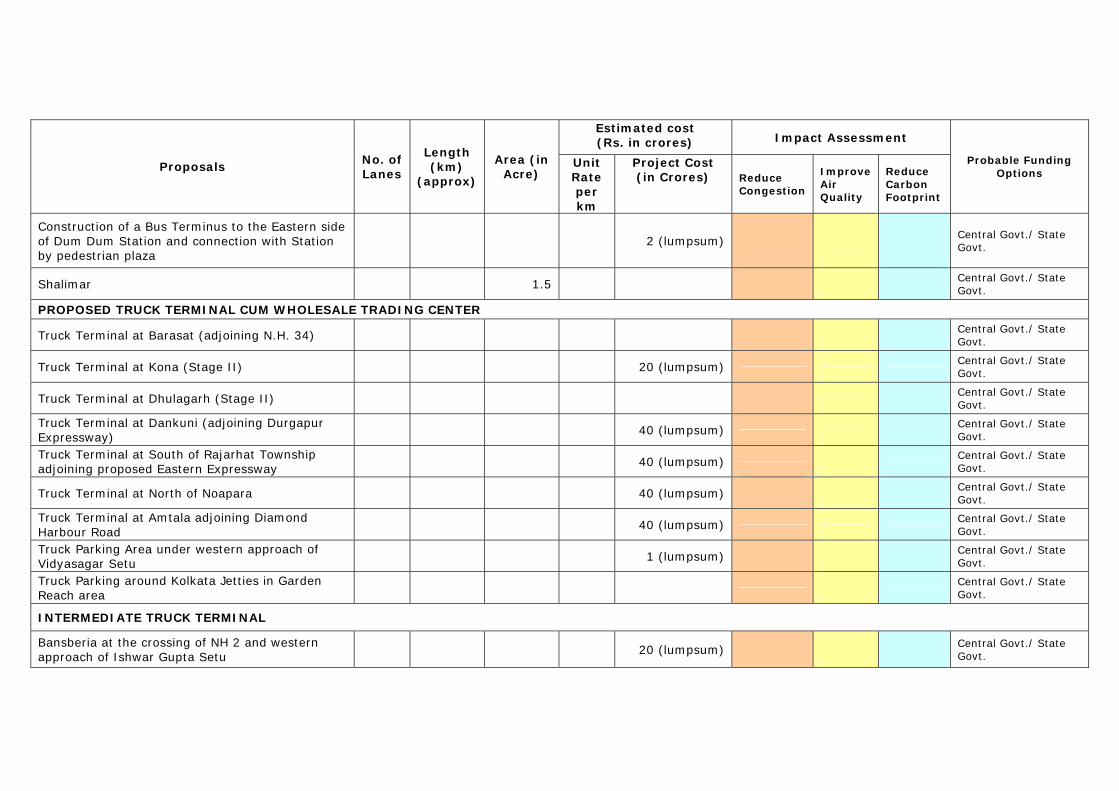
Estimated cost (Rs. in crores) Impact Assessment
Proposals No. of Lanes
Length (km)
(approx)
Area (in Acre)
Unit Rate per km
Project Cost (in Crores) Reduce
Congestion
Improve Air Quality
Reduce Carbon Footprint
Probable Funding Options
Construction of a Bus Terminus to the Eastern side of Dum Dum Station and connection with Station by pedestrian plaza
2 (lumpsum)
Central Govt./ State Govt.
Shalimar 1.5 Central Govt./ State Govt.
PROPOSED TRUCK TERMINAL CUM WHOLESALE TRADING CENTER
Truck Terminal at Barasat (adjoining N.H. 34) Central Govt./ State Govt.
Truck Terminal at Kona (Stage II) 20 (lumpsum) Central Govt./ State Govt.
Truck Terminal at Dhulagarh (Stage II) Central Govt./ State Govt.
Truck Terminal at Dankuni (adjoining Durgapur Expressway) 40 (lumpsum)
Central Govt./ State Govt.
Truck Terminal at South of Rajarhat Township adjoining proposed Eastern Expressway 40 (lumpsum)
Central Govt./ State Govt.
Truck Terminal at North of Noapara 40 (lumpsum) Central Govt./ State Govt.
Truck Terminal at Amtala adjoining Diamond Harbour Road
40 (lumpsum) Central Govt./ State Govt.
Truck Parking Area under western approach of Vidyasagar Setu 1 (lumpsum)
Central Govt./ State Govt.
Truck Parking around Kolkata Jetties in Garden Reach area
Central Govt./ State Govt.
INTERMEDIATE TRUCK TERMINAL
Bansberia at the crossing of NH 2 and western approach of Ishwar Gupta Setu 20 (lumpsum)
Central Govt./ State Govt.
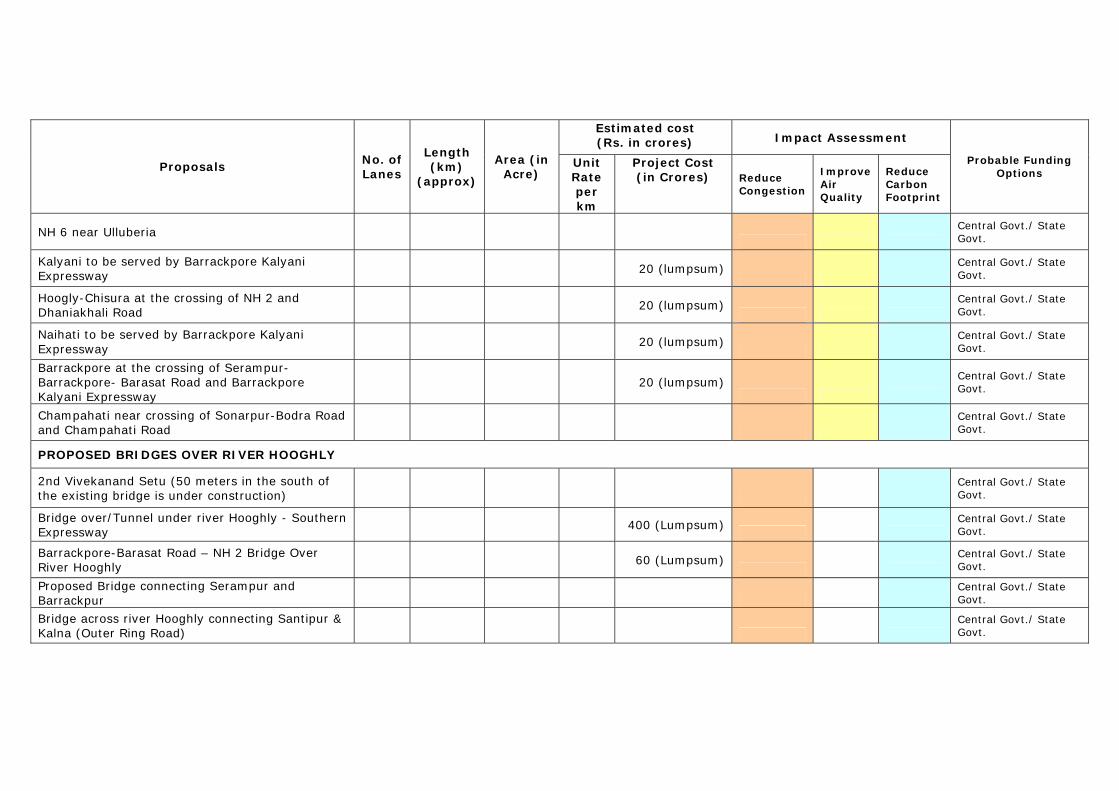
Estimated cost (Rs. in crores) Impact Assessment
Proposals No. of Lanes
Length (km)
(approx)
Area (in Acre)
Unit Rate per km
Project Cost (in Crores) Reduce
Congestion
Improve Air Quality
Reduce Carbon Footprint
Probable Funding Options
NH 6 near Ulluberia
Central Govt./ State Govt.
Kalyani to be served by Barrackpore Kalyani Expressway 20 (lumpsum)
Central Govt./ State Govt.
Hoogly-Chisura at the crossing of NH 2 and Dhaniakhali Road 20 (lumpsum)
Central Govt./ State Govt.
Naihati to be served by Barrackpore Kalyani Expressway
20 (lumpsum)
Central Govt./ State Govt.
Barrackpore at the crossing of Serampur-Barrackpore- Barasat Road and Barrackpore Kalyani Expressway
20 (lumpsum)
Central Govt./ State Govt.
Champahati near crossing of Sonarpur-Bodra Road and Champahati Road
Central Govt./ State Govt.
PROPOSED BRIDGES OVER RIVER HOOGHLY
2nd Vivekanand Setu (50 meters in the south of the existing bridge is under construction)
Central Govt./ State Govt.
Bridge over/Tunnel under river Hooghly - Southern Expressway
400 (Lumpsum) Central Govt./ State Govt.
Barrackpore-Barasat Road – NH 2 Bridge Over River Hooghly 60 (Lumpsum)
Central Govt./ State Govt.
Proposed Bridge connecting Serampur and Barrackpur
Central Govt./ State Govt.
Bridge across river Hooghly connecting Santipur & Kalna (Outer Ring Road)
Central Govt./ State Govt.
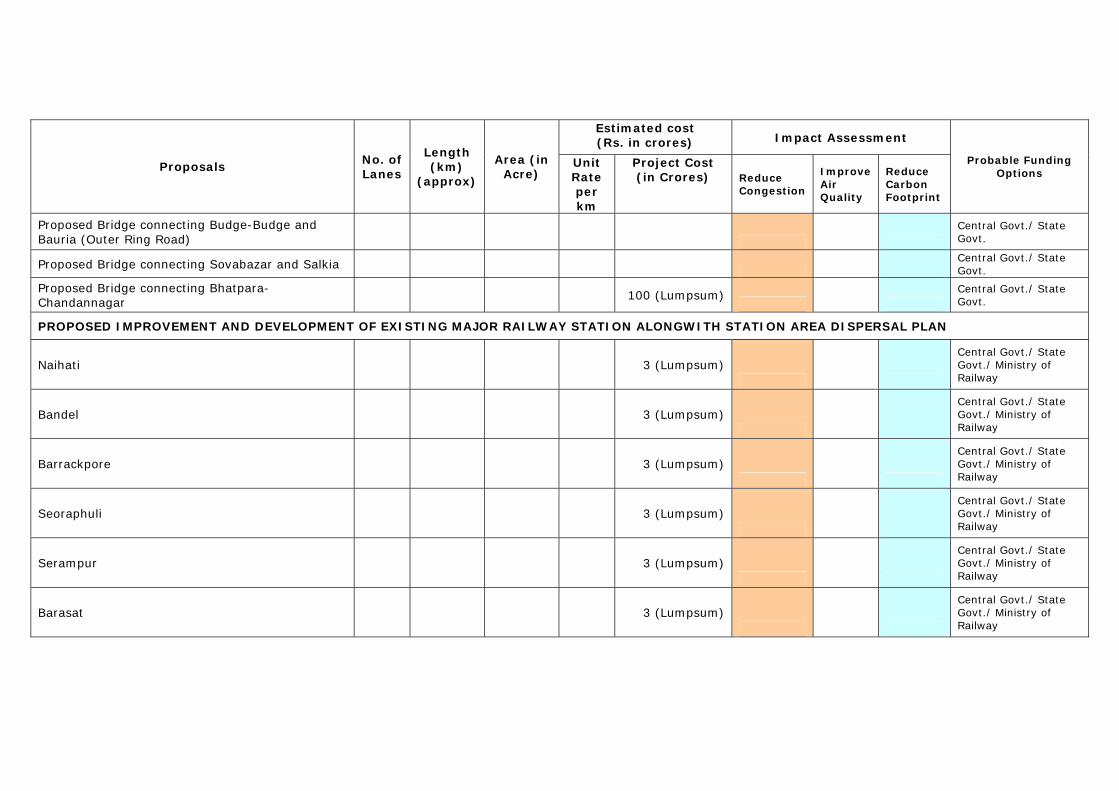
Estimated cost (Rs. in crores) Impact Assessment
Proposals No. of Lanes
Length (km)
(approx)
Area (in Acre)
Unit Rate per km
Project Cost (in Crores) Reduce
Congestion
Improve Air Quality
Reduce Carbon Footprint
Probable Funding Options
Proposed Bridge connecting Budge-Budge and Bauria (Outer Ring Road)
Central Govt./ State Govt.
Proposed Bridge connecting Sovabazar and Salkia Central Govt./ State Govt.
Proposed Bridge connecting Bhatpara-Chandannagar
100 (Lumpsum)
Central Govt./ State Govt.
PROPOSED IMPROVEMENT AND DEVELOPMENT OF EXISTING MAJOR RAILWAY STATION ALONGWITH STATION AREA DISPERSAL PLAN
Naihati 3 (Lumpsum)
Central Govt./ State Govt./ Ministry of Railway
Bandel 3 (Lumpsum)
Central Govt./ State Govt./ Ministry of Railway
Barrackpore 3 (Lumpsum)
Central Govt./ State Govt./ Ministry of Railway
Seoraphuli 3 (Lumpsum)
Central Govt./ State Govt./ Ministry of Railway
Serampur 3 (Lumpsum)
Central Govt./ State Govt./ Ministry of Railway
Barasat 3 (Lumpsum)
Central Govt./ State Govt./ Ministry of Railway
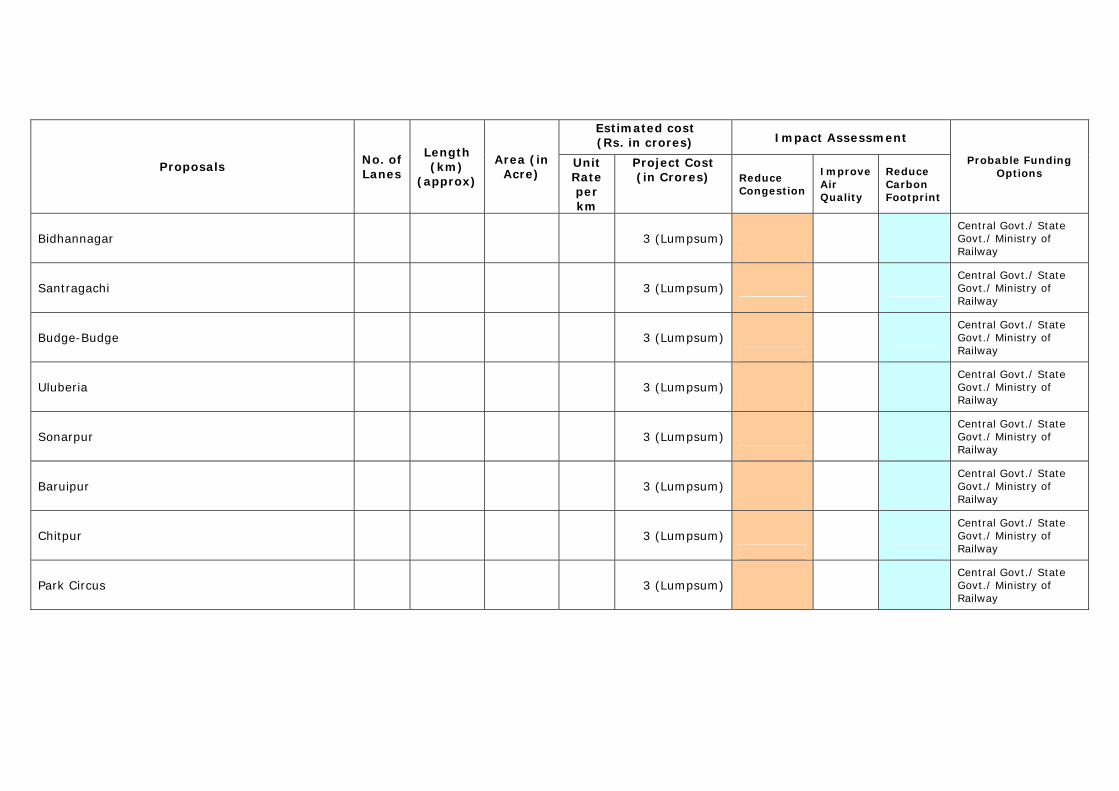
Estimated cost (Rs. in crores) Impact Assessment
Proposals No. of Lanes
Length (km)
(approx)
Area (in Acre)
Unit Rate per km
Project Cost (in Crores) Reduce
Congestion
Improve Air Quality
Reduce Carbon Footprint
Probable Funding Options
Bidhannagar 3 (Lumpsum)
Central Govt./ State Govt./ Ministry of Railway
Santragachi 3 (Lumpsum)
Central Govt./ State Govt./ Ministry of Railway
Budge-Budge 3 (Lumpsum)
Central Govt./ State Govt./ Ministry of Railway
Uluberia 3 (Lumpsum)
Central Govt./ State Govt./ Ministry of Railway
Sonarpur 3 (Lumpsum)
Central Govt./ State Govt./ Ministry of Railway
Baruipur 3 (Lumpsum)
Central Govt./ State Govt./ Ministry of Railway
Chitpur 3 (Lumpsum)
Central Govt./ State Govt./ Ministry of Railway
Park Circus 3 (Lumpsum)
Central Govt./ State Govt./ Ministry of Railway
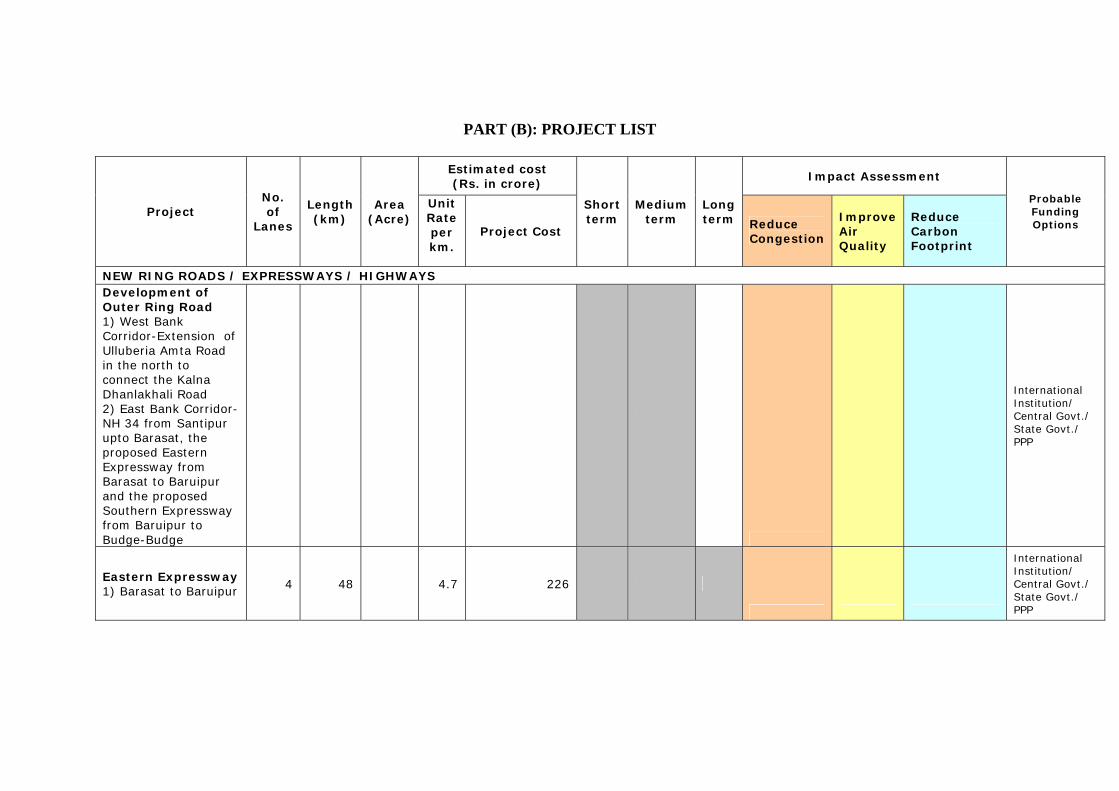
PART (B): PROJECT LIST
Estimated cost (Rs. in crore)
Impact Assessment
Project No. of
Lanes
Length (km)
Area (Acre)
Unit Rate per km.
Project Cost
Short term
Medium term
Long term Reduce
Congestion
Improve Air Quality
Reduce Carbon Footprint
Probable Funding Options
NEW RING ROADS / EXPRESSWAYS / HIGHWAYS Development of Outer Ring Road 1) West Bank Corridor-Extension of Ulluberia Amta Road in the north to connect the Kalna Dhanlakhali Road 2) East Bank Corridor- NH 34 from Santipur upto Barasat, the proposed Eastern Expressway from Barasat to Baruipur and the proposed Southern Expressway from Baruipur to Budge-Budge
International Institution/ Central Govt./ State Govt./ PPP
Eastern Expressway 1) Barasat to Baruipur
4 48 4.7 226
International Institution/ Central Govt./ State Govt./ PPP
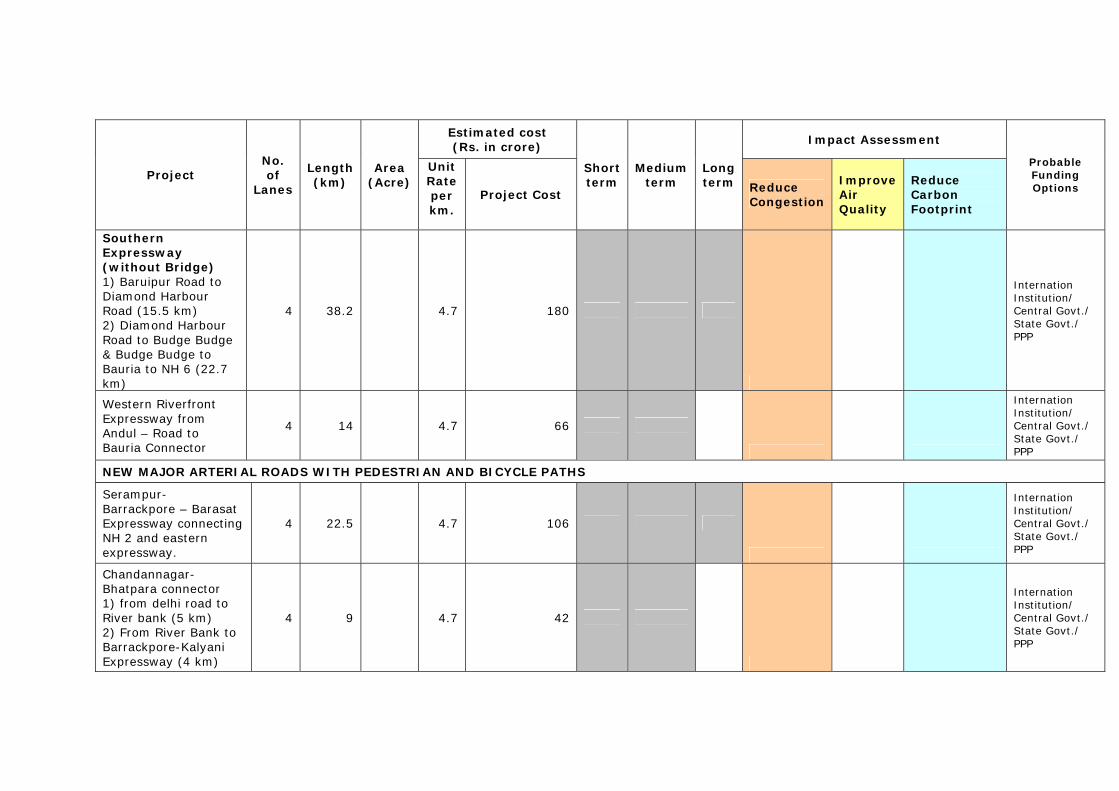
Estimated cost (Rs. in crore)
Impact Assessment
Project No. of
Lanes
Length (km)
Area (Acre)
Unit Rate per km.
Project Cost
Short term
Medium term
Long term Reduce
Congestion
Improve Air Quality
Reduce Carbon Footprint
Probable Funding Options
Southern Expressway (without Bridge) 1) Baruipur Road to Diamond Harbour Road (15.5 km) 2) Diamond Harbour Road to Budge Budge & Budge Budge to Bauria to NH 6 (22.7 km)
4 38.2 4.7 180
Internation Institution/ Central Govt./ State Govt./ PPP
Western Riverfront Expressway from Andul – Road to Bauria Connector
4 14 4.7 66
Internation Institution/ Central Govt./ State Govt./ PPP
NEW MAJOR ARTERIAL ROADS WITH PEDESTRIAN AND BICYCLE PATHS
Serampur- Barrackpore – Barasat Expressway connecting NH 2 and eastern expressway.
4 22.5 4.7 106
Internation Institution/ Central Govt./ State Govt./ PPP
Chandannagar- Bhatpara connector 1) from delhi road to River bank (5 km) 2) From River Bank to Barrackpore-Kalyani Expressway (4 km)
4 9 4.7 42
Internation Institution/ Central Govt./ State Govt./ PPP
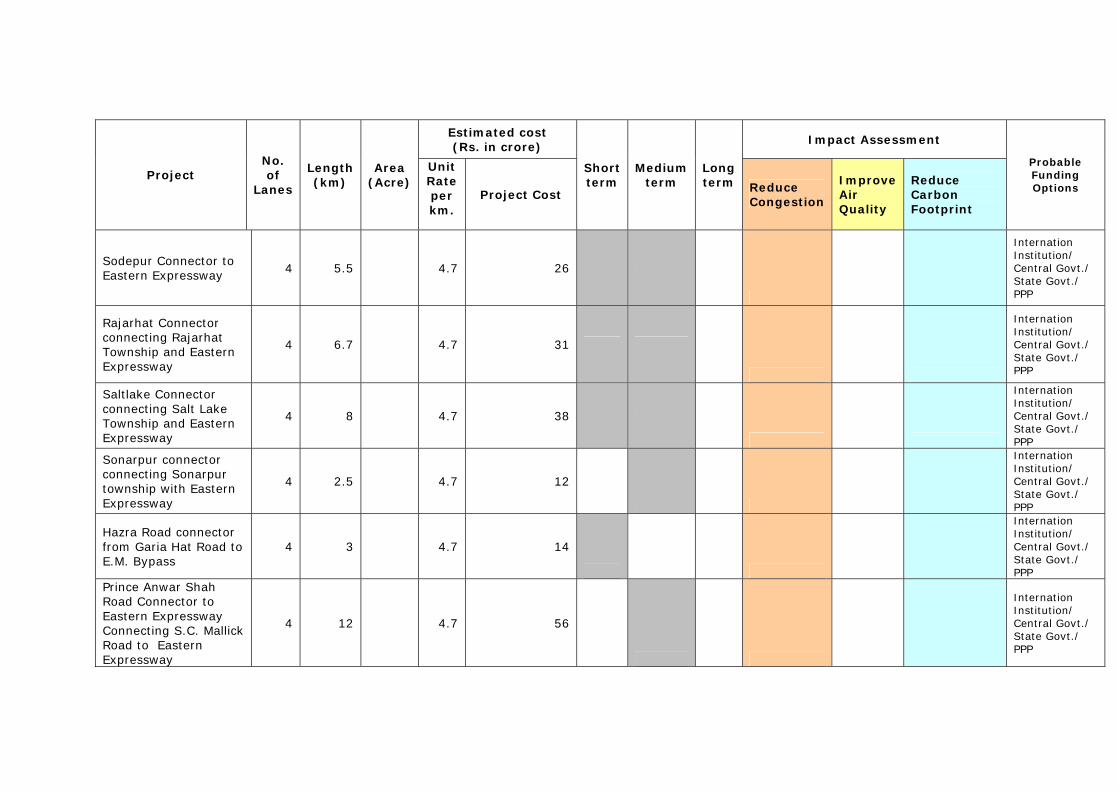
Estimated cost (Rs. in crore)
Impact Assessment
Project No. of
Lanes
Length (km)
Area (Acre)
Unit Rate per km.
Project Cost
Short term
Medium term
Long term Reduce
Congestion
Improve Air Quality
Reduce Carbon Footprint
Probable Funding Options
Sodepur Connector to Eastern Expressway 4 5.5 4.7 26
Internation Institution/ Central Govt./ State Govt./ PPP
Rajarhat Connector connecting Rajarhat Township and Eastern Expressway
4 6.7 4.7 31
Internation Institution/ Central Govt./ State Govt./ PPP
Saltlake Connector connecting Salt Lake Township and Eastern Expressway
4 8 4.7 38
Internation Institution/ Central Govt./ State Govt./ PPP
Sonarpur connector connecting Sonarpur township with Eastern Expressway
4 2.5 4.7 12
Internation Institution/ Central Govt./ State Govt./ PPP
Hazra Road connector from Garia Hat Road to E.M. Bypass
4 3 4.7 14
Internation Institution/ Central Govt./ State Govt./ PPP
Prince Anwar Shah Road Connector to Eastern Expressway Connecting S.C. Mallick Road to Eastern Expressway
4 12 4.7 56
Internation Institution/ Central Govt./ State Govt./ PPP
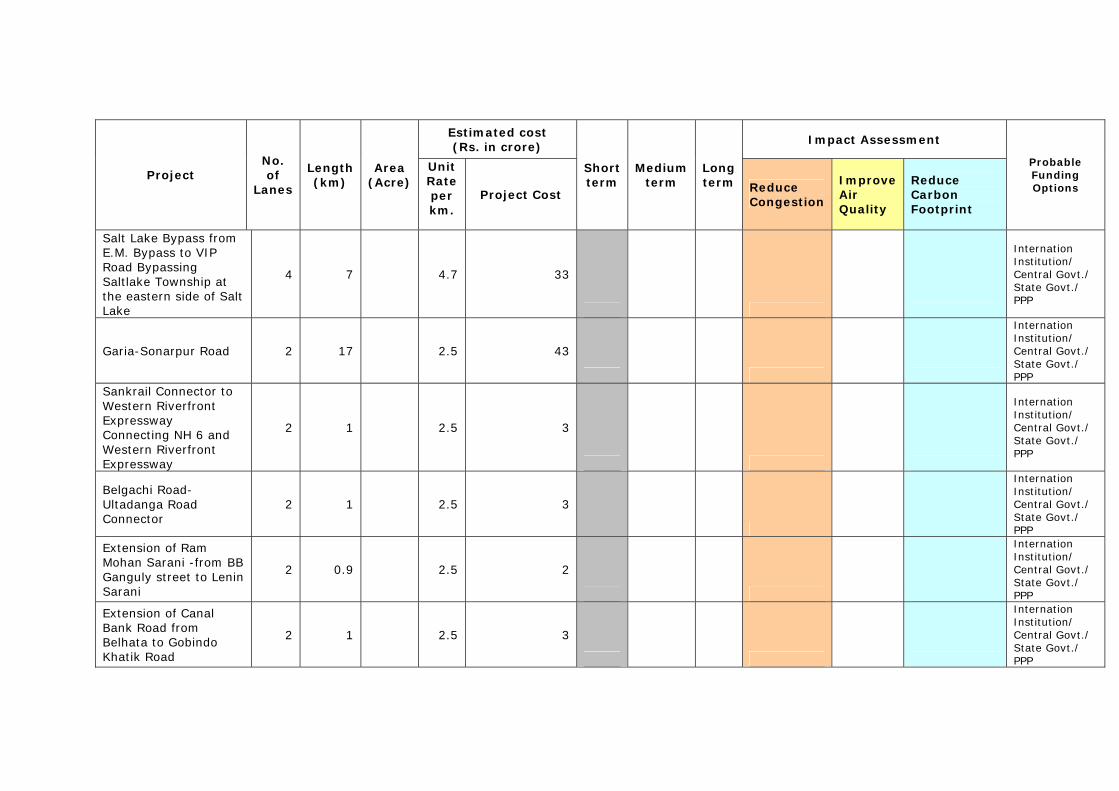
Estimated cost (Rs. in crore)
Impact Assessment
Project No. of
Lanes
Length (km)
Area (Acre)
Unit Rate per km.
Project Cost
Short term
Medium term
Long term Reduce
Congestion
Improve Air Quality
Reduce Carbon Footprint
Probable Funding Options
Salt Lake Bypass from E.M. Bypass to VIP Road Bypassing Saltlake Township at the eastern side of Salt Lake
4 7 4.7 33
Internation Institution/ Central Govt./ State Govt./ PPP
Garia-Sonarpur Road 2 17 2.5 43
Internation Institution/ Central Govt./ State Govt./ PPP
Sankrail Connector to Western Riverfront Expressway Connecting NH 6 and Western Riverfront Expressway
2 1 2.5 3
Internation Institution/ Central Govt./ State Govt./ PPP
Belgachi Road-Ultadanga Road Connector
2 1 2.5 3
Internation Institution/ Central Govt./ State Govt./ PPP
Extension of Ram Mohan Sarani -from BB Ganguly street to Lenin Sarani
2 0.9 2.5 2
Internation Institution/ Central Govt./ State Govt./ PPP
Extension of Canal Bank Road from Belhata to Gobindo Khatik Road
2 1 2.5 3
Internation Institution/ Central Govt./ State Govt./ PPP
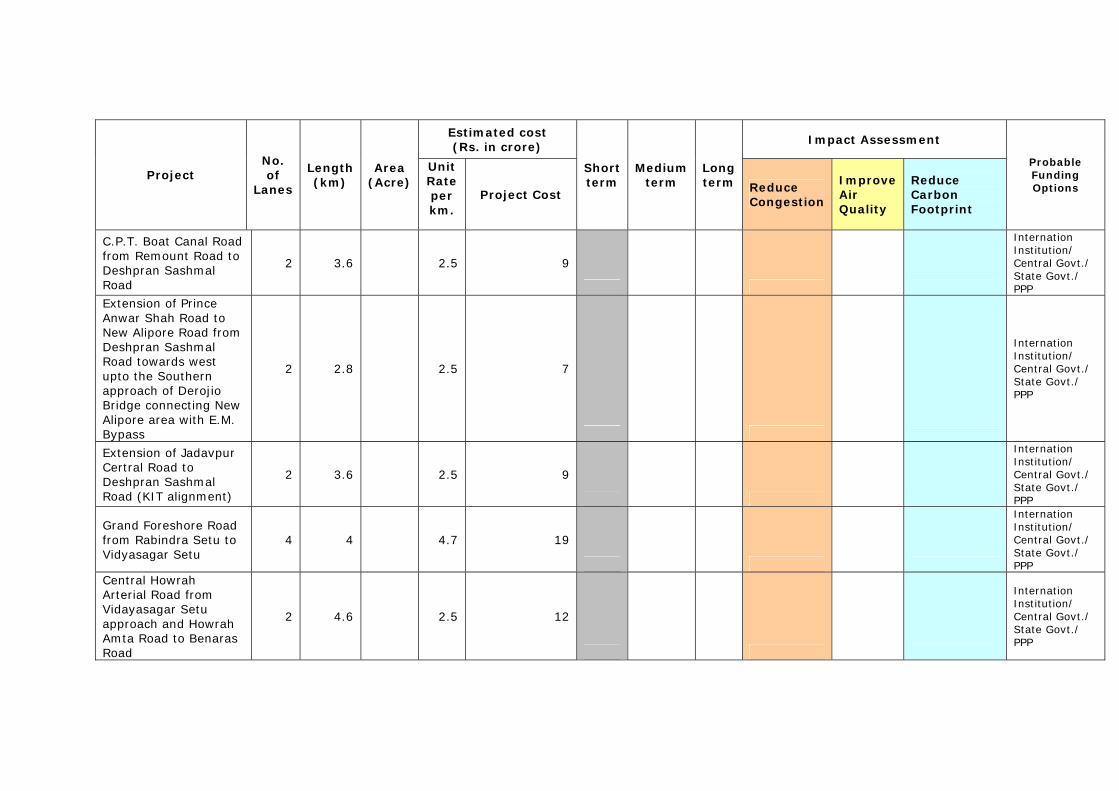
Estimated cost (Rs. in crore)
Impact Assessment
Project No. of
Lanes
Length (km)
Area (Acre)
Unit Rate per km.
Project Cost
Short term
Medium term
Long term Reduce
Congestion
Improve Air Quality
Reduce Carbon Footprint
Probable Funding Options
C.P.T. Boat Canal Road from Remount Road to Deshpran Sashmal Road
2 3.6 2.5 9
Internation Institution/ Central Govt./ State Govt./ PPP
Extension of Prince Anwar Shah Road to New Alipore Road from Deshpran Sashmal Road towards west upto the Southern approach of Derojio Bridge connecting New Alipore area with E.M. Bypass
2 2.8 2.5 7
Internation Institution/ Central Govt./ State Govt./ PPP
Extension of Jadavpur Certral Road to Deshpran Sashmal Road (KIT alignment)
2 3.6 2.5 9
Internation Institution/ Central Govt./ State Govt./ PPP
Grand Foreshore Road from Rabindra Setu to Vidyasagar Setu
4 4 4.7 19
Internation Institution/ Central Govt./ State Govt./ PPP
Central Howrah Arterial Road from Vidayasagar Setu approach and Howrah Amta Road to Benaras Road
2 4.6 2.5 12
Internation Institution/ Central Govt./ State Govt./ PPP
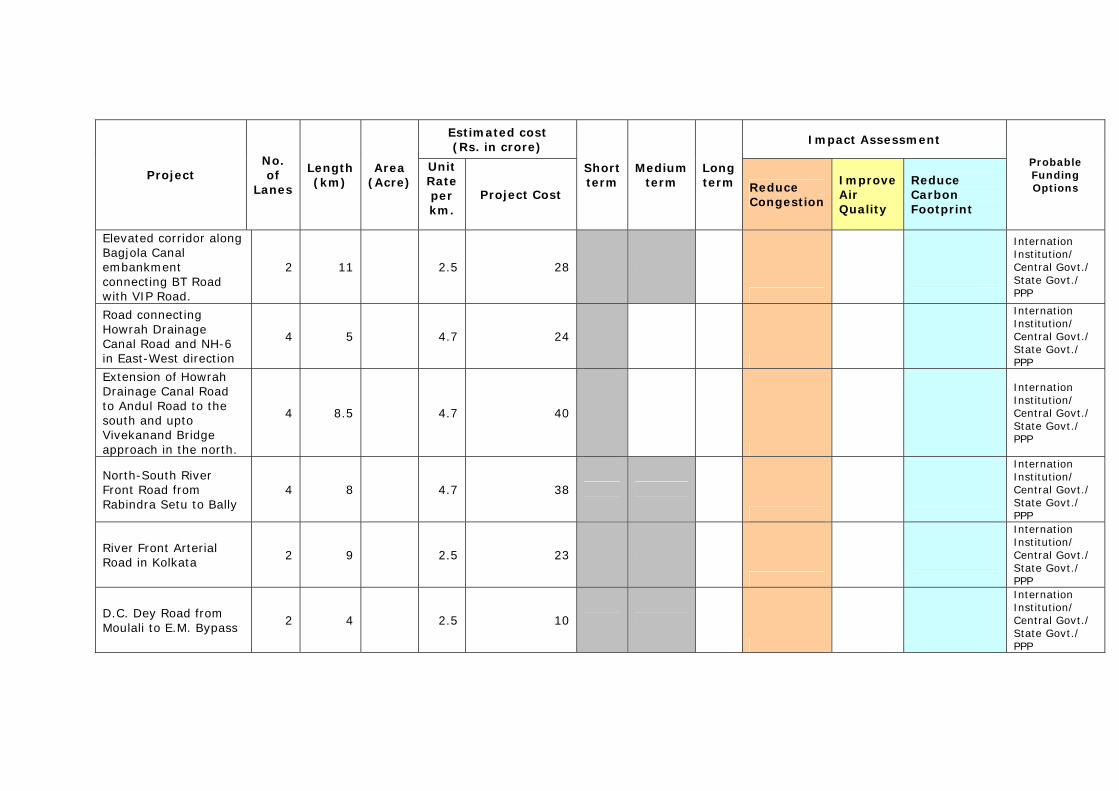
Estimated cost (Rs. in crore)
Impact Assessment
Project No. of
Lanes
Length (km)
Area (Acre)
Unit Rate per km.
Project Cost
Short term
Medium term
Long term Reduce
Congestion
Improve Air Quality
Reduce Carbon Footprint
Probable Funding Options
Elevated corridor along Bagjola Canal embankment connecting BT Road with VIP Road.
2 11 2.5 28
Internation Institution/ Central Govt./ State Govt./ PPP
Road connecting Howrah Drainage Canal Road and NH-6 in East-West direction
4 5 4.7 24
Internation Institution/ Central Govt./ State Govt./ PPP
Extension of Howrah Drainage Canal Road to Andul Road to the south and upto Vivekanand Bridge approach in the north.
4 8.5 4.7 40
Internation Institution/ Central Govt./ State Govt./ PPP
North-South River Front Road from Rabindra Setu to Bally
4 8 4.7 38
Internation Institution/ Central Govt./ State Govt./ PPP
River Front Arterial Road in Kolkata
2 9 2.5 23
Internation Institution/ Central Govt./ State Govt./ PPP
D.C. Dey Road from Moulali to E.M. Bypass
2 4 2.5 10
Internation Institution/ Central Govt./ State Govt./ PPP
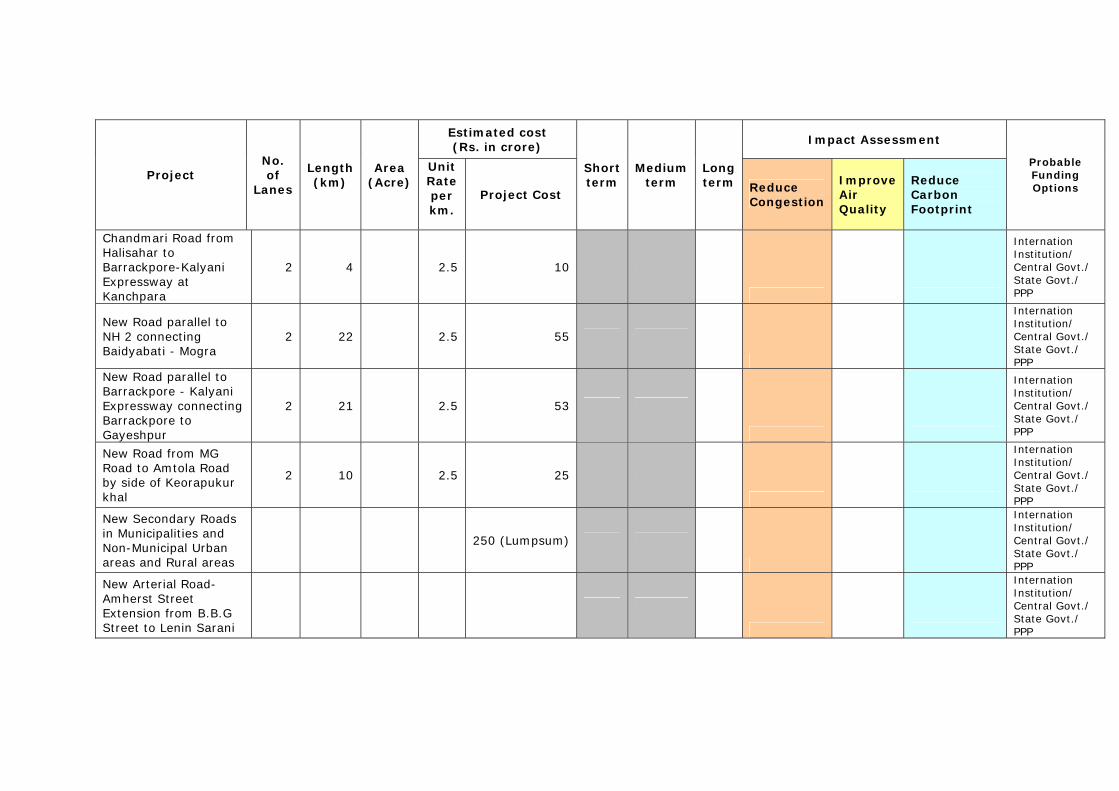
Estimated cost (Rs. in crore)
Impact Assessment
Project No. of
Lanes
Length (km)
Area (Acre)
Unit Rate per km.
Project Cost
Short term
Medium term
Long term Reduce
Congestion
Improve Air Quality
Reduce Carbon Footprint
Probable Funding Options
Chandmari Road from Halisahar to Barrackpore-Kalyani Expressway at Kanchpara
2 4 2.5 10
Internation Institution/ Central Govt./ State Govt./ PPP
New Road parallel to NH 2 connecting Baidyabati - Mogra
2 22 2.5 55
Internation Institution/ Central Govt./ State Govt./ PPP
New Road parallel to Barrackpore - Kalyani Expressway connecting Barrackpore to Gayeshpur
2 21 2.5 53
Internation Institution/ Central Govt./ State Govt./ PPP
New Road from MG Road to Amtola Road by side of Keorapukur khal
2 10 2.5 25
Internation Institution/ Central Govt./ State Govt./ PPP
New Secondary Roads in Municipalities and Non-Municipal Urban areas and Rural areas
250 (Lumpsum)
Internation Institution/ Central Govt./ State Govt./ PPP
New Arterial Road- Amherst Street Extension from B.B.G Street to Lenin Sarani
Internation Institution/ Central Govt./ State Govt./ PPP
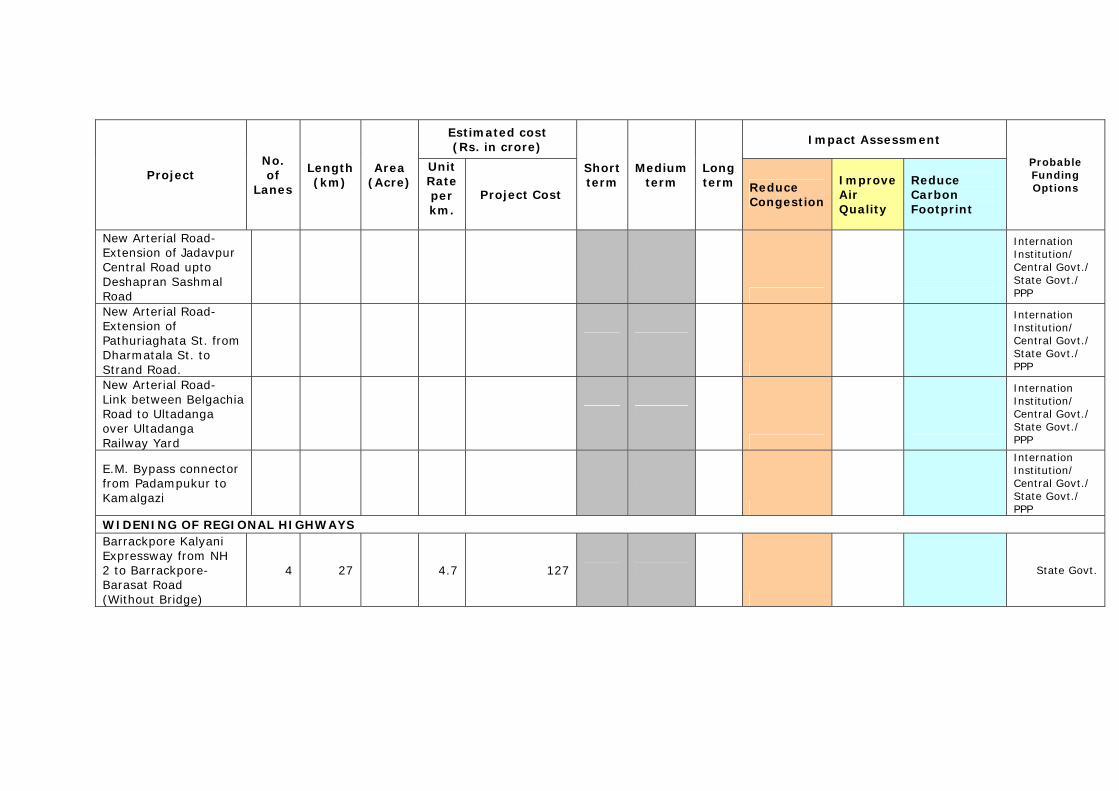
Estimated cost (Rs. in crore)
Impact Assessment
Project No. of
Lanes
Length (km)
Area (Acre)
Unit Rate per km.
Project Cost
Short term
Medium term
Long term Reduce
Congestion
Improve Air Quality
Reduce Carbon Footprint
Probable Funding Options
New Arterial Road- Extension of Jadavpur Central Road upto Deshapran Sashmal Road
Internation Institution/ Central Govt./ State Govt./ PPP
New Arterial Road- Extension of Pathuriaghata St. from Dharmatala St. to Strand Road.
Internation Institution/ Central Govt./ State Govt./ PPP
New Arterial Road- Link between Belgachia Road to Ultadanga over Ultadanga Railway Yard
Internation Institution/ Central Govt./ State Govt./ PPP
E.M. Bypass connector from Padampukur to Kamalgazi
Internation Institution/ Central Govt./ State Govt./ PPP
WIDENING OF REGIONAL HIGHWAYS Barrackpore Kalyani Expressway from NH 2 to Barrackpore-Barasat Road (Without Bridge)
4 27 4.7 127
State Govt.
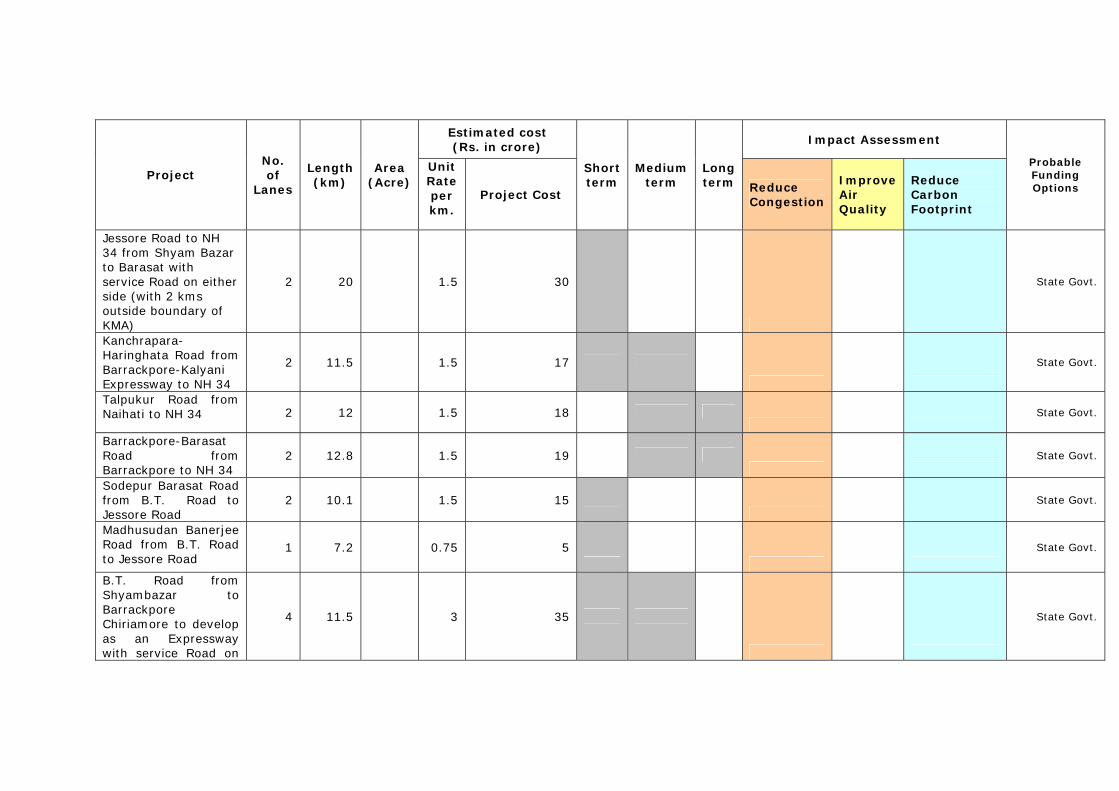
Estimated cost (Rs. in crore)
Impact Assessment
Project No. of
Lanes
Length (km)
Area (Acre)
Unit Rate per km.
Project Cost
Short term
Medium term
Long term Reduce
Congestion
Improve Air Quality
Reduce Carbon Footprint
Probable Funding Options
Jessore Road to NH 34 from Shyam Bazar to Barasat with service Road on either side (with 2 kms outside boundary of KMA)
2 20 1.5 30
State Govt.
Kanchrapara-Haringhata Road from Barrackpore-Kalyani Expressway to NH 34
2 11.5 1.5 17
State Govt.
Talpukur Road from Naihati to NH 34 2 12 1.5 18
State Govt.
Barrackpore-Barasat Road from Barrackpore to NH 34
2 12.8 1.5 19
State Govt.
Sodepur Barasat Road from B.T. Road to Jessore Road
2 10.1 1.5 15
State Govt.
Madhusudan Banerjee Road from B.T. Road to Jessore Road
1 7.2 0.75 5
State Govt.
B.T. Road from Shyambazar to Barrackpore Chiriamore to develop as an Expressway with service Road on
4 11.5 3 35
State Govt.
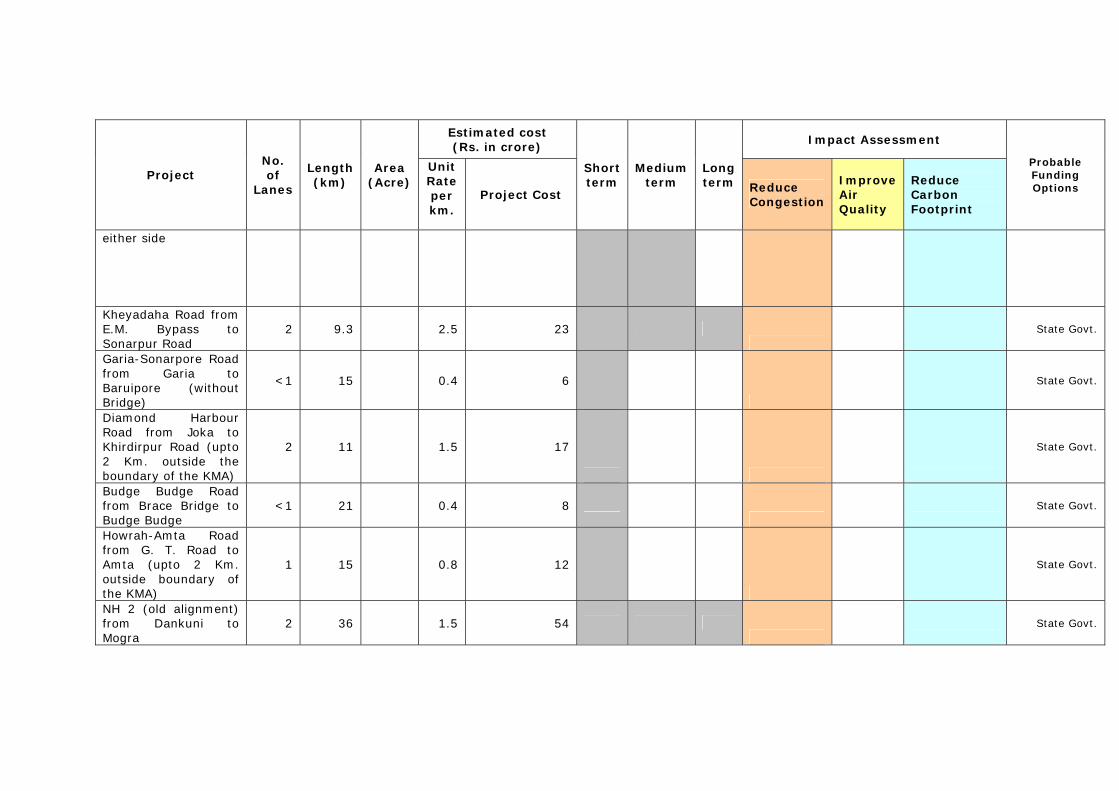
Estimated cost (Rs. in crore)
Impact Assessment
Project No. of
Lanes
Length (km)
Area (Acre)
Unit Rate per km.
Project Cost
Short term
Medium term
Long term Reduce
Congestion
Improve Air Quality
Reduce Carbon Footprint
Probable Funding Options
either side
Kheyadaha Road from E.M. Bypass to Sonarpur Road
2 9.3 2.5 23
State Govt.
Garia-Sonarpore Road from Garia to Baruipore (without Bridge)
<1 15 0.4 6
State Govt.
Diamond Harbour Road from Joka to Khirdirpur Road (upto 2 Km. outside the boundary of the KMA)
2 11 1.5 17
State Govt.
Budge Budge Road from Brace Bridge to Budge Budge
<1 21 0.4 8
State Govt.
Howrah-Amta Road from G. T. Road to Amta (upto 2 Km. outside boundary of the KMA)
1 15 0.8 12
State Govt.
NH 2 (old alignment) from Dankuni to Mogra
2 36 1.5 54
State Govt.
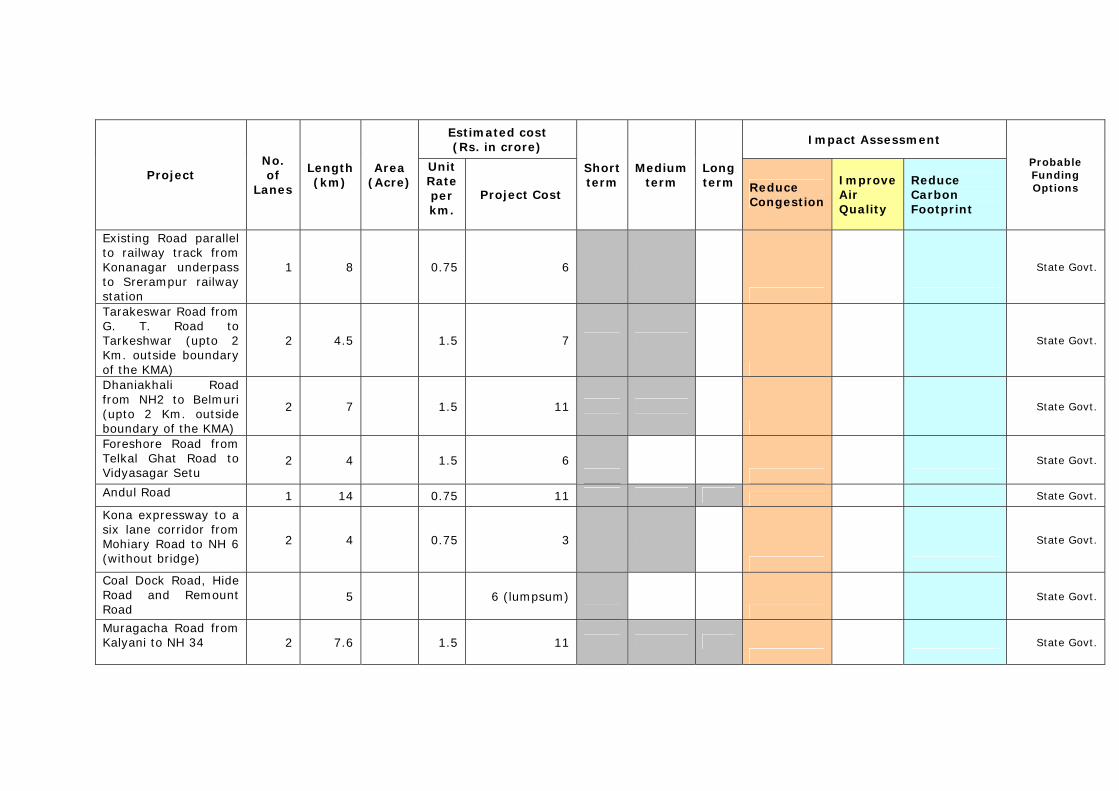
Estimated cost (Rs. in crore)
Impact Assessment
Project No. of
Lanes
Length (km)
Area (Acre)
Unit Rate per km.
Project Cost
Short term
Medium term
Long term Reduce
Congestion
Improve Air Quality
Reduce Carbon Footprint
Probable Funding Options
Existing Road parallel to railway track from Konanagar underpass to Srerampur railway station
1 8 0.75 6
State Govt.
Tarakeswar Road from G. T. Road to Tarkeshwar (upto 2 Km. outside boundary of the KMA)
2 4.5 1.5 7
State Govt.
Dhaniakhali Road from NH2 to Belmuri (upto 2 Km. outside boundary of the KMA)
2 7 1.5 11
State Govt.
Foreshore Road from Telkal Ghat Road to Vidyasagar Setu
2 4 1.5 6
State Govt.
Andul Road 1 14 0.75 11 State Govt.
Kona expressway to a six lane corridor from Mohiary Road to NH 6 (without bridge)
2 4 0.75 3
State Govt.
Coal Dock Road, Hide Road and Remount Road
5 6 (lumpsum)
State Govt.
Muragacha Road from Kalyani to NH 34 2 7.6 1.5 11
State Govt.
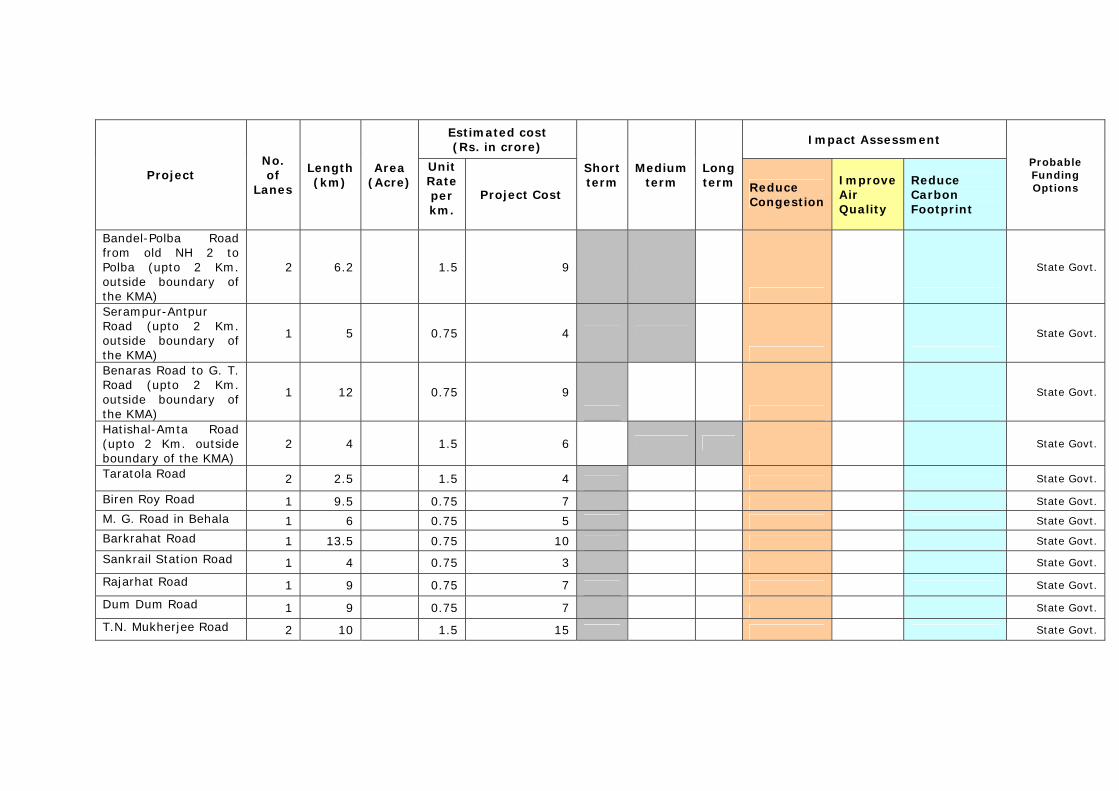
Estimated cost (Rs. in crore)
Impact Assessment
Project No. of
Lanes
Length (km)
Area (Acre)
Unit Rate per km.
Project Cost
Short term
Medium term
Long term Reduce
Congestion
Improve Air Quality
Reduce Carbon Footprint
Probable Funding Options
Bandel-Polba Road from old NH 2 to Polba (upto 2 Km. outside boundary of the KMA)
2 6.2 1.5 9
State Govt.
Serampur-Antpur Road (upto 2 Km. outside boundary of the KMA)
1 5 0.75 4
State Govt.
Benaras Road to G. T. Road (upto 2 Km. outside boundary of the KMA)
1 12 0.75 9
State Govt.
Hatishal-Amta Road (upto 2 Km. outside boundary of the KMA)
2 4 1.5 6
State Govt.
Taratola Road 2 2.5 1.5 4 State Govt.
Biren Roy Road 1 9.5 0.75 7 State Govt.
M. G. Road in Behala 1 6 0.75 5 State Govt.
Barkrahat Road 1 13.5 0.75 10 State Govt.
Sankrail Station Road 1 4 0.75 3 State Govt.
Rajarhat Road 1 9 0.75 7 State Govt.
Dum Dum Road 1 9 0.75 7 State Govt.
T.N. Mukherjee Road 2 10 1.5 15 State Govt.
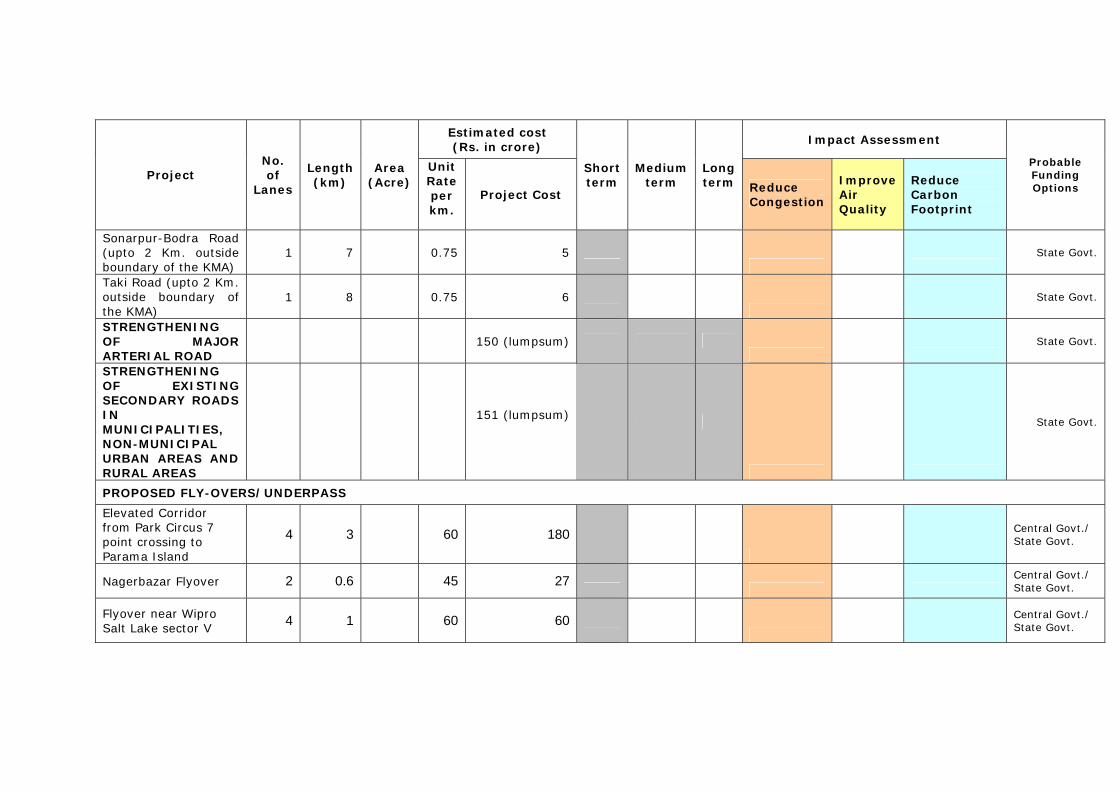
Estimated cost (Rs. in crore)
Impact Assessment
Project No. of
Lanes
Length (km)
Area (Acre)
Unit Rate per km.
Project Cost
Short term
Medium term
Long term Reduce
Congestion
Improve Air Quality
Reduce Carbon Footprint
Probable Funding Options
Sonarpur-Bodra Road (upto 2 Km. outside boundary of the KMA)
1 7 0.75 5
State Govt.
Taki Road (upto 2 Km. outside boundary of the KMA)
1 8 0.75 6
State Govt.
STRENGTHENING OF MAJOR ARTERIAL ROAD
150 (lumpsum)
State Govt.
STRENGTHENING OF EXISTING SECONDARY ROADS IN MUNICIPALITIES, NON-MUNICIPAL URBAN AREAS AND RURAL AREAS
151 (lumpsum)
State Govt.
PROPOSED FLY-OVERS/UNDERPASS
Elevated Corridor from Park Circus 7 point crossing to Parama Island
4 3
60 180
Central Govt./ State Govt.
Nagerbazar Flyover 2 0.6
45 27
Central Govt./ State Govt.
Flyover near Wipro Salt Lake sector V
4 1
60 60
Central Govt./ State Govt.
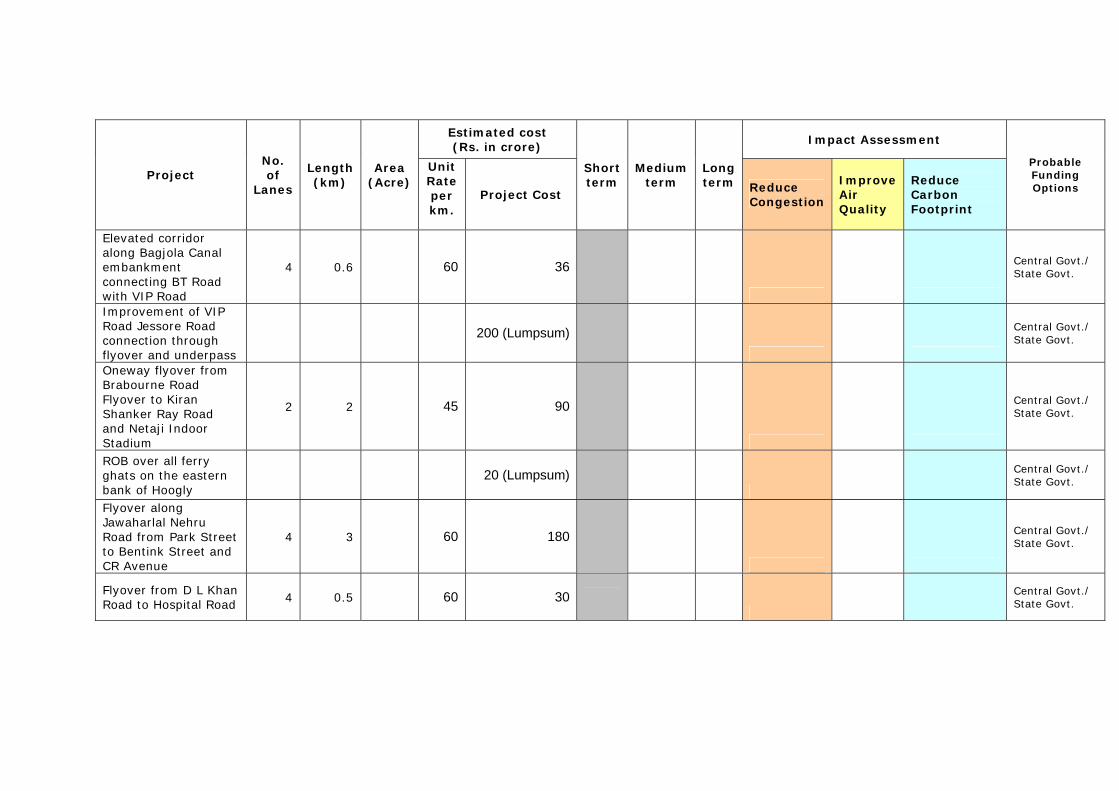
Estimated cost (Rs. in crore)
Impact Assessment
Project No. of
Lanes
Length (km)
Area (Acre)
Unit Rate per km.
Project Cost
Short term
Medium term
Long term Reduce
Congestion
Improve Air Quality
Reduce Carbon Footprint
Probable Funding Options
Elevated corridor along Bagjola Canal embankment connecting BT Road with VIP Road
4 0.6
60 36
Central Govt./ State Govt.
Improvement of VIP Road Jessore Road connection through flyover and underpass
200 (Lumpsum)
Central Govt./ State Govt.
Oneway flyover from Brabourne Road Flyover to Kiran Shanker Ray Road and Netaji Indoor Stadium
2 2
45 90
Central Govt./ State Govt.
ROB over all ferry ghats on the eastern bank of Hoogly
20 (Lumpsum)
Central Govt./ State Govt.
Flyover along Jawaharlal Nehru Road from Park Street to Bentink Street and CR Avenue
4 3
60 180
Central Govt./ State Govt.
Flyover from D L Khan Road to Hospital Road 4 0.5
60 30
Central Govt./ State Govt.
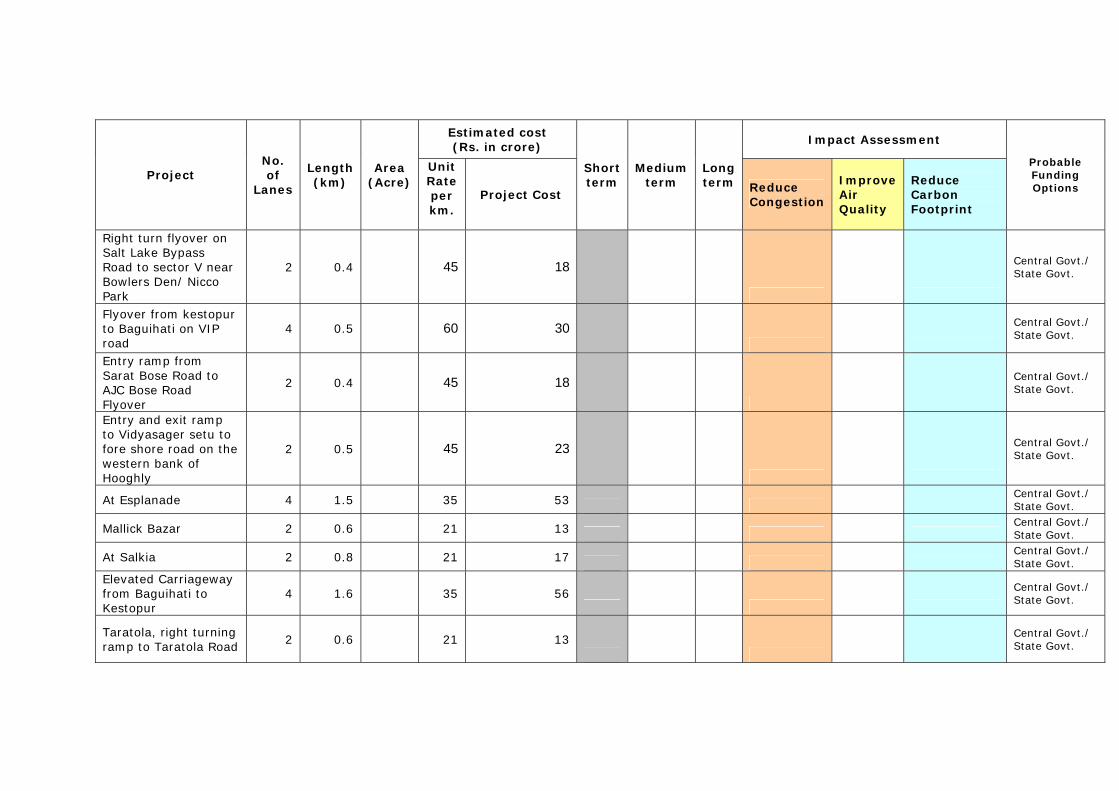
Estimated cost (Rs. in crore)
Impact Assessment
Project No. of
Lanes
Length (km)
Area (Acre)
Unit Rate per km.
Project Cost
Short term
Medium term
Long term Reduce
Congestion
Improve Air Quality
Reduce Carbon Footprint
Probable Funding Options
Right turn flyover on Salt Lake Bypass Road to sector V near Bowlers Den/ Nicco Park
2 0.4
45 18
Central Govt./ State Govt.
Flyover from kestopur to Baguihati on VIP road
4 0.5
60 30
Central Govt./ State Govt.
Entry ramp from Sarat Bose Road to AJC Bose Road Flyover
2 0.4
45 18
Central Govt./ State Govt.
Entry and exit ramp to Vidyasager setu to fore shore road on the western bank of Hooghly
2 0.5
45 23
Central Govt./ State Govt.
At Esplanade 4 1.5 35 53 Central Govt./ State Govt.
Mallick Bazar 2 0.6 21 13 Central Govt./ State Govt.
At Salkia 2 0.8 21 17 Central Govt./ State Govt.
Elevated Carriageway from Baguihati to Kestopur
4 1.6 35 56
Central Govt./ State Govt.
Taratola, right turning ramp to Taratola Road 2 0.6 21 13
Central Govt./ State Govt.
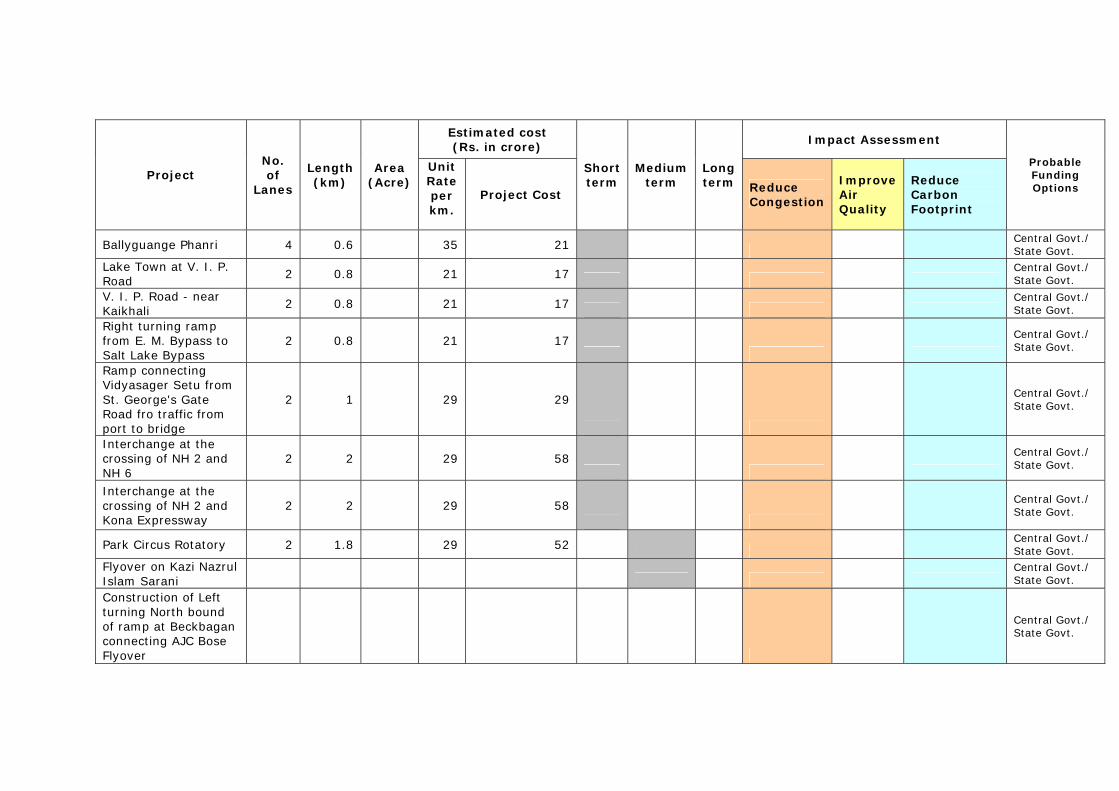
Estimated cost (Rs. in crore)
Impact Assessment
Project No. of
Lanes
Length (km)
Area (Acre)
Unit Rate per km.
Project Cost
Short term
Medium term
Long term Reduce
Congestion
Improve Air Quality
Reduce Carbon Footprint
Probable Funding Options
Ballyguange Phanri 4 0.6 35 21 Central Govt./ State Govt.
Lake Town at V. I. P. Road
2 0.8 21 17 Central Govt./ State Govt.
V. I. P. Road - near Kaikhali
2 0.8 21 17 Central Govt./ State Govt.
Right turning ramp from E. M. Bypass to Salt Lake Bypass
2 0.8 21 17
Central Govt./ State Govt.
Ramp connecting Vidyasager Setu from St. George's Gate Road fro traffic from port to bridge
2 1 29 29
Central Govt./ State Govt.
Interchange at the crossing of NH 2 and NH 6
2 2 29 58
Central Govt./ State Govt.
Interchange at the crossing of NH 2 and Kona Expressway
2 2 29 58
Central Govt./ State Govt.
Park Circus Rotatory 2 1.8 29 52 Central Govt./ State Govt.
Flyover on Kazi Nazrul Islam Sarani
Central Govt./ State Govt.
Construction of Left turning North bound of ramp at Beckbagan connecting AJC Bose Flyover
Central Govt./ State Govt.
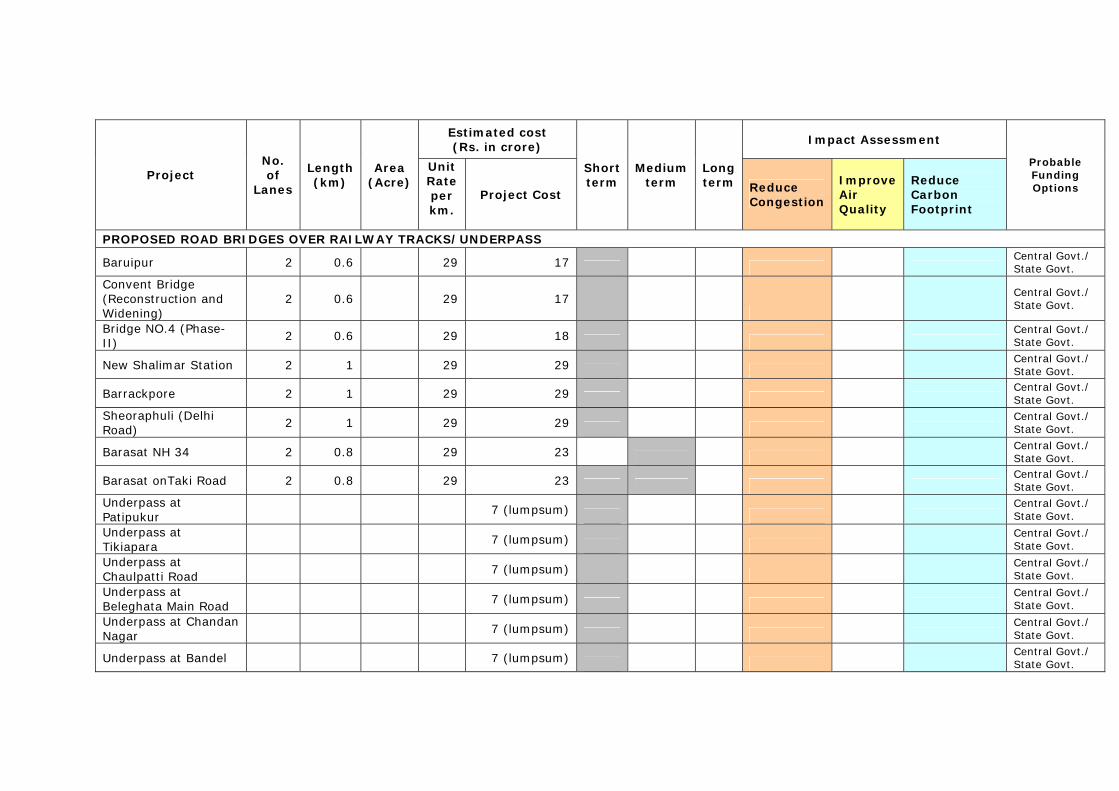
Estimated cost (Rs. in crore)
Impact Assessment
Project No. of
Lanes
Length (km)
Area (Acre)
Unit Rate per km.
Project Cost
Short term
Medium term
Long term Reduce
Congestion
Improve Air Quality
Reduce Carbon Footprint
Probable Funding Options
PROPOSED ROAD BRIDGES OVER RAILWAY TRACKS/UNDERPASS
Baruipur 2 0.6 29 17 Central Govt./ State Govt.
Convent Bridge (Reconstruction and Widening)
2 0.6 29 17
Central Govt./ State Govt.
Bridge NO.4 (Phase-II)
2 0.6 29 18 Central Govt./ State Govt.
New Shalimar Station 2 1 29 29 Central Govt./ State Govt.
Barrackpore 2 1 29 29 Central Govt./ State Govt.
Sheoraphuli (Delhi Road)
2 1 29 29 Central Govt./ State Govt.
Barasat NH 34 2 0.8 29 23 Central Govt./ State Govt.
Barasat onTaki Road 2 0.8 29 23 Central Govt./ State Govt.
Underpass at Patipukur
7 (lumpsum) Central Govt./ State Govt.
Underpass at Tikiapara
7 (lumpsum) Central Govt./ State Govt.
Underpass at Chaulpatti Road
7 (lumpsum) Central Govt./ State Govt.
Underpass at Beleghata Main Road
7 (lumpsum) Central Govt./ State Govt.
Underpass at Chandan Nagar
7 (lumpsum) Central Govt./ State Govt.
Underpass at Bandel 7 (lumpsum) Central Govt./ State Govt.
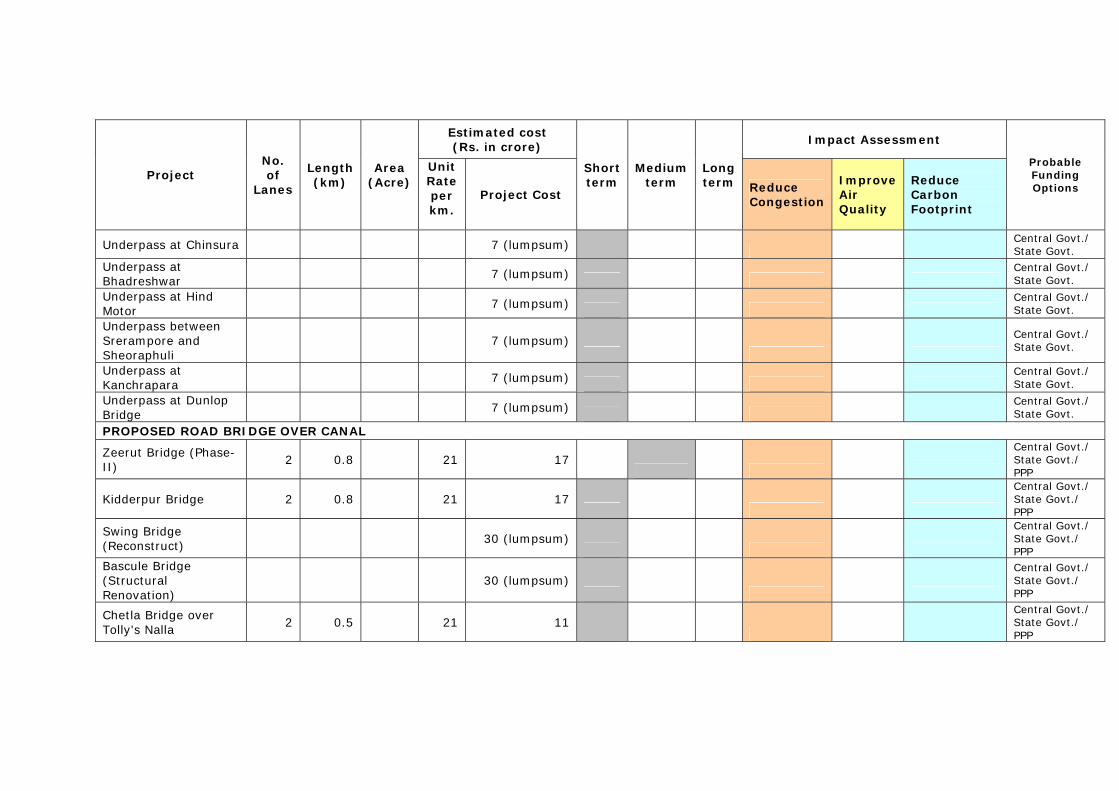
Estimated cost (Rs. in crore)
Impact Assessment
Project No. of
Lanes
Length (km)
Area (Acre)
Unit Rate per km.
Project Cost
Short term
Medium term
Long term Reduce
Congestion
Improve Air Quality
Reduce Carbon Footprint
Probable Funding Options
Underpass at Chinsura 7 (lumpsum) Central Govt./ State Govt.
Underpass at Bhadreshwar
7 (lumpsum) Central Govt./ State Govt.
Underpass at Hind Motor
7 (lumpsum) Central Govt./ State Govt.
Underpass between Srerampore and Sheoraphuli
7 (lumpsum)
Central Govt./ State Govt.
Underpass at Kanchrapara
7 (lumpsum) Central Govt./ State Govt.
Underpass at Dunlop Bridge
7 (lumpsum) Central Govt./ State Govt.
PROPOSED ROAD BRIDGE OVER CANAL
Zeerut Bridge (Phase-II) 2 0.8 21 17
Central Govt./ State Govt./ PPP
Kidderpur Bridge 2 0.8 21 17
Central Govt./ State Govt./ PPP
Swing Bridge (Reconstruct) 30 (lumpsum)
Central Govt./ State Govt./ PPP
Bascule Bridge (Structural Renovation)
30 (lumpsum)
Central Govt./ State Govt./ PPP
Chetla Bridge over Tolly's Nalla
2 0.5 21 11
Central Govt./ State Govt./ PPP
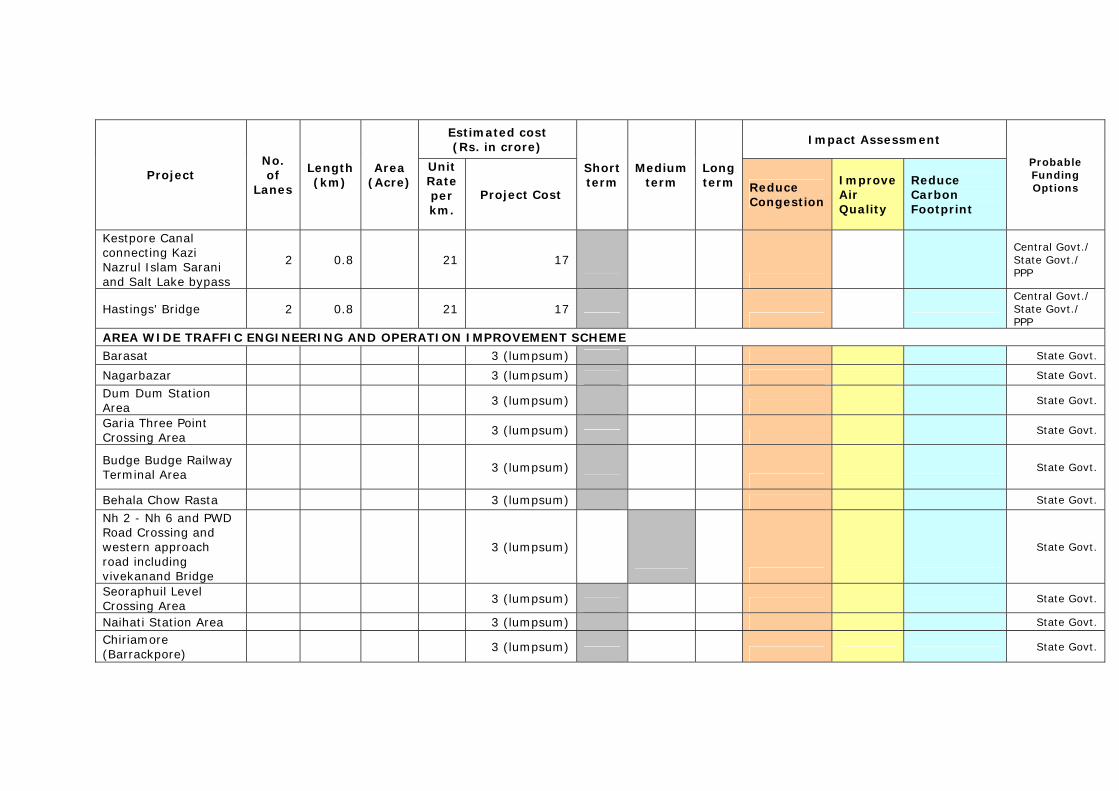
Estimated cost (Rs. in crore)
Impact Assessment
Project No. of
Lanes
Length (km)
Area (Acre)
Unit Rate per km.
Project Cost
Short term
Medium term
Long term Reduce
Congestion
Improve Air Quality
Reduce Carbon Footprint
Probable Funding Options
Kestpore Canal connecting Kazi Nazrul Islam Sarani and Salt Lake bypass
2 0.8 21 17
Central Govt./ State Govt./ PPP
Hastings' Bridge 2 0.8 21 17
Central Govt./ State Govt./ PPP
AREA WIDE TRAFFIC ENGINEERING AND OPERATION IMPROVEMENT SCHEME
Barasat 3 (lumpsum) State Govt.
Nagarbazar 3 (lumpsum) State Govt.
Dum Dum Station Area
3 (lumpsum) State Govt.
Garia Three Point Crossing Area
3 (lumpsum) State Govt.
Budge Budge Railway Terminal Area 3 (lumpsum)
State Govt.
Behala Chow Rasta 3 (lumpsum) State Govt.
Nh 2 - Nh 6 and PWD Road Crossing and western approach road including vivekanand Bridge
3 (lumpsum)
State Govt.
Seoraphuil Level Crossing Area
3 (lumpsum) State Govt.
Naihati Station Area 3 (lumpsum) State Govt.
Chiriamore (Barrackpore)
3 (lumpsum) State Govt.
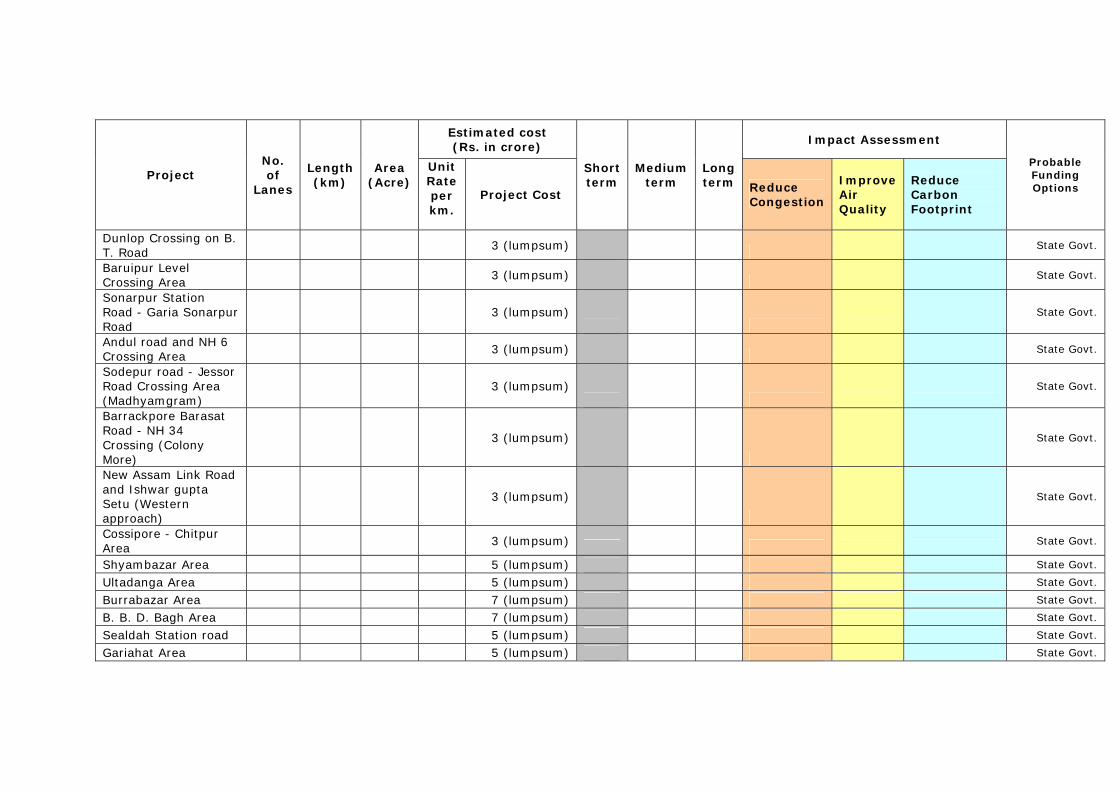
Estimated cost (Rs. in crore)
Impact Assessment
Project No. of
Lanes
Length (km)
Area (Acre)
Unit Rate per km.
Project Cost
Short term
Medium term
Long term Reduce
Congestion
Improve Air Quality
Reduce Carbon Footprint
Probable Funding Options
Dunlop Crossing on B. T. Road
3 (lumpsum) State Govt.
Baruipur Level Crossing Area
3 (lumpsum) State Govt.
Sonarpur Station Road - Garia Sonarpur Road
3 (lumpsum)
State Govt.
Andul road and NH 6 Crossing Area
3 (lumpsum) State Govt.
Sodepur road - Jessor Road Crossing Area (Madhyamgram)
3 (lumpsum)
State Govt.
Barrackpore Barasat Road - NH 34 Crossing (Colony More)
3 (lumpsum)
State Govt.
New Assam Link Road and Ishwar gupta Setu (Western approach)
3 (lumpsum)
State Govt.
Cossipore - Chitpur Area
3 (lumpsum) State Govt.
Shyambazar Area 5 (lumpsum) State Govt.
Ultadanga Area 5 (lumpsum) State Govt.
Burrabazar Area 7 (lumpsum) State Govt.
B. B. D. Bagh Area 7 (lumpsum) State Govt.
Sealdah Station road 5 (lumpsum) State Govt.
Gariahat Area 5 (lumpsum) State Govt.
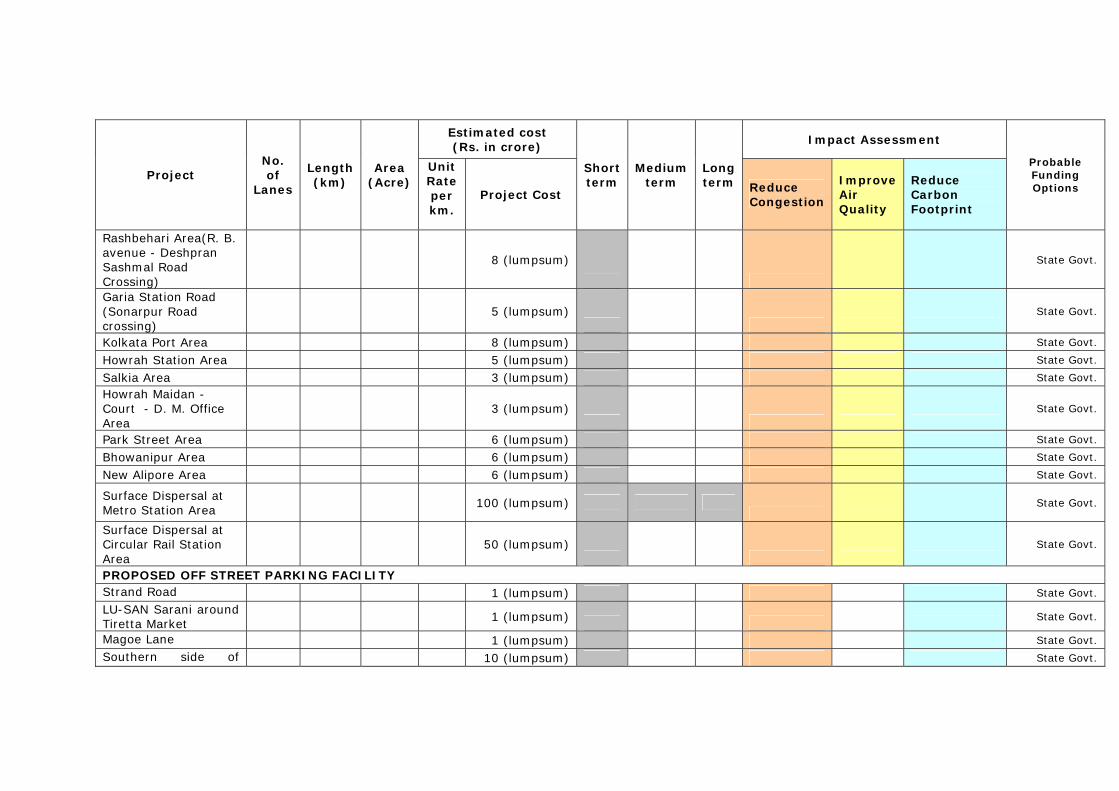
Estimated cost (Rs. in crore)
Impact Assessment
Project No. of
Lanes
Length (km)
Area (Acre)
Unit Rate per km.
Project Cost
Short term
Medium term
Long term Reduce
Congestion
Improve Air Quality
Reduce Carbon Footprint
Probable Funding Options
Rashbehari Area(R. B. avenue - Deshpran Sashmal Road Crossing)
8 (lumpsum)
State Govt.
Garia Station Road (Sonarpur Road crossing)
5 (lumpsum)
State Govt.
Kolkata Port Area 8 (lumpsum) State Govt.
Howrah Station Area 5 (lumpsum) State Govt.
Salkia Area 3 (lumpsum) State Govt.
Howrah Maidan - Court - D. M. Office Area
3 (lumpsum)
State Govt.
Park Street Area 6 (lumpsum) State Govt.
Bhowanipur Area 6 (lumpsum) State Govt.
New Alipore Area 6 (lumpsum) State Govt.
Surface Dispersal at Metro Station Area
100 (lumpsum)
State Govt.
Surface Dispersal at Circular Rail Station Area
50 (lumpsum)
State Govt.
PROPOSED OFF STREET PARKING FACILITY Strand Road 1 (lumpsum) State Govt.
LU-SAN Sarani around Tiretta Market
1 (lumpsum) State Govt.
Magoe Lane 1 (lumpsum) State Govt.
Southern side of 10 (lumpsum) State Govt.
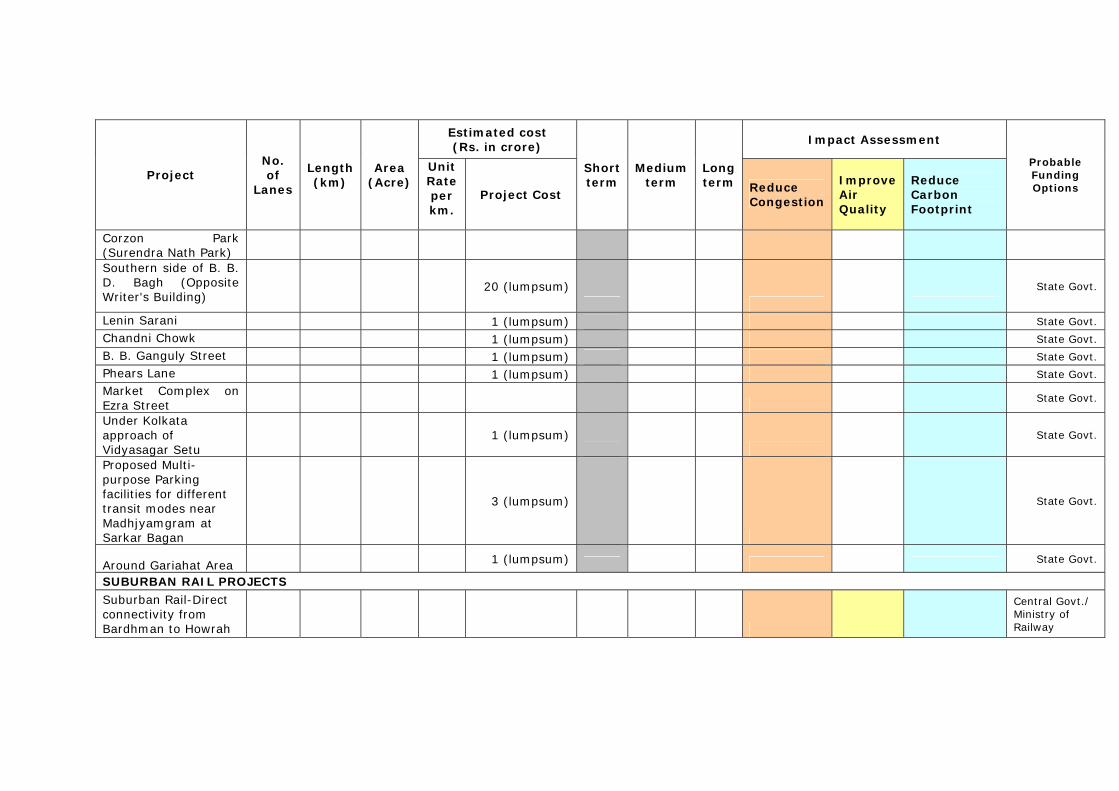
Estimated cost (Rs. in crore)
Impact Assessment
Project No. of
Lanes
Length (km)
Area (Acre)
Unit Rate per km.
Project Cost
Short term
Medium term
Long term Reduce
Congestion
Improve Air Quality
Reduce Carbon Footprint
Probable Funding Options
Corzon Park (Surendra Nath Park) Southern side of B. B. D. Bagh (Opposite Writer's Building)
20 (lumpsum)
State Govt.
Lenin Sarani 1 (lumpsum) State Govt.
Chandni Chowk 1 (lumpsum) State Govt.
B. B. Ganguly Street 1 (lumpsum) State Govt.
Phears Lane 1 (lumpsum) State Govt.
Market Complex on Ezra Street
State Govt.
Under Kolkata approach of Vidyasagar Setu
1 (lumpsum)
State Govt.
Proposed Multi-purpose Parking facilities for different transit modes near Madhjyamgram at Sarkar Bagan
3 (lumpsum)
State Govt.
Around Gariahat Area 1 (lumpsum) State Govt.
SUBURBAN RAIL PROJECTS Suburban Rail-Direct connectivity from Bardhman to Howrah
Central Govt./ Ministry of Railway
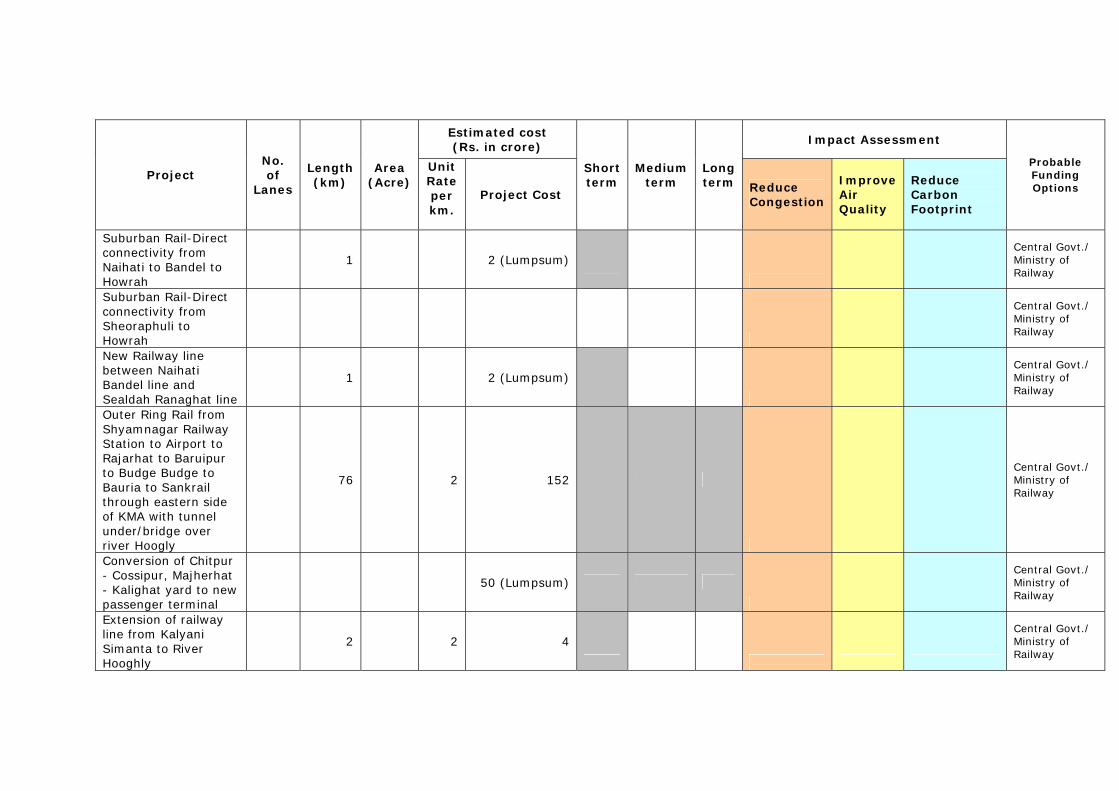
Estimated cost (Rs. in crore)
Impact Assessment
Project No. of
Lanes
Length (km)
Area (Acre)
Unit Rate per km.
Project Cost
Short term
Medium term
Long term Reduce
Congestion
Improve Air Quality
Reduce Carbon Footprint
Probable Funding Options
Suburban Rail-Direct connectivity from Naihati to Bandel to Howrah
1 2 (Lumpsum)
Central Govt./ Ministry of Railway
Suburban Rail-Direct connectivity from Sheoraphuli to Howrah
Central Govt./ Ministry of Railway
New Railway line between Naihati Bandel line and Sealdah Ranaghat line
1 2 (Lumpsum)
Central Govt./ Ministry of Railway
Outer Ring Rail from Shyamnagar Railway Station to Airport to Rajarhat to Baruipur to Budge Budge to Bauria to Sankrail through eastern side of KMA with tunnel under/bridge over river Hoogly
76 2 152
Central Govt./ Ministry of Railway
Conversion of Chitpur - Cossipur, Majherhat - Kalighat yard to new passenger terminal
50 (Lumpsum)
Central Govt./ Ministry of Railway
Extension of railway line from Kalyani Simanta to River Hooghly
2 2 4
Central Govt./ Ministry of Railway
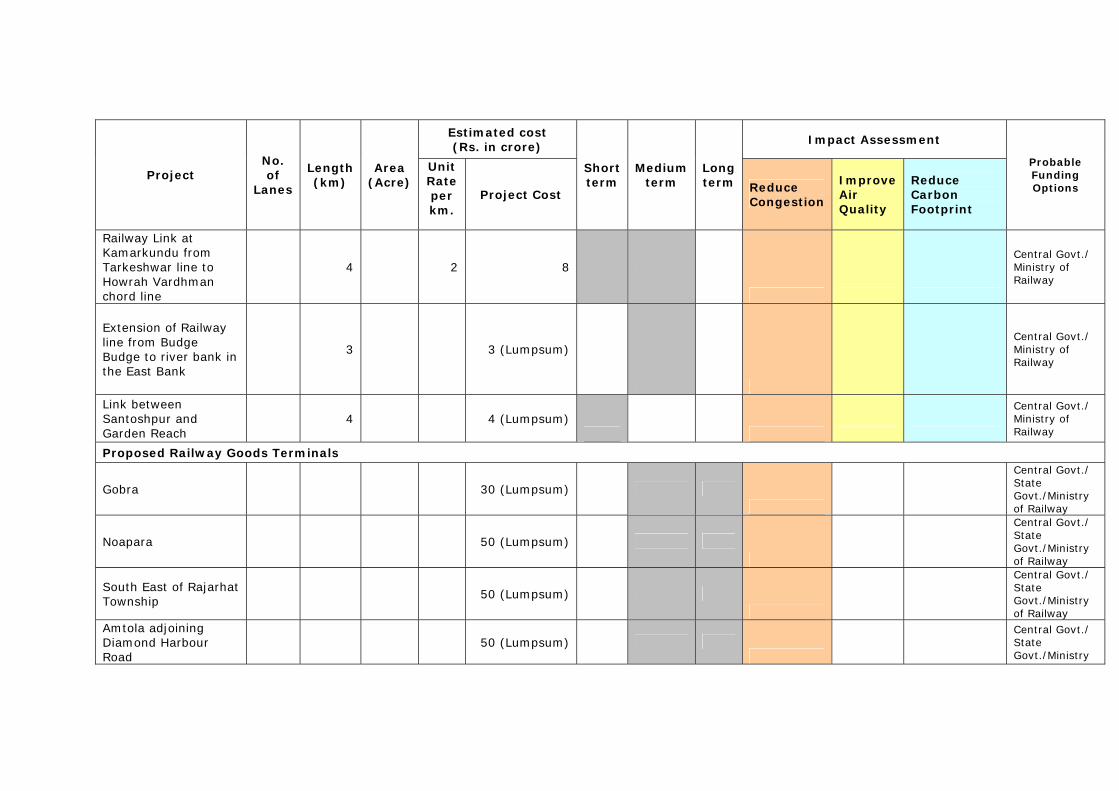
Estimated cost (Rs. in crore)
Impact Assessment
Project No. of
Lanes
Length (km)
Area (Acre)
Unit Rate per km.
Project Cost
Short term
Medium term
Long term Reduce
Congestion
Improve Air Quality
Reduce Carbon Footprint
Probable Funding Options
Railway Link at Kamarkundu from Tarkeshwar line to Howrah Vardhman chord line
4 2 8
Central Govt./ Ministry of Railway
Extension of Railway line from Budge Budge to river bank in the East Bank
3 3 (Lumpsum)
Central Govt./ Ministry of Railway
Link between Santoshpur and Garden Reach
4 4 (Lumpsum)
Central Govt./ Ministry of Railway
Proposed Railway Goods Terminals
Gobra 30 (Lumpsum)
Central Govt./ State Govt./Ministry of Railway
Noapara 50 (Lumpsum)
Central Govt./ State Govt./Ministry of Railway
South East of Rajarhat Township
50 (Lumpsum)
Central Govt./ State Govt./Ministry of Railway
Amtola adjoining Diamond Harbour Road
50 (Lumpsum)
Central Govt./ State Govt./Ministry
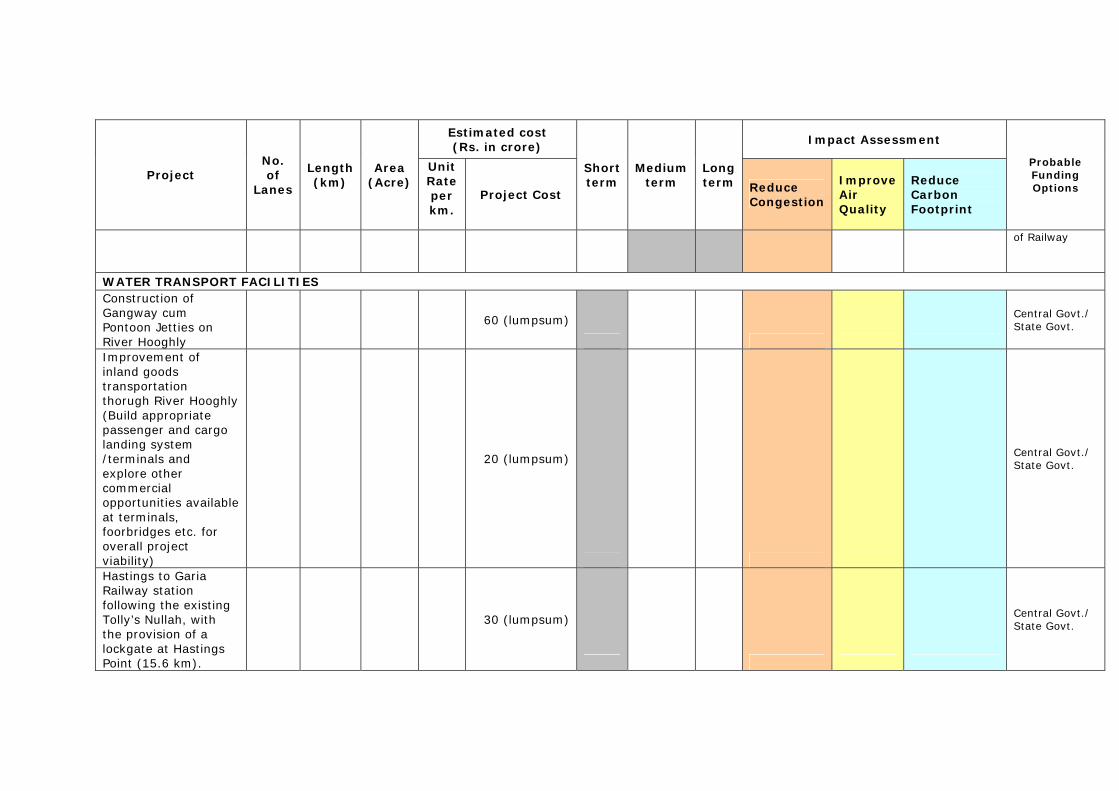
Estimated cost (Rs. in crore)
Impact Assessment
Project No. of
Lanes
Length (km)
Area (Acre)
Unit Rate per km.
Project Cost
Short term
Medium term
Long term Reduce
Congestion
Improve Air Quality
Reduce Carbon Footprint
Probable Funding Options
of Railway
WATER TRANSPORT FACILITIES Construction of Gangway cum Pontoon Jetties on River Hooghly
60 (lumpsum)
Central Govt./ State Govt.
Improvement of inland goods transportation thorugh River Hooghly (Build appropriate passenger and cargo landing system /terminals and explore other commercial opportunities available at terminals, foorbridges etc. for overall project viability)
20 (lumpsum)
Central Govt./ State Govt.
Hastings to Garia Railway station following the existing Tolly’s Nullah, with the provision of a lockgate at Hastings Point (15.6 km).
30 (lumpsum)
Central Govt./ State Govt.
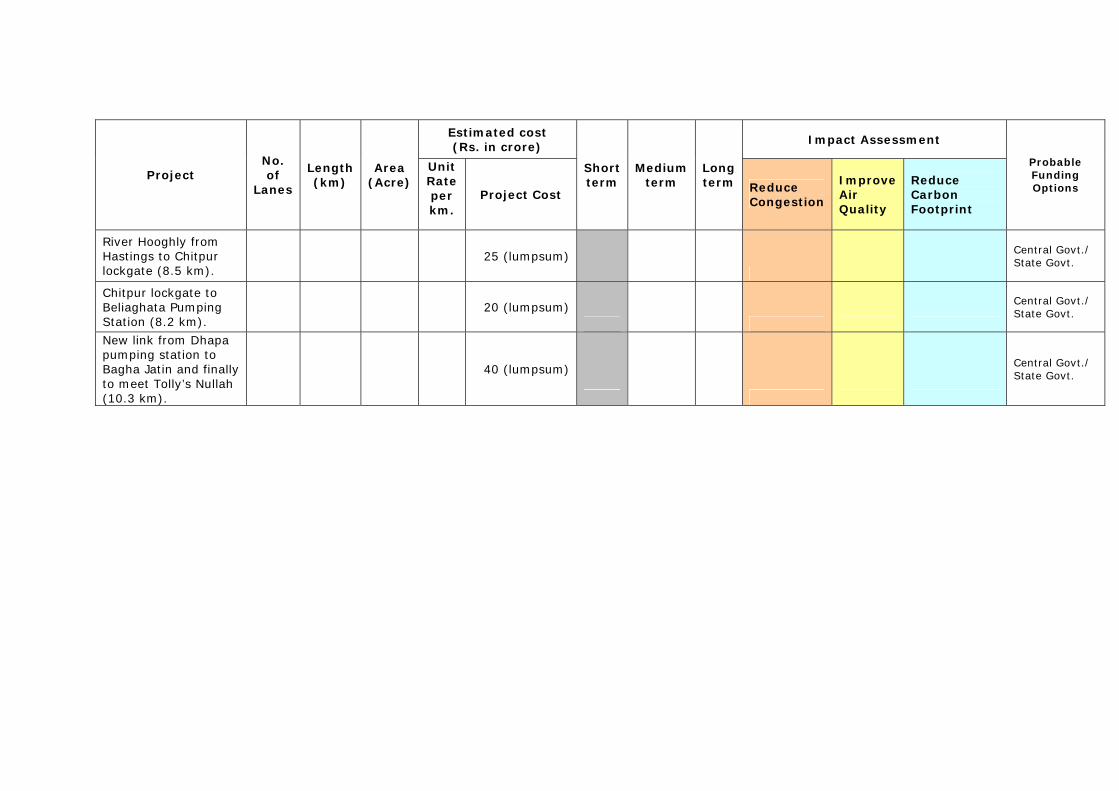
Estimated cost (Rs. in crore)
Impact Assessment
Project No. of
Lanes
Length (km)
Area (Acre)
Unit Rate per km.
Project Cost
Short term
Medium term
Long term Reduce
Congestion
Improve Air Quality
Reduce Carbon Footprint
Probable Funding Options
River Hooghly from Hastings to Chitpur lockgate (8.5 km).
25 (lumpsum)
Central Govt./ State Govt.
Chitpur lockgate to Beliaghata Pumping Station (8.2 km).
20 (lumpsum)
Central Govt./ State Govt.
New link from Dhapa pumping station to Bagha Jatin and finally to meet Tolly’s Nullah (10.3 km).
40 (lumpsum)
Central Govt./ State Govt.
ANNEXURES
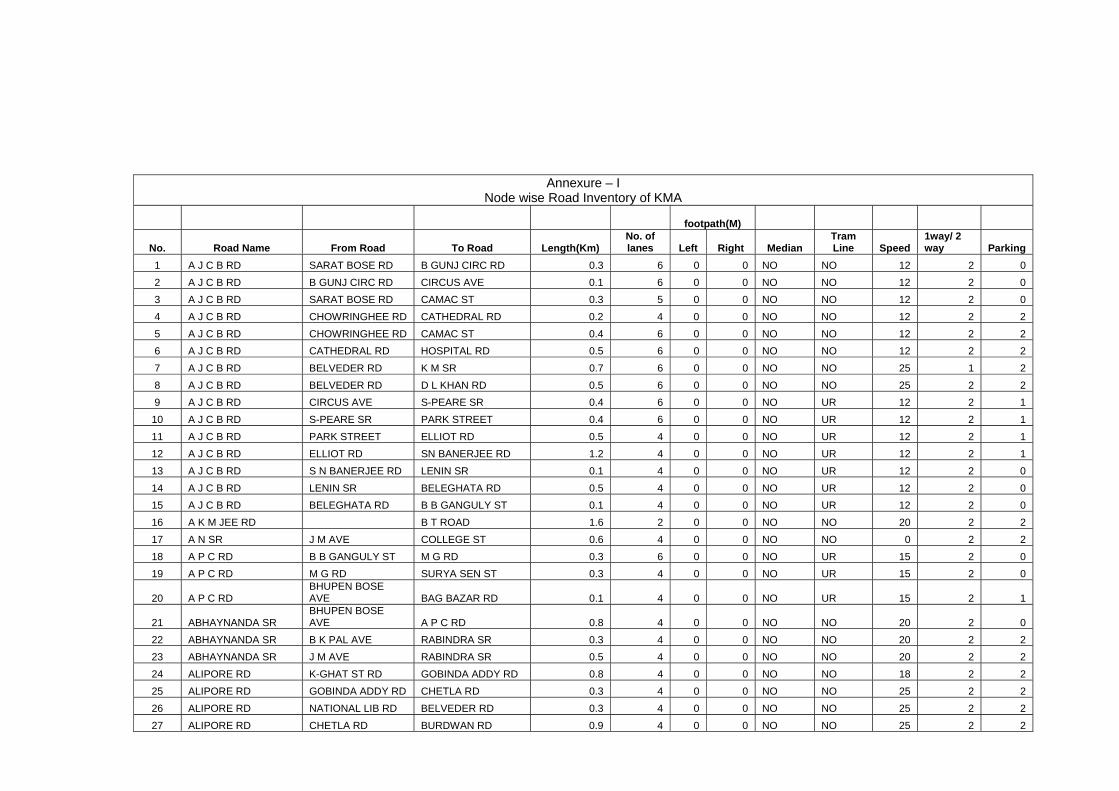
Annexure – I Node wise Road Inventory of KMA
footpath(M)
No. Road Name From Road To Road Length(Km) No. of lanes Left Right Median
Tram Line Speed
1way/ 2 way Parking
1 A J C B RD SARAT BOSE RD B GUNJ CIRC RD 0.3 6 0 0 NO NO 12 2 0 2 A J C B RD B GUNJ CIRC RD CIRCUS AVE 0.1 6 0 0 NO NO 12 2 0 3 A J C B RD SARAT BOSE RD CAMAC ST 0.3 5 0 0 NO NO 12 2 0 4 A J C B RD CHOWRINGHEE RD CATHEDRAL RD 0.2 4 0 0 NO NO 12 2 2 5 A J C B RD CHOWRINGHEE RD CAMAC ST 0.4 6 0 0 NO NO 12 2 2 6 A J C B RD CATHEDRAL RD HOSPITAL RD 0.5 6 0 0 NO NO 12 2 2 7 A J C B RD BELVEDER RD K M SR 0.7 6 0 0 NO NO 25 1 2 8 A J C B RD BELVEDER RD D L KHAN RD 0.5 6 0 0 NO NO 25 2 2 9 A J C B RD CIRCUS AVE S-PEARE SR 0.4 6 0 0 NO UR 12 2 1
10 A J C B RD S-PEARE SR PARK STREET 0.4 6 0 0 NO UR 12 2 1 11 A J C B RD PARK STREET ELLIOT RD 0.5 4 0 0 NO UR 12 2 1 12 A J C B RD ELLIOT RD SN BANERJEE RD 1.2 4 0 0 NO UR 12 2 1 13 A J C B RD S N BANERJEE RD LENIN SR 0.1 4 0 0 NO UR 12 2 0 14 A J C B RD LENIN SR BELEGHATA RD 0.5 4 0 0 NO UR 12 2 0 15 A J C B RD BELEGHATA RD B B GANGULY ST 0.1 4 0 0 NO UR 12 2 0 16 A K M JEE RD B T ROAD 1.6 2 0 0 NO NO 20 2 2 17 A N SR J M AVE COLLEGE ST 0.6 4 0 0 NO NO 0 2 2 18 A P C RD B B GANGULY ST M G RD 0.3 6 0 0 NO UR 15 2 0 19 A P C RD M G RD SURYA SEN ST 0.3 4 0 0 NO UR 15 2 0
20 A P C RD BHUPEN BOSE AVE BAG BAZAR RD 0.1 4 0 0 NO UR 15 2 1
21 ABHAYNANDA SR BHUPEN BOSE AVE A P C RD 0.8 4 0 0 NO NO 20 2 0
22 ABHAYNANDA SR B K PAL AVE RABINDRA SR 0.3 4 0 0 NO NO 20 2 2 23 ABHAYNANDA SR J M AVE RABINDRA SR 0.5 4 0 0 NO NO 20 2 2 24 ALIPORE RD K-GHAT ST RD GOBINDA ADDY RD 0.8 4 0 0 NO NO 18 2 2 25 ALIPORE RD GOBINDA ADDY RD CHETLA RD 0.3 4 0 0 NO NO 25 2 2 26 ALIPORE RD NATIONAL LIB RD BELVEDER RD 0.3 4 0 0 NO NO 25 2 2 27 ALIPORE RD CHETLA RD BURDWAN RD 0.9 4 0 0 NO NO 25 2 2
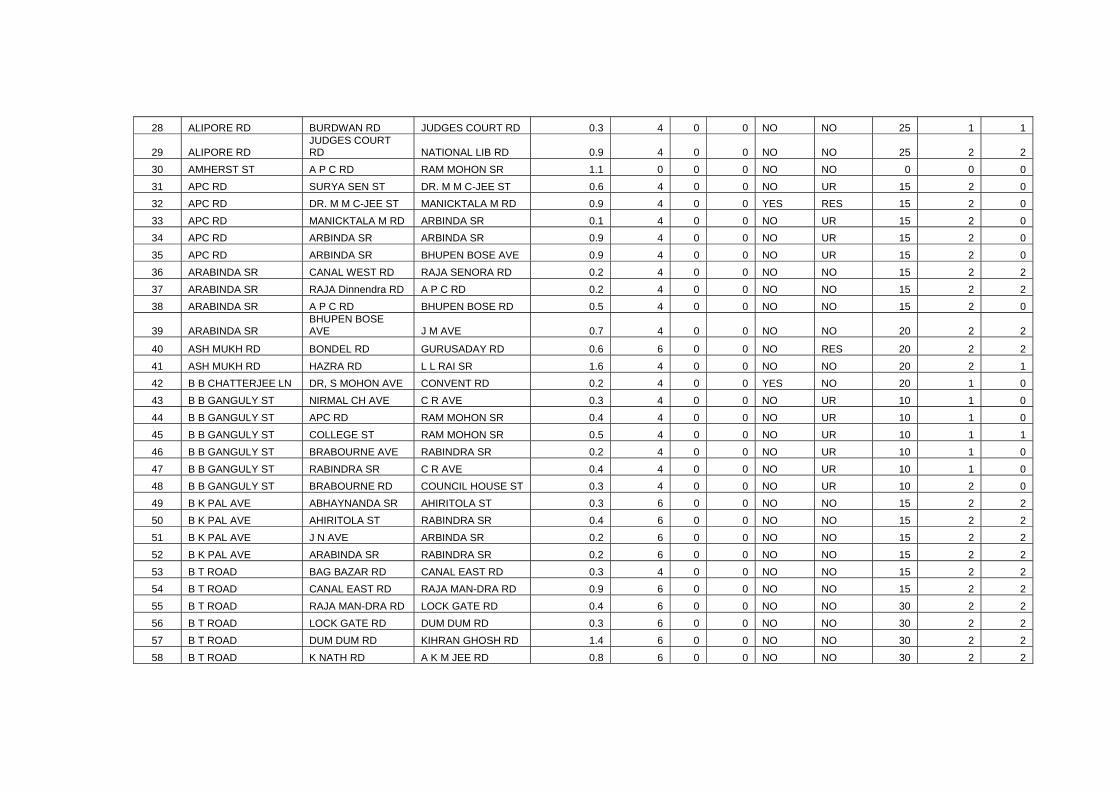
28 ALIPORE RD BURDWAN RD JUDGES COURT RD 0.3 4 0 0 NO NO 25 1 1
29 ALIPORE RD JUDGES COURT RD NATIONAL LIB RD 0.9 4 0 0 NO NO 25 2 2
30 AMHERST ST A P C RD RAM MOHON SR 1.1 0 0 0 NO NO 0 0 0 31 APC RD SURYA SEN ST DR. M M C-JEE ST 0.6 4 0 0 NO UR 15 2 0 32 APC RD DR. M M C-JEE ST MANICKTALA M RD 0.9 4 0 0 YES RES 15 2 0 33 APC RD MANICKTALA M RD ARBINDA SR 0.1 4 0 0 NO UR 15 2 0 34 APC RD ARBINDA SR ARBINDA SR 0.9 4 0 0 NO UR 15 2 0 35 APC RD ARBINDA SR BHUPEN BOSE AVE 0.9 4 0 0 NO UR 15 2 0 36 ARABINDA SR CANAL WEST RD RAJA SENORA RD 0.2 4 0 0 NO NO 15 2 2 37 ARABINDA SR RAJA Dinnendra RD A P C RD 0.2 4 0 0 NO NO 15 2 2 38 ARABINDA SR A P C RD BHUPEN BOSE RD 0.5 4 0 0 NO NO 15 2 0
39 ARABINDA SR BHUPEN BOSE AVE J M AVE 0.7 4 0 0 NO NO 20 2 2
40 ASH MUKH RD BONDEL RD GURUSADAY RD 0.6 6 0 0 NO RES 20 2 2
41 ASH MUKH RD HAZRA RD L L RAI SR 1.6 4 0 0 NO NO 20 2 1 42 B B CHATTERJEE LN DR, S MOHON AVE CONVENT RD 0.2 4 0 0 YES NO 20 1 0 43 B B GANGULY ST NIRMAL CH AVE C R AVE 0.3 4 0 0 NO UR 10 1 0 44 B B GANGULY ST APC RD RAM MOHON SR 0.4 4 0 0 NO UR 10 1 0 45 B B GANGULY ST COLLEGE ST RAM MOHON SR 0.5 4 0 0 NO UR 10 1 1 46 B B GANGULY ST BRABOURNE AVE RABINDRA SR 0.2 4 0 0 NO UR 10 1 0 47 B B GANGULY ST RABINDRA SR C R AVE 0.4 4 0 0 NO UR 10 1 0 48 B B GANGULY ST BRABOURNE RD COUNCIL HOUSE ST 0.3 4 0 0 NO UR 10 2 0 49 B K PAL AVE ABHAYNANDA SR AHIRITOLA ST 0.3 6 0 0 NO NO 15 2 2 50 B K PAL AVE AHIRITOLA ST RABINDRA SR 0.4 6 0 0 NO NO 15 2 2 51 B K PAL AVE J N AVE ARBINDA SR 0.2 6 0 0 NO NO 15 2 2 52 B K PAL AVE ARABINDA SR RABINDRA SR 0.2 6 0 0 NO NO 15 2 2 53 B T ROAD BAG BAZAR RD CANAL EAST RD 0.3 4 0 0 NO NO 15 2 2 54 B T ROAD CANAL EAST RD RAJA MAN-DRA RD 0.9 6 0 0 NO NO 15 2 2 55 B T ROAD RAJA MAN-DRA RD LOCK GATE RD 0.4 6 0 0 NO NO 30 2 2 56 B T ROAD LOCK GATE RD DUM DUM RD 0.3 6 0 0 NO NO 30 2 2 57 B T ROAD DUM DUM RD KIHRAN GHOSH RD 1.4 6 0 0 NO NO 30 2 2 58 B T ROAD K NATH RD A K M JEE RD 0.8 6 0 0 NO NO 30 2 2
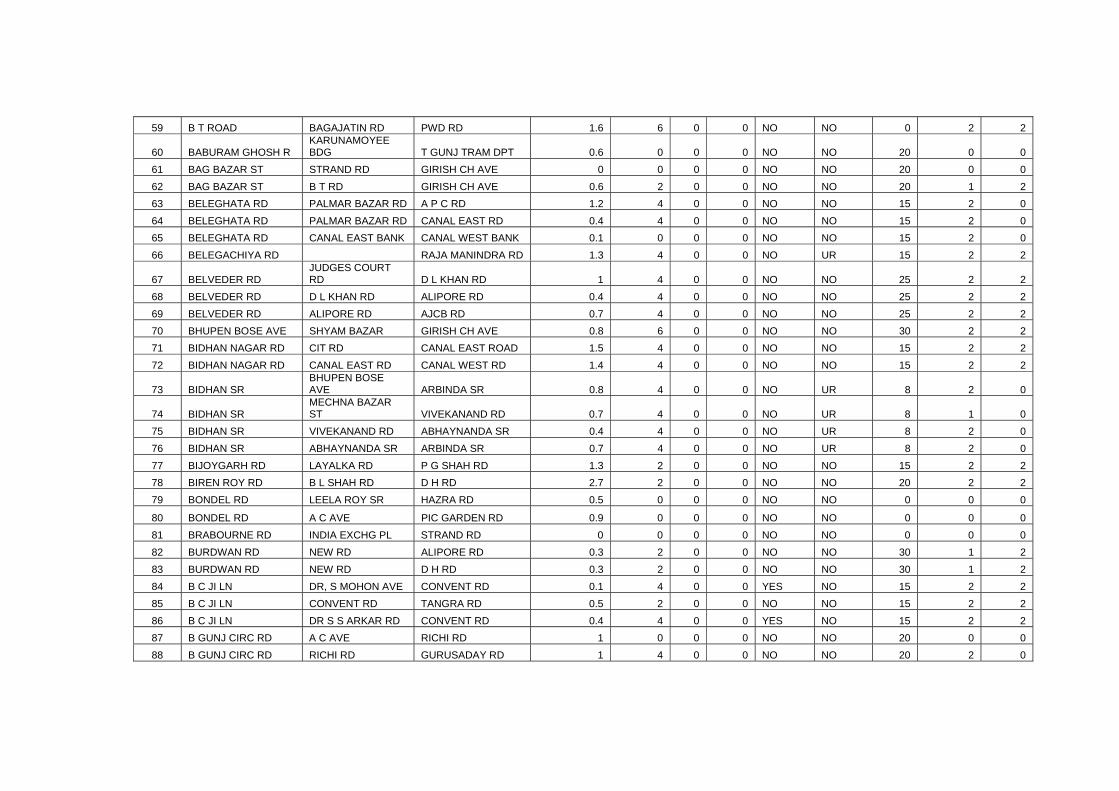
59 B T ROAD BAGAJATIN RD PWD RD 1.6 6 0 0 NO NO 0 2 2
60 BABURAM GHOSH R KARUNAMOYEE BDG T GUNJ TRAM DPT 0.6 0 0 0 NO NO 20 0 0
61 BAG BAZAR ST STRAND RD GIRISH CH AVE 0 0 0 0 NO NO 20 0 0 62 BAG BAZAR ST B T RD GIRISH CH AVE 0.6 2 0 0 NO NO 20 1 2 63 BELEGHATA RD PALMAR BAZAR RD A P C RD 1.2 4 0 0 NO NO 15 2 0 64 BELEGHATA RD PALMAR BAZAR RD CANAL EAST RD 0.4 4 0 0 NO NO 15 2 0 65 BELEGHATA RD CANAL EAST BANK CANAL WEST BANK 0.1 0 0 0 NO NO 15 2 0 66 BELEGACHIYA RD RAJA MANINDRA RD 1.3 4 0 0 NO UR 15 2 2
67 BELVEDER RD JUDGES COURT RD D L KHAN RD 1 4 0 0 NO NO 25 2 2
68 BELVEDER RD D L KHAN RD ALIPORE RD 0.4 4 0 0 NO NO 25 2 2 69 BELVEDER RD ALIPORE RD AJCB RD 0.7 4 0 0 NO NO 25 2 2 70 BHUPEN BOSE AVE SHYAM BAZAR GIRISH CH AVE 0.8 6 0 0 NO NO 30 2 2 71 BIDHAN NAGAR RD CIT RD CANAL EAST ROAD 1.5 4 0 0 NO NO 15 2 2 72 BIDHAN NAGAR RD CANAL EAST RD CANAL WEST RD 1.4 4 0 0 NO NO 15 2 2
73 BIDHAN SR BHUPEN BOSE AVE ARBINDA SR 0.8 4 0 0 NO UR 8 2 0
74 BIDHAN SR MECHNA BAZAR ST VIVEKANAND RD 0.7 4 0 0 NO UR 8 1 0
75 BIDHAN SR VIVEKANAND RD ABHAYNANDA SR 0.4 4 0 0 NO UR 8 2 0 76 BIDHAN SR ABHAYNANDA SR ARBINDA SR 0.7 4 0 0 NO UR 8 2 0 77 BIJOYGARH RD LAYALKA RD P G SHAH RD 1.3 2 0 0 NO NO 15 2 2 78 BIREN ROY RD B L SHAH RD D H RD 2.7 2 0 0 NO NO 20 2 2 79 BONDEL RD LEELA ROY SR HAZRA RD 0.5 0 0 0 NO NO 0 0 0
80 BONDEL RD A C AVE PIC GARDEN RD 0.9 0 0 0 NO NO 0 0 0 81 BRABOURNE RD INDIA EXCHG PL STRAND RD 0 0 0 0 NO NO 0 0 0 82 BURDWAN RD NEW RD ALIPORE RD 0.3 2 0 0 NO NO 30 1 2 83 BURDWAN RD NEW RD D H RD 0.3 2 0 0 NO NO 30 1 2 84 B C JI LN DR, S MOHON AVE CONVENT RD 0.1 4 0 0 YES NO 15 2 2 85 B C JI LN CONVENT RD TANGRA RD 0.5 2 0 0 NO NO 15 2 2 86 B C JI LN DR S S ARKAR RD CONVENT RD 0.4 4 0 0 YES NO 15 2 2 87 B GUNJ CIRC RD A C AVE RICHI RD 1 0 0 0 NO NO 20 0 0 88 B GUNJ CIRC RD RICHI RD GURUSADAY RD 1 4 0 0 NO NO 20 2 0
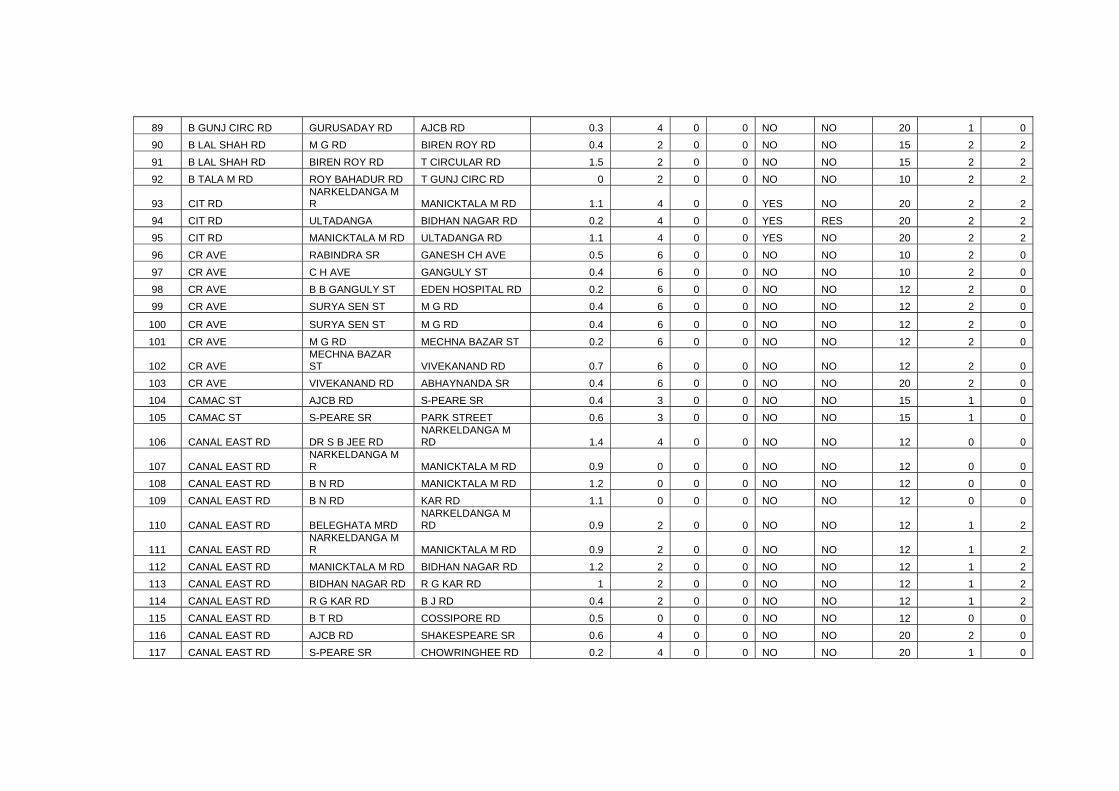
89 B GUNJ CIRC RD GURUSADAY RD AJCB RD 0.3 4 0 0 NO NO 20 1 0 90 B LAL SHAH RD M G RD BIREN ROY RD 0.4 2 0 0 NO NO 15 2 2 91 B LAL SHAH RD BIREN ROY RD T CIRCULAR RD 1.5 2 0 0 NO NO 15 2 2 92 B TALA M RD ROY BAHADUR RD T GUNJ CIRC RD 0 2 0 0 NO NO 10 2 2
93 CIT RD NARKELDANGA M R MANICKTALA M RD 1.1 4 0 0 YES NO 20 2 2
94 CIT RD ULTADANGA BIDHAN NAGAR RD 0.2 4 0 0 YES RES 20 2 2 95 CIT RD MANICKTALA M RD ULTADANGA RD 1.1 4 0 0 YES NO 20 2 2 96 CR AVE RABINDRA SR GANESH CH AVE 0.5 6 0 0 NO NO 10 2 0 97 CR AVE C H AVE GANGULY ST 0.4 6 0 0 NO NO 10 2 0 98 CR AVE B B GANGULY ST EDEN HOSPITAL RD 0.2 6 0 0 NO NO 12 2 0 99 CR AVE SURYA SEN ST M G RD 0.4 6 0 0 NO NO 12 2 0
100 CR AVE SURYA SEN ST M G RD 0.4 6 0 0 NO NO 12 2 0
101 CR AVE M G RD MECHNA BAZAR ST 0.2 6 0 0 NO NO 12 2 0
102 CR AVE MECHNA BAZAR ST VIVEKANAND RD 0.7 6 0 0 NO NO 12 2 0
103 CR AVE VIVEKANAND RD ABHAYNANDA SR 0.4 6 0 0 NO NO 20 2 0 104 CAMAC ST AJCB RD S-PEARE SR 0.4 3 0 0 NO NO 15 1 0 105 CAMAC ST S-PEARE SR PARK STREET 0.6 3 0 0 NO NO 15 1 0
106 CANAL EAST RD DR S B JEE RD NARKELDANGA M RD 1.4 4 0 0 NO NO 12 0 0
107 CANAL EAST RD NARKELDANGA M R MANICKTALA M RD 0.9 0 0 0 NO NO 12 0 0
108 CANAL EAST RD B N RD MANICKTALA M RD 1.2 0 0 0 NO NO 12 0 0 109 CANAL EAST RD B N RD KAR RD 1.1 0 0 0 NO NO 12 0 0
110 CANAL EAST RD BELEGHATA MRD NARKELDANGA M RD 0.9 2 0 0 NO NO 12 1 2
111 CANAL EAST RD NARKELDANGA M R MANICKTALA M RD 0.9 2 0 0 NO NO 12 1 2
112 CANAL EAST RD MANICKTALA M RD BIDHAN NAGAR RD 1.2 2 0 0 NO NO 12 1 2 113 CANAL EAST RD BIDHAN NAGAR RD R G KAR RD 1 2 0 0 NO NO 12 1 2 114 CANAL EAST RD R G KAR RD B J RD 0.4 2 0 0 NO NO 12 1 2 115 CANAL EAST RD B T RD COSSIPORE RD 0.5 0 0 0 NO NO 12 0 0 116 CANAL EAST RD AJCB RD SHAKESPEARE SR 0.6 4 0 0 NO NO 20 2 0 117 CANAL EAST RD S-PEARE SR CHOWRINGHEE RD 0.2 4 0 0 NO NO 20 1 0
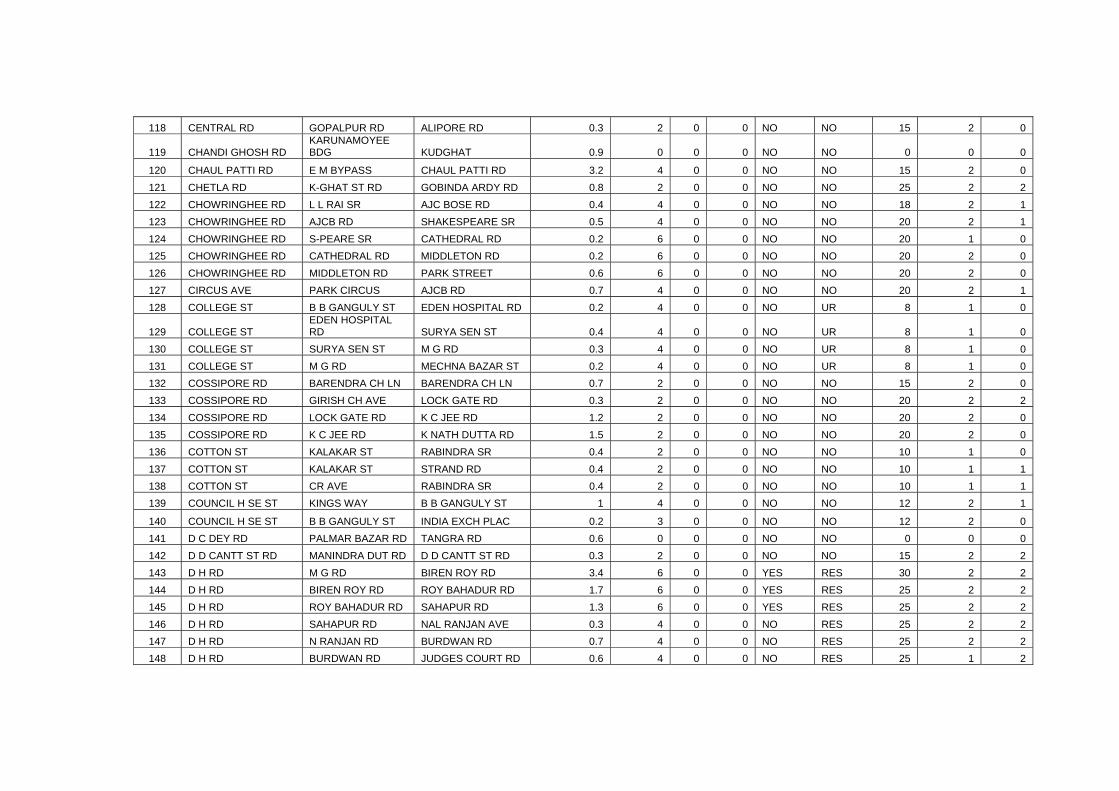
118 CENTRAL RD GOPALPUR RD ALIPORE RD 0.3 2 0 0 NO NO 15 2 0
119 CHANDI GHOSH RD KARUNAMOYEE BDG KUDGHAT 0.9 0 0 0 NO NO 0 0 0
120 CHAUL PATTI RD E M BYPASS CHAUL PATTI RD 3.2 4 0 0 NO NO 15 2 0 121 CHETLA RD K-GHAT ST RD GOBINDA ARDY RD 0.8 2 0 0 NO NO 25 2 2 122 CHOWRINGHEE RD L L RAI SR AJC BOSE RD 0.4 4 0 0 NO NO 18 2 1 123 CHOWRINGHEE RD AJCB RD SHAKESPEARE SR 0.5 4 0 0 NO NO 20 2 1 124 CHOWRINGHEE RD S-PEARE SR CATHEDRAL RD 0.2 6 0 0 NO NO 20 1 0 125 CHOWRINGHEE RD CATHEDRAL RD MIDDLETON RD 0.2 6 0 0 NO NO 20 2 0 126 CHOWRINGHEE RD MIDDLETON RD PARK STREET 0.6 6 0 0 NO NO 20 2 0 127 CIRCUS AVE PARK CIRCUS AJCB RD 0.7 4 0 0 NO NO 20 2 1 128 COLLEGE ST B B GANGULY ST EDEN HOSPITAL RD 0.2 4 0 0 NO UR 8 1 0
129 COLLEGE ST EDEN HOSPITAL RD SURYA SEN ST 0.4 4 0 0 NO UR 8 1 0
130 COLLEGE ST SURYA SEN ST M G RD 0.3 4 0 0 NO UR 8 1 0 131 COLLEGE ST M G RD MECHNA BAZAR ST 0.2 4 0 0 NO UR 8 1 0 132 COSSIPORE RD BARENDRA CH LN BARENDRA CH LN 0.7 2 0 0 NO NO 15 2 0 133 COSSIPORE RD GIRISH CH AVE LOCK GATE RD 0.3 2 0 0 NO NO 20 2 2 134 COSSIPORE RD LOCK GATE RD K C JEE RD 1.2 2 0 0 NO NO 20 2 0 135 COSSIPORE RD K C JEE RD K NATH DUTTA RD 1.5 2 0 0 NO NO 20 2 0 136 COTTON ST KALAKAR ST RABINDRA SR 0.4 2 0 0 NO NO 10 1 0 137 COTTON ST KALAKAR ST STRAND RD 0.4 2 0 0 NO NO 10 1 1 138 COTTON ST CR AVE RABINDRA SR 0.4 2 0 0 NO NO 10 1 1 139 COUNCIL H SE ST KINGS WAY B B GANGULY ST 1 4 0 0 NO NO 12 2 1
140 COUNCIL H SE ST B B GANGULY ST INDIA EXCH PLAC 0.2 3 0 0 NO NO 12 2 0 141 D C DEY RD PALMAR BAZAR RD TANGRA RD 0.6 0 0 0 NO NO 0 0 0 142 D D CANTT ST RD MANINDRA DUT RD D D CANTT ST RD 0.3 2 0 0 NO NO 15 2 2 143 D H RD M G RD BIREN ROY RD 3.4 6 0 0 YES RES 30 2 2 144 D H RD BIREN ROY RD ROY BAHADUR RD 1.7 6 0 0 YES RES 25 2 2 145 D H RD ROY BAHADUR RD SAHAPUR RD 1.3 6 0 0 YES RES 25 2 2 146 D H RD SAHAPUR RD NAL RANJAN AVE 0.3 4 0 0 NO RES 25 2 2 147 D H RD N RANJAN RD BURDWAN RD 0.7 4 0 0 NO RES 25 2 2 148 D H RD BURDWAN RD JUDGES COURT RD 0.6 4 0 0 NO RES 25 1 2
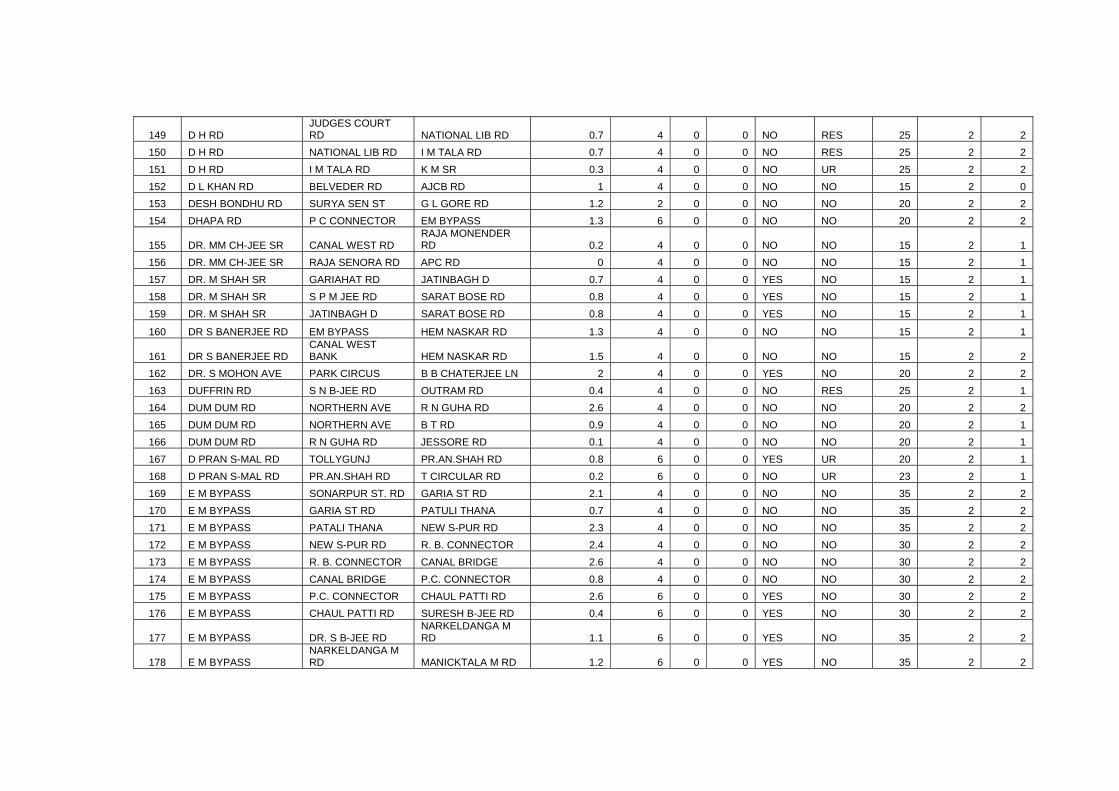
149 D H RD JUDGES COURT RD NATIONAL LIB RD 0.7 4 0 0 NO RES 25 2 2
150 D H RD NATIONAL LIB RD I M TALA RD 0.7 4 0 0 NO RES 25 2 2 151 D H RD I M TALA RD K M SR 0.3 4 0 0 NO UR 25 2 2 152 D L KHAN RD BELVEDER RD AJCB RD 1 4 0 0 NO NO 15 2 0 153 DESH BONDHU RD SURYA SEN ST G L GORE RD 1.2 2 0 0 NO NO 20 2 2 154 DHAPA RD P C CONNECTOR EM BYPASS 1.3 6 0 0 NO NO 20 2 2
155 DR. MM CH-JEE SR CANAL WEST RD RAJA MONENDER RD 0.2 4 0 0 NO NO 15 2 1
156 DR. MM CH-JEE SR RAJA SENORA RD APC RD 0 4 0 0 NO NO 15 2 1 157 DR. M SHAH SR GARIAHAT RD JATINBAGH D 0.7 4 0 0 YES NO 15 2 1 158 DR. M SHAH SR S P M JEE RD SARAT BOSE RD 0.8 4 0 0 YES NO 15 2 1 159 DR. M SHAH SR JATINBAGH D SARAT BOSE RD 0.8 4 0 0 YES NO 15 2 1
160 DR S BANERJEE RD EM BYPASS HEM NASKAR RD 1.3 4 0 0 NO NO 15 2 1
161 DR S BANERJEE RD CANAL WEST BANK HEM NASKAR RD 1.5 4 0 0 NO NO 15 2 2
162 DR. S MOHON AVE PARK CIRCUS B B CHATERJEE LN 2 4 0 0 YES NO 20 2 2 163 DUFFRIN RD S N B-JEE RD OUTRAM RD 0.4 4 0 0 NO RES 25 2 1 164 DUM DUM RD NORTHERN AVE R N GUHA RD 2.6 4 0 0 NO NO 20 2 2 165 DUM DUM RD NORTHERN AVE B T RD 0.9 4 0 0 NO NO 20 2 1 166 DUM DUM RD R N GUHA RD JESSORE RD 0.1 4 0 0 NO NO 20 2 1 167 D PRAN S-MAL RD TOLLYGUNJ PR.AN.SHAH RD 0.8 6 0 0 YES UR 20 2 1 168 D PRAN S-MAL RD PR.AN.SHAH RD T CIRCULAR RD 0.2 6 0 0 NO UR 23 2 1 169 E M BYPASS SONARPUR ST. RD GARIA ST RD 2.1 4 0 0 NO NO 35 2 2 170 E M BYPASS GARIA ST RD PATULI THANA 0.7 4 0 0 NO NO 35 2 2 171 E M BYPASS PATALI THANA NEW S-PUR RD 2.3 4 0 0 NO NO 35 2 2 172 E M BYPASS NEW S-PUR RD R. B. CONNECTOR 2.4 4 0 0 NO NO 30 2 2 173 E M BYPASS R. B. CONNECTOR CANAL BRIDGE 2.6 4 0 0 NO NO 30 2 2 174 E M BYPASS CANAL BRIDGE P.C. CONNECTOR 0.8 4 0 0 NO NO 30 2 2 175 E M BYPASS P.C. CONNECTOR CHAUL PATTI RD 2.6 6 0 0 YES NO 30 2 2 176 E M BYPASS CHAUL PATTI RD SURESH B-JEE RD 0.4 6 0 0 YES NO 30 2 2
177 E M BYPASS DR. S B-JEE RD NARKELDANGA M RD 1.1 6 0 0 YES NO 35 2 2
178 E M BYPASS NARKELDANGA M RD MANICKTALA M RD 1.2 6 0 0 YES NO 35 2 2
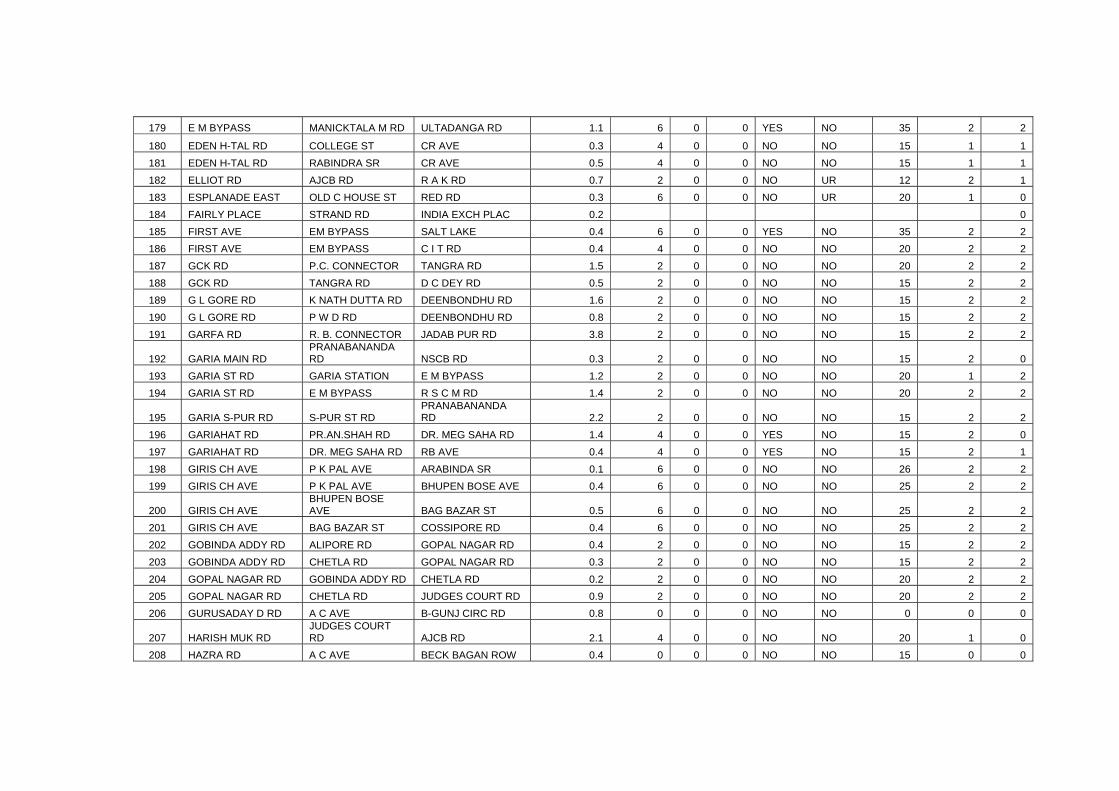
179 E M BYPASS MANICKTALA M RD ULTADANGA RD 1.1 6 0 0 YES NO 35 2 2
180 EDEN H-TAL RD COLLEGE ST CR AVE 0.3 4 0 0 NO NO 15 1 1 181 EDEN H-TAL RD RABINDRA SR CR AVE 0.5 4 0 0 NO NO 15 1 1 182 ELLIOT RD AJCB RD R A K RD 0.7 2 0 0 NO UR 12 2 1 183 ESPLANADE EAST OLD C HOUSE ST RED RD 0.3 6 0 0 NO UR 20 1 0 184 FAIRLY PLACE STRAND RD INDIA EXCH PLAC 0.2 0 185 FIRST AVE EM BYPASS SALT LAKE 0.4 6 0 0 YES NO 35 2 2 186 FIRST AVE EM BYPASS C I T RD 0.4 4 0 0 NO NO 20 2 2 187 GCK RD P.C. CONNECTOR TANGRA RD 1.5 2 0 0 NO NO 20 2 2 188 GCK RD TANGRA RD D C DEY RD 0.5 2 0 0 NO NO 15 2 2 189 G L GORE RD K NATH DUTTA RD DEENBONDHU RD 1.6 2 0 0 NO NO 15 2 2 190 G L GORE RD P W D RD DEENBONDHU RD 0.8 2 0 0 NO NO 15 2 2 191 GARFA RD R. B. CONNECTOR JADAB PUR RD 3.8 2 0 0 NO NO 15 2 2
192 GARIA MAIN RD PRANABANANDA RD NSCB RD 0.3 2 0 0 NO NO 15 2 0
193 GARIA ST RD GARIA STATION E M BYPASS 1.2 2 0 0 NO NO 20 1 2 194 GARIA ST RD E M BYPASS R S C M RD 1.4 2 0 0 NO NO 20 2 2
195 GARIA S-PUR RD S-PUR ST RD PRANABANANDA RD 2.2 2 0 0 NO NO 15 2 2
196 GARIAHAT RD PR.AN.SHAH RD DR. MEG SAHA RD 1.4 4 0 0 YES NO 15 2 0 197 GARIAHAT RD DR. MEG SAHA RD RB AVE 0.4 4 0 0 YES NO 15 2 1 198 GIRIS CH AVE P K PAL AVE ARABINDA SR 0.1 6 0 0 NO NO 26 2 2 199 GIRIS CH AVE P K PAL AVE BHUPEN BOSE AVE 0.4 6 0 0 NO NO 25 2 2
200 GIRIS CH AVE BHUPEN BOSE AVE BAG BAZAR ST 0.5 6 0 0 NO NO 25 2 2
201 GIRIS CH AVE BAG BAZAR ST COSSIPORE RD 0.4 6 0 0 NO NO 25 2 2 202 GOBINDA ADDY RD ALIPORE RD GOPAL NAGAR RD 0.4 2 0 0 NO NO 15 2 2 203 GOBINDA ADDY RD CHETLA RD GOPAL NAGAR RD 0.3 2 0 0 NO NO 15 2 2 204 GOPAL NAGAR RD GOBINDA ADDY RD CHETLA RD 0.2 2 0 0 NO NO 20 2 2 205 GOPAL NAGAR RD CHETLA RD JUDGES COURT RD 0.9 2 0 0 NO NO 20 2 2 206 GURUSADAY D RD A C AVE B-GUNJ CIRC RD 0.8 0 0 0 NO NO 0 0 0
207 HARISH MUK RD JUDGES COURT RD AJCB RD 2.1 4 0 0 NO NO 20 1 0
208 HAZRA RD A C AVE BECK BAGAN ROW 0.4 0 0 0 NO NO 15 0 0
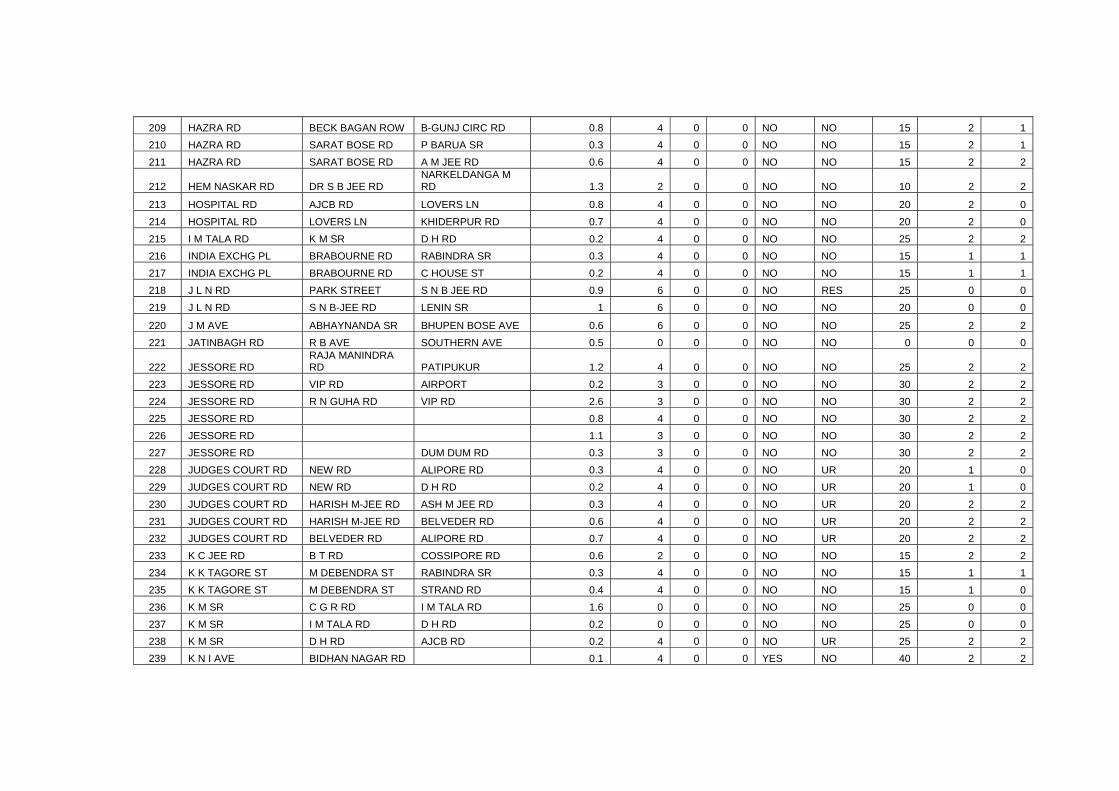
209 HAZRA RD BECK BAGAN ROW B-GUNJ CIRC RD 0.8 4 0 0 NO NO 15 2 1 210 HAZRA RD SARAT BOSE RD P BARUA SR 0.3 4 0 0 NO NO 15 2 1 211 HAZRA RD SARAT BOSE RD A M JEE RD 0.6 4 0 0 NO NO 15 2 2
212 HEM NASKAR RD DR S B JEE RD NARKELDANGA M RD 1.3 2 0 0 NO NO 10 2 2
213 HOSPITAL RD AJCB RD LOVERS LN 0.8 4 0 0 NO NO 20 2 0
214 HOSPITAL RD LOVERS LN KHIDERPUR RD 0.7 4 0 0 NO NO 20 2 0 215 I M TALA RD K M SR D H RD 0.2 4 0 0 NO NO 25 2 2 216 INDIA EXCHG PL BRABOURNE RD RABINDRA SR 0.3 4 0 0 NO NO 15 1 1 217 INDIA EXCHG PL BRABOURNE RD C HOUSE ST 0.2 4 0 0 NO NO 15 1 1 218 J L N RD PARK STREET S N B JEE RD 0.9 6 0 0 NO RES 25 0 0 219 J L N RD S N B-JEE RD LENIN SR 1 6 0 0 NO NO 20 0 0
220 J M AVE ABHAYNANDA SR BHUPEN BOSE AVE 0.6 6 0 0 NO NO 25 2 2 221 JATINBAGH RD R B AVE SOUTHERN AVE 0.5 0 0 0 NO NO 0 0 0
222 JESSORE RD RAJA MANINDRA RD PATIPUKUR 1.2 4 0 0 NO NO 25 2 2
223 JESSORE RD VIP RD AIRPORT 0.2 3 0 0 NO NO 30 2 2 224 JESSORE RD R N GUHA RD VIP RD 2.6 3 0 0 NO NO 30 2 2 225 JESSORE RD 0.8 4 0 0 NO NO 30 2 2 226 JESSORE RD 1.1 3 0 0 NO NO 30 2 2 227 JESSORE RD DUM DUM RD 0.3 3 0 0 NO NO 30 2 2 228 JUDGES COURT RD NEW RD ALIPORE RD 0.3 4 0 0 NO UR 20 1 0 229 JUDGES COURT RD NEW RD D H RD 0.2 4 0 0 NO UR 20 1 0 230 JUDGES COURT RD HARISH M-JEE RD ASH M JEE RD 0.3 4 0 0 NO UR 20 2 2 231 JUDGES COURT RD HARISH M-JEE RD BELVEDER RD 0.6 4 0 0 NO UR 20 2 2 232 JUDGES COURT RD BELVEDER RD ALIPORE RD 0.7 4 0 0 NO UR 20 2 2 233 K C JEE RD B T RD COSSIPORE RD 0.6 2 0 0 NO NO 15 2 2 234 K K TAGORE ST M DEBENDRA ST RABINDRA SR 0.3 4 0 0 NO NO 15 1 1 235 K K TAGORE ST M DEBENDRA ST STRAND RD 0.4 4 0 0 NO NO 15 1 0 236 K M SR C G R RD I M TALA RD 1.6 0 0 0 NO NO 25 0 0 237 K M SR I M TALA RD D H RD 0.2 0 0 0 NO NO 25 0 0 238 K M SR D H RD AJCB RD 0.2 4 0 0 NO UR 25 2 2 239 K N I AVE BIDHAN NAGAR RD 0.1 4 0 0 YES NO 40 2 2
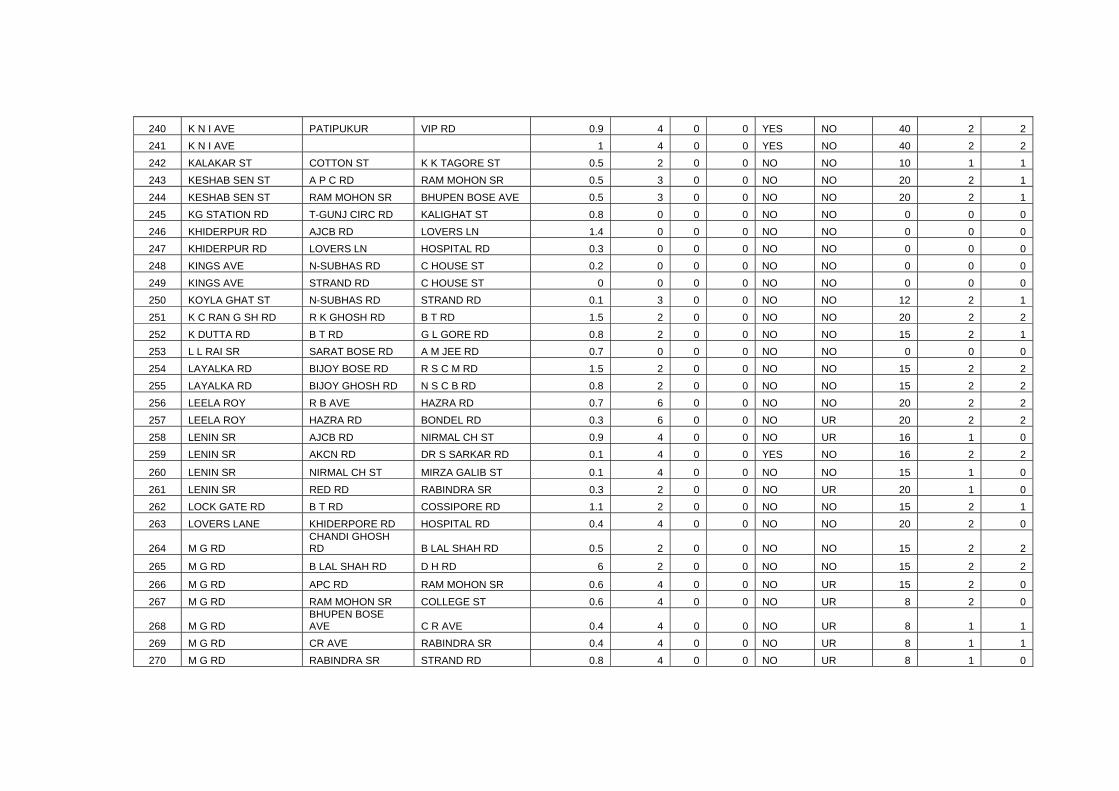
240 K N I AVE PATIPUKUR VIP RD 0.9 4 0 0 YES NO 40 2 2 241 K N I AVE 1 4 0 0 YES NO 40 2 2 242 KALAKAR ST COTTON ST K K TAGORE ST 0.5 2 0 0 NO NO 10 1 1 243 KESHAB SEN ST A P C RD RAM MOHON SR 0.5 3 0 0 NO NO 20 2 1 244 KESHAB SEN ST RAM MOHON SR BHUPEN BOSE AVE 0.5 3 0 0 NO NO 20 2 1 245 KG STATION RD T-GUNJ CIRC RD KALIGHAT ST 0.8 0 0 0 NO NO 0 0 0 246 KHIDERPUR RD AJCB RD LOVERS LN 1.4 0 0 0 NO NO 0 0 0 247 KHIDERPUR RD LOVERS LN HOSPITAL RD 0.3 0 0 0 NO NO 0 0 0 248 KINGS AVE N-SUBHAS RD C HOUSE ST 0.2 0 0 0 NO NO 0 0 0 249 KINGS AVE STRAND RD C HOUSE ST 0 0 0 0 NO NO 0 0 0 250 KOYLA GHAT ST N-SUBHAS RD STRAND RD 0.1 3 0 0 NO NO 12 2 1 251 K C RAN G SH RD R K GHOSH RD B T RD 1.5 2 0 0 NO NO 20 2 2 252 K DUTTA RD B T RD G L GORE RD 0.8 2 0 0 NO NO 15 2 1 253 L L RAI SR SARAT BOSE RD A M JEE RD 0.7 0 0 0 NO NO 0 0 0 254 LAYALKA RD BIJOY BOSE RD R S C M RD 1.5 2 0 0 NO NO 15 2 2 255 LAYALKA RD BIJOY GHOSH RD N S C B RD 0.8 2 0 0 NO NO 15 2 2 256 LEELA ROY R B AVE HAZRA RD 0.7 6 0 0 NO NO 20 2 2 257 LEELA ROY HAZRA RD BONDEL RD 0.3 6 0 0 NO UR 20 2 2 258 LENIN SR AJCB RD NIRMAL CH ST 0.9 4 0 0 NO UR 16 1 0 259 LENIN SR AKCN RD DR S SARKAR RD 0.1 4 0 0 YES NO 16 2 2
260 LENIN SR NIRMAL CH ST MIRZA GALIB ST 0.1 4 0 0 NO NO 15 1 0
261 LENIN SR RED RD RABINDRA SR 0.3 2 0 0 NO UR 20 1 0 262 LOCK GATE RD B T RD COSSIPORE RD 1.1 2 0 0 NO NO 15 2 1 263 LOVERS LANE KHIDERPORE RD HOSPITAL RD 0.4 4 0 0 NO NO 20 2 0
264 M G RD CHANDI GHOSH RD B LAL SHAH RD 0.5 2 0 0 NO NO 15 2 2
265 M G RD B LAL SHAH RD D H RD 6 2 0 0 NO NO 15 2 2
266 M G RD APC RD RAM MOHON SR 0.6 4 0 0 NO UR 15 2 0
267 M G RD RAM MOHON SR COLLEGE ST 0.6 4 0 0 NO UR 8 2 0
268 M G RD BHUPEN BOSE AVE C R AVE 0.4 4 0 0 NO UR 8 1 1
269 M G RD CR AVE RABINDRA SR 0.4 4 0 0 NO UR 8 1 1 270 M G RD RABINDRA SR STRAND RD 0.8 4 0 0 NO UR 8 1 0
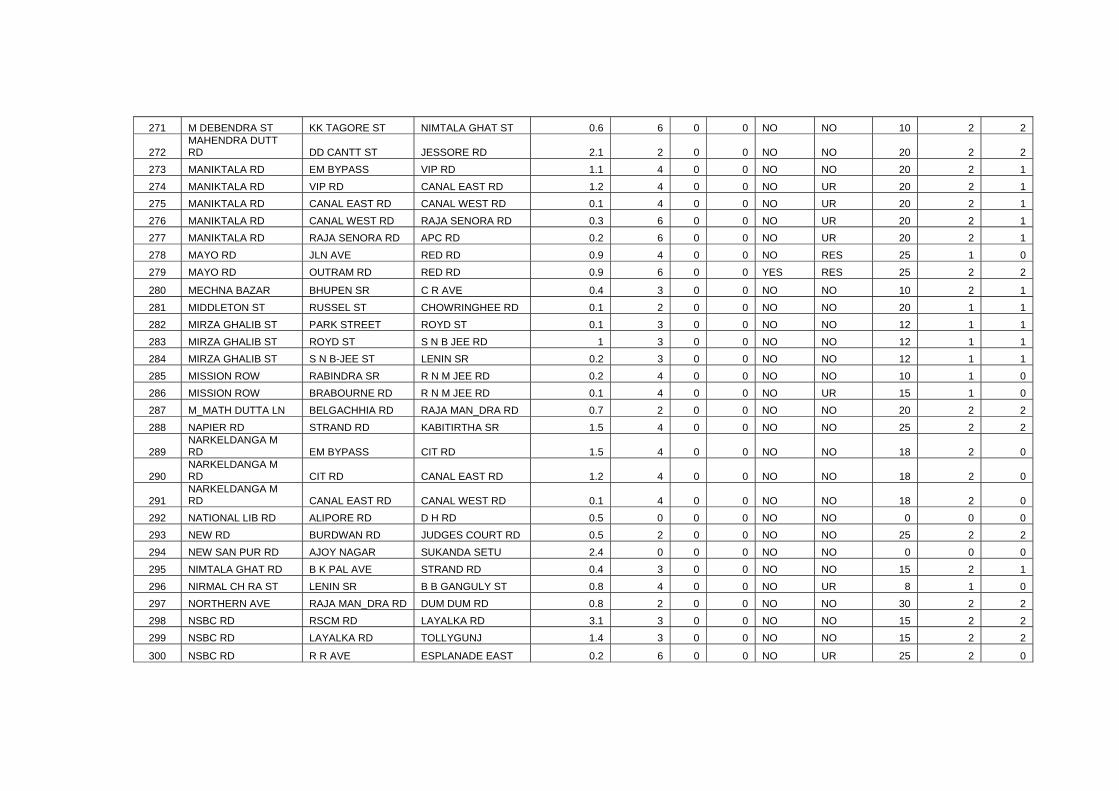
271 M DEBENDRA ST KK TAGORE ST NIMTALA GHAT ST 0.6 6 0 0 NO NO 10 2 2
272 MAHENDRA DUTT RD DD CANTT ST JESSORE RD 2.1 2 0 0 NO NO 20 2 2
273 MANIKTALA RD EM BYPASS VIP RD 1.1 4 0 0 NO NO 20 2 1 274 MANIKTALA RD VIP RD CANAL EAST RD 1.2 4 0 0 NO UR 20 2 1 275 MANIKTALA RD CANAL EAST RD CANAL WEST RD 0.1 4 0 0 NO UR 20 2 1 276 MANIKTALA RD CANAL WEST RD RAJA SENORA RD 0.3 6 0 0 NO UR 20 2 1 277 MANIKTALA RD RAJA SENORA RD APC RD 0.2 6 0 0 NO UR 20 2 1 278 MAYO RD JLN AVE RED RD 0.9 4 0 0 NO RES 25 1 0 279 MAYO RD OUTRAM RD RED RD 0.9 6 0 0 YES RES 25 2 2
280 MECHNA BAZAR BHUPEN SR C R AVE 0.4 3 0 0 NO NO 10 2 1 281 MIDDLETON ST RUSSEL ST CHOWRINGHEE RD 0.1 2 0 0 NO NO 20 1 1 282 MIRZA GHALIB ST PARK STREET ROYD ST 0.1 3 0 0 NO NO 12 1 1 283 MIRZA GHALIB ST ROYD ST S N B JEE RD 1 3 0 0 NO NO 12 1 1 284 MIRZA GHALIB ST S N B-JEE ST LENIN SR 0.2 3 0 0 NO NO 12 1 1 285 MISSION ROW RABINDRA SR R N M JEE RD 0.2 4 0 0 NO NO 10 1 0 286 MISSION ROW BRABOURNE RD R N M JEE RD 0.1 4 0 0 NO UR 15 1 0 287 M_MATH DUTTA LN BELGACHHIA RD RAJA MAN_DRA RD 0.7 2 0 0 NO NO 20 2 2 288 NAPIER RD STRAND RD KABITIRTHA SR 1.5 4 0 0 NO NO 25 2 2
289 NARKELDANGA M RD EM BYPASS CIT RD 1.5 4 0 0 NO NO 18 2 0
290 NARKELDANGA M RD CIT RD CANAL EAST RD 1.2 4 0 0 NO NO 18 2 0
291 NARKELDANGA M RD CANAL EAST RD CANAL WEST RD 0.1 4 0 0 NO NO 18 2 0
292 NATIONAL LIB RD ALIPORE RD D H RD 0.5 0 0 0 NO NO 0 0 0 293 NEW RD BURDWAN RD JUDGES COURT RD 0.5 2 0 0 NO NO 25 2 2 294 NEW SAN PUR RD AJOY NAGAR SUKANDA SETU 2.4 0 0 0 NO NO 0 0 0 295 NIMTALA GHAT RD B K PAL AVE STRAND RD 0.4 3 0 0 NO NO 15 2 1 296 NIRMAL CH RA ST LENIN SR B B GANGULY ST 0.8 4 0 0 NO UR 8 1 0 297 NORTHERN AVE RAJA MAN_DRA RD DUM DUM RD 0.8 2 0 0 NO NO 30 2 2 298 NSBC RD RSCM RD LAYALKA RD 3.1 3 0 0 NO NO 15 2 2 299 NSBC RD LAYALKA RD TOLLYGUNJ 1.4 3 0 0 NO NO 15 2 2
300 NSBC RD R R AVE ESPLANADE EAST 0.2 6 0 0 NO UR 25 2 0
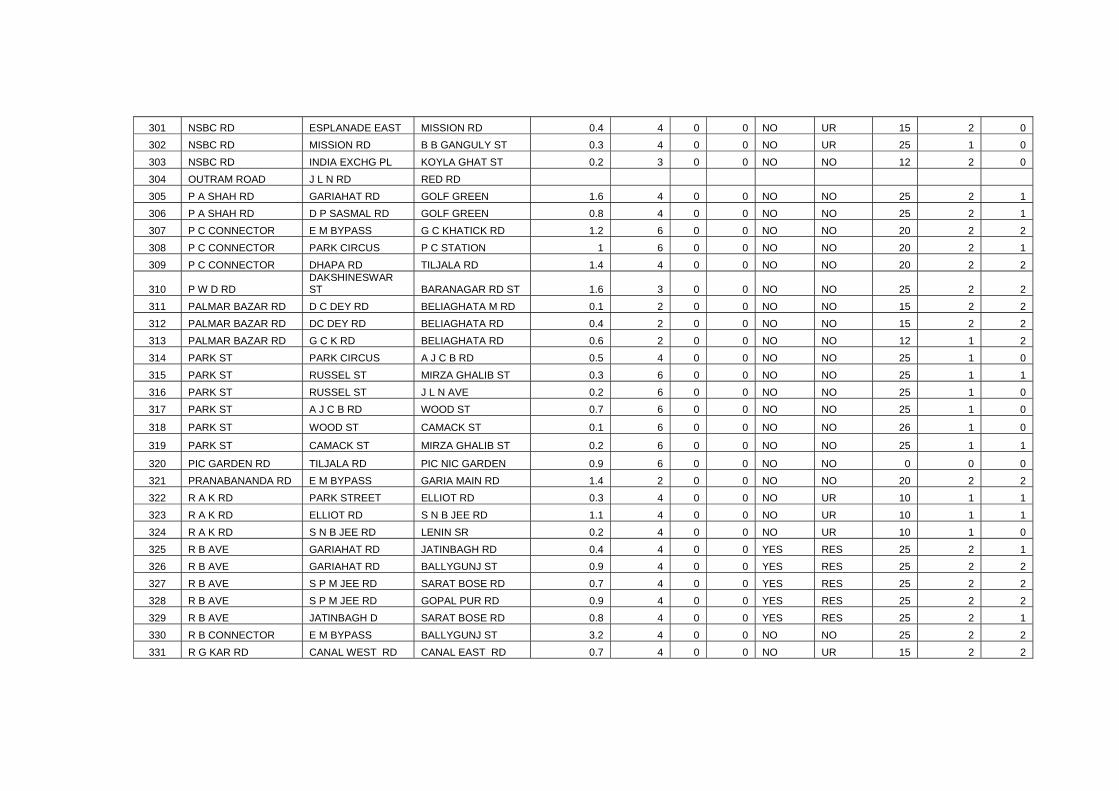
301 NSBC RD ESPLANADE EAST MISSION RD 0.4 4 0 0 NO UR 15 2 0 302 NSBC RD MISSION RD B B GANGULY ST 0.3 4 0 0 NO UR 25 1 0 303 NSBC RD INDIA EXCHG PL KOYLA GHAT ST 0.2 3 0 0 NO NO 12 2 0 304 OUTRAM ROAD J L N RD RED RD 305 P A SHAH RD GARIAHAT RD GOLF GREEN 1.6 4 0 0 NO NO 25 2 1 306 P A SHAH RD D P SASMAL RD GOLF GREEN 0.8 4 0 0 NO NO 25 2 1 307 P C CONNECTOR E M BYPASS G C KHATICK RD 1.2 6 0 0 NO NO 20 2 2 308 P C CONNECTOR PARK CIRCUS P C STATION 1 6 0 0 NO NO 20 2 1 309 P C CONNECTOR DHAPA RD TILJALA RD 1.4 4 0 0 NO NO 20 2 2
310 P W D RD DAKSHINESWAR ST BARANAGAR RD ST 1.6 3 0 0 NO NO 25 2 2
311 PALMAR BAZAR RD D C DEY RD BELIAGHATA M RD 0.1 2 0 0 NO NO 15 2 2 312 PALMAR BAZAR RD DC DEY RD BELIAGHATA RD 0.4 2 0 0 NO NO 15 2 2 313 PALMAR BAZAR RD G C K RD BELIAGHATA RD 0.6 2 0 0 NO NO 12 1 2 314 PARK ST PARK CIRCUS A J C B RD 0.5 4 0 0 NO NO 25 1 0 315 PARK ST RUSSEL ST MIRZA GHALIB ST 0.3 6 0 0 NO NO 25 1 1 316 PARK ST RUSSEL ST J L N AVE 0.2 6 0 0 NO NO 25 1 0 317 PARK ST A J C B RD WOOD ST 0.7 6 0 0 NO NO 25 1 0
318 PARK ST WOOD ST CAMACK ST 0.1 6 0 0 NO NO 26 1 0
319 PARK ST CAMACK ST MIRZA GHALIB ST 0.2 6 0 0 NO NO 25 1 1
320 PIC GARDEN RD TILJALA RD PIC NIC GARDEN 0.9 6 0 0 NO NO 0 0 0 321 PRANABANANDA RD E M BYPASS GARIA MAIN RD 1.4 2 0 0 NO NO 20 2 2 322 R A K RD PARK STREET ELLIOT RD 0.3 4 0 0 NO UR 10 1 1 323 R A K RD ELLIOT RD S N B JEE RD 1.1 4 0 0 NO UR 10 1 1 324 R A K RD S N B JEE RD LENIN SR 0.2 4 0 0 NO UR 10 1 0 325 R B AVE GARIAHAT RD JATINBAGH RD 0.4 4 0 0 YES RES 25 2 1 326 R B AVE GARIAHAT RD BALLYGUNJ ST 0.9 4 0 0 YES RES 25 2 2 327 R B AVE S P M JEE RD SARAT BOSE RD 0.7 4 0 0 YES RES 25 2 2 328 R B AVE S P M JEE RD GOPAL PUR RD 0.9 4 0 0 YES RES 25 2 2 329 R B AVE JATINBAGH D SARAT BOSE RD 0.8 4 0 0 YES RES 25 2 1 330 R B CONNECTOR E M BYPASS BALLYGUNJ ST 3.2 4 0 0 NO NO 25 2 2 331 R G KAR RD CANAL WEST RD CANAL EAST RD 0.7 4 0 0 NO UR 15 2 2
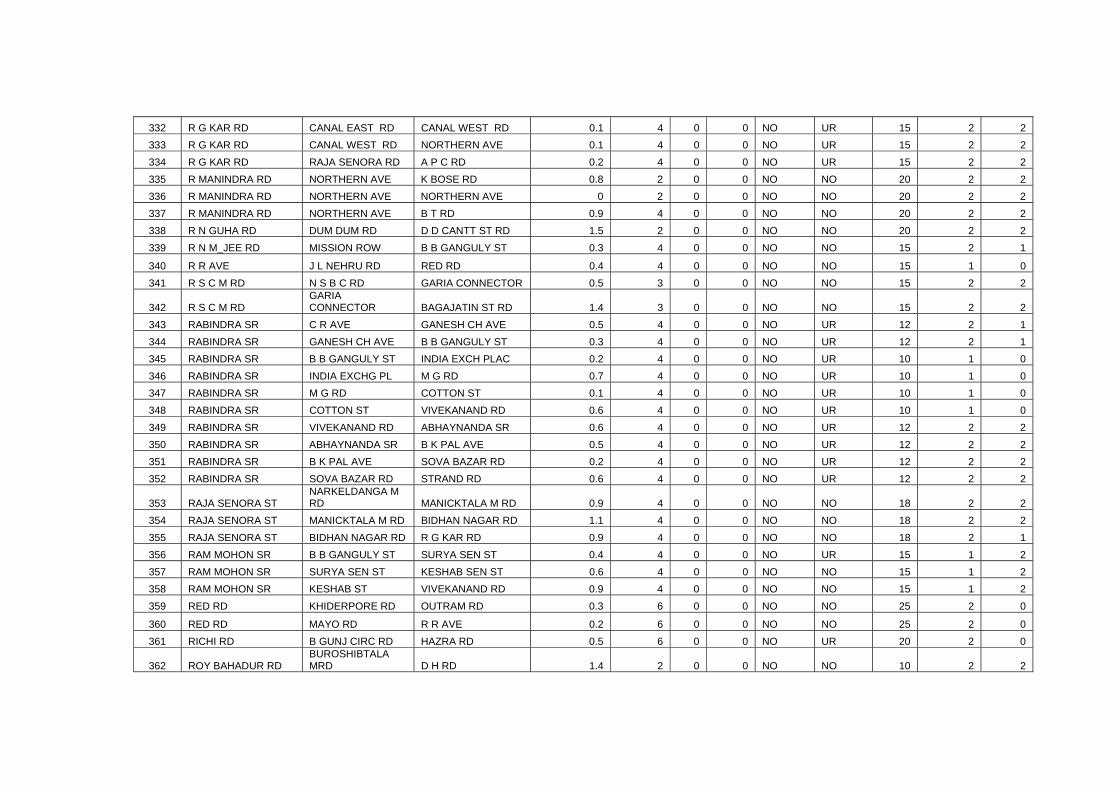
332 R G KAR RD CANAL EAST RD CANAL WEST RD 0.1 4 0 0 NO UR 15 2 2 333 R G KAR RD CANAL WEST RD NORTHERN AVE 0.1 4 0 0 NO UR 15 2 2 334 R G KAR RD RAJA SENORA RD A P C RD 0.2 4 0 0 NO UR 15 2 2 335 R MANINDRA RD NORTHERN AVE K BOSE RD 0.8 2 0 0 NO NO 20 2 2 336 R MANINDRA RD NORTHERN AVE NORTHERN AVE 0 2 0 0 NO NO 20 2 2 337 R MANINDRA RD NORTHERN AVE B T RD 0.9 4 0 0 NO NO 20 2 2 338 R N GUHA RD DUM DUM RD D D CANTT ST RD 1.5 2 0 0 NO NO 20 2 2 339 R N M_JEE RD MISSION ROW B B GANGULY ST 0.3 4 0 0 NO NO 15 2 1
340 R R AVE J L NEHRU RD RED RD 0.4 4 0 0 NO NO 15 1 0 341 R S C M RD N S B C RD GARIA CONNECTOR 0.5 3 0 0 NO NO 15 2 2
342 R S C M RD GARIA CONNECTOR BAGAJATIN ST RD 1.4 3 0 0 NO NO 15 2 2
343 RABINDRA SR C R AVE GANESH CH AVE 0.5 4 0 0 NO UR 12 2 1 344 RABINDRA SR GANESH CH AVE B B GANGULY ST 0.3 4 0 0 NO UR 12 2 1 345 RABINDRA SR B B GANGULY ST INDIA EXCH PLAC 0.2 4 0 0 NO UR 10 1 0 346 RABINDRA SR INDIA EXCHG PL M G RD 0.7 4 0 0 NO UR 10 1 0 347 RABINDRA SR M G RD COTTON ST 0.1 4 0 0 NO UR 10 1 0 348 RABINDRA SR COTTON ST VIVEKANAND RD 0.6 4 0 0 NO UR 10 1 0 349 RABINDRA SR VIVEKANAND RD ABHAYNANDA SR 0.6 4 0 0 NO UR 12 2 2 350 RABINDRA SR ABHAYNANDA SR B K PAL AVE 0.5 4 0 0 NO UR 12 2 2 351 RABINDRA SR B K PAL AVE SOVA BAZAR RD 0.2 4 0 0 NO UR 12 2 2 352 RABINDRA SR SOVA BAZAR RD STRAND RD 0.6 4 0 0 NO UR 12 2 2
353 RAJA SENORA ST NARKELDANGA M RD MANICKTALA M RD 0.9 4 0 0 NO NO 18 2 2
354 RAJA SENORA ST MANICKTALA M RD BIDHAN NAGAR RD 1.1 4 0 0 NO NO 18 2 2 355 RAJA SENORA ST BIDHAN NAGAR RD R G KAR RD 0.9 4 0 0 NO NO 18 2 1 356 RAM MOHON SR B B GANGULY ST SURYA SEN ST 0.4 4 0 0 NO UR 15 1 2 357 RAM MOHON SR SURYA SEN ST KESHAB SEN ST 0.6 4 0 0 NO NO 15 1 2 358 RAM MOHON SR KESHAB ST VIVEKANAND RD 0.9 4 0 0 NO NO 15 1 2 359 RED RD KHIDERPORE RD OUTRAM RD 0.3 6 0 0 NO NO 25 2 0
360 RED RD MAYO RD R R AVE 0.2 6 0 0 NO NO 25 2 0 361 RICHI RD B GUNJ CIRC RD HAZRA RD 0.5 6 0 0 NO UR 20 2 0
362 ROY BAHADUR RD BUROSHIBTALA MRD D H RD 1.4 2 0 0 NO NO 10 2 2
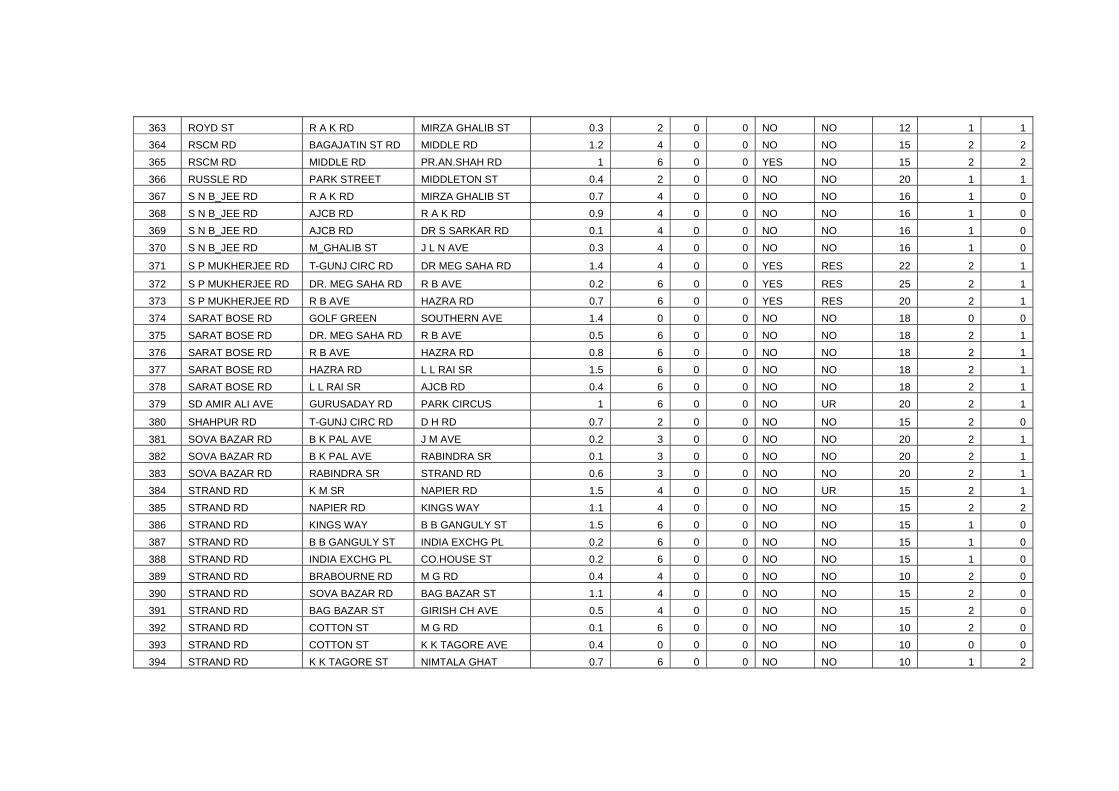
363 ROYD ST R A K RD MIRZA GHALIB ST 0.3 2 0 0 NO NO 12 1 1 364 RSCM RD BAGAJATIN ST RD MIDDLE RD 1.2 4 0 0 NO NO 15 2 2 365 RSCM RD MIDDLE RD PR.AN.SHAH RD 1 6 0 0 YES NO 15 2 2 366 RUSSLE RD PARK STREET MIDDLETON ST 0.4 2 0 0 NO NO 20 1 1 367 S N B_JEE RD R A K RD MIRZA GHALIB ST 0.7 4 0 0 NO NO 16 1 0 368 S N B_JEE RD AJCB RD R A K RD 0.9 4 0 0 NO NO 16 1 0 369 S N B_JEE RD AJCB RD DR S SARKAR RD 0.1 4 0 0 NO NO 16 1 0 370 S N B_JEE RD M_GHALIB ST J L N AVE 0.3 4 0 0 NO NO 16 1 0
371 S P MUKHERJEE RD T-GUNJ CIRC RD DR MEG SAHA RD 1.4 4 0 0 YES RES 22 2 1
372 S P MUKHERJEE RD DR. MEG SAHA RD R B AVE 0.2 6 0 0 YES RES 25 2 1 373 S P MUKHERJEE RD R B AVE HAZRA RD 0.7 6 0 0 YES RES 20 2 1 374 SARAT BOSE RD GOLF GREEN SOUTHERN AVE 1.4 0 0 0 NO NO 18 0 0 375 SARAT BOSE RD DR. MEG SAHA RD R B AVE 0.5 6 0 0 NO NO 18 2 1 376 SARAT BOSE RD R B AVE HAZRA RD 0.8 6 0 0 NO NO 18 2 1 377 SARAT BOSE RD HAZRA RD L L RAI SR 1.5 6 0 0 NO NO 18 2 1 378 SARAT BOSE RD L L RAI SR AJCB RD 0.4 6 0 0 NO NO 18 2 1 379 SD AMIR ALI AVE GURUSADAY RD PARK CIRCUS 1 6 0 0 NO UR 20 2 1
380 SHAHPUR RD T-GUNJ CIRC RD D H RD 0.7 2 0 0 NO NO 15 2 0
381 SOVA BAZAR RD B K PAL AVE J M AVE 0.2 3 0 0 NO NO 20 2 1 382 SOVA BAZAR RD B K PAL AVE RABINDRA SR 0.1 3 0 0 NO NO 20 2 1 383 SOVA BAZAR RD RABINDRA SR STRAND RD 0.6 3 0 0 NO NO 20 2 1 384 STRAND RD K M SR NAPIER RD 1.5 4 0 0 NO UR 15 2 1 385 STRAND RD NAPIER RD KINGS WAY 1.1 4 0 0 NO NO 15 2 2 386 STRAND RD KINGS WAY B B GANGULY ST 1.5 6 0 0 NO NO 15 1 0 387 STRAND RD B B GANGULY ST INDIA EXCHG PL 0.2 6 0 0 NO NO 15 1 0 388 STRAND RD INDIA EXCHG PL CO.HOUSE ST 0.2 6 0 0 NO NO 15 1 0 389 STRAND RD BRABOURNE RD M G RD 0.4 4 0 0 NO NO 10 2 0 390 STRAND RD SOVA BAZAR RD BAG BAZAR ST 1.1 4 0 0 NO NO 15 2 0 391 STRAND RD BAG BAZAR ST GIRISH CH AVE 0.5 4 0 0 NO NO 15 2 0 392 STRAND RD COTTON ST M G RD 0.1 6 0 0 NO NO 10 2 0 393 STRAND RD COTTON ST K K TAGORE AVE 0.4 0 0 0 NO NO 10 0 0 394 STRAND RD K K TAGORE ST NIMTALA GHAT 0.7 6 0 0 NO NO 10 1 2
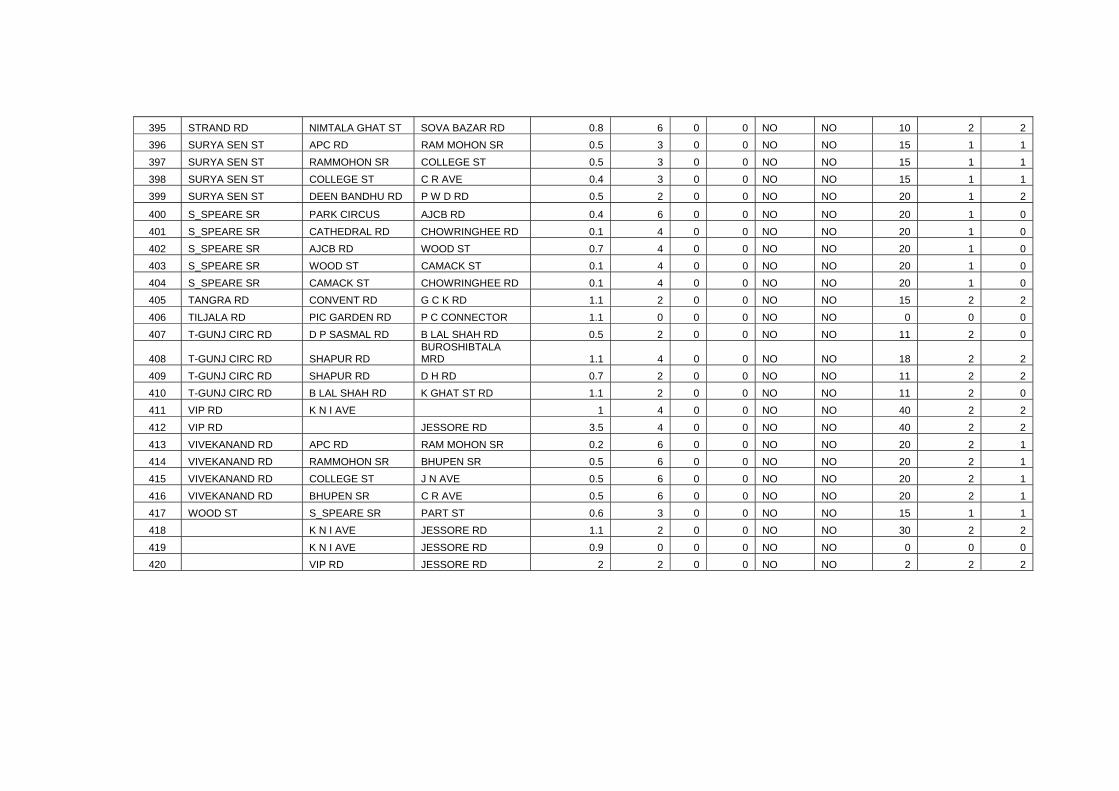
395 STRAND RD NIMTALA GHAT ST SOVA BAZAR RD 0.8 6 0 0 NO NO 10 2 2 396 SURYA SEN ST APC RD RAM MOHON SR 0.5 3 0 0 NO NO 15 1 1 397 SURYA SEN ST RAMMOHON SR COLLEGE ST 0.5 3 0 0 NO NO 15 1 1 398 SURYA SEN ST COLLEGE ST C R AVE 0.4 3 0 0 NO NO 15 1 1 399 SURYA SEN ST DEEN BANDHU RD P W D RD 0.5 2 0 0 NO NO 20 1 2
400 S_SPEARE SR PARK CIRCUS AJCB RD 0.4 6 0 0 NO NO 20 1 0
401 S_SPEARE SR CATHEDRAL RD CHOWRINGHEE RD 0.1 4 0 0 NO NO 20 1 0 402 S_SPEARE SR AJCB RD WOOD ST 0.7 4 0 0 NO NO 20 1 0 403 S_SPEARE SR WOOD ST CAMACK ST 0.1 4 0 0 NO NO 20 1 0 404 S_SPEARE SR CAMACK ST CHOWRINGHEE RD 0.1 4 0 0 NO NO 20 1 0 405 TANGRA RD CONVENT RD G C K RD 1.1 2 0 0 NO NO 15 2 2 406 TILJALA RD PIC GARDEN RD P C CONNECTOR 1.1 0 0 0 NO NO 0 0 0 407 T-GUNJ CIRC RD D P SASMAL RD B LAL SHAH RD 0.5 2 0 0 NO NO 11 2 0
408 T-GUNJ CIRC RD SHAPUR RD BUROSHIBTALA MRD 1.1 4 0 0 NO NO 18 2 2
409 T-GUNJ CIRC RD SHAPUR RD D H RD 0.7 2 0 0 NO NO 11 2 2 410 T-GUNJ CIRC RD B LAL SHAH RD K GHAT ST RD 1.1 2 0 0 NO NO 11 2 0 411 VIP RD K N I AVE 1 4 0 0 NO NO 40 2 2 412 VIP RD JESSORE RD 3.5 4 0 0 NO NO 40 2 2 413 VIVEKANAND RD APC RD RAM MOHON SR 0.2 6 0 0 NO NO 20 2 1 414 VIVEKANAND RD RAMMOHON SR BHUPEN SR 0.5 6 0 0 NO NO 20 2 1 415 VIVEKANAND RD COLLEGE ST J N AVE 0.5 6 0 0 NO NO 20 2 1 416 VIVEKANAND RD BHUPEN SR C R AVE 0.5 6 0 0 NO NO 20 2 1 417 WOOD ST S_SPEARE SR PART ST 0.6 3 0 0 NO NO 15 1 1 418 K N I AVE JESSORE RD 1.1 2 0 0 NO NO 30 2 2 419 K N I AVE JESSORE RD 0.9 0 0 0 NO NO 0 0 0 420 VIP RD JESSORE RD 2 2 0 0 NO NO 2 2 2
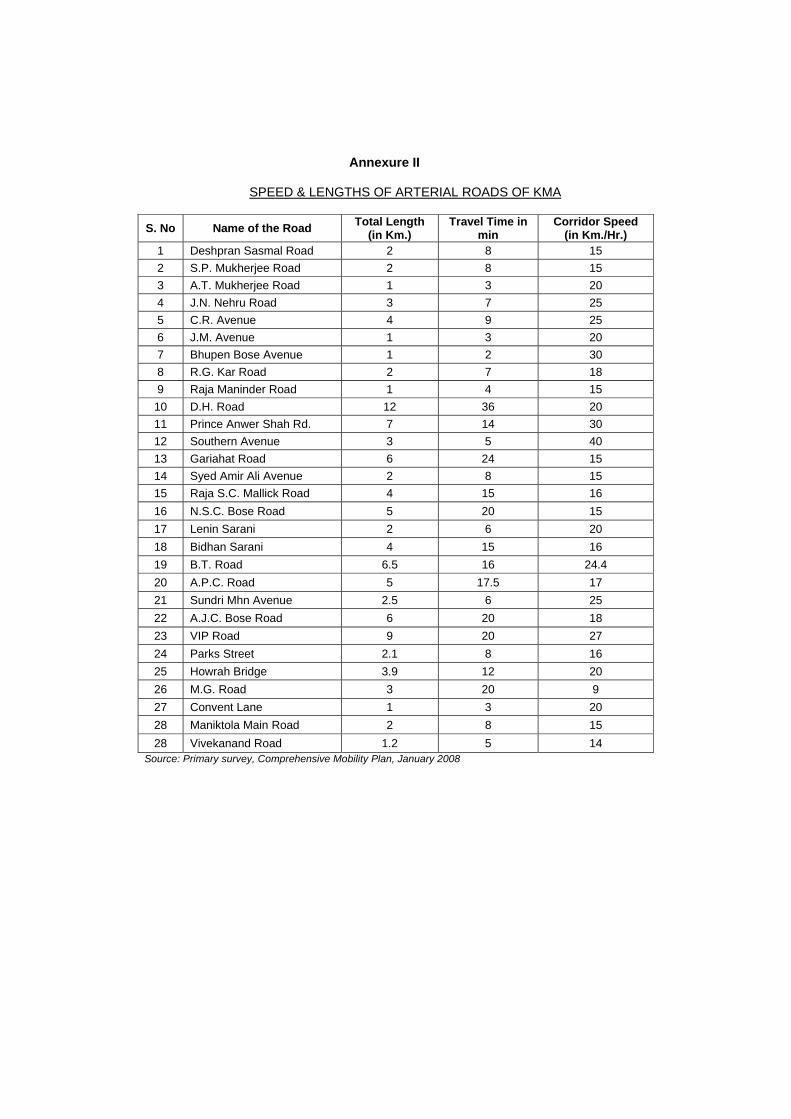
Annexure II
SPEED & LENGTHS OF ARTERIAL ROADS OF KMA
S. No Name of the Road Total Length
(in Km.) Travel Time in
min Corridor Speed
(in Km./Hr.) 1 Deshpran Sasmal Road 2 8 15 2 S.P. Mukherjee Road 2 8 15 3 A.T. Mukherjee Road 1 3 20 4 J.N. Nehru Road 3 7 25 5 C.R. Avenue 4 9 25 6 J.M. Avenue 1 3 20 7 Bhupen Bose Avenue 1 2 30 8 R.G. Kar Road 2 7 18 9 Raja Maninder Road 1 4 15 10 D.H. Road 12 36 20 11 Prince Anwer Shah Rd. 7 14 30 12 Southern Avenue 3 5 40 13 Gariahat Road 6 24 15 14 Syed Amir Ali Avenue 2 8 15 15 Raja S.C. Mallick Road 4 15 16 16 N.S.C. Bose Road 5 20 15 17 Lenin Sarani 2 6 20 18 Bidhan Sarani 4 15 16 19 B.T. Road 6.5 16 24.4 20 A.P.C. Road 5 17.5 17 21 Sundri Mhn Avenue 2.5 6 25 22 A.J.C. Bose Road 6 20 18 23 VIP Road 9 20 27 24 Parks Street 2.1 8 16 25 Howrah Bridge 3.9 12 20 26 M.G. Road 3 20 9 27 Convent Lane 1 3 20 28 Maniktola Main Road 2 8 15 28 Vivekanand Road 1.2 5 14
Source: Primary survey, Comprehensive Mobility Plan, January 2008
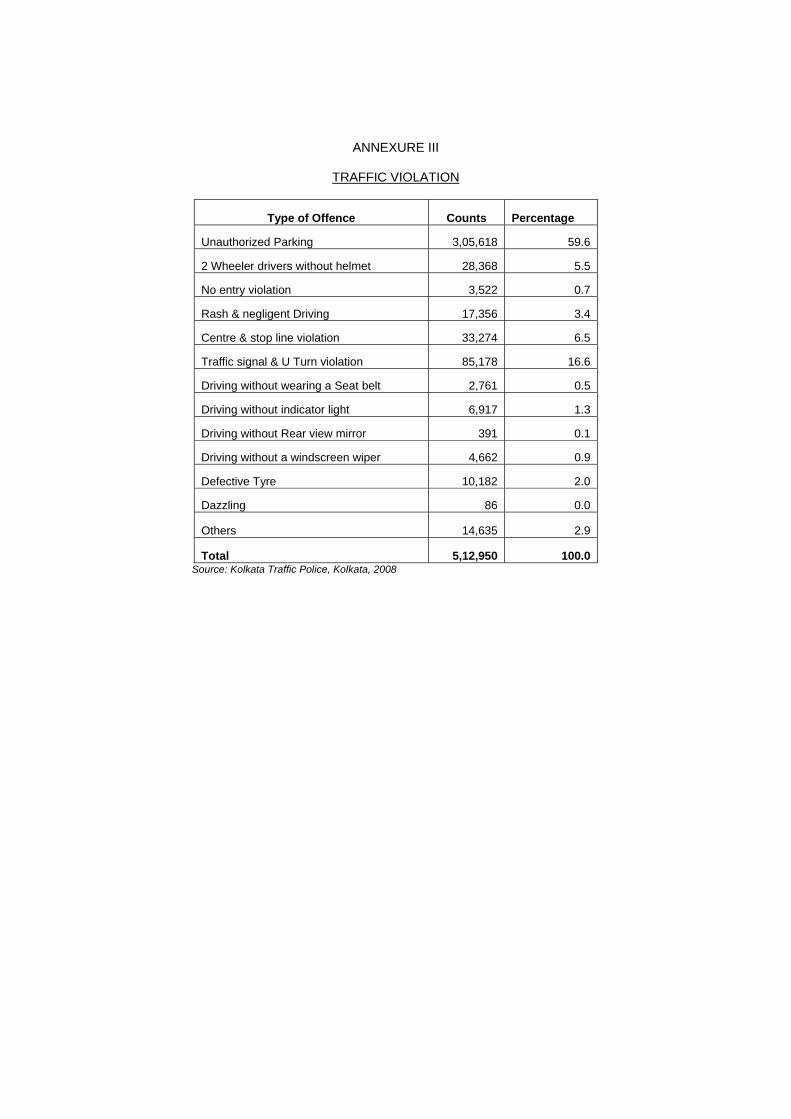
ANNEXURE III
TRAFFIC VIOLATION
Type of Offence Counts Percentage
Unauthorized Parking 3,05,618 59.6
2 Wheeler drivers without helmet 28,368 5.5
No entry violation 3,522 0.7
Rash & negligent Driving 17,356 3.4
Centre & stop line violation 33,274 6.5
Traffic signal & U Turn violation 85,178 16.6
Driving without wearing a Seat belt 2,761 0.5
Driving without indicator light 6,917 1.3
Driving without Rear view mirror 391 0.1
Driving without a windscreen wiper 4,662 0.9
Defective Tyre 10,182 2.0
Dazzling 86 0.0
Others 14,635 2.9
Total 5,12,950 100.0 Source: Kolkata Traffic Police, Kolkata, 2008
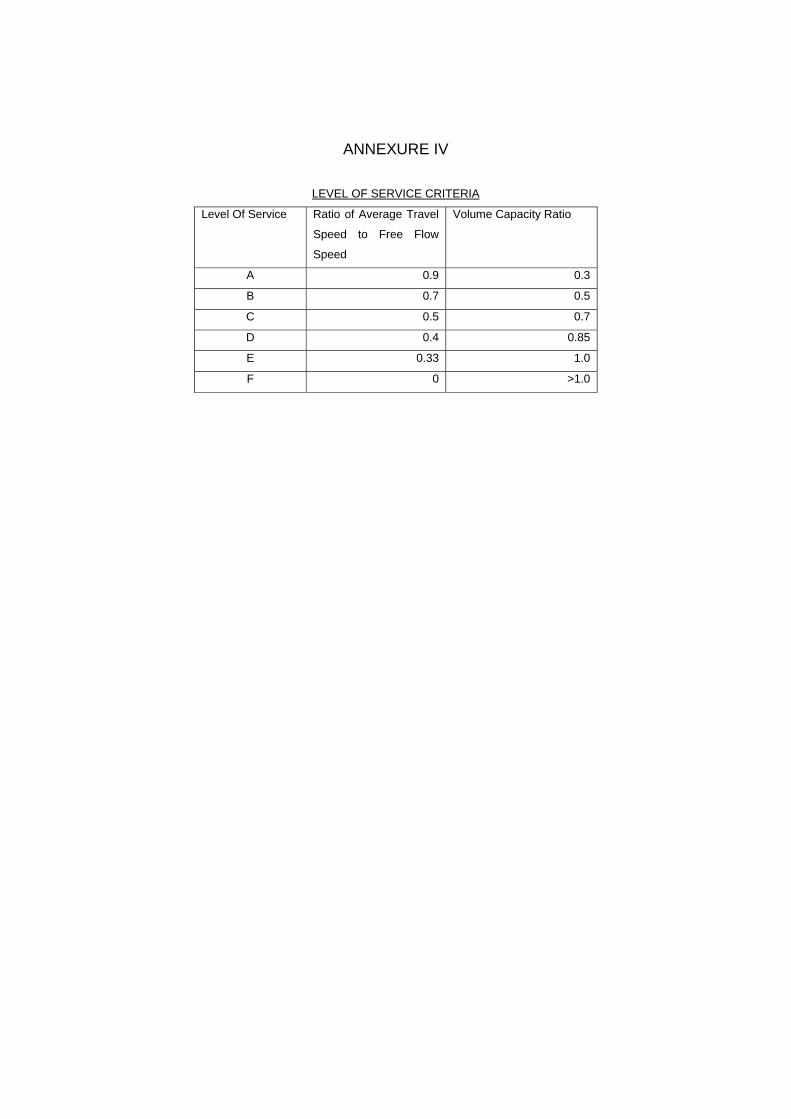
ANNEXURE IV
LEVEL OF SERVICE CRITERIA
Level Of Service Ratio of Average Travel
Speed to Free Flow
Speed
Volume Capacity Ratio
A 0.9 0.3
B 0.7 0.5
C 0.5 0.7
D 0.4 0.85
E 0.33 1.0
F 0 >1.0
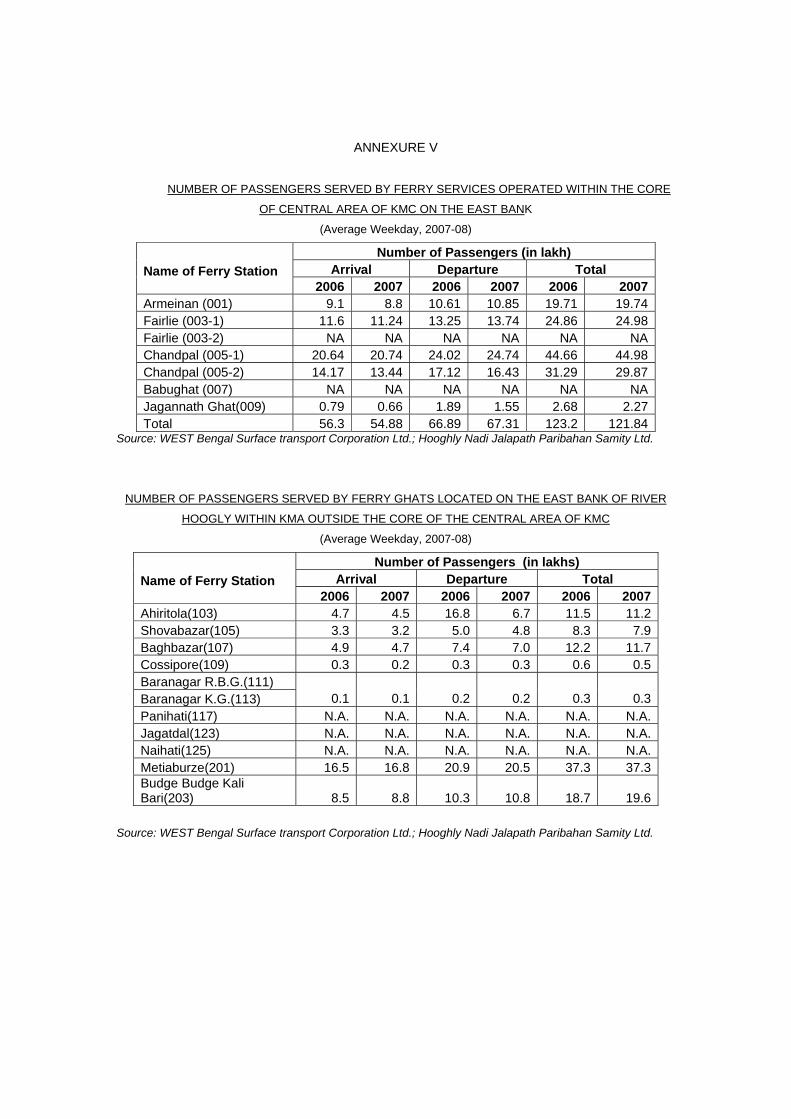
ANNEXURE V
NUMBER OF PASSENGERS SERVED BY FERRY SERVICES OPERATED WITHIN THE CORE
OF CENTRAL AREA OF KMC ON THE EAST BANK
(Average Weekday, 2007-08)
Number of Passengers (in lakh) Arrival Departure Total
Name of Ferry Station 2006 2007 2006 2007 2006 2007 Armeinan (001) 9.1 8.8 10.61 10.85 19.71 19.74 Fairlie (003-1) 11.6 11.24 13.25 13.74 24.86 24.98 Fairlie (003-2) NA NA NA NA NA NA Chandpal (005-1) 20.64 20.74 24.02 24.74 44.66 44.98 Chandpal (005-2) 14.17 13.44 17.12 16.43 31.29 29.87 Babughat (007) NA NA NA NA NA NA Jagannath Ghat(009) 0.79 0.66 1.89 1.55 2.68 2.27 Total 56.3 54.88 66.89 67.31 123.2 121.84
Source: WEST Bengal Surface transport Corporation Ltd.; Hooghly Nadi Jalapath Paribahan Samity Ltd.
NUMBER OF PASSENGERS SERVED BY FERRY GHATS LOCATED ON THE EAST BANK OF RIVER
HOOGLY WITHIN KMA OUTSIDE THE CORE OF THE CENTRAL AREA OF KMC
(Average Weekday, 2007-08)
Number of Passengers (in lakhs) Arrival Departure Total
Name of Ferry Station 2006 2007 2006 2007 2006 2007 Ahiritola(103) 4.7 4.5 16.8 6.7 11.5 11.2 Shovabazar(105) 3.3 3.2 5.0 4.8 8.3 7.9 Baghbazar(107) 4.9 4.7 7.4 7.0 12.2 11.7 Cossipore(109) 0.3 0.2 0.3 0.3 0.6 0.5 Baranagar R.B.G.(111) Baranagar K.G.(113) 0.1 0.1 0.2 0.2 0.3 0.3 Panihati(117) N.A. N.A. N.A. N.A. N.A. N.A. Jagatdal(123) N.A. N.A. N.A. N.A. N.A. N.A. Naihati(125) N.A. N.A. N.A. N.A. N.A. N.A. Metiaburze(201) 16.5 16.8 20.9 20.5 37.3 37.3 Budge Budge Kali Bari(203) 8.5 8.8 10.3 10.8 18.7 19.6
Source: WEST Bengal Surface transport Corporation Ltd.; Hooghly Nadi Jalapath Paribahan Samity Ltd.
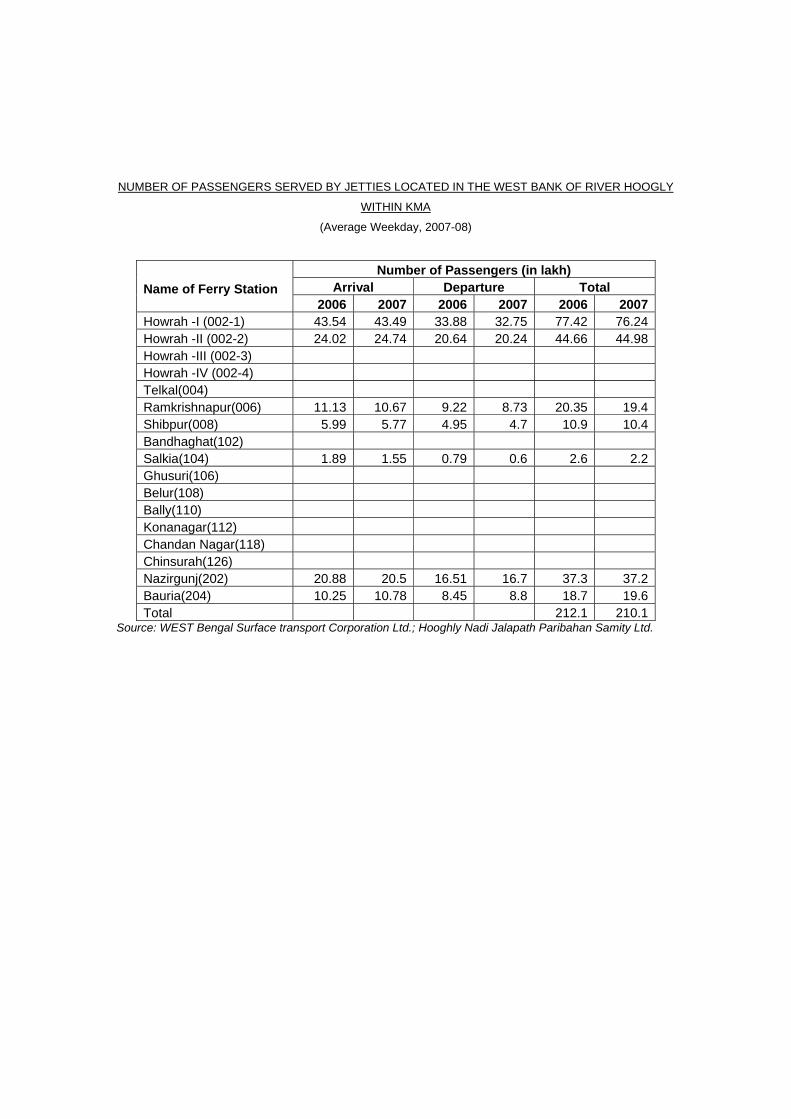
NUMBER OF PASSENGERS SERVED BY JETTIES LOCATED IN THE WEST BANK OF RIVER HOOGLY
WITHIN KMA
(Average Weekday, 2007-08)
Number of Passengers (in lakh) Arrival Departure Total
Name of Ferry Station 2006 2007 2006 2007 2006 2007 Howrah -I (002-1) 43.54 43.49 33.88 32.75 77.42 76.24 Howrah -II (002-2) 24.02 24.74 20.64 20.24 44.66 44.98 Howrah -III (002-3) Howrah -IV (002-4) Telkal(004) Ramkrishnapur(006) 11.13 10.67 9.22 8.73 20.35 19.4 Shibpur(008) 5.99 5.77 4.95 4.7 10.9 10.4 Bandhaghat(102) Salkia(104) 1.89 1.55 0.79 0.6 2.6 2.2 Ghusuri(106) Belur(108) Bally(110) Konanagar(112) Chandan Nagar(118) Chinsurah(126) Nazirgunj(202) 20.88 20.5 16.51 16.7 37.3 37.2 Bauria(204) 10.25 10.78 8.45 8.8 18.7 19.6 Total 212.1 210.1
Source: WEST Bengal Surface transport Corporation Ltd.; Hooghly Nadi Jalapath Paribahan Samity Ltd.
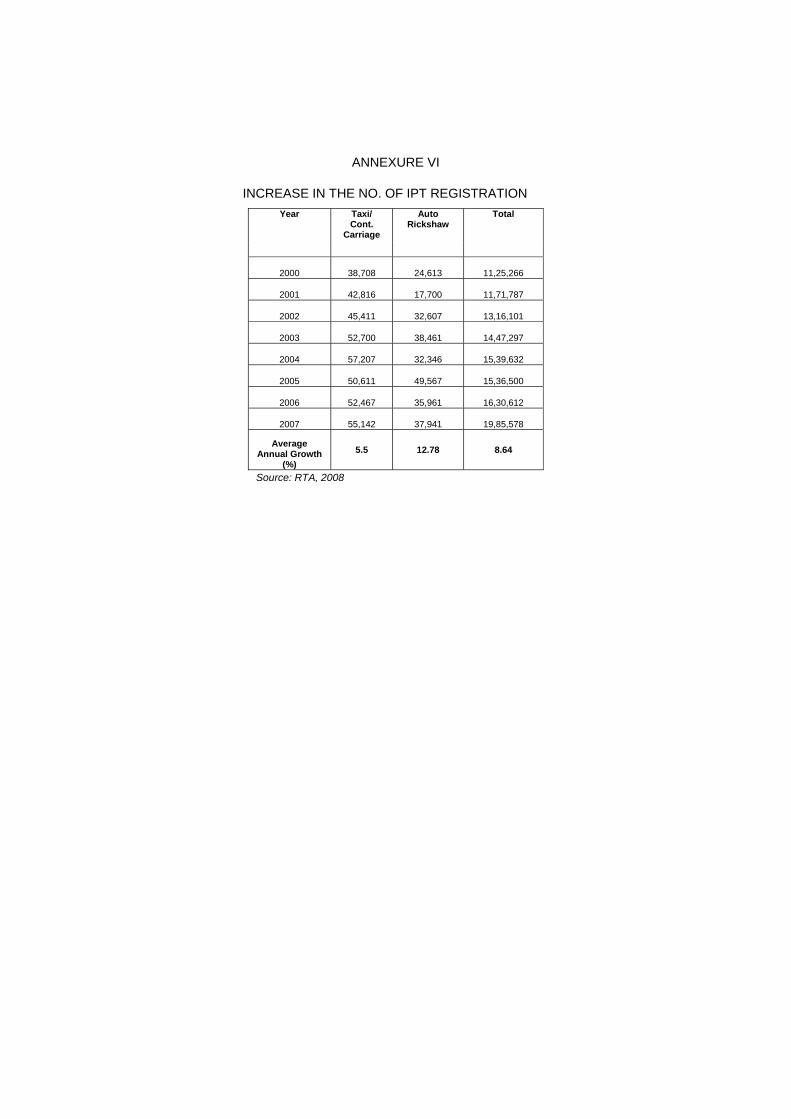
ANNEXURE VI
INCREASE IN THE NO. OF IPT REGISTRATION
Year Taxi/ Cont.
Carriage
Auto Rickshaw
Total
2000 38,708 24,613 11,25,266
2001 42,816 17,700 11,71,787
2002 45,411 32,607 13,16,101
2003 52,700 38,461 14,47,297
2004 57,207 32,346 15,39,632
2005 50,611 49,567 15,36,500
2006 52,467 35,961 16,30,612
2007 55,142 37,941 19,85,578
Average Annual Growth
(%) 5.5 12.78 8.64
Source: RTA, 2008
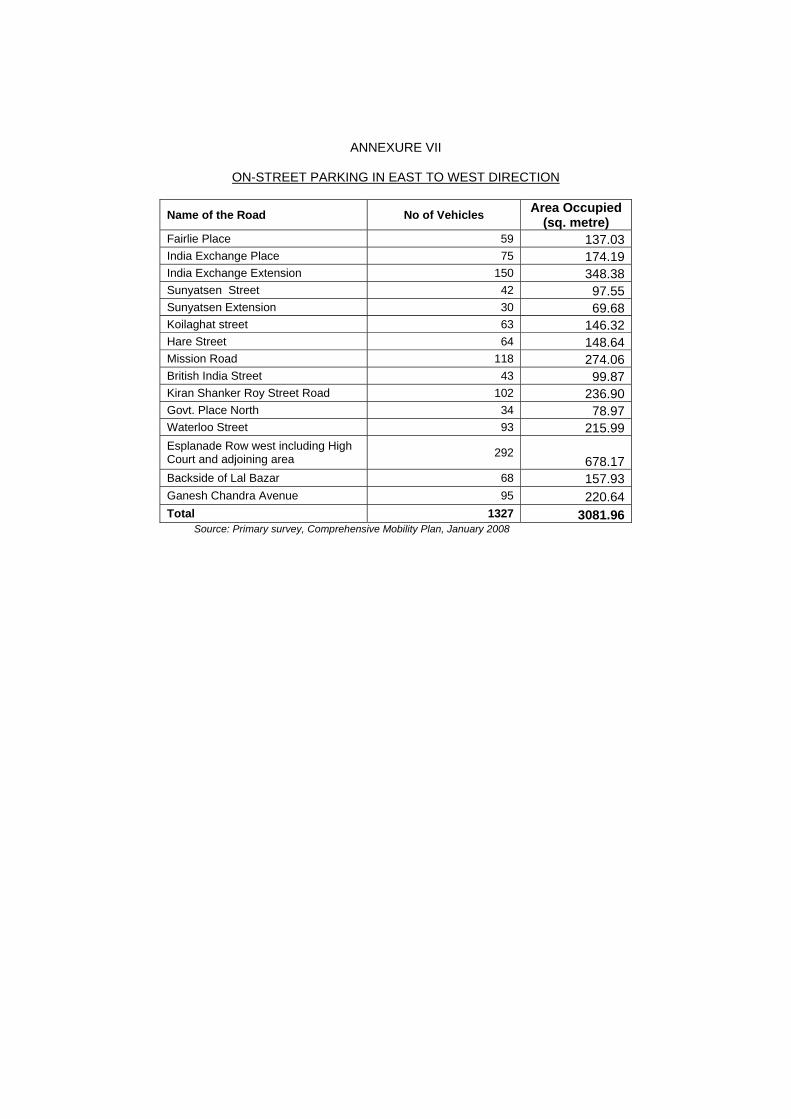
ANNEXURE VII
ON-STREET PARKING IN EAST TO WEST DIRECTION
Name of the Road No of Vehicles Area Occupied (sq. metre)
Fairlie Place 59 137.03 India Exchange Place 75 174.19 India Exchange Extension 150 348.38 Sunyatsen Street 42 97.55 Sunyatsen Extension 30 69.68 Koilaghat street 63 146.32 Hare Street 64 148.64 Mission Road 118 274.06 British India Street 43 99.87 Kiran Shanker Roy Street Road 102 236.90 Govt. Place North 34 78.97 Waterloo Street 93 215.99 Esplanade Row west including High Court and adjoining area 292
678.17 Backside of Lal Bazar 68 157.93 Ganesh Chandra Avenue 95 220.64 Total 1327 3081.96
Source: Primary survey, Comprehensive Mobility Plan, January 2008
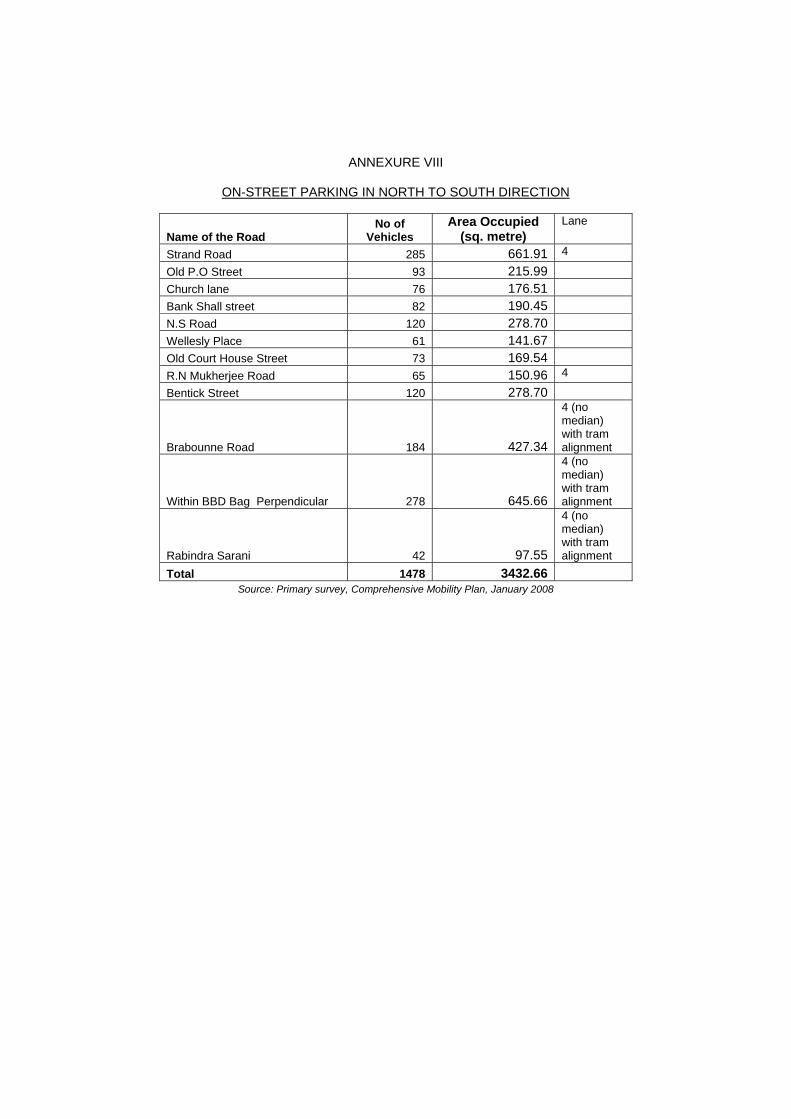
ANNEXURE VIII
ON-STREET PARKING IN NORTH TO SOUTH DIRECTION
Source: Primary survey, Comprehensive Mobility Plan, January 2008
Name of the Road No of
Vehicles Area Occupied
(sq. metre) Lane
Strand Road 285 661.91 4
Old P.O Street 93 215.99
Church lane 76 176.51
Bank Shall street 82 190.45
N.S Road 120 278.70
Wellesly Place 61 141.67
Old Court House Street 73 169.54
R.N Mukherjee Road 65 150.96 4
Bentick Street 120 278.70
Brabounne Road 184 427.34
4 (no median) with tram alignment
Within BBD Bag Perpendicular 278 645.66
4 (no median) with tram alignment
Rabindra Sarani 42 97.55
4 (no median) with tram alignment
Total 1478 3432.66
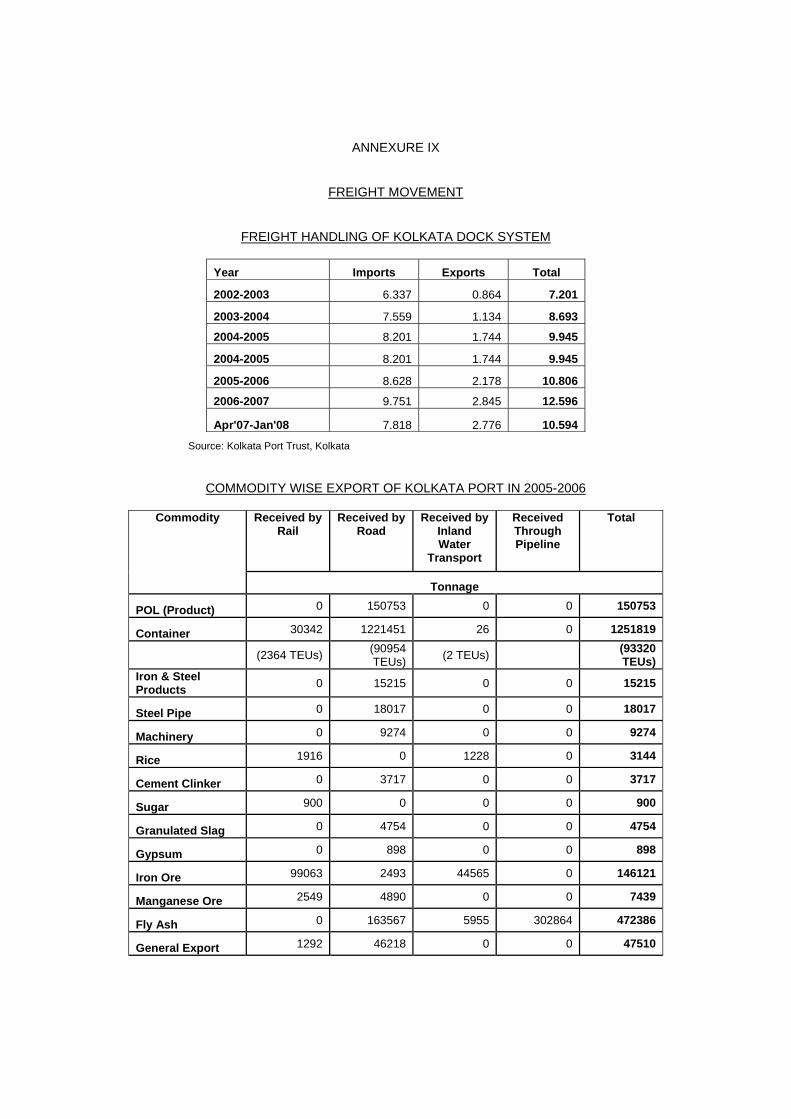
ANNEXURE IX
FREIGHT MOVEMENT
FREIGHT HANDLING OF KOLKATA DOCK SYSTEM
Year Imports Exports Total
2002-2003 6.337 0.864 7.201
2003-2004 7.559 1.134 8.693
2004-2005 8.201 1.744 9.945
2004-2005 8.201 1.744 9.945
2005-2006 8.628 2.178 10.806
2006-2007 9.751 2.845 12.596
Apr'07-Jan'08 7.818 2.776 10.594
Source: Kolkata Port Trust, Kolkata
COMMODITY WISE EXPORT OF KOLKATA PORT IN 2005-2006
Received by
Rail Received by
Road Received by
Inland Water
Transport
Received Through Pipeline
Total Commodity
Tonnage
POL (Product) 0 150753 0 0 150753
Container 30342 1221451 26 0 1251819
(2364 TEUs) (90954 TEUs) (2 TEUs) (93320
TEUs) Iron & Steel Products 0 15215 0 0 15215
Steel Pipe 0 18017 0 0 18017
Machinery 0 9274 0 0 9274
Rice 1916 0 1228 0 3144
Cement Clinker 0 3717 0 0 3717
Sugar 900 0 0 0 900
Granulated Slag 0 4754 0 0 4754
Gypsum 0 898 0 0 898
Iron Ore 99063 2493 44565 0 146121
Manganese Ore 2549 4890 0 0 7439
Fly Ash 0 163567 5955 302864 472386
General Export 1292 46218 0 0 47510
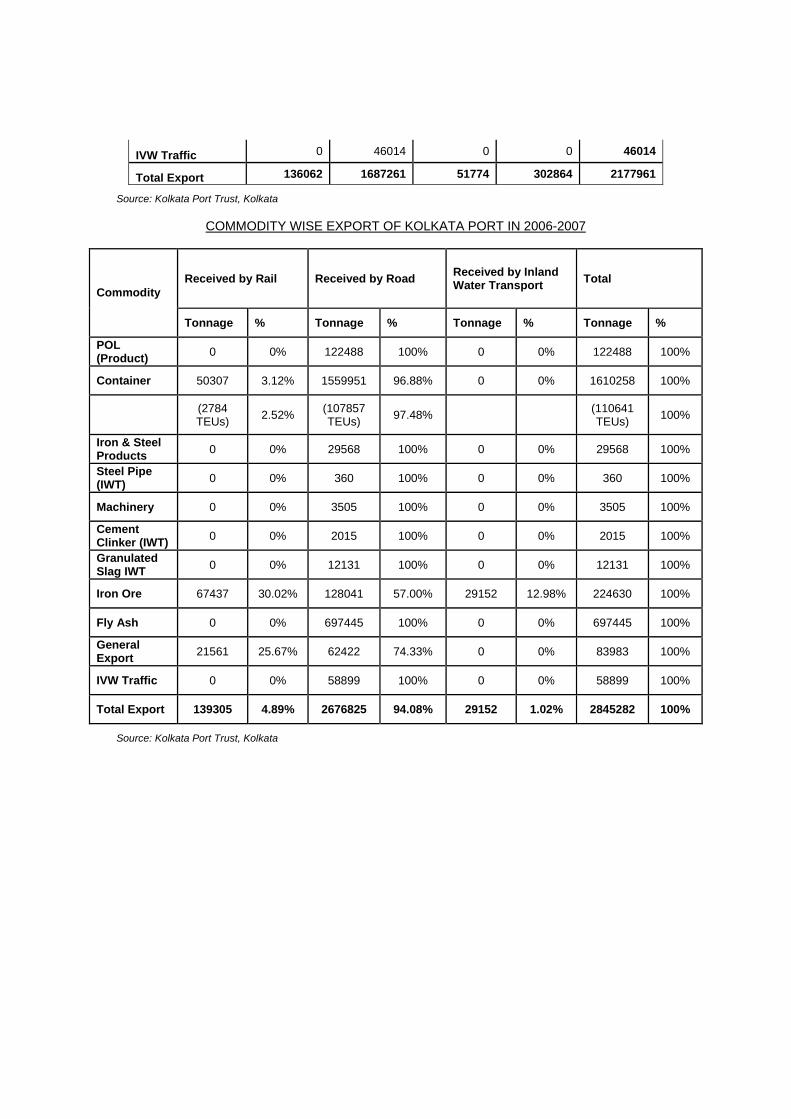
IVW Traffic 0 46014 0 0 46014
Total Export 136062 1687261 51774 302864 2177961
Source: Kolkata Port Trust, Kolkata
COMMODITY WISE EXPORT OF KOLKATA PORT IN 2006-2007
Received by Rail Received by Road Received by Inland Water Transport Total
Commodity
Tonnage % Tonnage % Tonnage % Tonnage %
POL (Product) 0 0% 122488 100% 0 0% 122488 100%
Container 50307 3.12% 1559951 96.88% 0 0% 1610258 100%
(2784 TEUs) 2.52% (107857
TEUs) 97.48% (110641 TEUs) 100%
Iron & Steel Products 0 0% 29568 100% 0 0% 29568 100%
Steel Pipe (IWT) 0 0% 360 100% 0 0% 360 100%
Machinery 0 0% 3505 100% 0 0% 3505 100%
Cement Clinker (IWT) 0 0% 2015 100% 0 0% 2015 100%
Granulated Slag IWT 0 0% 12131 100% 0 0% 12131 100%
Iron Ore 67437 30.02% 128041 57.00% 29152 12.98% 224630 100%
Fly Ash 0 0% 697445 100% 0 0% 697445 100%
General Export 21561 25.67% 62422 74.33% 0 0% 83983 100%
IVW Traffic 0 0% 58899 100% 0 0% 58899 100%
Total Export 139305 4.89% 2676825 94.08% 29152 1.02% 2845282 100%
Source: Kolkata Port Trust, Kolkata
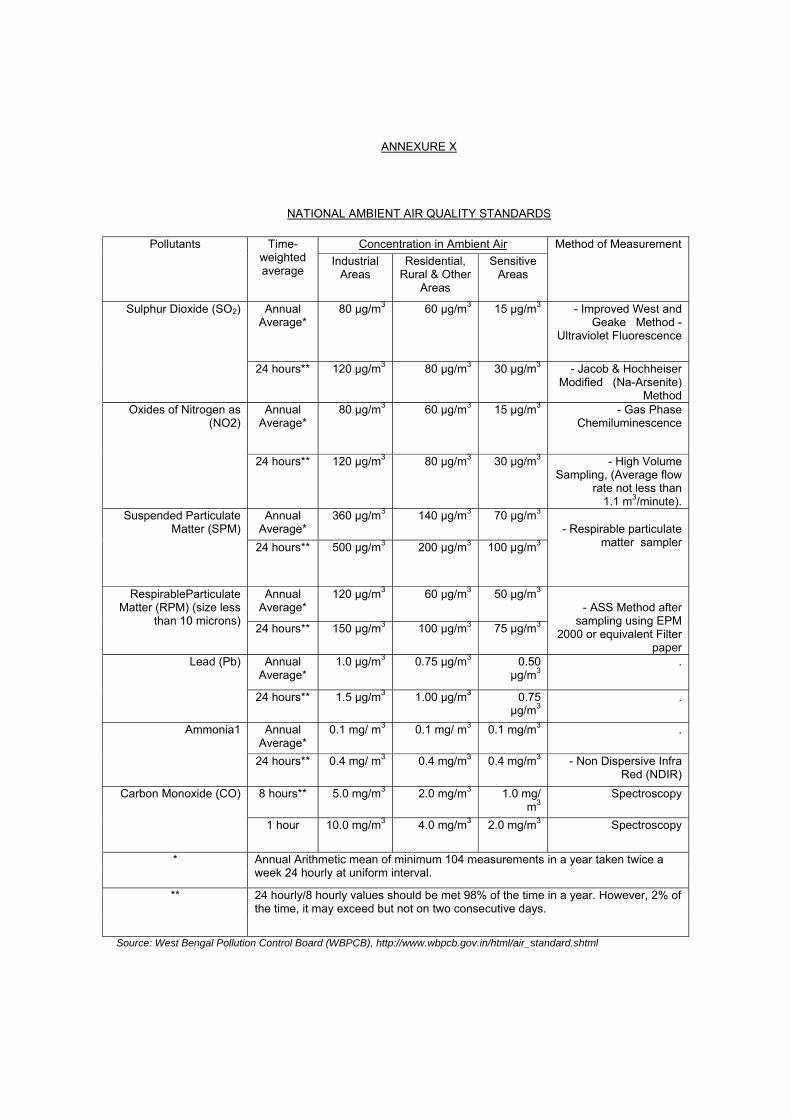
ANNEXURE X
NATIONAL AMBIENT AIR QUALITY STANDARDS
Concentration in Ambient Air Pollutants Time-weighted average
Industrial Areas
Residential, Rural & Other
Areas
Sensitive Areas
Method of Measurement
Annual Average*
80 µg/m3 60 µg/m3 15 µg/m3 - Improved West and Geake Method -
Ultraviolet Fluorescence
Sulphur Dioxide (SO2)
24 hours** 120 µg/m3 80 µg/m3 30 µg/m3 - Jacob & Hochheiser Modified (Na-Arsenite)
Method Annual
Average* 80 µg/m3 60 µg/m3 15 µg/m3 - Gas Phase
Chemiluminescence Oxides of Nitrogen as
(NO2)
24 hours** 120 µg/m3 80 µg/m3 30 µg/m3 - High Volume Sampling, (Average flow
rate not less than 1.1 m3/minute).
Annual Average*
360 µg/m3 140 µg/m3 70 µg/m3 Suspended Particulate Matter (SPM)
24 hours** 500 µg/m3 200 µg/m3 100 µg/m3
- Respirable particulate
matter sampler
Annual Average*
120 µg/m3 60 µg/m3 50 µg/m3 RespirableParticulate Matter (RPM) (size less
than 10 microns) 24 hours** 150 µg/m3 100 µg/m3 75 µg/m3
- ASS Method after
sampling using EPM 2000 or equivalent Filter
paper Annual
Average* 1.0 µg/m3 0.75 µg/m3 0.50
µg/m3 . Lead (Pb)
24 hours** 1.5 µg/m3 1.00 µg/m3 0.75 µg/m3
.
Annual Average*
0.1 mg/ m3 0.1 mg/ m3 0.1 mg/m3 . Ammonia1
24 hours** 0.4 mg/ m3 0.4 mg/m3 0.4 mg/m3 - Non Dispersive Infra Red (NDIR)
8 hours** 5.0 mg/m3 2.0 mg/m3 1.0 mg/ m3
Spectroscopy Carbon Monoxide (CO)
1 hour 10.0 mg/m3 4.0 mg/m3 2.0 mg/m3 Spectroscopy
* Annual Arithmetic mean of minimum 104 measurements in a year taken twice a week 24 hourly at uniform interval.
** 24 hourly/8 hourly values should be met 98% of the time in a year. However, 2% of the time, it may exceed but not on two consecutive days.
Source: West Bengal Pollution Control Board (WBPCB), http://www.wbpcb.gov.in/html/air_standard.shtml
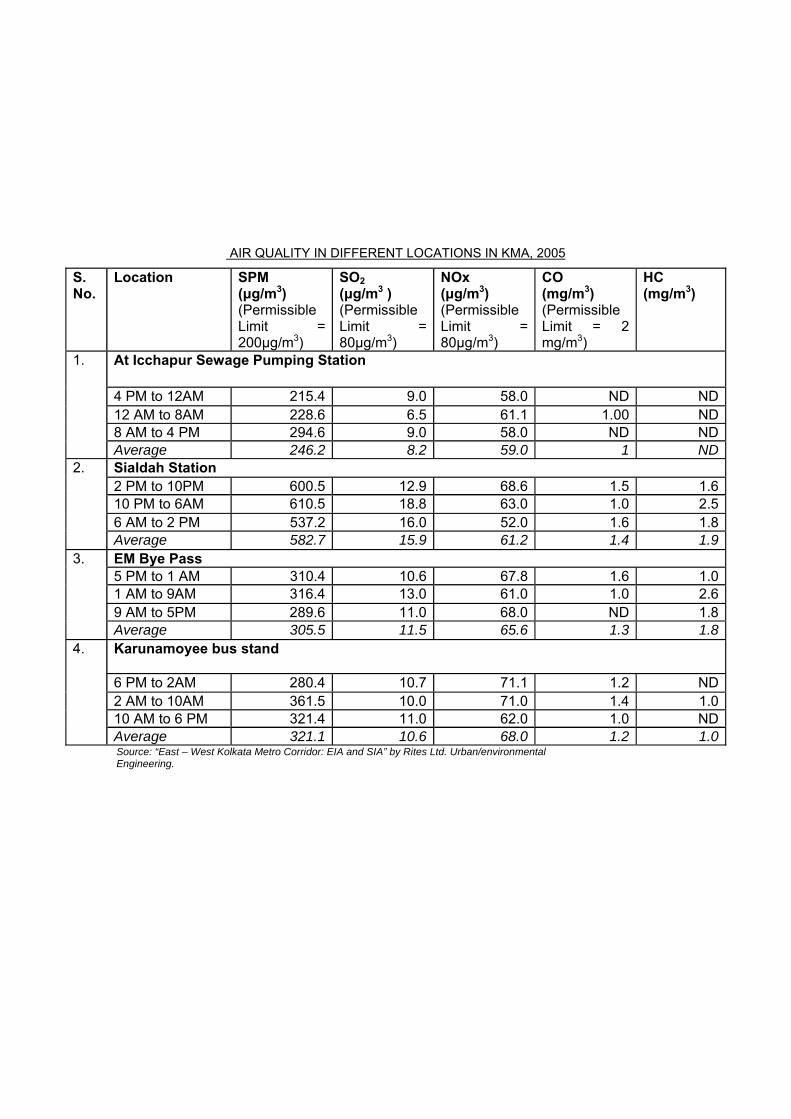
AIR QUALITY IN DIFFERENT LOCATIONS IN KMA, 2005
S. No.
Location SPM (μg/m3) (Permissible Limit = 200μg/m3)
SO2 (μg/m3 ) (Permissible Limit = 80μg/m3)
NOx (μg/m3) (Permissible Limit = 80μg/m3)
CO (mg/m3) (Permissible Limit = 2 mg/m3)
HC (mg/m3)
At Icchapur Sewage Pumping Station
4 PM to 12AM 215.4 9.0 58.0 ND ND 12 AM to 8AM 228.6 6.5 61.1 1.00 ND 8 AM to 4 PM 294.6 9.0 58.0 ND ND
1.
Average 246.2 8.2 59.0 1 ND Sialdah Station 2 PM to 10PM 600.5 12.9 68.6 1.5 1.6 10 PM to 6AM 610.5 18.8 63.0 1.0 2.5 6 AM to 2 PM 537.2 16.0 52.0 1.6 1.8
2.
Average 582.7 15.9 61.2 1.4 1.9 EM Bye Pass 5 PM to 1 AM 310.4 10.6 67.8 1.6 1.0 1 AM to 9AM 316.4 13.0 61.0 1.0 2.6 9 AM to 5PM 289.6 11.0 68.0 ND 1.8
3.
Average 305.5 11.5 65.6 1.3 1.8 Karunamoyee bus stand
6 PM to 2AM 280.4 10.7 71.1 1.2 ND 2 AM to 10AM 361.5 10.0 71.0 1.4 1.0 10 AM to 6 PM 321.4 11.0 62.0 1.0 ND
4.
Average 321.1 10.6 68.0 1.2 1.0 Source: “East – West Kolkata Metro Corridor: EIA and SIA” by Rites Ltd. Urban/environmental Engineering.
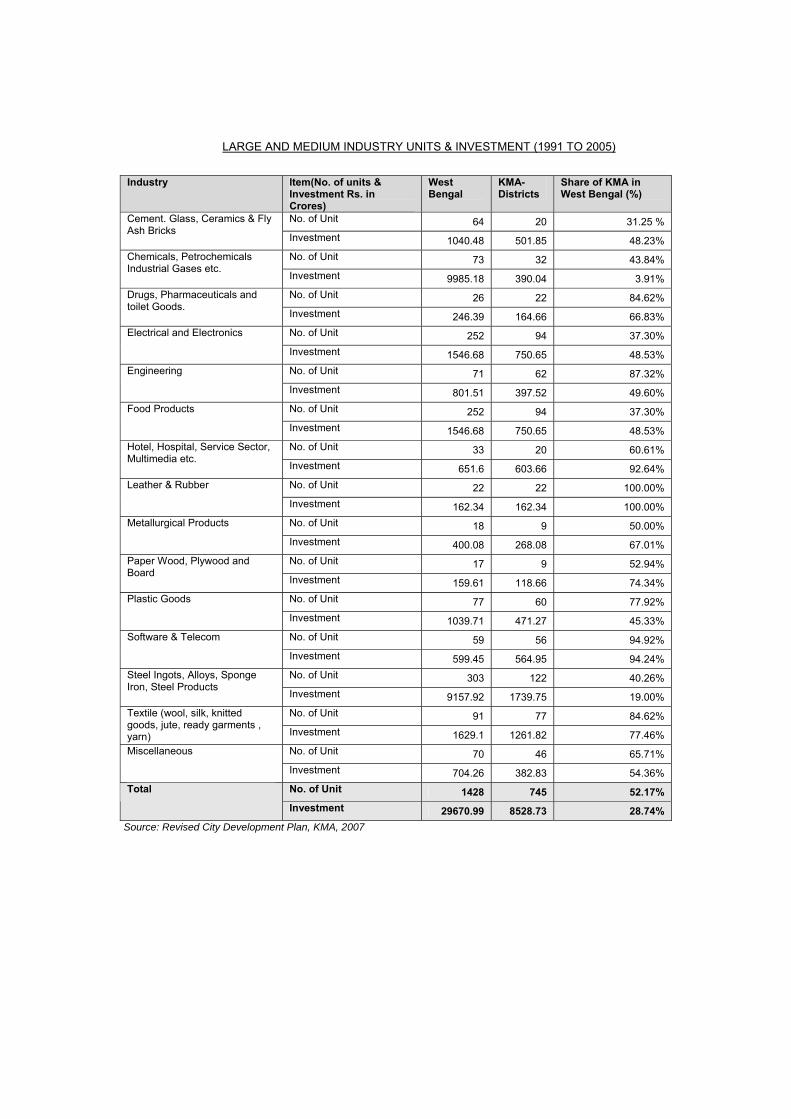
LARGE AND MEDIUM INDUSTRY UNITS & INVESTMENT (1991 TO 2005)
Industry Item(No. of units & Investment Rs. in Crores)
West Bengal
KMA- Districts
Share of KMA in West Bengal (%)
No. of Unit 64 20 31.25 % Cement. Glass, Ceramics & Fly Ash Bricks
Investment 1040.48 501.85 48.23% No. of Unit 73 32 43.84% Chemicals, Petrochemicals
Industrial Gases etc. Investment 9985.18 390.04 3.91% No. of Unit 26 22 84.62% Drugs, Pharmaceuticals and
toilet Goods. Investment 246.39 164.66 66.83% No. of Unit 252 94 37.30% Electrical and Electronics
Investment 1546.68 750.65 48.53% No. of Unit 71 62 87.32% Engineering
Investment 801.51 397.52 49.60% No. of Unit 252 94 37.30% Food Products
Investment 1546.68 750.65 48.53% No. of Unit 33 20 60.61% Hotel, Hospital, Service Sector,
Multimedia etc. Investment 651.6 603.66 92.64% No. of Unit 22 22 100.00% Leather & Rubber
Investment 162.34 162.34 100.00% No. of Unit 18 9 50.00% Metallurgical Products
Investment 400.08 268.08 67.01% No. of Unit 17 9 52.94% Paper Wood, Plywood and
Board Investment 159.61 118.66 74.34% No. of Unit 77 60 77.92% Plastic Goods
Investment 1039.71 471.27 45.33% No. of Unit 59 56 94.92% Software & Telecom
Investment 599.45 564.95 94.24% No. of Unit 303 122 40.26% Steel Ingots, Alloys, Sponge
Iron, Steel Products Investment 9157.92 1739.75 19.00% No. of Unit 91 77 84.62% Textile (wool, silk, knitted
goods, jute, ready garments , yarn) Investment 1629.1 1261.82 77.46%
No. of Unit 70 46 65.71% Miscellaneous
Investment 704.26 382.83 54.36% No. of Unit 1428 745 52.17% Total
Investment 29670.99 8528.73 28.74% Source: Revised City Development Plan, KMA, 2007
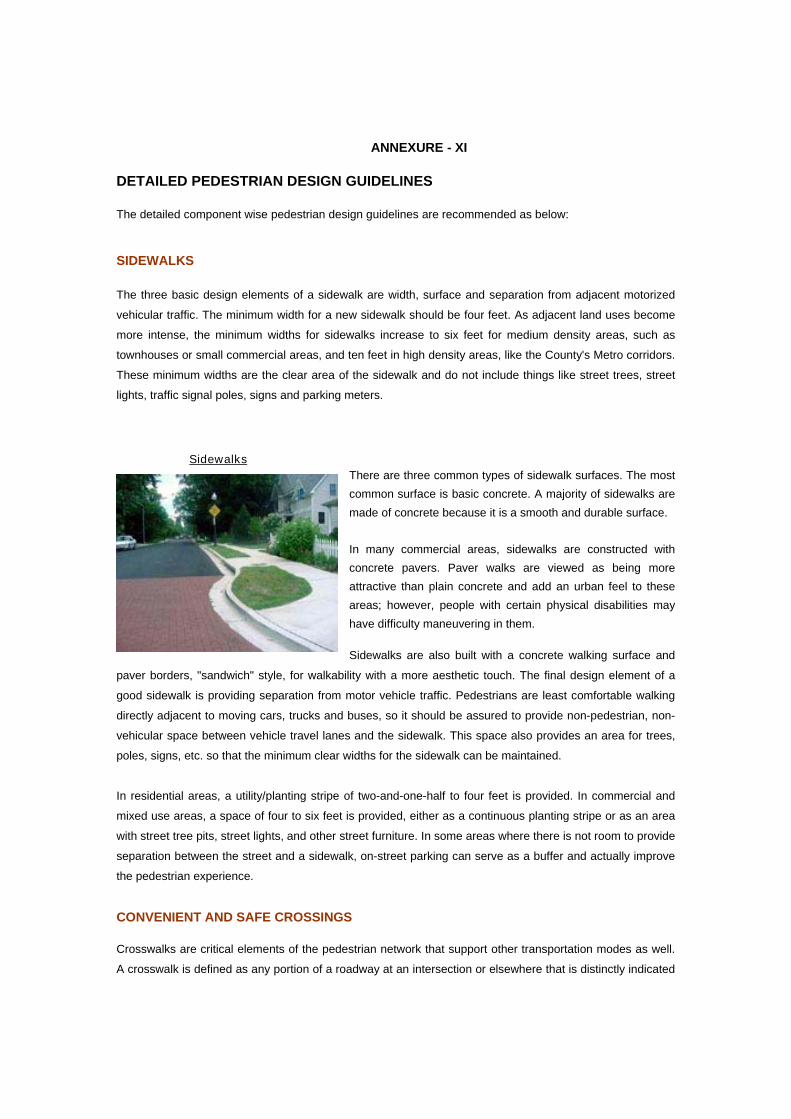
ANNEXURE - XI DETAILED PEDESTRIAN DESIGN GUIDELINES The detailed component wise pedestrian design guidelines are recommended as below: SIDEWALKS
The three basic design elements of a sidewalk are width, surface and separation from adjacent motorized
vehicular traffic. The minimum width for a new sidewalk should be four feet. As adjacent land uses become
more intense, the minimum widths for sidewalks increase to six feet for medium density areas, such as
townhouses or small commercial areas, and ten feet in high density areas, like the County's Metro corridors.
These minimum widths are the clear area of the sidewalk and do not include things like street trees, street
lights, traffic signal poles, signs and parking meters.
There are three common types of sidewalk surfaces. The most common surface is basic concrete. A majority of sidewalks are made of concrete because it is a smooth and durable surface.
In many commercial areas, sidewalks are constructed with concrete pavers. Paver walks are viewed as being more attractive than plain concrete and add an urban feel to these areas; however, people with certain physical disabilities may have difficulty maneuvering in them.
Sidewalks are also built with a concrete walking surface and
paver borders, "sandwich" style, for walkability with a more aesthetic touch. The final design element of a
good sidewalk is providing separation from motor vehicle traffic. Pedestrians are least comfortable walking
directly adjacent to moving cars, trucks and buses, so it should be assured to provide non-pedestrian, non-
vehicular space between vehicle travel lanes and the sidewalk. This space also provides an area for trees,
poles, signs, etc. so that the minimum clear widths for the sidewalk can be maintained.
In residential areas, a utility/planting stripe of two-and-one-half to four feet is provided. In commercial and
mixed use areas, a space of four to six feet is provided, either as a continuous planting stripe or as an area
with street tree pits, street lights, and other street furniture. In some areas where there is not room to provide
separation between the street and a sidewalk, on-street parking can serve as a buffer and actually improve
the pedestrian experience.
CONVENIENT AND SAFE CROSSINGS Crosswalks are critical elements of the pedestrian network that support other transportation modes as well.
A crosswalk is defined as any portion of a roadway at an intersection or elsewhere that is distinctly indicated
Sidewalks
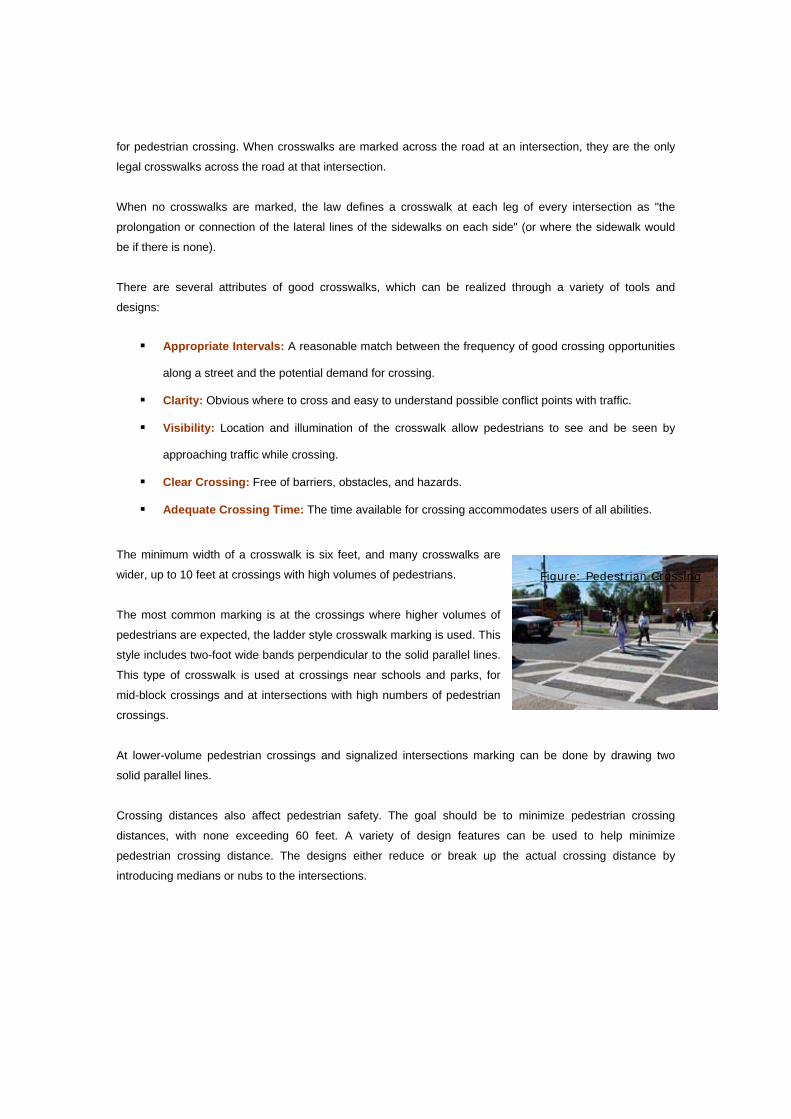
for pedestrian crossing. When crosswalks are marked across the road at an intersection, they are the only
legal crosswalks across the road at that intersection.
When no crosswalks are marked, the law defines a crosswalk at each leg of every intersection as "the
prolongation or connection of the lateral lines of the sidewalks on each side" (or where the sidewalk would
be if there is none).
There are several attributes of good crosswalks, which can be realized through a variety of tools and
designs:
Appropriate Intervals: A reasonable match between the frequency of good crossing opportunities
along a street and the potential demand for crossing.
Clarity: Obvious where to cross and easy to understand possible conflict points with traffic.
Visibility: Location and illumination of the crosswalk allow pedestrians to see and be seen by
approaching traffic while crossing.
Clear Crossing: Free of barriers, obstacles, and hazards.
Adequate Crossing Time: The time available for crossing accommodates users of all abilities.
The minimum width of a crosswalk is six feet, and many crosswalks are
wider, up to 10 feet at crossings with high volumes of pedestrians.
The most common marking is at the crossings where higher volumes of
pedestrians are expected, the ladder style crosswalk marking is used. This
style includes two-foot wide bands perpendicular to the solid parallel lines.
This type of crosswalk is used at crossings near schools and parks, for
mid-block crossings and at intersections with high numbers of pedestrian
crossings.
At lower-volume pedestrian crossings and signalized intersections marking can be done by drawing two
solid parallel lines.
Crossing distances also affect pedestrian safety. The goal should be to minimize pedestrian crossing
distances, with none exceeding 60 feet. A variety of design features can be used to help minimize
pedestrian crossing distance. The designs either reduce or break up the actual crossing distance by
introducing medians or nubs to the intersections.
Figure: Pedestrian Crossing
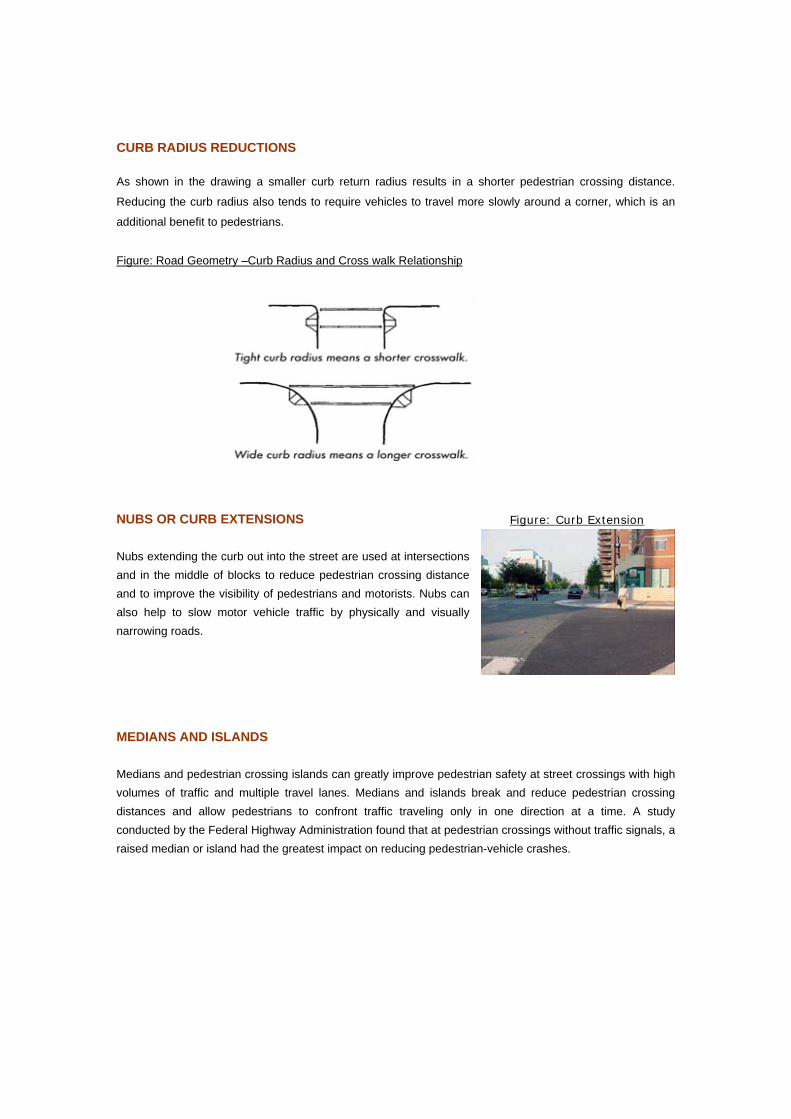
CURB RADIUS REDUCTIONS
As shown in the drawing a smaller curb return radius results in a shorter pedestrian crossing distance.
Reducing the curb radius also tends to require vehicles to travel more slowly around a corner, which is an
additional benefit to pedestrians.
Figure: Road Geometry –Curb Radius and Cross walk Relationship
NUBS OR CURB EXTENSIONS
Nubs extending the curb out into the street are used at intersections and in the middle of blocks to reduce pedestrian crossing distance and to improve the visibility of pedestrians and motorists. Nubs can also help to slow motor vehicle traffic by physically and visually narrowing roads.
MEDIANS AND ISLANDS
Medians and pedestrian crossing islands can greatly improve pedestrian safety at street crossings with high volumes of traffic and multiple travel lanes. Medians and islands break and reduce pedestrian crossing distances and allow pedestrians to confront traffic traveling only in one direction at a time. A study conducted by the Federal Highway Administration found that at pedestrian crossings without traffic signals, a raised median or island had the greatest impact on reducing pedestrian-vehicle crashes.
Figure: Curb Extension
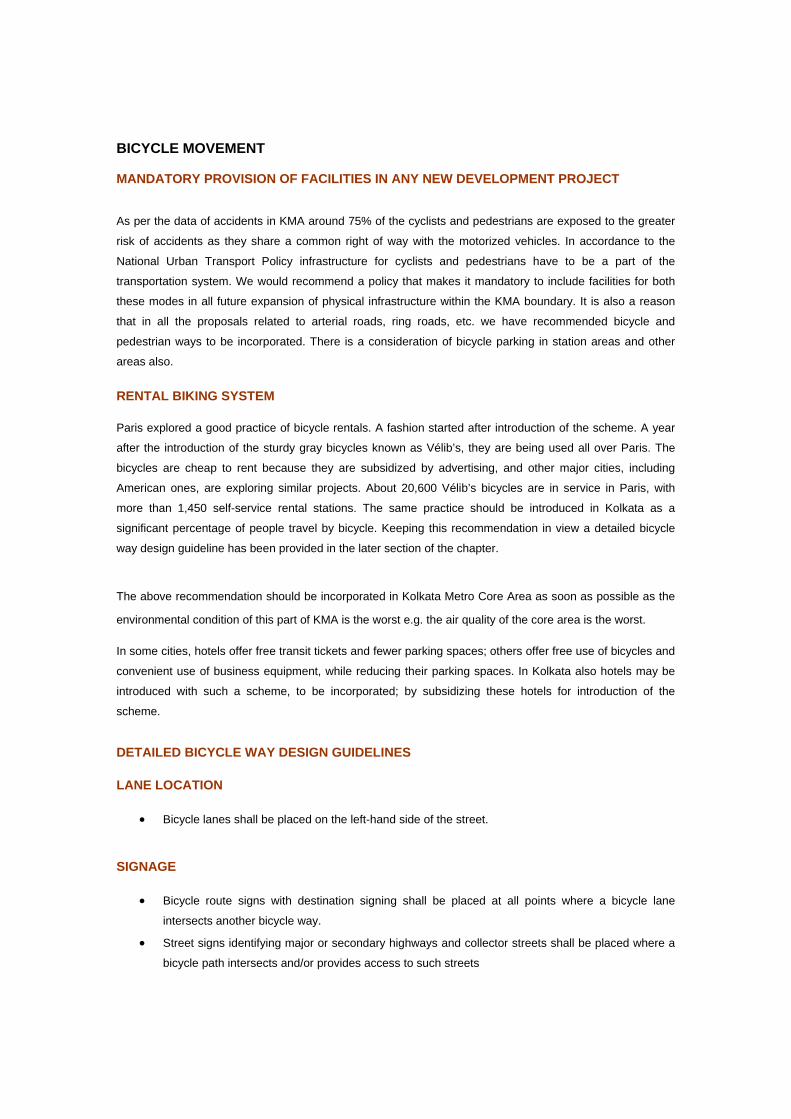
BICYCLE MOVEMENT MANDATORY PROVISION OF FACILITIES IN ANY NEW DEVELOPMENT PROJECT As per the data of accidents in KMA around 75% of the cyclists and pedestrians are exposed to the greater
risk of accidents as they share a common right of way with the motorized vehicles. In accordance to the
National Urban Transport Policy infrastructure for cyclists and pedestrians have to be a part of the
transportation system. We would recommend a policy that makes it mandatory to include facilities for both
these modes in all future expansion of physical infrastructure within the KMA boundary. It is also a reason
that in all the proposals related to arterial roads, ring roads, etc. we have recommended bicycle and
pedestrian ways to be incorporated. There is a consideration of bicycle parking in station areas and other
areas also.
RENTAL BIKING SYSTEM Paris explored a good practice of bicycle rentals. A fashion started after introduction of the scheme. A year
after the introduction of the sturdy gray bicycles known as Vélib’s, they are being used all over Paris. The
bicycles are cheap to rent because they are subsidized by advertising, and other major cities, including
American ones, are exploring similar projects. About 20,600 Vélib’s bicycles are in service in Paris, with
more than 1,450 self-service rental stations. The same practice should be introduced in Kolkata as a
significant percentage of people travel by bicycle. Keeping this recommendation in view a detailed bicycle
way design guideline has been provided in the later section of the chapter.
The above recommendation should be incorporated in Kolkata Metro Core Area as soon as possible as the
environmental condition of this part of KMA is the worst e.g. the air quality of the core area is the worst.
In some cities, hotels offer free transit tickets and fewer parking spaces; others offer free use of bicycles and
convenient use of business equipment, while reducing their parking spaces. In Kolkata also hotels may be
introduced with such a scheme, to be incorporated; by subsidizing these hotels for introduction of the
scheme.
DETAILED BICYCLE WAY DESIGN GUIDELINES LANE LOCATION
• Bicycle lanes shall be placed on the left-hand side of the street.
SIGNAGE
• Bicycle route signs with destination signing shall be placed at all points where a bicycle lane
intersects another bicycle way.
• Street signs identifying major or secondary highways and collector streets shall be placed where a
bicycle path intersects and/or provides access to such streets
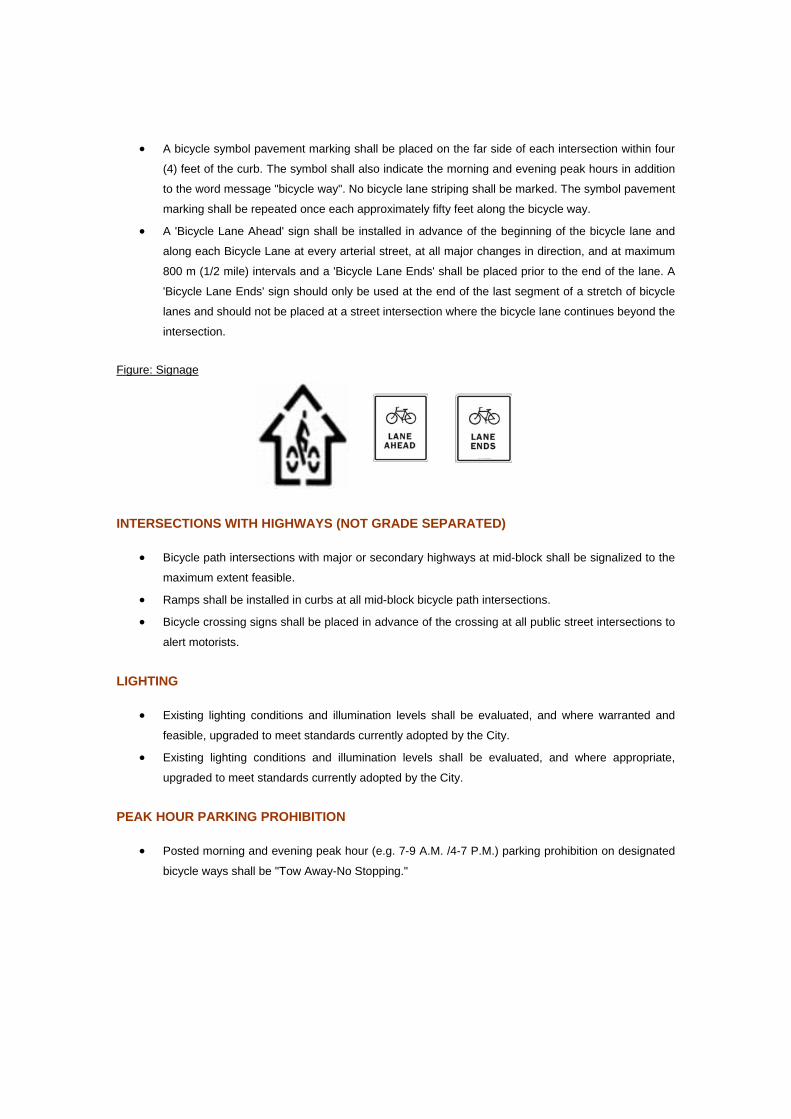
• A bicycle symbol pavement marking shall be placed on the far side of each intersection within four
(4) feet of the curb. The symbol shall also indicate the morning and evening peak hours in addition
to the word message "bicycle way". No bicycle lane striping shall be marked. The symbol pavement
marking shall be repeated once each approximately fifty feet along the bicycle way.
• A 'Bicycle Lane Ahead' sign shall be installed in advance of the beginning of the bicycle lane and
along each Bicycle Lane at every arterial street, at all major changes in direction, and at maximum
800 m (1/2 mile) intervals and a 'Bicycle Lane Ends' shall be placed prior to the end of the lane. A
'Bicycle Lane Ends' sign should only be used at the end of the last segment of a stretch of bicycle
lanes and should not be placed at a street intersection where the bicycle lane continues beyond the
intersection.
Figure: Signage
INTERSECTIONS WITH HIGHWAYS (NOT GRADE SEPARATED)
• Bicycle path intersections with major or secondary highways at mid-block shall be signalized to the
maximum extent feasible.
• Ramps shall be installed in curbs at all mid-block bicycle path intersections.
• Bicycle crossing signs shall be placed in advance of the crossing at all public street intersections to
alert motorists.
LIGHTING
• Existing lighting conditions and illumination levels shall be evaluated, and where warranted and
feasible, upgraded to meet standards currently adopted by the City.
• Existing lighting conditions and illumination levels shall be evaluated, and where appropriate,
upgraded to meet standards currently adopted by the City.
PEAK HOUR PARKING PROHIBITION
• Posted morning and evening peak hour (e.g. 7-9 A.M. /4-7 P.M.) parking prohibition on designated
bicycle ways shall be "Tow Away-No Stopping."
WIDTH
• Minimum bicycle lane width shall be four (4) feet. In case a four feet bicycle lane is proposed, it
should not include a joint with the gutter pan, or that drainage grates take up some of the width. A
four feet bicycle lane should be clear of all surface irregularities.
LINE TYPE AND THICKNESS
• Bicycle lanes may be marked with three different lines. When a bicycle lane is striped against a
curb and parking is prohibited, an 8-inch solid white line may be used to separate the bicycle lane
from the adjacent travel lane.
• On streets with on-street parking, a 4-inch wide solid white line may be used to define the parking
lane and a 6-inch wide solid white line to define the outer edge of the bicycle lane.
Where the outer line is dashed, the dash (or dot) may be 2 feet long and 6 inches wide, with a six foot gap
between dashes.
PARKING POLICIES The Parking policy should deal with the followings:
• Generation of off-street car parking facilities for all categories of developments in the newly developing areas, new townships, Greenfield project sites and in the fringe areas of the municipalities.
• Generation of off-street car parking facilities in already built -up areas at the
locations of major vehicular and pedestrian concentrations.
• Rational use of existing parking spaces by pricing mechanism.
• Regulations for on-street parking.
• Management of parking facilities.
• Monitoring and enforcement measures for violation of regulations for parking. The aspects to be considered in finalizing the above mentioned components of the proposed Parking Policy have been dealt in brief in the following paragraphs. GENERATION OF OFF-STREET CAR PARKING FACILITIES FOR ALL CATEGORIES OF NEW DEVELOPMENTS
All new developments must provide parking facilities for vehicles to be generated in the area in respect of
the total floor area as per the guidelines of the Urban Development Plan Formulation and Implementation
(UDPFI) or the National Building Code (NBC) or any other Development Control Regulations formulated for
the particular areas.
Incentives in F.A.R To encourage generation of additional parking facilities to be used for public car parking , incentives in the
form of F.A.R may be allowed subject to the condition that the additional car parking lot is free gifted to the
ULB or the civic authority .
Parking facilities for transit and paratransit vehicles The provision of parking areas for transit vehicles viz buses .minibuses and paratransit vehicles viz. taxis,
autorickshaws and cycle rickshaws should be planned by the local body at nodal locations on land
belonging to the Government or the local authority. Where such land with public ownership is not available
private plot owners may be given incentives in the form of additional floor area over and above the
permissible limit for free gifting of land to local bodies for arrangement of parking facilities for transit and
paratransit vehicles.
To ensure generation of parking facilities for paratransit vehicles viz. Cycle Rickshaws, Taxis and
Autorickshaws at the specified nodal locations to be identified by the ULB/ Planning Authority, incentives in
the form of additional F.A.R may be provided subject to the condition that the parking spaces are free gifted
to the ULB/Civic authority and that at least a minimum number of such parking facility say 10-15 is provided
and handed over to the ULB. For example, if a plot owner free gifts 10 % of the plot area for provision of
public parking facilities and widening of the adjoining road, he will be allowed to build 1.2 times the floor
area he was entitled in the free gifted parcel of the plot as per the permissible F.A.R in the plot. Similarly for
free gifting of plot area of 20% or more, the plot owner will be allowed to build 1.25 times the floor area he
was entitled in the free gifted parcel of the plot as per the permissible F.A.R in the plot.
This provision of incentive in floor area for free gifting of land towards public parking spaces and for
widening of the road will be subject to the approval of the local authority.
Parking facilities for commercial, business and assembly buildings For commercial, business and assembly buildings, where the duration of parking of the vehicles are
generally longer, multilevel parking facilities would be encouraged with basement parking and car parking
facility on elevated structures with electrical lifts. The built up areas for such parking facilities would not be
counted towards the permissible floor areas in FAR. In case of basement parking, the basement structure
may be allowed to cover upto 75% of the plot area below the ground level subject to the approval of the
local authority and provision of the underground utilities.
The present stipulations for compulsory provision of parking facilities in different categories of buildings in
different development control zones in the Land Use and Development Control Plans (LUDCP) prepared by
KMDA under the provisions of the West Bengal Town & Country ( P&D ) Act need to be reviewed and
additional parking facilities to be ensured to cater the increasing vehicle ownership and the resulting
increased demand for parking.
GENERATION OF OFF-STREET CAR PARKING FACILITIES IN ALREADY BUILT UP AREAS AT LOCATION OF MAJOR VEHICULAR AND PEDESTRIAN CONCENTRATION. Off-street vehicle parking facilities to be generated in built up areas near office complexes, shopping
complexes , cultural activity zones or major passenger terminals by providing basement parking in nearest
parks or public open spaces and by the construction of multistoried parking structures with commercial
activities over the existing bus terminals and depots.
The development control regulations for such areas should have the mandatory provision of public parking
facilities in cases of redevelopment of existing structures. This should also be supplemented with incentives
towards F.A.R.
Every vehicle trip requires parking at the two ends. This is an integrated component of the road transport
system. Inadequate parking facilities act as deterrent to the movement of vehicular trips and act as
hindrances to the proper functioning of urban activities. While adequate parking facilities for vehicular traffic
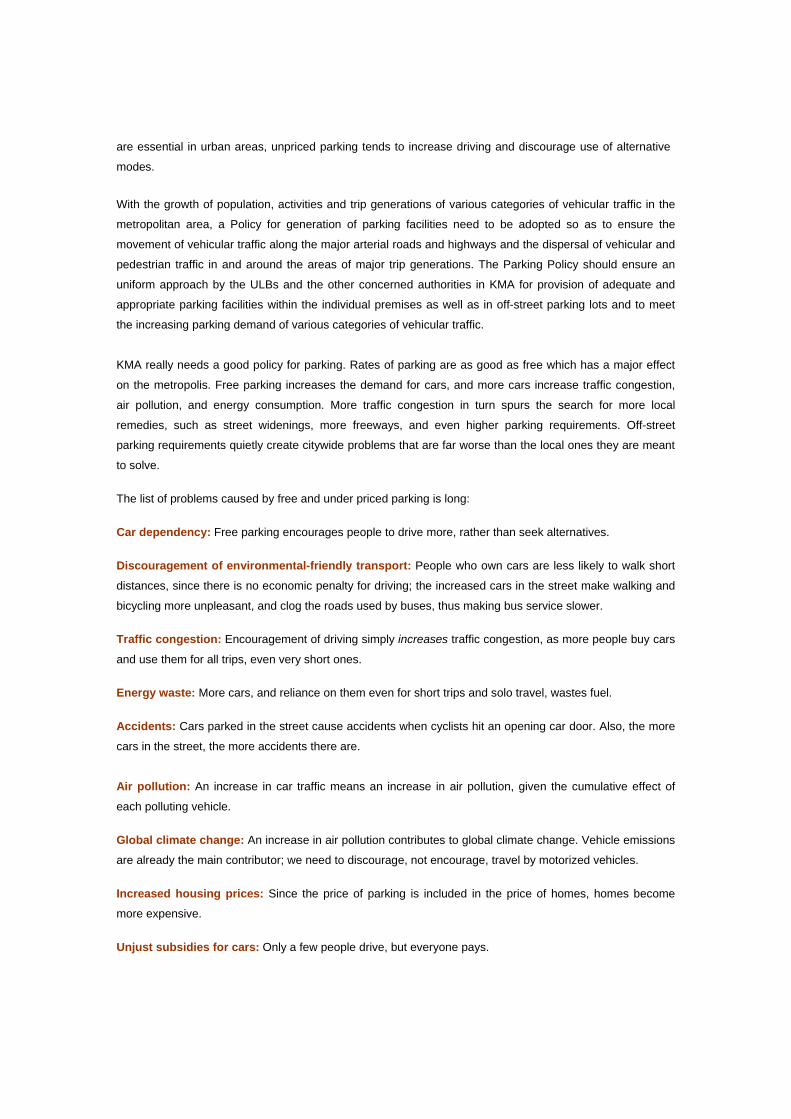
are essential in urban areas, unpriced parking tends to increase driving and discourage use of alternative
modes.
With the growth of population, activities and trip generations of various categories of vehicular traffic in the
metropolitan area, a Policy for generation of parking facilities need to be adopted so as to ensure the
movement of vehicular traffic along the major arterial roads and highways and the dispersal of vehicular and
pedestrian traffic in and around the areas of major trip generations. The Parking Policy should ensure an
uniform approach by the ULBs and the other concerned authorities in KMA for provision of adequate and
appropriate parking facilities within the individual premises as well as in off-street parking lots and to meet
the increasing parking demand of various categories of vehicular traffic.
KMA really needs a good policy for parking. Rates of parking are as good as free which has a major effect
on the metropolis. Free parking increases the demand for cars, and more cars increase traffic congestion,
air pollution, and energy consumption. More traffic congestion in turn spurs the search for more local
remedies, such as street widenings, more freeways, and even higher parking requirements. Off-street
parking requirements quietly create citywide problems that are far worse than the local ones they are meant
to solve.
The list of problems caused by free and under priced parking is long:
Car dependency: Free parking encourages people to drive more, rather than seek alternatives.
Discouragement of environmental-friendly transport: People who own cars are less likely to walk short
distances, since there is no economic penalty for driving; the increased cars in the street make walking and
bicycling more unpleasant, and clog the roads used by buses, thus making bus service slower.
Traffic congestion: Encouragement of driving simply increases traffic congestion, as more people buy cars
and use them for all trips, even very short ones.
Energy waste: More cars, and reliance on them even for short trips and solo travel, wastes fuel.
Accidents: Cars parked in the street cause accidents when cyclists hit an opening car door. Also, the more
cars in the street, the more accidents there are.
Air pollution: An increase in car traffic means an increase in air pollution, given the cumulative effect of
each polluting vehicle.
Global climate change: An increase in air pollution contributes to global climate change. Vehicle emissions
are already the main contributor; we need to discourage, not encourage, travel by motorized vehicles.
Increased housing prices: Since the price of parking is included in the price of homes, homes become
more expensive.
Unjust subsidies for cars: Only a few people drive, but everyone pays.
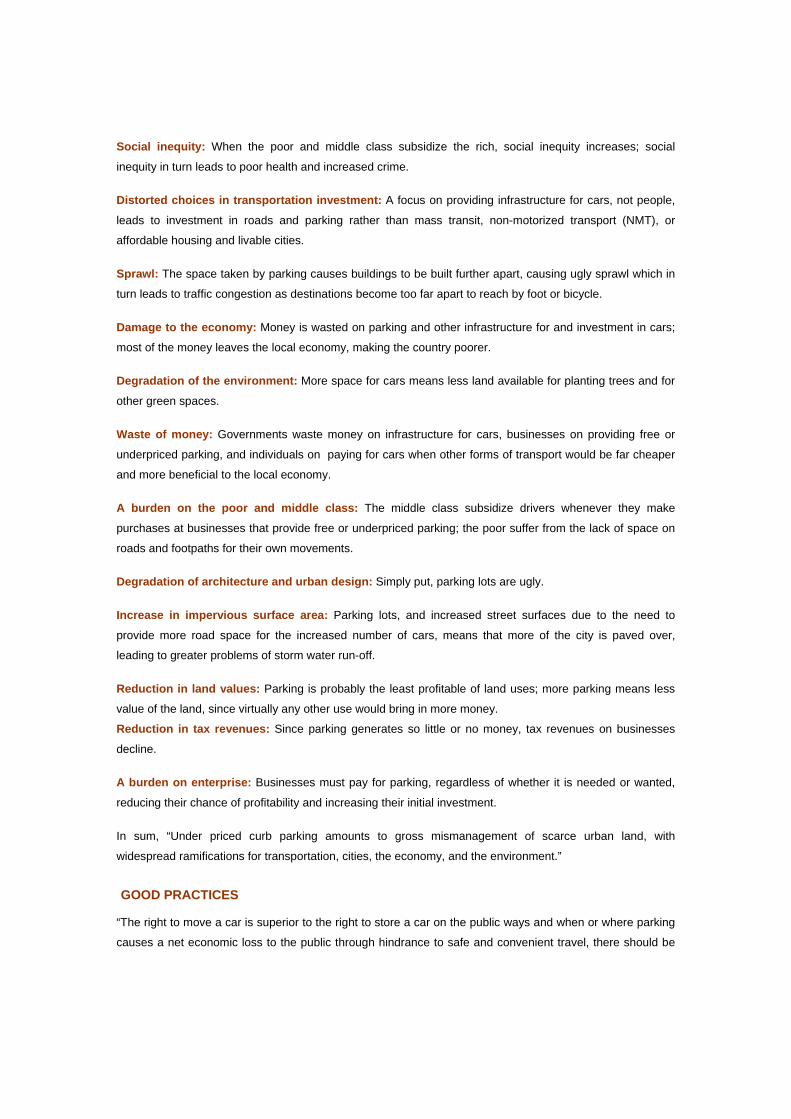
Social inequity: When the poor and middle class subsidize the rich, social inequity increases; social
inequity in turn leads to poor health and increased crime.
Distorted choices in transportation investment: A focus on providing infrastructure for cars, not people,
leads to investment in roads and parking rather than mass transit, non-motorized transport (NMT), or
affordable housing and livable cities.
Sprawl: The space taken by parking causes buildings to be built further apart, causing ugly sprawl which in
turn leads to traffic congestion as destinations become too far apart to reach by foot or bicycle.
Damage to the economy: Money is wasted on parking and other infrastructure for and investment in cars;
most of the money leaves the local economy, making the country poorer.
Degradation of the environment: More space for cars means less land available for planting trees and for
other green spaces.
Waste of money: Governments waste money on infrastructure for cars, businesses on providing free or
underpriced parking, and individuals on paying for cars when other forms of transport would be far cheaper
and more beneficial to the local economy.
A burden on the poor and middle class: The middle class subsidize drivers whenever they make
purchases at businesses that provide free or underpriced parking; the poor suffer from the lack of space on
roads and footpaths for their own movements.
Degradation of architecture and urban design: Simply put, parking lots are ugly.
Increase in impervious surface area: Parking lots, and increased street surfaces due to the need to
provide more road space for the increased number of cars, means that more of the city is paved over,
leading to greater problems of storm water run-off.
Reduction in land values: Parking is probably the least profitable of land uses; more parking means less
value of the land, since virtually any other use would bring in more money.
Reduction in tax revenues: Since parking generates so little or no money, tax revenues on businesses
decline.
A burden on enterprise: Businesses must pay for parking, regardless of whether it is needed or wanted,
reducing their chance of profitability and increasing their initial investment.
In sum, “Under priced curb parking amounts to gross mismanagement of scarce urban land, with
widespread ramifications for transportation, cities, the economy, and the environment.”
GOOD PRACTICES “The right to move a car is superior to the right to store a car on the public ways and when or where parking
causes a net economic loss to the public through hindrance to safe and convenient travel, there should be
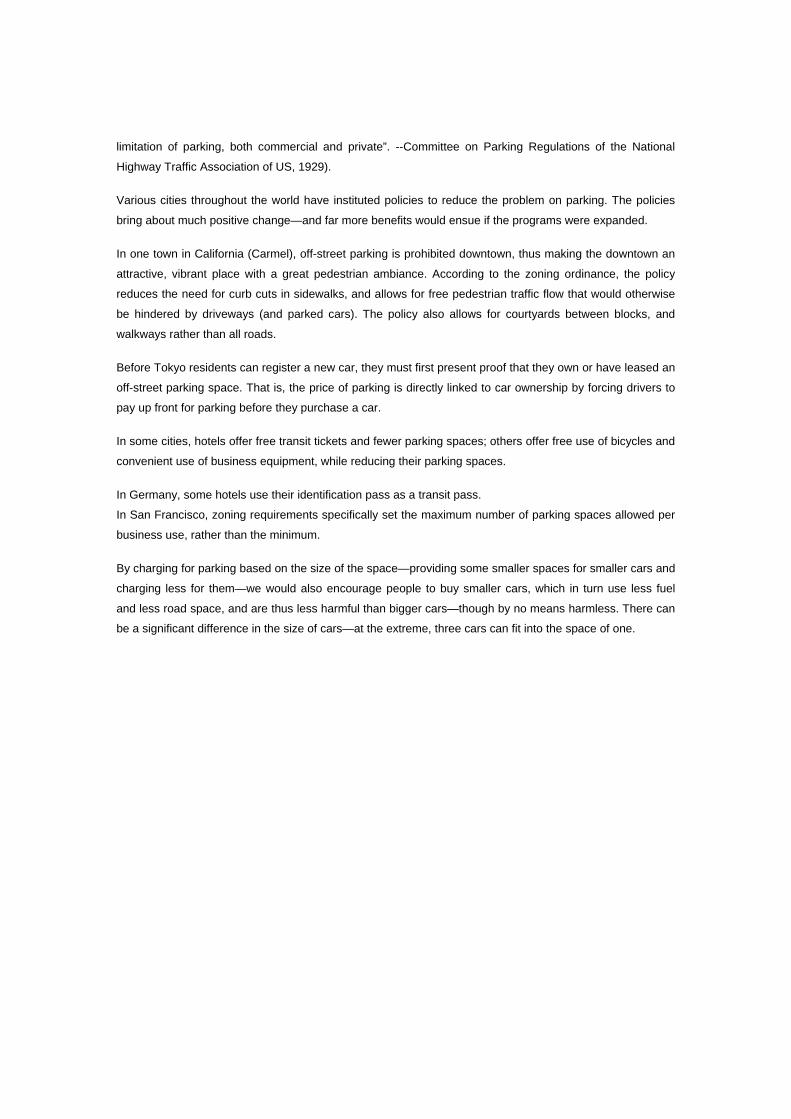
limitation of parking, both commercial and private”. --Committee on Parking Regulations of the National
Highway Traffic Association of US, 1929).
Various cities throughout the world have instituted policies to reduce the problem on parking. The policies
bring about much positive change—and far more benefits would ensue if the programs were expanded.
In one town in California (Carmel), off-street parking is prohibited downtown, thus making the downtown an
attractive, vibrant place with a great pedestrian ambiance. According to the zoning ordinance, the policy
reduces the need for curb cuts in sidewalks, and allows for free pedestrian traffic flow that would otherwise
be hindered by driveways (and parked cars). The policy also allows for courtyards between blocks, and
walkways rather than all roads.
Before Tokyo residents can register a new car, they must first present proof that they own or have leased an
off-street parking space. That is, the price of parking is directly linked to car ownership by forcing drivers to
pay up front for parking before they purchase a car.
In some cities, hotels offer free transit tickets and fewer parking spaces; others offer free use of bicycles and
convenient use of business equipment, while reducing their parking spaces.
In Germany, some hotels use their identification pass as a transit pass.
In San Francisco, zoning requirements specifically set the maximum number of parking spaces allowed per
business use, rather than the minimum.
By charging for parking based on the size of the space—providing some smaller spaces for smaller cars and
charging less for them—we would also encourage people to buy smaller cars, which in turn use less fuel
and less road space, and are thus less harmful than bigger cars—though by no means harmless. There can
be a significant difference in the size of cars—at the extreme, three cars can fit into the space of one.
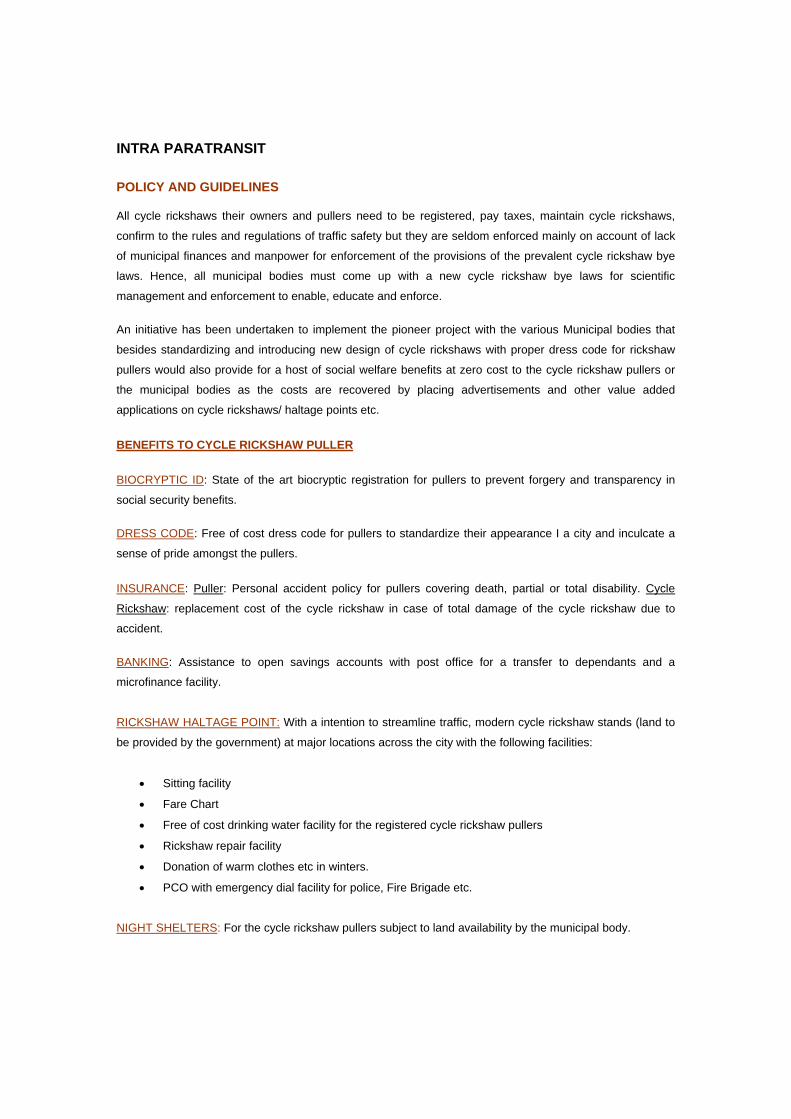
INTRA PARATRANSIT POLICY AND GUIDELINES All cycle rickshaws their owners and pullers need to be registered, pay taxes, maintain cycle rickshaws,
confirm to the rules and regulations of traffic safety but they are seldom enforced mainly on account of lack
of municipal finances and manpower for enforcement of the provisions of the prevalent cycle rickshaw bye
laws. Hence, all municipal bodies must come up with a new cycle rickshaw bye laws for scientific
management and enforcement to enable, educate and enforce.
An initiative has been undertaken to implement the pioneer project with the various Municipal bodies that
besides standardizing and introducing new design of cycle rickshaws with proper dress code for rickshaw
pullers would also provide for a host of social welfare benefits at zero cost to the cycle rickshaw pullers or
the municipal bodies as the costs are recovered by placing advertisements and other value added
applications on cycle rickshaws/ haltage points etc.
BENEFITS TO CYCLE RICKSHAW PULLER
BIOCRYPTIC ID: State of the art biocryptic registration for pullers to prevent forgery and transparency in
social security benefits.
DRESS CODE: Free of cost dress code for pullers to standardize their appearance I a city and inculcate a
sense of pride amongst the pullers.
INSURANCE: Puller: Personal accident policy for pullers covering death, partial or total disability. Cycle
Rickshaw: replacement cost of the cycle rickshaw in case of total damage of the cycle rickshaw due to
accident.
BANKING: Assistance to open savings accounts with post office for a transfer to dependants and a
microfinance facility.
RICKSHAW HALTAGE POINT: With a intention to streamline traffic, modern cycle rickshaw stands (land to
be provided by the government) at major locations across the city with the following facilities:
• Sitting facility
• Fare Chart
• Free of cost drinking water facility for the registered cycle rickshaw pullers
• Rickshaw repair facility
• Donation of warm clothes etc in winters.
• PCO with emergency dial facility for police, Fire Brigade etc.
NIGHT SHELTERS: For the cycle rickshaw pullers subject to land availability by the municipal body.
BENEFITS TO THE PASSENGER
• Better last mile green connectivity at doorstep with pleasurable passenger experience
• Safety of passengers especially school children since every cycle rickshaw puller’s biographic
details are being sent to police for verification as well as all records automated, for faster profiling
and targeting in case of an incident involving cycle rickshaw pullers.
NATIONAL BENEFITS
• Contribution to control of global warming: Cycle Rickshaw, being non polluting source of transport,
contributes to mitigation efforts against global warming that can have disastrous consequences on
the Indian economy on account of shifting weather patterns etc.
• Reduces fuel subsidy burden
BALANCED PARTICIPATION OF PUBLIC SECTORS AND PRIVATE SECTORS
In the development of the transport infrastructures and in providing transport services within the metropolis,
there should be participation of both the public sector and the private sector. So far the most of the transport
infrastructure development efforts have been restricted to the public sectors. In view of the high
development costs and the limitations of the public fund, more involvement of the private sectors should be
attempted. Particularly in the development of new highways and bridges there is scope for participation of
the private sectors.
In the operation of surface transit system in the metropolis, the private operators share the major role. The
ratio of the total surface transit passenger volume carried daily within the metropolis by the private operators
and the public sector transport operators at present is about 80: 20. To cater the future increased load both
the sectors would have to carry higher passenger volumes. In this respect attention should be given so that
the share of private to public can be achieved in a more balanced way.
CONGESTION PRICE Congestion pricing or congestion charges are a system of surcharging users of a transport network in
periods of peak demand to reduce traffic congestion. Examples include road pricing, and higher peak
charges for utilities, public transport and slots in canals and airports. Congestion pricing charges a premium
to road users who want to drive during peak periods such as rush hour or holiday weekends. Drivers pay a
toll to enter congested areas. The toll varies according to the level of congestion with higher tolls during
peak hours or in peak directions.
This variable pricing regulates demand, making it possible to manage congestion without increasing supply.
At the same time users will be forced to contribute to the negative externalities, covering the costs incurred
by other users who spend more time in traffic, and the impact on the environment.
The application on urban roads is limited to a small number of cities, including London, Stockholm and
Singapore, as well as a few smaller towns. Four general types of systems are in use; a cordon area around
a city center, with charges for passing the cordon line; area wide congestion pricing, which charges for being
inside an area; a city center toll ring, with toll collection surrounding the city; and corridor or single facility
congestion pricing, where access to a lane or a facility is priced.
Implementation of congestion pricing has reduced congestion, but has also sparked criticism and public
discontent. Critics maintain that congestion pricing is not equitable, places an economic burden on
neighboring communities, has a negative effect on retail businesses and on economic activity in general,
and is just another tax.
This concept has been explored for many years, and it has been successfully applied in public airline
pricing, public utility pricing and other areas of transportation and the private economy.
Proponents of congestion pricing claim the strategy would work in crowded traffic lanes because the peak-
hour users of the transportation system would be charged directly and proportionally. During peak periods,
users (not the entire community) would pay a fee in exchange for greater convenience, fewer delays, and
prompt access to a free-flowing highway lane. Revenue from these fees could be used to help support
alternative forms of transportation and other environmental measures.
DESCRIPTION
Congestion pricing is a concept from market economics regarding the use of pricing mechanisms to charge
the users of public goods for the negative externalities generated by the peak demand in excess of available
supply. Its economic rationale is that, at a price of zero, demand exceeds supply, causing a shortage, and
that the shortage should be corrected by charging the equilibrium price rather than shifting it down by
increasing the supply. Usually this means increasing prices during certain periods of time or at the places
where congestion occurs; or introducing a new usage tax or charge when peak demand exceeds available
supply in the case of a tax-funded public good provided free at the point of usage.
According to the economic theory behind congestion pricing, the objective of this policy is the use of the
price mechanism to make users more aware of the costs that they impose upon one another when
consuming during the peak demand, and that they should pay for the additional congestion they create, thus
encouraging the redistribution of the demand in space or in time or shifting it to the consumption of a
substitute public good; for example, switching from private transport to public transport.
Congestion pricing is one of a number of alternative demand side (as opposed to supply side) strategies
offered by economists to address traffic congestion. Congestion is considered a negative externality by
economists. An externality occurs when a transaction causes costs or benefits to third party, often, although
not necessarily, from the use of a public good. For example, manufacturing or transportation causes air
pollution imposing costs on others when making use of public air. Congestion pricing is an efficiency pricing
strategy that requires the users to pay more for that public good, thus increasing the welfare gain or net
benefit for society.
Nobel-laureate William Vickrey is considered one of the fathers of congestion pricing, as he first proposed it
for the New York City Subway system in 1952. In the road transportation arena these theories were
extended by Maurice Allais, Gabriel Roth who was instrumental in the first designs and upon whose World
Bank recommendation the first system was put in place in Singapore, and Reuben Smeed, the deputy
director of the Transport and Road Research Laboratory.
WHY CONGESTION PRICING? Congestion has major negative implications, including adverse impacts on air pollution and energy use, as
well as billions of dollars in lost time to individuals and businesses. Traditional responses, such as building
additional capacity or regulating demand, have had limited effects. Adding capacity is very expensive,
provides only temporary relief, and exacerbates air quality and land-use impacts. Command- and control-
based restriction, fail to recognize the wide variations of travel needs, and have not produced lasting relief in
congestion. Congestion pricing, on the other hand, has some key advantages that enable it to be used to
manage demand effectively and also to determine where future capacity expansion is most desirable:
congestion pricing relies on market forces, recognizes spatial and temporal variation, offers choices, and
promises new revenues. Variable pricing is widely used in other sectors, such as telephone service, energy
utilities, airlines, and hotel expenses in resort areas. The major reasons for congestion pricing not being
implemented more widely are political, not technical. The primary reason is that it is difficult to charge for
something always taken for granted as free. Consumers need to recognize that only the initial construction
costs have been paid for, while maintenance costs continue. In addition to maintenance costs, there are
other costs, such as emissions and congestion delays, which are not directly paid for by users. Technology
advances offer many new options, and issues of cost and feasibility need to be evaluated.
Currently, many environmental externalities are not included in the prices facing transportation consumers,
and this leads to decisions to build excess capacity. Existing transportation models often do not address
mode shift, time-of-day shift, auto ownership rates, and the land-use impacts of pricing. Congestion pricing
offers a powerful tool to address a number of goals. It is important, however, to consider impacts on social
equity, particularly given the importance of transportation in facilitating the welfare-to-work transition. It may
be appropriate to develop minimum levels of universal service, as is the case in the telephone and energy
utility sector. In a collaborative multi-stakeholder planning process, it is important to examine many issues
often considered to be out of the purview of congestion pricing. The impact on social equity will depend to a
large degree upon how transit service is affected.
CASE STUDY Experience in other countries1, particularly in France, demonstrates that congestion pricing does
significantly reduce gridlock during peak traffic periods. America's top scientific organizations, including the
prestigious National Academy of Sciences, also give high marks to congestion pricing. In its 1995 two-
volume report, Curbing Gridlock: Peak-Period Fees to Relieve Traffic Congestion, the academy praises
congestion pricing as a potentially powerful tool to persuade people to carpool, use transit, telecommute,
vary the times they travel, alter their routes, choose other destinations, or avoid or combine some trips.
In a separate California study, researchers found that congestion pricing and other market-based
transportation pricing measures offer great potential for reducing congestion, improving air quality, cutting
energy consumption, and increasing the efficiency of the state's transportation system.
Recently, the first commercial test of congestion pricing was set in motion when the California Private
Transportation Company (CPTC) introduced pricing on a 16-kilometer stretch of state Route 91 near
Anaheim, between the Riverside-Orange county line and the Newport-Costa Mesa Freeway (state Route
55). Four new, median express lanes -- two additional lanes in each direction -- are predicted to save
commuters from 20 to 40 minutes a trip and the headache of bumper-to-bumper traffic on a freeway traveled
by 250,000 motorists a day. And the revenues received from the world's first fully automated toll road will
enable CPTC to pay capital and operating costs, such as setting up an extensive safety program, ensuring a
rapid-response capability for clearing disabled vehicles, paying for a state highway patrol presence along the
road, and reimbursing the California Department of Transportation for maintaining the road.
To boost carpooling and to keep traffic moving on the new express lanes, tolls are adjusted according to the
number of vehicle occupants, time of day, and the amount of traffic. Cars and vans with three or more
passengers pay no toll. There's no need for tollbooths or cash baskets because tolls are debited
electronically.
HOW THE SYSTEM WORKS
As drivers approach the Route 91 express lanes, an easy-to-read sign displays the current toll. Drivers have
about a kilometer to decide whether to switch to the new lanes or stay on the existing freeway. Every car
and van entering the lanes must have a Velcro-backed FasTrak transponder mounted on its windshield.
(Drivers pay $40 of tolls in advance to get a transponder.) The 95-millimeter, plastic toll-tracker works like an
electronic debiting card. As the car or van crosses into the express lanes, overhead antennas read the
account information found on the transponder's microchip and automatically deduct the appropriate toll. The
1 Source: U.S. Department of Transportation, Federal Highway Administration
sophisticated antennas can handle up to 2,500 vehicles per lane per hour and can scan vehicles at speeds
of more than 160 kilometers per hour.
During peak periods, observers at the toll zones count the number of occupants in each vehicle. Carpool
violators face fines of $271 to $813. Those who try to enter the express lanes without a transponder are
caught by roadside cameras and fined $100 to $300.
Transportation professionals from around the world are watching the results of this innovative project.
Edward Sullivan, chair of the civil and environmental engineering department at California Polytechnic State
University at San Luis Obispo and the consultant who is monitoring and evaluating Route 91, predicts the
project will win the fight against gridlock and will spur similar efforts elsewhere.
State Route 91 is already becoming a model. Within just a few weeks of its opening, the new toll lanes and
nearby Metro link trains drew so many commuters that congestion on Highway 91's free lanes dropped to
levels not seen in more than 15 years. Carpooling and vanpooling also increased. On one evening alone,
more than 160 vanpools were counted.
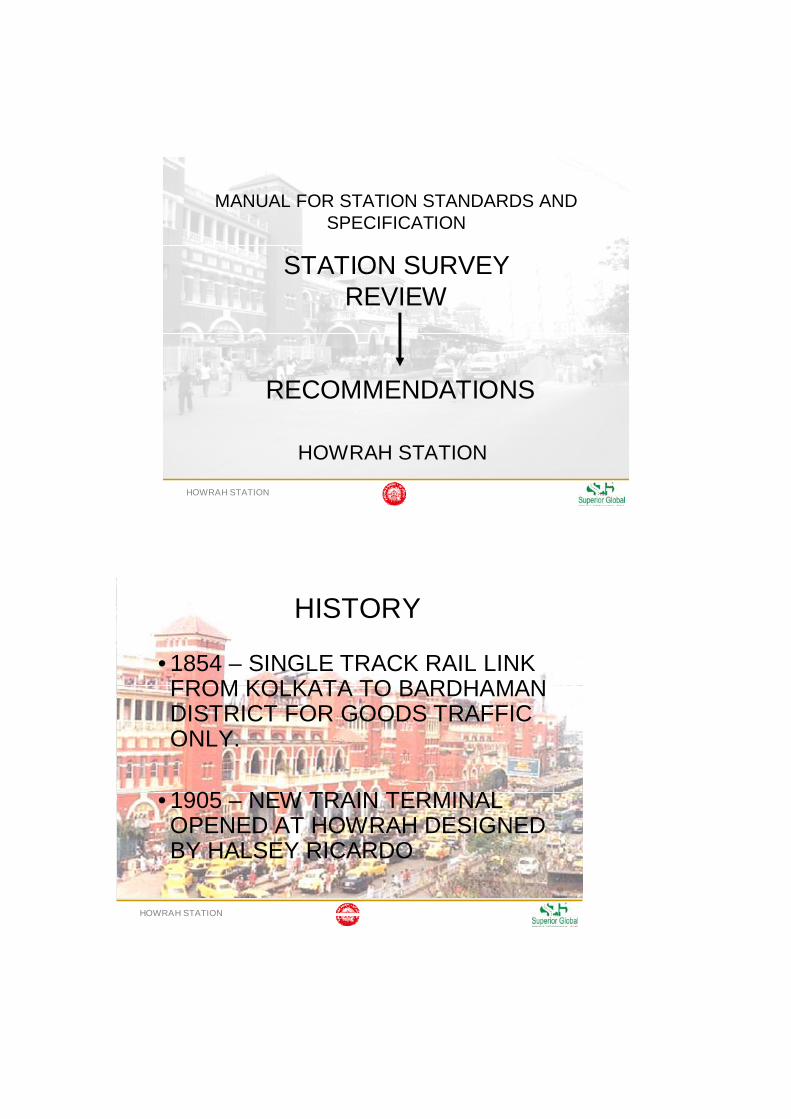
HOWRAH STATION
MANUAL FOR STATION STANDARDS AND SPECIFICATION
HOWRAH STATION
STATION SURVEY REVIEW
RECOMMENDATIONS
HOWRAH STATION
• 1854 – SINGLE TRACK RAIL LINK FROM KOLKATA TO BARDHAMAN DISTRICT FOR GOODS TRAFFIC ONLY.
• 1905 – NEW TRAIN TERMINAL OPENED AT HOWRAH DESIGNED BY HALSEY RICARDO
HISTORY
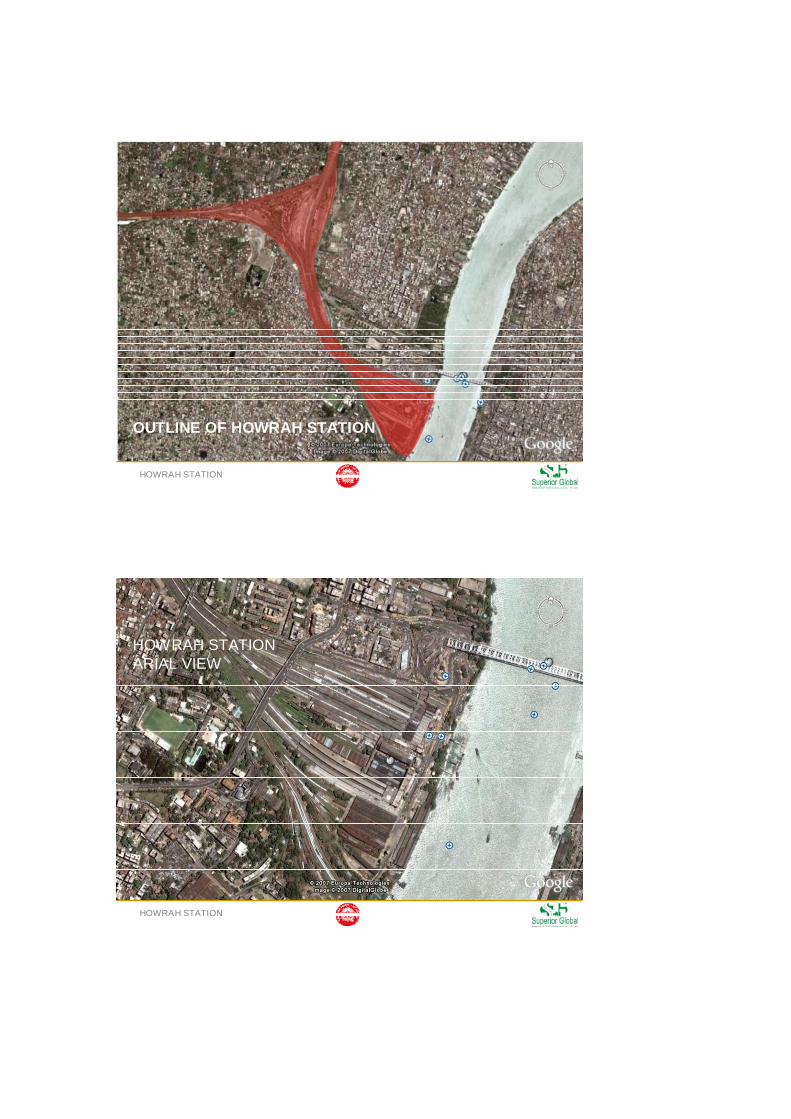
HOWRAH STATION
OUTLINE OF HOWRAH STATION
HOWRAH STATION
HOWRAH STATION ARIAL VIEW
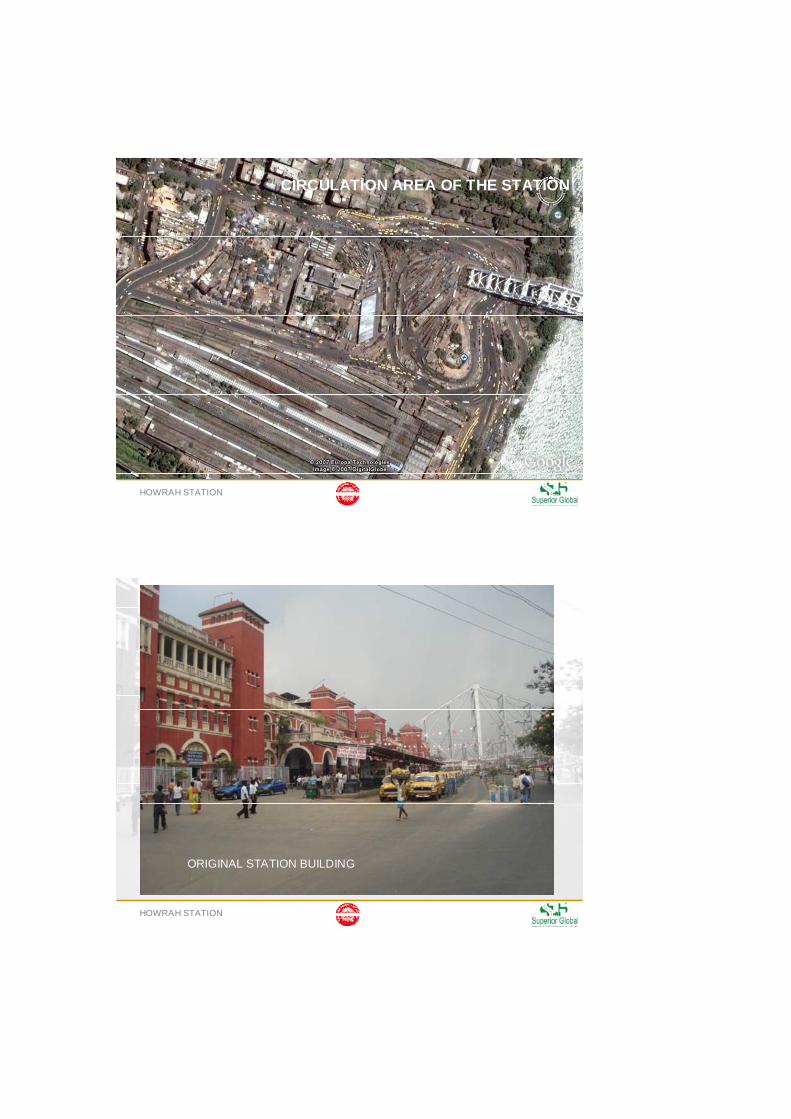
HOWRAH STATION
CIRCULATION AREA OF THE STATION
HOWRAH STATION
ORIGINAL STATION BUILDING
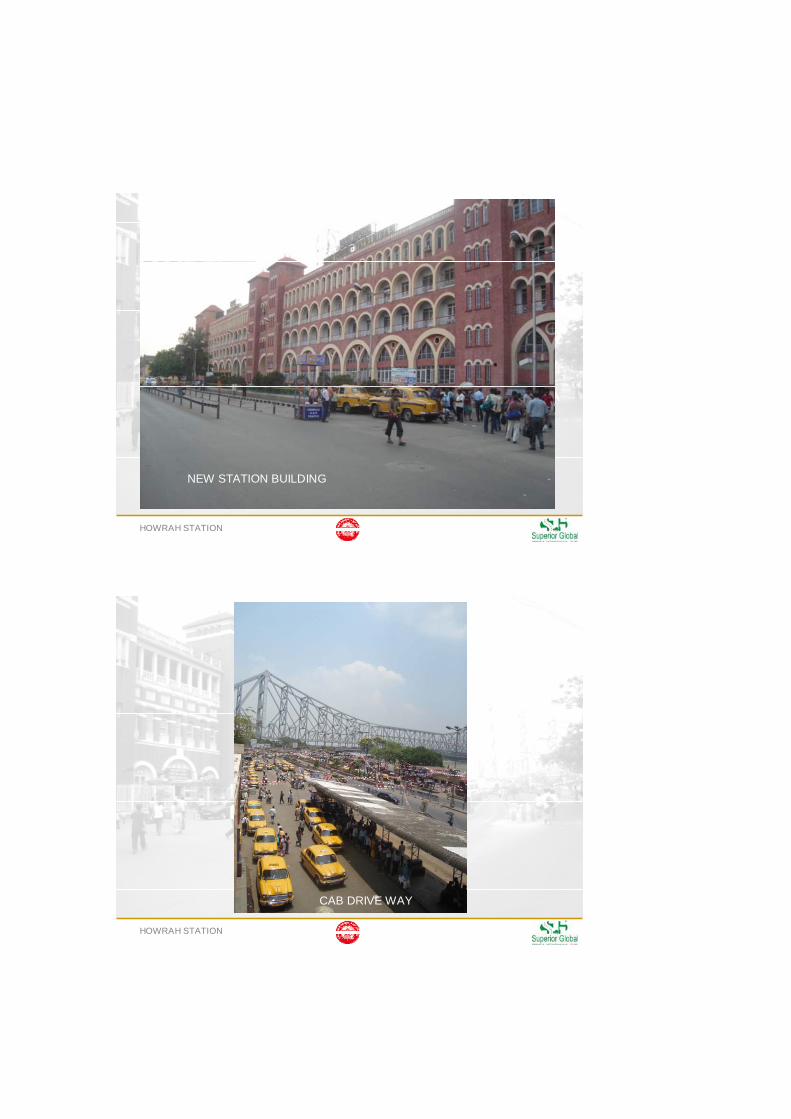
HOWRAH STATION
NEW STATION BUILDING
HOWRAH STATION
CAB DRIVE WAY
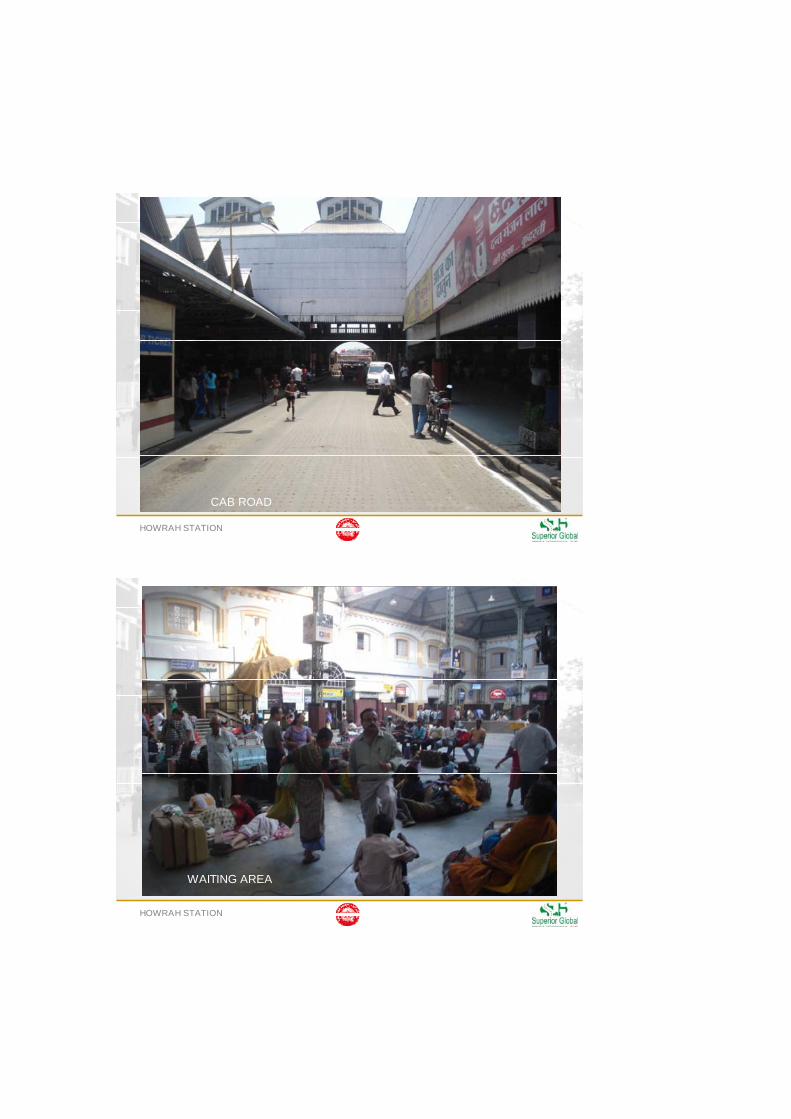
HOWRAH STATION
CAB ROAD
HOWRAH STATION
WAITING AREA
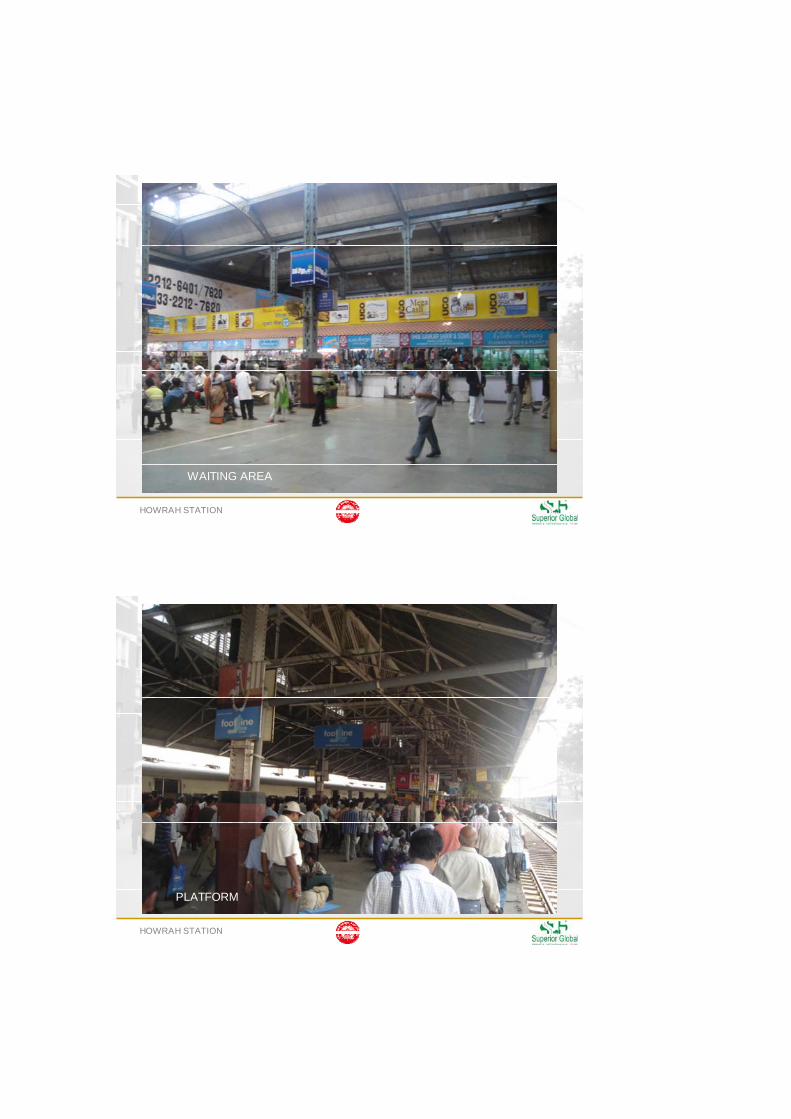
HOWRAH STATION
WAITING AREA
HOWRAH STATION
PLATFORM
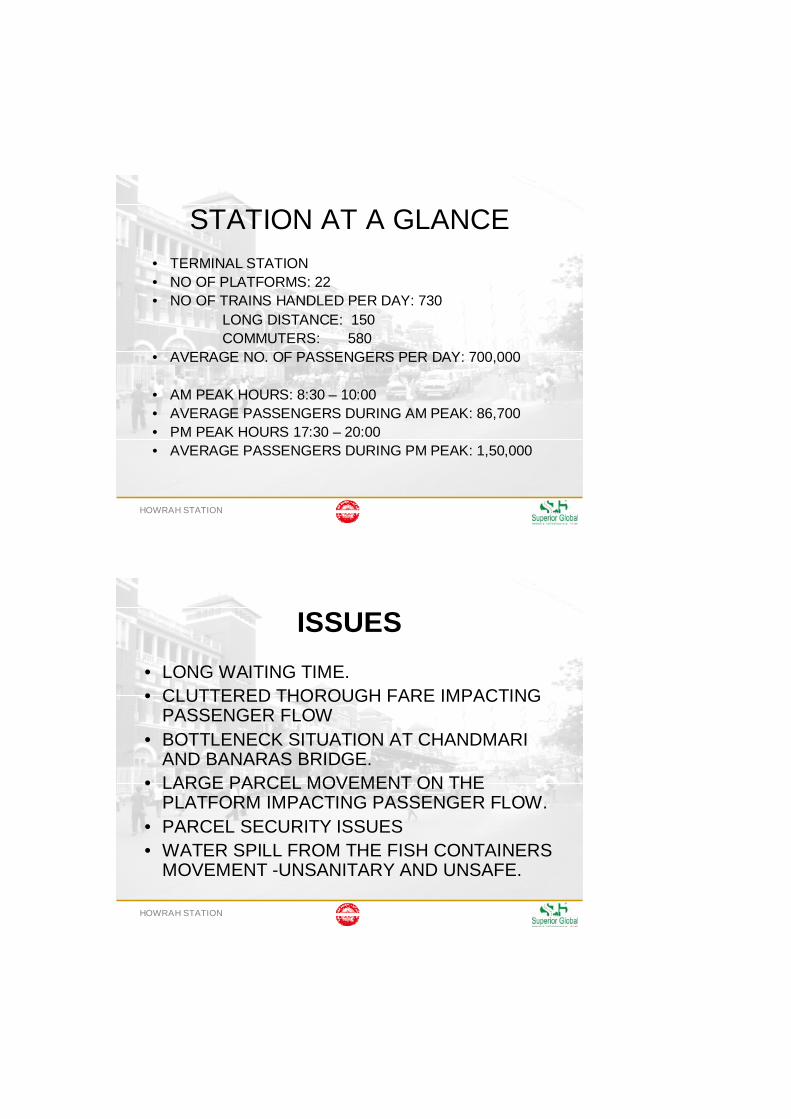
HOWRAH STATION
STATION AT A GLANCE• TERMINAL STATION• NO OF PLATFORMS: 22• NO OF TRAINS HANDLED PER DAY: 730
LONG DISTANCE: 150COMMUTERS: 580
• AVERAGE NO. OF PASSENGERS PER DAY: 700,000
• AM PEAK HOURS: 8:30 – 10:00 • AVERAGE PASSENGERS DURING AM PEAK: 86,700• PM PEAK HOURS 17:30 – 20:00 • AVERAGE PASSENGERS DURING PM PEAK: 1,50,000
HOWRAH STATION
ISSUES• LONG WAITING TIME.• CLUTTERED THOROUGH FARE IMPACTING
PASSENGER FLOW• BOTTLENECK SITUATION AT CHANDMARI
AND BANARAS BRIDGE.• LARGE PARCEL MOVEMENT ON THE
PLATFORM IMPACTING PASSENGER FLOW.• PARCEL SECURITY ISSUES • WATER SPILL FROM THE FISH CONTAINERS
MOVEMENT -UNSANITARY AND UNSAFE.
HOWRAH STATION
Circulation Pattern LOW HANGING FRUITS– ALLOW TAXI UP TO CAB ROAD TO DROP PEOPLE TO
THE STATION.– MANDATORY ONE-WAY MOVEMENT THROUGH THE
NEW BRIDGE FOR THE CABS COMING TO STATION TO REDUCE TRAFFIC LOAD FROM HOWRAH BRIDGE. MRTS CONNECTIVITY WITH REDEVELOPMENT OF STATION.
LONG TERM ACTIONS ITEMS– INCREASE UNDER-GROUND CONNECTIVITY TO
FERRY/ BUS STAND.– INCREASE NUMBER OF ENTRANCES FOR STATION.
HOWRAH STATION
LAYOUT AND TRAFFICLOW HANGING FRUITS– IMPROVE PASSENGER FLOW ON THE PASSAGE
WAYS / THOROUGH FARE BY RELOCATING GRP OFFICE AND WATER BOOTH
– INTRODUCE TICKET VENDING MACHINES.– SHIFT RUNNING ROOM OUT OF THE STATION
BUILDING
LONG TERM ACTIONS ITEMS– TEMPORARILY RELOCATE DRM BUILDING – CONDUCT FEASIBILITY STUDY FOR INCREASING
SPAN OF CHANDMARI BRIDGE AND BANARAS BRIDGE OPTIMUM USE OF ALL THE PLATFORMS.
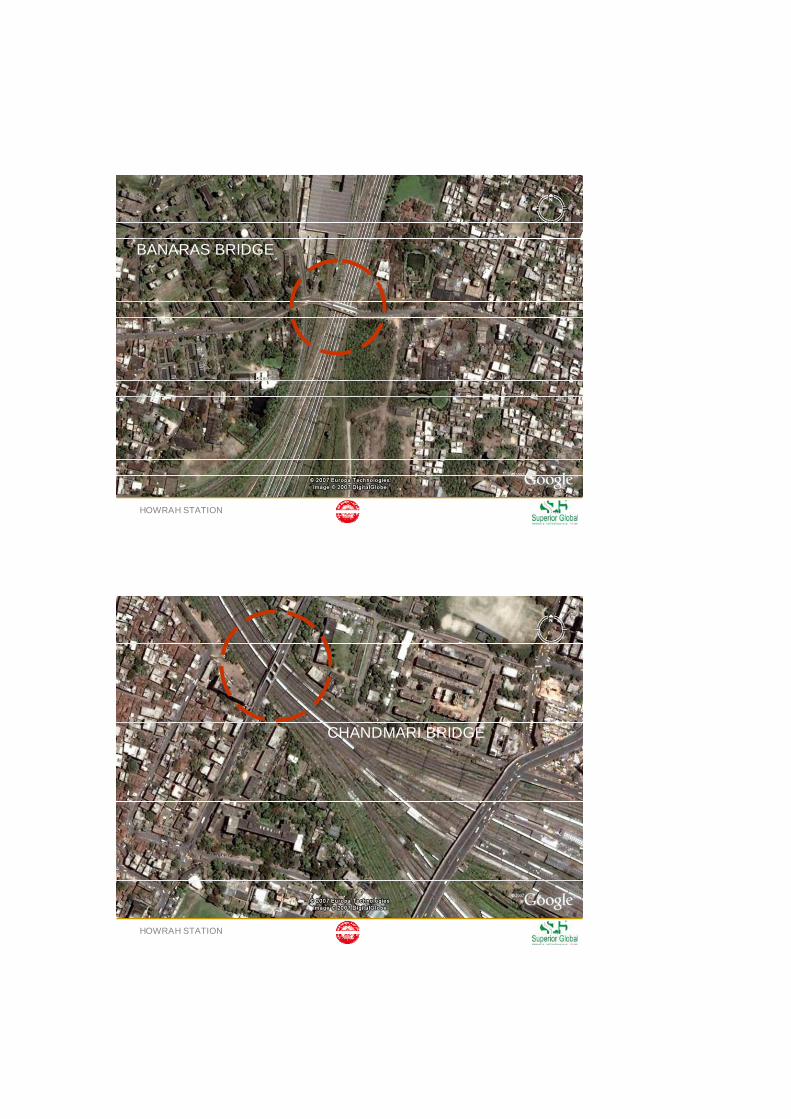
HOWRAH STATION
BANARAS BRIDGE
HOWRAH STATION
CHANDMARI BRIDGE
HOWRAH STATION
PARCEL STORAGE AND MOVEMENT
LOW HANGING FRUITS
– IMMEDIATE CLEARING OF PARCEL WAGONS AFTER THEY ARE UNLOADED AT THE PLATFORM.
– REFRIGERATED GOOD-SHEDS TO REDUCE ODOR.
LONG TERM ACTION ITEMS– DETAILED PARCEL MOVEMENT STUDY TO BE DONE FOR
LOCALIZING PARCEL MOVEMENT AT ONE END OF THE STATION.
– PARCEL SECURITY MANAGEMENT SYSTEM TO BE INTRODUCED
HOWRAH STATION
WASTE MANAGEMENT
LOW HANGING FRUITS– SEGREGATION OF GARBAGE BY PUTTING
DEDICATED BINS – LARGER GARBAGE CANS WITH RECYCLE BINS– AWARENESS PROGRAM TO KEEP STATION
CLEAN.
LONG TERM ACTION ITEMS– WASTE MANAGEMENT SYSTEM TO BE
INTRODUCED.
HOWRAH STATION
SECURITY
– CONDUCT VULNERABILITY STUDY– OPTIMIZE CCTV COVERAGE.– TRAIN SECURITY PERSONNEL– EMERGENCY RESPONSE SYSTEM TO BE
INTRODUCED WITH MOCK DRILLS, CONDUCTED AT REGULAR INTERVALS.
– AWARENESS PROGRAM
HOWRAH STATION
PASSENGER INFORMATION SYSTEM
LOW HANGING FRUITS– SIGNAGE IMPROVEMENTS. – LAUNCH AM RADIO CHANNEL FOR UPDATES IN
ORDER TO REDUCE WAITING TIME AT THE PLATFORM
– AUTOMATED TELEPHONE ENQUIRY SYSTEM FOR ARRIVAL DEPARTURE UPDATES.
LONG TERM ACTION ITEMS– IMPROVING WAY FINDING- DETAILED
PASSENGER CIRCULATION STUDY TO BE CONDUCTED.
MAPS