Embed Size (px)
Citation preview
Solutions Through Technology
Comprehensive Management and Organizational Assessment
El Dorado Irrigation District
Final Assessment Report
May 12, 2008

2
Background
Project Purpose:The El Dorado Irrigation District (District) is located in El Dorado County on the western slope of the Sierra Nevada Mountains. Its contiguous service area covers approximately 220 square miles and 100,000 residents, ranging from El Dorado Hills in the west to Pollock Pines in the east, and from the South Fork American River in the north to the Cosumnes
River in the south. The District provides treated water, wastewater treatment and disposal, recycled water and recreation services and operates Project 184, a FERC-licensed hydroelectric project including high mountain lakes in the vicinity of Lake Tahoe.
The District faces many forces that have increased the cost of providing service while also requiring it to limit its rate increases. Over the past six years, the District has experienced very rapid growth in the western portion of its service area and has doubled its operating budget from $26.6 million in 2002 to $46.6 million in 2008. Over the next five years, the District, like other public utilities, faces escalating health care costs for active and retired employees and the inevitable exodus of long-time employees eligible for retirement. The District seeks to continue meeting the external challenges through increasingly efficient and responsible operations.
In January 2008, the District’s Board of Directors selected Westin Engineering, Inc. (Westin) teamed with RMC Water and Environment (RMC) to conduct a Comprehensive Management and Organizational Assessment intended to assist the Board and new General Manager in developing recommendations on what should be done in the foreseeable future to improve the District’s efficiency and effectiveness. As part of the assessment, Westin evaluated the District’s organizational structure, policies, and practices regarding its operations, administration and management. As part of the assessment, Westin noted organizational and management practices that are working well and specific areas requiring significant improvement. Westin’s findings and recommendations contained within this document are envisioned to help the District align its people, business processes and technology investments with industry best practices.

3
Background
•
Changing economic cycles
•
Regional drought concerns
•
Water conservation practices
•
Increasing level of service expectations
•
Rate pressures
•
Aging workforce
•
Aging infrastructure
•
Long-term financial and rate stability
•
Increased cyber and physical security
•
Customer confidence and public trust
•
Rising energy costs
•
Heightened environmental awareness
•
Green energy and conservation
•
Emerging mobile technology
•
Increased customer accessibility
•
Community partnership
Common External DriversIndustry Drivers for Change:
There are several key drivers that impact the District’s operational efficiency and effectiveness:
•
Increased residential development within the District
•
Growth demands on the District’s utility infrastructure
•
Water conservation
•
Potential loss of property-tax revenues
•
Residential and non-residential meter retrofits
•
Staff retirements and turnover
•
Capital improvements
•
Migration of new contributed assets
•
Management of existing infrastructure and equipment
•
Information management and document control
•
Management of grant-funded projects
•
Updating and integrating core business applications

4
Background
Summary of Stated Project Goals:Perform a comprehensive management and organizational
assessment•
Comparison of specific conditions versus industry standards and best practices
•
Employee perceptions on certain topics
•
Professional assessment of certain conditions with recommendations for improvement
•
Broad overview of the existing organization and recommended improvements

5
Background
Specific Requested Areas of Assessment:•
Proportions of management and supervisory personnel
•
Whether organizational structure, skills and total staffing levels are correctly defined
•
Broad overview of the existing organizational structure and strengths and weaknesses of the District’s information technology functions
•
Assessment of the organizational changes over the past 6 years and how to improve
•
Expected retirements
•
Equal compensation policy for all management personnel
•
Proportions and types of in-house and retained legal services
•
Whether employees and management are properly assigned, trained and supervised

6
Project Approach
Westin’s Water Utility Business ModelWestin utilized its Water Utility Business Model to assess the District’s “as-is” condition against best industry practices.
A number of key management processes directly support the Water Supply Chain, including Strategic Planning, Budget Management, Performance Management, and Asset Management.
In addition, several enabling processes should provide effective business support services.

7
Project Approach
•
Project Kickoff Meeting –
Facilitated meeting with the Project Steering Committee to discuss and agree on project approach, schedule, logistics, milestones, communication protocols, and deliverables.
•
Assessment –
A series of document reviews, one-on-one interviews, deployment and collection of employee and management surveys, and on-
site visits to understand the District’s “as-is” condition for organizational and management areas of interest.
•
Findings Evaluation –
A comparison of the District’s “as-is” condition
against industry best practices.
•
Validation Meeting –
A review of the initial findings with the Project Steering Committee for verification of factual accuracy.
•
Draft Report –
Development and issuance of a Draft Assessment Report for review and comment by the Project Steering Committee for accuracy and completeness.
•
Final Report –
Final project deliverable describing the “as-is” condition of the District and making a series of prioritized recommendations for continuous improvement.
ProjectKickoffMeeting
DocumentReview
Interviews
SiteVisits
ValidationMeeting
DraftReport
FinalReport
Survey
FindingsEvaluation
Westin employed the following Project Approach:

8
Project Approach
Executive Management -•
Michael H. Smith Report (10/22/07)•
Management Audit (Oct. 2000)•
LAFCO Water Wastewater and Power Municipal Services Review (Oct. 2007)
•
First Annual State of the Staff Report (2/25/05)•
Conference Presentations on Succession Planning (various)•
Conference Presentations on Performance Management (various)
Human Resources -•
EID Board Policies and Administrative Regulations Manual•
Employee Handbook (Draft 4/11/08)•
Organization Charts (2007, 2000)•
Memorandum of Understanding 2005 -
2009•
Employee Code of Conduct Outline•
Personnel Policy Statement•
Personnel Benefits Outline•
Employee Appraisal and Self Appraisal Forms•
2007 Class Grade Listing•
Nash Classification and Compensation Study (11/28/2007)•
Workforce Planning Statistics•
Injury and Illness Prevention Plan
Facilities Management -•
2007 –
2011 Capital Improvement Program•
Integrated Regional Water Management Plan (Dec. 2006)•
USEPA Administrative Order (9/30/2003)•
Project Manager Training (3/8/2006)
Finance & Management Services -•
BP 3000 Series District Business Operations•
Budget Workshop and Performance Measures•
Water System Demographics and Statistical Summary•
Recycled Water Demographics and Statistical Summary•
Wastewater Demographics and Statistical Summary•
Recreation Demographics and Statistical Summary•
Fleet Maintenance and Facility Staffing Plan•
Fleet Utilization Study•
Vehicle and Equipment Team (VET) Board Presentation
Strategic Management & Communications -•
Overview Binder•
Strategic Guide and 2008 Action Plan•
Drought Preparedness Plan (Jan. 2008)•
Five-Year Water Management Plan (2005 Update) 03/06•
Urban Water Management Plan Update (2005 Update) 01/06
Environmental Compliance & Water Policy -•
CEQA Procedures•
Annual Performance•
Federal And State Legislation and Grant Funding
Recreation -•
Park Manual•
Recreational Department Procedural Manual•
Sly Park Recreational Master Plan and Environmental Impact Report
Westin reviewed the following District documents:
9
Project Approach
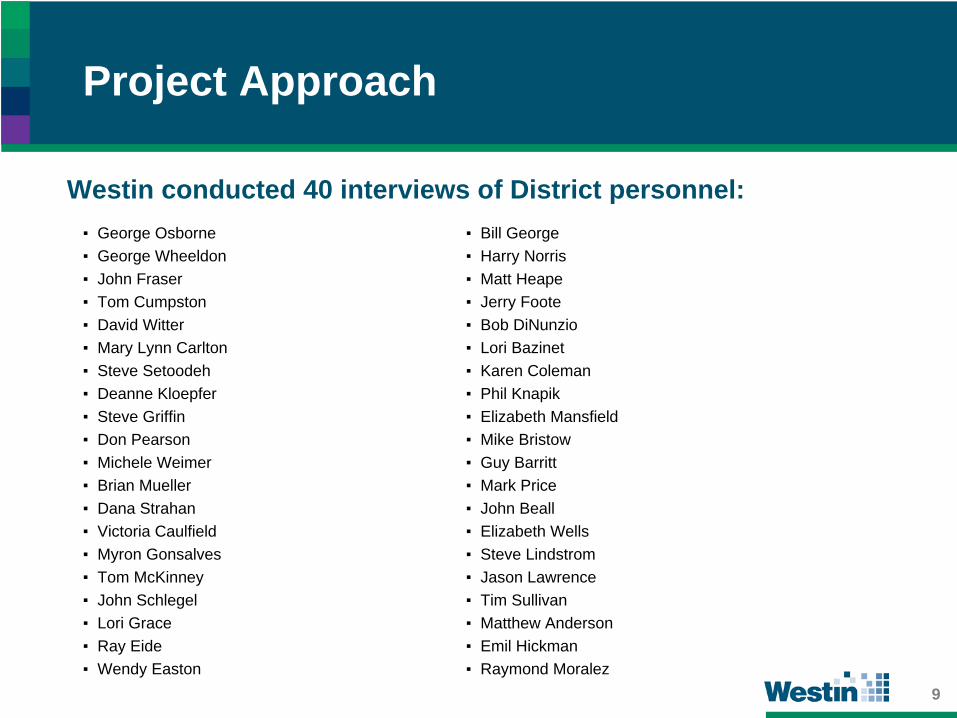
Westin conducted 40 interviews of District personnel:▪
George Osborne
▪
Bill George▪
George Wheeldon
▪
Harry Norris▪
John Fraser
▪
Matt Heape▪
Tom Cumpston
▪
Jerry Foote▪
David Witter
▪
Bob DiNunzio▪
Mary Lynn Carlton ▪
Lori Bazinet▪
Steve Setoodeh
▪
Karen Coleman▪
Deanne Kloepfer
▪
Phil Knapik▪
Steve Griffin
▪
Elizabeth Mansfield▪
Don Pearson
▪
Mike Bristow▪
Michele Weimer
▪
Guy Barritt▪
Brian Mueller ▪
Mark Price▪
Dana Strahan
▪
John Beall▪
Victoria Caulfield
▪
Elizabeth Wells▪
Myron Gonsalves
▪
Steve Lindstrom▪
Tom McKinney
▪
Jason Lawrence▪
John Schlegel
▪
Tim Sullivan▪
Lori Grace
▪
Matthew Anderson▪
Ray Eide
▪
Emil Hickman▪
Wendy Easton
▪
Raymond Moralez

10
Project Approach
Westin facilitated an Organizational Survey:The survey was designed for all management and staff to complete in order to better understand the various individual perspectives within the District. The first 19 questions were identical for both management and staff. The Management Survey included an additional 8 questions to gather additional perspectives. Each question on the survey had an appropriate response score from 0 – 10. A hard-copy survey was mailed to every District employee to complete with a self-addressed stamped envelope for direct mail return to Westin’s Rancho Cordova Office. The survey was completely anonymous.
Total Management Employees
Surveys Mailed 303 29 274
Surveys Returned 155 18 137
Percentage Returned 51% 62% 50%
Westin received the completed surveys and tallied the results for each of the questions. Westin calculated the mean, median, and the percentage of answers in the High (scores of 7 – 10), Medium (scores of 4 – 6) and Low (scores of 0 – 3) categories. For each question, Westin also graphed the number of responses for each score.
The results of the Employee and Management Surveys are presented below.

11
Organizational Survey
Sample Employee Organizational Survey:

12
Organizational Survey
Westin provided the District’s management team with 8 additional questions to elicit their specific organizational perspectives.
Additional Management Survey Questions:

13
1. Are the District’s strategic goals clearly defined and understood?
Organizational Survey Results
Employees Management
Median 4 3
Average 4.0 4.1
% HighScores
18% 28%
% MediumScores
40% 22%
% Low Scores
42% 50%
LegendHigh Scores = 7 -
10Med Scores = 4 -
6Low Scores = 0 -
3
EID M a n a g e r S u r ve yQ u e s t io n 1
3
1
3
2
0
1
34
0 0
1
0
1
2
34
5
6
7
8
0 1 2 3 4 5 6 7 8 9 1 0
A n s w e r V a lu e
Num
ber o
f Res
pons
es
EID Employee SurveyQuestion 1
15
8
1618
16
27
117
11
24
0
5
10
15
20
25
30
35
0 1 2 3 4 5 6 7 8 9 10
Answer ValueNot Understood Clearly Understood
Not Understood Clearly Understood
Num
ber o
f Res
pons
es

14
Organizational Survey Results
2. Are your job duties and responsibilities clear?
Employees Management
Median 7 9
Average 6.4 7.6
% HighScores
58% 72%
%MediumScores
22% 11%
% Low Scores
20% 17%
LegendHigh Scores = 7 -
10Med Scores = 4 -
6Low Scores = 0 -
3
E ID M a n a g e r S u r v e yQ u e s t io n 2
1
0
1 1 1
0
1 1
2 2
8
0
1
2
34
5
6
7
8
0 1 2 3 4 5 6 7 8 9 1 0
A n s w e r V a lu e
Num
ber o
f Res
pons
es
EID Employee SurveyQuest ion 2
35
9 108
14
8
2 1
2 6
12
2 1
0
5
10
15
2 0
2 5
3 0
3 5
0 1 2 3 4 5 6 7 8 9 10
Answer V alue
Unclear Clearly Understood
Unclear Clearly Understood
Num
ber o
f Res
pons
es

15
Organizational Survey Results
3. Are timely and appropriate management decisions made?
Employees Management
Median 2 5
Average 3.3 5.0
% HighScores
11% 39%
% MediumScores
31% 33%
% Low Scores
58% 28%
LegendHigh Scores = 7 -
10Med Scores = 4 -
6Low Scores = 0 -
3
EID M a n a g e r S u r v e yQ u e s t io n 3
21 1 1 1
32
4
21
0012345678
0 1 2 3 4 5 6 7 8 9 1 0
A n s w e r V a lu e
Num
ber o
f
Res
pons
es
EID Employee SurveyQuestion 3
17
22
29
12 1216
14
47
2 2
0
5
10
15
20
25
30
35
0 1 2 3 4 5 6 7 8 9 10
Answer ValueIneffective Process Effective Process
Ineffective Process Effective Process
Num
ber o
f Res
pons
es

16
Organizational Survey Results
4. Are mistakes appropriately handled?
Employees Management
Median 2 3
Average 3.1 4.0
% HighScores
16% 33%
% MediumScores
22% 17%
% Low Scores
62% 50%
LegendHigh Scores = 7 -
10Med Scores = 4 -
6Low Scores = 0 -
3
E I D M a n a g e r S u r v e yQ u e s t i o n 4
4
21
2
01
2
4
1 10
012345678
0 1 2 3 4 5 6 7 8 9 1 0
A n s w e r V a l u e
Num
ber o
f Res
pons
es
EID Employee SurveyQuest ion 4
2 42 1 2 2
16
9
17
46
9
3 3
0
5
10
15
20
2 5
30
3 5
0 1 2 3 4 5 6 7 8 9 10
Answer ValuePunished Utilized for Learning
Punished Utilized for Learning
Num
ber o
f R
espo
nses

17
Organizational Survey Results
5. Are employees motivated and enthusiastic?
Employees Management
Median 4 7
Average 4.2 6.6
% HighScores
23% 67%
% MediumScores
34% 22%
% Low Scores
43% 11%
LegendHigh Scores = 7 -
10Med Scores = 4 -
6Low Scores = 0 -
3
EID M a n a g e r S u r v e yQ u e s t io n 5
2 2
0 0 0
2 2
45
3
0012345678
0 1 2 3 4 5 6 7 8 9 1 0
A n s w e r V a lu e
Num
ber o
f
Res
pons
es
EID Employee SurveyQuestion 3
17
22
29
12 1216
14
47
2 2
0
5
10
15
20
25
30
35
0 1 2 3 4 5 6 7 8 9 10
Answer ValuePoorly motivated Highly motivated and extremely enthusiastic
Poorly motivated Highly motivated and extremely enthusiastic
Num
ber o
f Res
pons
es

18
Organizational Survey Results
6. Do the employees possess a high level of District pride?
Employees Management
Median 5 7
Average 5.1 7.1
% HighScores
35% 78%
% MediumScores
36% 11%
% Low Scores
28% 11%
LegendHigh Scores = 7 -
10Med Scores = 4 -
6Low Scores = 0 -
3
E I D M a n a g e r S u r v e yQ u e s t i o n 6
0 0 01
01 1
54 4
1
012345678
0 1 2 3 4 5 6 7 8 9 1 0
A n s w e r V a l u e
Num
ber o
f
Res
pons
es
E ID E mp lo yee S ur veyQ uest io n 6
47
1513
2 2
16
12
16 17
10
5
0
5
10
15
2 0
2 5
3 0
3 5
0 1 2 3 4 5 6 7 8 9 10
A nsw er V alueLow Pride Great Pride
Low Pride Great Pride
Num
ber o
f Res
pons
es

19
Organizational Survey Results
7. Are the current Board of Directors effective?
Employees Management
Median 5 7
Average 5.3 6.1
% HighScores
37% 61%
% MediumScores
43% 11%
% Low Scores
21% 28%
LegendHigh Scores = 7 -
10Med Scores = 4 -
6Low Scores = 0 -
3
EID M a n a g e r S u r v e yQ u e s t io n 7
0
32
0 0
2
0
3 32
3
012345678
0 1 2 3 4 5 6 7 8 9 1 0
A n s w e r V a lu e
Num
ber o
f
Res
pons
es
EID Employee SurveyQuestion 7
3 48
1317
30
10
2118
5 5
0
5
10
15
20
25
30
35
0 1 2 3 4 5 6 7 8 9 10
Answer ValueVery Ineffective Highly effective
Very Ineffective Highly effective
Num
ber o
f Res
pons
es
20
Organizational Survey Results
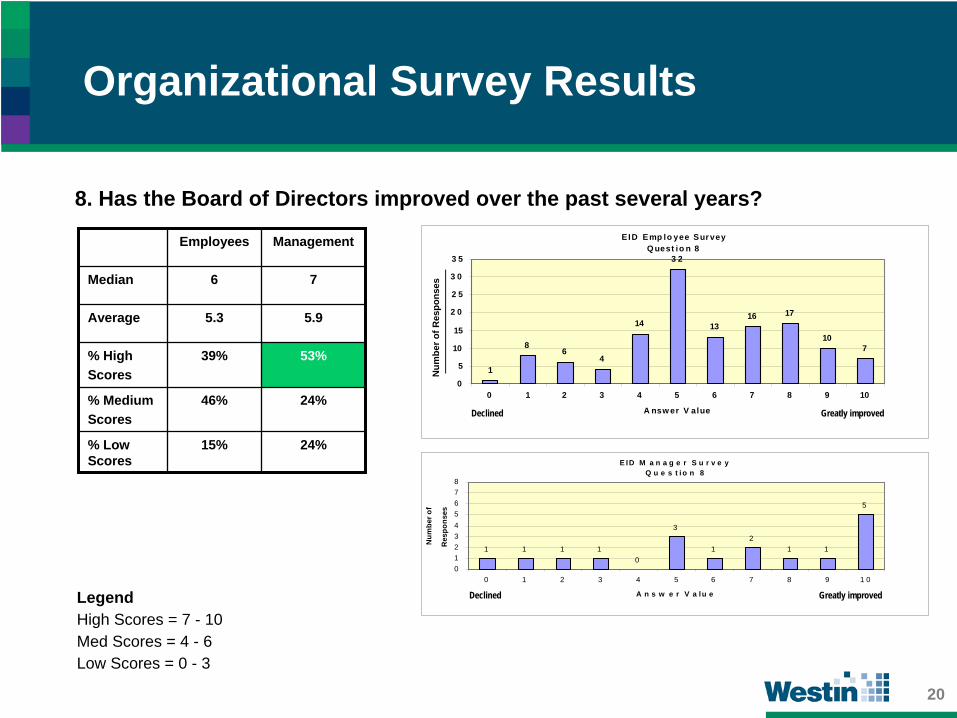
8. Has the Board of Directors improved over the past several years?
Employees Management
Median 6 7
Average 5.3 5.9
% HighScores
39% 53%
% MediumScores
46% 24%
% Low Scores
15% 24%
LegendHigh Scores = 7 -
10Med Scores = 4 -
6Low Scores = 0 -
3
E ID M a n a g e r S u r v e yQ u e s t i o n 8
1 1 1 10
3
12
1 1
5
012345678
0 1 2 3 4 5 6 7 8 9 1 0
A n s w e r V a lu e
Num
ber o
f
Res
pons
es
E ID Emp lo yee SurveyQ uest io n 8
1
86
4
14
3 2
1316 17
107
0
5
10
15
2 0
2 5
3 0
3 5
0 1 2 3 4 5 6 7 8 9 10
A nsw er V alueDeclined Greatly improved
Declined Greatly improved
Num
ber o
f Res
pons
es
21
Organizational Survey Results
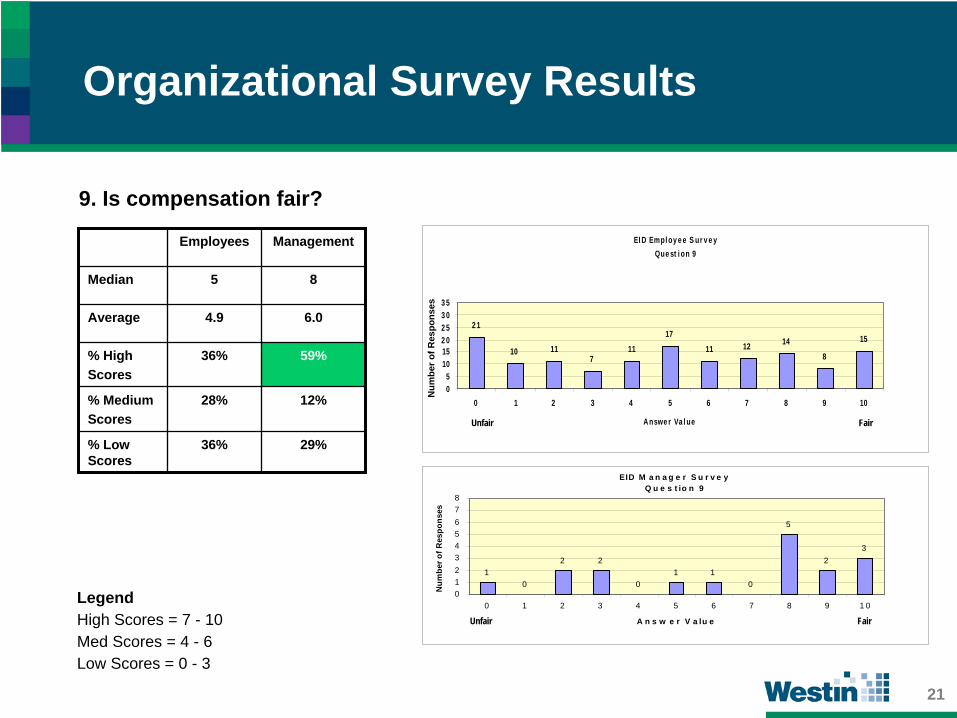
9. Is compensation fair?
Employees Management
Median 5 8
Average 4.9 6.0
% HighScores
36% 59%
% MediumScores
28% 12%
% Low Scores
36% 29%
LegendHigh Scores = 7 -
10Med Scores = 4 -
6Low Scores = 0 -
3
EID M a n a g e r S u r v e yQ u e s t io n 9
10
2 2
01 1
0
5
23
012345678
0 1 2 3 4 5 6 7 8 9 1 0
A n s w e r V a lu e
Num
ber o
f Res
pons
es
EI D Empl oy e e S ur v e yQue st i on 9
2 1
10 117
1117
11 12 148
15
05
10152 02 53 03 5
0 1 2 3 4 5 6 7 8 9 10
A nswe r Va l ueUnfair Fair
Unfair Fair
Num
ber o
f Res
pons
es

22
Organizational Survey Results
10. Are problems appropriately handled in a timely fashion?
Employees Management
Median 3 5
Average 3.5 5.2
% HighScores
10% 39%
% MediumScores
35% 39%
% Low Scores
54% 22%
LegendHigh Scores = 7 -
10Med Scores = 4 -
6Low Scores = 0 -
3
E I D M a n a g e r S u r v e yQ u e s t io n 1 0
2
01 1
23
23 3
10
012345678
0 1 2 3 4 5 6 7 8 9 1 0
A n s w e r V a lu e
Num
ber o
f Res
pons
es
EID Emp lo yee SurveyQuest io n 10
1014
2 72 3
172 0
118
31 2
0
5
10
15
2 0
2 5
3 0
3 5
0 1 2 3 4 5 6 7 8 9 10
A nswer V alueNever Always
Never Always
Num
ber o
f Res
pons
es

23
Organizational Survey Results
11. Is the District’s organizational structure aligned for efficiency and effectiveness?
Employees Management
Median 2 4
Average 2.6 4.2
% HighScores
9% 33%
% MediumScores
20% 33%
% Low Scores
71% 33%
LegendHigh Scores = 7 -
10Med Scores = 4 -
6Low Scores = 0 -
3
EID M a n a g e r S u r v e yQ u e s t io n 1 1
2
4
0 0
3
12
6
0 0 0012345678
0 1 2 3 4 5 6 7 8 9 1 0
A n s w e r V a lu e
Num
ber o
f Res
pons
es
EID Employee SurveyQuestion 11
32
19 20
26
11 12
4 4 51 2
05
1015
2025
3035
0 1 2 3 4 5 6 7 8 9 10
Answer ValueInefficient and Ineffective Very effective and efficient
Inefficient and Ineffective Very effective and efficient
Num
ber o
f Res
pons
es

24
Organizational Survey Results
12. Is there a strong partnership between management and employees?
Employees Management
Median 3 6
Average 2.9 5.4
% HighScores
11% 44%
% MediumScores
24% 28%
% Low Scores
65% 28%
LegendHigh Scores = 7 -
10Med Scores = 4 -
6Low Scores = 0 -
3
EID M an ag e r S u r v e yQ u e s t io n 12
10 0
4
1 1
3
6
2
0 0012345678
0 1 2 3 4 5 6 7 8 9 1 0
A n s w e r V a lu e
Num
ber o
f Res
pons
es
EID Employee SurveyQuest ion 12
18
3 0
182 3
14 14
4
11
1 1 2
05
1015
2 02 53 03 5
0 1 2 3 4 5 6 7 8 9 10
Answer V alueAdversaries Partners
Adversaries Partners
Num
ber o
f R
espo
nses

25
Organizational Survey Results
13. Has the District’s Legal Department services improved over the past several years?
Employees Management
Median 5 8
Average 4.9 6.3
% HighScores
35% 56%
% MediumScores
46% 22%
% Low Scores
19% 22%
LegendHigh Scores = 7 -
10Med Scores = 4 -
6Low Scores = 0 -
3
EID M a n ag e r S u r v e yQ u e s t io n 1 3
1 12
0 0
4
0 0
3
5
2
012345678
0 1 2 3 4 5 6 7 8 9 1 0
A n s w e r V a lu e
Num
ber o
f Res
pons
es
EID Employee SurveyQuestion 13
3 2
9 912
33
1218
126 8
05
1015
20253035
0 1 2 3 4 5 6 7 8 9 10
Answer ValueDeclined Greatly improved
Declined Greatly improved
Num
ber o
f R
espo
nses
26
Organizational Survey Results
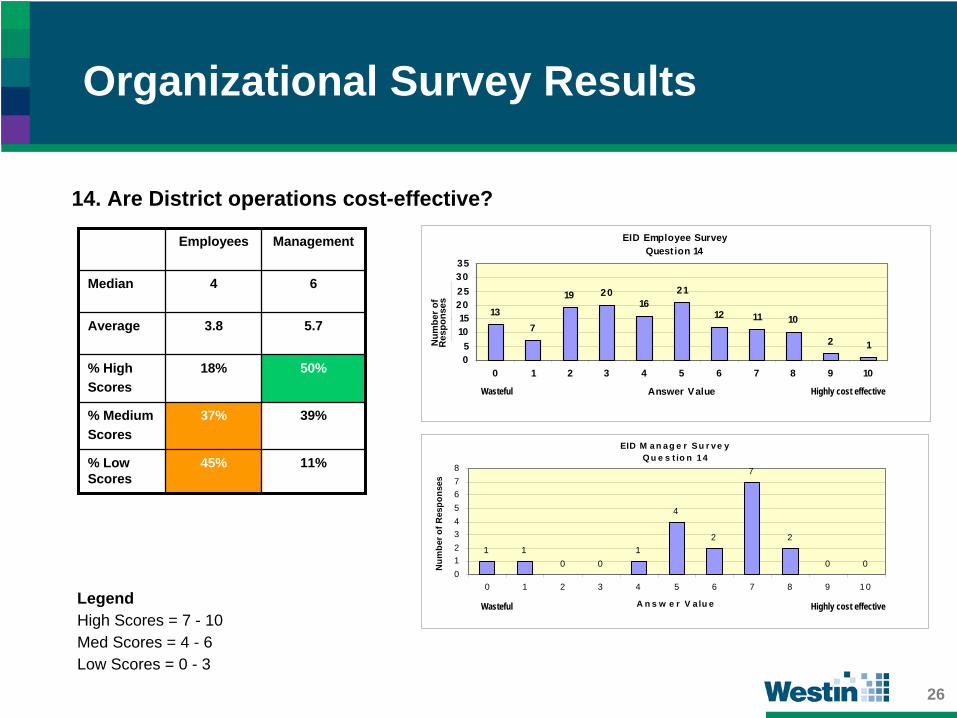
14. Are District operations cost-effective?
Employees Management
Median 4 6
Average 3.8 5.7
% HighScores
18% 50%
% MediumScores
37% 39%
% Low Scores
45% 11%
LegendHigh Scores = 7 -
10Med Scores = 4 -
6Low Scores = 0 -
3
EID M a n a g e r S u r ve yQ u e s t io n 14
1 10 0
1
4
2
7
2
0 0012345678
0 1 2 3 4 5 6 7 8 9 1 0
A n s w e r V a lu e
Num
ber o
f Res
pons
es
EID Employee SurveyQuest ion 14
137
19 2016
21
12 11 10
2 105
1015
20253035
0 1 2 3 4 5 6 7 8 9 10
Answer ValueWasteful Highly cost effective
Wasteful Highly cost effective
Num
ber o
f R
espo
nses

27
Organizational Survey Results
15. Is the District’s Management Team effective in oversight of day-to-day operations?
Employees Management
Median 4 8
Average 3.6 6.9
% HighScores
14% 78%
% MediumScores
38% 11%
% Low Scores
49% 11%
LegendHigh Scores = 7 -
10Med Scores = 4 -
6Low Scores = 0 -
3
EID M a n a g e r S u r v e yQ u e s t io n 1 5
10 0
10
1 1
4
8
1 1
012345678
0 1 2 3 4 5 6 7 8 9 1 0
A n s w e r V a lu e
Num
ber o
f Res
pons
es
EID Employee SurveyQuestion 15
15 14
28
9
2017
1410
6
03
0
5
10
15
20
25
30
35
0 1 2 3 4 5 6 7 8 9 10
Answer ValueVery ineffective Highly effective
Very ineffective Highly effective
Num
ber o
f R
espo
nses
28
Organizational Survey Results
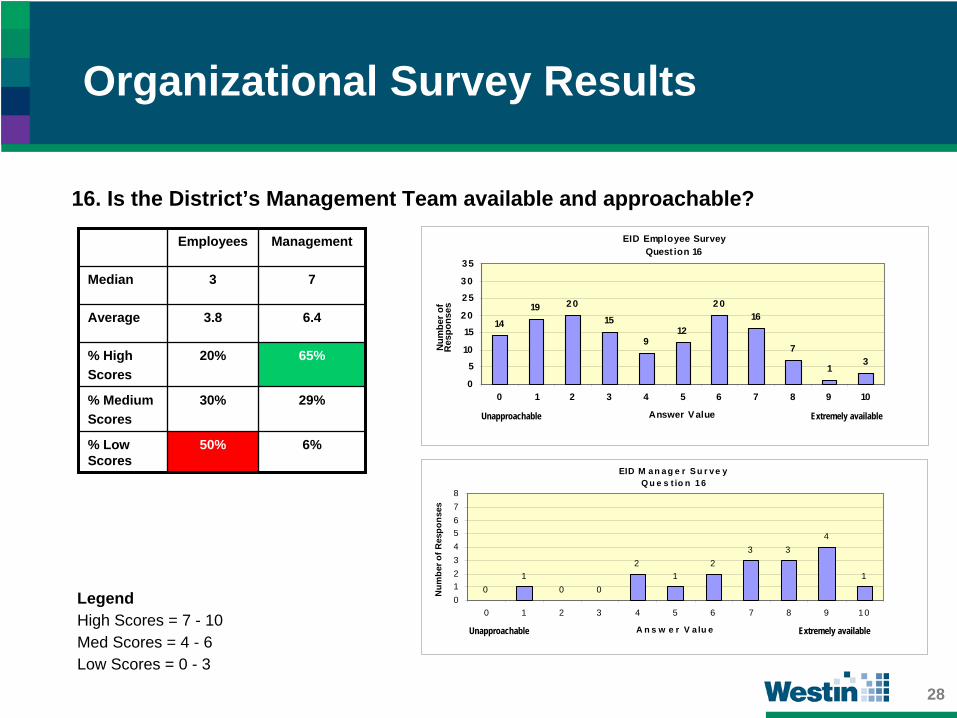
16. Is the District’s Management Team available and approachable?
Employees Management
Median 3 7
Average 3.8 6.4
% HighScores
20% 65%
% MediumScores
30% 29%
% Low Scores
50% 6%
LegendHigh Scores = 7 -
10Med Scores = 4 -
6Low Scores = 0 -
3
EID M an a g e r S u r ve yQ u e s t io n 16
01
0 0
21
23 3
4
1
012345678
0 1 2 3 4 5 6 7 8 9 10
A n s w e r V a lu e
Num
ber o
f Res
pons
es
EID Employee SurveyQuest ion 16
14
19 20
15
912
2016
7
13
0
5
10
15
20
25
30
35
0 1 2 3 4 5 6 7 8 9 10
Answer ValueUnapproachable Extremely available
Unapproachable Extremely available
Num
ber o
f R
espo
nses

29
Organizational Survey Results
17. Are you properly trained to effectively perform your job duties?
Employees Management
Median 7 9
Average 6.6 8.0
% HighScores
62% 83%
% MediumScores
22% 11%
% Low Scores
16% 6%
LegendHigh Scores = 7 -
10Med Scores = 4 -
6Low Scores = 0 -
3
EID M an ag e r Su r ve yQ u e s t io n 17
10 0 0
10
1 12
3
012345678
0 1 2 3 4 5 6 7 8 9 10
A n s w e r V a lu e
Num
ber o
f Res
pons
es
EID Employee SurveyQuestion 17
4 26
106
13 11
19
34
1814
05
1015
20253035
0 1 2 3 4 5 6 7 8 9 10
Answer ValueDefinitely no Extremely well trained
Definitely no Extremely well trained
Num
ber o
f Res
pons
es

30
Organizational Survey Results
18. Is there a high degree of teamwork within the District?
Employees Management
Median 6 8
Average 5.5 6.7
% HighScores
38% 71%
% MediumScores
37% 18%
% Low Scores
25% 12%
LegendHigh Scores = 7 -
10Med Scores = 4 -
6Low Scores = 0 -
3
EID M a n a g e r S u r v e yQ u e s t io n 1 8
01
01
01
23 3
5
1
012345678
0 1 2 3 4 5 6 7 8 9 1 0
A n s w e r V a lu e
Num
ber o
f Res
pons
es
EID Employee SurveyQuestion 18
58 9
129
2319
22
129 9
05
1015
20253035
0 1 2 3 4 5 6 7 8 9 10
Answer ValueNo teamwork High degree of teamwork
No teamwork High degree of teamwork
Num
ber o
f R
espo
nses

31
Organizational Survey Results
19. Do you believe that you will still be a District employee in 3 years?
Employees Management
Median 8 9
Average 7.0 7.6
% HighScores
64% 72%
% MediumScores
21% 17%
% Low Scores
15% 11%
LegendHigh Scores = 7 -
10Med Scores = 4 -
6Low Scores = 0 -
3
E I D M a n a g e r S u r v e yQ u e s t i o n 1 9
2
0 0 0 0
21 1
23
7
012345678
0 1 2 3 4 5 6 7 8 9 1 0
A n s w e r V a l u e
Num
ber o
f Res
pons
es
EID Employee SurveyQuest ion 19
7
36
47
18
3
12 13 13
0
5
10
15
20
25
30
35
0 1 2 3 4 5 6 7 8 9 10
Answer V alueDefinitely no Definitely yes
Definitely no Definitely yes
Num
ber o
f Res
pons
es

32
Organizational Survey Results
Management
Median 5
Average 4.4
% HighScores
28%
% MediumScores
28%
% LowScores
44%
20. Are the District’s strategic goals being achieved?
EID Manager SurveyQuestion 20
21
32
0
32
1
3
10
012345678
0 1 2 3 4 5 6 7 8 9 10
Answ er ValueN
umbe
r of
Res
pons
es
LegendHigh Scores = 7 -
10Med Scores = 4 -
6Low Scores = 0 -
3
None being achieved All being achieved

33
Organizational Survey Results
Management
Median 2
Average 3.5
% High Scores
33%
% Medium Scores
6%
% LowScores
61%
21. Is there a strong level of trust among Senior Management Team members?
LegendHigh Scores = 7 -
10Med Scores = 4 -
6Low Scores = 0 -
3
EID Manager SurveyQuestion 21
34
3
1 10 0
32
10
012345678
0 1 2 3 4 5 6 7 8 9 10
Answer ValueN
umbe
r of
Res
pons
esHigh suspicion High trust

34
Organizational Survey Results
Management
Median 4
Average 4.8
% HighScores
39%
% MediumScores
28%
% Low Scores 33%
22. Is there a high degree of respect among team members?
EID Manager SurveyQuestion 22
1
3
1 1
3
1 12
32
0012345678
0 1 2 3 4 5 6 7 8 9 10
Answ er ValueN
umbe
r of R
espo
nses
LegendHigh Scores = 7 -
10Med Scores = 4 -
6Low Scores = 0 -
3
Lack of respect Highly respectful

35
Organizational Survey Results
Management
Median 4
Average 4.1
% HighScores
22%
% MediumScores
33%
% Low Scores
44%
23. Is conflict adequately resolved?
EID Manager SurveyQuestion 23
12
4
12
1
32 2
0 0012345678
0 1 2 3 4 5 6 7 8 9 10
Answ er ValueN
umbe
r of R
espo
nses
LegendHigh Scores = 7 -
10Med Scores = 4 -
6Low Scores = 0 -
3
Denial, avoidance Acceptance and open suppression, or deflection “working through” of conflicts

36
Organizational Survey Results
Management
Median 7
Average 5.8
% HighScores
56%
% MediumScores
28%
% LowScores
17%
24. Is the District’s management team motivated and enthusiastic?
EID Manager SurveyQuestion 24
10 0
23
1 1
54
10
012345678
0 1 2 3 4 5 6 7 8 9 10
Answ er ValueN
umbe
r of
Res
pons
es
LegendHigh Scores = 7 -
10Med Scores = 4 -
6Low Scores = 0 -
3
Poorly motivated Highly motivated and extremely enthusiastic

37
Organizational Survey Results
Management
Median 8
Average 6.9
% HighScores
72%
% MediumScores
17%
% Low Scores
11%
25. Does the management team possess a high level of District pride?
EID Manager SurveyQuestion 25
01 1
0
21
0
34
5
1
012345678
0 1 2 3 4 5 6 7 8 9 10
Answ er ValueN
umbe
r of R
espo
nses
LegendHigh Scores = 7 -
10Med Scores = 4 -
6Low Scores = 0 -
3
Low Pride Great pride

38
Organizational Survey Results
Management
Median 8
Average 7.1
% HighScores
61%
% MediumScores
28%
% Low Scores
11%
26. Is the District’s Legal Department effective?
LegendHigh Scores = 7 -
10Med Scores = 4 -
6Low Scores = 0 -
3
EID Manager SurveyQuestion 26
01 1
01
3
10
3
5
3
012345678
0 1 2 3 4 5 6 7 8 9 10
Answ er ValueN
umbe
r of R
espo
nses
Ineffective Highly effective

39
Organizational Survey Results
Management
Median 5
Average 4.3
% HighScores
24%
% MediumScores
47%
% LowScores
29%
27. Are the District’s business processes efficient?
EID Manager SurveyQuestion 27
2
0
21
2 2
43
10 0
012345678
0 1 2 3 4 5 6 7 8 9 10
Answer ValueN
umbe
r of R
espo
nses
LegendHigh Scores = 7 -
10Med Scores = 4 -
6Low Scores = 0 -
3
Very inefficient Highly efficient

40
Organizational Survey Results
Areas for Perceived ImprovementEmployees Management1. Organizational Structure
1. Level of Trust2. Management/Employee Partnership
2. Handling Mistakes3. Handling Mistakes
Strategic Goals Understood4. Management Decisions 4. Strategic Goals Being Achieved
5. Handling Problems
Conflicts Resolved
Areas for Perceived ImprovementEmployees Management1. Organizational Structure
1. Level of Trust2. Management/Employee Partnership
2. Handling Mistakes3. Handling Mistakes
Strategic Goals Understood4. Management Decisions 4. Strategic Goals Being Achieved
5. Handling Problems
Conflicts Resolved
Areas of Perceived StrengthEmployees Management1. Still Will Be at EID in 3 years
1. Properly Trained2. Properly Trained
2. Effective Management Oversight3. Clear Job Duties and Responsibilities
Employees have District Pride4. Improved Board of Directors
4. Clear Job Duties and Responsibilities5. Effective Board of Directors
Still Will Be at EID in 3 years6. Fair Compensation
Management Team has District Pride

41
Organizational Assessment
Westin conducted an assessment of the District’s organizational structure and the changes that took place over the past several years. We compared the District from 2000 to January 2008.

42
Organizational Assessment
Several organizational changes took place between 2000 and January 2002 as shown below in the organizational chart.

43
Organizational Assessment
From 2000 to January 2008, several major common business functions within the District have been distributed among the Departments and Divisions, thus hampering effective and efficient work practices. The resulting average span of control is significantly unbalanced.

44
Organizational Assessment.
Position 2000January
2008%
Change
General Manager 1 1 0%
Director 3 6 100%
Senior Management Subtotal 4 7 75%
Assistant Director 0 5 ***
Managers 7 10 43%
Co-Managers 0 10 ***
Superintendants 5 1 -80%
Supervisors 8 16 100%
Mid-Management Subtotal 20 42 110%
Total District Management 24 49 104%
Hands-on Staff 147 148 1%
Support Staff 56 104 86%
Total Staff 227 301 33%
Total Customers 30,549 37,677 23%
Management and Employee Growth:•
The District’s total staff have grown from 227 to 301 (33%) over the past 7 years.
•
The Senior Management Team has grown from 4 to 7 (75%) over the past 7 years.
•
The Mid-Management Team has grown from 20 to 42 (110%) over the past 7 years.
•
The total Management Team has grown from 24 to 49 (104%) over the past 7 years.
•
The District’s customers have grown from 30,549 to 37,677 (23%) over the past 7 years.
•
The ratio of staff to management between 2000 and 2007 declined from 1:9 to 1:5.
•
The District’s “Hands-on Staff” have only grown by 1% over the past 7 years.
•
“Hands-on Staff” includes employees that physically process water, wastewater or reclaimed water or work on the system infrastructure. It includes water, wastewater and reclaimed water operations, maintenance and construction, plus the lab, SCADA, I&C and meter services personnel.
“Hands-on Staff” purposely does not include office personnel such as HR, engineering, accounting, customer service, Hansen, utility billing, purchasing, safety and security, PIO, GIS, drafting, environmental review, or water conservation. It also does not include fleet mechanics, recreation or hydro/watershed management personnel.

45
Organizational Assessment
YearAvg.
PopulationNew Hires
% New Hires
CumulativeNew Hires
2003 232 47 20.3% 47
2004 272 48 17.6% 95
2005 286 46 16.1% 141
2006 296 31 10.5% 172
2007 301 28 9.3% 200
District New Hires:
•
The average population of employees has grown significantly over the past 5 years from a total of 232 employees in 2003 to a total of 301 employees in 2007.
•
The percentage of new hires as compared to average population has significantly decreased over the past 5 years from over 20% in 2003 to under 10% in 2007.
•
During the past 5 years, the District has hired 200 new employees.

46
Organizational Assessment
YearAvg.
Population Separations Terminations TotalTurnover
Rate
2003 232 9 15 26 10.4%
2004 272 6 8 14 5.1%
2005 286 26 13 39 13.7%
2006 286 24 10 34 11.5%
2007 301 18 7 25 8.3%
Total 301 83 53 138 46%
District Separations and Terminations:
•
Approximately 46% of the staff have left the District over the past 5 years.•
The number of separations have significantly increased from 2003. •
The number of terminations (including Probation Periods) for the past five years total 53 employees.
•
The historical turnover rate for the past five years is greater than 9% annually.

47
Organizational Assessment
Year Eligible Employees Percentage
2008 46 14.6%
2009 61 19.4%
2010 73 23.2%
2011 86 27.3%
2012 91 31.4%
Department Eligible Year
Directors and Assistant Directors 78% 2012
Office of the GM 35% 2012
Finance and Management Services 36% 2012
Environmental Compliance and Water Policy
12% 2012
SMAC 36% 2012
FM Division Managers 29% 2012
Hydro 30% 2012
Wastewater/Recycled Water 31% 2012
Water 24% 2012
Construction 19% 2012
Recreation 43% 2012
Eligible District Retirements:
•
Over 30% of the District’s workforce is eligible for retirement by the year 2012.
•
Approximately 80% of the District’s Senior Management Team is eligible for retirement within the next 5 years.
•
Several Departments may face significant retirements (> 30%) over the next 5 years.
“Eligible for Retirement” is defined in this assessment as those employees age 55 or greater plus five (5) or more years of District service.

48
Organizational Assessment
Year Number of People
Labor $ % of Labor Expenditures
2005 14 $66,657 0.4%
2006 15 $138,309 0.8%
2007 17 $185,976 1.0%
Total 46 $390,942 0.8%
•
The District’s use of Administrative Leave has significantly increased over the past three years in cost of labor from approximately $66K in 2005 to approximately $186K in 2007.
•
Use of Administrative Leave has cost the District a total of $391K over the past three years in paid salary.
•
Approximately 5% of the District’s workforce has been placed on Administrative Leave in each of the prior three years.
•
Use of Administrative Leave for the prior three years added up to a total of 46 employees or as much as 15% of the District’s workforce.
Administrative Leave:

49
Organizational Assessment
Department 2005Actual
2006Actual
2007Actual
2007Budget
2007 %Expended
2007% Labor
Office of GM $32,331 $36,775 $14,370 $15,600 92% 0.8%
Strategic Management and Communications
$165,324 $40,816 $55,133 $47,625 116% 2.6%
Finance $41,363 $48,369 $92,402 $43,171 214% 3.0%
Environmental Compliance
$17,189 $56,903 $65,526 $40,172 163% 4.7%
Facilities Management $642,525 $769,148 $838,852 $318,823 263% 9.5%
Recreation $10,319 $9,606 $11,725 $0 - 1.5%
Total $909,051 $961,617 $1,078,008 $465,391 232% 6.0%
•
The District’s overtime costs have steadily increased over the past three years by over 9%.•
The District’s actual overtime far exceeds the total budgeted overtime for each of the prior three years. The results for 2007 exceeded the overtime budget by 232%.
•
The Facilities Management Department is the largest user of overtime at approximately 7 - 10 full-time equivalent (FTE) employee positions. Finance is the second largest user of overtime.
•
Note - This analysis does not include the Administrative Leave costs for all management level personnel, each with an additional 40 – 80 paid hours per year.
Overtime:
50
Organizational Assessment
Year Number of Hours
Labor Salaries
% of Total Labor Salaries
Avg.# of Days
2005 15,518 $424,878 2.7% 6.76
2006 16,892 $485,878 2.9% 7.38
2007 16,391 $486,968 2.7% 6.90
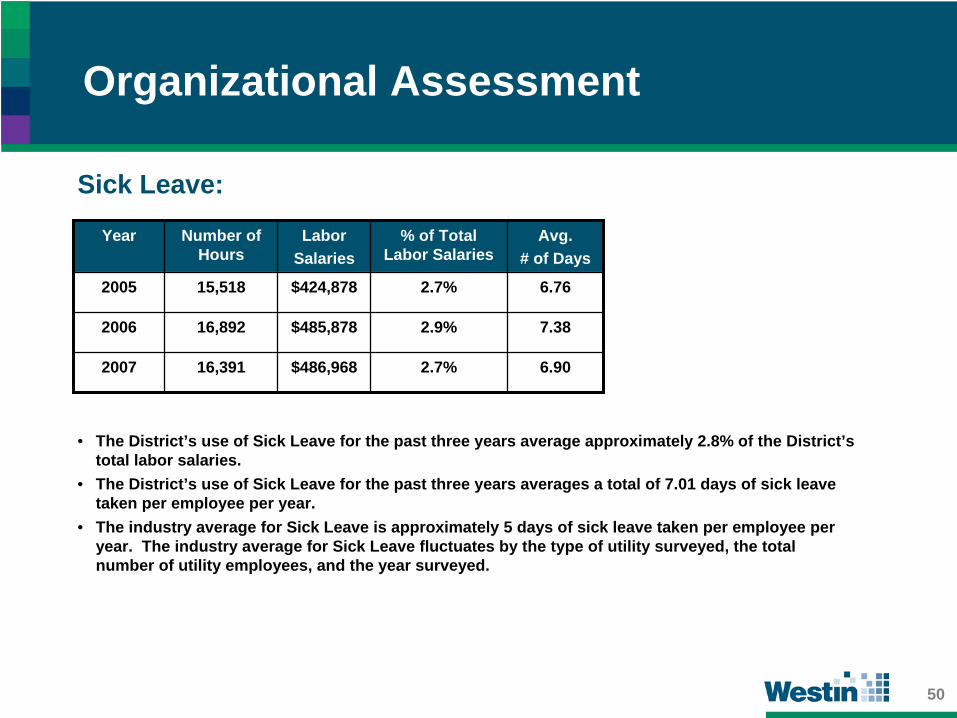
Sick Leave:
•
The District’s use of Sick Leave for the past three years average approximately 2.8% of the District’s total labor salaries.
•
The District’s use of Sick Leave for the past three years averages a total of 7.01 days of sick leave taken per employee per year.
•
The industry average for Sick Leave is approximately 5 days of sick leave taken per employee per year. The industry average for Sick Leave fluctuates by the type of utility surveyed, the total number of utility employees, and the year surveyed.

51
Assessment Findings
•
In October 2002, the District began employing in- house legal services in order to reduce costs and improve its legal services.
•
The Legal Department has significantly grown with the addition of an Assistant General Counsel, the shifting of Contract Management Personnel from Administrative Services, and the transfer of Real Property Services/Right-of-Way Agent and a Property Specialist, along with a shared Administrative Assistant.
•
The District’s General Counsel’s operating expenses (excluding legal expenditures for capital projects) have been significantly reduced from 2001 at approximately $1.1M to $573K in 2007.
•
56% of the Senior Management Team surveyed responded positively that the Legal Department has improved over the past several years.
•
61% of the Senior Management Team surveyed responded positively that the Legal Department is effective.
YearLegal
OperatingExpenditures
% of Operating
Expenditures
2001 $1,068,495 4.1%
2002 $1,110,845 4.1%
2003 $743,579 2.6%
2004 $607,130 1.8%
2005 $554,752 1.5%
2006 $611,120 1.5%
2007 $573,450 1.4%
Office of General Counsel:

52
CIP Spending
0
20
40
6080
100
120
140
2001 2002 2003 2004 2005 2006 2007
Year
$MM
Assessment Findings
Year Budget($M)
Expenditures($M)
% of Budget
2001 $50.8 $22.2 44%
2002 $52.8 $25.1 48%
2003 $81.2 $31.1 38%
2004 $68.2 $38.0 56%
2005 $89.7 $41.2 46%
2006 $114.6 $50.6 44%
2007 $58.4 $46.8 80%
Total $515.7 $255.0 49%
CIP Budgeting and Spending
CIP Expenditures
CIP Budget
•
The historical CIP expenditures are significantly below planned CIP budget (as low as 38% of budget).
•
Less than 50% of the dollar value of the planned CIP work has been executed from 2001 to 2007.
•
The capacity of executing the CIP budget has steadily grown from $22.2M in 2001 to approximately $50M in 2006 and 2007.
•
Best practices require that CIP expenditures to CIP budget are greater than 80% each year.
$M

53
Best Practice: Current Performance:•
Written three to five-year Strategic Plan document defining the agency’s vision, values, strategies, goals and objectives for enterprise-wide improvement.
•
Strategies are aligned with the Balanced Scorecard methodology from multiple perspectives.
•
Effective communication of the Strategic Plan to all key stakeholder groups, including the Board of Directors, the management team, and to all employees.
•
Plan is available on-line for ease of communication to all rate payers and other key stakeholder groups.
•
The District has a defined Mission Statement.•
No formal Strategic Plan or strategic planning process as part of the annual budget/financial cycle.
•
Legal Department and SMAC have created departmental strategies.•
No formally adopted District-wide Vision Statement.•
No formally adopted set of stated District Values.
Initial Recommendations:•
Develop a Three-Year Strategic Plan consisting of defined strategies for improvement based upon the Balanced Scorecard methodology for public sector entities.
•
Develop a District-wide Strategy Map for ease of communication to the various stakeholder groups.•
Include a formal Vision Statement defining where the District wishes to be in the future.•
Include a set of balanced strategies, goals and objectives that will achieve the District’s mission and vision.•
Include a series of formal value statements for management and staff to adhere to.•
Broadly communicate the Strategic Plan to all key stakeholder groups.
Assessment Findings 1. Strategic Planning

54
Best Practice: Current Performance:•
Employ a flexible, efficient, flat organization with effective spans of control.
•
Establish clear accountability and lines of authority for effective and efficient decision making.
•
Concentrate similar functions.•
Align core functional areas for effective supervision, efficient work flow, efficient use of staff, cross training, and personal development.
•
Extensive organizational changes occurred over the past 5 years.•
The General Manager has 8 current direct reports.•
Work functions are inappropriately distributed among Departments. •
The span of control varies greatly between Departments, management levels, and between engineering and operations.
•
Information technology (IT) personnel are scattered throughout the organization (GIS, Hansen CMMS, Great Plains, SCADA, Help Desk).
•
Engineering expertise is split across two Departments and divided among three Divisions within Facilities Management.
•
SMAC has a collection of disparate services including PIO, Safety and Security, Construction Inspection, GIS, Drafting, Meter Services, USA Locate, Residential/Commercial Development and Customer Services.
•
Finance Department includes Hansen support and a Fleet Maintenance Division with mechanics, painter, welders, and hazardous materials.
•
Environmental Compliance and Water Policy Department includes the Lab Section.•
Facilities Management is organized by services. Core skill sets
are split among Divisions. No one individual is responsible for overseeing District-wide engineering, maintenance or asset management.
Initial Recommendations:•
Re-align major core functional areas within Departments such as engineering, maintenance, construction, instrumentation and control
and information technology.
•
Flatten the organizational hierarchy to reduce management-to-staff ratios where appropriate. •
Eliminate one-to-one reporting hierarchies and level the span of control among managers.•
Re-align the Lab, Hansen, SCADA, Meter Services, Customer Services,
GIS, and Fleet Maintenance into the appropriate Departments.
Assessment Findings 2. Organizational Structure

55
Best Practice: Current Performance:•
High degree of emphasis and alignment with mission, vision and quality of services.
•
Highly adaptive and open to changing conditions.•
Team culture focused on delivering expected results.•
Effective coordination and information sharing across Departments.•
Employees are motivated and dedicated to the success of the whole enterprise.
•
Manager and employee relations are harmonious.•
Employees have a strong sense of ownership and personal pride in
the organization.•
Conflict and differences are well managed.•
Creative and inspiring atmosphere with high value on professionalism and achievement.
•
High sense of overall District pride among both management and staff personnel
•
Apparent distrust among the District’s management team.•
Lack of an effective partnership between management and represented employees.
•
Employees are apparently concerned about repercussions for making inadvertent mistakes.
•
Perception that the District’s management team is not generally available and approachable.
•
Many employees surveyed feel they are under-motivated.•
Limited cross-functional teams exist within the District.•
General feeling among staff that administrative policies have been inconsistently applied across Departments.
•
Departments have been free to interpret administrative policies.•
No formal written policy for on-call personnel.
Initial Recommendations:•
Need to develop and effectively communicate new strategies for increased employee/management relations in order to instill a sense of collaboration and teamwork within the Senior Management team and
across the District.•
Employ strategic planning workshops with active staff participation.•
Create Continuous Improvement Teams (CIT) for the development of
cross-functional teams to solve District-wide issues.•
Ensure that all administrative policies are fairly employed and the results of administrative decisions are adequately communicated.•
Improve the quality of management and staff communications by increasing the frequency of face-to-face communication by the employee’s direct supervisor.
Assessment Findings 3. Organizational Culture

56
Best Practice: Current Performance:•
Effective assignment and management of labor resources across a wide range of operations and maintenance activities.
•
Consistent application of management policies across the organization.
•
Consistent measure of performance within all job classifications.•
Consistent and effective performance review process across organization.
•
Ability to financially reward top performers in each job classification.•
Effectively use training to correct unintended behaviors.•
Ability to correctly discipline intentional bad behaviors.
•
The Administrative Regulations were adopted in 2006 to synthesize prior policies, rules and practices.
•
The Employee Handbook is still in draft format.•
A large percentage of employees are at the top of their pay scale. •
A total of 46 employees were placed on Administrative Leave during the past 3 years.
•
A total of 53 employees were terminated over the past 5 years, including those that did not pass the probationary period.
•
There is an apparent lack of a formal review process in determining retention of employees at the conclusion of the probationary period.
•
Staff work different schedules (5-8’s, 4-10s, 24 hour shifts).•
Apparent history of late performance reviews past the employee’s
anniversary date.
Initial Recommendations:•
Establish a competitive District vision to promote growth and continuity within the District. •
Establish a formal leadership training program and a formal training program for new managers and supervisors.•
Enhance the District’s Performance Review process, management reviews, and signature cycles.•
Formalize staff position job descriptions to identify qualifications, responsibility, accountability and annual review criteria.
Each position should have clearly defined ‘key performance results’, measures and expectations.
•
There should be a formal review of probationary performance.•
Eliminate the 24-hour shifts.
Assessment Findings 4. Resource Management

57
Best Practice: Current Performance:•
Capture and share business and operational knowledge to support a continual learning process.
•
Establish a formal enterprise-wide succession plan.•
Establish a clearly identified career path for all job classifications.•
Ensure the effective and efficient development of new knowledge.•
Ensure that knowledge is effectively secured so that it can be easily accessible to the entire organization.
•
Keep the body of knowledge up to date.
•
31% of the workforce will be eligible for retirement by 2012.•
BP 3070 incorporates by reference the State of California Local Government Records Retention Program, which was adopted by the Board of Directors on January 6, 2003.
•
The District does not have a formal enterprise-wide document management program.
•
There has been discussions and presentations for development of a formal Succession Plan, but no such plan exists.
•
A formal Career Development Plan for a majority of employees is not defined.
Initial Recommendations:•
Identify and implement near-term succession plan for each Department. •
Formulate a strategic policy for the development and application
of knowledge.•
Implement an Electronic Document Management System with integrated documents, records, and forms management and for accessing operator manuals, manufacturers’ cut sheets, plant drawings, and
regulatory reports.•
Identify employees to move into key positions and begin to transfer knowledge from employees planning to retire.•
Implement an Operations Knowledge Management System for capturing the knowledge of experienced operators regarding alternative actions appropriate to different plant conditions.
•
Identify career paths for all job classifications.
Assessment Findings 5. Knowledge Management
58
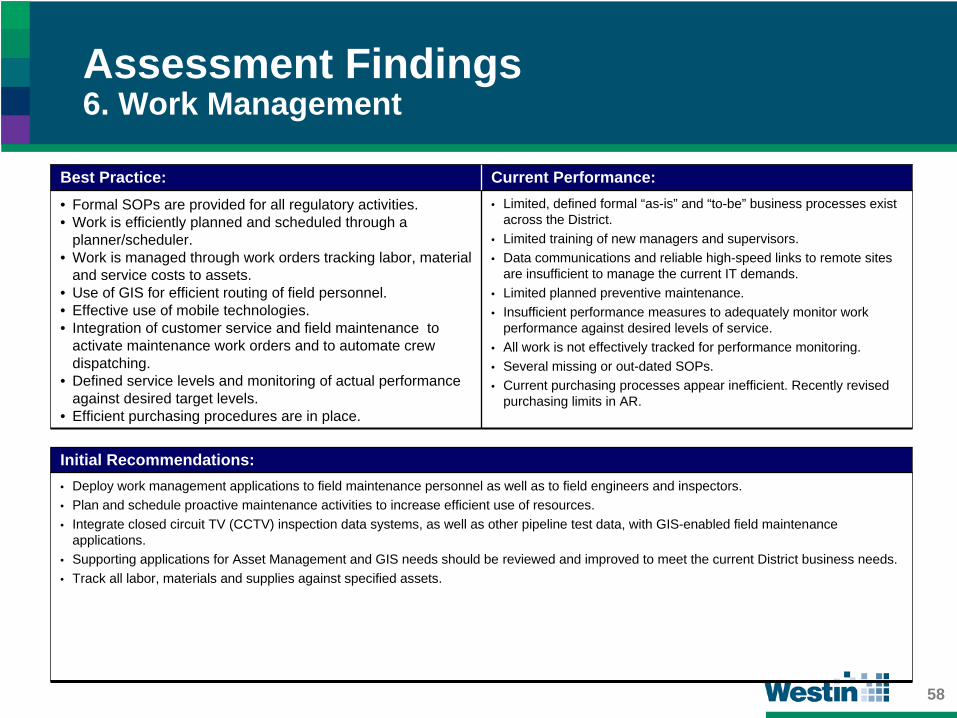
Best Practice: Current Performance:•
Formal SOPs are provided for all regulatory activities.•
Work is efficiently planned and scheduled through a planner/scheduler.
•
Work is managed through work orders tracking labor, material and service costs to assets.
•
Use of GIS for efficient routing of field personnel.•
Effective use of mobile technologies.•
Integration of customer service and field maintenance to activate maintenance work orders and to automate crew dispatching.
•
Defined service levels and monitoring of actual performance against desired target levels.
•
Efficient purchasing procedures are in place.
•
Limited, defined formal “as-is” and “to-be” business processes exist across the District.
•
Limited training of new managers and supervisors.•
Data communications and reliable high-speed links to remote sites are insufficient to manage the current IT demands.
•
Limited planned preventive maintenance. •
Insufficient performance measures to adequately monitor work performance against desired levels of service.
•
All work is not effectively tracked for performance monitoring.•
Several missing or out-dated SOPs.•
Current purchasing processes appear inefficient. Recently revised purchasing limits in AR.
Initial Recommendations:•
Deploy work management applications to field maintenance personnel as well as to field engineers and inspectors.•
Plan and schedule proactive maintenance activities to increase efficient use of resources. •
Integrate closed circuit TV (CCTV) inspection data systems, as well as other pipeline test data, with GIS-enabled field maintenance applications.
•
Supporting applications for Asset Management and GIS needs should be reviewed and improved to meet the current District business
needs.•
Track all labor, materials and supplies against specified assets.
Assessment Findings 6. Work Management

59
Best Practice: Current Performance:•
Updated, forward-looking Information System Master Plan that provides a road map for all IT purchases.
•
Integrated set of core applications and databases.•
Improved financial management through delivery of more accurate and timely information regarding CIP management, work management and asset management.
•
Computerized Maintenance Management System (CMMS) linked with GIS and Customer Information System (CIS) enabling efficient routing of critical information to field crews.
•
Electronic document management enabling automated routing of notification forms as well as ease of access to project records and drawings.
•
Conducting an IT Master Planning study.•
GIS base map efforts are lagging as-built entry into the database. Effective use of GIS is lagging other similar agencies.
•
Hansen CMMS resides within Finance. Hansen CMMS is not efficiently deployed or adequately supported. Hansen CMMS lacks
reporting capability to effectively aid field end users. Finance is using clerical entry of information in lieu of field entry by maintenance staff. Business processes are inefficient and ineffective.
•
Great Plains Financial Information System (FIS) is currently being deployed as a replacement for the HTE system. Full deployment is impacted due to inadequate system planning and staff training.
•
No formal enterprise-wide document management application.•
No formal District-wide CIP management application.•
No formal Laboratory Information Management (LIMs) application.•
No formal performance reporting or business intelligence application.
Initial Recommendations:•
The District needs to successfully deploy, implement and integrate its IT applications and streamline data entry and reporting for greater efficiency and improved data management and quality.
•
GIS should be driven by engineering with increased accountability to operations and residential/commercial development engineering.•
CMMS and GIS should be field accessible and integrated into the work management business processes and CIS.•
Prioritize, plan, budget and implement the resulting recommendations contained in the IT Master Plan.
Assessment Findings 7. Information Management

60
Best Practice: Current Performance:•
Efficient and effective use of multi-media communication channels.•
Extensive use of wireless technologies for field staff.•
Ease of access to agency intranet site by all employees.•
Regular face-to-face meetings with all direct line supervisors.•
Routine site visits to field facilities by executive and mid-level management staff.
•
The District currently publishes and posts a bi-monthly District newsletter.
•
The District currently maintains a Web site –
newsletter, Consumer Confidence Report, Board of Directors meetings, agendas, master plans, recreation resource site are available to the general public.
•
The District’s Facility Management Status Report of Jan. 18, 2008 echoes the issue of network communications problems between District office and remote sites, impacting work efficiency and system reliability.
•
The District conducts monthly Department Head/Assistant Department Head meetings.
•
Information Exchange Team (IET) meetings are conducted after the
every Board meeting and open to all staff.•
Many staff were provided with Blackberries for remote e-mail and phone access.
Initial Recommendations:•
Ensure that executive management team is periodically meeting with remote plant and field staff.•
Improve ease of access to agency intranet site for all field employees.•
Ensure Board meetings are broadcasted to all available employees.•
Increase the frequency of periodic face-to-face meetings of all direct line supervisors.
Assessment Findings 8. Communications

61
Best Practice: Current Performance:•
Fleet Manager to manage the operations and maintenance of all District vehicles.
•
Manager to be empowered to establish fleet vehicle allocations to departments based on personnel and duties requiring mobility.
•
Fleet is established as a true internal service fund. •
Cost of repairs and shop overhead is applied to service job order.•
Use a fleet management software program to track vehicle repair and maintenance records.
•
Monitor and track vehicle operational costs to determine vehicle
replacement schedule.
•
Fleet Operations is funded as an overhead service to the District•
The District has a Fleet Maintenance Division Manager but does not employ an enterprise-wide Fleet Manager position.
•
There is no current Fleet Management Policy governing fleet expenses, maintenance or capital funding distribution among the divisions utilizing District vehicles and equipment.
•
Hansen is used to track maintenance of vehicles. Total cost is not captured for reporting or analysis.
•
Not all fuel consumption is tracked and reported by each vehicle.•
Divisions currently do not fund operations, maintenance, and capital expenses of fleet or rolling stock.
Initial Recommendations:•
Establish accounting and budget for Fleet Maintenance as a Cost Center rather than a General Fund department, allocating cost of
maintenance to each department based on actual maintenance costs
and department over-head based on job orders charged to vehicles•
Designate a Fleet Manager to manage operations and management of
all vehicles for the District. Manager to be empowered to establish fleet vehicle allocations to departments based on personnel and duties requiring mobility.
•
Report on the performance of vehicle utilization, vehicle condition, shop performance, and replacement and retirement of vehicles.•
Install, train and implement software to track and monitor vehicle maintenance and repair records, work orders, inventory, and associated costs. Provide a terminals in the shop area for mechanics to review, record and complete job orders.
Assessment Findings 9. Fleet Operations and Management

62
Best Practice: Current Performance:•
Full compliance to all OSHA required annual safety training required across all Departments.
•
Each department/division within the organization budgets for training in safety, skills enhancement, technical and managerial
improvement.•
Formal cross-training of personnel for succession planning, career development and job advancement.
•
Compliance to budgeted training vs. actual training is a key performance indicator for all departments/divisions within the organization.
•
Minimum standards of qualifications, certifications and experience are established within the job descriptions of all the organization.
•
Training programs appear to be adequately supported by management.
•
Working with Folsom Lake College for ops training program.•
Policies support certification credit hours and time/travel.•
No financial incentive to gain higher certification, however it is a component of advancement in classification.
•
No formal plan of cross-training. Cross-training varies in deployment, effectiveness and support across the organization.
•
Not presently incorporating internships or co-op students within the organization.
•
Have formal course for new orientation training.•
Have formal Operator in Training (OIT) Program•
Conducted in-house Project Management training in 2006.•
No leadership development training program.•
No new supervisor or manager training program.•
No formal customer relationship training.•
No formal training on the Employee Handbook.
Initial Recommendations:•
Develop formal Safety Training and training records management program for uniform training, compliance to OSHA required annual training topics and uniform application of training program to all divisions within the District.
•
Each department/division within the organization formulates an annual training program, a budgeted line item for each, and specific key performance indicators for compliance.
•
Implement a new manager and supervisor training program.•
Implement a leadership development training program.•
Ensure that confined space, electrical safety and other critical
safety training is executed.
Assessment Findings 10. Training

63
Best Practice: Current Performance:•
Fully supported Classification and Compensation Study by independent firm.
•
Selection and buy-in of comparable agencies.•
Fully developed classifications based on job duties and requirements.
•
Compensations based on industry standards and job classifications.•
Efficient and effective performance review process.
•
Compensation Study performed by Nash (11/07). •
The recommendations within the Compensation Study were not implemented.
•
No recent Classification Study.•
Current District practice is to offer the same salary range for each level of supervisor positions and up (AR4107). Accordingly, a majority of District employees are at their top step of their salary range. This “Equal Pay Policy” is inconsistent with industry standard and limits the District’s ability to financially incentivize top performers or motivate weaker performers.
•
Pay increases in FY-08 did not align with the recommendations contained in the 2007 Nash Compensation Study.
•
Performance review process is scheduled to be performed on employee’s anniversary. Current process requires 5 signatures for ultimate approval of each review, including the General Manager.
Initial Recommendations:•
Conduct a new classification and compensation study. Develop appropriate classifications for the District and implement compensation recommendations.
•
Eliminate existing policy of equal compensation to all management classifications.•
Implement a salary structure to adequately reward top performers
and motivate weaker performers.•
Enhance the Performance Review process. Eliminate the reviews on anniversaries and switch to a focal process. Reduce the number of required signatures. Reduce the 25 available scoring levels to 5.
Assessment Findings 11. Classification and Compensation

64
Best Practice: Current Performance:•
Manage all assets through the full life cycle from procurement through disposal.
•
Ensure asset registry is complete and updated as new assets are placed into service and old ones disposed of.
•
Capture all labor, material and service costs to assets and align with GL within Finance.
•
Prioritize maintenance based on asset criticality.•
Perform 100% of all planned preventive maintenance activities on
schedule.•
Employ dedicated staff to perform all scheduled preventive maintenance activities, site visits, inspections and testing.
•
Establish a long-range estimate of future repair and rehabilitation cost of all major asset classes.
•
No formal Asset Management Plan•
No designated single point of accountability for asset management (Asset Manager).
•
Employing straight line depreciation of asset value.•
No long term (>5 years) financing plan for future R&R needs.•
No formal reserve policy.•
Asset replacement value is not known.•
CIP actual expenditures to planned averages less than 50% over the past 5 years.
•
No formal condition assessment program for all asset classes.•
Limited formal preventive maintenance programs.•
Limited predictive maintenance program.•
No formal asset criticality analysis.
Initial Recommendations:•
Initiate a condition monitoring and data collection program focused on the above ground rotating equipment assets within Hansen CMMS and log data into the inspection record screens within Hansen of all
condition data collected. Data to include vibration, motor performance data, infrared thermography
(temperature readings), oil analysis and flow performance where
applicable.•
Develop standards of measure/evaluation for condition monitoring
and data collection. Train applicable staff in use of instruments and methods. Monitor and report results. Trend performance over time and establish minimum performance standards to trigger corrective action.
•
Include condition assessment data in the evaluation of repair and rehabilitation decisions and the CIP prioritization process.
Assessment Findings 12. Asset Management

65
Best Practice: Current Performance:•
Formal performance management program tied to the agency’s mission, strategies, and financial plan.
•
Series of meaningful performance measures aligned with multiple business perspectives (customer, financial, innovation, and learning and growth).
•
Motivates performance to desired levels of service.•
Quickly enables managers and staff to monitor performance against desired targets.
•
Tracks in-process and outcome measures.•
Provides trending of historical performance.•
Metrics are monitored monthly by management.•
Metrics are effectively and efficiently communicated to all key stakeholders.
•
No formal enterprise-wide performance management program.•
Limited performance measures throughout the District.•
Limited historic trending of performance.•
Limited activity-based costing processes.•
The District is not an AWWA QualServe
Benchmarking participant.•
No business intelligence or decision support software applications.•
Not a performance-based management culture.
Initial Recommendations:•
Implement a formal performance management program with defined accountabilities and desired levels of service.•
Create top-tier performance measures tied to the new Strategic Plan to monitor progress towards desired services levels.•
Implement a hierarchy of plant and water system operational and maintenance measures to drive continuous improvement, resulting in performance improvements (such as proactive to reactive work ratio, planned work ratio, and total work backlog).
•
Implement a hierarchy of in-process and outcome measures to monitor support functions such as HR, Finance, Legal, Purchasing, Utility Billing, Environmental Compliance, Safety and Security, Fleet, Development Services, and Payment Processing.
•
Establish a reporting program that trends the actual level of performance against the desired level of performance over time. •
Effectively communicate performance against goals to all key stakeholders.•
Analyze results for potential corrective actions to continuously
improve performance.
Assessment Findings 13. Performance Management

66
Best Practice: Current Performance:•
The CIP Planning Program supports a short-term (typically 5-year prioritized plan of projects) and a long-term plan (typically extending 20+ years).
•
Utilize project portfolio management applications to support prioritization for CIP budgeting.
•
The CIP prioritization methodology includes data related to life
cycle cost analysis, net present value, and asset replacement costs.
•
Project priority of all Rehabilitation and Replacement (R&R) is based on established decision models including condition of assets, level of service, and remaining useful service life.
•
Conducted Project Manager training class in 2006.•
Rolling 5-year CIP updated annually.•
Project managers receive bi-weekly project reports.•
Facilitate monthly project progress meetings.•
Utilize Microsoft Project for project scheduling.•
Limited and outdated design standards.•
The Great Plains implementation is expected to include a CIP Management module.
•
CIP budget is not leveled –
from $114M in 2006 to $58M in 2007.•
The current level of CIP Project Engineers does not support the volume of projects planned and approved for construction.
Initial Recommendations:•
Determine the long-term future R&R needs of the District through implementation of an effective asset management program. •
Standardize in-house project tracking and budget management practices for managing CIP projects and implement an integrated suite of CIP budgeting, engineering, and construction applications.
•
Continue efforts to fully staff the Project Engineering vacancies to meet the current level of projects funded and scheduled. •
Employ outside resources to supplement project engineering and project management when the requisite project backlog exceeds in-house staff capacity.
•
Document future CIP business processes based on best practices for asset management, CIP budgeting, construction project portfolio management, construction project planning and scheduling, and construction project inspection.
•
Develop an economic decision model to analyze current available data of assets to deliver option alternatives for major repair, rehabilitation or replacement of assets, based on remaining service life, net present value, replacement cost, life-cycle cost, level of service, performance, criticality and risk.
Assessment Findings 14. Capital Improvement Project Planning & Budgeting

67
Best Practice: Current Performance:•
Fully developed specifications and standards included into the District ordinances, with accountability, consequences and enforcement.
•
Aggressive water conservation and compliance program.•
100% compliance to reporting schedule of deliverables to local, state and federal agencies.
•
0% tolerance of violations to regulatory compliance reporting.
•
Engineering reviews all SSO incident reports to the State.•
Compliance reporting to SSMP and CMOM requirements.•
Hansen is the sole capacity, management, operating and maintenance (CMOM) reporting repository of maintenance activities for the sewer collection system.
Initial Recommendations:•
Develop document management standards and systems within the department for records management, storage, retrieval and disposal.•
Create a calendar of all regulatory activities with defined accountabilities.•
Implement a modern Electronic Document Management System, commonly utilized within high performing water/wastewater agencies, for use in developing regulatory compliance applications (including incident and risk management applications).
•
Utilize electronic records management to track recorded compliance data, track past compliance reports, and schedule future compliance report submissions.
Assessment Findings 15. Regulatory Compliance

68
Best Practice: Current Performance:•
Fully developed department vision and mission statements.•
Understood department goals, policies and procedures.•
Staff held accountable at all levels.•
Job related training available to staff at all levels.•
Performance Measures used to gauge the effectiveness of a department’s operations.
•
Design standards reviewed and updated yearly.
•
Integrated Regional Water Management Plan (Dec. 2006).•
Five-Year Water Management Plan (2005 Update) 03/06.•
Urban Water Management Plan Update (2005 Update) 01/06.•
Design standards dated July 1999.•
SCADA data not currently linked or associated to the hydraulic flow model.
•
Some of the water distribution piping remains undocumented in the older sections of the District’s supply network.
•
No SCADA Master Plan.
Initial Recommendations:•
Review and update design standards as necessary to current-day standards.•
Link flow data from the meter readings from customer meters, plant master meters and construction meters with reservoir fluctuations and system flow meters to calibrate the water hydraulic flow model.
•
Mapping and collecting infrastructure data relating to the water
distribution system will improve the accuracy and results obtained from the hydraulic model.
•
Establish policy to review operating deficiencies within the water supply operations and review on a periodic basis (i.e. 24 months) all active SOP’s.
•
Continue to include data gathered from the older sections of the
District’s water distribution system and include these updates in the GIS mapping effort.
Assessment Findings 16. Water Supply Management

69
Best Practice: Current Performance:•
Fully developed department vision and mission.•
Understood goals, policies and procedures.•
Staff held accountable at all levels.•
Job related training available to staff at all levels.•
Performance measures used to gauge the effectiveness of a departments operations.
•
Design standards reviewed and updated yearly.•
Update Master Plans on a regular basis.
•
Draft Recycled Water Master Plan Completed in December 2002.•
Design standards dated July 1999.•
Not enough recycled water storage to serve demand in peak season.
Initial Recommendations:•
Review and update design standards as necessary.•
Continue to evaluate additional seasonal storage to eliminate need to fill recycled system with potable water. •
Review and establish as controlled documents SOP’s
for the operations of the recycled water distribution and operations.•
Establish policy to review operating deficiencies within the recycled water operations and review on a periodic basis (i.e. 24 months) all active SOP’s.
Assessment Findings 17. Recycled Water Management

70
Best Practice: Current Performance:•
Fully developed department vision and mission.•
Understood goals, policies and procedures.•
Staff held accountable at all levels.•
Job related training available to staff at all levels.•
Performance measures used to gauge the effectiveness of a departments operations.
•
Design standards reviewed and updated yearly.•
Update Master Plans on a regular basis.
•
Wastewater Corrective Action Plan completed in November 1998.•
2025 Wastewater Master Plan completed in November 2001.•
3 formal enforcement actions and 50 violations linked to formal enforcement actions at the Deer Creek Wastewater Treatment Plant.
•
Design standards dated July 1999.•
Successfully worked with Regional Board during permit renewal process.
Initial Recommendations:•
Review and update design standards as necessary.•
Review and establish as controlled documents SOP’s
for the operations of the District’s wastewater treatment plants. •
Establish policy to review operating deficiencies within the wastewater operations and review on a periodic basis (i.e. 24 months) all active SOP’s.
Assessment Findings 18. Wastewater Management

71
Best Practice: Current Performance:•
Fully developed department vision and mission.•
Understood goals, policies and procedures.•
Staff held accountable at all levels.•
Job related training available to staff at all levels.•
Performance measures used to gauge the effectiveness of a departments operations.
•
Staff are apparently aware of Department’s vision and goals.•
Daily work orders completed and entered into Hansen.•
Sense of strong internal communications.•
Job descriptions are generic.•
Training includes safety and snow conditions.•
Lacking opportunities for formal technical training.
Initial Recommendations:•
Develop job classifications specific to the job duties within the Hydro/Watershed Management Division.•
Develop a formal training program specific to the Department.•
Review and establish as controlled documents SOP’s
for the operations of Project 184.•
Establish policy to review operating deficiencies within the Project 184 operations and review on a periodic basis (i.e. 24 months) all active SOP’s.
Assessment Findings 19. Project 184 Management

72
Summary of Assessment Results
Noted District Successes:•
High level of District pride,•
Capital planning and water system infrastructure to meet growth demands,•
Regional recycled water leader,•
Hired new General Manager,•
Reduced the Legal Department’s operating expenditures,•
Obtained grant funding of $14.6M within the past three years, •
Competitive total compensation package for District employees,•
Increased water industry participation and recognition,•
Advancing Automated Meter Reading (AMR) for water and recycled water,•
Employing field GPS tools to assist in mapping District assets into the GIS,•
District’s financial ratings upgraded by national firms,•
Employees feel that they are adequately trained for their positions, and •
Many recent or new improvement initiatives underway.

73
Summary of Assessment Results
Recent or On-Going District Initiatives:•
Reactivated standing Board Committees,•
New Administration Regulations adopted in 2006, •
Draft Employee Handbook,•
Updating the Five-Year Financing Plan (2008 –
2012),•
New program to attract engineers,•
Fleet Management Study and implementation,•
Implementing Headquarters Master Plan,•
Eliminated equal pay practice for new hires,•
RFQ for Integrated Water Resources Master Plan and WW Master Plan,•
Beginning a valve exercising program,•
Rate Study for water, wastewater and recycled water,•
Adopted Drought Preparedness Plan and developing an Implementation Plan,•
Updating the Emergency Response Plan,•
Developing an Information Technology Master Plan,•
Implementing Great Plains financial information system (FIS), and•
Participating in helping to finance water rights application.

74
Summary of Assessment Results
Noted Areas for Improvement:•
Strategic visioning and planning,•
Organizational alignment,•
Collaborative culture,•
Defined business processes,•
Total life cycle asset management,•
Preventive and predictive maintenance,•
Long-term financial planning,•
Reserve policies,•
Classification and Compensation Study,•
Integrated information systems,•
Knowledge and data management,•
Document management,•
Succession planning,•
Formal training and career development program, and•
Performance management program.
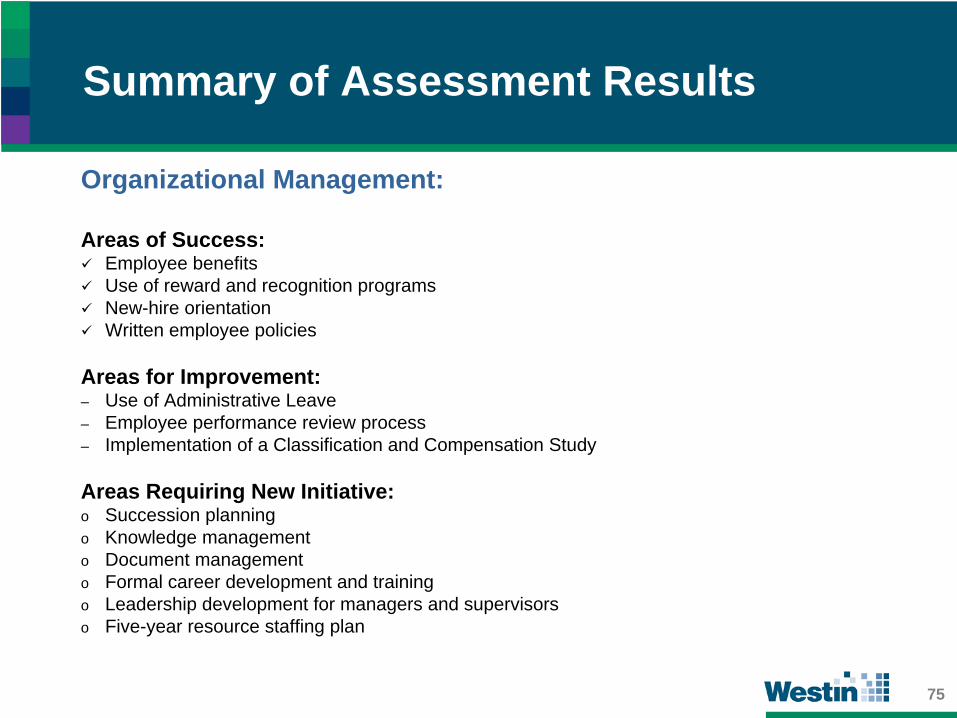
75
Summary of Assessment Results
Organizational Management:
Areas of Success:Employee benefitsUse of reward and recognition programsNew-hire orientationWritten employee policies
Areas for Improvement:–
Use of Administrative Leave –
Employee performance review process –
Implementation of a Classification and Compensation Study
Areas Requiring New Initiative:o
Succession planning o
Knowledge management o
Document managemento
Formal career development and trainingo
Leadership development for managers and supervisorso
Five-year resource staffing plan

76
Summary of Assessment Results
Financial Management:
Areas of Success:Formal investment policyControl of fiscal year budget to expenditures
Areas for Improvement:–
Managing CIP budget to expenditures–
Use of CIP budget and scheduling management tools–
CIP project manager training
Areas Requiring New Initiative:o
Formal financial reserve policyo
Asset replacement valuationo
Use of activity based costing

77
Summary of Assessment Results
Asset Management:Areas Requiring Improvement:–
Asset inventory–
Preventive maintenance–
Predictive maintenance–
Hydraulic modeling–
Design standards–
Condition assessment–
Asset valuation model–
Performance management
Areas Requiring New Initiative:o
Development of an Life Cycle Asset Management Plan o
Enterprise-wide asset criticality analysiso
Defined level of service modelo
Asset management accountability and analysis o
Future repair and rehabilitation financial forecast

78
Summary of Recommendations
StrategicBusiness Plan
EAM Plan Capital Improvement Plan
FinancialPlan
R&RPlan
PerformanceManagement
ITMaster Plan
OtherPlans
PerformanceAssessment
StrategicBusiness Plan
EAM Plan Capital Improvement Plan
FinancialPlan
R&RPlan
PerformanceManagement
ITMaster Plan
OtherPlans
PerformanceAssessment
Continuous Utility Improvement Building Blocks:Integrated Water Resource PlanWater System Master PlanDrought Management PlanResource Needs and Recruiting PlanFacilities PlanHealth and Safety PlanFleet Management Plan
Westin’s model for continuous utility improvement requires a combination of specific “Building Blocks” for sustainable success. This Management and Organization Assessment is just the beginning. As noted above, the District requires the development of a Strategic Plan in order to provide a roadmap for all key stakeholder classes. Other missing elements include the development and implementation of an enterprise-wide Asset Management Plan, an IT Master Plan and a Asset Repair and Rehabilitation (R&R) Plan. A District-wide Performance Management Program is also needed to monitor organizational performance against the District’s stated mission, vision, defined strategies for improvement and desired target levels of service.
Plan
Asset Management Plan

79
Summary of Recommendations
Summary of RecommendationsLevel of
ImportanceLevel of Urgency
1. Develop a Strategic Plan and associated performance management culture that defines a common vision, District values, strategies, goals, objectives and target levels of service to fulfill the District’s stated mission and to provide a roadmap for continuous organizational improvement.
H H
2. Realign the organizational structure for improved business efficiency. Flatten the management structure and level the span of control for improved accountability and decision making. Realign the engineers, maintenance personnel, inspectors, drafting, GIS, Hansen, and IT into more cohesive functional areas. Cross-train employees to promote organizational growth and to reduce impact of vacancies, overtime and stand-by.
H H
3. Create an atmosphere of trust and increased employee-management relations by employing consistent application of Administrative Regulations (AR) and stated District policies including: classification and compensation, promotions, use of administrative leave, out-of-class pay, and normal work schedules. Train the managers, supervisors and employees on the AR and distribute (or
make available) the Employee Handbook to all employees. Enhance the District’s Performance Appraisal program.
H H
4. Develop a formal asset management program with defined goals,
business processes, performance measures and accountabilities. Implement a formal, programmatic preventive maintenance program for all asset classes.
H M
5. Optimize use of the District’s information technologies for improved business efficiency and reduced transactional costs including Supervisory Control and Data Acquisition (SCADA)
System, Hansen Computerized Maintenance Management System (CMMS), ESRI Geographic Information System (GIS), and Great Plains Financial Information System (FIS). Implement a Laboratory Information System (LIMs), Document Management System (DMS) and Capital Improvement Program (CIP) Management System. Increase the use of mobile solutions.
H M
6. Develop and implement a comprehensive plan for knowledge management, document management and succession planning.
M H

80
Summary of Recommendations
Recommendation 1. Develop a Strategic Plan and associated performance management culture that defines a common vision, values, strategies, goals, objectives and target levels of service to fulfill the District’s stated mission and to provide a roadmap for continuous organizational improvement.
A.
Develop a Three-Year Strategic Plan that crosses all departments. Define a Steering Committee to oversee the Plan’s development and include working sessions with managers and select staff to gain a broad perspective and to promote inclusion and buy-in. Model the Strategic Plan around the Balanced Scorecard or other similar approach. Define appropriate strategies, goals and detailed objectives.
B.
Develop a list of District values by employing a cross-functional team of managers and staff.
C.
Define the accountability for each requisite action. Develop the cost and resource requirement for each objective. Prioritize each goal and objective based on its urgency and importance.
D.
Develop an appropriate performance management program that includes a hierarchy of meaningful performance measures and target levels of performance. Define the accountability for each measure, its frequency of measure, source of data, and historic performance if available.
E.
Develop an effective and efficient performance reporting process
that tracks actual performance to desired target levels.

81
Summary of Recommendations
Recommendation 2. Realign the organizational structure for improved business efficiency. Flatten the management structure and level the span of control for improved accountability and decision making. Realign the engineers, maintenance personnel, inspectors, drafting, GIS, Hansen, and IT into more cohesive functional areas. Cross-train employees to promote organizational growth and to reduce impact of vacancies, overtime and stand-by.
A.
Develop a new District-wide organizational structure that is more aligned with utilities of similar size and complexity.
B.
Considering reducing the number of direct reports to the General
Manager.C.
Consider moving the Hansen Division and Fleet Maintenance Division into the Facilities Management Department under a new maintenance division.
D.
Consider moving the Laboratory Section from Environmental Compliance & Water Policy into the Facilities Management Department.
E.
Consider moving Inspection Services Section and GIS/Drafting Section to a new engineering division within Facilities Management Department.
F.
Consider moving the Meter Services Section and Customer Services
into the Finance Department.
G.
Consider the creation of a central administration department including safety and security, HR, PIO, Information Services and other related services.
H.
Align common engineering functions within the Facilities Management Department. Develop a new, centralized maintenance division including the alignment of common maintenance and construction functions. Align common I&C functions.
I.
Populate the organizational structure and communicate new roles and responsibilities. Train managers, supervisors and employees as appropriate.

82
Summary of Recommendations
Recommendation 3. Create an atmosphere of trust and increased employee-management relations by employing consistent application of Administrative Regulations (AR) and stated District policies including: classification and compensation, promotions, use of administrative leave, out-of-class pay, and normal work schedules. Train the managers, supervisors and employees on the AR and distribute (or make available) the Employee Handbook to all employees. Enhance the District’s Performance Appraisal program.
A.
Train all managers and supervisors on the ARs.B.
Publish and train all employees on the Employee Handbook.C.
Revise the classification and compensation study based on the new organizational structure and implement recommendations consistently across all departments.
D.
Consider modifying alternate work schedules like 4-10’s, and 24-hour shifts.E.
Enhance the District’s Performance Appraisal program. Perform all appraisals at a set time of year. Evaluate the use of on-line performance appraisal systems. Implement the ability to customize the form to better align with the specific job duties. Reduce the 25-point scoring system to a maximum of five performance levels. Reduce the requisite number of signatures needed to complete the form. Train managers, supervisors and employees as appropriate.

83
Summary of Recommendations
Recommendation 4. Develop a formal asset management program with defined goals, business processes, performance measures and accountabilities. Implement
a formal, programmatic preventive maintenance program for all asset classes.
A.
Develop an enterprise-wide Life Cycle Asset Management Program.B.
Develop a complete asset registry of all District assets. C.
Identify the criticality of all assets.D.
Develop a formal condition assessment program aligned with industry best practices.E.
Develop and implement best practice preventive and predictive maintenance programs. Document standard maintenance procedures.
F.
Establish the replacement value of District assets.G.
Establish the remaining useful life of District assets based on age and existing condition.
H.
Develop a model for determining the renewal and rehabilitation costs of assets at the end of their useful life. Include the forecast into long-term financial reserve and rate models.
I.
Develop appropriate asset performance measures.J.
Train appropriate employees on industry best practices.

84
Summary of Recommendations
Recommendation 5. Optimize use of the District’s information technologies for improved business efficiency and reduced transactional costs including Supervisory Control and Data Acquisition (SCADA) System, Hansen Computerized Maintenance Management System (CMMS), ESRI Geographic Information System (GIS), and Great Plains Financial Information System (FIS). Implement a Laboratory Information System (LIMs), Document Management System (DMS) and Capital Improvement Program (CIP) Management System. Increase the use of mobile solutions.
A.
Review and prioritize the recommendations contained within the new Information System Master Plan document (under development).
B.
Train appropriate employees on industry best practices.

85
Summary of Recommendations
Recommendation 6. Develop and implement a comprehensive plan for knowledge management, document management and succession planning.
A.
Analyze existing knowledge management processes within the District and identify required improvements.
B.
Define accountabilities for knowledge management, document management and succession planning programs.
C.
Develop a system-orientated Knowledge Management Program based on best industry practices.
D.
Prioritize and secure existing District knowledge based on its criticality and risk.E.
Utilize information technology to optimize the location and access to existing knowledge.
F.
Implement an Electronic Document Management System with integrated documents, records, and forms management and for accessing operator manuals, manufacturers’ cut sheets, plant drawings, and regulatory reports.
G.
Develop a District-wide succession plan aligned with industry best practices. Identify employees to move into key positions and begin to transfer knowledge from employees planning to retire.
H.
Ensure the effective and efficient development of new knowledge.I.
Train appropriate employees on industry best practices.