Embed Size (px)
Citation preview
COMPREHENSIVE HOUSING MARKET ANALYSIS
U.S. Department of Housing and Urban Development, Office of Policy Development and Research
As of July 1, 2020
Share on:
The analysis presented in this report includes data from the early stages of the COVID-19 outbreak in the United States. The unprecedentedly large and rapid changes in many data series, and the similarly unprecedentedly large policy responses, make analysis of, and longer run predictions for, the economy and housing markets exceptionally difficult and uncertain. HUD will continue to monitor market conditions in the HMA and provide an updated report/addendum in the future.
Salt Lake City, Utah
Executive Summary 2Salt Lake City, Utah Comprehensive Housing Market Analysis as of July 1, 2020
Comprehensive Housing Market Analysis Salt Lake City, UtahU.S. Department of Housing and Urban Development, Office of Policy Development and Research
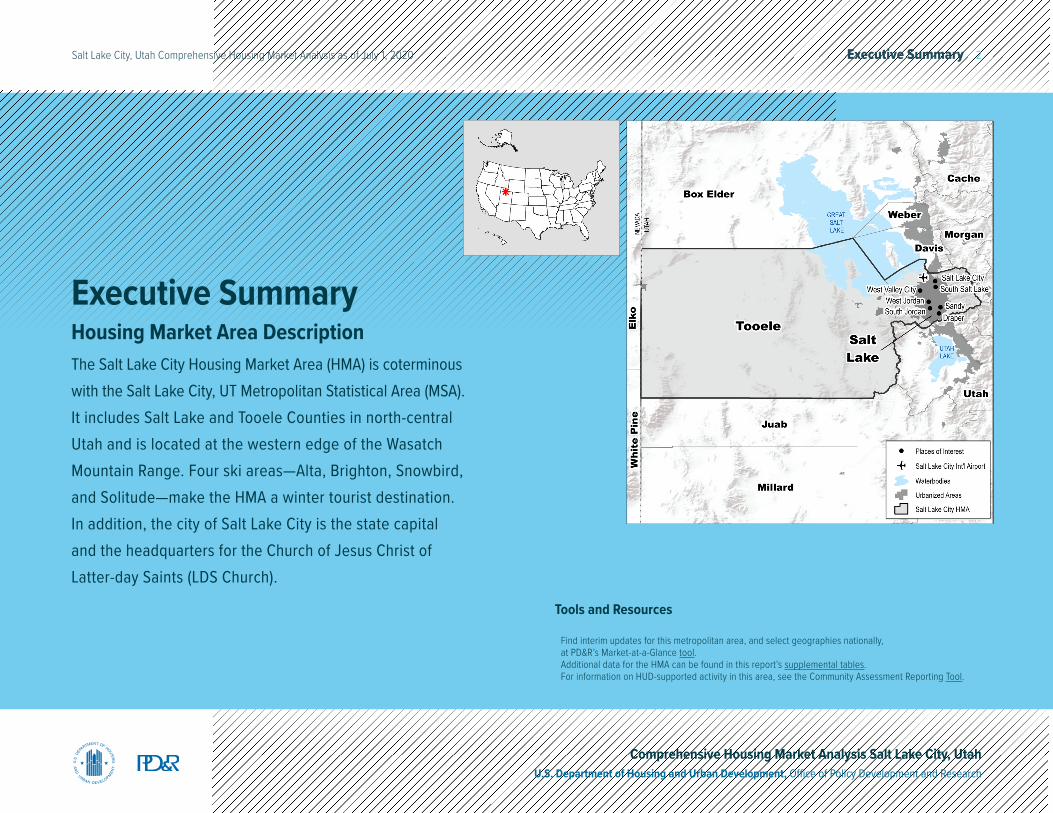
Executive SummaryHousing Market Area DescriptionThe Salt Lake City Housing Market Area (HMA) is coterminous with the Salt Lake City, UT Metropolitan Statistical Area (MSA). It includes Salt Lake and Tooele Counties in north-central Utah and is located at the western edge of the Wasatch Mountain Range. Four ski areas—Alta, Brighton, Snowbird, and Solitude—make the HMA a winter tourist destination. In addition, the city of Salt Lake City is the state capital and the headquarters for the Church of Jesus Christ of Latter-day Saints (LDS Church).
Tools and Resources
Find interim updates for this metropolitan area, and select geographies nationally, at PD&R’s Market-at-a-Glance tool.Additional data for the HMA can be found in this report’s supplemental tables.For information on HUD-supported activity in this area, see the Community Assessment Reporting Tool.
Executive Summary 3Salt Lake City, Utah Comprehensive Housing Market Analysis as of July 1, 2020
Comprehensive Housing Market Analysis Salt Lake City, UtahU.S. Department of Housing and Urban Development, Office of Policy Development and Research
Market Qualifiers
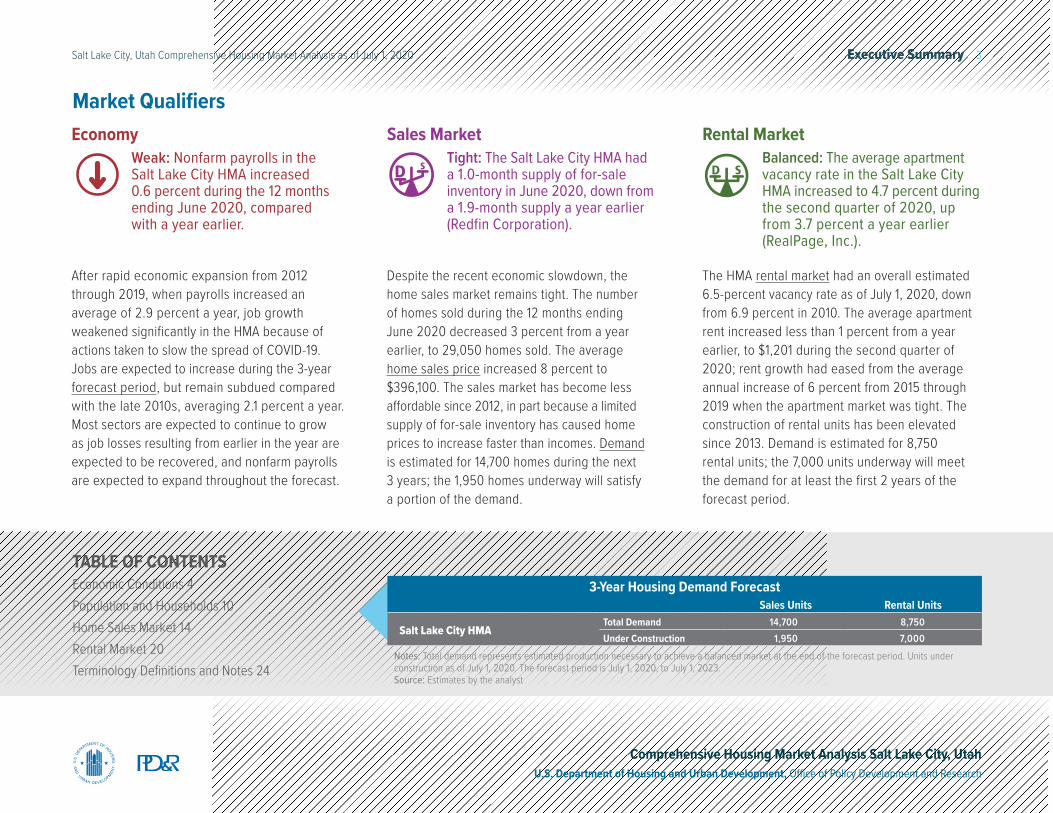
After rapid economic expansion from 2012 through 2019, when payrolls increased an average of 2.9 percent a year, job growth weakened significantly in the HMA because of actions taken to slow the spread of COVID-19. Jobs are expected to increase during the 3-year forecast period, but remain subdued compared with the late 2010s, averaging 2.1 percent a year. Most sectors are expected to continue to grow as job losses resulting from earlier in the year are expected to be recovered, and nonfarm payrolls are expected to expand throughout the forecast.
Despite the recent economic slowdown, the home sales market remains tight. The number of homes sold during the 12 months ending June 2020 decreased 3 percent from a year earlier, to 29,050 homes sold. The average home sales price increased 8 percent to $396,100. The sales market has become less affordable since 2012, in part because a limited supply of for-sale inventory has caused home prices to increase faster than incomes. Demand is estimated for 14,700 homes during the next 3 years; the 1,950 homes underway will satisfy a portion of the demand.
The HMA rental market had an overall estimated 6.5-percent vacancy rate as of July 1, 2020, down from 6.9 percent in 2010. The average apartment rent increased less than 1 percent from a year earlier, to $1,201 during the second quarter of 2020; rent growth had eased from the average annual increase of 6 percent from 2015 through 2019 when the apartment market was tight. The construction of rental units has been elevated since 2013. Demand is estimated for 8,750 rental units; the 7,000 units underway will meet the demand for at least the first 2 years of the forecast period.
EconomyWeak: Nonfarm payrolls in the Salt Lake City HMA increased 0.6 percent during the 12 months ending June 2020, compared with a year earlier.
Rental MarketBalanced: The average apartment vacancy rate in the Salt Lake City HMA increased to 4.7 percent during the second quarter of 2020, up from 3.7 percent a year earlier (RealPage, Inc.).
Sales MarketTight: The Salt Lake City HMA had a 1.0-month supply of for-sale inventory in June 2020, down from a 1.9-month supply a year earlier (Redfin Corporation).
TABLE OF CONTENTSEconomic Conditions 4Population and Households 10Home Sales Market 14Rental Market 20Terminology Definitions and Notes 24
Notes: Total demand represents estimated production necessary to achieve a balanced market at the end of the forecast period. Units under construction as of July 1, 2020. The forecast period is July 1, 2020, to July 1, 2023.Source: Estimates by the analyst
3-Year Housing Demand Forecast Sales Units Rental Units
Salt Lake City HMATotal Demand 14,700 8,750Under Construction 1,950 7,000
Economic Conditions 4Salt Lake City, Utah Comprehensive Housing Market Analysis as of July 1, 2020
Comprehensive Housing Market Analysis Salt Lake City, UtahU.S. Department of Housing and Urban Development, Office of Policy Development and Research
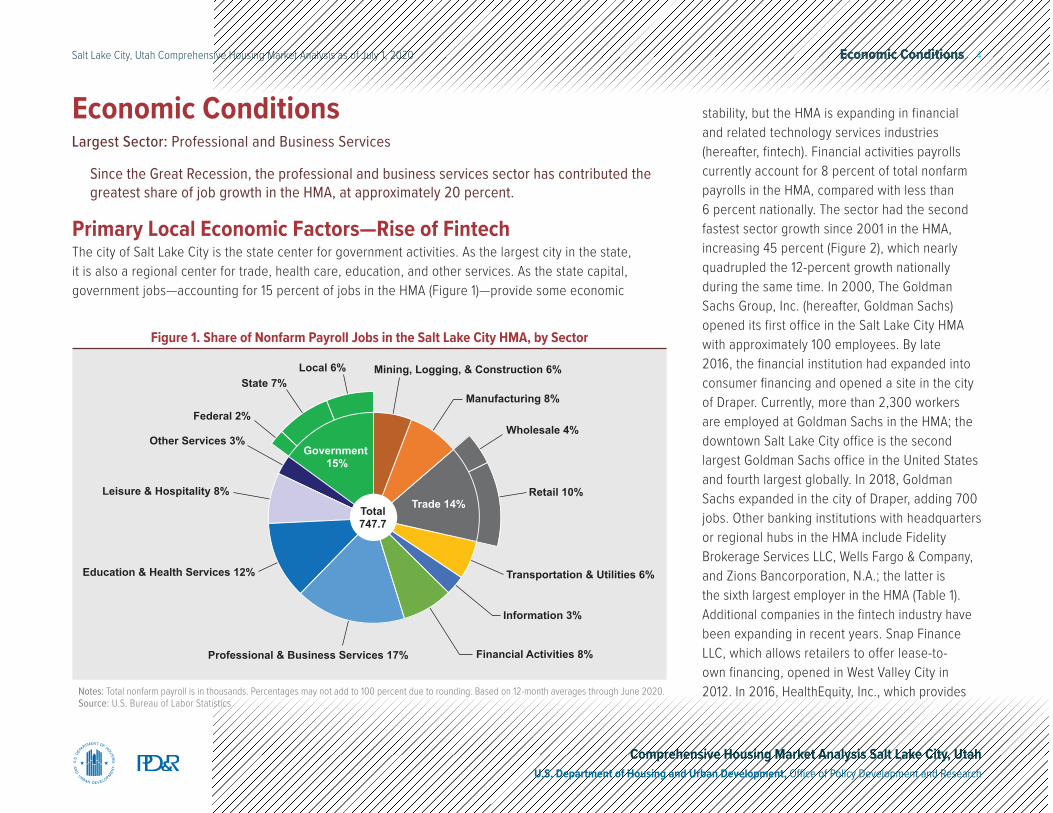
Primary Local Economic Factors—Rise of FintechThe city of Salt Lake City is the state center for government activities. As the largest city in the state, it is also a regional center for trade, health care, education, and other services. As the state capital, government jobs—accounting for 15 percent of jobs in the HMA (Figure 1)—provide some economic
Economic ConditionsLargest Sector: Professional and Business Services
Since the Great Recession, the professional and business services sector has contributed the greatest share of job growth in the HMA, at approximately 20 percent.
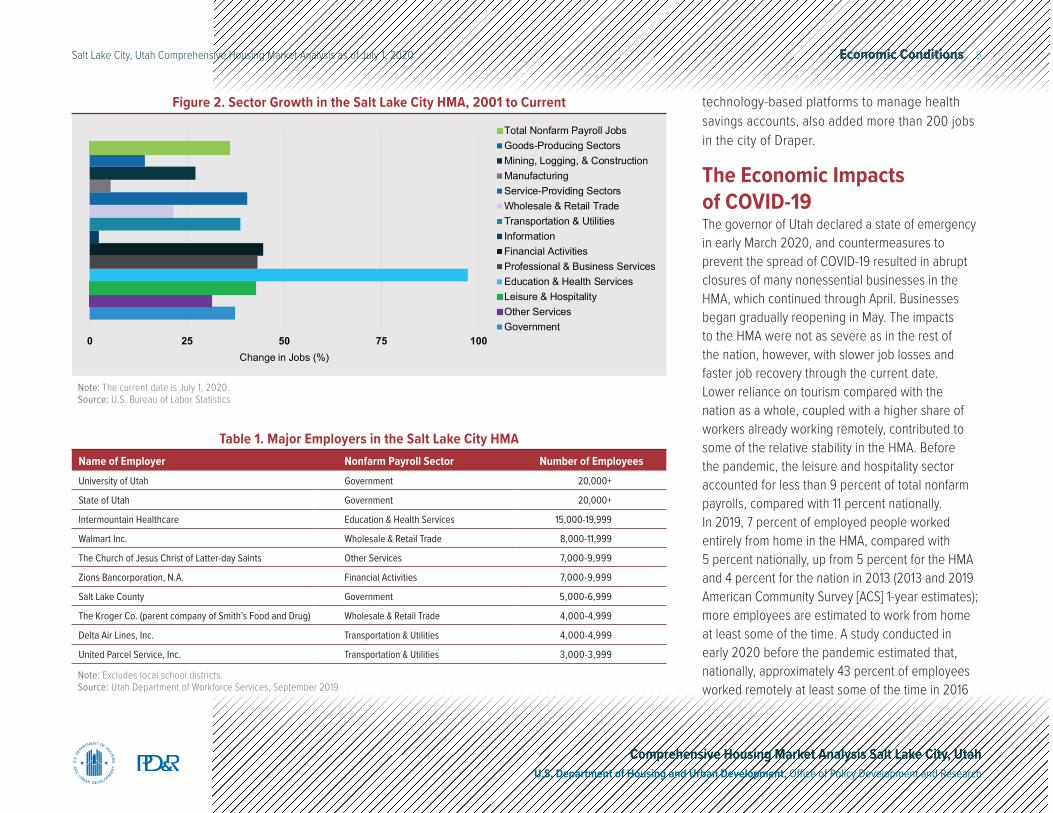
stability, but the HMA is expanding in financial and related technology services industries (hereafter, fintech). Financial activities payrolls currently account for 8 percent of total nonfarm payrolls in the HMA, compared with less than 6 percent nationally. The sector had the second fastest sector growth since 2001 in the HMA, increasing 45 percent (Figure 2), which nearly quadrupled the 12-percent growth nationally during the same time. In 2000, The Goldman Sachs Group, Inc. (hereafter, Goldman Sachs) opened its first office in the Salt Lake City HMA with approximately 100 employees. By late 2016, the financial institution had expanded into consumer financing and opened a site in the city of Draper. Currently, more than 2,300 workers are employed at Goldman Sachs in the HMA; the downtown Salt Lake City office is the second largest Goldman Sachs office in the United States and fourth largest globally. In 2018, Goldman Sachs expanded in the city of Draper, adding 700 jobs. Other banking institutions with headquarters or regional hubs in the HMA include Fidelity Brokerage Services LLC, Wells Fargo & Company, and Zions Bancorporation, N.A.; the latter is the sixth largest employer in the HMA (Table 1). Additional companies in the fintech industry have been expanding in recent years. Snap Finance LLC, which allows retailers to offer lease-to-own financing, opened in West Valley City in 2012. In 2016, HealthEquity, Inc., which provides
Mining, Logging, & Construction 6%
Manufacturing 8%
Wholesale 4%
Retail 10%
Transportation & Utilities 6%
Information 3%
Financial Activities 8%Professional & Business Services 17%
Education & Health Services 12%
Leisure & Hospitality 8%
Other Services 3%
Federal 2%
State 7%Local 6%
Government 15%
Trade 14%Total747.7
Notes: Total nonfarm payroll is in thousands. Percentages may not add to 100 percent due to rounding. Based on 12-month averages through June 2020.Source: U.S. Bureau of Labor Statistics
Figure 1. Share of Nonfarm Payroll Jobs in the Salt Lake City HMA, by Sector
Economic Conditions 5Salt Lake City, Utah Comprehensive Housing Market Analysis as of July 1, 2020
Comprehensive Housing Market Analysis Salt Lake City, UtahU.S. Department of Housing and Urban Development, Office of Policy Development and Research
Note: The current date is July 1, 2020.Source: U.S. Bureau of Labor Statistics
Figure 2. Sector Growth in the Salt Lake City HMA, 2001 to Current
Name of Employer Nonfarm Payroll Sector Number of EmployeesUniversity of Utah Government 20,000+
State of Utah Government 20,000+
Intermountain Healthcare Education & Health Services 15,000-19,999
Walmart Inc. Wholesale & Retail Trade 8,000-11,999
The Church of Jesus Christ of Latter-day Saints Other Services 7,000-9,999
Zions Bancorporation, N.A. Financial Activities 7,000-9,999
Salt Lake County Government 5,000-6,999
The Kroger Co. (parent company of Smith’s Food and Drug) Wholesale & Retail Trade 4,000-4,999
Delta Air Lines, Inc. Transportation & Utilities 4,000-4,999
United Parcel Service, Inc. Transportation & Utilities 3,000-3,999
Table 1. Major Employers in the Salt Lake City HMA
Note: Excludes local school districts.Source: Utah Department of Workforce Services, September 2019
technology-based platforms to manage health savings accounts, also added more than 200 jobs in the city of Draper.
The Economic Impacts of COVID-19The governor of Utah declared a state of emergency in early March 2020, and countermeasures to prevent the spread of COVID-19 resulted in abrupt closures of many nonessential businesses in the HMA, which continued through April. Businesses began gradually reopening in May. The impacts to the HMA were not as severe as in the rest of the nation, however, with slower job losses and faster job recovery through the current date. Lower reliance on tourism compared with the nation as a whole, coupled with a higher share of workers already working remotely, contributed to some of the relative stability in the HMA. Before the pandemic, the leisure and hospitality sector accounted for less than 9 percent of total nonfarm payrolls, compared with 11 percent nationally. In 2019, 7 percent of employed people worked entirely from home in the HMA, compared with 5 percent nationally, up from 5 percent for the HMA and 4 percent for the nation in 2013 (2013 and 2019 American Community Survey [ACS] 1-year estimates); more employees are estimated to work from home at least some of the time. A study conducted in early 2020 before the pandemic estimated that, nationally, approximately 43 percent of employees worked remotely at least some of the time in 2016
0 25 50 75 100Change in Jobs (%)
Total Nonfarm Payroll JobsGoods-Producing SectorsMining, Logging, & ConstructionManufacturingService-Providing SectorsWholesale & Retail TradeTransportation & UtilitiesInformationFinancial ActivitiesProfessional & Business ServicesEducation & Health ServicesLeisure & HospitalityOther ServicesGovernment
Economic Conditions 6Salt Lake City, Utah Comprehensive Housing Market Analysis as of July 1, 2020
Comprehensive Housing Market Analysis Salt Lake City, UtahU.S. Department of Housing and Urban Development, Office of Policy Development and Research
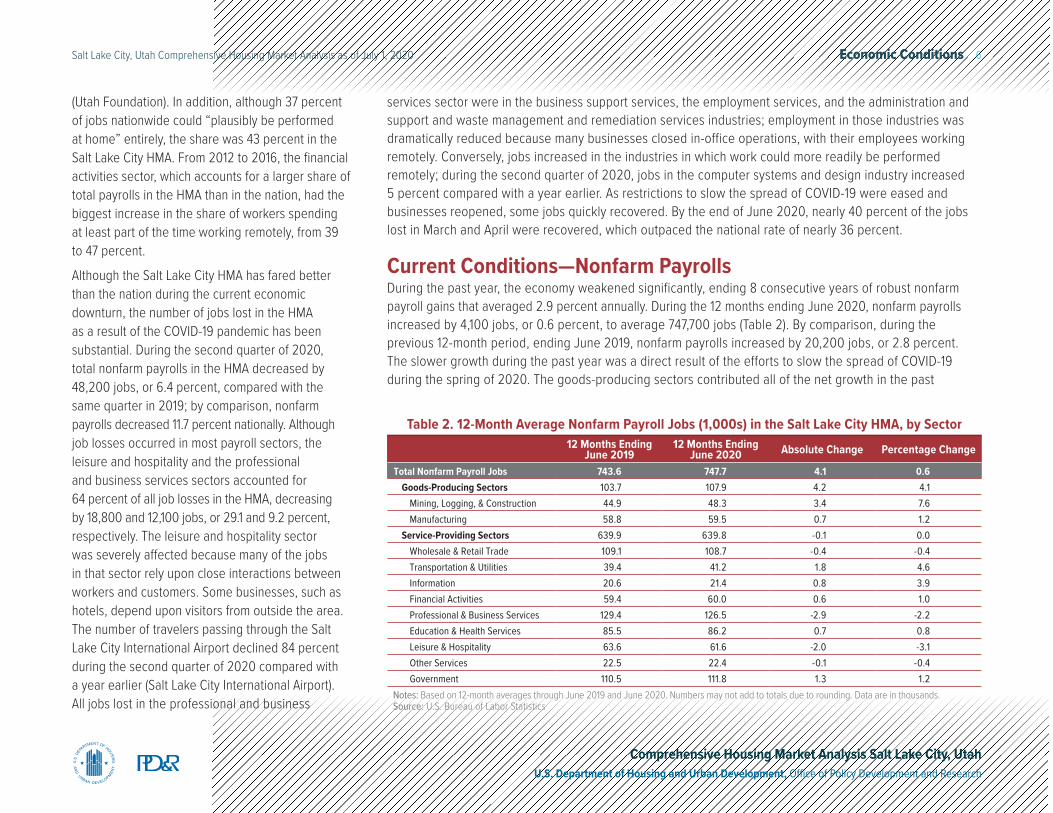
Table 2. 12-Month Average Nonfarm Payroll Jobs (1,000s) in the Salt Lake City HMA, by Sector12 Months Ending
June 201912 Months Ending
June 2020 Absolute Change Percentage Change
Total Nonfarm Payroll Jobs 743.6 747.7 4.1 0.6Goods-Producing Sectors 103.7 107.9 4.2 4.1
Mining, Logging, & Construction 44.9 48.3 3.4 7.6Manufacturing 58.8 59.5 0.7 1.2
Service-Providing Sectors 639.9 639.8 -0.1 0.0Wholesale & Retail Trade 109.1 108.7 -0.4 -0.4Transportation & Utilities 39.4 41.2 1.8 4.6Information 20.6 21.4 0.8 3.9Financial Activities 59.4 60.0 0.6 1.0Professional & Business Services 129.4 126.5 -2.9 -2.2Education & Health Services 85.5 86.2 0.7 0.8Leisure & Hospitality 63.6 61.6 -2.0 -3.1Other Services 22.5 22.4 -0.1 -0.4Government 110.5 111.8 1.3 1.2
Notes: Based on 12-month averages through June 2019 and June 2020. Numbers may not add to totals due to rounding. Data are in thousands.Source: U.S. Bureau of Labor Statistics
(Utah Foundation). In addition, although 37 percent of jobs nationwide could “plausibly be performed at home” entirely, the share was 43 percent in the Salt Lake City HMA. From 2012 to 2016, the financial activities sector, which accounts for a larger share of total payrolls in the HMA than in the nation, had the biggest increase in the share of workers spending at least part of the time working remotely, from 39 to 47 percent.
Although the Salt Lake City HMA has fared better than the nation during the current economic downturn, the number of jobs lost in the HMA as a result of the COVID-19 pandemic has been substantial. During the second quarter of 2020, total nonfarm payrolls in the HMA decreased by 48,200 jobs, or 6.4 percent, compared with the same quarter in 2019; by comparison, nonfarm payrolls decreased 11.7 percent nationally. Although job losses occurred in most payroll sectors, the leisure and hospitality and the professional and business services sectors accounted for 64 percent of all job losses in the HMA, decreasing by 18,800 and 12,100 jobs, or 29.1 and 9.2 percent, respectively. The leisure and hospitality sector was severely affected because many of the jobs in that sector rely upon close interactions between workers and customers. Some businesses, such as hotels, depend upon visitors from outside the area. The number of travelers passing through the Salt Lake City International Airport declined 84 percent during the second quarter of 2020 compared with a year earlier (Salt Lake City International Airport). All jobs lost in the professional and business
services sector were in the business support services, the employment services, and the administration and support and waste management and remediation services industries; employment in those industries was dramatically reduced because many businesses closed in-office operations, with their employees working remotely. Conversely, jobs increased in the industries in which work could more readily be performed remotely; during the second quarter of 2020, jobs in the computer systems and design industry increased 5 percent compared with a year earlier. As restrictions to slow the spread of COVID-19 were eased and businesses reopened, some jobs quickly recovered. By the end of June 2020, nearly 40 percent of the jobs lost in March and April were recovered, which outpaced the national rate of nearly 36 percent.
Current Conditions—Nonfarm PayrollsDuring the past year, the economy weakened significantly, ending 8 consecutive years of robust nonfarm payroll gains that averaged 2.9 percent annually. During the 12 months ending June 2020, nonfarm payrolls increased by 4,100 jobs, or 0.6 percent, to average 747,700 jobs (Table 2). By comparison, during the previous 12-month period, ending June 2019, nonfarm payrolls increased by 20,200 jobs, or 2.8 percent. The slower growth during the past year was a direct result of the efforts to slow the spread of COVID-19 during the spring of 2020. The goods-producing sectors contributed all of the net growth in the past
Economic Conditions 7Salt Lake City, Utah Comprehensive Housing Market Analysis as of July 1, 2020
Comprehensive Housing Market Analysis Salt Lake City, UtahU.S. Department of Housing and Urban Development, Office of Policy Development and Research
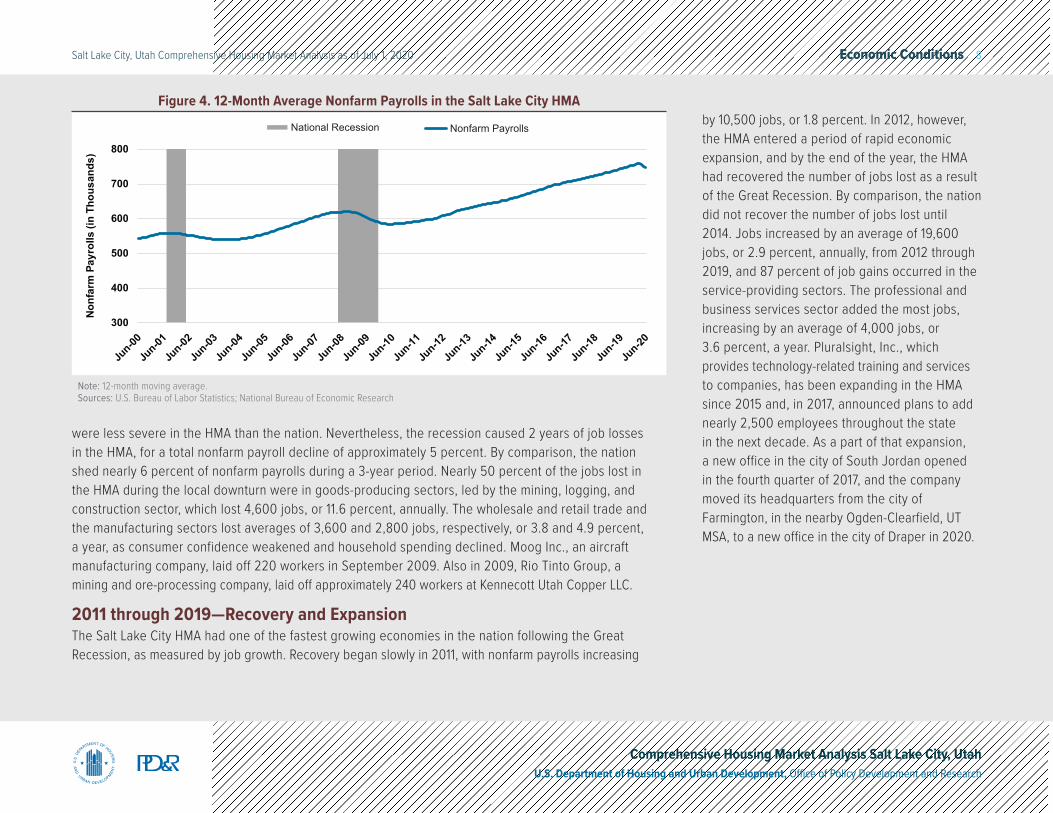
2001 through 2008— Recession and RecoveryAfter peaking at 557,200 jobs in 2001, nonfarm payrolls decreased by an average of 8,900 jobs, or 1.6 percent a year, to a low of 539,400 jobs in 2003 (Figure 4) as a result of the local economic downturn caused by the bursting of the dot-com bubble. Five years of job growth followed, and jobs increased by an average of 15,700, or 2.8 percent, annually from 2004 through 2008, to 618,100 jobs. Service-providing sectors accounted for 80 percent of job gains during the period. The professional and business services sector added the most jobs in numerical terms during the period, up by 3,600 jobs, or 4.0 percent, annually. The fastest job growth in percentage terms was in the mining, logging, and construction sector, which increased an average of 2,000 jobs, or 5.4 percent, annually. Greater population growth in 2004 caused an increased demand for housing and construction jobs in the HMA.
2009 through 2010— The Local Economic DownturnAlthough the Great Recession lasted from December 2007 to June 2009, job losses did not hit the Salt Lake City HMA until 2009, and they
Historical Trends: Nonfarm Payrolls
year, with the mining, logging, and construction and the manufacturing sectors increasing by 3,400 and 700 jobs, respectively, or 7.6 and 1.2 percent, compared with the same period a year earlier. A spike in apartment construction in 2019 and ongoing commercial projects, such as the renovations at the Salt Lake City International Airport, supported the increased number of construction jobs in the HMA. In 2018, Merit Medical Systems, Inc., which produces disposable medical devices, began an expansion at its manufacturing site in the city of South Jordan that will add more than 1,000 jobs over the next 15 years. The government and the education and health services sectors are the only payroll sectors that have expanded every year since 2000, but modest annual gains of 1,300 jobs and 700 jobs, or 1.2 and 0.8 percent, respectively, in the past 12 months were more than offset by losses in other service-providing sectors.
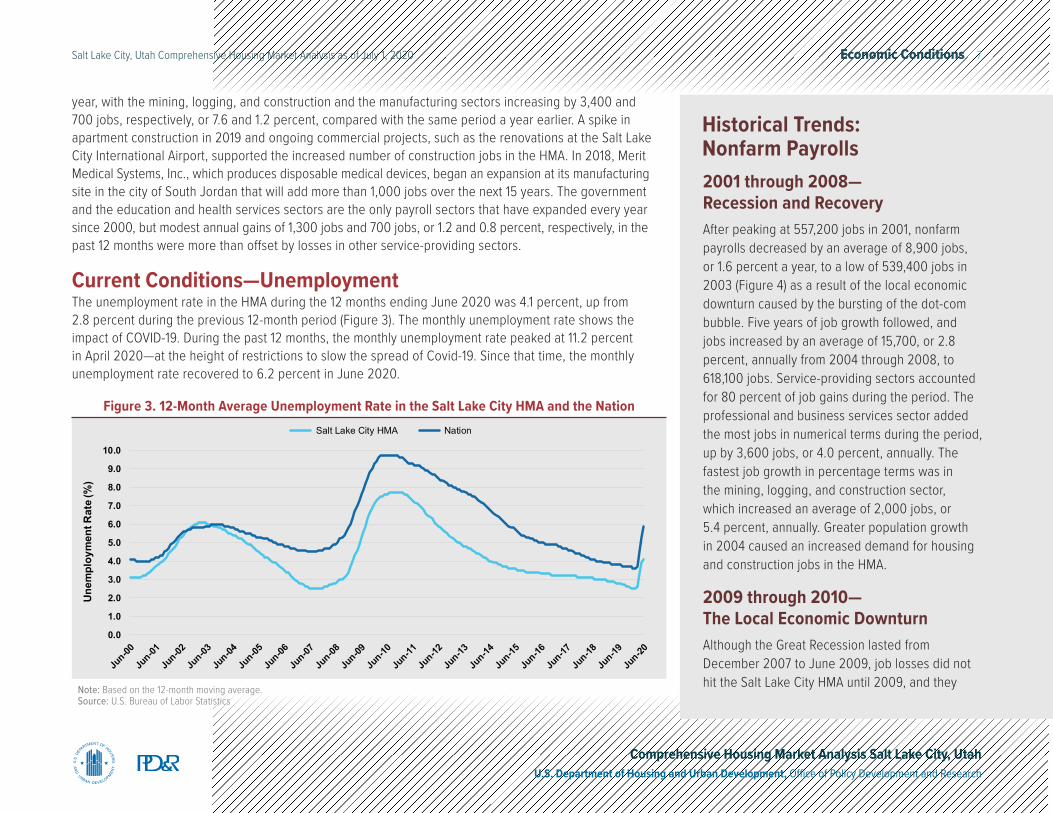
Current Conditions—UnemploymentThe unemployment rate in the HMA during the 12 months ending June 2020 was 4.1 percent, up from 2.8 percent during the previous 12-month period (Figure 3). The monthly unemployment rate shows the impact of COVID-19. During the past 12 months, the monthly unemployment rate peaked at 11.2 percent in April 2020—at the height of restrictions to slow the spread of Covid-19. Since that time, the monthly unemployment rate recovered to 6.2 percent in June 2020.
0.0
1.0
2.0
3.0
4.0
5.0
6.0
7.0
8.0
9.0
10.0
Jun-00
Jun-01
Jun-02
Jun-03
Jun-04
Jun-05
Jun-06
Jun-07
Jun-08
Jun-09
Jun-10
Jun-11
Jun-12
Jun-13
Jun-14
Jun-15
Jun-16
Jun-17
Jun-18
Jun-19
Jun-20
Unem
ploy
men
t Rat
e (%
)
Salt Lake City HMA Nation
Note: Based on the 12-month moving average.Source: U.S. Bureau of Labor Statistics
Figure 3. 12-Month Average Unemployment Rate in the Salt Lake City HMA and the Nation
Economic Conditions 8Salt Lake City, Utah Comprehensive Housing Market Analysis as of July 1, 2020
Comprehensive Housing Market Analysis Salt Lake City, UtahU.S. Department of Housing and Urban Development, Office of Policy Development and Research
were less severe in the HMA than the nation. Nevertheless, the recession caused 2 years of job losses in the HMA, for a total nonfarm payroll decline of approximately 5 percent. By comparison, the nation shed nearly 6 percent of nonfarm payrolls during a 3-year period. Nearly 50 percent of the jobs lost in the HMA during the local downturn were in goods-producing sectors, led by the mining, logging, and construction sector, which lost 4,600 jobs, or 11.6 percent, annually. The wholesale and retail trade and the manufacturing sectors lost averages of 3,600 and 2,800 jobs, respectively, or 3.8 and 4.9 percent, a year, as consumer confidence weakened and household spending declined. Moog Inc., an aircraft manufacturing company, laid off 220 workers in September 2009. Also in 2009, Rio Tinto Group, a mining and ore-processing company, laid off approximately 240 workers at Kennecott Utah Copper LLC.
2011 through 2019—Recovery and ExpansionThe Salt Lake City HMA had one of the fastest growing economies in the nation following the Great Recession, as measured by job growth. Recovery began slowly in 2011, with nonfarm payrolls increasing
National Recession Nonfarm Payrolls
300
400
500
600
700
800
Jun-00
Jun-01
Jun-02
Jun-03
Jun-04
Jun-05
Jun-06
Jun-07
Jun-08
Jun-09
Jun-10
Jun-11
Jun-12
Jun-13
Jun-14
Jun-15
Jun-16
Jun-17
Jun-18
Jun-19
Jun-20
Nonf
arm
Pay
rolls
(in
Thou
sand
s)
Note: 12-month moving average.Sources: U.S. Bureau of Labor Statistics; National Bureau of Economic Research
Figure 4. 12-Month Average Nonfarm Payrolls in the Salt Lake City HMAby 10,500 jobs, or 1.8 percent. In 2012, however, the HMA entered a period of rapid economic expansion, and by the end of the year, the HMA had recovered the number of jobs lost as a result of the Great Recession. By comparison, the nation did not recover the number of jobs lost until 2014. Jobs increased by an average of 19,600 jobs, or 2.9 percent, annually, from 2012 through 2019, and 87 percent of job gains occurred in the service-providing sectors. The professional and business services sector added the most jobs, increasing by an average of 4,000 jobs, or 3.6 percent, a year. Pluralsight, Inc., which provides technology-related training and services to companies, has been expanding in the HMA since 2015 and, in 2017, announced plans to add nearly 2,500 employees throughout the state in the next decade. As a part of that expansion, a new office in the city of South Jordan opened in the fourth quarter of 2017, and the company moved its headquarters from the city of Farmington, in the nearby Ogden-Clearfield, UT MSA, to a new office in the city of Draper in 2020.
Economic Conditions 9Salt Lake City, Utah Comprehensive Housing Market Analysis as of July 1, 2020
Comprehensive Housing Market Analysis Salt Lake City, UtahU.S. Department of Housing and Urban Development, Office of Policy Development and Research
Employment ForecastDuring the 3-year forecast period, nonfarm payrolls are expected to increase by an average of 2.1 percent a year. Most sectors are expected to contribute to that growth, primarily in the first year, as the economy continues to reopen and recover the job losses that occurred during the second quarter of 2020. Fintech is expected to continue as a leader in economic growth in the HMA. In 2016, Snap Finance LLC announced the addition of more than 140 jobs by 2021. HealthEquity, Inc. will add 500 jobs by the end of 2023. Brex Inc., a San Francisco-based fintech company, announced the opening of a new office in Salt Lake City in 2019 and will add more than 1,000 jobs by 2026. In addition to the HMA experiencing growth in fintech, Salt Lake City International Airport is undergoing a $4.1 billion renovation, the largest construction project in the history of the state, opening new terminals and expanding the number of restaurants and lounge areas. Despite a precipitous drop in travelers passing through the airport because of the COVID-19 pandemic,
plans to renovate the airport have not changed. Approximately 1,800 construction jobs are supported by the development, which will be completed in two phases. The first phase will include a new parking garage, terminal, and concourses that are expected to open in October 2020, followed by the completion of additional concourses in the second phase in 2025 (Salt Lake City International Airport). The combined phases are expected to result in a 50-percent increase in restaurants and an 80-percent increase in retail stores at the airport, which is expected to contribute to job growth in the leisure and hospitality sector and the retail trade subsector in the HMA. A prison in the city of Draper is being relocated near the airport; the $650 million prison—with a capacity of up to 4,000 prisoners—is expected to be complete in 2021, and prisoners are expected to be transferred in early 2022. The relocation will result in 700 acres of land available for redevelopment in the city of Draper, which is near concentrated centers of population and transit, including the interstate, light rail, and commuter rail.
Population and Households 10Salt Lake City, Utah Comprehensive Housing Market Analysis as of July 1, 2020
Comprehensive Housing Market Analysis Salt Lake City, UtahU.S. Department of Housing and Urban Development, Office of Policy Development and Research
Population and HouseholdsCurrent Population: 1.25 million
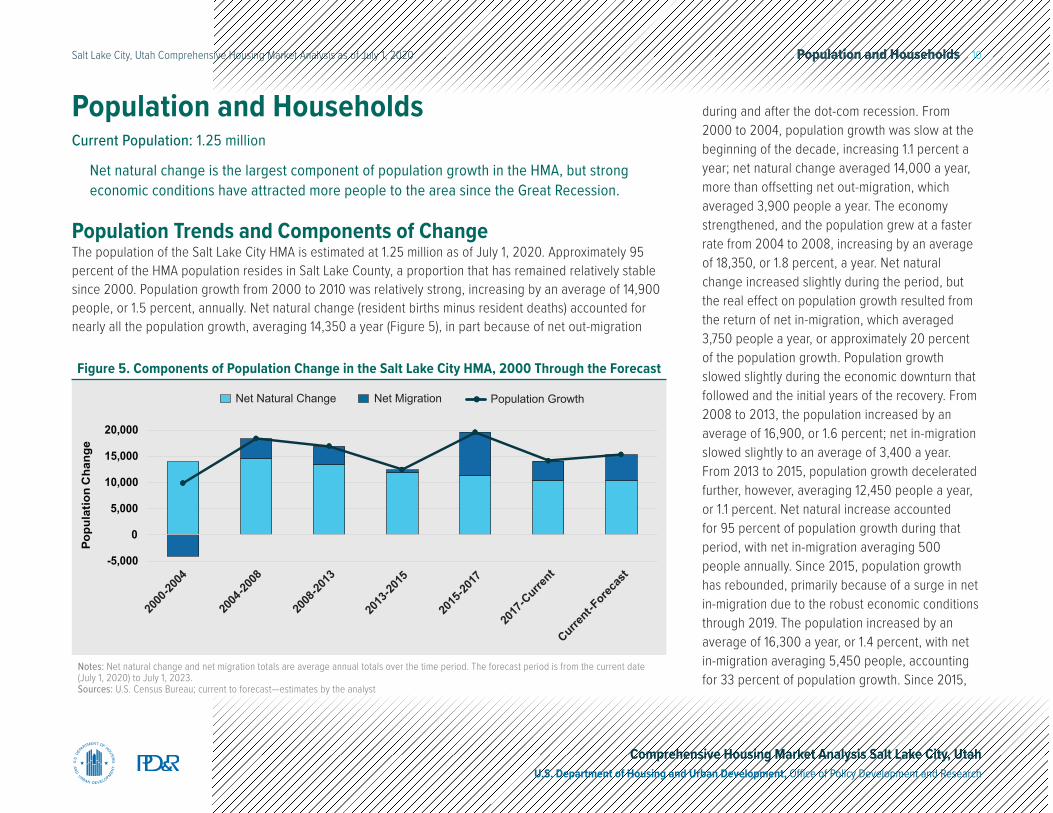
Net natural change is the largest component of population growth in the HMA, but strong economic conditions have attracted more people to the area since the Great Recession.
Population Trends and Components of ChangeThe population of the Salt Lake City HMA is estimated at 1.25 million as of July 1, 2020. Approximately 95 percent of the HMA population resides in Salt Lake County, a proportion that has remained relatively stable since 2000. Population growth from 2000 to 2010 was relatively strong, increasing by an average of 14,900 people, or 1.5 percent, annually. Net natural change (resident births minus resident deaths) accounted for nearly all the population growth, averaging 14,350 a year (Figure 5), in part because of net out-migration
Notes: Net natural change and net migration totals are average annual totals over the time period. The forecast period is from the current date (July 1, 2020) to July 1, 2023.Sources: U.S. Census Bureau; current to forecast—estimates by the analyst
Net MigrationNet Natural Change Population Growth
2000
-2004
2004
-2008
2008
-2013
2013
-2015
2015
-2017
2017
-Curre
nt
Current-F
orecas
t-5,000
0
5,000
10,000
15,000
20,000
Popu
latio
n C
hang
e
Figure 5. Components of Population Change in the Salt Lake City HMA, 2000 Through the Forecast
during and after the dot-com recession. From 2000 to 2004, population growth was slow at the beginning of the decade, increasing 1.1 percent a year; net natural change averaged 14,000 a year, more than offsetting net out-migration, which averaged 3,900 people a year. The economy strengthened, and the population grew at a faster rate from 2004 to 2008, increasing by an average of 18,350, or 1.8 percent, a year. Net natural change increased slightly during the period, but the real effect on population growth resulted from the return of net in-migration, which averaged 3,750 people a year, or approximately 20 percent of the population growth. Population growth slowed slightly during the economic downturn that followed and the initial years of the recovery. From 2008 to 2013, the population increased by an average of 16,900, or 1.6 percent; net in-migration slowed slightly to an average of 3,400 a year. From 2013 to 2015, population growth decelerated further, however, averaging 12,450 people a year, or 1.1 percent. Net natural increase accounted for 95 percent of population growth during that period, with net in-migration averaging 500 people annually. Since 2015, population growth has rebounded, primarily because of a surge in net in-migration due to the robust economic conditions through 2019. The population increased by an average of 16,300 a year, or 1.4 percent, with net in-migration averaging 5,450 people, accounting for 33 percent of population growth. Since 2015,
Population and Households 11Salt Lake City, Utah Comprehensive Housing Market Analysis as of July 1, 2020
Comprehensive Housing Market Analysis Salt Lake City, UtahU.S. Department of Housing and Urban Development, Office of Policy Development and Research
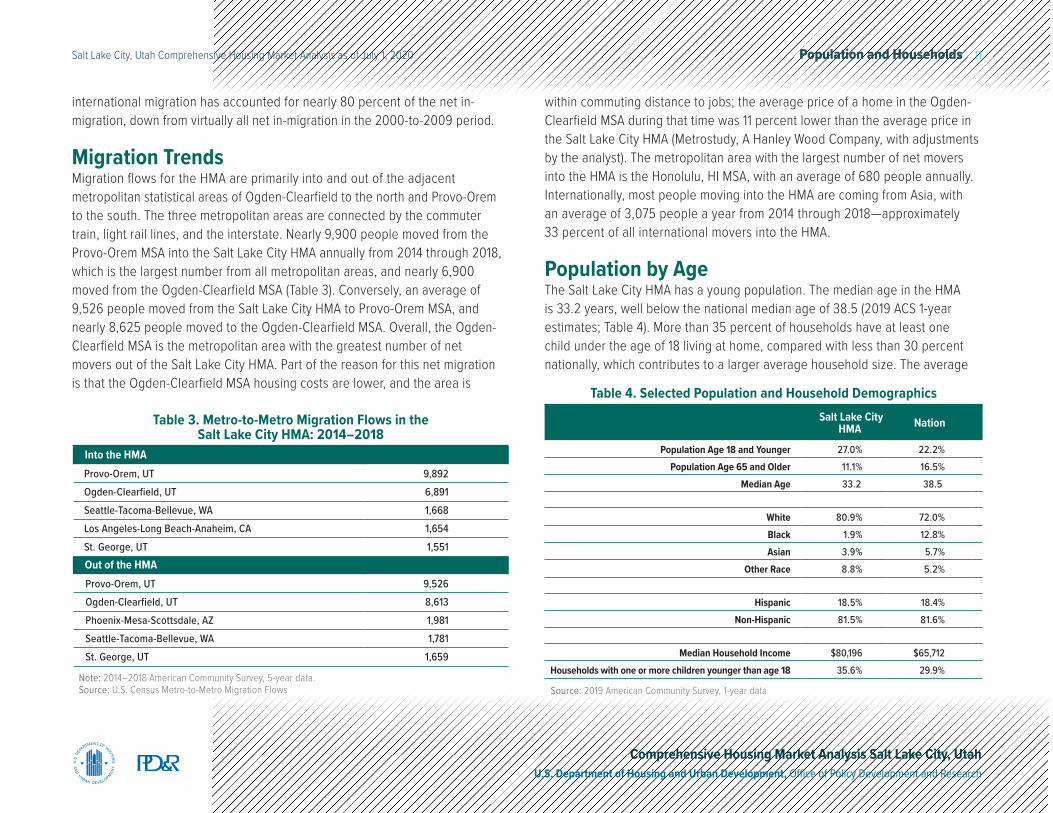
Into the HMAProvo-Orem, UT 9,892Ogden-Clearfield, UT 6,891Seattle-Tacoma-Bellevue, WA 1,668Los Angeles-Long Beach-Anaheim, CA 1,654St. George, UT 1,551Out of the HMAProvo-Orem, UT 9,526Ogden-Clearfield, UT 8,613Phoenix-Mesa-Scottsdale, AZ 1,981Seattle-Tacoma-Bellevue, WA 1,781St. George, UT 1,659
Table 3. Metro-to-Metro Migration Flows in the Salt Lake City HMA: 2014–2018
Note: 2014–2018 American Community Survey, 5-year data.Source: U.S. Census Metro-to-Metro Migration Flows
international migration has accounted for nearly 80 percent of the net in-migration, down from virtually all net in-migration in the 2000-to-2009 period.
Migration TrendsMigration flows for the HMA are primarily into and out of the adjacent metropolitan statistical areas of Ogden-Clearfield to the north and Provo-Orem to the south. The three metropolitan areas are connected by the commuter train, light rail lines, and the interstate. Nearly 9,900 people moved from the Provo-Orem MSA into the Salt Lake City HMA annually from 2014 through 2018, which is the largest number from all metropolitan areas, and nearly 6,900 moved from the Ogden-Clearfield MSA (Table 3). Conversely, an average of 9,526 people moved from the Salt Lake City HMA to Provo-Orem MSA, and nearly 8,625 people moved to the Ogden-Clearfield MSA. Overall, the Ogden-Clearfield MSA is the metropolitan area with the greatest number of net movers out of the Salt Lake City HMA. Part of the reason for this net migration is that the Ogden-Clearfield MSA housing costs are lower, and the area is
within commuting distance to jobs; the average price of a home in the Ogden-Clearfield MSA during that time was 11 percent lower than the average price in the Salt Lake City HMA (Metrostudy, A Hanley Wood Company, with adjustments by the analyst). The metropolitan area with the largest number of net movers into the HMA is the Honolulu, HI MSA, with an average of 680 people annually. Internationally, most people moving into the HMA are coming from Asia, with an average of 3,075 people a year from 2014 through 2018—approximately 33 percent of all international movers into the HMA.
Population by AgeThe Salt Lake City HMA has a young population. The median age in the HMA is 33.2 years, well below the national median age of 38.5 (2019 ACS 1-year estimates; Table 4). More than 35 percent of households have at least one child under the age of 18 living at home, compared with less than 30 percent nationally, which contributes to a larger average household size. The average
Salt Lake City HMA Nation
Population Age 18 and Younger 27.0% 22.2%Population Age 65 and Older 11.1% 16.5%
Median Age 33.2 38.5
White 80.9% 72.0%Black 1.9% 12.8%Asian 3.9% 5.7%
Other Race 8.8% 5.2%
Hispanic 18.5% 18.4%Non-Hispanic 81.5% 81.6%
Median Household Income $80,196 $65,712Households with one or more children younger than age 18 35.6% 29.9%
Table 4. Selected Population and Household Demographics
Source: 2019 American Community Survey, 1-year data
Population and Households 12Salt Lake City, Utah Comprehensive Housing Market Analysis as of July 1, 2020
Comprehensive Housing Market Analysis Salt Lake City, UtahU.S. Department of Housing and Urban Development, Office of Policy Development and Research
Sources: U.S. Census Bureau, 2013 and 2019 American Community Survey, 1-year estimates
0
5
10
15
20
25
30
35
Under 18 18 to 39 40 to 64 65 and Older
Popu
latio
n (%
)
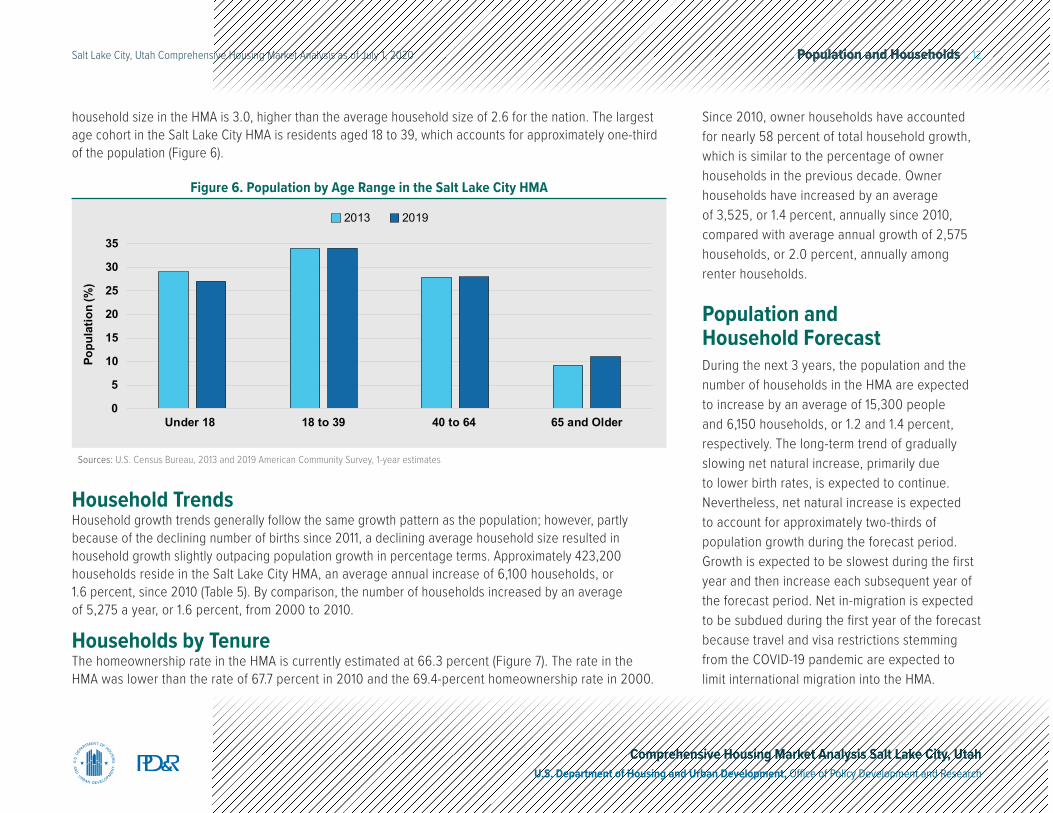
2013 2019
Figure 6. Population by Age Range in the Salt Lake City HMA
household size in the HMA is 3.0, higher than the average household size of 2.6 for the nation. The largest age cohort in the Salt Lake City HMA is residents aged 18 to 39, which accounts for approximately one-third of the population (Figure 6).
Household TrendsHousehold growth trends generally follow the same growth pattern as the population; however, partly because of the declining number of births since 2011, a declining average household size resulted in household growth slightly outpacing population growth in percentage terms. Approximately 423,200 households reside in the Salt Lake City HMA, an average annual increase of 6,100 households, or 1.6 percent, since 2010 (Table 5). By comparison, the number of households increased by an average of 5,275 a year, or 1.6 percent, from 2000 to 2010.
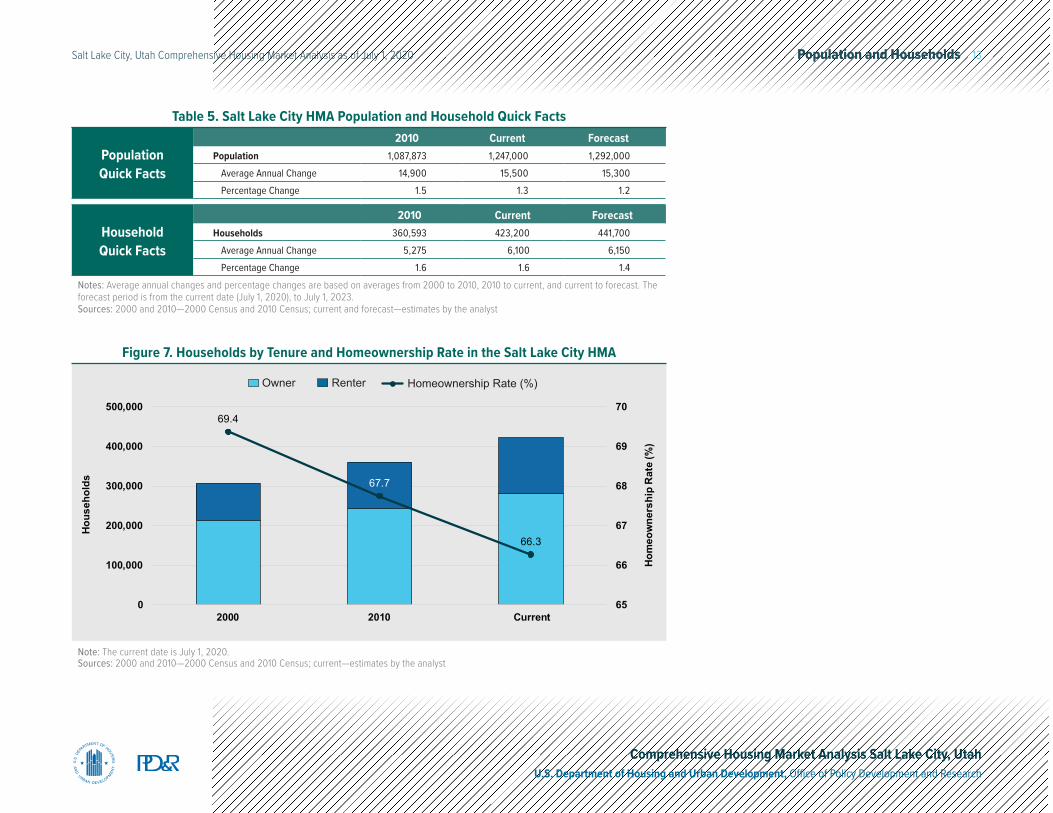
Households by TenureThe homeownership rate in the HMA is currently estimated at 66.3 percent (Figure 7). The rate in the HMA was lower than the rate of 67.7 percent in 2010 and the 69.4-percent homeownership rate in 2000.
Since 2010, owner households have accounted for nearly 58 percent of total household growth, which is similar to the percentage of owner households in the previous decade. Owner households have increased by an average of 3,525, or 1.4 percent, annually since 2010, compared with average annual growth of 2,575 households, or 2.0 percent, annually among renter households.
Population and Household ForecastDuring the next 3 years, the population and the number of households in the HMA are expected to increase by an average of 15,300 people and 6,150 households, or 1.2 and 1.4 percent, respectively. The long-term trend of gradually slowing net natural increase, primarily due to lower birth rates, is expected to continue. Nevertheless, net natural increase is expected to account for approximately two-thirds of population growth during the forecast period. Growth is expected to be slowest during the first year and then increase each subsequent year of the forecast period. Net in-migration is expected to be subdued during the first year of the forecast because travel and visa restrictions stemming from the COVID-19 pandemic are expected to limit international migration into the HMA.
Population and Households 13Salt Lake City, Utah Comprehensive Housing Market Analysis as of July 1, 2020
Comprehensive Housing Market Analysis Salt Lake City, UtahU.S. Department of Housing and Urban Development, Office of Policy Development and Research
Population Quick Facts
2010 Current ForecastPopulation 1,087,873 1,247,000 1,292,000
Average Annual Change 14,900 15,500 15,300Percentage Change 1.5 1.3 1.2
Household Quick Facts
2010 Current ForecastHouseholds 360,593 423,200 441,700
Average Annual Change 5,275 6,100 6,150Percentage Change 1.6 1.6 1.4
Notes: Average annual changes and percentage changes are based on averages from 2000 to 2010, 2010 to current, and current to forecast. The forecast period is from the current date (July 1, 2020), to July 1, 2023.Sources: 2000 and 2010—2000 Census and 2010 Census; current and forecast—estimates by the analyst
Table 5. Salt Lake City HMA Population and Household Quick Facts
Note: The current date is July 1, 2020.Sources: 2000 and 2010—2000 Census and 2010 Census; current—estimates by the analyst
RenterOwner Homeownership Rate (%)
69.4
67.7
66.3
65
66
67
68
69
70
0
100,000
200,000
300,000
400,000
500,000
2000 2010 Current
Hom
eow
ners
hip
Rat
e (%
)
Hous
ehol
ds
Figure 7. Households by Tenure and Homeownership Rate in the Salt Lake City HMA
Home Sales Market 14Salt Lake City, Utah Comprehensive Housing Market Analysis as of July 1, 2020
Comprehensive Housing Market Analysis Salt Lake City, UtahU.S. Department of Housing and Urban Development, Office of Policy Development and Research
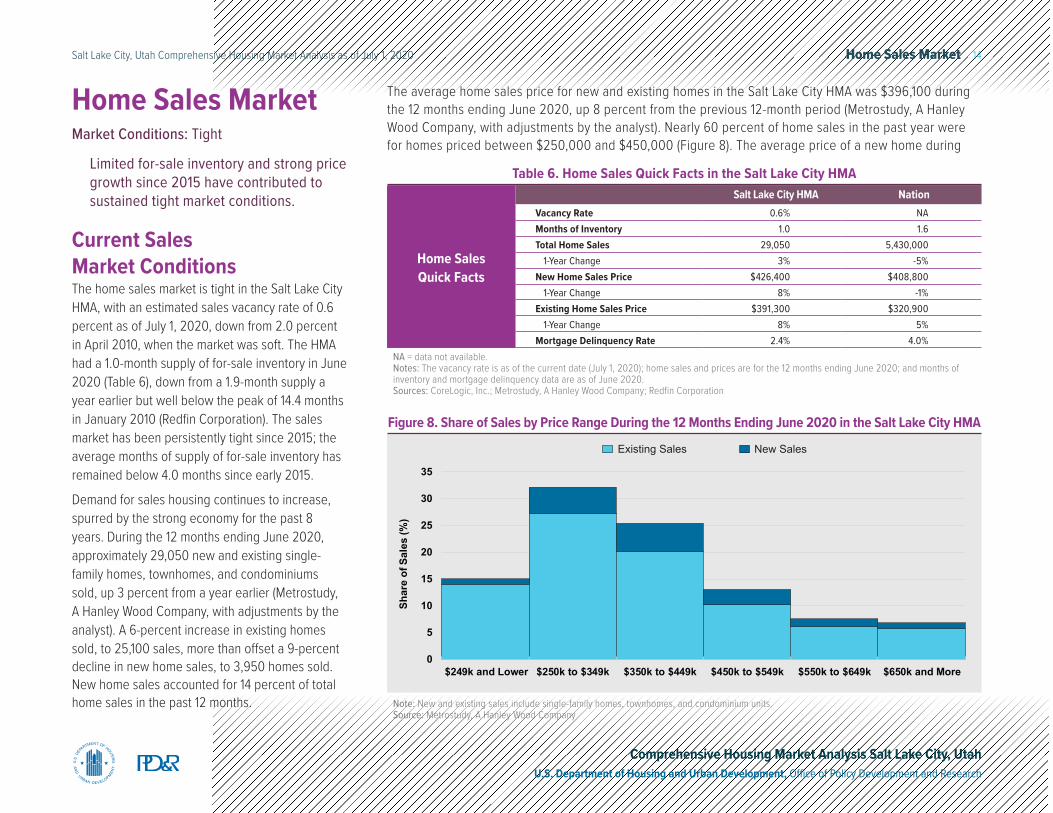
Current Sales Market ConditionsThe home sales market is tight in the Salt Lake City HMA, with an estimated sales vacancy rate of 0.6 percent as of July 1, 2020, down from 2.0 percent in April 2010, when the market was soft. The HMA had a 1.0-month supply of for-sale inventory in June 2020 (Table 6), down from a 1.9-month supply a year earlier but well below the peak of 14.4 months in January 2010 (Redfin Corporation). The sales market has been persistently tight since 2015; the average months of supply of for-sale inventory has remained below 4.0 months since early 2015.
Demand for sales housing continues to increase, spurred by the strong economy for the past 8 years. During the 12 months ending June 2020, approximately 29,050 new and existing single-family homes, townhomes, and condominiums sold, up 3 percent from a year earlier (Metrostudy, A Hanley Wood Company, with adjustments by the analyst). A 6-percent increase in existing homes sold, to 25,100 sales, more than offset a 9-percent decline in new home sales, to 3,950 homes sold. New home sales accounted for 14 percent of total home sales in the past 12 months.
Home Sales MarketMarket Conditions: Tight
Limited for-sale inventory and strong price growth since 2015 have contributed to sustained tight market conditions.
Home Sales Quick Facts
Salt Lake City HMA NationVacancy Rate 0.6% NAMonths of Inventory 1.0 1.6Total Home Sales 29,050 5,430,000
1-Year Change 3% -5%New Home Sales Price $426,400 $408,800
1-Year Change 8% -1%Existing Home Sales Price $391,300 $320,900
1-Year Change 8% 5%Mortgage Delinquency Rate 2.4% 4.0%
NA = data not available.Notes: The vacancy rate is as of the current date (July 1, 2020); home sales and prices are for the 12 months ending June 2020; and months of inventory and mortgage delinquency data are as of June 2020.Sources: CoreLogic, Inc.; Metrostudy, A Hanley Wood Company; Redfin Corporation
Table 6. Home Sales Quick Facts in the Salt Lake City HMA
The average home sales price for new and existing homes in the Salt Lake City HMA was $396,100 during the 12 months ending June 2020, up 8 percent from the previous 12-month period (Metrostudy, A Hanley Wood Company, with adjustments by the analyst). Nearly 60 percent of home sales in the past year were for homes priced between $250,000 and $450,000 (Figure 8). The average price of a new home during
Note: New and existing sales include single-family homes, townhomes, and condominium units.Source: Metrostudy, A Hanley Wood Company
New SalesExisting Sales
0
5
10
15
20
25
30
35
$249k and Lower $250k to $349k $350k to $449k $450k to $549k $550k to $649k $650k and More
Shar
e of
Sal
es (%
)
Figure 8. Share of Sales by Price Range During the 12 Months Ending June 2020 in the Salt Lake City HMA
Home Sales Market 15Salt Lake City, Utah Comprehensive Housing Market Analysis as of July 1, 2020
Comprehensive Housing Market Analysis Salt Lake City, UtahU.S. Department of Housing and Urban Development, Office of Policy Development and Research
Source: Metrostudy, A Hanley Wood Company, with adjustments by the analyst
New Home SalesExisting Home Sales
0
5,000
10,000
15,000
20,000
25,000
30,000
35,000
40,000
45,000
Jun-06
Jun-07
Jun-08
Jun-09
Jun-10
Jun-11
Jun-12
Jun-13
Jun-14
Jun-15
Jun-16
Jun-17
Jun-18
Jun-19
Jun-20
Sale
s To
tals
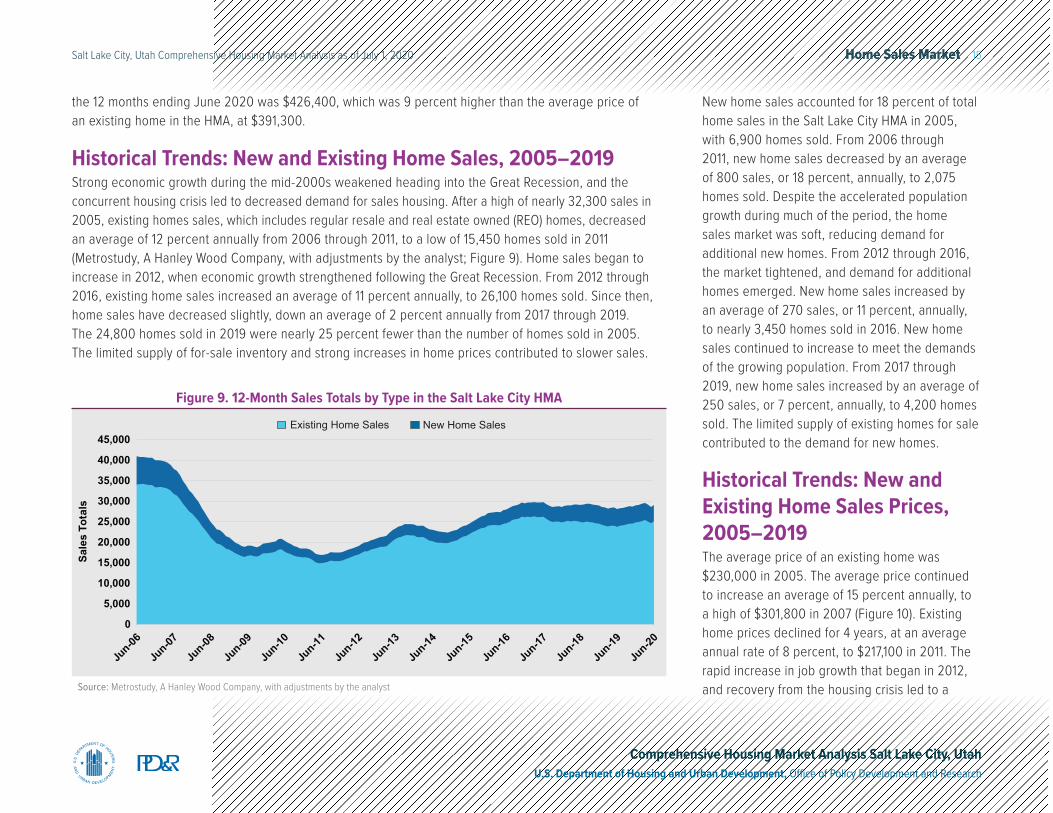
Figure 9. 12-Month Sales Totals by Type in the Salt Lake City HMA
the 12 months ending June 2020 was $426,400, which was 9 percent higher than the average price of an existing home in the HMA, at $391,300.
Historical Trends: New and Existing Home Sales, 2005–2019Strong economic growth during the mid-2000s weakened heading into the Great Recession, and the concurrent housing crisis led to decreased demand for sales housing. After a high of nearly 32,300 sales in 2005, existing homes sales, which includes regular resale and real estate owned (REO) homes, decreased an average of 12 percent annually from 2006 through 2011, to a low of 15,450 homes sold in 2011 (Metrostudy, A Hanley Wood Company, with adjustments by the analyst; Figure 9). Home sales began to increase in 2012, when economic growth strengthened following the Great Recession. From 2012 through 2016, existing home sales increased an average of 11 percent annually, to 26,100 homes sold. Since then, home sales have decreased slightly, down an average of 2 percent annually from 2017 through 2019. The 24,800 homes sold in 2019 were nearly 25 percent fewer than the number of homes sold in 2005. The limited supply of for-sale inventory and strong increases in home prices contributed to slower sales.
New home sales accounted for 18 percent of total home sales in the Salt Lake City HMA in 2005, with 6,900 homes sold. From 2006 through 2011, new home sales decreased by an average of 800 sales, or 18 percent, annually, to 2,075 homes sold. Despite the accelerated population growth during much of the period, the home sales market was soft, reducing demand for additional new homes. From 2012 through 2016, the market tightened, and demand for additional homes emerged. New home sales increased by an average of 270 sales, or 11 percent, annually, to nearly 3,450 homes sold in 2016. New home sales continued to increase to meet the demands of the growing population. From 2017 through 2019, new home sales increased by an average of 250 sales, or 7 percent, annually, to 4,200 homes sold. The limited supply of existing homes for sale contributed to the demand for new homes.
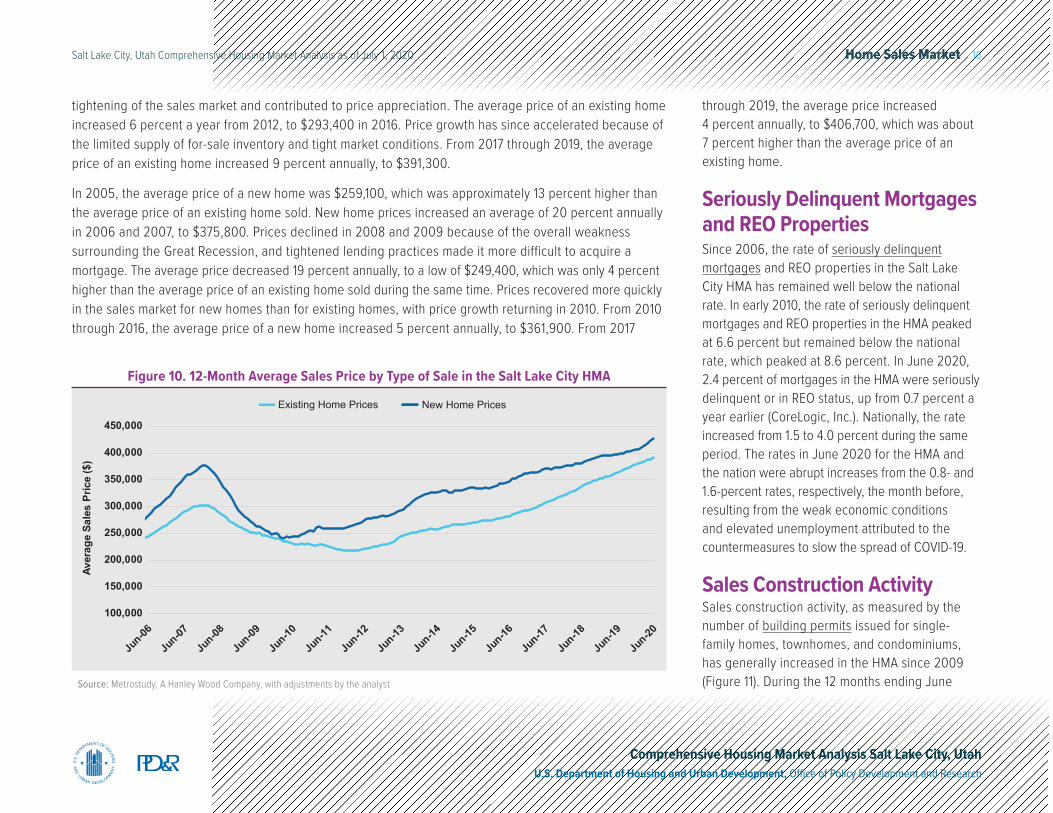
Historical Trends: New and Existing Home Sales Prices, 2005–2019The average price of an existing home was $230,000 in 2005. The average price continued to increase an average of 15 percent annually, to a high of $301,800 in 2007 (Figure 10). Existing home prices declined for 4 years, at an average annual rate of 8 percent, to $217,100 in 2011. The rapid increase in job growth that began in 2012, and recovery from the housing crisis led to a
Home Sales Market 16Salt Lake City, Utah Comprehensive Housing Market Analysis as of July 1, 2020
Comprehensive Housing Market Analysis Salt Lake City, UtahU.S. Department of Housing and Urban Development, Office of Policy Development and Research
tightening of the sales market and contributed to price appreciation. The average price of an existing home increased 6 percent a year from 2012, to $293,400 in 2016. Price growth has since accelerated because of the limited supply of for-sale inventory and tight market conditions. From 2017 through 2019, the average price of an existing home increased 9 percent annually, to $391,300.
In 2005, the average price of a new home was $259,100, which was approximately 13 percent higher than the average price of an existing home sold. New home prices increased an average of 20 percent annually in 2006 and 2007, to $375,800. Prices declined in 2008 and 2009 because of the overall weakness surrounding the Great Recession, and tightened lending practices made it more difficult to acquire a mortgage. The average price decreased 19 percent annually, to a low of $249,400, which was only 4 percent higher than the average price of an existing home sold during the same time. Prices recovered more quickly in the sales market for new homes than for existing homes, with price growth returning in 2010. From 2010 through 2016, the average price of a new home increased 5 percent annually, to $361,900. From 2017
Source: Metrostudy, A Hanley Wood Company, with adjustments by the analyst
New Home PricesExisting Home Prices
100,000
150,000
200,000
250,000
300,000
350,000
400,000
450,000
Jun-06
Jun-07
Jun-08
Jun-09
Jun-10
Jun-11
Jun-12
Jun-13
Jun-14
Jun-15
Jun-16
Jun-17
Jun-18
Jun-19
Jun-20
Aver
age
Sale
s Pr
ice
($)
Figure 10. 12-Month Average Sales Price by Type of Sale in the Salt Lake City HMA
through 2019, the average price increased 4 percent annually, to $406,700, which was about 7 percent higher than the average price of an existing home.
Seriously Delinquent Mortgages and REO PropertiesSince 2006, the rate of seriously delinquent mortgages and REO properties in the Salt Lake City HMA has remained well below the national rate. In early 2010, the rate of seriously delinquent mortgages and REO properties in the HMA peaked at 6.6 percent but remained below the national rate, which peaked at 8.6 percent. In June 2020, 2.4 percent of mortgages in the HMA were seriously delinquent or in REO status, up from 0.7 percent a year earlier (CoreLogic, Inc.). Nationally, the rate increased from 1.5 to 4.0 percent during the same period. The rates in June 2020 for the HMA and the nation were abrupt increases from the 0.8- and 1.6-percent rates, respectively, the month before, resulting from the weak economic conditions and elevated unemployment attributed to the countermeasures to slow the spread of COVID-19.
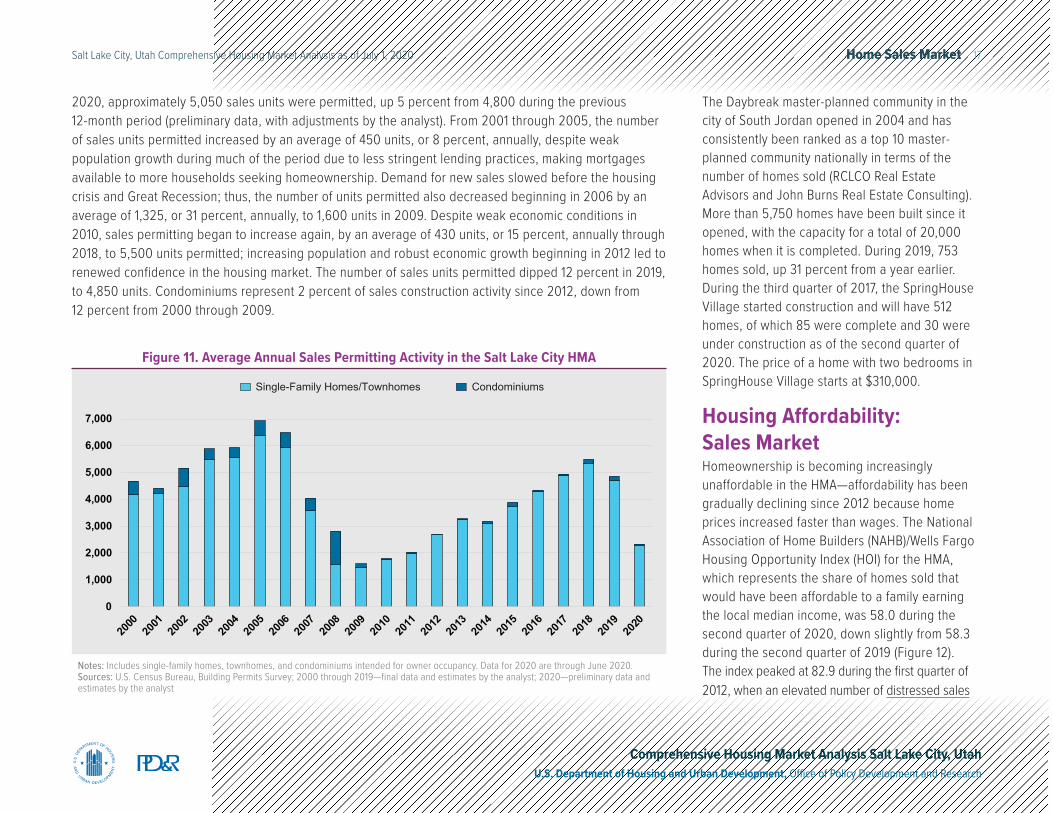
Sales Construction ActivitySales construction activity, as measured by the number of building permits issued for single-family homes, townhomes, and condominiums, has generally increased in the HMA since 2009 (Figure 11). During the 12 months ending June
Home Sales Market 17Salt Lake City, Utah Comprehensive Housing Market Analysis as of July 1, 2020
Comprehensive Housing Market Analysis Salt Lake City, UtahU.S. Department of Housing and Urban Development, Office of Policy Development and Research
2020, approximately 5,050 sales units were permitted, up 5 percent from 4,800 during the previous 12-month period (preliminary data, with adjustments by the analyst). From 2001 through 2005, the number of sales units permitted increased by an average of 450 units, or 8 percent, annually, despite weak population growth during much of the period due to less stringent lending practices, making mortgages available to more households seeking homeownership. Demand for new sales slowed before the housing crisis and Great Recession; thus, the number of units permitted also decreased beginning in 2006 by an average of 1,325, or 31 percent, annually, to 1,600 units in 2009. Despite weak economic conditions in 2010, sales permitting began to increase again, by an average of 430 units, or 15 percent, annually through 2018, to 5,500 units permitted; increasing population and robust economic growth beginning in 2012 led to renewed confidence in the housing market. The number of sales units permitted dipped 12 percent in 2019, to 4,850 units. Condominiums represent 2 percent of sales construction activity since 2012, down from 12 percent from 2000 through 2009.
CondominiumsSingle-Family Homes/Townhomes
0
1,000
2,000
3,000
4,000
5,000
6,000
7,000
2000
2001
2002
2003
2004
2005
2006
2007
2008
2009
2010
2011
2012
2013
2014
2015
2016
2017
2018
2019
2020
Notes: Includes single-family homes, townhomes, and condominiums intended for owner occupancy. Data for 2020 are through June 2020.Sources: U.S. Census Bureau, Building Permits Survey; 2000 through 2019—final data and estimates by the analyst; 2020—preliminary data and estimates by the analyst
Figure 11. Average Annual Sales Permitting Activity in the Salt Lake City HMA
The Daybreak master-planned community in the city of South Jordan opened in 2004 and has consistently been ranked as a top 10 master-planned community nationally in terms of the number of homes sold (RCLCO Real Estate Advisors and John Burns Real Estate Consulting). More than 5,750 homes have been built since it opened, with the capacity for a total of 20,000 homes when it is completed. During 2019, 753 homes sold, up 31 percent from a year earlier. During the third quarter of 2017, the SpringHouse Village started construction and will have 512 homes, of which 85 were complete and 30 were under construction as of the second quarter of 2020. The price of a home with two bedrooms in SpringHouse Village starts at $310,000.
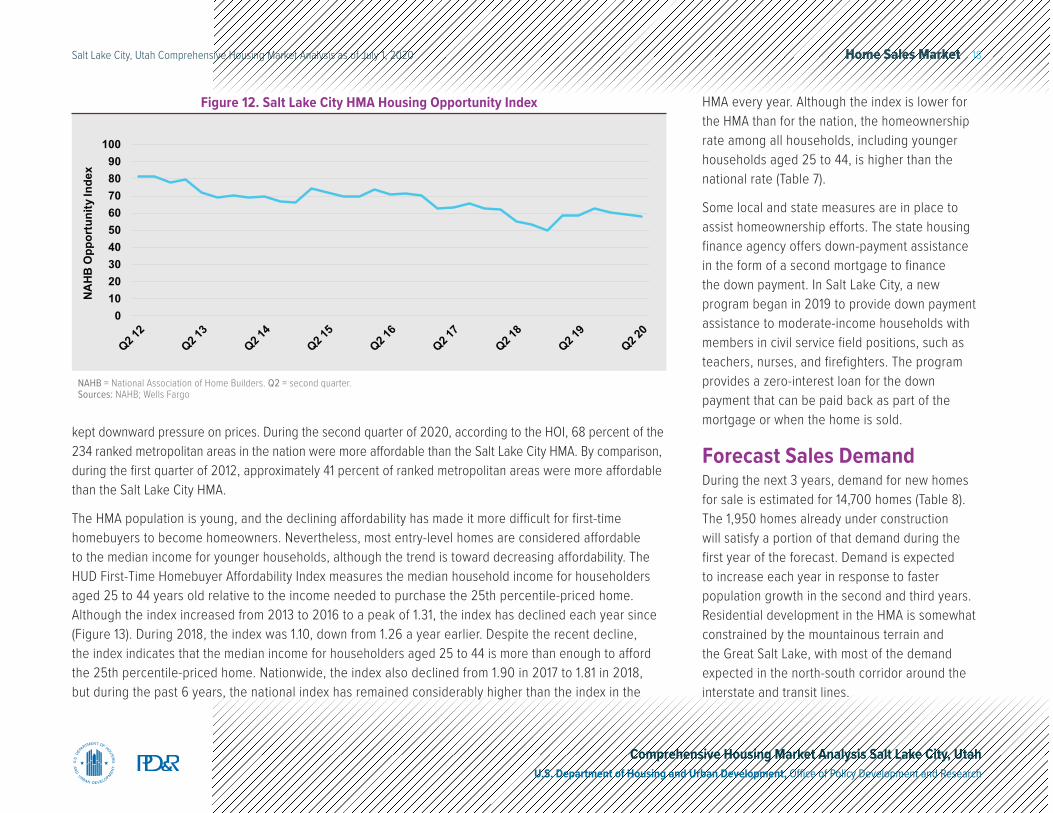
Housing Affordability: Sales MarketHomeownership is becoming increasingly unaffordable in the HMA—affordability has been gradually declining since 2012 because home prices increased faster than wages. The National Association of Home Builders (NAHB)/Wells Fargo Housing Opportunity Index (HOI) for the HMA, which represents the share of homes sold that would have been affordable to a family earning the local median income, was 58.0 during the second quarter of 2020, down slightly from 58.3 during the second quarter of 2019 (Figure 12). The index peaked at 82.9 during the first quarter of 2012, when an elevated number of distressed sales
Home Sales Market 18Salt Lake City, Utah Comprehensive Housing Market Analysis as of July 1, 2020
Comprehensive Housing Market Analysis Salt Lake City, UtahU.S. Department of Housing and Urban Development, Office of Policy Development and Research
kept downward pressure on prices. During the second quarter of 2020, according to the HOI, 68 percent of the 234 ranked metropolitan areas in the nation were more affordable than the Salt Lake City HMA. By comparison, during the first quarter of 2012, approximately 41 percent of ranked metropolitan areas were more affordable than the Salt Lake City HMA.
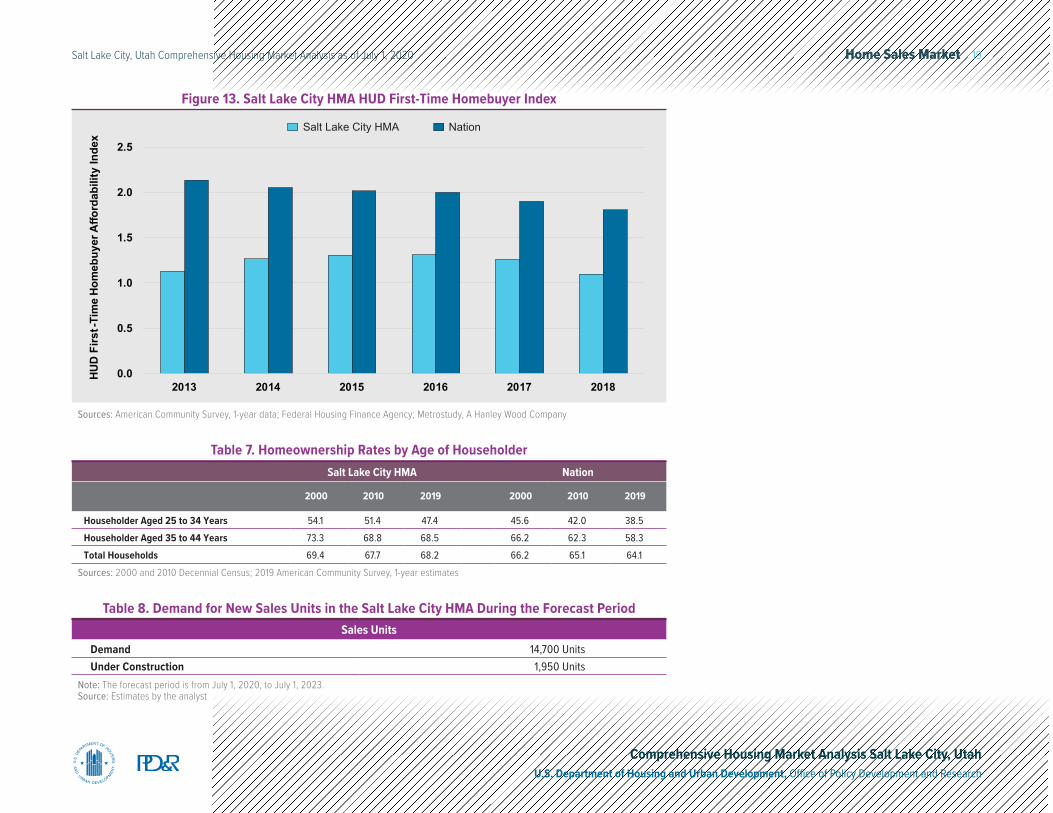
The HMA population is young, and the declining affordability has made it more difficult for first-time homebuyers to become homeowners. Nevertheless, most entry-level homes are considered affordable to the median income for younger households, although the trend is toward decreasing affordability. The HUD First-Time Homebuyer Affordability Index measures the median household income for householders aged 25 to 44 years old relative to the income needed to purchase the 25th percentile-priced home. Although the index increased from 2013 to 2016 to a peak of 1.31, the index has declined each year since (Figure 13). During 2018, the index was 1.10, down from 1.26 a year earlier. Despite the recent decline, the index indicates that the median income for householders aged 25 to 44 is more than enough to afford the 25th percentile-priced home. Nationwide, the index also declined from 1.90 in 2017 to 1.81 in 2018, but during the past 6 years, the national index has remained considerably higher than the index in the
NAHB = National Association of Home Builders. Q2 = second quarter.Sources: NAHB; Wells Fargo
0102030405060708090
100
Q2 12
Q2 13
Q2 14
Q2 15
Q2 16
Q2 17
Q2 18
Q2 19
Q2 20
NAHB
Opp
ortu
nity
Inde
xFigure 12. Salt Lake City HMA Housing Opportunity Index HMA every year. Although the index is lower for
the HMA than for the nation, the homeownership rate among all households, including younger households aged 25 to 44, is higher than the national rate (Table 7).
Some local and state measures are in place to assist homeownership efforts. The state housing finance agency offers down-payment assistance in the form of a second mortgage to finance the down payment. In Salt Lake City, a new program began in 2019 to provide down payment assistance to moderate-income households with members in civil service field positions, such as teachers, nurses, and firefighters. The program provides a zero-interest loan for the down payment that can be paid back as part of the mortgage or when the home is sold.
Forecast Sales DemandDuring the next 3 years, demand for new homes for sale is estimated for 14,700 homes (Table 8). The 1,950 homes already under construction will satisfy a portion of that demand during the first year of the forecast. Demand is expected to increase each year in response to faster population growth in the second and third years. Residential development in the HMA is somewhat constrained by the mountainous terrain and the Great Salt Lake, with most of the demand expected in the north-south corridor around the interstate and transit lines.
Home Sales Market 19Salt Lake City, Utah Comprehensive Housing Market Analysis as of July 1, 2020
Comprehensive Housing Market Analysis Salt Lake City, UtahU.S. Department of Housing and Urban Development, Office of Policy Development and Research
Table 8. Demand for New Sales Units in the Salt Lake City HMA During the Forecast PeriodSales Units
Demand 14,700 UnitsUnder Construction 1,950 Units
Note: The forecast period is from July 1, 2020, to July 1, 2023.Source: Estimates by the analyst
Salt Lake City HMA Nation
2000 2010 2019 2000 2010 2019
Householder Aged 25 to 34 Years 54.1 51.4 47.4 45.6 42.0 38.5 Householder Aged 35 to 44 Years 73.3 68.8 68.5 66.2 62.3 58.3 Total Households 69.4 67.7 68.2 66.2 65.1 64.1
Sources: 2000 and 2010 Decennial Census; 2019 American Community Survey, 1-year estimates
Table 7. Homeownership Rates by Age of Householder
Sources: American Community Survey, 1-year data; Federal Housing Finance Agency; Metrostudy, A Hanley Wood Company
0.0
0.5
1.0
1.5
2.0
2.5
2013 2014 2015 2016 2017 2018
HUD
Firs
t-Ti
me
Hom
ebuy
er A
fford
abili
ty In
dex
NationSalt Lake City HMA
Figure 13. Salt Lake City HMA HUD First-Time Homebuyer Index
Rental Market 20Salt Lake City, Utah Comprehensive Housing Market Analysis as of July 1, 2020
Comprehensive Housing Market Analysis Salt Lake City, UtahU.S. Department of Housing and Urban Development, Office of Policy Development and Research
Rental MarketMarket Conditions: Balanced
The rental vacancy rate is currently estimated at 6.5 percent, compared with 6.9 percent in April 2010.
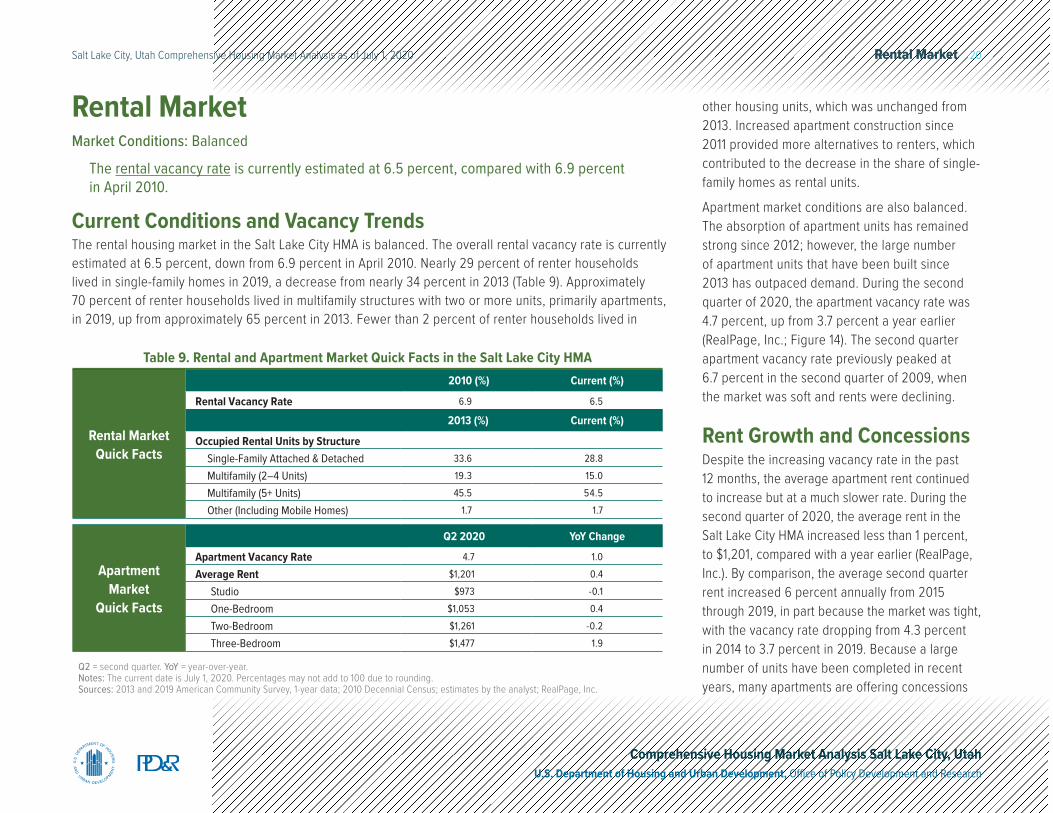
Current Conditions and Vacancy TrendsThe rental housing market in the Salt Lake City HMA is balanced. The overall rental vacancy rate is currently estimated at 6.5 percent, down from 6.9 percent in April 2010. Nearly 29 percent of renter households lived in single-family homes in 2019, a decrease from nearly 34 percent in 2013 (Table 9). Approximately 70 percent of renter households lived in multifamily structures with two or more units, primarily apartments, in 2019, up from approximately 65 percent in 2013. Fewer than 2 percent of renter households lived in
Rental Market Quick Facts
2010 (%) Current (%)
Rental Vacancy Rate 6.9 6.5
2013 (%) Current (%)
Occupied Rental Units by StructureSingle-Family Attached & Detached 33.6 28.8
Multifamily (2–4 Units) 19.3 15.0
Multifamily (5+ Units) 45.5 54.5
Other (Including Mobile Homes) 1.7 1.7
Apartment Market
Quick Facts
Q2 2020 YoY Change
Apartment Vacancy Rate 4.7 1.0
Average Rent $1,201 0.4
Studio $973 -0.1
One-Bedroom $1,053 0.4
Two-Bedroom $1,261 -0.2
Three-Bedroom $1,477 1.9 Q2 = second quarter. YoY = year-over-year.Notes: The current date is July 1, 2020. Percentages may not add to 100 due to rounding.Sources: 2013 and 2019 American Community Survey, 1-year data; 2010 Decennial Census; estimates by the analyst; RealPage, Inc.
Table 9. Rental and Apartment Market Quick Facts in the Salt Lake City HMA
other housing units, which was unchanged from 2013. Increased apartment construction since 2011 provided more alternatives to renters, which contributed to the decrease in the share of single-family homes as rental units.
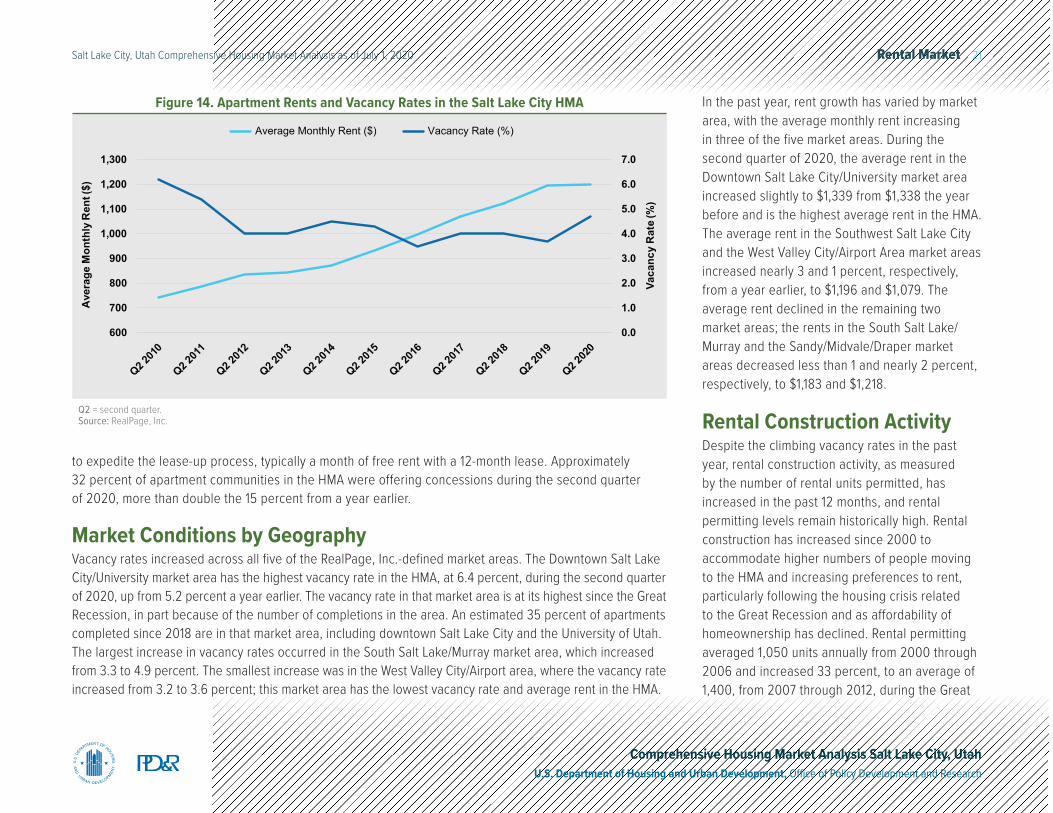
Apartment market conditions are also balanced. The absorption of apartment units has remained strong since 2012; however, the large number of apartment units that have been built since 2013 has outpaced demand. During the second quarter of 2020, the apartment vacancy rate was 4.7 percent, up from 3.7 percent a year earlier (RealPage, Inc.; Figure 14). The second quarter apartment vacancy rate previously peaked at 6.7 percent in the second quarter of 2009, when the market was soft and rents were declining.
Rent Growth and ConcessionsDespite the increasing vacancy rate in the past 12 months, the average apartment rent continued to increase but at a much slower rate. During the second quarter of 2020, the average rent in the Salt Lake City HMA increased less than 1 percent, to $1,201, compared with a year earlier (RealPage, Inc.). By comparison, the average second quarter rent increased 6 percent annually from 2015 through 2019, in part because the market was tight, with the vacancy rate dropping from 4.3 percent in 2014 to 3.7 percent in 2019. Because a large number of units have been completed in recent years, many apartments are offering concessions
Rental Market 21Salt Lake City, Utah Comprehensive Housing Market Analysis as of July 1, 2020
Comprehensive Housing Market Analysis Salt Lake City, UtahU.S. Department of Housing and Urban Development, Office of Policy Development and Research
Q2 = second quarter.Source: RealPage, Inc.
Average Monthly Rent ($) Vacancy Rate (%)
0.0
1.0
2.0
3.0
4.0
5.0
6.0
7.0
600
700
800
900
1,000
1,100
1,200
1,300
Q2 201
0
Q2 201
1
Q2 201
2
Q2 201
3
Q2 201
4
Q2 201
5
Q2 201
6
Q2 201
7
Q2 201
8
Q2 201
9
Q2 202
0
Vaca
ncy
Rat
e (%
)
Ave
rage
Mon
thly
Ren
t ($)
Figure 14. Apartment Rents and Vacancy Rates in the Salt Lake City HMA
to expedite the lease-up process, typically a month of free rent with a 12-month lease. Approximately 32 percent of apartment communities in the HMA were offering concessions during the second quarter of 2020, more than double the 15 percent from a year earlier.
Market Conditions by GeographyVacancy rates increased across all five of the RealPage, Inc.-defined market areas. The Downtown Salt Lake City/University market area has the highest vacancy rate in the HMA, at 6.4 percent, during the second quarter of 2020, up from 5.2 percent a year earlier. The vacancy rate in that market area is at its highest since the Great Recession, in part because of the number of completions in the area. An estimated 35 percent of apartments completed since 2018 are in that market area, including downtown Salt Lake City and the University of Utah. The largest increase in vacancy rates occurred in the South Salt Lake/Murray market area, which increased from 3.3 to 4.9 percent. The smallest increase was in the West Valley City/Airport area, where the vacancy rate increased from 3.2 to 3.6 percent; this market area has the lowest vacancy rate and average rent in the HMA.
In the past year, rent growth has varied by market area, with the average monthly rent increasing in three of the five market areas. During the second quarter of 2020, the average rent in the Downtown Salt Lake City/University market area increased slightly to $1,339 from $1,338 the year before and is the highest average rent in the HMA. The average rent in the Southwest Salt Lake City and the West Valley City/Airport Area market areas increased nearly 3 and 1 percent, respectively, from a year earlier, to $1,196 and $1,079. The average rent declined in the remaining two market areas; the rents in the South Salt Lake/Murray and the Sandy/Midvale/Draper market areas decreased less than 1 and nearly 2 percent, respectively, to $1,183 and $1,218.
Rental Construction ActivityDespite the climbing vacancy rates in the past year, rental construction activity, as measured by the number of rental units permitted, has increased in the past 12 months, and rental permitting levels remain historically high. Rental construction has increased since 2000 to accommodate higher numbers of people moving to the HMA and increasing preferences to rent, particularly following the housing crisis related to the Great Recession and as affordability of homeownership has declined. Rental permitting averaged 1,050 units annually from 2000 through 2006 and increased 33 percent, to an average of 1,400, from 2007 through 2012, during the Great
Rental Market 22Salt Lake City, Utah Comprehensive Housing Market Analysis as of July 1, 2020
Comprehensive Housing Market Analysis Salt Lake City, UtahU.S. Department of Housing and Urban Development, Office of Policy Development and Research
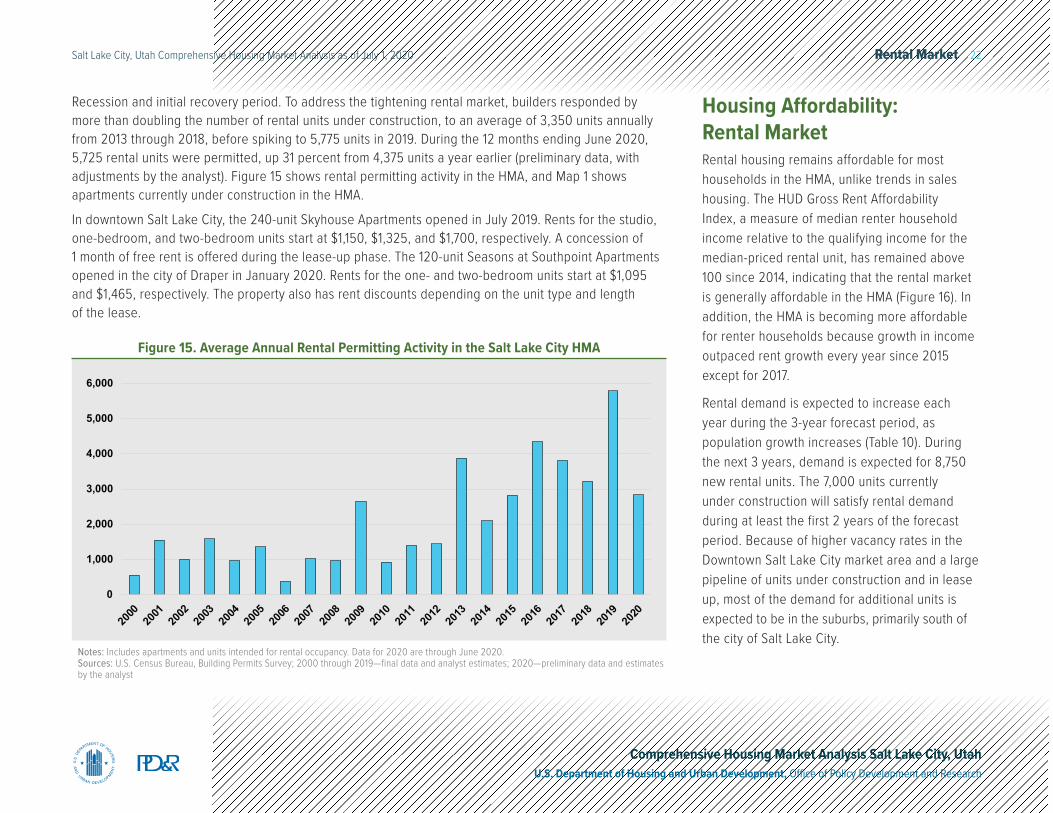
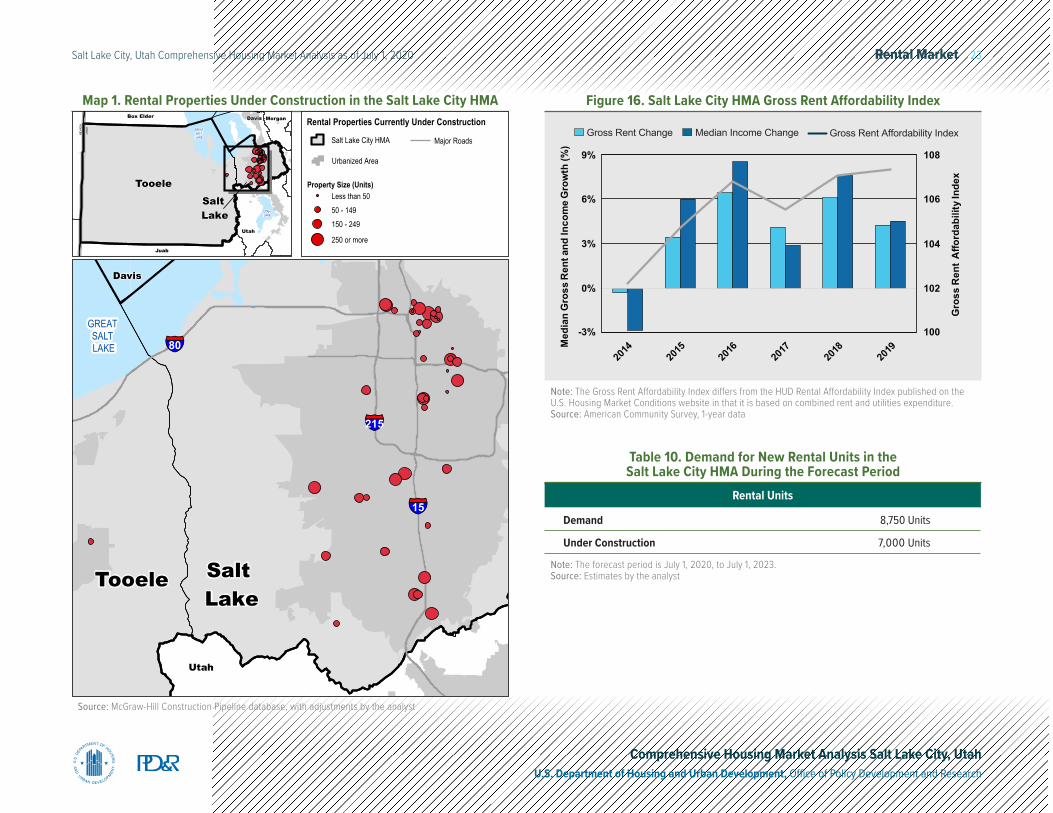
Recession and initial recovery period. To address the tightening rental market, builders responded by more than doubling the number of rental units under construction, to an average of 3,350 units annually from 2013 through 2018, before spiking to 5,775 units in 2019. During the 12 months ending June 2020, 5,725 rental units were permitted, up 31 percent from 4,375 units a year earlier (preliminary data, with adjustments by the analyst). Figure 15 shows rental permitting activity in the HMA, and Map 1 shows apartments currently under construction in the HMA.
In downtown Salt Lake City, the 240-unit Skyhouse Apartments opened in July 2019. Rents for the studio, one-bedroom, and two-bedroom units start at $1,150, $1,325, and $1,700, respectively. A concession of 1 month of free rent is offered during the lease-up phase. The 120-unit Seasons at Southpoint Apartments opened in the city of Draper in January 2020. Rents for the one- and two-bedroom units start at $1,095 and $1,465, respectively. The property also has rent discounts depending on the unit type and length of the lease.
Notes: Includes apartments and units intended for rental occupancy. Data for 2020 are through June 2020.Sources: U.S. Census Bureau, Building Permits Survey; 2000 through 2019—final data and analyst estimates; 2020—preliminary data and estimates by the analyst
0
1,000
2,000
3,000
4,000
5,000
6,000
2000
2001
2002
2003
2004
2005
2006
2007
2008
2009
2010
2011
2012
2013
2014
2015
2016
2017
2018
2019
2020
Figure 15. Average Annual Rental Permitting Activity in the Salt Lake City HMA
Housing Affordability: Rental MarketRental housing remains affordable for most households in the HMA, unlike trends in sales housing. The HUD Gross Rent Affordability Index, a measure of median renter household income relative to the qualifying income for the median-priced rental unit, has remained above 100 since 2014, indicating that the rental market is generally affordable in the HMA (Figure 16). In addition, the HMA is becoming more affordable for renter households because growth in income outpaced rent growth every year since 2015 except for 2017.
Rental demand is expected to increase each year during the 3-year forecast period, as population growth increases (Table 10). During the next 3 years, demand is expected for 8,750 new rental units. The 7,000 units currently under construction will satisfy rental demand during at least the first 2 years of the forecast period. Because of higher vacancy rates in the Downtown Salt Lake City market area and a large pipeline of units under construction and in lease up, most of the demand for additional units is expected to be in the suburbs, primarily south of the city of Salt Lake City.
Rental Market 23Salt Lake City, Utah Comprehensive Housing Market Analysis as of July 1, 2020
Comprehensive Housing Market Analysis Salt Lake City, UtahU.S. Department of Housing and Urban Development, Office of Policy Development and Research
Note: The Gross Rent Affordability Index differs from the HUD Rental Affordability Index published on the U.S. Housing Market Conditions website in that it is based on combined rent and utilities expenditure.Source: American Community Survey, 1-year data
Median Income ChangeGross Rent Change Gross Rent Affordability Index
100
102
104
106
108
-3%
0%
3%
6%
9%
2014
2015
2016
2017
2018
2019
Gro
ss R
ent
Affo
rdab
ility
Inde
x
Med
ian
Gro
ss R
ent a
nd In
com
e G
row
th (%
)
Figure 16. Salt Lake City HMA Gross Rent Affordability Index
Rental Units
Demand 8,750 Units
Under Construction 7,000 Units
Table 10. Demand for New Rental Units in the Salt Lake City HMA During the Forecast Period
Note: The forecast period is July 1, 2020, to July 1, 2023.Source: Estimates by the analyst
Map 1. Rental Properties Under Construction in the Salt Lake City HMA
Source: McGraw-Hill Construction Pipeline database, with adjustments by the analyst
GREAT SALT LAKE
UTAH LAKE
UTA
H
NEV
ADA
Salt Lake
Utah
Juab
DavisBox Elder Morgan
Tooele
GREAT SALT LAKE
Salt Lake
Tooele
§̈¦15
§̈¦215
§̈¦80
Utah
Davis
Rental Properties Currently Under Construction
Property Size (Units)
Urbanized Area
250 or more
150 - 24950 - 149Less than 50
Salt Lake City HMA Major Roads
Terminology Definitions and Notes 24Salt Lake City, Utah Comprehensive Housing Market Analysis as of July 1, 2020
Comprehensive Housing Market Analysis Salt Lake City, UtahU.S. Department of Housing and Urban Development, Office of Policy Development and Research
Terminology Definitions and Notes
A. Definitions
Building Permits
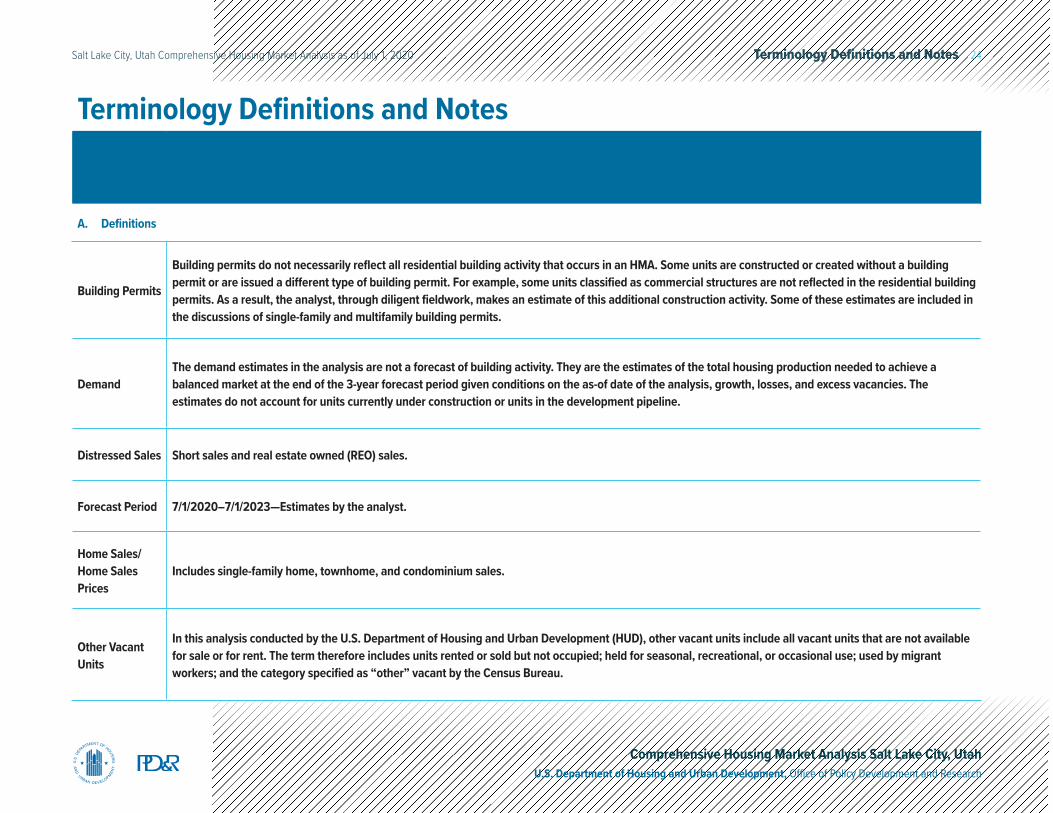
Building permits do not necessarily reflect all residential building activity that occurs in an HMA. Some units are constructed or created without a building permit or are issued a different type of building permit. For example, some units classified as commercial structures are not reflected in the residential building permits. As a result, the analyst, through diligent fieldwork, makes an estimate of this additional construction activity. Some of these estimates are included in the discussions of single-family and multifamily building permits.
Demand The demand estimates in the analysis are not a forecast of building activity. They are the estimates of the total housing production needed to achieve a balanced market at the end of the 3-year forecast period given conditions on the as-of date of the analysis, growth, losses, and excess vacancies. The estimates do not account for units currently under construction or units in the development pipeline.
Distressed Sales Short sales and real estate owned (REO) sales.
Forecast Period 7/1/2020–7/1/2023—Estimates by the analyst.
Home Sales/Home Sales Prices
Includes single-family home, townhome, and condominium sales.
Other Vacant Units
In this analysis conducted by the U.S. Department of Housing and Urban Development (HUD), other vacant units include all vacant units that are not available for sale or for rent. The term therefore includes units rented or sold but not occupied; held for seasonal, recreational, or occasional use; used by migrant workers; and the category specified as “other” vacant by the Census Bureau.

Terminology Definitions and Notes 25Salt Lake City, Utah Comprehensive Housing Market Analysis as of July 1, 2020
Comprehensive Housing Market Analysis Salt Lake City, UtahU.S. Department of Housing and Urban Development, Office of Policy Development and Research
Rental Market/Rental Vacancy Rate
Includes apartments and other rental units such as single-family, multifamily, and mobile homes.
Seriously Delinquent Mortgages
Mortgages 90+ days delinquent or in foreclosure.
B. Notes on Geography
1. The metropolitan statistical area definition noted in this report is based on the delineations established by the Office of Management and Budget (OMB) in the OMB Bulletin dated April 10, 2018.
2. Urbanized areas are defined using the U.S. Census Bureau 2010 Census Urban and Rural Classification and the Urban Area Criteria.
3. The geography of the Salt Lake City, UT metropolitan area changed between the 2009 and 2013 OMB Bulletins, with the removal of Summit County, which affects the ACS estimates during that time. When comparing ACS data, this analysis focuses on trends since 2013.
C. Additional Notes
1. The NAHB Housing Opportunity Index represents the share of homes sold in the HMA that would have been affordable to a family earning the local median income, based on standard mortgage underwriting criteria.
Terminology Definitions and Notes 26Salt Lake City, Utah Comprehensive Housing Market Analysis as of July 1, 2020
Comprehensive Housing Market Analysis Salt Lake City, UtahU.S. Department of Housing and Urban Development, Office of Policy Development and Research
2.This analysis has been prepared for the assistance and guidance of HUD in its operations. The factual information, findings, and conclusions may also be useful to builders, mortgagees, and others concerned with local housing market conditions and trends. The analysis does not purport to make determinations regarding the acceptability of any mortgage insurance proposals that may be under consideration by the Department.
3.
The factual framework for this analysis follows the guidelines and methods developed by the Economic and Market Analysis Division within HUD. The analysis and findings are as thorough and current as possible based on information available on the as-of date from local and national sources. As such, findings or conclusions may be modified by subsequent developments. HUD expresses its appreciation to those industry sources and state and local government officials who provided data and information on local economic and housing market conditions.
D. Photo/Map Credits
Cover Photo iStock
Map 1 McGraw-Hill Construction Pipeline database, with adjustments by the analyst
Contact InformationKatharine Jones, Economist Denver HUD Regional Office303–672–[email protected]