Embed Size (px)
Citation preview
C O M P R E H E N S I V E H O U S I N G M A R K E T A N A L Y S I S
Dayton, OhioAs of July 1, 2016U.S. Department of Housing and Urban Development Office of Policy Development and Research
Clark
Champaign
Warren
Darke
Shelby
ClintonButler
Logan
Pre
ble
Fay
ette
Madison
Miami
Greene
Montgomery
Housing Market Area
The Dayton Housing Market Area (HMA) is coterminous with the Dayton, OH Metropolitan Statistical Area (MSA). The HMA, which comprises Greene, Miami, and Montgomery Counties in southwest Ohio, is located in the Miami Valley region, 50 miles northeast of Cin-cinnati, Ohio, and 70 miles southwest of Columbus, Ohio. The HMA is home to Wright-Patterson Air Force Base (AFB), which had a $4.3 billion economic impact on the HMA in 2014, and several colleges and universities, including Wright State University, the University of Dayton, and Sinclair Community College.
Market DetailsEconomic Conditions ............... 2
Population and Households ..... 5
Housing Market Trends ............ 7
Data Profile ............................. 12
SummaryEconomy Economic conditions in the Dayton HMA have improved since 2011 but are still recovering after 10 years of job losses from 2000 through 2010. During the 12 months ending June 2016, nonfarm payrolls increased by 6,900 jobs, or 1.8 percent, to 382,700 jobs, slightly more than the 6,300 jobs, or 1.7 percent, added during the previous 12-month period. As the economy continues to recover, nonfarm payrolls are expected to grow an average of 1.6 percent a year during the 3-year forecast period, led by expansions in the education and health services and the manufactur-ing sectors.
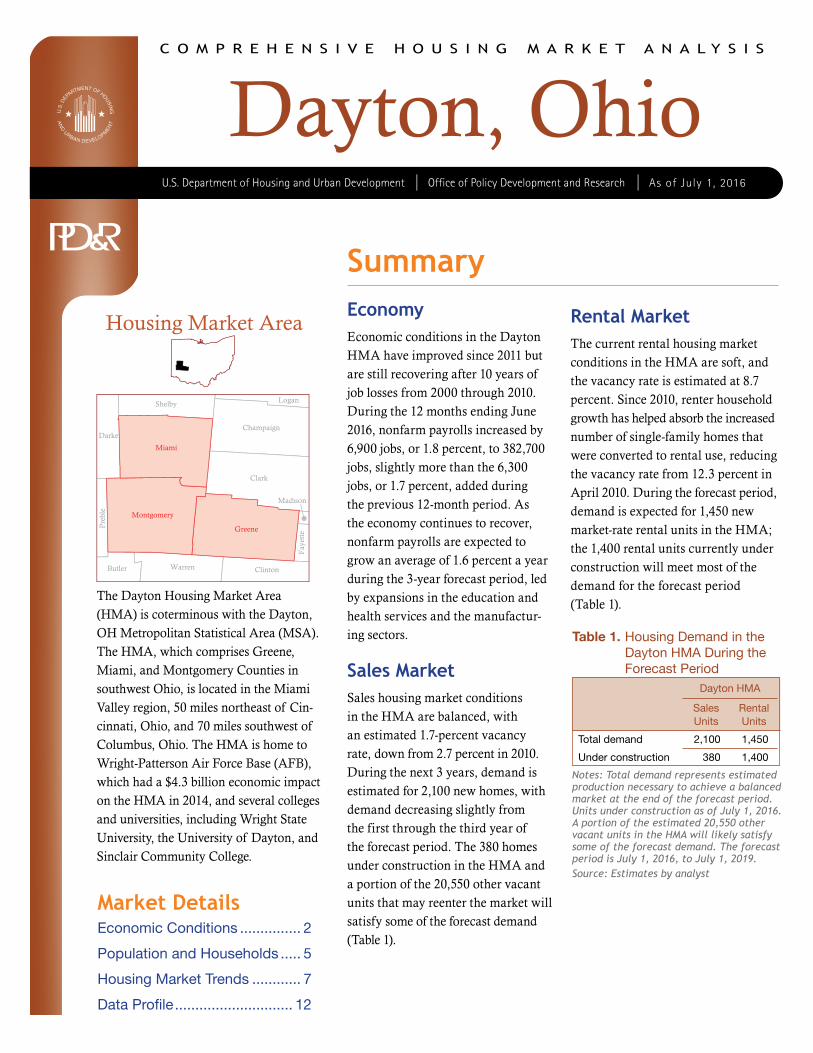
Sales MarketSales housing market conditions in the HMA are balanced, with an esti mated 1.7-percent vacancy rate, down from 2.7 percent in 2010. During the next 3 years, demand is estimated for 2,100 new homes, with demand decreasing slightly from the first through the third year of the forecast period. The 380 homes under construction in the HMA and a portion of the 20,550 other vacant units that may reenter the market will satisfy some of the forecast demand (Table 1).
Rental MarketThe current rental housing market conditions in the HMA are soft, and the vacancy rate is estimated at 8.7 percent. Since 2010, renter household growth has helped absorb the increased number of single-family homes that were converted to rental use, reducing the vacancy rate from 12.3 percent in April 2010. During the forecast period, demand is expected for 1,450 new market-rate rental units in the HMA; the 1,400 rental units currently under construction will meet most of the de mand for the forecast period ( Table 1).
Table 1. Housing Demand in the Dayton HMA During the Forecast Period
Dayton HMA
SalesUnits
RentalUnits
Total demand 2,100 1,450
Under construction 380 1,400
Notes: Total demand represents estimated production necessary to achieve a balanced market at the end of the forecast period. Units under construction as of July 1, 2016. A portion of the estimated 20,550 other vacant units in the HMA will likely satisfy some of the forecast demand. The forecast period is July 1, 2016, to July 1, 2019.Source: Estimates by analyst
Da
yto
n,
OH
• C
OM
PR
EH
EN
SIV
E H
OU
SIN
G M
AR
KE
T A
NA
LYS
IS
2Economic Conditions
The Dayton HMA is known as the birthplace of aviation
because the inventors of the first suc cessful airplane, Orville and Wilbur Wright, were from the city of Dayton. In addition, the National Museum of the US Air Force, located at Wright-Patterson AFB, is the oldest and larg est military aviation museum in the world, attracts about 1 million visitors a year, and has an economic impact of approximately $40 million (Dayton Daily News). Historical origins in aviation support Dayton as a center for aerospace research and development in southwest Ohio. Wright-Patterson AFB, the largest employer in the HMA (Table 2) and the largest single-site employer in Ohio, employs 7,500 active military and 20,050 civilian employees. In
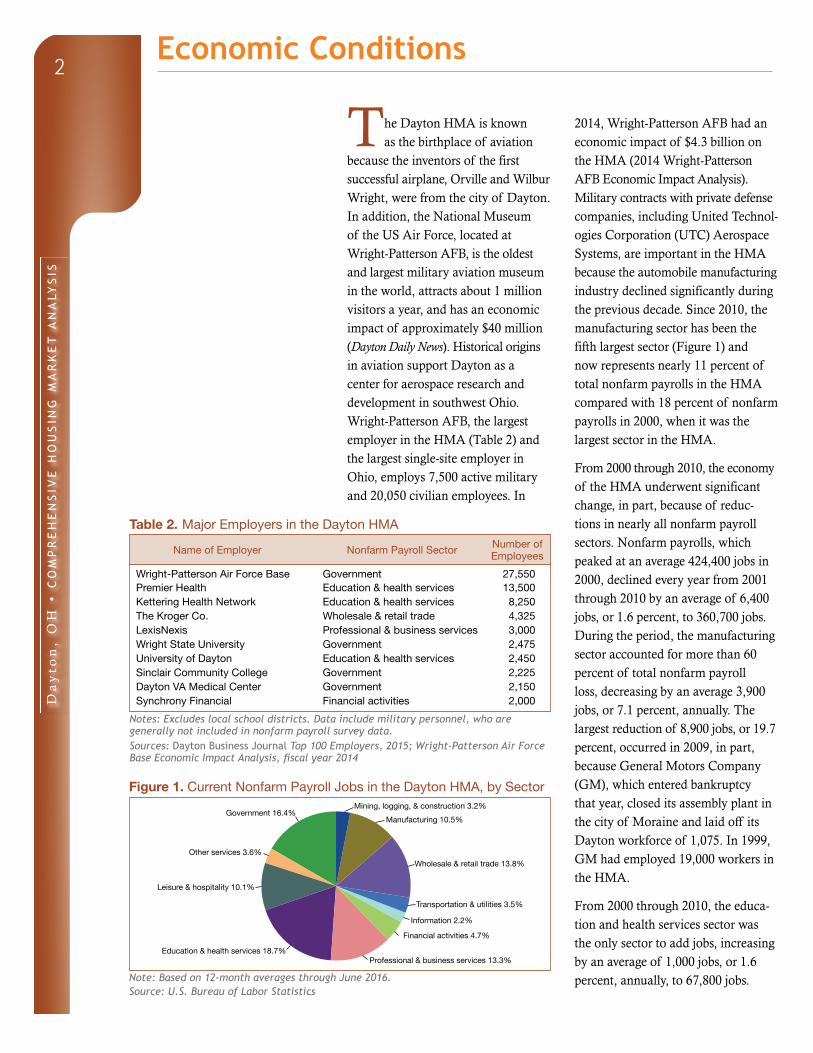
2014, Wright-Patterson AFB had an economic impact of $4.3 billion on the HMA (2014 Wright-Patterson AFB Economic Impact Analysis). Military contracts with private defense companies, including United Technol-ogies Corporation (UTC) Aerospace Systems, are important in the HMA because the automobile manufacturing industry declined significantly during the previous decade. Since 2010, the manufacturing sector has been the fifth largest sector (Figure 1) and now represents nearly 11 percent of total nonfarm payrolls in the HMA com pared with 18 percent of nonfarm payrolls in 2000, when it was the largest sector in the HMA.
From 2000 through 2010, the economy of the HMA underwent significant change, in part, because of reduc-tions in nearly all nonfarm payroll sectors. Nonfarm payrolls, which peaked at an average 424,400 jobs in 2000, declined every year from 2001 through 2010 by an average of 6,400 jobs, or 1.6 percent, to 360,700 jobs. During the period, the manufacturing sector accounted for more than 60 percent of total nonfarm payroll loss, decreasing by an average 3,900 jobs, or 7.1 percent, annually. The largest reduction of 8,900 jobs, or 19.7 percent, occurred in 2009, in part, because General Motors Company (GM), which entered bankruptcy that year, closed its assembly plant in the city of Moraine and laid off its Dayton workforce of 1,075. In 1999, GM had employed 19,000 workers in the HMA.
From 2000 through 2010, the educa-tion and health services sector was the only sector to add jobs, increasing by an average of 1,000 jobs, or 1.6 per cent, annually, to 67,800 jobs.
Table 2. Major Employers in the Dayton HMA
Name of Employer Nonfarm Payroll Sector Number of Employees
Wright-Patterson Air Force Base Government 27,550Premier Health Education & health services 13,500Kettering Health Network Education & health services 8,250The Kroger Co. Wholesale & retail trade 4,325LexisNexis Professional & business services 3,000Wright State University Government 2,475University of Dayton Education & health services 2,450Sinclair Community College Government 2,225Dayton VA Medical Center Government 2,150Synchrony Financial Financial activities 2,000
Notes: Excludes local school districts. Data include military personnel, who are generally not included in nonfarm payroll survey data.Sources: Dayton Business Journal Top 100 Employers, 2015; Wright-Patterson Air Force Base Economic Impact Analysis, fiscal year 2014
Figure 1. Current Nonfarm Payroll Jobs in the Dayton HMA, by Sector
Government 16.4%
Leisure & hospitality 10.1%
Other services 3.6%
Education & health services 18.7%Professional & business services 13.3%
Wholesale & retail trade 13.8%
Manufacturing 10.5%Mining, logging, & construction 3.2%
Information 2.2%
Transportation & utilities 3.5%
Financial activities 4.7%
Note: Based on 12-month averages through June 2016.Source: U.S. Bureau of Labor Statistics
Da
yto
n,
OH
• C
OM
PR
EH
EN
SIV
E H
OU
SIN
G M
AR
KE
T A
NA
LYS
IS
3
During the same time, the leisure and hospitality sector had no net change, because nearly all jobs gained from 2000 through 2006 were lost by 2010. Employment in the sector increased early in the 2000s, in part, because of the opening of Fifth Third Field in downtown Dayton, which hosts the Dayton Dragons, a minor league baseball team affiliated with the Cincinnati Reds. The stadium opened in 2000. In addition, the $121.9 mil-lion Benjamin and Marian Schuster Performing Arts Center, also in down town Dayton, opened in 2003. In 2013, the theater had an economic impact of $29.4 million (Victoria Theatre Association, 2016). Job losses in the manufacturing and the mining, logging, and construction sectors from 2000 through 2010 resulted in a shift from a goods-producing to a service-providing economy in the HMA. The education and health services sector rose from the fourth largest nonfarm payroll sector during 2000, representing more than 14 percent of nonfarm payrolls, to the largest sector since 2010, contributing
nearly 19 percent of jobs. More than 80 percent of the growth in the educa-tion and health services sector was in the healthcare and social assistance subsector. The HMA is home to the Dayton Children’s Hospital, Kettering Medical Center (Kettering Health Network), and the Miami Valley Hospital (Premier Health).
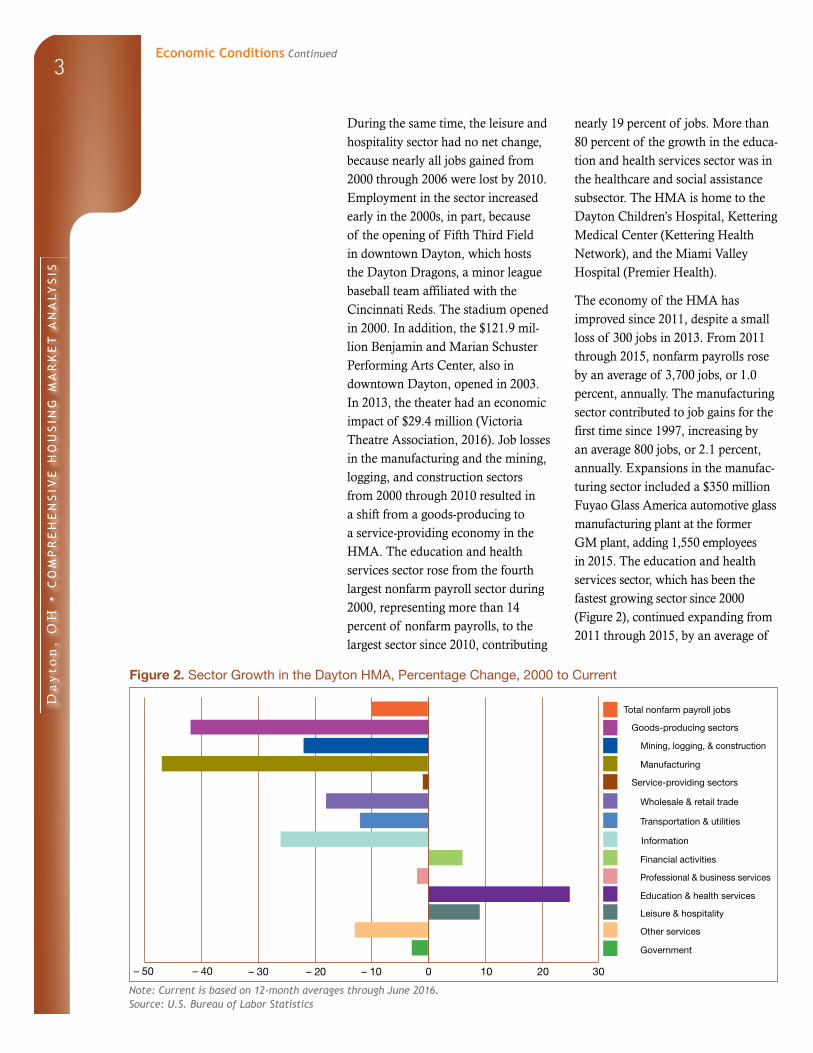
The economy of the HMA has improved since 2011, despite a small loss of 300 jobs in 2013. From 2011 through 2015, nonfarm payrolls rose by an average of 3,700 jobs, or 1.0 percent, annually. The manufacturing sector contributed to job gains for the first time since 1997, increasing by an average 800 jobs, or 2.1 percent, annually. Expansions in the manufac-turing sector included a $350 million Fuyao Glass America automotive glass manufacturing plant at the former GM plant, adding 1,550 employees in 2015. The education and health services sec tor, which has been the fastest grow ing sector since 2000 (Figure 2), continued expanding from 2011 through 2015, by an average of
Figure 2. Sector Growth in the Dayton HMA, Percentage Change, 2000 to Current
Total nonfarm payroll jobs
Goods-producing sectors
Mining, logging, & construction
Manufacturing
Service-providing sectors
Information
Financial activities
Professional & business services
Education & health services
Government
Other services
Leisure & hospitality
Transportation & utilities
Wholesale & retail trade
– 20 – 10 200 10– 30– 50 – 40 30
Note: Current is based on 12-month averages through June 2016.Source: U.S. Bureau of Labor Statistics
Economic Conditions Continued
Da
yto
n,
OH
• C
OM
PR
EH
EN
SIV
E H
OU
SIN
G M
AR
KE
T A
NA
LYS
IS
4
600 jobs, or 0.9 percent, a year. The sector was supported by job growth at Premier Health and Kettering Health Network, the second and third largest employers in the HMA, each with $1.78 and $1.41 billion in revenue in 2014, respectively (Dayton Business Journal).
During the 12 months ending June 2016, job growth in the HMA ac-celerated, increasing by 6,900 jobs, or 1.8 percent, to 382,700 (Table 3), but nonfarm payrolls are still 10 percent below peak employment in 2000. During the 12 months ending June 2016, the professional and business services and the education and health services sectors led job gains, which
rose by 1,500 and 1,300 jobs, or 3.0 and 1.8 percent, respectively, from the previous 12-month period. Together, those two sectors accounted for more than 40 percent of the increase in nonfarm payrolls. Recent gains in the education and health services sector included Premier Health, which opened a Clinical Neuroscience Institute in the spring of 2016 and is also currently investing $1 million in renovations in its headquarters building; jobs added at each project have not been announced. Growth also occurred during the 12 months ending June 2016 in the leisure and hospitality and the manufacturing sectors, increasing 900 and 800 jobs, or 2.4 and 2.0 percent, respectively.
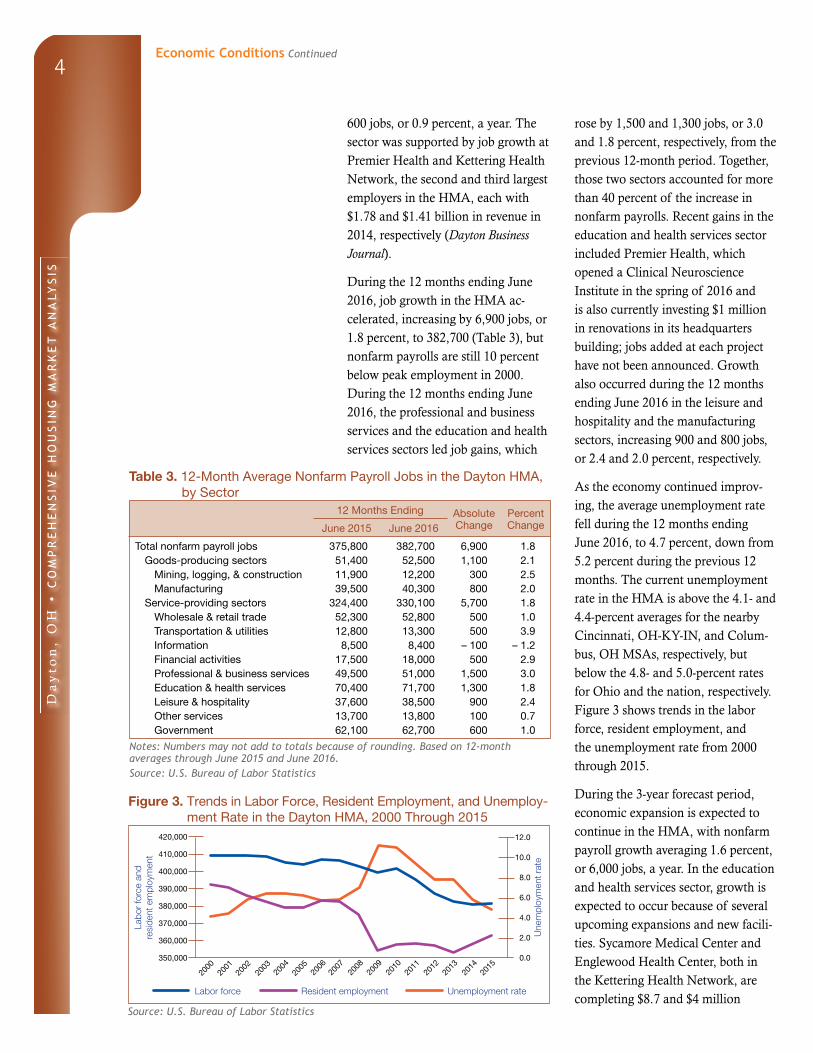
As the economy continued improv-ing, the average unemployment rate fell during the 12 months ending June 2016, to 4.7 percent, down from 5.2 percent during the previous 12 months. The current unemployment rate in the HMA is above the 4.1- and 4.4-percent averages for the nearby Cincinnati, OH-KY-IN, and Colum-bus, OH MSAs, respectively, but below the 4.8- and 5.0-percent rates for Ohio and the nation, respectively. Figure 3 shows trends in the labor force, resident employment, and the unemployment rate from 2000 through 2015.
During the 3-year forecast period, economic expansion is expected to continue in the HMA, with nonfarm payroll growth averaging 1.6 percent, or 6,000 jobs, a year. In the education and health services sector, growth is expected to occur because of several upcoming expansions and new facili-ties. Sycamore Medical Center and Englewood Health Center, both in the Kettering Health Network, are complet ing $8.7 and $4 million
Table 3. 12-Month Average Nonfarm Payroll Jobs in the Dayton HMA, by Sector
12 Months Ending Absolute Change
Percent ChangeJune 2015 June 2016
Total nonfarm payroll jobs 375,800 382,700 6,900 1.8Goods-producing sectors 51,400 52,500 1,100 2.1
Mining, logging, & construction 11,900 12,200 300 2.5Manufacturing 39,500 40,300 800 2.0
Service-providing sectors 324,400 330,100 5,700 1.8Wholesale & retail trade 52,300 52,800 500 1.0Transportation & utilities 12,800 13,300 500 3.9Information 8,500 8,400 – 100 – 1.2Financial activities 17,500 18,000 500 2.9Professional & business services 49,500 51,000 1,500 3.0Education & health services 70,400 71,700 1,300 1.8Leisure & hospitality 37,600 38,500 900 2.4Other services 13,700 13,800 100 0.7Government 62,100 62,700 600 1.0
Notes: Numbers may not add to totals because of rounding. Based on 12-month averages through June 2015 and June 2016.Source: U.S. Bureau of Labor Statistics
Figure 3. Trends in Labor Force, Resident Employment, and Unemploy-ment Rate in the Dayton HMA, 2000 Through 2015
Une
mpl
oym
ent r
ate
Labo
r fo
rce
and
resi
dent
em
ploy
men
t
420,000
410,000
400,000
390,000
380,000
370,000
360,000
350,000
2000
2002
2004
Labor force Resident employment Unemployment rate
12.0
10.0
8.0
6.0
4.0
2.0
0.0
2006
2001
2003
2005
2007
2009
2010
2008
2012
2013
2015
2014
2011
Source: U.S. Bureau of Labor Statistics
Economic Conditions Continued
Da
yto
n,
OH
• C
OM
PR
EH
EN
SIV
E H
OU
SIN
G M
AR
KE
T A
NA
LYS
IS
5
expansions, respectively; total jobs to be added have not been announced. A new $49 million cancer center at Kettering Medical Center is expected to open in 2017, adding 20 new jobs. In the manufacturing sector, UTC Aerospace Systems, is expected to add jobs because it is a supplier to Boeing Co., which was awarded a $2.8 billion military contract to pro-duce 179 refueling tankers. The first round of tankers is expected to enter service in 2017. Orbital ATK Inc., an American aerospace manufacturer, is planning a $6.5 million expansion, adding 68 new full-time employees to develop aerospace composite anten-nas, radomes, and other structures.
The project is expected to be complete within the next 3 years, adding $4.3 million in payrolls (Dayton Business Journal). Fuyao Glass America, which signed a lease for an additional 241,000 square feet at the former GM plant, plans to hire 500 additional employees by the end of 2016. The company plans to expand to 2,500 employees in the HMA in the next 5 to 10 years (Dayton Business Journal). In the leisure and hospitality sector, the seven-story, 115-room Fairfield Inn & Suites, near Fifth Third Field, is expected to open in the summer of 2017; total jobs to be added have yet to be announced. The hotel is the first built in downtown Dayton in decades.
Population and Households
The population of the Dayton HMA is estimated at 801,700
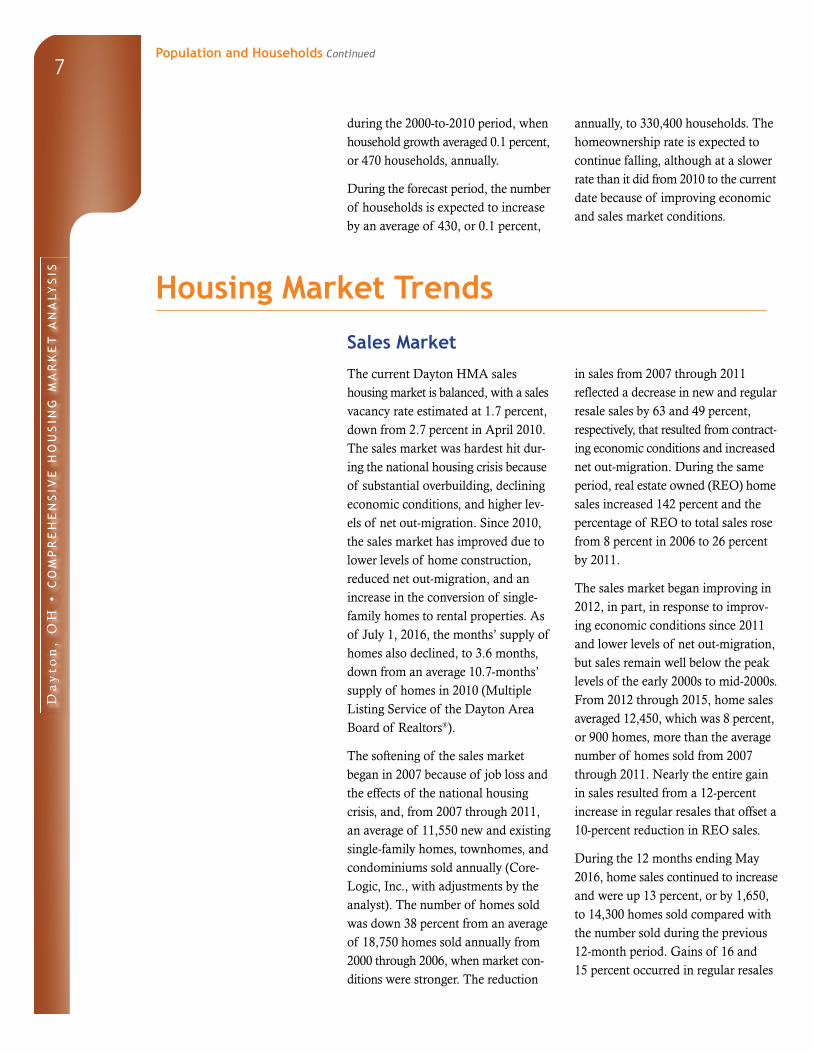
as of July 1, 2016, reflecting an annual increase of only 390 since 2010. The HMA has had net-out migration every year since 2000, making net natural change (resident births minus resident deaths) the only source of population growth. Despite the continued out- migration, the severity of it has varied annually based on economic expansion or contraction, changes in personnel at Wright-Patterson AFB, and student enrollment at several universities and colleges in the HMA.
From 2000 to 2004, a period when the local economy was contracting, the population of the HMA remained stable because an average net natural change of 2,750 annually offset an average net out-migration of 2,750 a year. From 2004 to 2009, when local
economic conditions were worsening, population loss averaging 1,400 people, or 0.2 percent, annually resulted from an acceleration in net out-migration that averaged 4,075 people annually coupled with slower net natural change that averaged 2,675 people a year. During that period, net out-migration, in general, was to Warren and Franklin Counties, which are part of the Cincin-nati and Columbus MSAs (Internal Revenue Service, County-to-County Migration Data) and where the rate of job loss was less pronounced and shorter lived than in the HMA. From 2004 to 2009, increased student en roll ment at local universities, averag-ing 140 students, or 3 percent, a year, slightly offset net out-migration.
From 2009 to 2012, net out-migration slowed because of an increase in jobs at Wright-Patterson AFB, an increase
Economic Conditions Continued
Da
yto
n,
OH
• C
OM
PR
EH
EN
SIV
E H
OU
SIN
G M
AR
KE
T A
NA
LYS
IS
6
that averaged 480 jobs, or 1.8 percent, annually as a result of the Base Closure and Realignment (BRAC) Commis-sion. Student enrollment, however, declined during that period by an av erage of 80 students, or 0.8 percent,
a year. From 2009 to 2012, net out- migration slowed to average 750 people annually, but net natural change in creased to average 1,875 people, result ing in a population growth aver aging 1,125 people, or 0.1 percent, annually. From 2012 to 2015, when the economy continued im prov ing, net out-migration averaged 1,900 people, leading to an overall reduction in the population that averaged 460, or 0.1 percent, annually, as net natural change decreased to average 1,450 people. Net out-migration from 2012 to 2015 is partly attributed to improving economic conditions in the Cin cin-nati and Columbus MSAs, both of which provide greater employment opportunities and higher wages, par - ticularly during economic expansions.
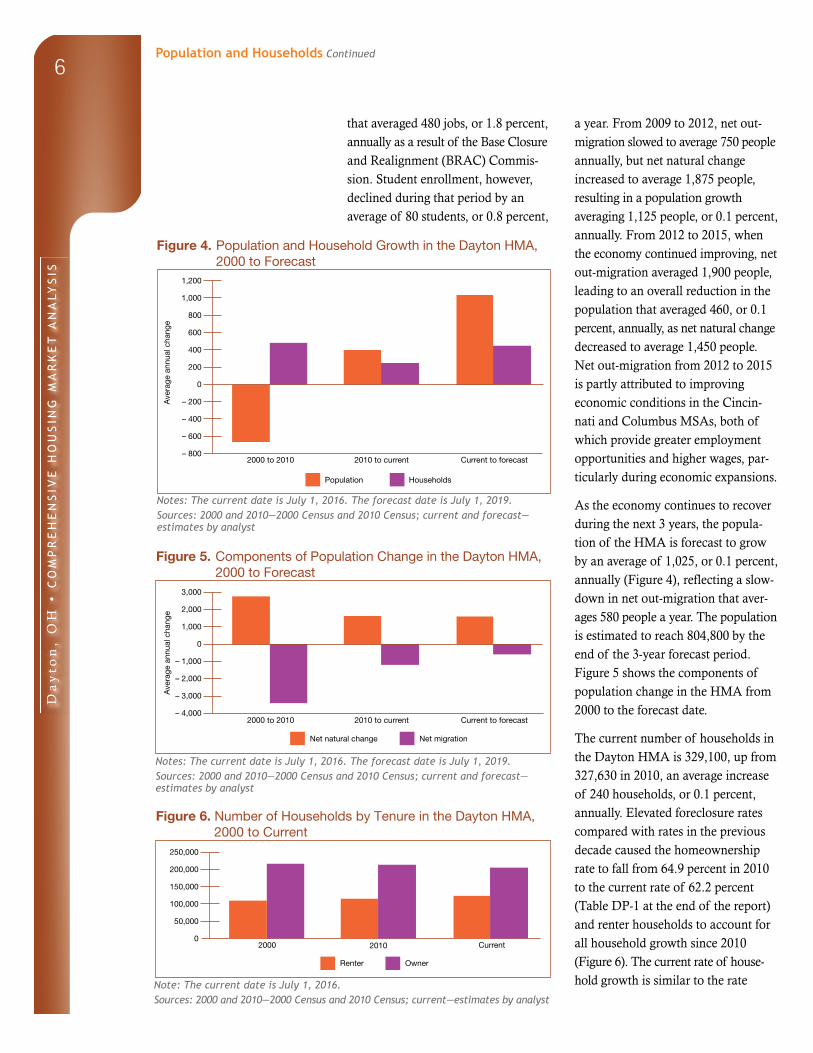
As the economy continues to recover during the next 3 years, the popula-tion of the HMA is forecast to grow by an average of 1,025, or 0.1 percent, annually (Figure 4), reflecting a slow - down in net out-migration that aver - ages 580 people a year. The population is estimated to reach 804,800 by the end of the 3-year forecast period. Figure 5 shows the components of population change in the HMA from 2000 to the forecast date.
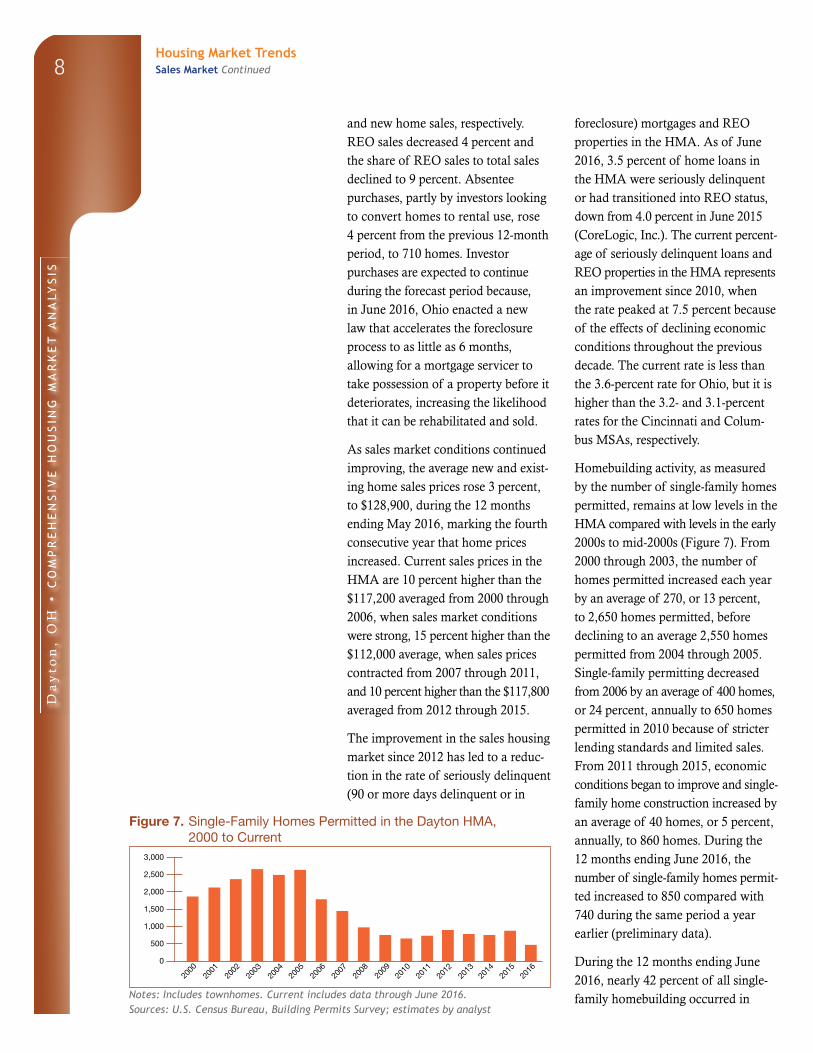
The current number of households in the Dayton HMA is 329,100, up from 327,630 in 2010, an average increase of 240 households, or 0.1 percent, annually. Elevated foreclosure rates compared with rates in the previous decade caused the homeownership rate to fall from 64.9 percent in 2010 to the current rate of 62.2 percent (Table DP-1 at the end of the report) and renter households to account for all household growth since 2010 (Figure 6). The current rate of house-hold growth is similar to the rate
Figure 4. Population and Household Growth in the Dayton HMA, 2000 to Forecast
Population Households
1,200
1,000
800
600
400
200
0
– 200
– 400
– 600
– 8002000 to 2010 2010 to current Current to forecast
Ave
rage
ann
ual c
hang
e
Notes: The current date is July 1, 2016. The forecast date is July 1, 2019.Sources: 2000 and 2010—2000 Census and 2010 Census; current and forecast—estimates by analyst
Figure 5. Components of Population Change in the Dayton HMA, 2000 to Forecast
3,000
2,000
1,000
0
– 1,000
– 2,000
– 3,000
– 4,0002000 to 2010 2010 to current Current to forecast
Ave
rage
ann
ual c
hang
e
Net natural change Net migration
Notes: The current date is July 1, 2016. The forecast date is July 1, 2019.Sources: 2000 and 2010—2000 Census and 2010 Census; current and forecast—estimates by analyst
Figure 6. Number of Households by Tenure in the Dayton HMA, 2000 to Current
2000 2010 Current
Renter Owner
250,000
200,000
150,000
100,000
50,000
0
Note: The current date is July 1, 2016.Sources: 2000 and 2010—2000 Census and 2010 Census; current—estimates by analyst
Population and Households Continued
Da
yto
n,
OH
• C
OM
PR
EH
EN
SIV
E H
OU
SIN
G M
AR
KE
T A
NA
LYS
IS
7
during the 2000-to-2010 period, when household growth averaged 0.1 percent, or 470 households, annually.
During the forecast period, the number of households is expected to increase by an average of 430, or 0.1 percent,
annually, to 330,400 households. The homeownership rate is expected to continue falling, although at a slower rate than it did from 2010 to the current date because of improving economic and sales market conditions.
Housing Market Trends
Sales Market
The current Dayton HMA sales hous ing market is balanced, with a sales vacancy rate estimated at 1.7 percent, down from 2.7 percent in April 2010. The sales market was hardest hit dur-ing the national housing crisis because of substantial overbuilding, declining economic conditions, and higher lev-els of net out-migration. Since 2010, the sales market has improved due to lower levels of home construction, reduced net out-migration, and an increase in the conversion of single-family homes to rental properties. As of July 1, 2016, the months’ supply of homes also declined, to 3.6 months, down from an average 10.7-months’ supply of homes in 2010 (Multiple Listing Service of the Dayton Area Board of Realtors®).
The softening of the sales market began in 2007 because of job loss and the effects of the national housing crisis, and, from 2007 through 2011, an average of 11,550 new and existing single-family homes, townhomes, and condominiums sold annually (Core-Logic, Inc., with adjustments by the analyst). The number of homes sold was down 38 percent from an average of 18,750 homes sold annually from 2000 through 2006, when market con-ditions were stronger. The reduction
in sales from 2007 through 2011 reflected a decrease in new and regular resale sales by 63 and 49 percent, respectively, that resulted from contract-ing economic conditions and increased net out-migration. During the same period, real estate owned (REO) home sales increased 142 percent and the percentage of REO to total sales rose from 8 percent in 2006 to 26 percent by 2011.
The sales market began improving in 2012, in part, in response to improv-ing economic conditions since 2011 and lower levels of net out-migration, but sales remain well below the peak levels of the early 2000s to mid-2000s. From 2012 through 2015, home sales averaged 12,450, which was 8 percent, or 900 homes, more than the average number of homes sold from 2007 through 2011. Nearly the entire gain in sales resulted from a 12-percent increase in regular resales that offset a 10-percent reduction in REO sales.
During the 12 months ending May 2016, home sales continued to increase and were up 13 percent, or by 1,650, to 14,300 homes sold compared with the number sold during the previous 12-month period. Gains of 16 and 15 percent occurred in regular resales
Population and Households Continued
Da
yto
n,
OH
• C
OM
PR
EH
EN
SIV
E H
OU
SIN
G M
AR
KE
T A
NA
LYS
IS
8
and new home sales, respectively. REO sales decreased 4 percent and the share of REO sales to total sales declined to 9 percent. Absentee pur chases, partly by investors looking to convert homes to rental use, rose 4 percent from the previous 12-month period, to 710 homes. Investor purchases are expected to continue during the forecast period because, in June 2016, Ohio enacted a new law that accelerates the foreclosure process to as little as 6 months, allowing for a mortgage servicer to take possession of a property before it deteriorates, increasing the likelihood that it can be rehabilitated and sold.
As sales market conditions continued improving, the average new and exist-ing home sales prices rose 3 percent, to $128,900, during the 12 months ending May 2016, marking the fourth consecutive year that home prices increased. Current sales prices in the HMA are 10 percent higher than the $117,200 averaged from 2000 through 2006, when sales market conditions were strong, 15 percent higher than the $112,000 average, when sales prices contracted from 2007 through 2011, and 10 percent higher than the $117,800 averaged from 2012 through 2015.
The improvement in the sales housing market since 2012 has led to a reduc-tion in the rate of seriously delinquent (90 or more days delinquent or in
fore closure) mortgages and REO properties in the HMA. As of June 2016, 3.5 percent of home loans in the HMA were seriously delinquent or had transitioned into REO status, down from 4.0 percent in June 2015 (CoreLogic, Inc.). The current per cent-age of seriously delinquent loans and REO properties in the HMA represents an improvement since 2010, when the rate peaked at 7.5 percent because of the effects of declining economic conditions throughout the previous decade. The current rate is less than the 3.6-percent rate for Ohio, but it is higher than the 3.2- and 3.1-percent rates for the Cincinnati and Colum-bus MSAs, respectively.
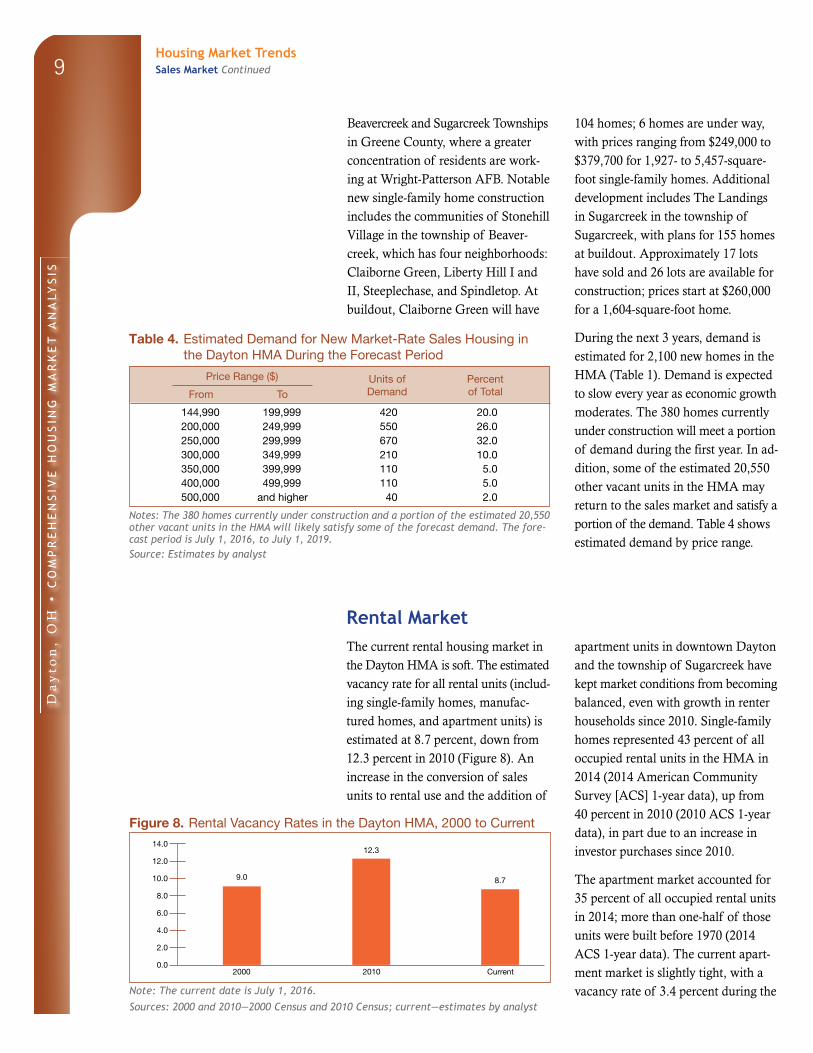
Homebuilding activity, as measured by the number of single-family homes permitted, remains at low levels in the HMA compared with levels in the early 2000s to mid-2000s (Figure 7). From 2000 through 2003, the number of homes permitted increased each year by an average of 270, or 13 percent, to 2,650 homes permitted, before declin ing to an average 2,550 homes per mit ted from 2004 through 2005. Single-family permitting decreased from 2006 by an average of 400 homes, or 24 percent, annually to 650 homes permitted in 2010 because of stricter lending standards and limited sales. From 2011 through 2015, economic conditions began to improve and single-family home construction increased by an average of 40 homes, or 5 per cent, annually, to 860 homes. During the 12 months ending June 2016, the number of single-family homes per mit-ted increased to 850 compared with 740 during the same period a year earlier (preliminary data).
During the 12 months ending June 2016, nearly 42 percent of all single- family homebuilding occurred in
Figure 7. Single-Family Homes Permitted in the Dayton HMA, 2000 to Current
2000
2001
2002
2003
2004
2005
2006
3,000
2,500
2,000
1,500
1,000
500
0
2008
2009
2010
2011
2013
2016
2015
2014
2012
2007
Notes: Includes townhomes. Current includes data through June 2016.Sources: U.S. Census Bureau, Building Permits Survey; estimates by analyst
Housing Market TrendsSales Market Continued
Da
yto
n,
OH
• C
OM
PR
EH
EN
SIV
E H
OU
SIN
G M
AR
KE
T A
NA
LYS
IS
9
Beavercreek and Sugarcreek Townships in Greene County, where a greater concentration of residents are work-ing at Wright-Patterson AFB. Notable new single-family home construction includes the communities of Stonehill Village in the township of Beaver-creek, which has four neighborhoods: Claiborne Green, Liberty Hill I and II, Steeplechase, and Spindletop. At buildout, Claiborne Green will have
104 homes; 6 homes are under way, with prices ranging from $249,000 to $379,700 for 1,927- to 5,457-square-foot single-family homes. Additional development includes The Landings in Sugarcreek in the township of Sugarcreek, with plans for 155 homes at buildout. Approximately 17 lots have sold and 26 lots are available for construction; prices start at $260,000 for a 1,604-square-foot home.
During the next 3 years, demand is estimated for 2,100 new homes in the HMA (Table 1). Demand is ex pected to slow every year as economic growth moderates. The 380 homes currently under construction will meet a portion of demand during the first year. In ad-dition, some of the estimated 20,550 other vacant units in the HMA may return to the sales market and satisfy a portion of the demand. Table 4 shows estimated demand by price range.
Table 4. Estimated Demand for New Market-Rate Sales Housing in the Dayton HMA During the Forecast Period
Price Range ($) Units of PercentFrom To Demand of Total
144,990 199,999 420 20.0200,000 249,999 550 26.0250,000 299,999 670 32.0300,000 349,999 210 10.0350,000 399,999 110 5.0400,000 499,999 110 5.0500,000 and higher 40 2.0
Notes: The 380 homes currently under construction and a portion of the estimated 20,550 other vacant units in the HMA will likely satisfy some of the forecast demand. The fore-cast period is July 1, 2016, to July 1, 2019.Source: Estimates by analyst
Rental MarketThe current rental housing market in the Dayton HMA is soft. The estimated vacancy rate for all rental units (includ-ing single-family homes, manufac-tured homes, and apartment units) is estimated at 8.7 percent, down from 12.3 percent in 2010 (Figure 8). An increase in the conversion of sales units to rental use and the addition of
apartment units in downtown Dayton and the township of Sugarcreek have kept market conditions from becoming balanced, even with growth in renter households since 2010. Single-family homes represented 43 percent of all occupied rental units in the HMA in 2014 (2014 American Community Survey [ACS] 1-year data), up from 40 percent in 2010 (2010 ACS 1-year data), in part due to an increase in investor purchases since 2010.
The apartment market accounted for 35 percent of all occupied rental units in 2014; more than one-half of those units were built before 1970 (2014 ACS 1-year data). The current apart-ment market is slightly tight, with a vacancy rate of 3.4 percent during the
Figure 8. Rental Vacancy Rates in the Dayton HMA, 2000 to Current
2000 Current2010
9.0 8.7
12.314.0
12.0
10.0
8.0
6.0
4.0
2.0
0.0
Note: The current date is July 1, 2016.
Sources: 2000 and 2010—2000 Census and 2010 Census; current—estimates by analyst
Housing Market TrendsSales Market Continued
Da
yto
n,
OH
• C
OM
PR
EH
EN
SIV
E H
OU
SIN
G M
AR
KE
T A
NA
LYS
IS
10
second quarter of 2016, down from 3.7 percent during the second quarter of 2015 and 6.9 percent in 2010 (Reis, Inc.). A high level of apartment construction from 2000 through 2005, coupled with higher net out-migration from the HMA, caused the market to soften between 2001 and 2010. In the second quarter of 2016, among the five Reis, Inc.-defined market areas that comprise the Dayton HMA, the Northwest and Central Dayton areas had apartment vacancy rates that ranged from 0.9 to 7.5 percent, respectively. The high vacancy rate in Central Dayton reflects the concentra-tion of older apartment inventory in that market area.
The average apartment rent in the HMA was $700 during the second quarter of 2016, up 2 percent from the second quarter of 2015 (Reis, Inc.), indicating an average annual increase of 2 percent from $630 in 2010. During the second quarter of 2016, studio apartment rents averaged $460, with one-, two-, and three-bedroom units averaging $590, $750, and $970, respectively. The average rent was lowest in Central Dayton, at $600, up 3 percent from the second quarter of 2015. The average rent in the Central Dayton area is expected
to rise during the next 3 years when 336 new apartment units under construction are complete.
Wright-Patterson AFB and the colleges and universities in the HMA significantly affect the rental market, together accounting for 10 percent of renter households. Wright-Patterson AFB offers on-base, dormitory-style accommodations for approximately 400 unaccompanied airmen and an additional 100 three- and four-bedroom homes for senior and general officers and their dependents. The AFB also provides around 1,525 privatized single-family and duplex-style rental units off base. An estimated 6,875 active-duty personnel reside off base, along with an estimated 13,100 depend-ents, occupying an estimated 5,700 rental units. Of the approximately 32,750 students that attend seven of Dayton’s colleges and universities (ex-cluding Sinclair Community College), 13,150 are housed in on-campus dorm itories or campus apartments. In August 2017, on-campus housing is expected to increase by 200 beds, when three projects totaling $11 million are complete at the University of Dayton. The remaining 19,600 stu dents who live off campus occupy an esti-mated 6,525 rental units. In the south and northeast areas of the HMA, where Wright-Patterson AFB and the large universities are located, apartment vacancy rates are among the lowest, at 1.1 and 3.5 percent, and average rents are among the highest, at $760 and $775, respectively.
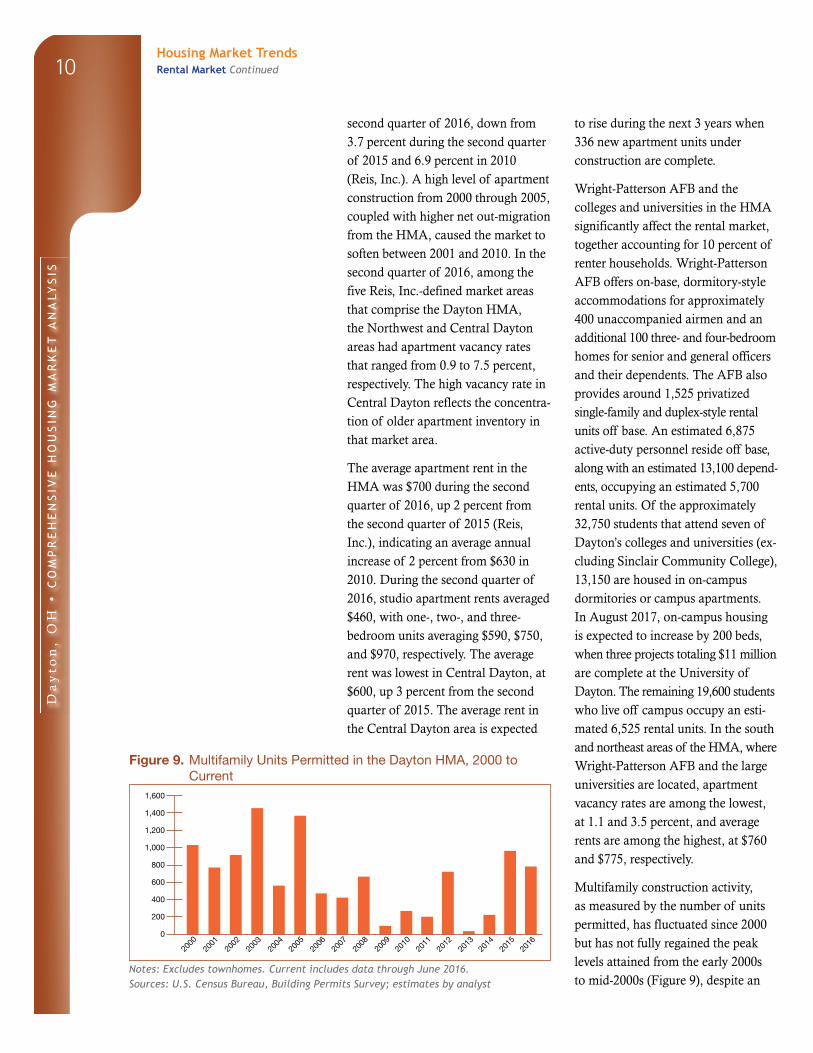
Multifamily construction activity, as measured by the number of units permitted, has fluctuated since 2000 but has not fully regained the peak levels attained from the early 2000s to mid-2000s (Figure 9), despite an
Figure 9. Multifamily Units Permitted in the Dayton HMA, 2000 to Current
2000
2001
2002
2003
2004
2005
2006
1,600
1,400
1,200
1,000
800
600
400
200
0
2008
2009
2010
2011
2013
2016
2015
2014
2012
2007
Notes: Excludes townhomes. Current includes data through June 2016.Sources: U.S. Census Bureau, Building Permits Survey; estimates by analyst
Housing Market TrendsRental Market Continued
Da
yto
n,
OH
• C
OM
PR
EH
EN
SIV
E H
OU
SIN
G M
AR
KE
T A
NA
LYS
IS
11
increase in the number of renter households. From 2000 through 2005, multifamily permitting averaged 1,000 units annually but slowed to average 350 units a year from 2006 through 2011. In 2012, the number of multi-family units permitted rose to 710 but fell to average 130 units a year from 2013 through 2014 before the number permitted increased to 960 units in 2015. During the 12 months ending June 2016, 360 multifamily units were permitted compared with 20 units during the previous 12 months (preliminary data). Approximately 15 percent of the multifamily units constructed since 2000 have been condominiums, a proportion that has remained fairly constant despite the contraction in the homeownership rate.
Recent apartment development in the HMA is concentrated in downtown Dayton and the township of Sugar-creek. In downtown Dayton, revital-ization since 2000 has sparked the recent redevelopment of warehouses into rental housing. Revitalization includes the Fifth Third Field and the Schuster Performing Arts Center (both previously mentioned) and RiverScape MetroPark, a public park along the Great Miami River. The $45 million, 215-unit Water Street Apartments along the riverfront is expected to be complete in September
2016. Rents for studio, one-bedroom, and two-bedroom units start at $805, $930, and $1,224, respectively. In addition, the Delco Lofts, a 132-unit warehouse conversion across the street from Fifth Third Field is currently under construction. The project is expected to be complete in the spring of 2017, but rents have yet to be an nounced. In the township of Sugar-creek, the Waterford at Sugarcreek, a $24 million, 231-unit apartment complex, is in the planning phase with 97 one-bedroom, 108 two-bedroom, and 26 three-bedroom units planned, ranging from 866 to 1,430 square feet and with rents expected to range from $1,080 to $1,590.
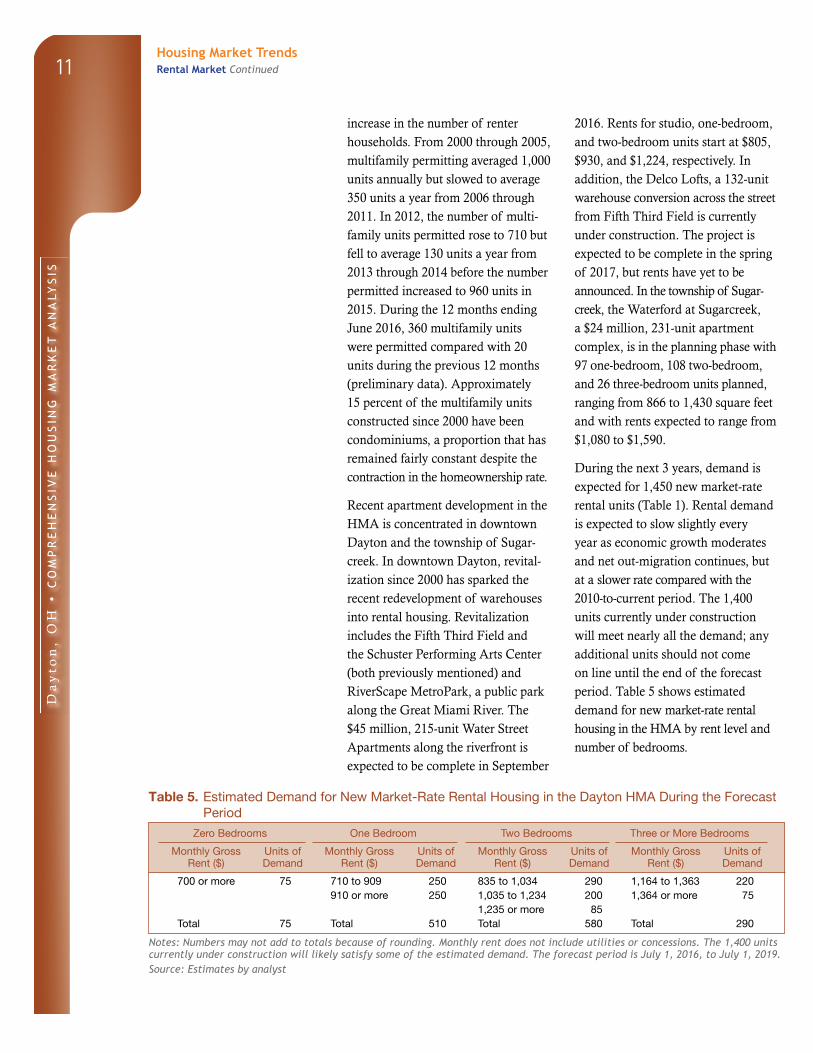
During the next 3 years, demand is expected for 1,450 new market-rate rental units (Table 1). Rental demand is expected to slow slightly every year as economic growth moderates and net out-migration continues, but at a slower rate compared with the 2010-to-current period. The 1,400 units currently under construction will meet nearly all the demand; any additional units should not come on line until the end of the forecast period. Table 5 shows estimated demand for new market-rate rental housing in the HMA by rent level and number of bedrooms.
Table 5. Estimated Demand for New Market-Rate Rental Housing in the Dayton HMA During the Forecast Period
Zero Bedrooms One Bedroom Two Bedrooms Three or More Bedrooms
Monthly Gross Rent ($)
Units of Demand
Monthly Gross Rent ($)
Units of Demand
Monthly Gross Rent ($)
Units of Demand
Monthly Gross Rent ($)
Units of Demand
700 or more 75 710 to 909 250 835 to 1,034 290 1,164 to 1,363 220910 or more 250 1,035 to 1,234 200 1,364 or more 75
1,235 or more 85Total 75 Total 510 Total 580 Total 290
Notes: Numbers may not add to totals because of rounding. Monthly rent does not include utilities or concessions. The 1,400 units currently under construction will likely satisfy some of the estimated demand. The forecast period is July 1, 2016, to July 1, 2019.Source: Estimates by analyst
Housing Market TrendsRental Market Continued
Da
yto
n,
OH
• C
OM
PR
EH
EN
SIV
E H
OU
SIN
G M
AR
KE
T A
NA
LYS
IS
12Data Profile
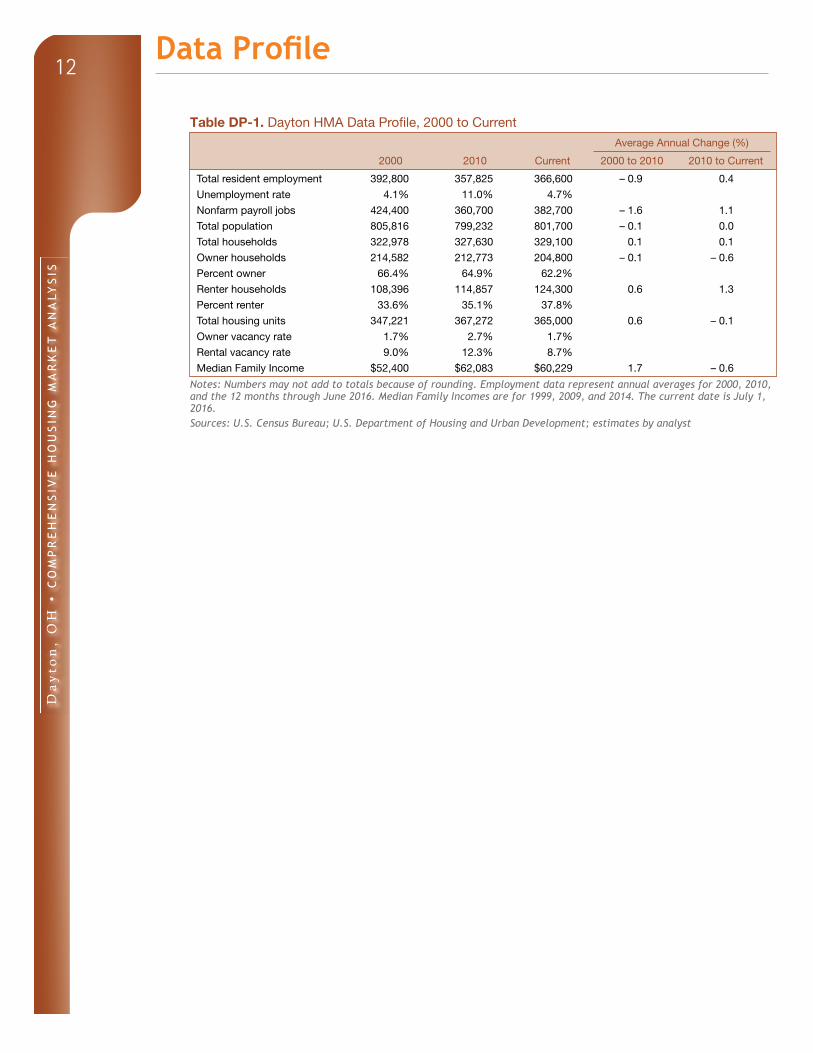
Table DP-1. Dayton HMA Data Profile, 2000 to Current
Average Annual Change (%)
2000 2010 Current 2000 to 2010 2010 to Current
Total resident employment 392,800 357,825 366,600 – 0.9 0.4
Unemployment rate 4.1% 11.0% 4.7%
Nonfarm payroll jobs 424,400 360,700 382,700 – 1.6 1.1
Total population 805,816 799,232 801,700 – 0.1 0.0
Total households 322,978 327,630 329,100 0.1 0.1
Owner households 214,582 212,773 204,800 – 0.1 – 0.6
Percent owner 66.4% 64.9% 62.2%
Renter households 108,396 114,857 124,300 0.6 1.3
Percent renter 33.6% 35.1% 37.8%
Total housing units 347,221 367,272 365,000 0.6 – 0.1
Owner vacancy rate 1.7% 2.7% 1.7%
Rental vacancy rate 9.0% 12.3% 8.7%
Median Family Income $52,400 $62,083 $60,229 1.7 – 0.6
Notes: Numbers may not add to totals because of rounding. Employment data represent annual averages for 2000, 2010, and the 12 months through June 2016. Median Family Incomes are for 1999, 2009, and 2014. The current date is July 1, 2016.Sources: U.S. Census Bureau; U.S. Department of Housing and Urban Development; estimates by analyst
Da
yto
n,
OH
• C
OM
PR
EH
EN
SIV
E H
OU
SIN
G M
AR
KE
T A
NA
LYS
IS
13
Data Definitions and Sources
2000: 4/1/2000—U.S. Decennial Census
2010: 4/1/2010—U.S. Decennial Census
Current date: 7/1/2016—Analyst’s estimates
Forecast period: 7/1/2016–7/1/2019—Analyst’s
estimates
The metropolitan statistical area definitions
in this report are based on the delineations
established by the Office of Management and
Budget (OMB) in the OMB Bulletin dated
February 28, 2013.
Demand: The demand estimates in the analysis
are not a forecast of building activity. They are
the estimates of the total housing production
needed to achieve a balanced market at the end
of the 3-year forecast period given conditions on
the as-of date of the analysis, growth, losses, and
excess vacancies. The estimates do not account
for units currently under construction or units in
the development pipeline.
Other Vacant Units: In the U.S. Department of
Housing and Urban Development’s (HUD’s)
analysis, other vacant units include all vacant
units that are not available for sale or for rent.
The term therefore includes units rented or sold
but not occupied; held for seasonal, recreational,
or occasional use; used by migrant workers; and
the category specified as “other” vacant by the
Census Bureau.
Building Permits: Building permits do not neces-
sarily reflect all residential building activity that
occurs in an HMA. Some units are constructed
or created without a building permit or are issued
a different type of building permit. For example,
some units classified as commercial structures are
not reflected in the residential building permits.
As a result, the analyst, through diligent fieldwork, makes
an estimate of this additional construction activity. Some
of these estimates are included in the discussions of
single-family and multifamily building permits.
For additional data pertaining to the housing market
for this HMA, go to huduser.gov/publications/pdf/
CMARtables_DaytonOH_17.pdf.
Contact Information
Diana Villavicencio, Economist
Chicago HUD Regional Office
312–913–8286
This analysis has been prepared for the assistance and
guidance of HUD in its operations. The factual informa-
tion, findings, and conclusions may also be useful to
builders, mortgagees, and others concerned with local
housing market conditions and trends. The analysis
does not purport to make determinations regarding the
acceptability of any mortgage insurance proposals that
may be under consideration by the Department.
The factual framework for this analysis follows the
guidelines and methods developed by HUD’s Economic
and Market Analysis Division. The analysis and findings
are as thorough and current as possible based on infor ma-
tion available on the as-of date from local and national
sources. As such, findings or conclusions may be modi fied
by subsequent developments. HUD expresses its ap-
preciation to those industry sources and state and local
government officials who provided data and information
on local economic and housing market conditions.
For additional reports on other market areas, please go to huduser.gov/portal/ushmc/chma_archive.html.