Embed Size (px)
Citation preview
Comprehensive Financial Plan
Prepared for
Richard and Linda Jones(Main Scenario)
December 12, 2005
Provided by
Piper Jaffray Financial Advisor
Piper Jaffray800 Nicollet Mall
Minneapolis, MN 55402
Disclosure
The following comprehensive analysis report has been prepared with information provided by you to guide youin selecting an appropriate asset allocation strategy. It may contain asset allocation models that reflect broadgeneralizations and are not intended as investment recommendations. Each of the allocation models representsone possible asset allocation strategy, which is based on responses to questions regarding personalcircumstances, financial goals and investment risk tolerance. The use of the terms financial forecast, expectedreturn, and risk (standard deviation) are not intended to be either an expressed or implied guarantee of actualperformance. Past performance does not guarantee future results.
An Asset Allocation Analysis is a tool that may assist you in determining if you have the right mix ofinvestments for your personal situation. Development of a personalized Asset Allocation Analysis is designedto assist you in positioning your assets based on your financial objectives, time horizons and risk tolerance. Thefollowing report is a hypothetical illustration using assumed rates of return that are based on information youhave provided to your advisor and from sources we believe to be reliable. Depicted rates of return are notrepresentative of the actual rate of return that you will experience with any particular insurance or financialproduct. This illustration is based on the concepts of Modern Portfolio Theory, which states that throughdiversification you may be able to minimize the effects of investment risks and that gains in one investmentclass may help offset losses in another. There is no certainty that any investment or strategy will be profitable orsuccessful in achieving your specific investment objectives. The illustrations shown should not be considered asa prediction of any investment results. Principal values of your investments will fluctuate and when redeemed,may be worth more or less than your original investment. Asset allocation does not ensure a profit or protectagainst losses in a declining market.
Asset mixes presented throughout this analysis are derived using available historical information for each assetclass based on the selected index for that class. They are meant only to illustrate the relative experience betweenasset classes and portfolios. Other asset classes and indices may have characteristics similar or superior to thosebeing analyzed here.
IMPORTANT: The projections or other information generated by AllocationMaster regarding the likelihood ofvarious investment outcomes are hypothetical in nature, do not reflect actual investment results and are notguarantees of future results. The results of this analysis may vary with each use and over time. Monte CarloSimulation is a mathematical model for computing the probability of an outcome by testing hundreds uponhundreds of possible results. Monte Carlo simulation takes into investment returns, volatility, correlations, andother factors, all based on historical statistical estimates. The simulation is created by running a large number ofprojections utilizing randomly selected rates of return to illustrate variable future economic conditions. Theprocess selects random rates of return for each year of each projection to simulate a large number of possiblefuture financial market environments. By using random rates from a statistically appropriate collection ofprobable returns, and repeating the process hundreds of times, the resulting projections can be viewed as arepresentative set of potential future results.
MUTUAL FUNDS, UNIT INVESTMENT TRUSTS OR VARIABLE ANNUITIES
If any mutual fund, unit investment trust, or variable annuity is mentioned in this report, this report must bepreceded or accompanied by the investment product's current prospectus. The prospectus contains morecomplete information, including fees, expenses, investment objectives, and risks. Please read the prospectuscarefully before investing or sending money. Investment return and principal will fluctuate with marketconditions and you may have a gain or a loss when you sell the investment product(s).
ALTERNATIVE INVESTMENTS
Comprehensive Financial Plan Richard and Linda Jones
Prepared by Piper Jaffray Financial Advisor 2 Piper Jaffray

Alternative Investments such as fund of hedge funds, managed futures funds are intended only for investorswho meet certain minimum qualifications. Alternative Investments are allowed to use aggressive, complexstrategies, and they are not subject to the same regulatory requirements as other investments. They carry risksand concerns not always associated with other investments, including restricted liquidity, less regulatoryoversight, tax inefficiency, delays in distributing tax information and higher fees.
An investment in a hedge fund is speculative and involves a high degree of risk, which each investor mustcarefully consider. Returns generated from an investment in a hedge fund may not adequately compensateinvestors for the business and financial risks assumed. No assurance can be given that the hedge fund willachieve its investment objectives or avoid substantial losses including loss of all or a substantial amount of hisor her investment. Fund of hedge funds are subject to many market risks including market volatility fund ofhedge funds employ certain trading techniques, such as, the use of leveraging and other speculative investmentpractices that may increase the risk of investment loss. Other risks associated with fund of hedge fundsinvestments include, but are not limited to, the fact that fund of hedge funds:
Can be highly illiquid are not required to provide periodic pricing or valuation information to investors mayinvolve complex tax structures and delays in distributing important tax information are not subject to the sameregulatory requirements as mutual funds often charge higher fees and the high fees may offset the fund's tradingprofits may have a limited operating history can have performance that is volatile may have a fund managerwho has total trading authority over the fund and the use of a single adviser applying generally similar tradingprograms could mean a lack of diversification, and consequentially, higher risk may not have a secondarymarket for an investor's interest in the fund and none may be expected to develop may have restrictions ontransferring interests in the fund and may trade a substantial portion of their trades on foreign exchanges.
INDEX BENCHMARKS
Index benchmarks are provided for illustrative purposes only. Comparisons to benchmarks have limitationsbecause benchmarks have volatility and other material characteristics that may differ from the underlyinginvestment product they track. Benchmarks are not managed and you can not invest directly in an index.Because of these differences, benchmarks should not be relied upon as an accurate measure of comparison. Youcannot invest directly in these indices, which include no expenses or transaction charges.
You are under no obligation to act upon, or implement all or any portion of the guidance contained in thisreport. If you elect to act upon, or implement any of the guidance in this report, you are under no obligation toeffect any resulting transaction through or purchase any products or services from Piper Jaffray. To the extentthat you do implement in whole or in part any of the guidance in the report by executing transactions throughPiper Jaffray as a broker or purchasing other products or services offered by Piper Jaffray, a potential conflict ofinterest may arise between your interest and the interest of Piper Jaffray and its financial advisors. For example,in connection with any transactions that you may effect through Piper Jaffray or other products or services youmay purchase from Piper Jaffray, Piper Jaffray will collect asset-based fees, commissions, transaction fees,mark-ups and mark-downs, and receive other compensation. In addition, Piper Jaffray may be the investmentbanker or the company whose securities you purchase or sell or have a financial interest in products or servicesyou purchase. Piper Jaffray, in addition to acting as investment banking, acts as a market maker, which mayresult in Piper Jaffray's interests conflicting with your interests.
This report is not intended to offer tax or legal advice. There is no solicitation and no recommendation for anyaction based upon its results. The report is based on data obtained from sources we consider to be reliablehowever, it is not guaranteed as to accuracy and does not purport to be complete.
Piper Jaffray & Co. Since 1895. Member SIPC and NYSE.
Comprehensive Financial Plan Richard and Linda Jones
Prepared by Piper Jaffray Financial Advisor 3 Piper Jaffray
.
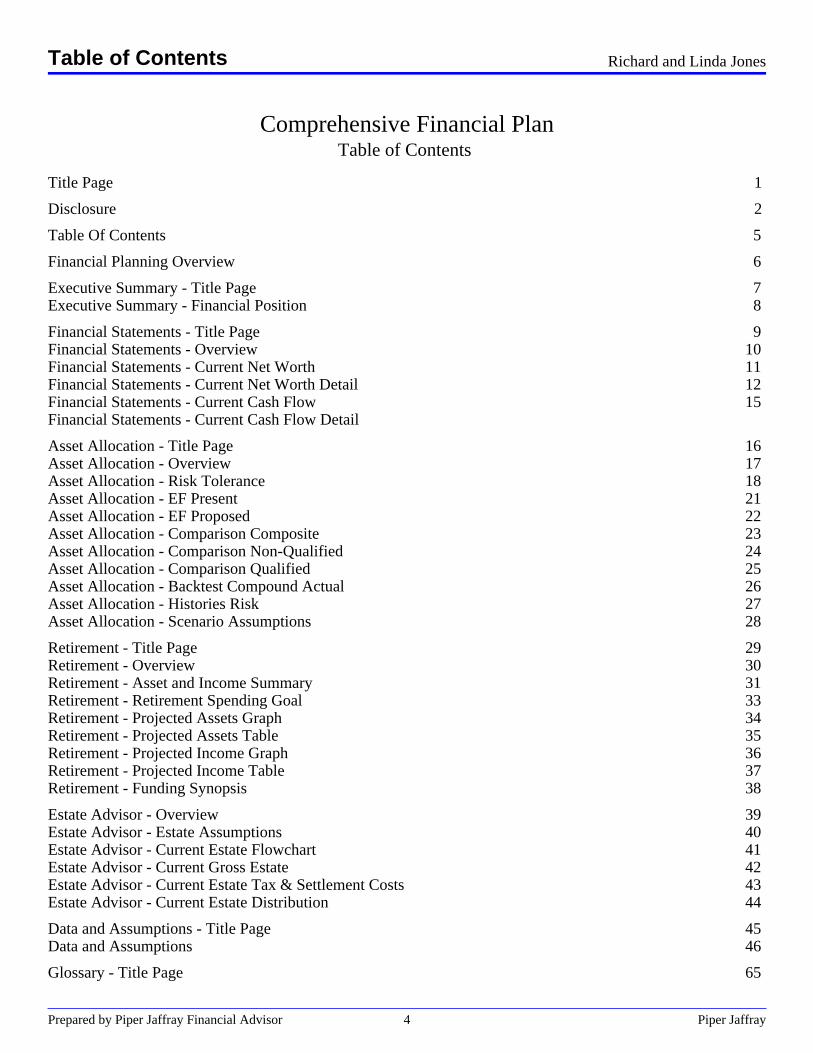
Comprehensive Financial PlanTable of Contents
Title Page 1. .
Disclosure 2. .
Table Of Contents 5. .
Financial Planning Overview 6. .
Executive Summary - Title Page 7Executive Summary - Financial Position 8. .
Financial Statements - Title Page 9Financial Statements - Overview 10Financial Statements - Current Net Worth 11Financial Statements - Current Net Worth Detail 12Financial Statements - Current Cash Flow 15Financial Statements - Current Cash Flow Detail. .
Asset Allocation - Title Page 16Asset Allocation - Overview 17Asset Allocation - Risk Tolerance 18Asset Allocation - EF Present 21Asset Allocation - EF Proposed 22Asset Allocation - Comparison Composite 23Asset Allocation - Comparison Non-Qualified 24Asset Allocation - Comparison Qualified 25Asset Allocation - Backtest Compound Actual 26Asset Allocation - Histories Risk 27Asset Allocation - Scenario Assumptions 28. .
Retirement - Title Page 29Retirement - Overview 30Retirement - Asset and Income Summary 31Retirement - Retirement Spending Goal 33Retirement - Projected Assets Graph 34Retirement - Projected Assets Table 35Retirement - Projected Income Graph 36Retirement - Projected Income Table 37Retirement - Funding Synopsis 38. .
Estate Advisor - Overview 39Estate Advisor - Estate Assumptions 40Estate Advisor - Current Estate Flowchart 41Estate Advisor - Current Gross Estate 42Estate Advisor - Current Estate Tax & Settlement Costs 43Estate Advisor - Current Estate Distribution 44. .
Data and Assumptions - Title Page 45Data and Assumptions 46. .
Glossary - Title Page 65
Table of Contents Richard and Linda Jones
Prepared by Piper Jaffray Financial Advisor 4 Piper Jaffray

Glossary - Asset Allocation 66Glossary - Accumulation 68Glossary - Financial Statements 70Glossary - Retirement 72Glossary - Estate 74. .
Notes 76
Table of Contents Richard and Linda Jones
Prepared by Piper Jaffray Financial Advisor 5 Piper Jaffray

Your Personal Comprehensive Financial Plan
This comprehensive financial plan has been prepared specifically for you using your current financial data. Itspurpose is to help you establish and prioritize your financial goals and to help plan for future financial security.This plan compares your current financial situation to your projected needs in the following areas:
· Financial statements· Personal goal planning· Retirement planning· Portfolio analysis· Estate preservation planning
You can use this plan in several ways. First, you can use it to get an overall view of your present financialsituation: where you stand now. For example, this plan will show your estimated current income taxes andcash flows, and clearly state your balance sheet and estate positions.
Second, you can use the illustrated financial projections to gain an idea of how well your future financial needswill be covered. For example, this plan will project your retirement income based on your current preparationsand your future assumptions.
Third, you can explore and choose to implement the actions suggested in this plan to help improve your presentfinancial situation and your future financial situation.
Recommended Actions
This plan will introduce specific actions that could improve your financial situation. However, the actions thatmay help you now may not be the same actions that you should take a year from now. Changes in your lifesituation may change recommended actions, particularly if changes are experienced in any of the followingareas:
· Your family· Your level of income or wealth· Your objectives· Tax laws and rulings· The economy
If changes are experienced in any of these areas, you should re-evaluate your financial plan. Implementing yourrecommended plan of action can help you on the path to financial security.
Financial Planning Overview Richard and Linda Jones
Prepared by Piper Jaffray Financial Advisor 6 Piper Jaffray

.
Executive Summary
Prepared by Piper Jaffray Financial Advisor 7 Piper Jaffray
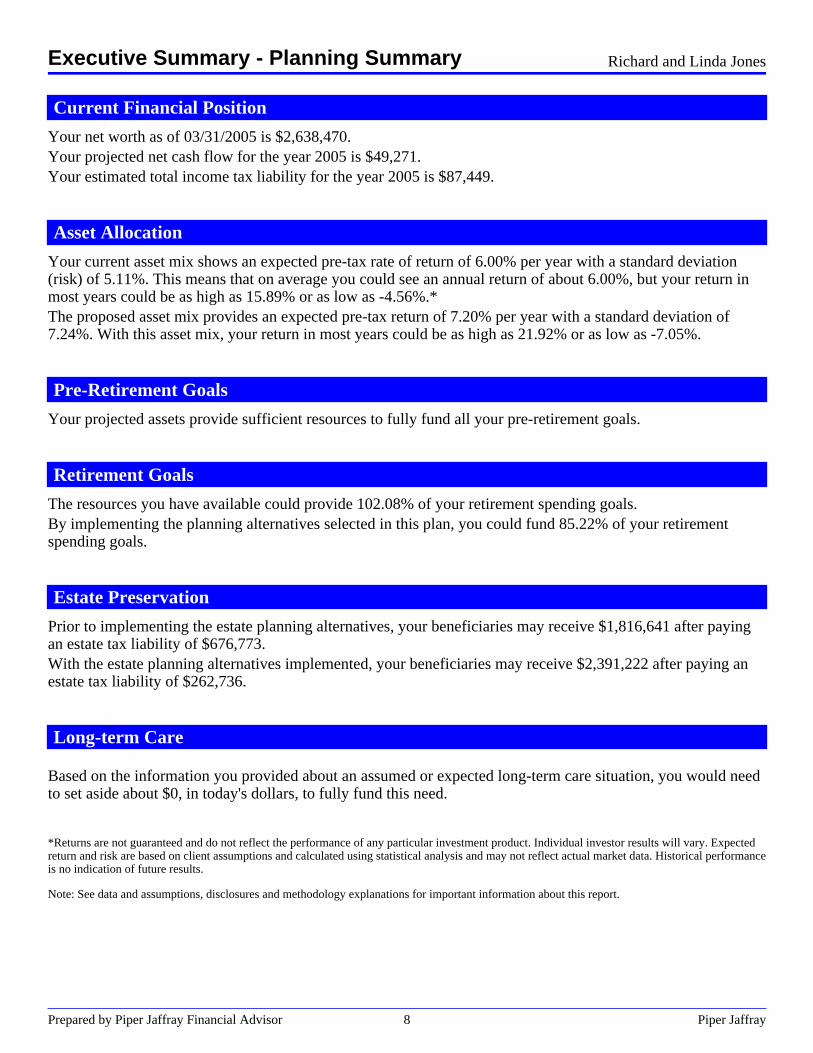
Current Financial Position
Your net worth as of 03/31/2005 is $2,638,470.Your projected net cash flow for the year 2005 is $49,271.Your estimated total income tax liability for the year 2005 is $87,449.
Asset Allocation
Your current asset mix shows an expected pre-tax rate of return of 6.00% per year with a standard deviation(risk) of 5.11%. This means that on average you could see an annual return of about 6.00%, but your return inmost years could be as high as 15.89% or as low as -4.56%.*The proposed asset mix provides an expected pre-tax return of 7.20% per year with a standard deviation of7.24%. With this asset mix, your return in most years could be as high as 21.92% or as low as -7.05%.
Pre-Retirement Goals
Your projected assets provide sufficient resources to fully fund all your pre-retirement goals.
Retirement Goals
The resources you have available could provide 102.08% of your retirement spending goals.By implementing the planning alternatives selected in this plan, you could fund 85.22% of your retirementspending goals.
Estate Preservation
Prior to implementing the estate planning alternatives, your beneficiaries may receive $1,816,641 after payingan estate tax liability of $676,773.With the estate planning alternatives implemented, your beneficiaries may receive $2,391,222 after paying anestate tax liability of $262,736.
Long-term Care
Based on the information you provided about an assumed or expected long-term care situation, you would needto set aside about $0, in today's dollars, to fully fund this need.
*Returns are not guaranteed and do not reflect the performance of any particular investment product. Individual investor results will vary. Expectedreturn and risk are based on client assumptions and calculated using statistical analysis and may not reflect actual market data. Historical performanceis no indication of future results.
Note: See data and assumptions, disclosures and methodology explanations for important information about this report.
Executive Summary - Planning Summary Richard and Linda Jones
Prepared by Piper Jaffray Financial Advisor 8 Piper Jaffray

.
Financial Statements
Prepared by Piper Jaffray Financial Advisor 9 Piper Jaffray
Financial Statements Introduction
A financial statement deals with cash management. Your access to cash influences your level of financialcomfort and the range of investment decisions that you can make. Personal financial statements help youcarefully manage your cash by providing a cash flow statement, and your assets and liabilities by providing anet worth statement. How you manage your cash, assets, and liabilities can largely determine whether you reachyour financial objectives. Monitoring your financial statements can help you achieve your financial goals.
This section of the report includes the following financial statements:
· Net worth statement· Insurance schedule· Current year cash flow statement· Income tax estimate with supporting statements· Pro forma financial statements
Financial Statements Defined
Net worth statement- A statement of net worth, which is sometimes called a balance sheet, provides anoverview of an individual's current financial situation. In this report, the Assets section represents what youcurrently own, stated at market values. The Liabilities section illustrates your current debt balances. The NetWorth section shows the approximate amount that would be left if you sold all your assets and paid off yourdebts. Your Net Worth Statement is an estimate of your current wealth. One of the main objectives of financialplanning is to increase your net worth.
Cash flow statement- A cash flow statement, which is sometimes called an income statement, summarizes anindividual's financial activity over a given period of time. The cash flow statement in this report tracks yourincome (cash inflows) and uses of cash (cash outflows) during the current year. The difference between theincome you receive and the cash you use is your net cash flow.
Income tax estimate- The income tax estimate included in this report is not a substitute for the advice of aqualified tax consultant. It is provided to give you a general idea of the portion of your income that goes toincome taxes. This report also includes schedules that will help you gain a general understanding of howincome taxes are estimated. The schedules include:· Schedule of capital gains and losses· Schedule of itemized deductions· Schedule of personal exemptions
Pro forma financial statements- Pro forma financial statements project an individual's current financialsituation for many years into the future. The statements in this report can help you estimate and then monitor thechanges in your wealth over your lifetime.
Benefits of Regular Review
Regular review of your personal financial statements can help you confirm that you are on track to achieve yourfinancial goals. Your cash flow statement will help you monitor your spending so you can make any neededadjustments in the future. The balance sheet helps you see how well you are working toward achieving yourobjectives.
Financial Statements Overview Richard and Linda Jones
Prepared by Piper Jaffray Financial Advisor 10 Piper Jaffray
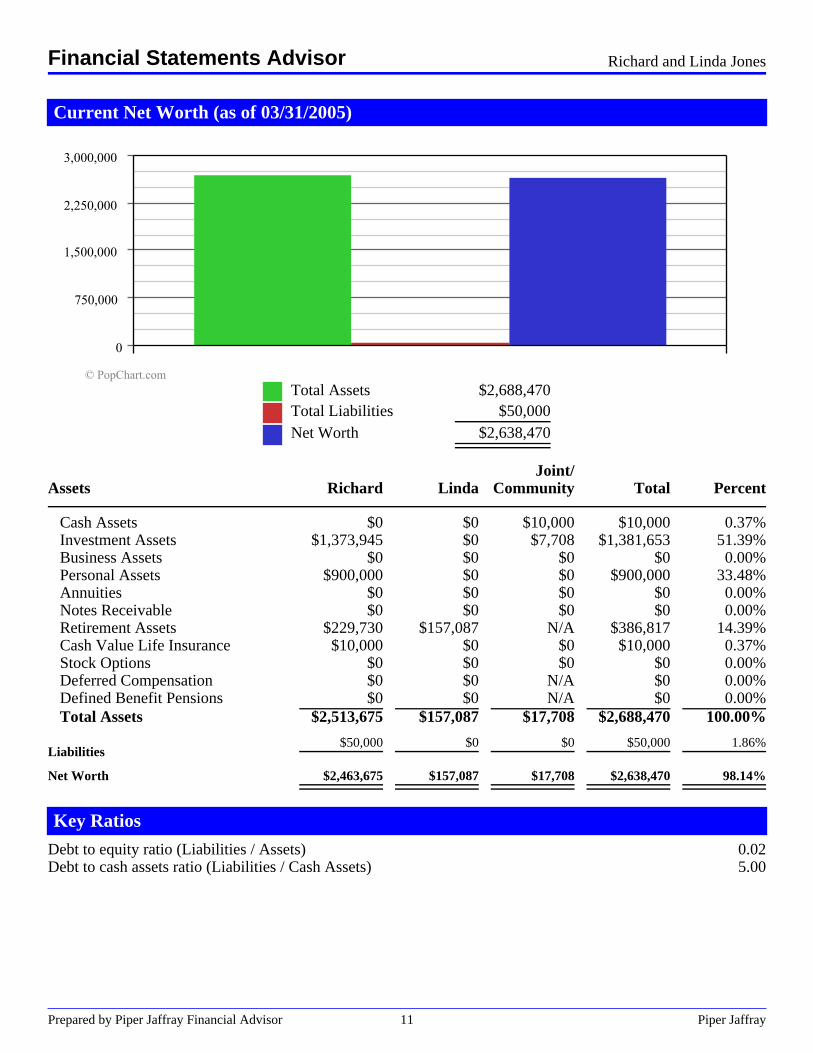
Current Net Worth (as of 03/31/2005)
.
. Total Assets $2,688,470..
. Total Liabilities $50,000.
. . Net Worth $2,638,470.
.
. Joint/ .Assets Richard Linda Community Total Percent.
Cash Assets $0 $0 $10,000 $10,000 0.37%Investment Assets $1,373,945 $0 $7,708 $1,381,653 51.39%Business Assets $0 $0 $0 $0 0.00%Personal Assets $900,000 $0 $0 $900,000 33.48%Annuities $0 $0 $0 $0 0.00%Notes Receivable $0 $0 $0 $0 0.00%Retirement Assets $229,730 $157,087 N/A $386,817 14.39%Cash Value Life Insurance $10,000 $0 $0 $10,000 0.37%Stock Options $0 $0 $0 $0 0.00%Deferred Compensation $0 $0 N/A $0 0.00%Defined Benefit Pensions . $0 . $0 . N/A . $0 . 0.00%Total Assets $2,513,675 $157,087 $17,708 $2,688,470 100.00%
Liabilities.
$50,000.
$0.
$0.
$50,000.
1.86%
Net Worth.
$2,463,675.
$157,087.
$17,708.
$2,638,470.
98.14%. .
.
.
.
.
.
.
.
.
.
Key Ratios
Debt to equity ratio (Liabilities / Assets) 0.02Debt to cash assets ratio (Liabilities / Cash Assets) 5.00
Financial Statements Advisor Richard and Linda Jones
Prepared by Piper Jaffray Financial Advisor 11 Piper Jaffray

Current Net Worth Detail (as of 03/31/2005).
. . . . . .
Cash Assets.
Description Value Basis Ownerche cking $10,000 $10,000 JTWROSTotal $10,000 $10,000
.
Investment Assets.
Description Value Basis OwnerCASH $5,000 $5,000 ClientALLIED HEALTHCARE PRODS INC $10,000 $10,000 ClientMEDTRONIC INC $10,000 $10,000 Client
$100,000 $100,000 ClientCASH $250,000 $250,000 Client
$10,000 $10,000 ClientATT CORP $5,000 $5,000 ClientGROWTH FD OF AMERICA $75,000 $75,000 ClientCASH $7,708 $7,708 JTWROSAUSTIN MN 5.25 100114 $52,146 $50,000 ClientMN ST HSG 3.25 070111 $48,344 $50,433 ClientMN ST HI ED 4.375 100117 $24,516 $25,000 ClientMN ST REF UT 5.0 060108 $26,503 $25,260 ClientCASH $15,798 $15,798 ClientSTILLWTR MN 4.1 020112 $41,106 $40,000 ClientCFB CAPITAL IV PFD 7.6% $25,900 $25,000 ClientTODD MRRIS MN3.15 040112 $52,993 $55,632 ClientCHASKA MN 5.125 020107 $26,022 $25,179 ClientUST STRIP INT 0.0 081508 $74,171 $32,172 ClientCROW WING MN 2.0 020106 $49,732 $50,762 ClientUST STRIP INT 0.0 111506 $117,625 $62,688 ClientDULUTH MN 4.875 021533 $28,319 $29,428 ClientWATONWAN MN 5.75 020115 $26,220 $25,000 ClientFHLB BOND 2.125 090705 $99,550 $99,933 Client
$0 $0 ClientTARGET CORP $10,000 $10,000 Client
$50,000 $0 ClientIRA $90,000 $0 ClientDD $50,000 $50,000 ClientTotal $1,381,653 $1,144,993
.
Personal Assets.
Description Value Basis OwnerHOME $900,000 $500,000 ClientTotal $900,000 $500,000
.
Financial Statements Advisor Richard and Linda Jones
Prepared by Piper Jaffray Financial Advisor 12 Piper Jaffray
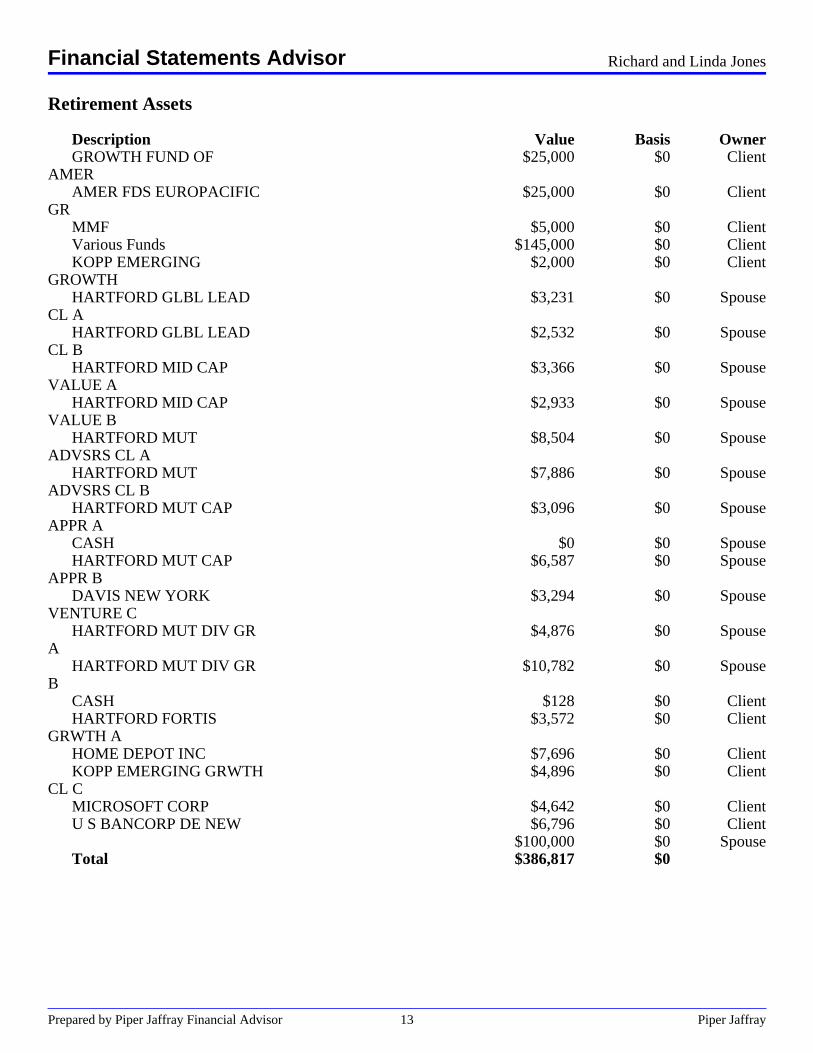
Retirement Assets.
Description Value Basis OwnerGROWTH FUND OF
AMER$25,000 $0 Client
AMER FDS EUROPACIFICGR
$25,000 $0 Client
MMF $5,000 $0 ClientVarious Funds $145,000 $0 ClientKOPP EMERGING
GROWTH$2,000 $0 Client
HARTFORD GLBL LEADCL A
$3,231 $0 Spouse
HARTFORD GLBL LEADCL B
$2,532 $0 Spouse
HARTFORD MID CAPVALUE A
$3,366 $0 Spouse
HARTFORD MID CAPVALUE B
$2,933 $0 Spouse
HARTFORD MUTADVSRS CL A
$8,504 $0 Spouse
HARTFORD MUTADVSRS CL B
$7,886 $0 Spouse
HARTFORD MUT CAPAPPR A
$3,096 $0 Spouse
CASH $0 $0 SpouseHARTFORD MUT CAP
APPR B$6,587 $0 Spouse
DAVIS NEW YORKVENTURE C
$3,294 $0 Spouse
HARTFORD MUT DIV GRA
$4,876 $0 Spouse
HARTFORD MUT DIV GRB
$10,782 $0 Spouse
CASH $128 $0 ClientHARTFORD FORTIS
GRWTH A$3,572 $0 Client
HOME DEPOT INC $7,696 $0 ClientKOPP EMERGING GRWTH
CL C$4,896 $0 Client
MICROSOFT CORP $4,642 $0 ClientU S BANCORP DE NEW $6,796 $0 Client
$100,000 $0 SpouseTotal $386,817 $0
.
Financial Statements Advisor Richard and Linda Jones
Prepared by Piper Jaffray Financial Advisor 13 Piper Jaffray
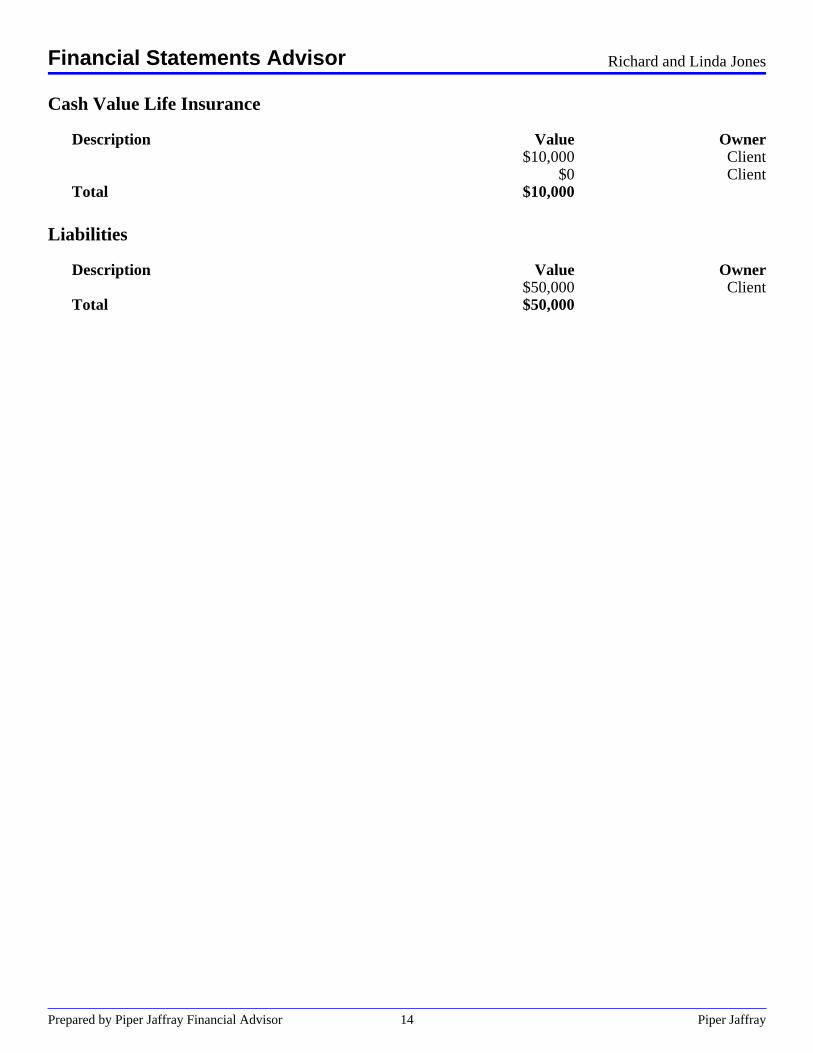
Cash Value Life Insurance.
Description Value Owner$10,000 Client
$0 ClientTotal $10,000
.
Liabilities.
Description Value Owner$50,000 Client
Total $50,000
Financial Statements Advisor Richard and Linda Jones
Prepared by Piper Jaffray Financial Advisor 14 Piper Jaffray
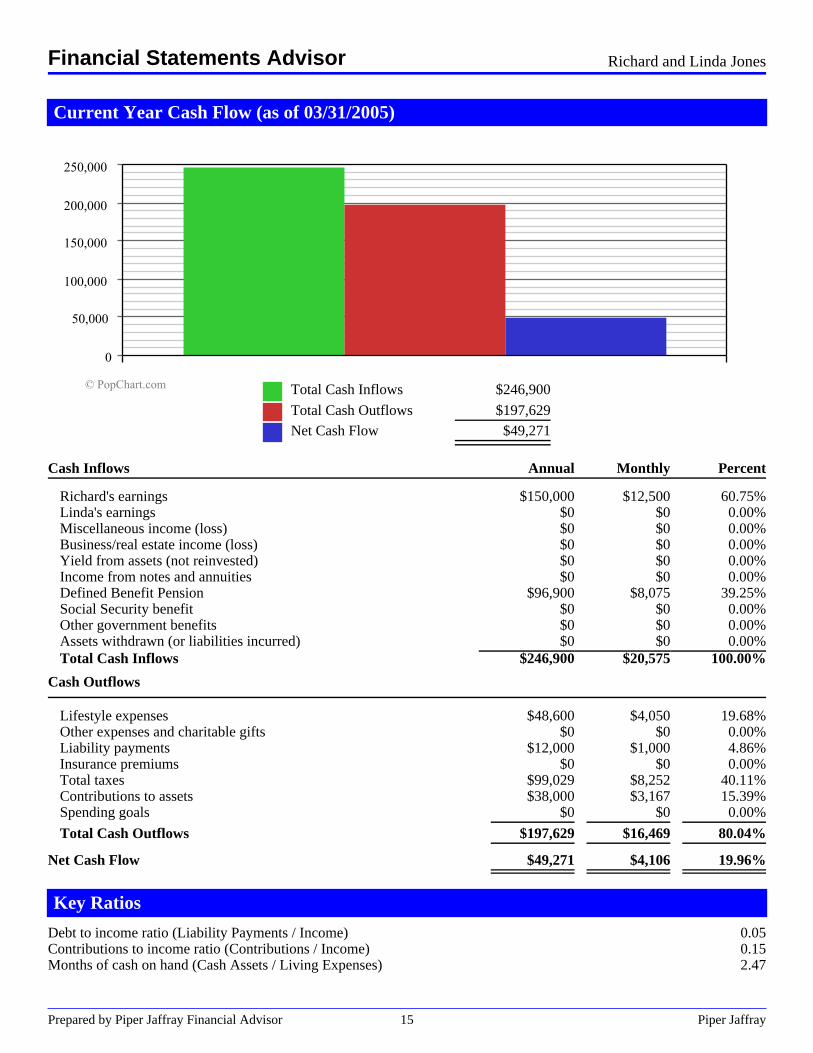
Current Year Cash Flow (as of 03/31/2005)
.
. Total Cash Inflows $246,900..
. Total Cash Outflows $197,629.
. . Net Cash Flow $49,271. .
Cash Inflows Annual Monthly Percent.
Richard's earnings $150,000 $12,500 60.75%Linda's earnings $0 $0 0.00%Miscellaneous income (loss) $0 $0 0.00%Business/real estate income (loss) $0 $0 0.00%Yield from assets (not reinvested) $0 $0 0.00%Income from notes and annuities $0 $0 0.00%Defined Benefit Pension $96,900 $8,075 39.25%Social Security benefit $0 $0 0.00%Other government benefits $0 $0 0.00%Assets withdrawn (or liabilities incurred) $0 $0 0.00%Total Cash Inflows $246,900 $20,575 100.00%
Cash Outflows . . ..
Lifestyle expenses $48,600 $4,050 19.68%Other expenses and charitable gifts $0 $0 0.00%Liability payments $12,000 $1,000 4.86%Insurance premiums $0 $0 0.00%Total taxes $99,029 $8,252 40.11%Contributions to assets $38,000 $3,167 15.39%Spending goals . $0 . $0 . 0.00%
Total Cash Outflows . $197,629 . $16,469 . 80.04%
Net Cash Flow.
$49,271.
$4,106.
19.96%. . . . . .
Key Ratios
Debt to income ratio (Liability Payments / Income) 0.05Contributions to income ratio (Contributions / Income) 0.15Months of cash on hand (Cash Assets / Living Expenses) 2.47
Financial Statements Advisor Richard and Linda Jones
Prepared by Piper Jaffray Financial Advisor 15 Piper Jaffray
.
Asset AllocationAnalysis
Prepared by Piper Jaffray Financial Advisor 16 Piper Jaffray

Allocating Your Portfolio
This report has been prepared to help you create an asset allocation plan specific to your situation. It can guideyou through the allocation process from defining your personal investment objectives to helping determine asuitable portfolio.
Your Recommended Allocation
The asset allocation plan presented in this report is based on the Nobel-prize winning concepts of ModernPortfolio Theory. This theory holds that you can minimize the effects of investment risk through intelligentdiversification. In a properly diversified portfolio, gains in one investment class may help offset losses inanother.
Remember that this asset allocation plan is designed to help you meet long-term investment objectives, whichare generally assumed to be five or more years in the future. Investing over extended periods of time allows youto assume a reasonable amount of risk with the expectation of higher returns and take advantage of themoderating effect of time on investment risk. In general, The longer an investment's time horizon, the morelikely the investment has the potential to earn a positive return.
Adherence to this asset allocation plan can play a key role in helping you achieve your financial objectives.Like any financial plan, it should be reviewed periodically.
Asset Allocation Analysis - Overview Richard and Linda Jones
Prepared by Piper Jaffray Financial Advisor 17 Piper Jaffray
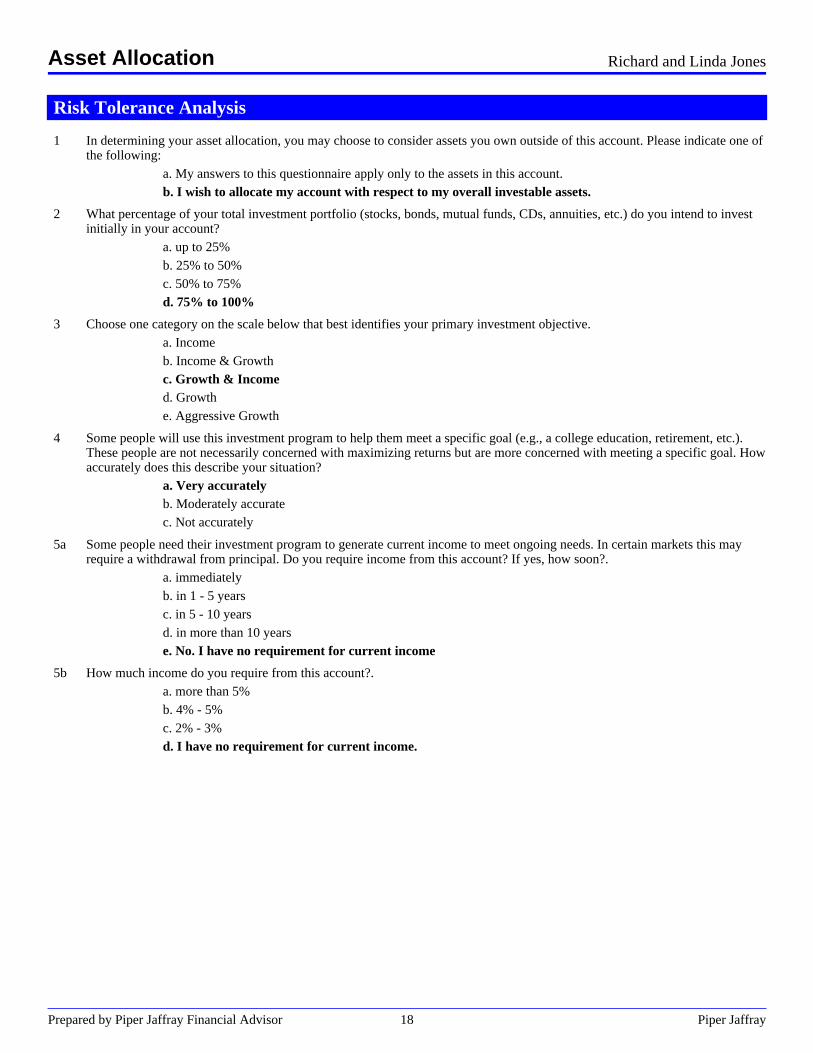
Risk Tolerance Analysis
1 In determining your asset allocation, you may choose to consider assets you own outside of this account. Please indicate one ofthe following:
a. My answers to this questionnaire apply only to the assets in this account.b. I wish to allocate my account with respect to my overall investable assets.
2 What percentage of your total investment portfolio (stocks, bonds, mutual funds, CDs, annuities, etc.) do you intend to investinitially in your account?
a. up to 25%b. 25% to 50%c. 50% to 75%d. 75% to 100%
3 Choose one category on the scale below that best identifies your primary investment objective.a. Incomeb. Income & Growthc. Growth & Incomed. Growthe. Aggressive Growth
4 Some people will use this investment program to help them meet a specific goal (e.g., a college education, retirement, etc.).These people are not necessarily concerned with maximizing returns but are more concerned with meeting a specific goal. Howaccurately does this describe your situation?
a. Very accuratelyb. Moderately accuratec. Not accurately
5a Some people need their investment program to generate current income to meet ongoing needs. In certain markets this mayrequire a withdrawal from principal. Do you require income from this account? If yes, how soon?.
a. immediatelyb. in 1 - 5 yearsc. in 5 - 10 yearsd. in more than 10 yearse. No. I have no requirement for current income
5b How much income do you require from this account?.a. more than 5%b. 4% - 5%c. 2% - 3%d. I have no requirement for current income.
Asset Allocation Richard and Linda Jones
Prepared by Piper Jaffray Financial Advisor 18 Piper Jaffray

6 Investing encourages you to consider your time horizon. Time is a key element in investment risk and reward. This isparticularly important when investing in stocks. History has shown that returns on stocks do not accrue evenly over time.Investment success cannot be measured over short time periods. Strategies must be given time to work. Investors have differenttime horizons. What is your time horizon for investing these assets (how long do you anticipate investing these assets)? (Note:If you choose a, stocks may not be an appropriate strategy.)
a. 0 - 3 yearsb. 3 - 5 yearsc. 5 - 10 yearsd. 10 - 15 yearse. more than 15 years
7 What is your attitude toward investment volatility with regard to this account? Remember, history has shown the returns of thevarious asset classes (e.g., stocks and bonds) fluctuate over time. That is why it is important to consider your time horizon aswell as your risk tolerance when investing.
a. I cannot accept any loss of principal at any time. Note: If you choose a, your risk tolerance is low and aportfolio consisting primarily of cash equivalents and short-term fixed-income securities will likely besuitable.b. I am more concerned with preserving my investment than maximizing investment gains. I can tolerateinfrequent and moderate negative returns.c. I understand that by pursuing higher returns, I may have to tolerate periods of longer, more frequent andgreater negative returns. However, I prefer risk of loss be limited to approximately that of commonly usedindices.d. My main concern is maximizing investment gains. I can tolerate risk of loss greater than that of commonlyused indices.
8 Assume you had a portfolio worth $100,000. What percentage decline could you endure in one year before you change yourinvestment strategy, such as selling your securities? ( Note: If you choose f, your risk tolerance is low and a portfolioconsisting primarily of cash equivalents and short-term fixed-income securities will likely be suitable)
a. 25% or larger decline (resulting in a portfolio value of $75,000 or less).b. 20 - 24% decline (resulting in a portfolio value between $76,000 - $80,000).c. 15 - 19% decline (resulting in a portfolio value between $81,000 - 85,000).d. 10 - 14% decline (resulting in a portfolio value between $86,000 - 90,000)e. 5 - 9% decline (resulting in a portfolio value between $91,000 - 95,000)f. 0 - 4% decline (resulting in a portfolio value greater than $96,000)
Asset Allocation Richard and Linda Jones
Prepared by Piper Jaffray Financial Advisor 19 Piper Jaffray
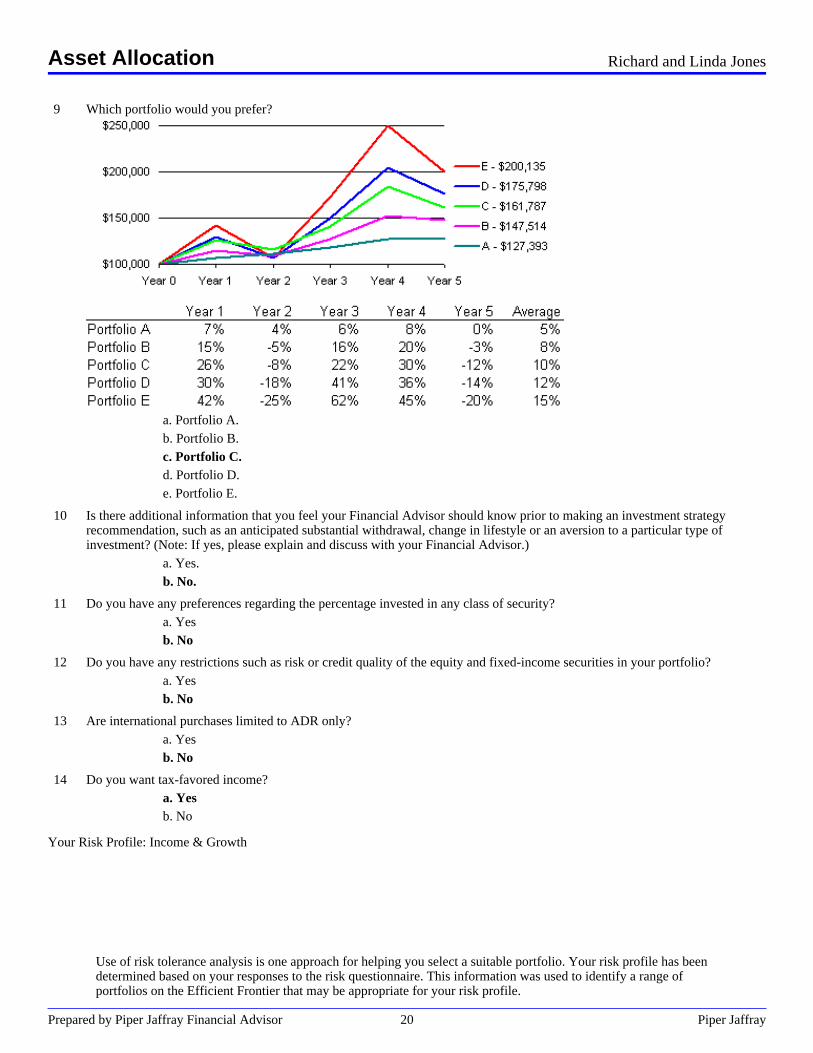
9 Which portfolio would you prefer?
a. Portfolio A.b. Portfolio B.c. Portfolio C.d. Portfolio D.e. Portfolio E.
10 Is there additional information that you feel your Financial Advisor should know prior to making an investment strategyrecommendation, such as an anticipated substantial withdrawal, change in lifestyle or an aversion to a particular type ofinvestment? (Note: If yes, please explain and discuss with your Financial Advisor.)
a. Yes.b. No.
11 Do you have any preferences regarding the percentage invested in any class of security?a. Yesb. No
12 Do you have any restrictions such as risk or credit quality of the equity and fixed-income securities in your portfolio?a. Yesb. No
13 Are international purchases limited to ADR only?a. Yesb. No
14 Do you want tax-favored income?a. Yesb. No
Your Risk Profile: Income & Growth
Use of risk tolerance analysis is one approach for helping you select a suitable portfolio. Your risk profile has beendetermined based on your responses to the risk questionnaire. This information was used to identify a range ofportfolios on the Efficient Frontier that may be appropriate for your risk profile.
Asset Allocation Richard and Linda Jones
Prepared by Piper Jaffray Financial Advisor 20 Piper Jaffray
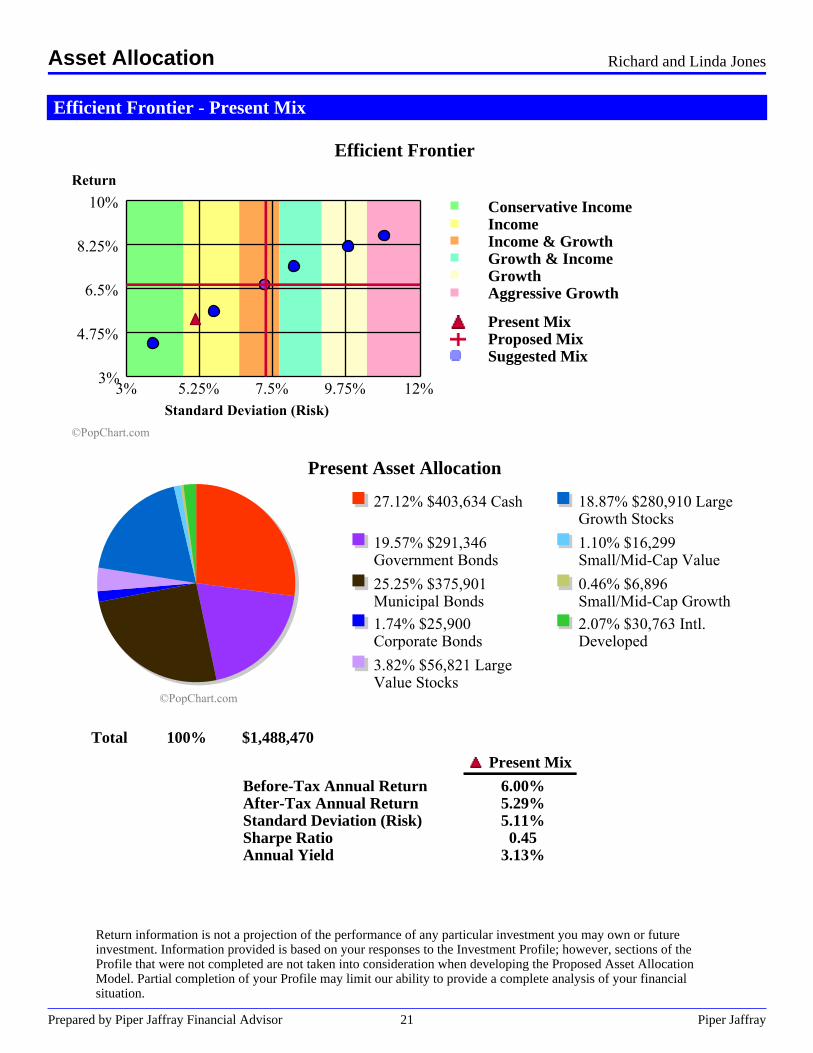
Efficient Frontier - Present Mix
Efficient Frontier
Conservative IncomeIncomeIncome & GrowthGrowth & IncomeGrowthAggressive Growth
Present MixProposed MixSuggested Mix
Present Asset Allocation
Total 100% $1,488,470
Present Mix
Before-Tax Annual Return 6.00%After-Tax Annual Return 5.29%Standard Deviation (Risk) 5.11%Sharpe Ratio 0.45Annual Yield 3.13%
Return information is not a projection of the performance of any particular investment you may own or futureinvestment. Information provided is based on your responses to the Investment Profile; however, sections of theProfile that were not completed are not taken into consideration when developing the Proposed Asset AllocationModel. Partial completion of your Profile may limit our ability to provide a complete analysis of your financialsituation.
Asset Allocation Richard and Linda Jones
Prepared by Piper Jaffray Financial Advisor 21 Piper Jaffray
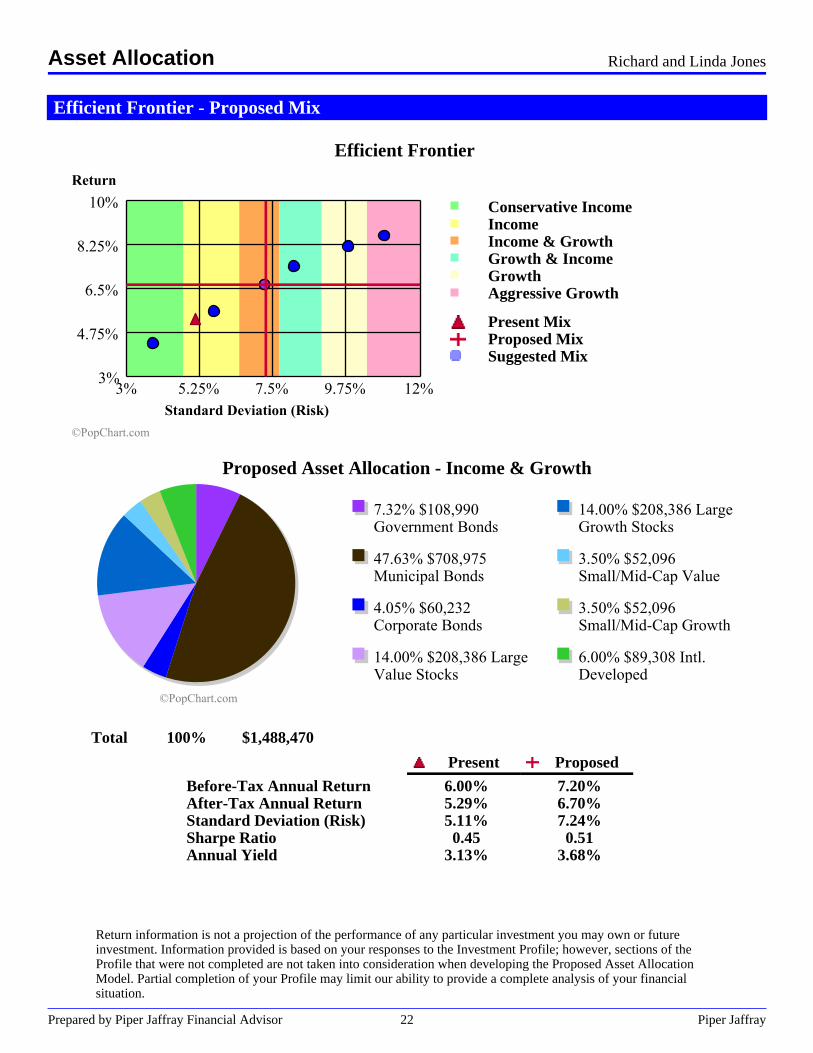
Efficient Frontier - Proposed Mix
Efficient Frontier
Conservative IncomeIncomeIncome & GrowthGrowth & IncomeGrowthAggressive Growth
Present MixProposed MixSuggested Mix
Proposed Asset Allocation - Income & Growth
Total 100% $1,488,470
Present Proposed
Before-Tax Annual Return 6.00% 7.20%After-Tax Annual Return 5.29% 6.70%Standard Deviation (Risk) 5.11% 7.24%Sharpe Ratio 0.45 0.51Annual Yield 3.13% 3.68%
Return information is not a projection of the performance of any particular investment you may own or futureinvestment. Information provided is based on your responses to the Investment Profile; however, sections of theProfile that were not completed are not taken into consideration when developing the Proposed Asset AllocationModel. Partial completion of your Profile may limit our ability to provide a complete analysis of your financialsituation.
Asset Allocation Richard and Linda Jones
Prepared by Piper Jaffray Financial Advisor 22 Piper Jaffray
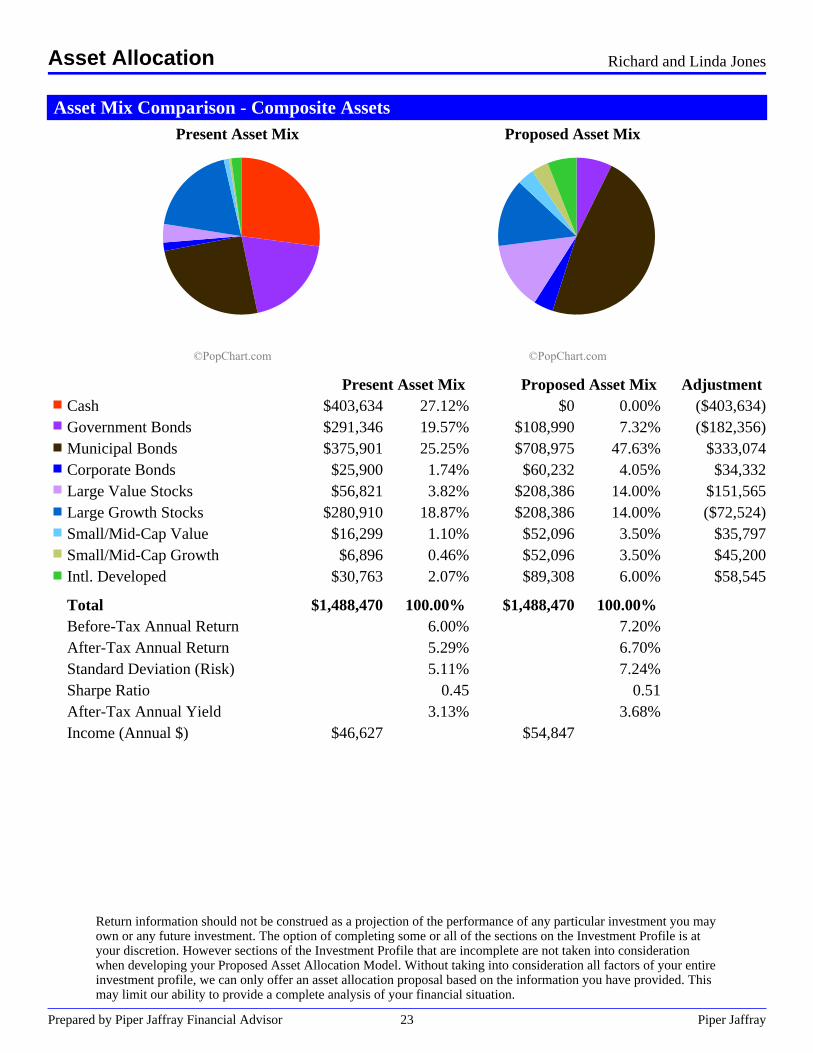
Asset Mix Comparison - Composite AssetsPresent Asset Mix Proposed Asset Mix
Present Asset Mix Proposed Asset Mix AdjustmentCash $403,634 27.12% $0 0.00% ($403,634)Government Bonds $291,346 19.57% $108,990 7.32% ($182,356)Municipal Bonds $375,901 25.25% $708,975 47.63% $333,074Corporate Bonds $25,900 1.74% $60,232 4.05% $34,332Large Value Stocks $56,821 3.82% $208,386 14.00% $151,565Large Growth Stocks $280,910 18.87% $208,386 14.00% ($72,524)Small/Mid-Cap Value $16,299 1.10% $52,096 3.50% $35,797Small/Mid-Cap Growth $6,896 0.46% $52,096 3.50% $45,200Intl. Developed $30,763 2.07% $89,308 6.00% $58,545
Total $1,488,470 100.00% $1,488,470 100.00%Before-Tax Annual Return 6.00% 7.20%After-Tax Annual Return 5.29% 6.70%Standard Deviation (Risk) 5.11% 7.24%Sharpe Ratio 0.45 0.51After-Tax Annual Yield 3.13% 3.68%Income (Annual $) $46,627 $54,847
Return information should not be construed as a projection of the performance of any particular investment you mayown or any future investment. The option of completing some or all of the sections on the Investment Profile is atyour discretion. However sections of the Investment Profile that are incomplete are not taken into considerationwhen developing your Proposed Asset Allocation Model. Without taking into consideration all factors of your entireinvestment profile, we can only offer an asset allocation proposal based on the information you have provided. Thismay limit our ability to provide a complete analysis of your financial situation.
Asset Allocation Richard and Linda Jones
Prepared by Piper Jaffray Financial Advisor 23 Piper Jaffray
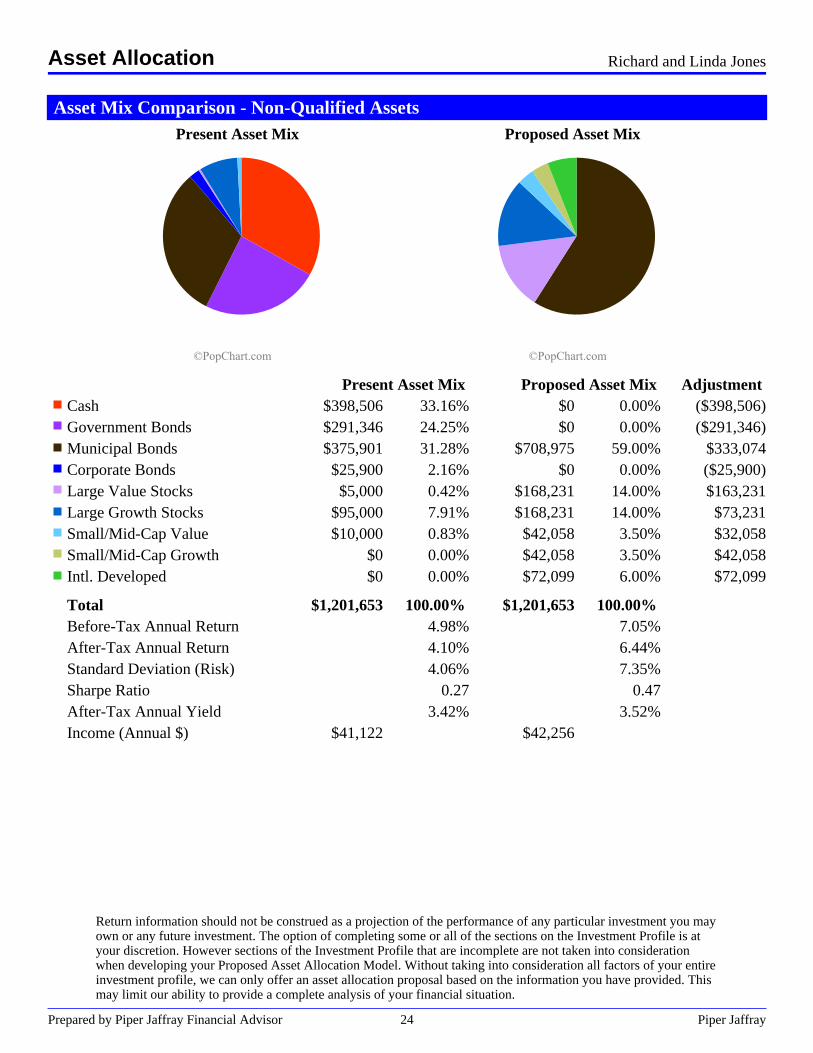
Asset Mix Comparison - Non-Qualified AssetsPresent Asset Mix Proposed Asset Mix
Present Asset Mix Proposed Asset Mix AdjustmentCash $398,506 33.16% $0 0.00% ($398,506)Government Bonds $291,346 24.25% $0 0.00% ($291,346)Municipal Bonds $375,901 31.28% $708,975 59.00% $333,074Corporate Bonds $25,900 2.16% $0 0.00% ($25,900)Large Value Stocks $5,000 0.42% $168,231 14.00% $163,231Large Growth Stocks $95,000 7.91% $168,231 14.00% $73,231Small/Mid-Cap Value $10,000 0.83% $42,058 3.50% $32,058Small/Mid-Cap Growth $0 0.00% $42,058 3.50% $42,058Intl. Developed $0 0.00% $72,099 6.00% $72,099
Total $1,201,653 100.00% $1,201,653 100.00%Before-Tax Annual Return 4.98% 7.05%After-Tax Annual Return 4.10% 6.44%Standard Deviation (Risk) 4.06% 7.35%Sharpe Ratio 0.27 0.47After-Tax Annual Yield 3.42% 3.52%Income (Annual $) $41,122 $42,256
Return information should not be construed as a projection of the performance of any particular investment you mayown or any future investment. The option of completing some or all of the sections on the Investment Profile is atyour discretion. However sections of the Investment Profile that are incomplete are not taken into considerationwhen developing your Proposed Asset Allocation Model. Without taking into consideration all factors of your entireinvestment profile, we can only offer an asset allocation proposal based on the information you have provided. Thismay limit our ability to provide a complete analysis of your financial situation.
Asset Allocation Richard and Linda Jones
Prepared by Piper Jaffray Financial Advisor 24 Piper Jaffray
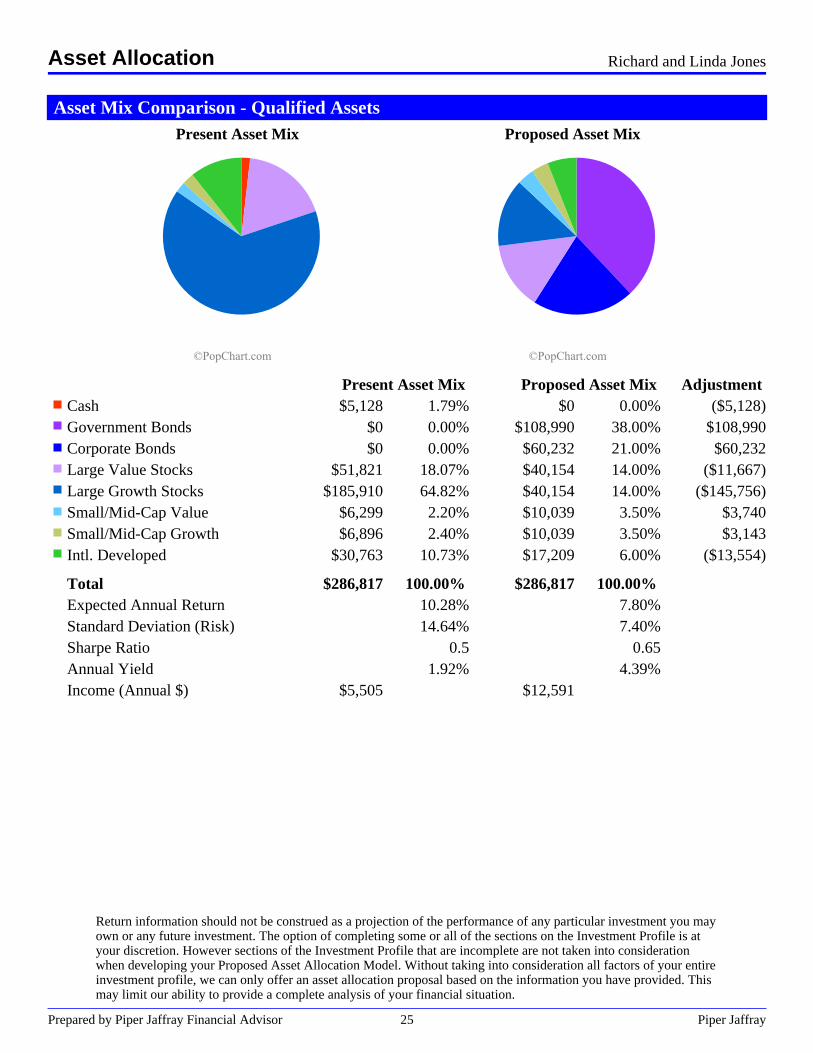
Asset Mix Comparison - Qualified AssetsPresent Asset Mix Proposed Asset Mix
Present Asset Mix Proposed Asset Mix AdjustmentCash $5,128 1.79% $0 0.00% ($5,128)Government Bonds $0 0.00% $108,990 38.00% $108,990Corporate Bonds $0 0.00% $60,232 21.00% $60,232Large Value Stocks $51,821 18.07% $40,154 14.00% ($11,667)Large Growth Stocks $185,910 64.82% $40,154 14.00% ($145,756)Small/Mid-Cap Value $6,299 2.20% $10,039 3.50% $3,740Small/Mid-Cap Growth $6,896 2.40% $10,039 3.50% $3,143Intl. Developed $30,763 10.73% $17,209 6.00% ($13,554)
Total $286,817 100.00% $286,817 100.00%Expected Annual Return 10.28% 7.80%Standard Deviation (Risk) 14.64% 7.40%Sharpe Ratio 0.5 0.65Annual Yield 1.92% 4.39%Income (Annual $) $5,505 $12,591
Return information should not be construed as a projection of the performance of any particular investment you mayown or any future investment. The option of completing some or all of the sections on the Investment Profile is atyour discretion. However sections of the Investment Profile that are incomplete are not taken into considerationwhen developing your Proposed Asset Allocation Model. Without taking into consideration all factors of your entireinvestment profile, we can only offer an asset allocation proposal based on the information you have provided. Thismay limit our ability to provide a complete analysis of your financial situation.
Asset Allocation Richard and Linda Jones
Prepared by Piper Jaffray Financial Advisor 25 Piper Jaffray
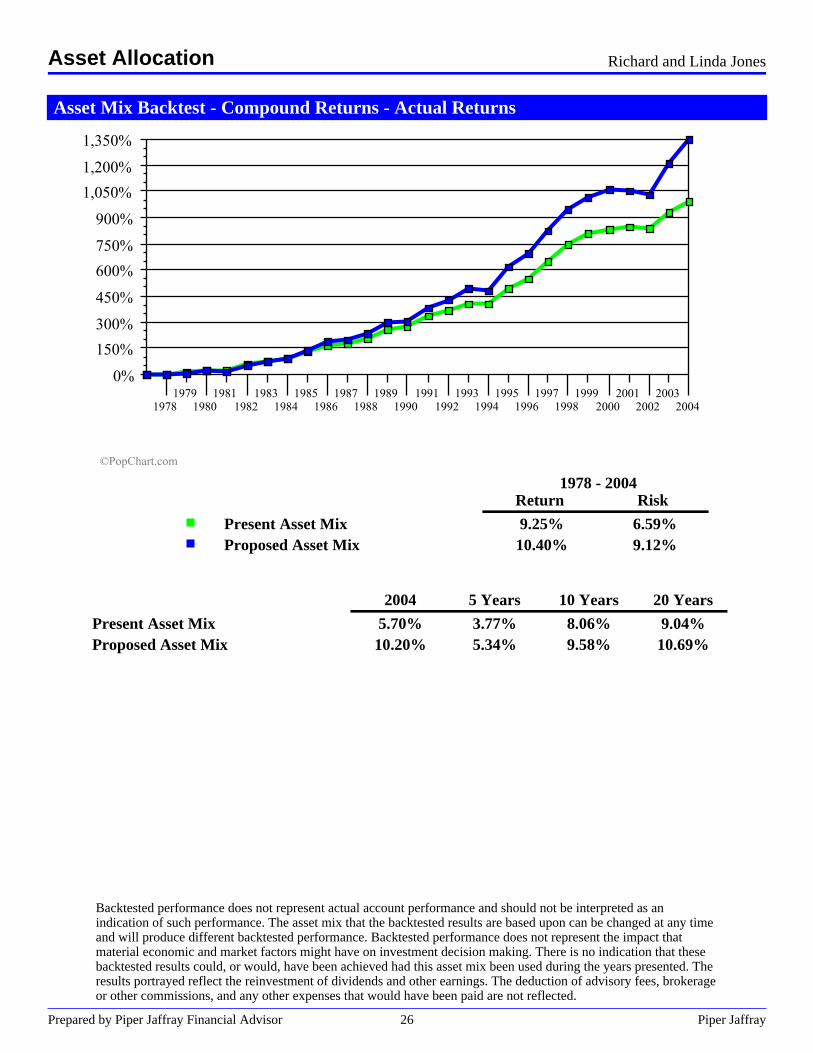
Asset Mix Backtest - Compound Returns - Actual Returns
1978 - 2004Return Risk
Present Asset Mix 9.25% 6.59%Proposed Asset Mix 10.40% 9.12%
2004 5 Years 10 Years 20 Years
Present Asset Mix 5.70% 3.77% 8.06% 9.04%Proposed Asset Mix 10.20% 5.34% 9.58% 10.69%
Backtested performance does not represent actual account performance and should not be interpreted as anindication of such performance. The asset mix that the backtested results are based upon can be changed at any timeand will produce different backtested performance. Backtested performance does not represent the impact thatmaterial economic and market factors might have on investment decision making. There is no indication that thesebacktested results could, or would, have been achieved had this asset mix been used during the years presented. Theresults portrayed reflect the reinvestment of dividends and other earnings. The deduction of advisory fees, brokerageor other commissions, and any other expenses that would have been paid are not reflected.
Asset Allocation Richard and Linda Jones
Prepared by Piper Jaffray Financial Advisor 26 Piper Jaffray
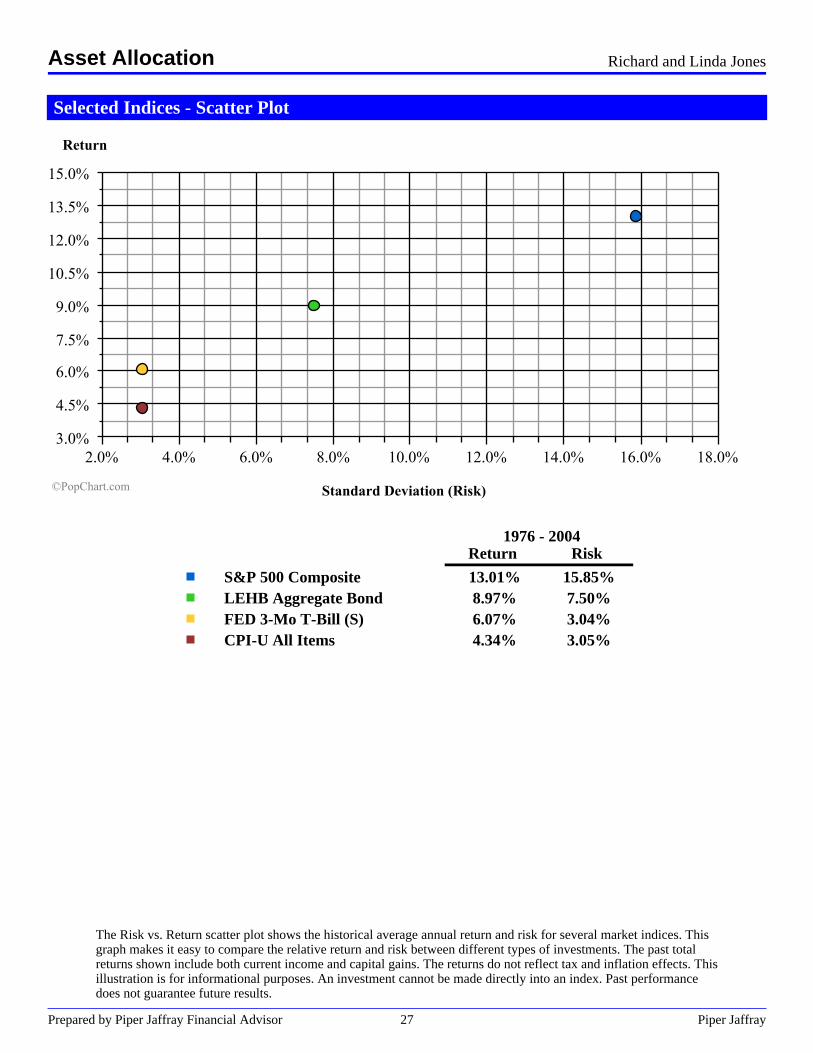
Selected Indices - Scatter Plot
1976 - 2004Return Risk
S&P 500 Composite 13.01% 15.85%LEHB Aggregate Bond 8.97% 7.50%FED 3-Mo T-Bill (S) 6.07% 3.04%CPI-U All Items 4.34% 3.05%
The Risk vs. Return scatter plot shows the historical average annual return and risk for several market indices. Thisgraph makes it easy to compare the relative return and risk between different types of investments. The past totalreturns shown include both current income and capital gains. The returns do not reflect tax and inflation effects. Thisillustration is for informational purposes. An investment cannot be made directly into an index. Past performancedoes not guarantee future results.
Asset Allocation Richard and Linda Jones
Prepared by Piper Jaffray Financial Advisor 27 Piper Jaffray

Scenario Assumptions
Scenario AssumptionsAsset Class Index Proxy Return Risk Yield Dividend TurnoverCash CITI 3-mo T-bill 3.00% 2.00% 3.00% 0.00% 100.00%T-Notes/CDs FED 6-Month CD 3.50% 3.00% 3.50% 0.00% 100.00%Government Bonds LEHB Government Bond 5.75% 6.00% 5.75% 0.00% 40.00%Municipal Bonds LEHB Municipal Bond 4.75% 8.00% 4.75% 0.00% 40.00%Corporate Bonds LEHB Credit Bond 6.50% 8.50% 6.50% 0.00% 40.00%High Yield Bonds LEHB High Yield 9.25% 16.00% 9.50% 0.00% 40.00%International Bonds CITI NonUS WGBI-All$ 7.00% 13.25% 7.00% 0.00% 40.00%Large Value Stocks BARA S&P500 Value 9.50% 13.25% 0.00% 2.50% 40.00%Large Growth Stocks BARA S&P500 Growth 10.50% 16.25% 0.00% 1.75% 40.00%Small/Mid-Cap Value WILS Tgt Small Value 11.00% 18.75% 0.00% 2.00% 40.00%Small/Mid-Cap Growth WILS Tgt Small Grth 11.60% 21.75% 0.00% 2.00% 40.00%Intl. Developed MSCI EAFE Index-$ 11.00% 22.25% 0.00% 1.75% 40.00%Emerging Equities MSCI Emerg Free-$ 11.50% 40.25% 0.00% 0.75% 40.00%REITs NAR REITs-All 7.50% 14.00% 5.50% 0.00% 10.00%Managed Futures CISDM-Fund/Pool-$ 8.00% 30.00% 0.00% 0.00% 100.00%Hedge Funds HFRI Fund of Funds 8.50% 12.00% 2.00% 0.00% 60.00%Venture Capital/L.P. CAMB US Venture Cap 12.50% 35.25% 0.00% 0.00% 10.00%
Inflation Rate: 3.00%
Holding LimitsNon-Qualified Assets Qualified Assets Non-Qualified Tax-Def
AssetsAsset Class Min % Max % Min % Max % Min % Max %Cash 0.00% 35.00% 0.00% 35.00% 0.00% 35.00%T-Notes/CDs 0.00% 20.00% 0.00% 20.00% 0.00% 20.00%Government Bonds 0.00% 60.00% 0.00% 60.00% 0.00% 60.00%Municipal Bonds 0.00% 60.00% 0.00% 0.00% 0.00% 0.00%Corporate Bonds 0.00% 35.00% 0.00% 35.00% 0.00% 35.00%High Yield Bonds 0.00% 25.00% 0.00% 25.00% 0.00% 25.00%International Bonds 0.00% 10.00% 0.00% 10.00% 0.00% 10.00%Large Value Stocks 0.00% 50.00% 0.00% 50.00% 0.00% 50.00%Large Growth Stocks 0.00% 50.00% 0.00% 50.00% 0.00% 50.00%Small/Mid-Cap Value 0.00% 50.00% 0.00% 50.00% 0.00% 50.00%Small/Mid-Cap Growth 0.00% 50.00% 0.00% 50.00% 0.00% 50.00%Intl. Developed 0.00% 25.00% 0.00% 25.00% 0.00% 25.00%Emerging Equities 0.00% 10.00% 0.00% 10.00% 0.00% 10.00%REITs 0.00% 10.00% 0.00% 10.00% 0.00% 10.00%Managed Futures 0.00% 0.00% 0.00% 0.00% 0.00% 0.00%Hedge Funds 0.00% 0.00% 0.00% 0.00% 0.00% 0.00%Venture Capital/L.P. 0.00% 0.00% 0.00% 0.00% 0.00% 0.00%
Scenario assumptions are based on the estimates of the future performance for each major asset class, which isrepresented by each of its respective market index. These estimates are based on the estimated long-term averagemedian total annual return. These estimates do not rely solely on historical performance and past performance is notindicative of future results. Indexes are unmanaged and an investment cannot be made directly into an index.
Asset Allocation Richard and Linda Jones
Prepared by Piper Jaffray Financial Advisor 28 Piper Jaffray

.
Retirement PlanningAnalysis
Prepared by Piper Jaffray Financial Advisor 29 Piper Jaffray
Planning For Your Retirement
The purpose of retirement planning is to determine the level of funding needed to help meet your retirementgoals and identify the actions you will need to take to achieve that level of funding. A good retirement plan willanswer the following questions about your current retirement preparations and objectives:
· What would my spendable income during retirement be if I maintain my current patterns of income,spending, and saving?
· How much would I have to save annually in order to achieve my annual retirement spending objective?· How will varying the assumed rates of return on my assets affect the results of the analysis?· What can I do to facilitate more rapid growth of wealth?
Your Retirement Plan
In this report, your retirement plan is analyzed in two different ways, as summarized below, using two sets ofassumptions.
· First, your current commitment to saving and investing is assumed to remain constant, and your currentsituation is projected into the future. This illustrates the income you might have available during retirement ifyour current saving and investment patterns do not change.
· Second, changes are made to your current level of saving and investing, as well as to your assumed returnsand alternatives, that may enhance your projected retirement situation. The results of these changes arecompared to your desired retirement spending objective and to the original projection.
Benefits of Retirement Planning
Among other benefits, a proper retirement plan can:
· Help you set attainable spending goals for retirement· Help you understand where you are in relationship to your goals· Illustrate the impact of changing your current spending and saving patterns· Help you utilize planning concepts such as tax deferral, time horizons, and tax reduction.
Retirement Planning Analysis - Overview Richard and Linda Jones
Prepared by Piper Jaffray Financial Advisor 30 Piper Jaffray
FYI
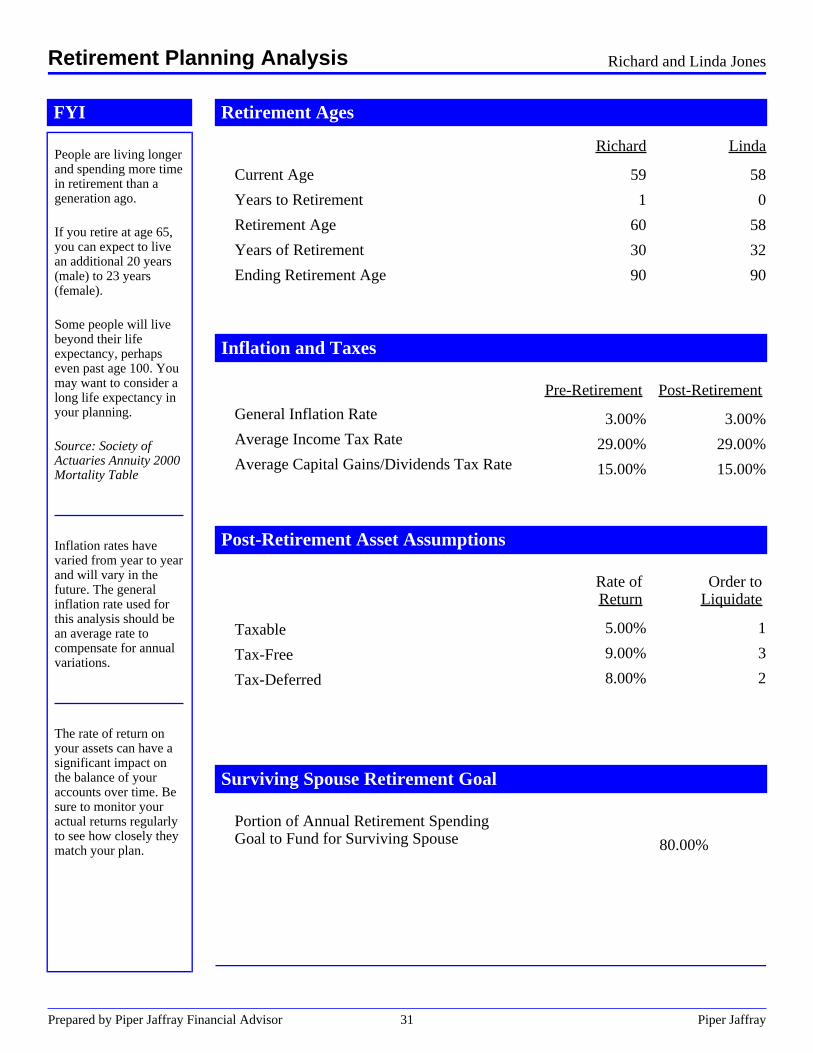
People are living longerand spending more timein retirement than ageneration ago.
If you retire at age 65,you can expect to livean additional 20 years(male) to 23 years(female).
Some people will livebeyond their lifeexpectancy, perhapseven past age 100. Youmay want to consider along life expectancy inyour planning.
Source: Society ofActuaries Annuity 2000Mortality Table
Inflation rates havevaried from year to yearand will vary in thefuture. The generalinflation rate used forthis analysis should bean average rate tocompensate for annualvariations.
The rate of return onyour assets can have asignificant impact onthe balance of youraccounts over time. Besure to monitor youractual returns regularlyto see how closely theymatch your plan.
Retirement Ages
Current Age
Years to Retirement
Retirement Age
Years of Retirement
Ending Retirement Age
Richard
59
1
60
30
90
Linda
58
0
58
32
90
Inflation and Taxes
General Inflation Rate
Average Income Tax Rate
Average Capital Gains/Dividends Tax Rate
Pre-Retirement
3.00%
29.00%
15.00%
Post-Retirement
3.00%
29.00%
15.00%
Post-Retirement Asset Assumptions
Taxable
Tax-Free
Tax-Deferred
Rate ofReturn
5.00%
9.00%
8.00%
Order toLiquidate
1
3
2
Surviving Spouse Retirement Goal
Portion of Annual Retirement SpendingGoal to Fund for Surviving Spouse 80.00%
Retirement Planning Analysis Richard and Linda Jones
Prepared by Piper Jaffray Financial Advisor 31 Piper Jaffray
FYI
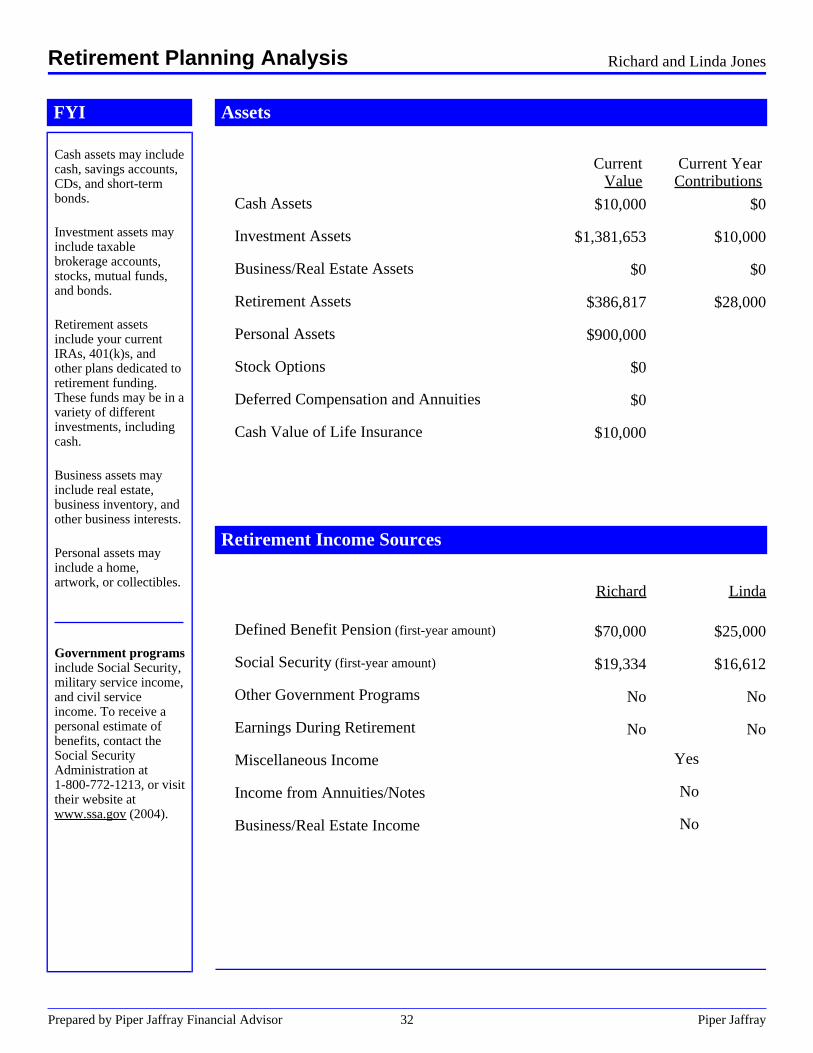
Cash assets may includecash, savings accounts,CDs, and short-termbonds.
Investment assets mayinclude taxablebrokerage accounts,stocks, mutual funds,and bonds.
Retirement assetsinclude your currentIRAs, 401(k)s, andother plans dedicated toretirement funding.These funds may be in avariety of differentinvestments, includingcash.
Business assets mayinclude real estate,business inventory, andother business interests.
Personal assets mayinclude a home,artwork, or collectibles.
Government programsinclude Social Security,military service income,and civil serviceincome. To receive apersonal estimate ofbenefits, contact theSocial SecurityAdministration at1-800-772-1213, or visittheir website atwww.ssa.gov (2004).
Assets
Cash Assets
Investment Assets
Business/Real Estate Assets
Retirement Assets
Personal Assets
Stock Options
Deferred Compensation and Annuities
Cash Value of Life Insurance
.Current
Value
$10,000
$1,381,653
$0
$386,817
$900,000
$0
$0
$10,000
.Current Year
Contributions
$0
$10,000
$0
$28,000
Retirement Income Sources
Defined Benefit Pension (first-year amount)
Social Security (first-year amount)
Other Government Programs
Earnings During Retirement
Miscellaneous Income
Income from Annuities/Notes
Business/Real Estate Income
Richard
$70,000
$19,334
No
No
Yes
No
No
Linda
$25,000
$16,612
No
No
Retirement Planning Analysis Richard and Linda Jones
Prepared by Piper Jaffray Financial Advisor 32 Piper Jaffray
FYI
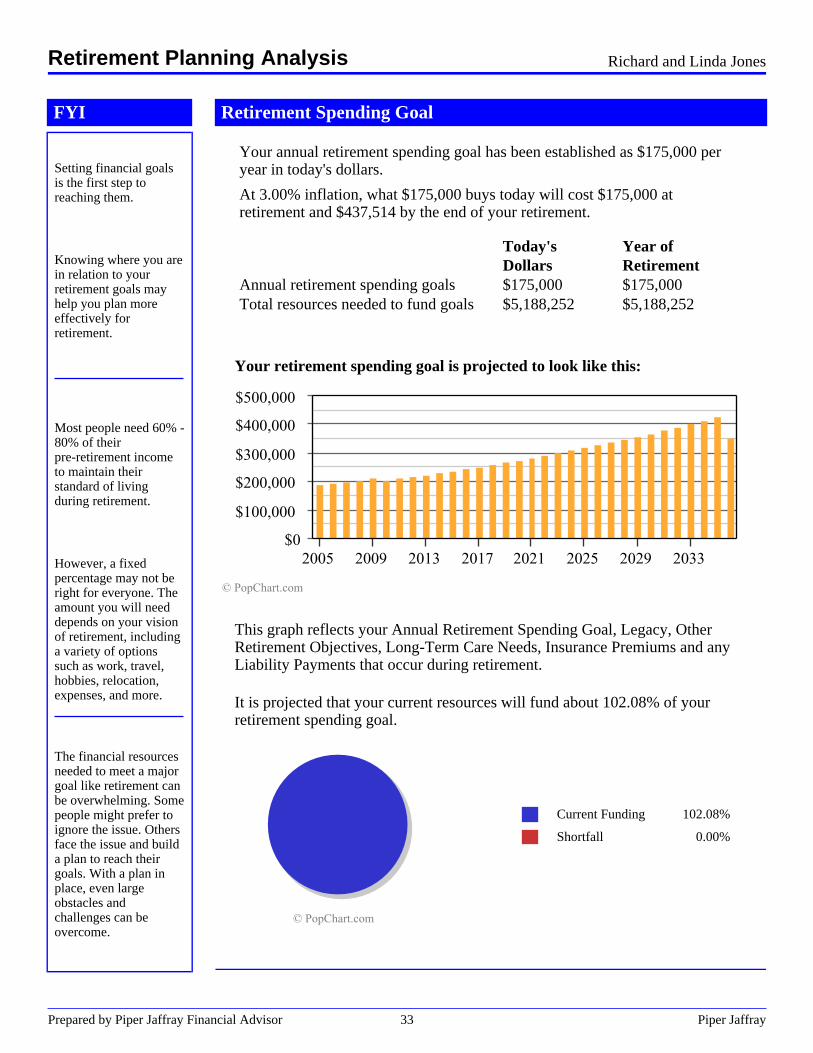
Setting financial goalsis the first step toreaching them.
Knowing where you arein relation to yourretirement goals mayhelp you plan moreeffectively forretirement.
Most people need 60% -80% of theirpre-retirement incometo maintain theirstandard of livingduring retirement.
However, a fixedpercentage may not beright for everyone. Theamount you will needdepends on your visionof retirement, includinga variety of optionssuch as work, travel,hobbies, relocation,expenses, and more.
The financial resourcesneeded to meet a majorgoal like retirement canbe overwhelming. Somepeople might prefer toignore the issue. Othersface the issue and builda plan to reach theirgoals. With a plan inplace, even largeobstacles andchallenges can beovercome.
Retirement Spending Goal
Your annual retirement spending goal has been established as $175,000 peryear in today's dollars.
At 3.00% inflation, what $175,000 buys today will cost $175,000 atretirement and $437,514 by the end of your retirement.
Today's Year ofDollars Retirement
Annual retirement spending goals $175,000 $175,000Total resources needed to fund goals $5,188,252 $5,188,252
Your retirement spending goal is projected to look like this:
This graph reflects your Annual Retirement Spending Goal, Legacy, OtherRetirement Objectives, Long-Term Care Needs, Insurance Premiums and anyLiability Payments that occur during retirement.
It is projected that your current resources will fund about 102.08% of yourretirement spending goal.
. Current Funding 102.08%
. Shortfall 0.00%
Retirement Planning Analysis Richard and Linda Jones
Prepared by Piper Jaffray Financial Advisor 33 Piper Jaffray
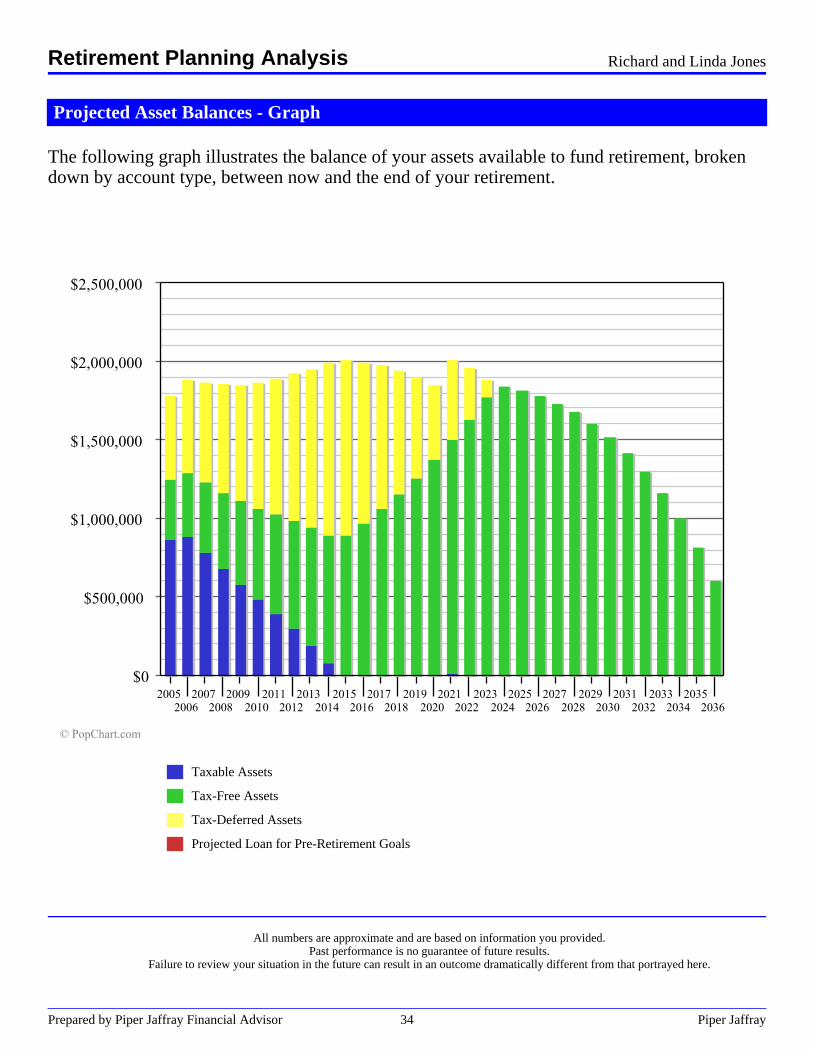
Projected Asset Balances - Graph
The following graph illustrates the balance of your assets available to fund retirement, brokendown by account type, between now and the end of your retirement.
. Taxable Assets
. Tax-Free Assets
. Tax-Deferred Assets
. Projected Loan for Pre-Retirement Goals
All numbers are approximate and are based on information you provided.Past performance is no guarantee of future results.
Failure to review your situation in the future can result in an outcome dramatically different from that portrayed here.
Retirement Planning Analysis Richard and Linda Jones
Prepared by Piper Jaffray Financial Advisor 34 Piper Jaffray
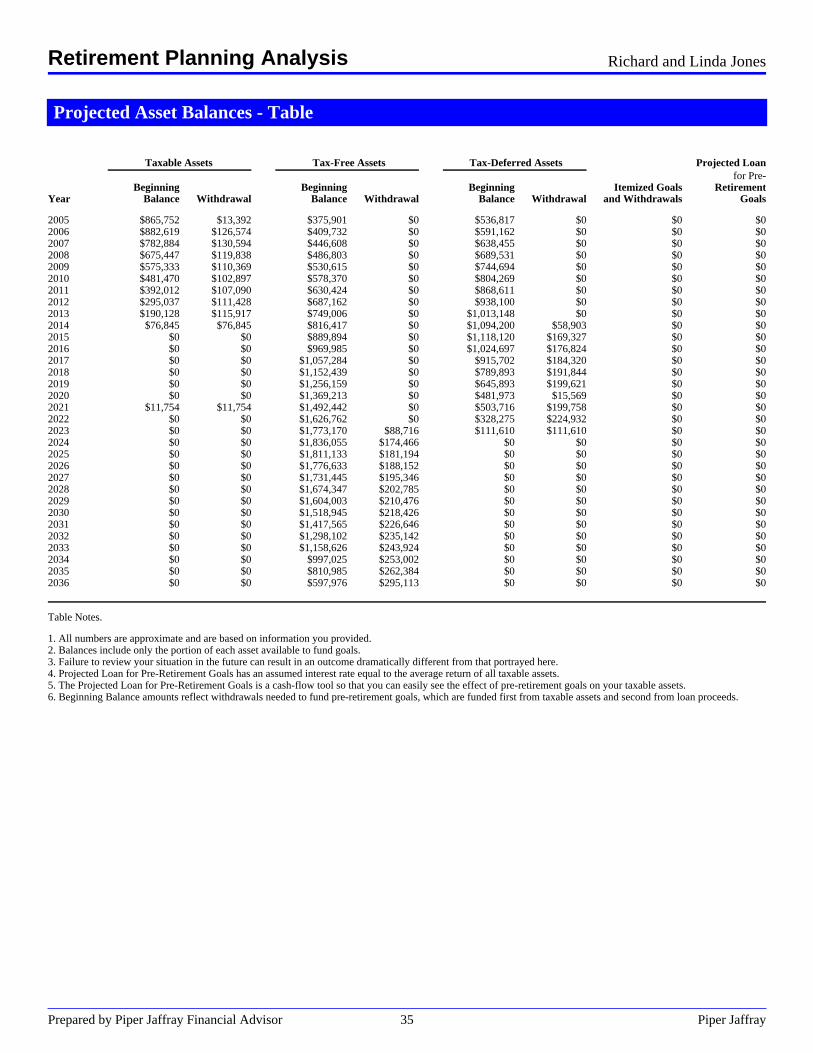
Projected Asset Balances - Table.
. ..............Taxable Assets ..............Tax-Free Assets ..........Tax-Deferred Assets . Projected Loan
. . . . . for Pre-
. Beginning Beginning Beginning Itemized Goals RetirementYear Balance Withdrawal Balance Withdrawal Balance Withdrawal and Withdrawals Goals
2005 $865,752 $13,392 $375,901 $0 $536,817 $0 $0 $02006 $882,619 $126,574 $409,732 $0 $591,162 $0 $0 $02007 $782,884 $130,594 $446,608 $0 $638,455 $0 $0 $02008 $675,447 $119,838 $486,803 $0 $689,531 $0 $0 $02009 $575,333 $110,369 $530,615 $0 $744,694 $0 $0 $02010 $481,470 $102,897 $578,370 $0 $804,269 $0 $0 $02011 $392,012 $107,090 $630,424 $0 $868,611 $0 $0 $02012 $295,037 $111,428 $687,162 $0 $938,100 $0 $0 $02013 $190,128 $115,917 $749,006 $0 $1,013,148 $0 $0 $02014 $76,845 $76,845 $816,417 $0 $1,094,200 $58,903 $0 $02015 $0 $0 $889,894 $0 $1,118,120 $169,327 $0 $02016 $0 $0 $969,985 $0 $1,024,697 $176,824 $0 $02017 $0 $0 $1,057,284 $0 $915,702 $184,320 $0 $02018 $0 $0 $1,152,439 $0 $789,893 $191,844 $0 $02019 $0 $0 $1,256,159 $0 $645,893 $199,621 $0 $02020 $0 $0 $1,369,213 $0 $481,973 $15,569 $0 $02021 $11,754 $11,754 $1,492,442 $0 $503,716 $199,758 $0 $02022 $0 $0 $1,626,762 $0 $328,275 $224,932 $0 $02023 $0 $0 $1,773,170 $88,716 $111,610 $111,610 $0 $02024 $0 $0 $1,836,055 $174,466 $0 $0 $0 $02025 $0 $0 $1,811,133 $181,194 $0 $0 $0 $02026 $0 $0 $1,776,633 $188,152 $0 $0 $0 $02027 $0 $0 $1,731,445 $195,346 $0 $0 $0 $02028 $0 $0 $1,674,347 $202,785 $0 $0 $0 $02029 $0 $0 $1,604,003 $210,476 $0 $0 $0 $02030 $0 $0 $1,518,945 $218,426 $0 $0 $0 $02031 $0 $0 $1,417,565 $226,646 $0 $0 $0 $02032 $0 $0 $1,298,102 $235,142 $0 $0 $0 $02033 $0 $0 $1,158,626 $243,924 $0 $0 $0 $02034 $0 $0 $997,025 $253,002 $0 $0 $0 $02035 $0 $0 $810,985 $262,384 $0 $0 $0 $02036 $0 $0 $597,976 $295,113 $0 $0 $0 $0.
Table Notes.
1. All numbers are approximate and are based on information you provided.2. Balances include only the portion of each asset available to fund goals.3. Failure to review your situation in the future can result in an outcome dramatically different from that portrayed here.4. Projected Loan for Pre-Retirement Goals has an assumed interest rate equal to the average return of all taxable assets.5. The Projected Loan for Pre-Retirement Goals is a cash-flow tool so that you can easily see the effect of pre-retirement goals on your taxable assets.6. Beginning Balance amounts reflect withdrawals needed to fund pre-retirement goals, which are funded first from taxable assets and second from loan proceeds.
Retirement Planning Analysis Richard and Linda Jones
Prepared by Piper Jaffray Financial Advisor 35 Piper Jaffray
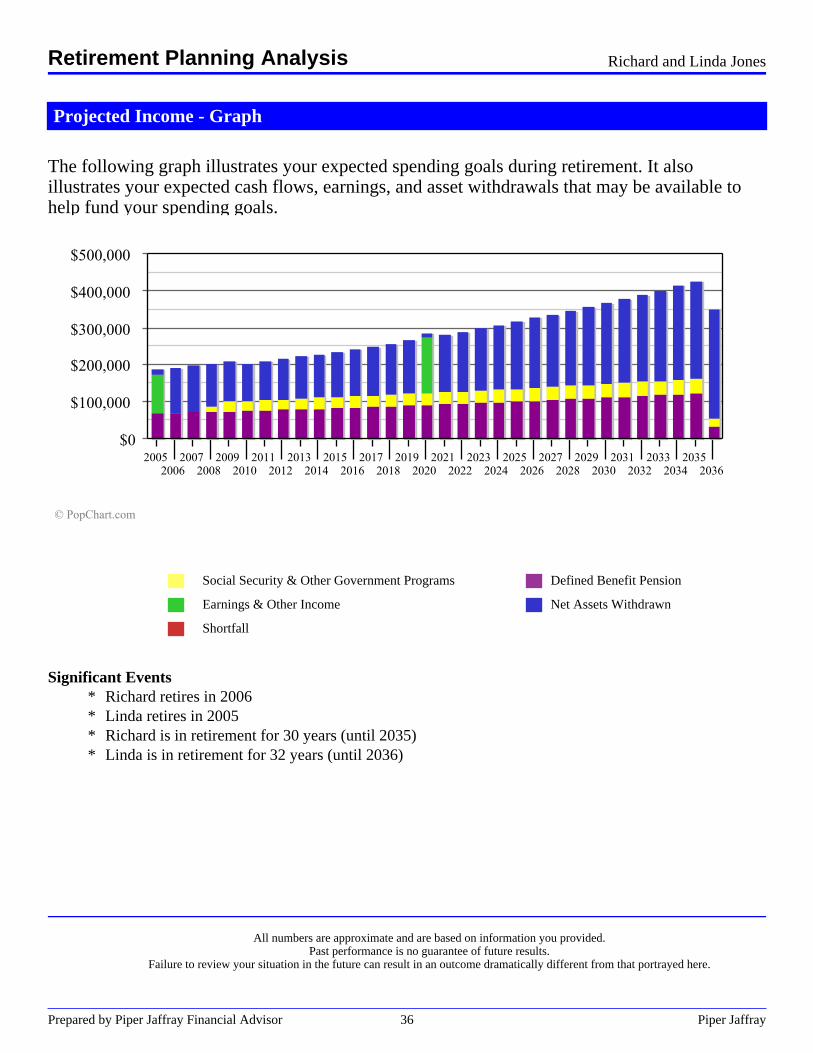
Projected Income - Graph
The following graph illustrates your expected spending goals during retirement. It alsoillustrates your expected cash flows, earnings, and asset withdrawals that may be available tohelp fund your spending goals.
. Social Security & Other Government Programs . Defined Benefit Pension
. Earnings & Other Income . Net Assets Withdrawn
. Shortfall
Significant Events* Richard retires in 2006* Linda retires in 2005* Richard is in retirement for 30 years (until 2035)* Linda is in retirement for 32 years (until 2036)
All numbers are approximate and are based on information you provided.Past performance is no guarantee of future results.
Failure to review your situation in the future can result in an outcome dramatically different from that portrayed here.
Retirement Planning Analysis Richard and Linda Jones
Prepared by Piper Jaffray Financial Advisor 36 Piper Jaffray
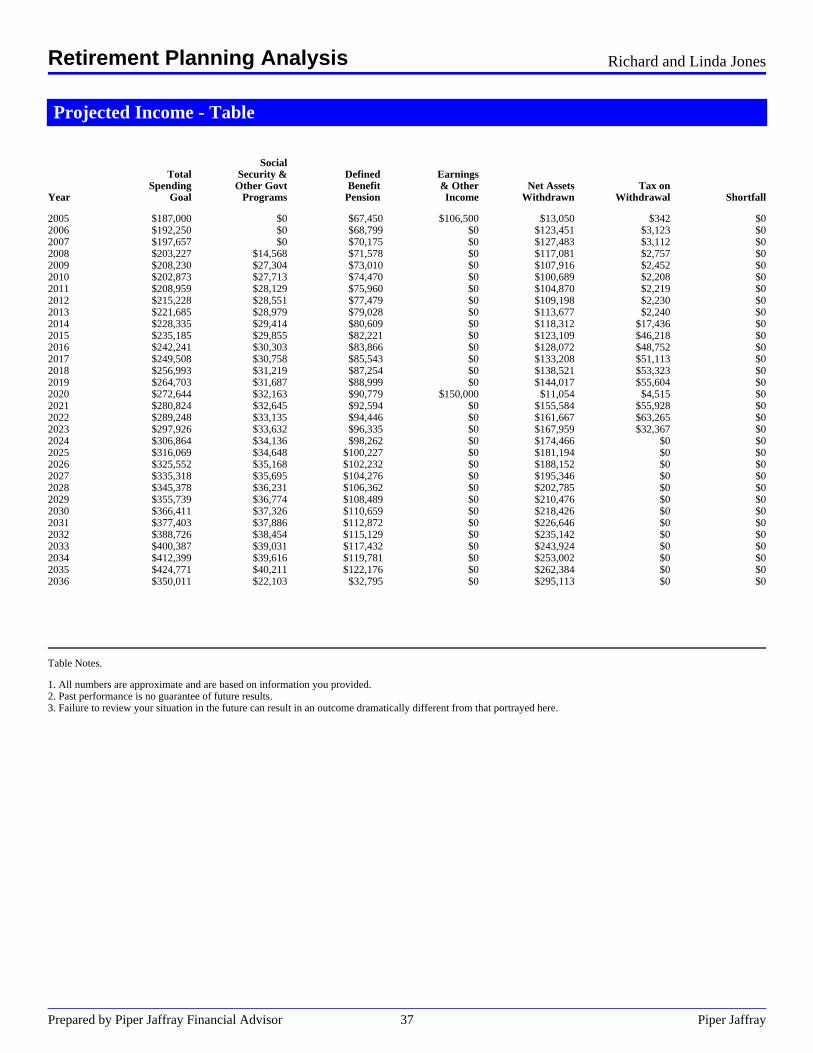
Projected Income - Table
.Social
Total Security & Defined EarningsSpending Other Govt Benefit & Other Net Assets Tax on
Year Goal Programs Pension Income Withdrawn Withdrawal Shortfall
2005 $187,000 $0 $67,450 $106,500 $13,050 $342 $02006 $192,250 $0 $68,799 $0 $123,451 $3,123 $02007 $197,657 $0 $70,175 $0 $127,483 $3,112 $02008 $203,227 $14,568 $71,578 $0 $117,081 $2,757 $02009 $208,230 $27,304 $73,010 $0 $107,916 $2,452 $02010 $202,873 $27,713 $74,470 $0 $100,689 $2,208 $02011 $208,959 $28,129 $75,960 $0 $104,870 $2,219 $02012 $215,228 $28,551 $77,479 $0 $109,198 $2,230 $02013 $221,685 $28,979 $79,028 $0 $113,677 $2,240 $02014 $228,335 $29,414 $80,609 $0 $118,312 $17,436 $02015 $235,185 $29,855 $82,221 $0 $123,109 $46,218 $02016 $242,241 $30,303 $83,866 $0 $128,072 $48,752 $02017 $249,508 $30,758 $85,543 $0 $133,208 $51,113 $02018 $256,993 $31,219 $87,254 $0 $138,521 $53,323 $02019 $264,703 $31,687 $88,999 $0 $144,017 $55,604 $02020 $272,644 $32,163 $90,779 $150,000 $11,054 $4,515 $02021 $280,824 $32,645 $92,594 $0 $155,584 $55,928 $02022 $289,248 $33,135 $94,446 $0 $161,667 $63,265 $02023 $297,926 $33,632 $96,335 $0 $167,959 $32,367 $02024 $306,864 $34,136 $98,262 $0 $174,466 $0 $02025 $316,069 $34,648 $100,227 $0 $181,194 $0 $02026 $325,552 $35,168 $102,232 $0 $188,152 $0 $02027 $335,318 $35,695 $104,276 $0 $195,346 $0 $02028 $345,378 $36,231 $106,362 $0 $202,785 $0 $02029 $355,739 $36,774 $108,489 $0 $210,476 $0 $02030 $366,411 $37,326 $110,659 $0 $218,426 $0 $02031 $377,403 $37,886 $112,872 $0 $226,646 $0 $02032 $388,726 $38,454 $115,129 $0 $235,142 $0 $02033 $400,387 $39,031 $117,432 $0 $243,924 $0 $02034 $412,399 $39,616 $119,781 $0 $253,002 $0 $02035 $424,771 $40,211 $122,176 $0 $262,384 $0 $02036 $350,011 $22,103 $32,795 $0 $295,113 $0 $0
.
.
Table Notes.
1. All numbers are approximate and are based on information you provided.2. Past performance is no guarantee of future results.3. Failure to review your situation in the future can result in an outcome dramatically different from that portrayed here.
Retirement Planning Analysis Richard and Linda Jones
Prepared by Piper Jaffray Financial Advisor 37 Piper Jaffray
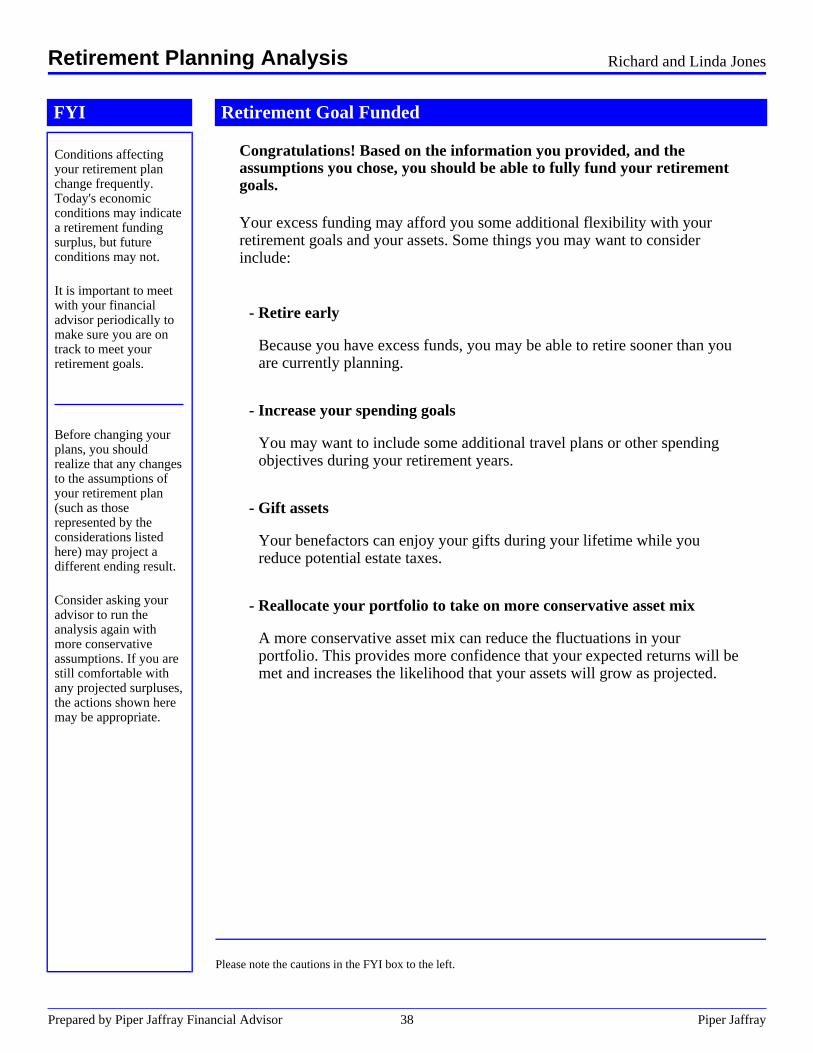
FYI
Conditions affectingyour retirement planchange frequently.Today's economicconditions may indicatea retirement fundingsurplus, but futureconditions may not.
It is important to meetwith your financialadvisor periodically tomake sure you are ontrack to meet yourretirement goals.
Before changing yourplans, you shouldrealize that any changesto the assumptions ofyour retirement plan(such as thoserepresented by theconsiderations listedhere) may project adifferent ending result.
Consider asking youradvisor to run theanalysis again withmore conservativeassumptions. If you arestill comfortable withany projected surpluses,the actions shown heremay be appropriate.
Retirement Goal Funded
Congratulations! Based on the information you provided, and theassumptions you chose, you should be able to fully fund your retirementgoals.
Your excess funding may afford you some additional flexibility with yourretirement goals and your assets. Some things you may want to considerinclude:
- Retire early
Because you have excess funds, you may be able to retire sooner than youare currently planning.
- Increase your spending goals
You may want to include some additional travel plans or other spendingobjectives during your retirement years.
- Gift assets
Your benefactors can enjoy your gifts during your lifetime while youreduce potential estate taxes.
- Reallocate your portfolio to take on more conservative asset mix
A more conservative asset mix can reduce the fluctuations in yourportfolio. This provides more confidence that your expected returns will bemet and increases the likelihood that your assets will grow as projected.
Please note the cautions in the FYI box to the left.
Retirement Planning Analysis Richard and Linda Jones
Prepared by Piper Jaffray Financial Advisor 38 Piper Jaffray

Overview
Planning Your Estate
Building your estate requires a lifetime of effort and careful planning. Similar careful planning is required toachieve your estate planning goals. If you do not make appropriate estate planning provisions during your life,your estate may be unduly diminished by taxes and suffer from poor management, administrative delays, and/orincreased settlement costs.
If you plan your estate properly, you may increase your ability to achieve lifelong goals and provide for yourfamily, charities, and others. You may also reduce the transfer taxes and settlement costs that may be assessedat your death. Estate and income tax laws change frequently, which means that you will need to review yourplans on a regular basis in order to adjust to these changes.
Your Estate Plan
The analysis contained in this report will provide you with information to help you understand general estateplanning rules and concepts. It is for illustrative purposes only and may not reflect all the specifics of yoursituation, such as individual state inheritance or estate taxes. This analysis illustrates your current estatesituation and discusses estate planning alternatives that may benefit you and your heirs. Your estate plan shouldbe centered on your financial situation and what you want to accomplish. Because these factors may changewith time, you should periodically review your estate plan with your financial advisor, attorney, and tax advisor.You will need the assistance of an estate attorney to implement many of the recommendations put forth in thisreport.
Benefits of Estate Planning
A proper estate plan may do the following:
· Reduce your estate tax liability· Reduce your asset transfer costs· Direct your financial resources to those you choose· Ease your family's burden during a time of stress
Comprehensive Financial Plan Richard and Linda Jones
Prepared by Piper Jaffray Financial Advisor 39 Piper Jaffray

Estate Assumptions
Personal InformationRichard and Linda Jones
General AssumptionsScenario name Market CyclePlan date 03/31/2005
Current Estate Structure Richard LindaWill No No
Bequests to someone other than the surviving client (dollar amount) $0 $0Bequests to someone other than the surviving client (percent) 0.00% 0.00%
Credit shelter trust No No
Estate Planning Assumptions Richard LindaDeath age (for estate plan) 85 85Funeral and final expenses (in today's dollars) $7,500 $7,500Probate expenses (as a percent of the probate estate) 0.00% 0.00%Administration expenses (as a percent of the gross estate) 5.00% 5.00%
Growth RatesGrowth/depletion of survivor's estate after first death
Annual percent adjustment to value of estate 0.00%Annual dollar adjustment to value of estate $0
Index dollar adjustment with inflation? NoRate of return for assets held in trust 8.00%
Federal Estate Tax and State Death Tax Assumptions Richard LindaFederal estate tax law applied Sunset SunsetState death tax law applied State Freeze State FreezeState freeze year 2010 2010
Historical Gifting Information Richard LindaCumulative total gifts in excess of annual exclusion $0 $0Cumulative gift tax previously paid on above total $0 $0Cumulative gift tax credit previously used $0 $0
Estate Planning Analysis Richard and Linda Jones
Prepared by Piper Jaffray Financial Advisor 40 Piper Jaffray
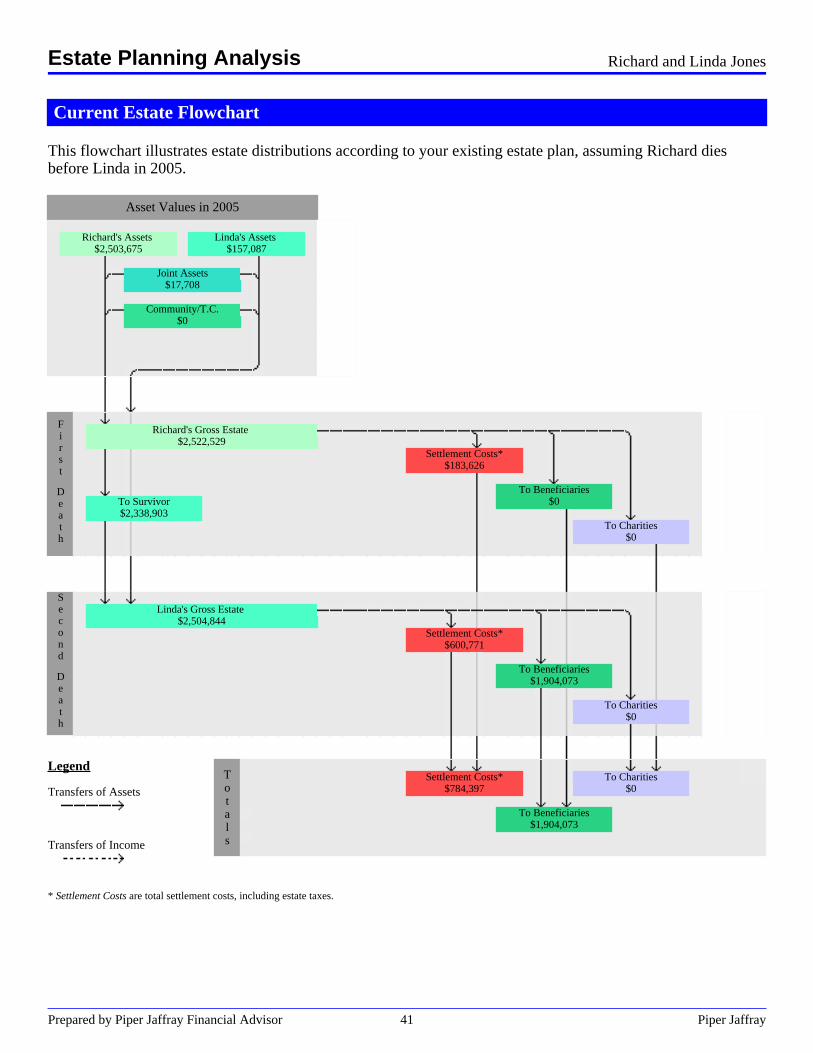
Current Estate Flowchart
This flowchart illustrates estate distributions according to your existing estate plan, assuming Richard diesbefore Linda in 2005.
Asset Values in 2005
Richard's Assets$2,503,675
Linda's Assets$157,087
Joint Assets$17,708
Community/T.C.$0
First
Death
Richard's Gross Estate$2,522,529
Settlement Costs*$183,626
To Beneficiaries$0To Survivor
$2,338,903To Charities
$0
Second
Death
Linda's Gross Estate$2,504,844
Settlement Costs*$600,771
To Beneficiaries$1,904,073
To Charities$0
Legend
Transfers of Assets
Transfers of Income
Totals
Settlement Costs*$784,397
To Charities$0
To Beneficiaries$1,904,073
* Settlement Costs are total settlement costs, including estate taxes.
Estate Planning Analysis Richard and Linda Jones
Prepared by Piper Jaffray Financial Advisor 41 Piper Jaffray

FYI
You have worked hardto accumulate thefinancial resources tosupport your familytoday and leave alegacy for tomorrow.
When you die, yourestate executor willcalculate your grossestate by determiningthe value of your assetsand any assets in whichyou have an 'incident ofownership.' The rulesconcerning what isincluded in the value ofyour gross estate arecomplex. To avoidfuture difficulties, makecertain this report listsall assets in which youhave incidents ofownership.
Current Assets by Owner
.
.Richard
.
.Linda
.
.Joint Assets
Community/T. Common
AssetsCash assets $0 $0 $10,000 $0Investment assets $1,373,945 $0 $7,708 $0Retirement assets $229,730 $157,087 N/A N/AStock options $0 $0 N/A $0Annuities $0 $0 $0 $0Deferred compensation $0 $0 N/A N/ANotes receivable $0 $0 $0 $0Business assets $0 $0 $0 $0Personal assets $900,000 $0 $0 $0Total assets $2,503,675 $157,087 $17,708 $0
Current Gross Estate
Richard LindaIndividually owned assets $2,503,675 $157,08750% of joint assets $8,854 $8,85450% of community assets/tenancy in common assets $0 $0Life insurance included in estate $10,000 $0Assets received at Richard's death N/A $2,338,903Current gross estate $2,522,529 $2,504,844
Estate Planning Analysis Richard and Linda Jones
Prepared by Piper Jaffray Financial Advisor 42 Piper Jaffray
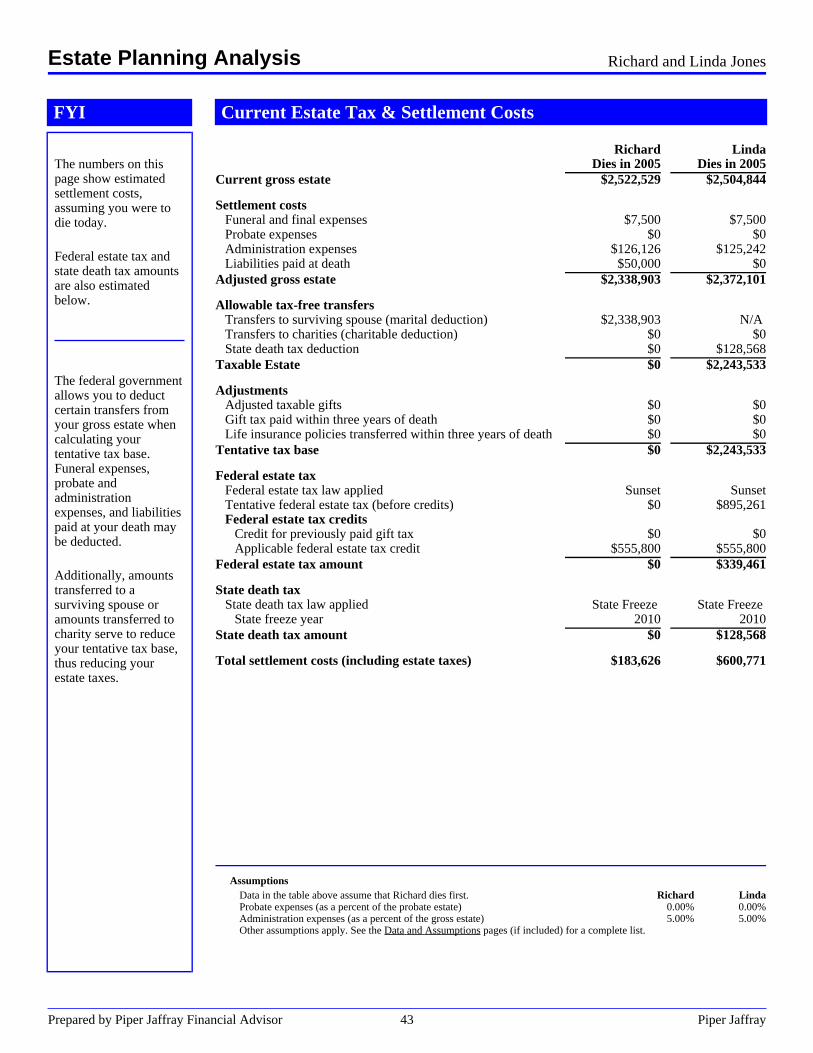
FYI
The numbers on thispage show estimatedsettlement costs,assuming you were todie today.
Federal estate tax andstate death tax amountsare also estimatedbelow.
The federal governmentallows you to deductcertain transfers fromyour gross estate whencalculating yourtentative tax base.Funeral expenses,probate andadministrationexpenses, and liabilitiespaid at your death maybe deducted.
Additionally, amountstransferred to asurviving spouse oramounts transferred tocharity serve to reduceyour tentative tax base,thus reducing yourestate taxes.
Current Estate Tax & Settlement Costs
RichardDies in 2005
LindaDies in 2005
Current gross estate $2,522,529 $2,504,844
Settlement costsFuneral and final expenses $7,500 $7,500Probate expenses $0 $0Administration expenses $126,126 $125,242Liabilities paid at death $50,000 $0
Adjusted gross estate $2,338,903 $2,372,101
Allowable tax-free transfersTransfers to surviving spouse (marital deduction) $2,338,903 N/ATransfers to charities (charitable deduction) $0 $0State death tax deduction $0 $128,568
Taxable Estate $0 $2,243,533
AdjustmentsAdjusted taxable gifts $0 $0Gift tax paid within three years of death $0 $0Life insurance policies transferred within three years of death $0 $0
Tentative tax base $0 $2,243,533
Federal estate taxFederal estate tax law applied Sunset SunsetTentative federal estate tax (before credits) $0 $895,261Federal estate tax credits
Credit for previously paid gift tax $0 $0Applicable federal estate tax credit $555,800 $555,800
Federal estate tax amount $0 $339,461
State death taxState death tax law applied State Freeze State Freeze
State freeze year 2010 2010State death tax amount $0 $128,568
Total settlement costs (including estate taxes) $183,626 $600,771
AssumptionsData in the table above assume that Richard dies first. Richard LindaProbate expenses (as a percent of the probate estate) 0.00% 0.00%Administration expenses (as a percent of the gross estate) 5.00% 5.00%Other assumptions apply. See the Data and Assumptions pages (if included) for a complete list.
Estate Planning Analysis Richard and Linda Jones
Prepared by Piper Jaffray Financial Advisor 43 Piper Jaffray
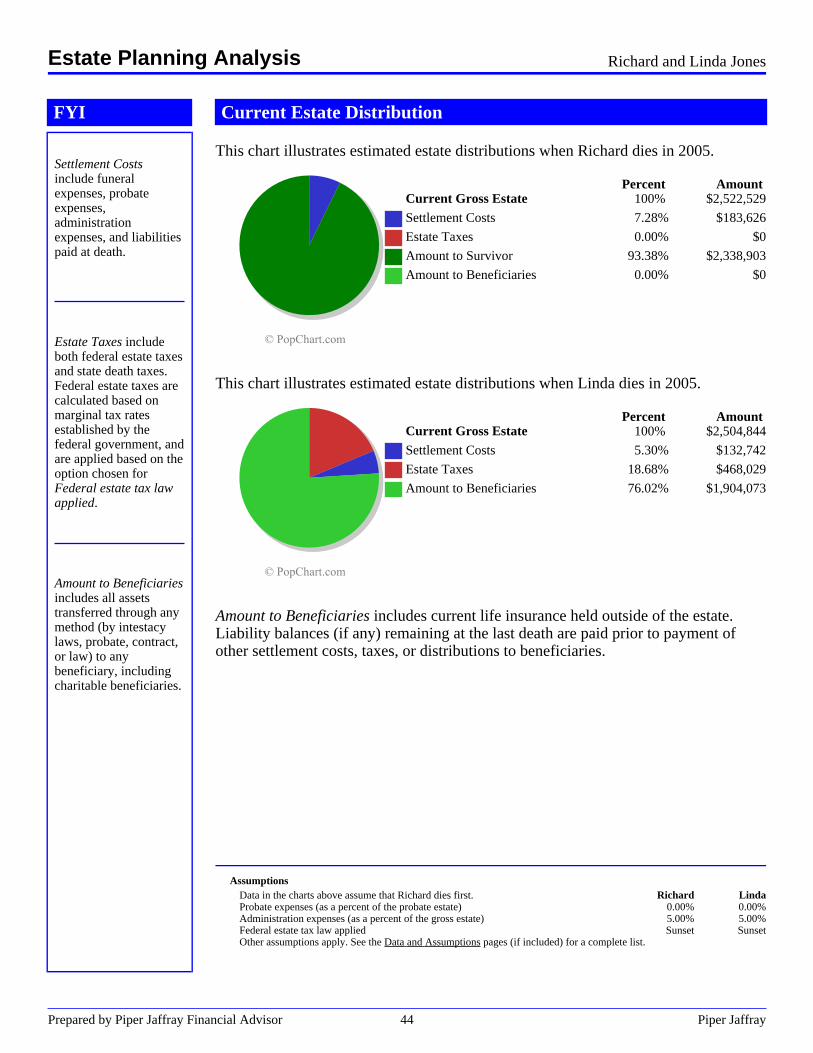
FYI
Settlement Costsinclude funeralexpenses, probateexpenses,administrationexpenses, and liabilitiespaid at death.
Estate Taxes includeboth federal estate taxesand state death taxes.Federal estate taxes arecalculated based onmarginal tax ratesestablished by thefederal government, andare applied based on theoption chosen forFederal estate tax lawapplied.
Amount to Beneficiariesincludes all assetstransferred through anymethod (by intestacylaws, probate, contract,or law) to anybeneficiary, includingcharitable beneficiaries.
Current Estate Distribution
This chart illustrates estimated estate distributions when Richard dies in 2005..
Percent AmountCurrent Gross Estate 100% $2,522,529
.
. Settlement Costs 7.28% $183,626.
. Estate Taxes 0.00% $0.
. Amount to Survivor 93.38% $2,338,903.
. Amount to Beneficiaries 0.00% $0
This chart illustrates estimated estate distributions when Linda dies in 2005..
Percent AmountCurrent Gross Estate 100% $2,504,844
.
. Settlement Costs 5.30% $132,742.
. Estate Taxes 18.68% $468,029.
. Amount to Beneficiaries 76.02% $1,904,073
Amount to Beneficiaries includes current life insurance held outside of the estate.Liability balances (if any) remaining at the last death are paid prior to payment ofother settlement costs, taxes, or distributions to beneficiaries.
AssumptionsData in the charts above assume that Richard dies first. Richard LindaProbate expenses (as a percent of the probate estate) 0.00% 0.00%Administration expenses (as a percent of the gross estate) 5.00% 5.00%Federal estate tax law applied Sunset SunsetOther assumptions apply. See the Data and Assumptions pages (if included) for a complete list.
Estate Planning Analysis Richard and Linda Jones
Prepared by Piper Jaffray Financial Advisor 44 Piper Jaffray
.
Data and Assumptions
Prepared by Piper Jaffray Financial Advisor 45 Piper Jaffray
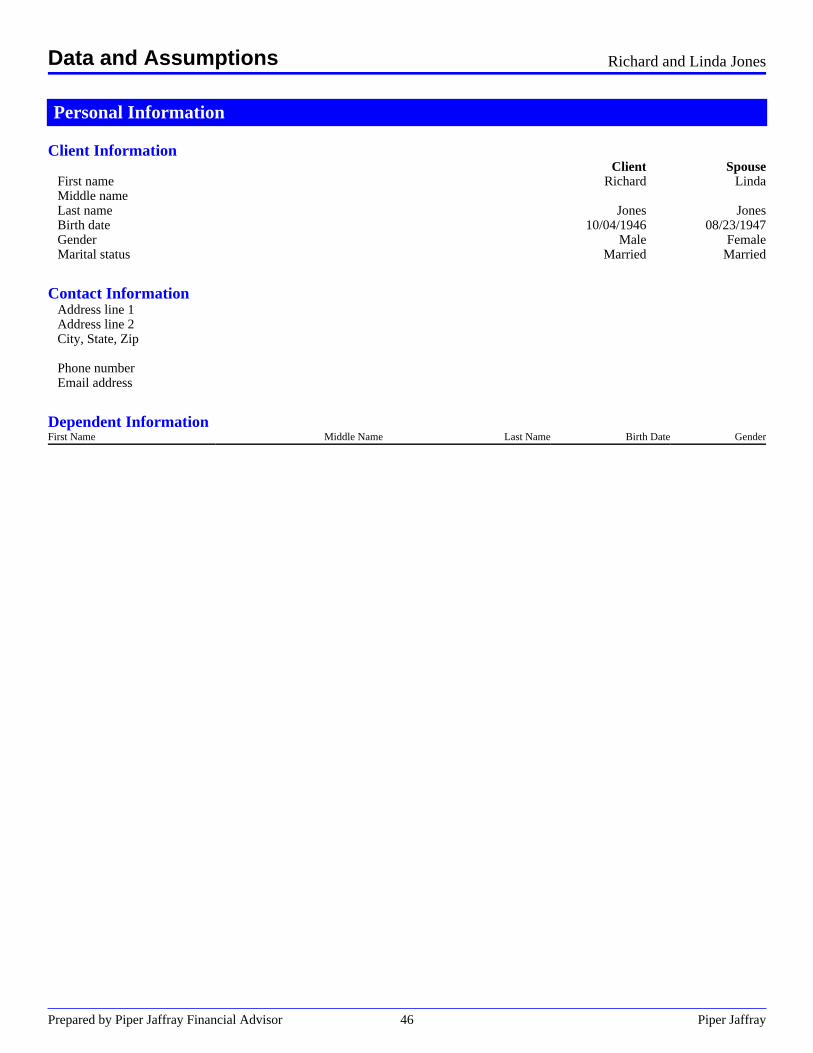
Personal Information
Client InformationClient Spouse
First name Richard LindaMiddle nameLast name Jones JonesBirth date 10/04/1946 08/23/1947Gender Male FemaleMarital status Married Married
.Contact Information
Address line 1Address line 2City, State, Zip
.Phone numberEmail address
.Dependent InformationFirst Name Middle Name Last Name Birth Date Gender
Data and Assumptions Richard and Linda Jones
Prepared by Piper Jaffray Financial Advisor 46 Piper Jaffray

Assumptions
General AssumptionsScenario Main ScenarioPlan date 03/31/2005
.Richard Linda
Earned income growth rate 3.00% 3.00%Desired retirement age 60 58Life expectancy 90 90
.Pre-Retirement Post-Retirement
General inflation rate 3.00% 3.00%Average income tax rate (state and federal) 29.00% 29.00%Average capital gains/dividends tax rate 15.00% 15.00%
.Discount rate 5.00%
.Allocated assets grow at the rate of return from the Present Allocation.
.Post-Retirement Assumptions
Rate of Return Order to LiquidateTaxable accounts 5.00% 1Tax-free accounts 9.00% 3Tax-deferred accounts 8.00% 2Percent of non-retired working spouses income available for retirement 100.00%
.Employer Matching Information - Richard
100.00% match on employee's first 4.00% of pay0.00% match on employee's next 0.00% of pay
.Employer Matching Information - Linda
0.00% match on employee's first 0.00% of pay0.00% match on employee's next 0.00% of pay
Data and Assumptions Richard and Linda Jones
Prepared by Piper Jaffray Financial Advisor 47 Piper Jaffray
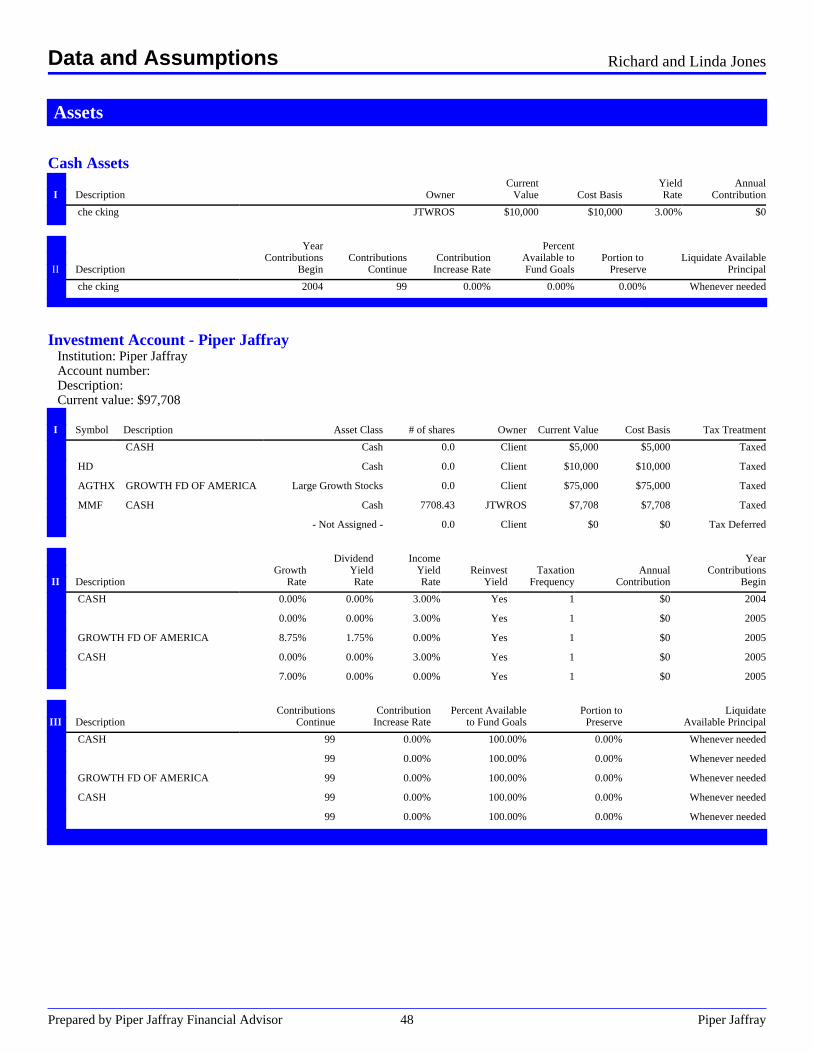
Assets. . . . . . . .
Cash Assets . . .. . . . Current . Yield AnnualI Description . Owner Value Cost Basis Rate Contribution
. che cking JTWROS $10,000 $10,000 3.00% $0
.
. . Year . . Percent . .
. . Contributions Contributions Contribution Available to Portion to Liquidate AvailableII Description Begin Continue Increase Rate Fund Goals Preserve Principal
. che cking 2004 99 0.00% 0.00% 0.00% Whenever needed. .. . . . . . . . .
.Investment Account - Piper Jaffray
Institution: Piper JaffrayAccount number:Description:Current value: $97,708
. .I Symbol Description Asset Class # of shares Owner Current Value Cost Basis Tax Treatment
. CASH Cash 0.0 Client $5,000 $5,000 Taxed
. HD Cash 0.0 Client $10,000 $10,000 Taxed
. AGTHX GROWTH FD OF AMERICA Large Growth Stocks 0.0 Client $75,000 $75,000 Taxed
. MMF CASH Cash 7708.43 JTWROS $7,708 $7,708 Taxed
. - Not Assigned - 0.0 Client $0 $0 Tax Deferred
.
. . Dividend Income Year
. . Growth Yield Yield Reinvest Taxation Annual ContributionsII Description Rate Rate Rate Yield Frequency Contribution Begin
. CASH 0.00% 0.00% 3.00% Yes 1 $0 2004
. 0.00% 0.00% 3.00% Yes 1 $0 2005
. GROWTH FD OF AMERICA 8.75% 1.75% 0.00% Yes 1 $0 2005
. CASH 0.00% 0.00% 3.00% Yes 1 $0 2005
. 7.00% 0.00% 0.00% Yes 1 $0 2005
.
. . Contributions Contribution Percent Available Portion to LiquidateIII Description Continue Increase Rate to Fund Goals Preserve Available Principal
. CASH 99 0.00% 100.00% 0.00% Whenever needed
. 99 0.00% 100.00% 0.00% Whenever needed
. GROWTH FD OF AMERICA 99 0.00% 100.00% 0.00% Whenever needed
. CASH 99 0.00% 100.00% 0.00% Whenever needed
. 99 0.00% 100.00% 0.00% Whenever needed
.. . . . . . . . .
.
Data and Assumptions Richard and Linda Jones
Prepared by Piper Jaffray Financial Advisor 48 Piper Jaffray
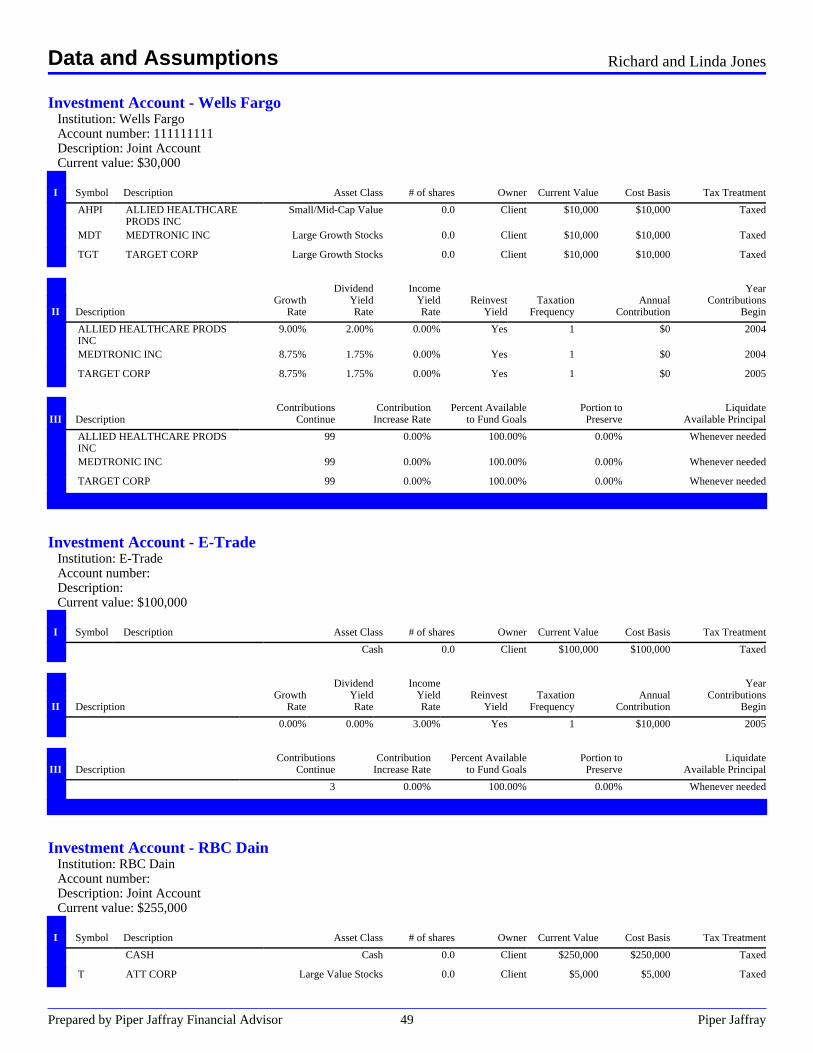
Investment Account - Wells FargoInstitution: Wells FargoAccount number: 111111111Description: Joint AccountCurrent value: $30,000
. .I Symbol Description Asset Class # of shares Owner Current Value Cost Basis Tax Treatment
. AHPI ALLIED HEALTHCAREPRODS INC
Small/Mid-Cap Value 0.0 Client $10,000 $10,000 Taxed
. MDT MEDTRONIC INC Large Growth Stocks 0.0 Client $10,000 $10,000 Taxed
. TGT TARGET CORP Large Growth Stocks 0.0 Client $10,000 $10,000 Taxed
.
. . Dividend Income Year
. . Growth Yield Yield Reinvest Taxation Annual ContributionsII Description Rate Rate Rate Yield Frequency Contribution Begin
. ALLIED HEALTHCARE PRODSINC
9.00% 2.00% 0.00% Yes 1 $0 2004
. MEDTRONIC INC 8.75% 1.75% 0.00% Yes 1 $0 2004
. TARGET CORP 8.75% 1.75% 0.00% Yes 1 $0 2005
.
. . Contributions Contribution Percent Available Portion to LiquidateIII Description Continue Increase Rate to Fund Goals Preserve Available Principal
. ALLIED HEALTHCARE PRODSINC
99 0.00% 100.00% 0.00% Whenever needed
. MEDTRONIC INC 99 0.00% 100.00% 0.00% Whenever needed
. TARGET CORP 99 0.00% 100.00% 0.00% Whenever needed
.. . . . . . . . .
.Investment Account - E-Trade
Institution: E-TradeAccount number:Description:Current value: $100,000
. .I Symbol Description Asset Class # of shares Owner Current Value Cost Basis Tax Treatment
. Cash 0.0 Client $100,000 $100,000 Taxed
.
. . Dividend Income Year
. . Growth Yield Yield Reinvest Taxation Annual ContributionsII Description Rate Rate Rate Yield Frequency Contribution Begin
. 0.00% 0.00% 3.00% Yes 1 $10,000 2005
.
. . Contributions Contribution Percent Available Portion to LiquidateIII Description Continue Increase Rate to Fund Goals Preserve Available Principal
. 3 0.00% 100.00% 0.00% Whenever needed
.. . . . . . . . .
.Investment Account - RBC Dain
Institution: RBC DainAccount number:Description: Joint AccountCurrent value: $255,000
. .I Symbol Description Asset Class # of shares Owner Current Value Cost Basis Tax Treatment
. CASH Cash 0.0 Client $250,000 $250,000 Taxed
. T ATT CORP Large Value Stocks 0.0 Client $5,000 $5,000 Taxed
Data and Assumptions Richard and Linda Jones
Prepared by Piper Jaffray Financial Advisor 49 Piper Jaffray
.
. . Dividend Income Year
. . Growth Yield Yield Reinvest Taxation Annual ContributionsII Description Rate Rate Rate Yield Frequency Contribution Begin
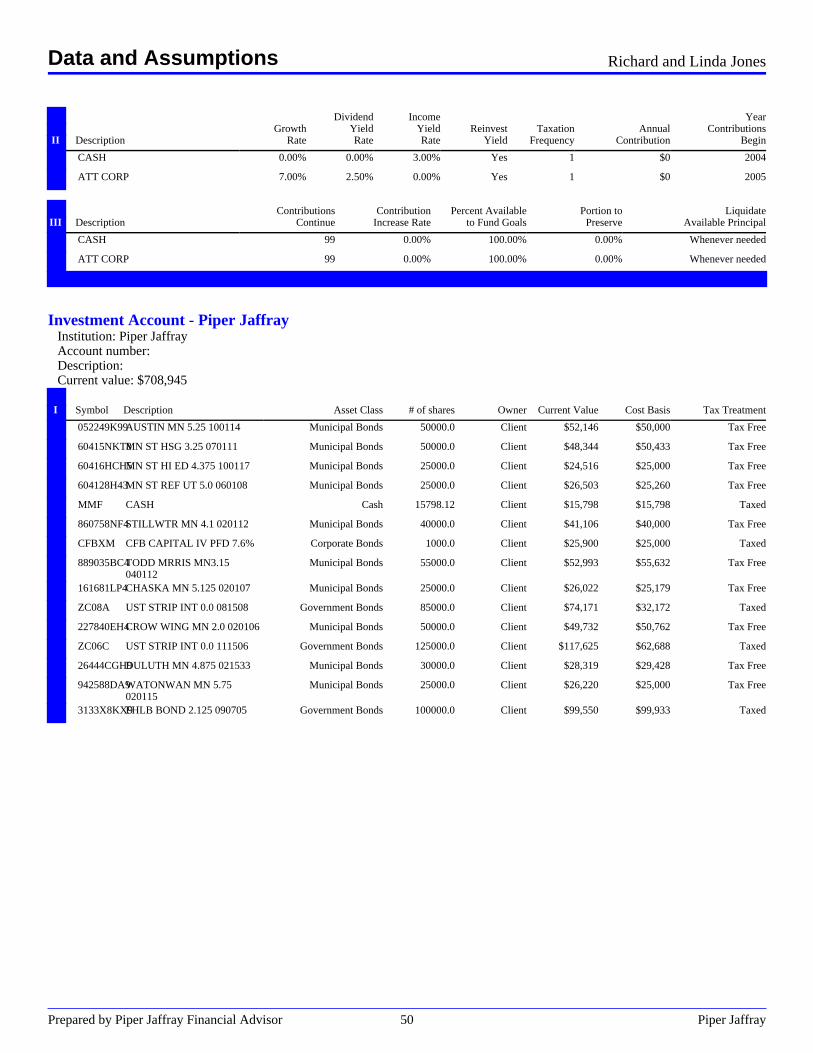
. CASH 0.00% 0.00% 3.00% Yes 1 $0 2004
. ATT CORP 7.00% 2.50% 0.00% Yes 1 $0 2005
.
. . Contributions Contribution Percent Available Portion to LiquidateIII Description Continue Increase Rate to Fund Goals Preserve Available Principal
. CASH 99 0.00% 100.00% 0.00% Whenever needed
. ATT CORP 99 0.00% 100.00% 0.00% Whenever needed
.. . . . . . . . .
.Investment Account - Piper Jaffray
Institution: Piper JaffrayAccount number:Description:Current value: $708,945
. .I Symbol Description Asset Class # of shares Owner Current Value Cost Basis Tax Treatment
. 052249K99AUSTIN MN 5.25 100114 Municipal Bonds 50000.0 Client $52,146 $50,000 Tax Free
. 60415NKT8MN ST HSG 3.25 070111 Municipal Bonds 50000.0 Client $48,344 $50,433 Tax Free
. 60416HCH5MN ST HI ED 4.375 100117 Municipal Bonds 25000.0 Client $24,516 $25,000 Tax Free
. 604128H43MN ST REF UT 5.0 060108 Municipal Bonds 25000.0 Client $26,503 $25,260 Tax Free
. MMF CASH Cash 15798.12 Client $15,798 $15,798 Taxed
. 860758NF4STILLWTR MN 4.1 020112 Municipal Bonds 40000.0 Client $41,106 $40,000 Tax Free
. CFBXM CFB CAPITAL IV PFD 7.6% Corporate Bonds 1000.0 Client $25,900 $25,000 Taxed
. 889035BC4TODD MRRIS MN3.15040112
Municipal Bonds 55000.0 Client $52,993 $55,632 Tax Free
. 161681LP4CHASKA MN 5.125 020107 Municipal Bonds 25000.0 Client $26,022 $25,179 Tax Free
. ZC08A UST STRIP INT 0.0 081508 Government Bonds 85000.0 Client $74,171 $32,172 Taxed
. 227840EH4CROW WING MN 2.0 020106 Municipal Bonds 50000.0 Client $49,732 $50,762 Tax Free
. ZC06C UST STRIP INT 0.0 111506 Government Bonds 125000.0 Client $117,625 $62,688 Taxed
. 26444CGH9DULUTH MN 4.875 021533 Municipal Bonds 30000.0 Client $28,319 $29,428 Tax Free
. 942588DA9WATONWAN MN 5.75020115
Municipal Bonds 25000.0 Client $26,220 $25,000 Tax Free
. 3133X8KX9FHLB BOND 2.125 090705 Government Bonds 100000.0 Client $99,550 $99,933 Taxed
.
Data and Assumptions Richard and Linda Jones
Prepared by Piper Jaffray Financial Advisor 50 Piper Jaffray
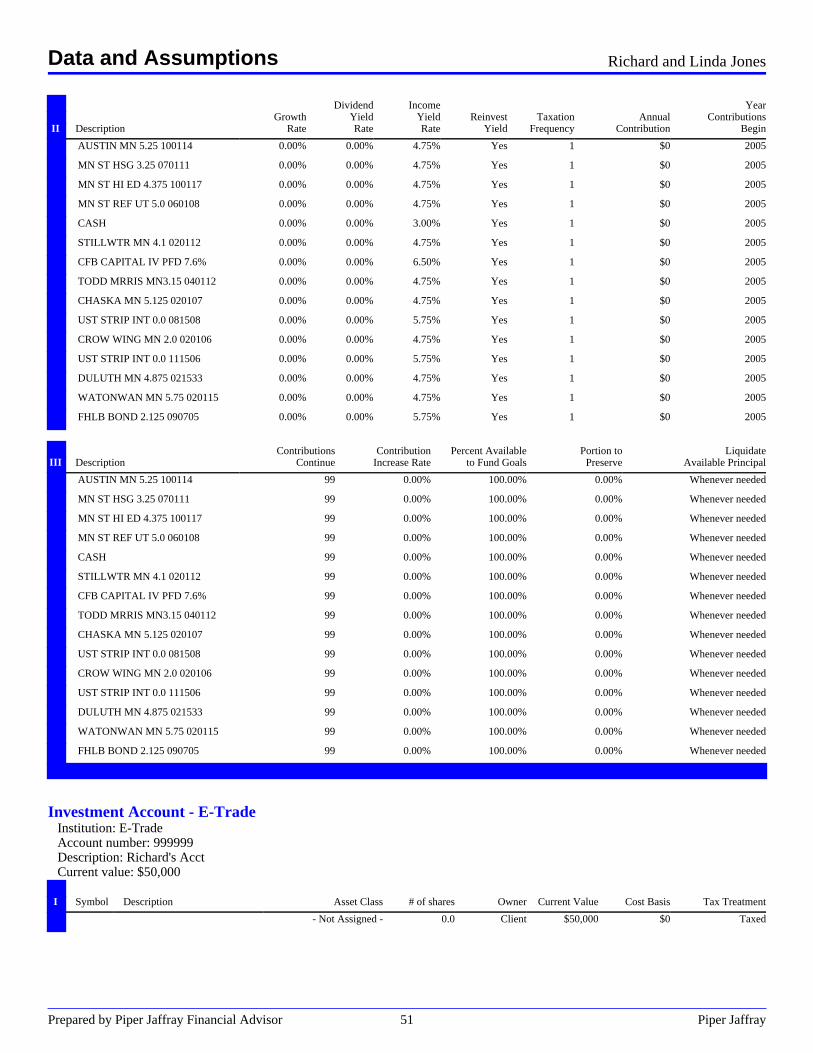
. . Dividend Income Year
. . Growth Yield Yield Reinvest Taxation Annual ContributionsII Description Rate Rate Rate Yield Frequency Contribution Begin
. AUSTIN MN 5.25 100114 0.00% 0.00% 4.75% Yes 1 $0 2005
. MN ST HSG 3.25 070111 0.00% 0.00% 4.75% Yes 1 $0 2005
. MN ST HI ED 4.375 100117 0.00% 0.00% 4.75% Yes 1 $0 2005
. MN ST REF UT 5.0 060108 0.00% 0.00% 4.75% Yes 1 $0 2005
. CASH 0.00% 0.00% 3.00% Yes 1 $0 2005
. STILLWTR MN 4.1 020112 0.00% 0.00% 4.75% Yes 1 $0 2005
. CFB CAPITAL IV PFD 7.6% 0.00% 0.00% 6.50% Yes 1 $0 2005
. TODD MRRIS MN3.15 040112 0.00% 0.00% 4.75% Yes 1 $0 2005
. CHASKA MN 5.125 020107 0.00% 0.00% 4.75% Yes 1 $0 2005
. UST STRIP INT 0.0 081508 0.00% 0.00% 5.75% Yes 1 $0 2005
. CROW WING MN 2.0 020106 0.00% 0.00% 4.75% Yes 1 $0 2005
. UST STRIP INT 0.0 111506 0.00% 0.00% 5.75% Yes 1 $0 2005
. DULUTH MN 4.875 021533 0.00% 0.00% 4.75% Yes 1 $0 2005
. WATONWAN MN 5.75 020115 0.00% 0.00% 4.75% Yes 1 $0 2005
. FHLB BOND 2.125 090705 0.00% 0.00% 5.75% Yes 1 $0 2005
.
. . Contributions Contribution Percent Available Portion to LiquidateIII Description Continue Increase Rate to Fund Goals Preserve Available Principal
. AUSTIN MN 5.25 100114 99 0.00% 100.00% 0.00% Whenever needed
. MN ST HSG 3.25 070111 99 0.00% 100.00% 0.00% Whenever needed
. MN ST HI ED 4.375 100117 99 0.00% 100.00% 0.00% Whenever needed
. MN ST REF UT 5.0 060108 99 0.00% 100.00% 0.00% Whenever needed
. CASH 99 0.00% 100.00% 0.00% Whenever needed
. STILLWTR MN 4.1 020112 99 0.00% 100.00% 0.00% Whenever needed
. CFB CAPITAL IV PFD 7.6% 99 0.00% 100.00% 0.00% Whenever needed
. TODD MRRIS MN3.15 040112 99 0.00% 100.00% 0.00% Whenever needed
. CHASKA MN 5.125 020107 99 0.00% 100.00% 0.00% Whenever needed
. UST STRIP INT 0.0 081508 99 0.00% 100.00% 0.00% Whenever needed
. CROW WING MN 2.0 020106 99 0.00% 100.00% 0.00% Whenever needed
. UST STRIP INT 0.0 111506 99 0.00% 100.00% 0.00% Whenever needed
. DULUTH MN 4.875 021533 99 0.00% 100.00% 0.00% Whenever needed
. WATONWAN MN 5.75 020115 99 0.00% 100.00% 0.00% Whenever needed
. FHLB BOND 2.125 090705 99 0.00% 100.00% 0.00% Whenever needed
.. . . . . . . . .
.Investment Account - E-Trade
Institution: E-TradeAccount number: 999999Description: Richard's AcctCurrent value: $50,000
. .I Symbol Description Asset Class # of shares Owner Current Value Cost Basis Tax Treatment
. - Not Assigned - 0.0 Client $50,000 $0 Taxed
.
Data and Assumptions Richard and Linda Jones
Prepared by Piper Jaffray Financial Advisor 51 Piper Jaffray
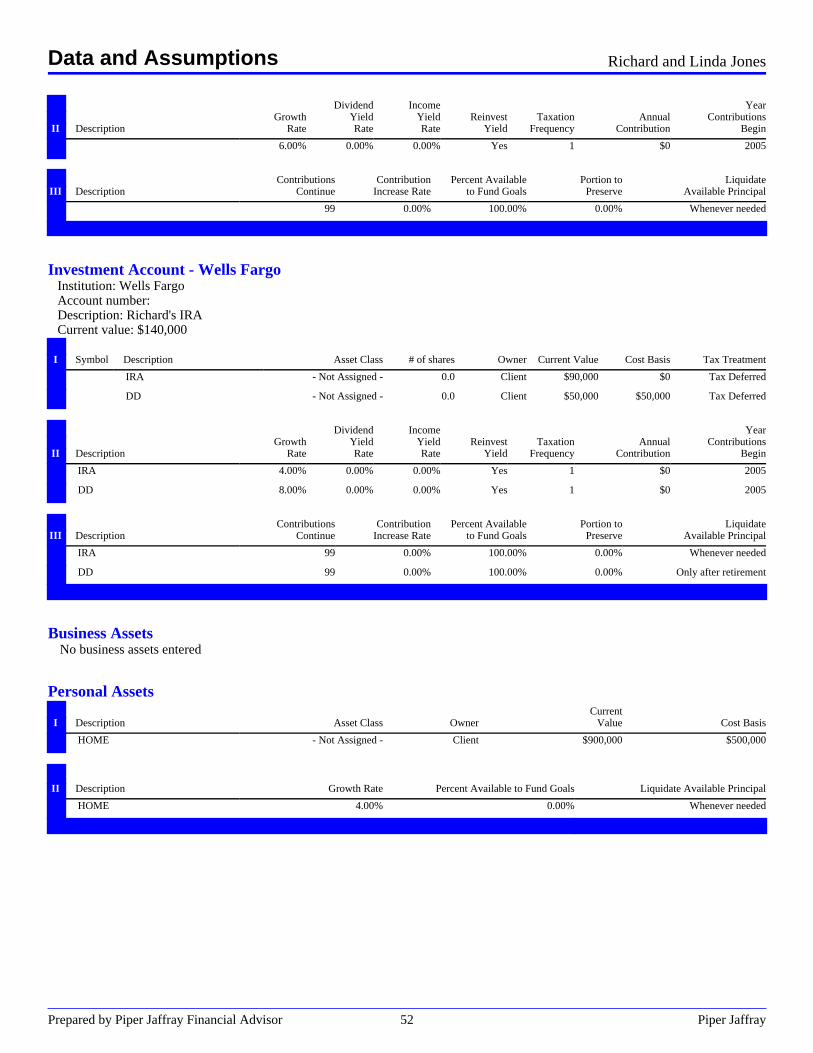
. . Dividend Income Year
. . Growth Yield Yield Reinvest Taxation Annual ContributionsII Description Rate Rate Rate Yield Frequency Contribution Begin
. 6.00% 0.00% 0.00% Yes 1 $0 2005
.
. . Contributions Contribution Percent Available Portion to LiquidateIII Description Continue Increase Rate to Fund Goals Preserve Available Principal
. 99 0.00% 100.00% 0.00% Whenever needed
.. . . . . . . . .
.Investment Account - Wells Fargo
Institution: Wells FargoAccount number:Description: Richard's IRACurrent value: $140,000
. .I Symbol Description Asset Class # of shares Owner Current Value Cost Basis Tax Treatment
. IRA - Not Assigned - 0.0 Client $90,000 $0 Tax Deferred
. DD - Not Assigned - 0.0 Client $50,000 $50,000 Tax Deferred
.
. . Dividend Income Year
. . Growth Yield Yield Reinvest Taxation Annual ContributionsII Description Rate Rate Rate Yield Frequency Contribution Begin
. IRA 4.00% 0.00% 0.00% Yes 1 $0 2005
. DD 8.00% 0.00% 0.00% Yes 1 $0 2005
.
. . Contributions Contribution Percent Available Portion to LiquidateIII Description Continue Increase Rate to Fund Goals Preserve Available Principal
. IRA 99 0.00% 100.00% 0.00% Whenever needed
. DD 99 0.00% 100.00% 0.00% Only after retirement
.. . . . . . .
.Business Assets
No business assets entered. . . . . .
.Personal Assets
. . . . Current .I Description Asset Class Owner Value Cost Basis
. HOME - Not Assigned - Client $900,000 $500,000
.
. .II Description Growth Rate Percent Available to Fund Goals Liquidate Available Principal
. HOME 4.00% 0.00% Whenever needed
. .. . . . . . . . .
.
Data and Assumptions Richard and Linda Jones
Prepared by Piper Jaffray Financial Advisor 52 Piper Jaffray

Retirement Account - Piper JaffrayInstitution: Piper JaffrayAccount number:Description:Current value: $114,087
. .I Symbol Description Asset Class # of shares Type Owner Current Value Cost Basis
. AGTHX GROWTH FUND OF AMER Large Growth Stocks 0.0 Trad IRA Client $25,000 $0
. AEPGX AMER FDS EUROPACIFICGR
Intl. Developed 0.0 Trad IRA Client $25,000 $0
. MMF Cash 0.0 Trad IRA Client $5,000 $0
. KOPPX KOPP EMERGING GROWTH Small/Mid-Cap Growth 0.0 401(k) Client $2,000 $0
. HALAX HARTFORD GLBL LEAD CLA
Intl. Developed 201.561 403(b) Spouse $3,231 $0
. HGLBX HARTFORD GLBL LEAD CLB
Intl. Developed 165.798 403(b) Spouse $2,532 $0
. HMVAX HARTFORD MID CAPVALUE A
Small/Mid-Cap Value 260.713 403(b) Spouse $3,366 $0
. HMVBX HARTFORD MID CAPVALUE B
Small/Mid-Cap Value 233.879 403(b) Spouse $2,933 $0
. ITTAX HARTFORD MUT ADVSRSCL A
Large Value Stocks 576.541 403(b) Spouse $8,504 $0
. IHABX HARTFORD MUT ADVSRSCL B
Large Value Stocks 539.801 403(b) Spouse $7,886 $0
. ITHAX HARTFORD MUT CAP APPRA
Large Value Stocks 93.592 403(b) Spouse $3,096 $0
. MMF CASH Cash 0.38 403(b) Spouse $0 $0
. IHCAX HARTFORD MUT CAP APPRB
Large Value Stocks 213.508 403(b) Spouse $6,587 $0
. NYVCX DAVIS NEW YORKVENTURE C
Large Value Stocks 111.427 403(b) Spouse $3,294 $0
. IHGIX HARTFORD MUT DIV GR A Large Value Stocks 261.569 403(b) Spouse $4,876 $0
. ITDGX HARTFORD MUT DIV GR B Large Value Stocks 585.958 403(b) Spouse $10,782 $0
.
. . . . . .II Description Tax Treatment Rate of Return Personal Annual Contribution Employer Match
. GROWTH FUND OF AMER Deferred (Pre-Tax) 10.50% $0 No
. AMER FDS EUROPACIFIC GR Deferred (Pre-Tax) 11.00% $0 No
. MMF Deferred (Pre-Tax) 3.00% $3,000 No
. KOPP EMERGING GROWTH Deferred (Pre-Tax) 11.60% $0 No
. HARTFORD GLBL LEAD CL A Deferred (Pre-Tax) 11.00% $0 No
. HARTFORD GLBL LEAD CL B Deferred (Pre-Tax) 11.00% $0 No
. HARTFORD MID CAP VALUE A Deferred (Pre-Tax) 11.00% $0 No
. HARTFORD MID CAP VALUE B Deferred (Pre-Tax) 11.00% $0 No
. HARTFORD MUT ADVSRS CL A Deferred (Pre-Tax) 9.50% $0 No
. HARTFORD MUT ADVSRS CL B Deferred (Pre-Tax) 9.50% $0 No
. HARTFORD MUT CAP APPR A Deferred (Pre-Tax) 9.50% $0 No
. CASH Deferred (Pre-Tax) 3.00% $0 No
. HARTFORD MUT CAP APPR B Deferred (Pre-Tax) 9.50% $0 No
. DAVIS NEW YORK VENTURE C Deferred (Pre-Tax) 9.50% $0 No
. HARTFORD MUT DIV GR A Deferred (Pre-Tax) 9.50% $0 No
. HARTFORD MUT DIV GR B Deferred (Pre-Tax) 9.50% $0 No
.
. . Employer-Only Annual Year Contributions Contributions Contribution Increase
Data and Assumptions Richard and Linda Jones
Prepared by Piper Jaffray Financial Advisor 53 Piper Jaffray

III Description Contribution Begin Continue Rate
. GROWTH FUND OF AMER $0 2004 99 0.00%
. AMER FDS EUROPACIFIC GR $0 2004 99 0.00%
. MMF $0 2004 99 0.00%
. KOPP EMERGING GROWTH $0 2004 99 0.00%
. HARTFORD GLBL LEAD CL A $0 2005 99 0.00%
. HARTFORD GLBL LEAD CL B $0 2005 99 0.00%
. HARTFORD MID CAP VALUE A $0 2005 99 0.00%
. HARTFORD MID CAP VALUE B $0 2005 99 0.00%
. HARTFORD MUT ADVSRS CL A $0 2005 99 0.00%
. HARTFORD MUT ADVSRS CL B $0 2005 99 0.00%
. HARTFORD MUT CAP APPR A $0 2005 99 0.00%
. CASH $0 2005 99 0.00%
. HARTFORD MUT CAP APPR B $0 2005 99 0.00%
. DAVIS NEW YORK VENTURE C $0 2005 99 0.00%
. HARTFORD MUT DIV GR A $0 2005 99 0.00%
. HARTFORD MUT DIV GR B $0 2005 99 0.00%
.. . . . . . . . .
.Retirement Account - Medtronic Retirement Plan
Institution: Medtronic Retirement PlanAccount number: 9999999Description: Richard's 401KCurrent value: $145,000
. .I Symbol Description Asset Class # of shares Type Owner Current Value Cost Basis
. Various Funds Large Growth Stocks 0.0 401(k) Client $145,000 $0
.
. . . . . .II Description Tax Treatment Rate of Return Personal Annual Contribution Employer Match
. Various Funds Deferred (Pre-Tax) 10.50% $11,000 No
.
. . Employer-Only Annual Year Contributions Contributions Contribution IncreaseIII Description Contribution Begin Continue Rate
. Various Funds $2,000 2004 99 0.00%
.. . . . . . . . .
.Retirement Account - Piper Jaffray
Institution: Piper JaffrayAccount number:22222222Description:Current value: $27,730
. .I Symbol Description Asset Class # of shares Type Owner Current Value Cost Basis
. MMF CASH Cash 128.4 Trad IRA Client $128 $0
. HGWAX HARTFORD FORTISGRWTH A
Large Growth Stocks 220.757 Trad IRA Client $3,572 $0
. HD HOME DEPOT INC Large Growth Stocks 201.729 Trad IRA Client $7,696 $0
. KEGCX KOPP EMERGING GRWTHCL C
Small/Mid-Cap Growth 633.383 Trad IRA Client $4,896 $0
. MSFT MICROSOFT CORP Large Growth Stocks 192.141 Trad IRA Client $4,642 $0
. USB U S BANCORP DE NEW Large Value Stocks 237.38 Trad IRA Client $6,796 $0
Data and Assumptions Richard and Linda Jones
Prepared by Piper Jaffray Financial Advisor 54 Piper Jaffray
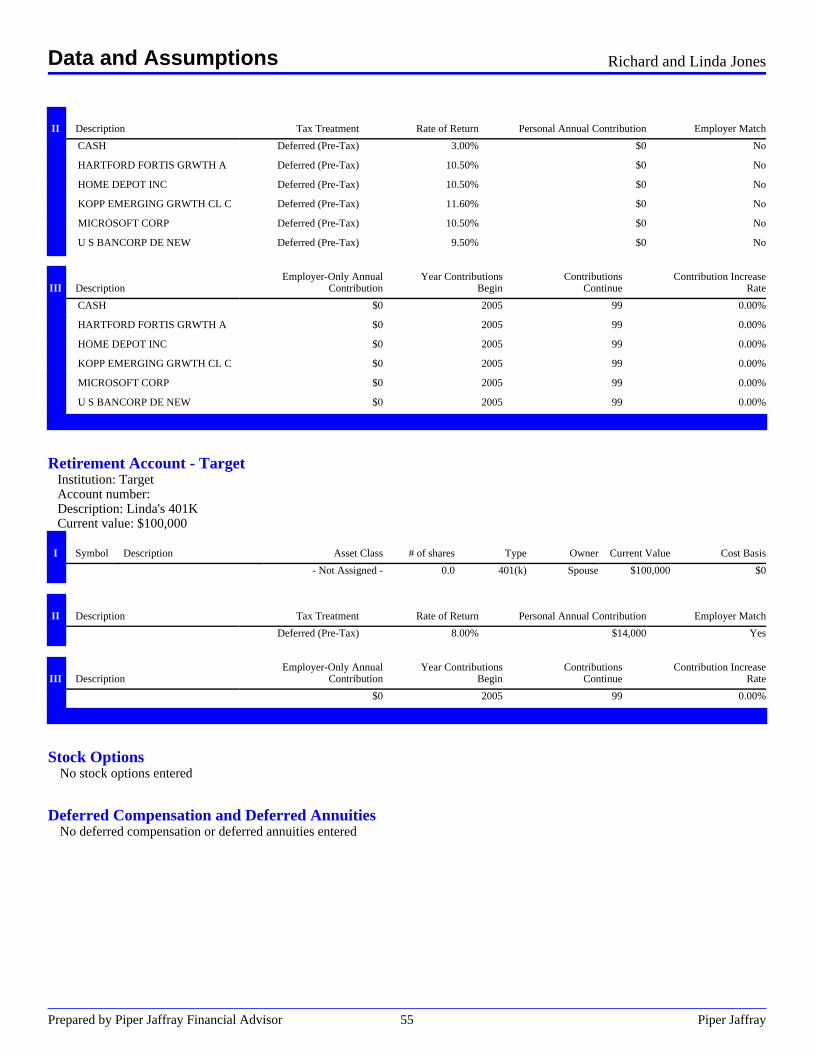
.
. . . . . .II Description Tax Treatment Rate of Return Personal Annual Contribution Employer Match
. CASH Deferred (Pre-Tax) 3.00% $0 No
. HARTFORD FORTIS GRWTH A Deferred (Pre-Tax) 10.50% $0 No
. HOME DEPOT INC Deferred (Pre-Tax) 10.50% $0 No
. KOPP EMERGING GRWTH CL C Deferred (Pre-Tax) 11.60% $0 No
. MICROSOFT CORP Deferred (Pre-Tax) 10.50% $0 No
. U S BANCORP DE NEW Deferred (Pre-Tax) 9.50% $0 No
.
. . Employer-Only Annual Year Contributions Contributions Contribution IncreaseIII Description Contribution Begin Continue Rate
. CASH $0 2005 99 0.00%
. HARTFORD FORTIS GRWTH A $0 2005 99 0.00%
. HOME DEPOT INC $0 2005 99 0.00%
. KOPP EMERGING GRWTH CL C $0 2005 99 0.00%
. MICROSOFT CORP $0 2005 99 0.00%
. U S BANCORP DE NEW $0 2005 99 0.00%
.. . . . . . . . .
.Retirement Account - Target
Institution: TargetAccount number:Description: Linda's 401KCurrent value: $100,000
. .I Symbol Description Asset Class # of shares Type Owner Current Value Cost Basis
. - Not Assigned - 0.0 401(k) Spouse $100,000 $0
.
. . . . . .II Description Tax Treatment Rate of Return Personal Annual Contribution Employer Match
. Deferred (Pre-Tax) 8.00% $14,000 Yes
.
. . Employer-Only Annual Year Contributions Contributions Contribution IncreaseIII Description Contribution Begin Continue Rate
. $0 2005 99 0.00%
.. . . . . . .
.Stock Options
No stock options entered. . . . . . . .
.Deferred Compensation and Deferred Annuities
No deferred compensation or deferred annuities entered
Data and Assumptions Richard and Linda Jones
Prepared by Piper Jaffray Financial Advisor 55 Piper Jaffray
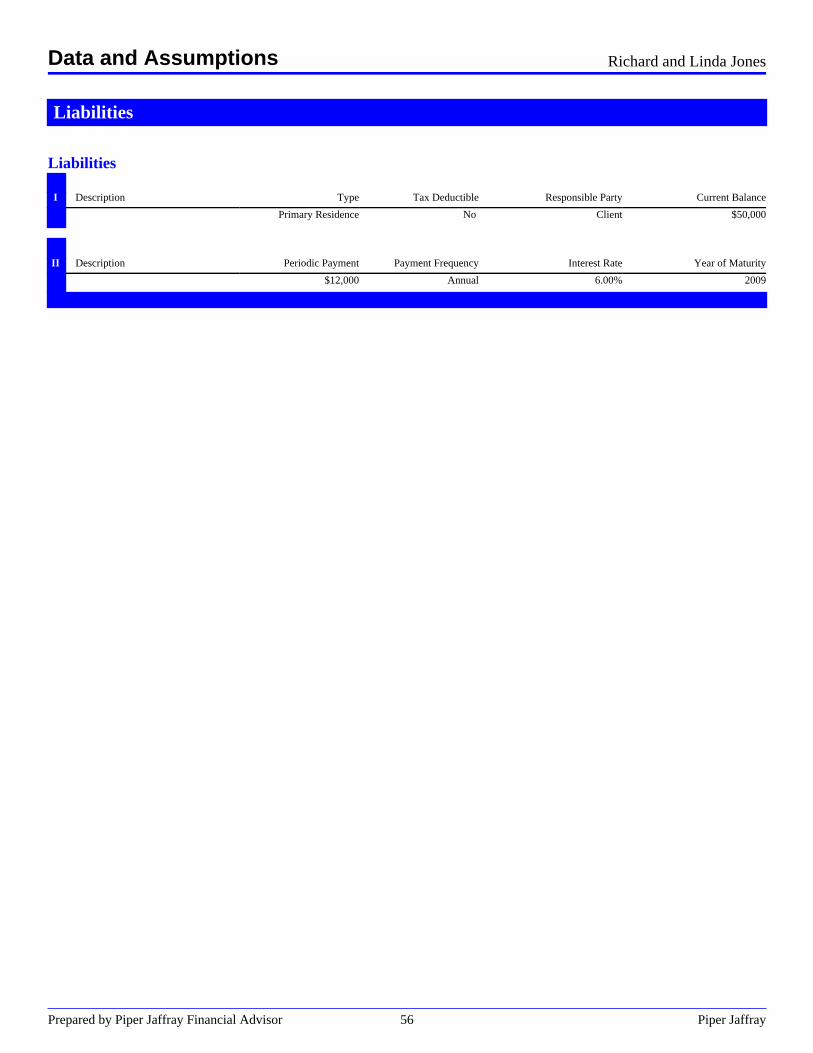
Liabilities. . . . . .
Liabilities. .I Description Type Tax Deductible Responsible Party Current Balance
. Primary Residence No Client $50,000
.
. .II Description Periodic Payment Payment Frequency Interest Rate Year of Maturity
. $12,000 Annual 6.00% 2009
.
Data and Assumptions Richard and Linda Jones
Prepared by Piper Jaffray Financial Advisor 56 Piper Jaffray
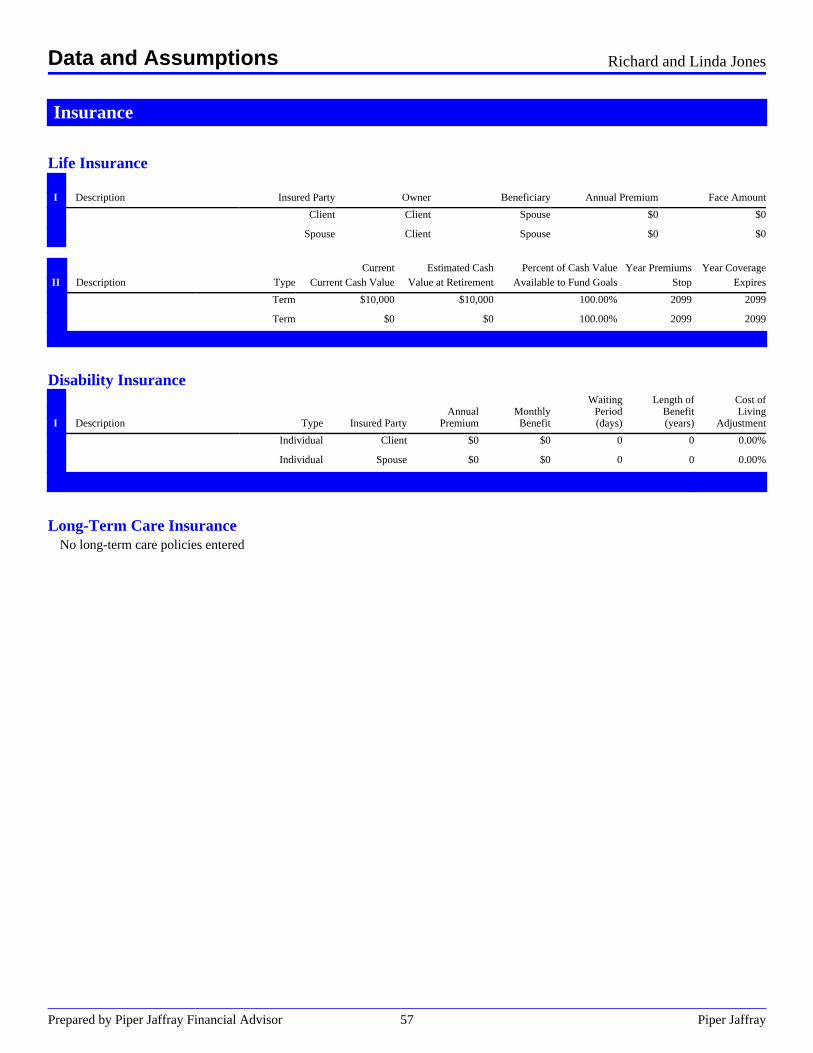
Insurance. . . . . . .
Life Insurance. .I Description Insured Party Owner Beneficiary Annual Premium Face Amount
. Client Client Spouse $0 $0
. Spouse Client Spouse $0 $0
.
. . . Current Estimated Cash Percent of Cash Value Year Premiums Year CoverageII Description Type Current Cash Value Value at Retirement Available to Fund Goals Stop Expires
. Term $10,000 $10,000 100.00% 2099 2099
. Term $0 $0 100.00% 2099 2099
.. . . . . . . . .
.Disability Insurance
. . . . . . Waiting Length of Cost of
. . . . Annual Monthly Period Benefit LivingI Description Type Insured Party Premium Benefit (days) (years) Adjustment
. Individual Client $0 $0 0 0 0.00%
. Individual Spouse $0 $0 0 0 0.00%
. .. . . . . . . .
Long-Term Care Insurance. . . . . . . .
No long-term care policies entered.
Data and Assumptions Richard and Linda Jones
Prepared by Piper Jaffray Financial Advisor 57 Piper Jaffray
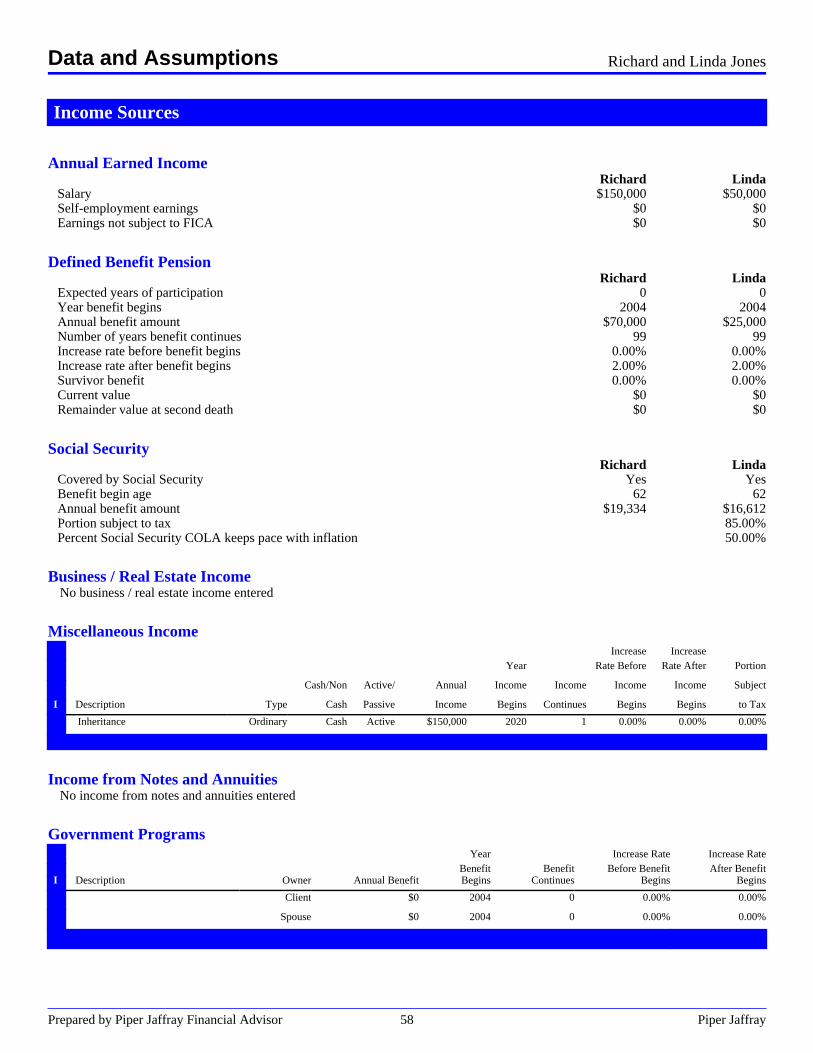
Income Sources. . .
Annual Earned IncomeRichard Linda
Salary $150,000 $50,000Self-employment earnings $0 $0Earnings not subject to FICA $0 $0
.Defined Benefit Pension
Richard LindaExpected years of participation 0 0Year benefit begins 2004 2004Annual benefit amount $70,000 $25,000Number of years benefit continues 99 99Increase rate before benefit begins 0.00% 0.00%Increase rate after benefit begins 2.00% 2.00%Survivor benefit 0.00% 0.00%Current value $0 $0Remainder value at second death $0 $0
.Social Security
Richard LindaCovered by Social Security Yes YesBenefit begin age 62 62Annual benefit amount $19,334 $16,612Portion subject to tax 85.00%Percent Social Security COLA keeps pace with inflation 50.00%
. . . . . . .Business / Real Estate Income
No business / real estate income entered
. . . . . . . . .. .
Miscellaneous Income. . . . . . . . Increase Increase .
. . . . . . Year . Rate Before Rate After Portion
. . . Cash/Non Active/ Annual Income Income Income Income Subject
I Description Type Cash Passive Income Begins Continues Begins Begins to Tax
. Inheritance Ordinary Cash Active $150,000 2020 1 0.00% 0.00% 0.00%
.
. . . . . . . . .Income from Notes and Annuities
No income from notes and annuities entered
. . . . . . .Government Programs
. . . . Year . Increase Rate Increase Rate
. . . . Benefit Benefit Before Benefit After BenefitI Description Owner Annual Benefit Begins Continues Begins Begins
. Client $0 2004 0 0.00% 0.00%
. Spouse $0 2004 0 0.00% 0.00%
. .
. . . . . . .
Data and Assumptions Richard and Linda Jones
Prepared by Piper Jaffray Financial Advisor 58 Piper Jaffray
Earnings During RetirementNo earnings during retirement entered
Data and Assumptions Richard and Linda Jones
Prepared by Piper Jaffray Financial Advisor 59 Piper Jaffray
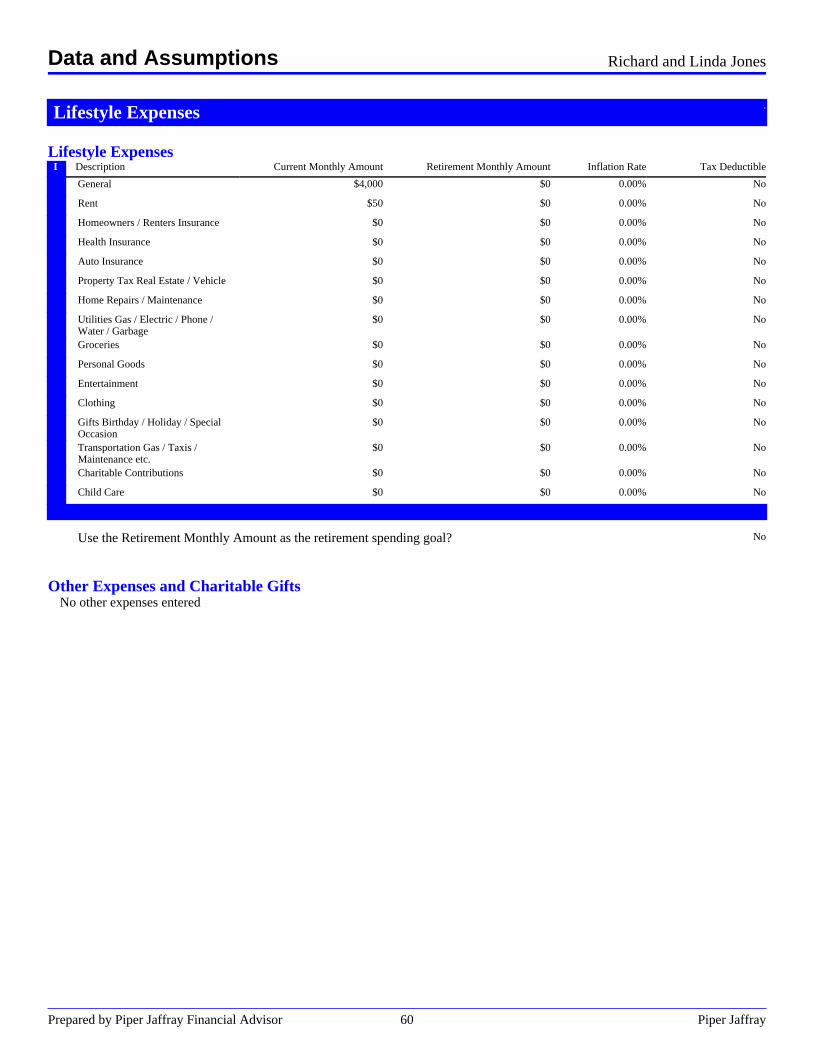
Lifestyle Expenses .
. . . . . .Lifestyle Expenses
I Description Current Monthly Amount Retirement Monthly Amount Inflation Rate Tax Deductible
. General $4,000 $0 0.00% No
. Rent $50 $0 0.00% No
. Homeowners / Renters Insurance $0 $0 0.00% No
. Health Insurance $0 $0 0.00% No
. Auto Insurance $0 $0 0.00% No
. Property Tax Real Estate / Vehicle $0 $0 0.00% No
. Home Repairs / Maintenance $0 $0 0.00% No
. Utilities Gas / Electric / Phone /Water / Garbage
$0 $0 0.00% No
. Groceries $0 $0 0.00% No
. Personal Goods $0 $0 0.00% No
. Entertainment $0 $0 0.00% No
. Clothing $0 $0 0.00% No
. Gifts Birthday / Holiday / SpecialOccasion
$0 $0 0.00% No
. Transportation Gas / Taxis /Maintenance etc.
$0 $0 0.00% No
. Charitable Contributions $0 $0 0.00% No
. Child Care $0 $0 0.00% No
.
Use the Retirement Monthly Amount as the retirement spending goal? No
. . . . . . . . .Other Expenses and Charitable Gifts
No other expenses entered.
Data and Assumptions Richard and Linda Jones
Prepared by Piper Jaffray Financial Advisor 60 Piper Jaffray
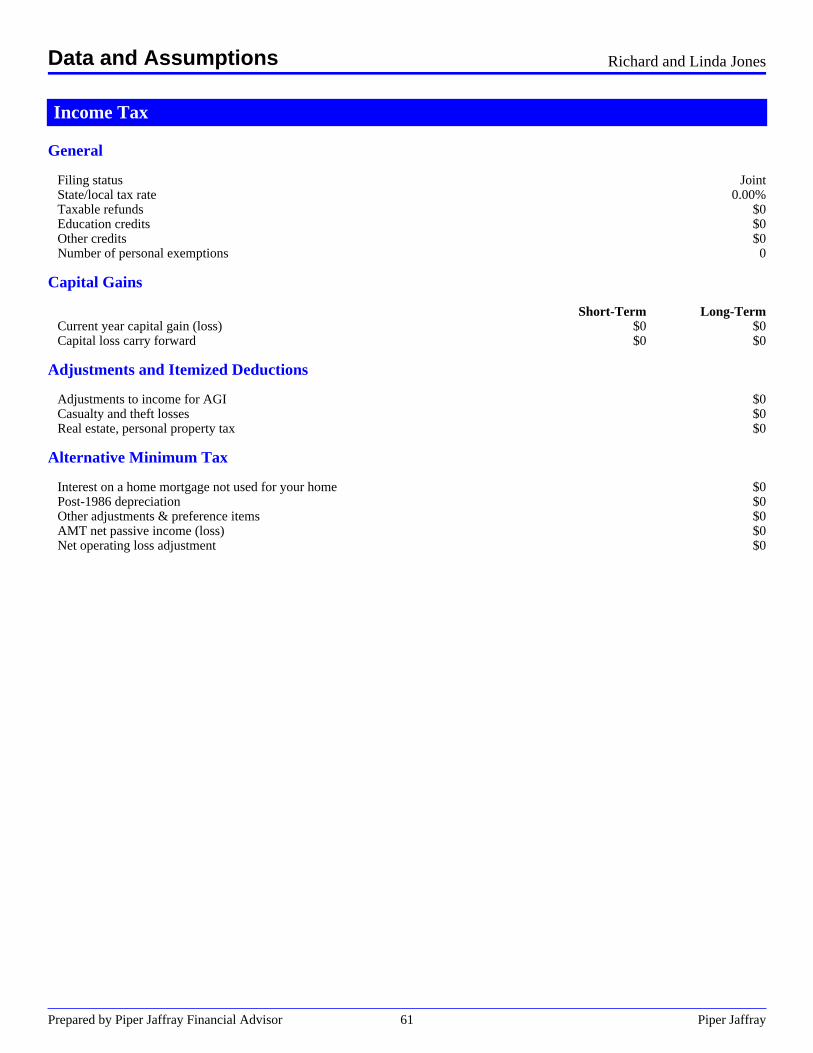
Income Tax
General
Filing status JointState/local tax rate 0.00%Taxable refunds $0Education credits $0Other credits $0Number of personal exemptions 0
Capital Gains
Short-Term Long-TermCurrent year capital gain (loss) $0 $0Capital loss carry forward $0 $0
Adjustments and Itemized Deductions
Adjustments to income for AGI $0Casualty and theft losses $0Real estate, personal property tax $0
Alternative Minimum Tax
Interest on a home mortgage not used for your home $0Post-1986 depreciation $0Other adjustments & preference items $0AMT net passive income (loss) $0Net operating loss adjustment $0
Data and Assumptions Richard and Linda Jones
Prepared by Piper Jaffray Financial Advisor 61 Piper Jaffray
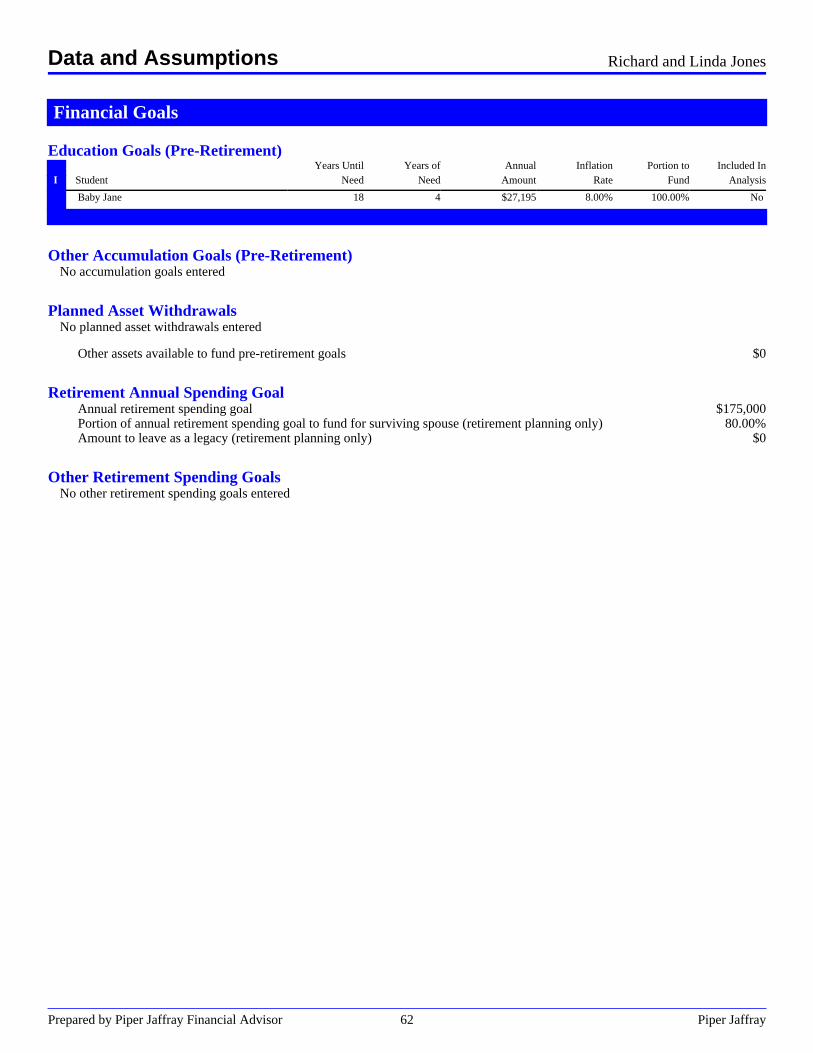
Financial Goals
Education Goals (Pre-Retirement). Years Until Years of Annual Inflation Portion to Included In
I Student Need Need Amount Rate Fund Analysis
. Baby Jane 18 4 $27,195 8.00% 100.00% No
.
.Other Accumulation Goals (Pre-Retirement)
No accumulation goals entered
.Planned Asset Withdrawals
No planned asset withdrawals entered
Other assets available to fund pre-retirement goals $0
.Retirement Annual Spending Goal
Annual retirement spending goal $175,000Portion of annual retirement spending goal to fund for surviving spouse (retirement planning only) 80.00%Amount to leave as a legacy (retirement planning only) $0
.Other Retirement Spending Goals
No other retirement spending goals entered
Data and Assumptions Richard and Linda Jones
Prepared by Piper Jaffray Financial Advisor 62 Piper Jaffray
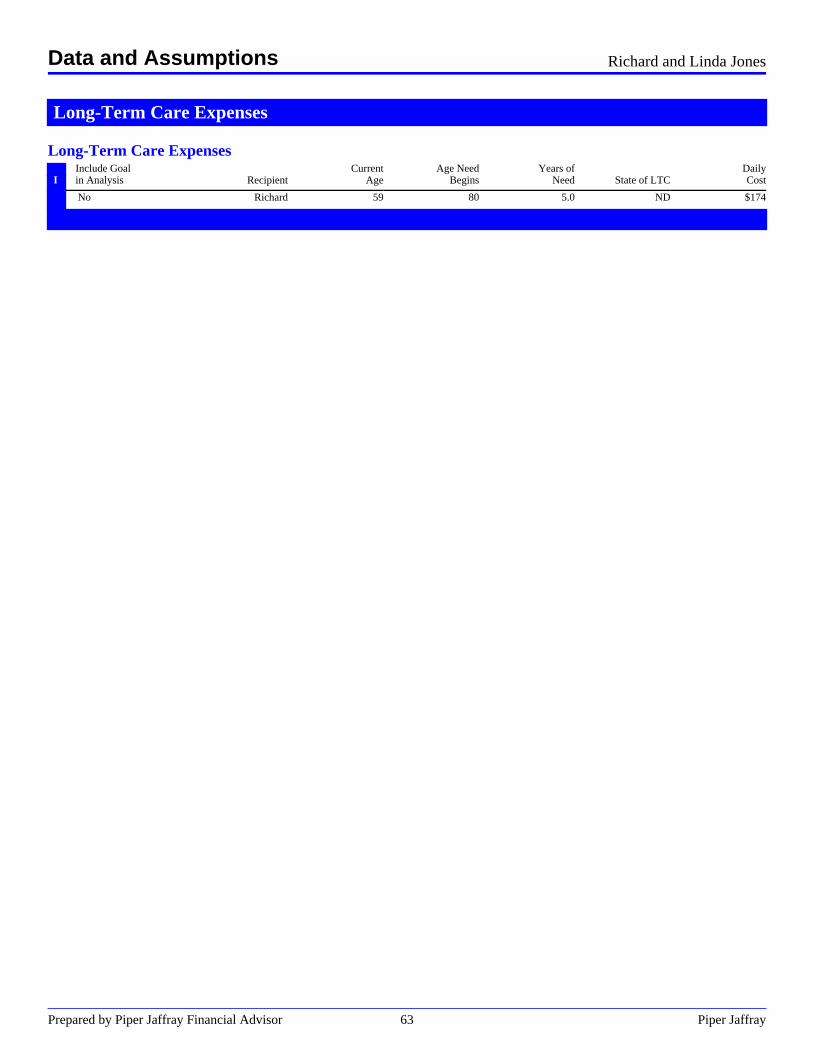
Long-Term Care Expenses
Long-Term Care Expenses. . . . . . . .
. Include Goal . Current Age Need Years of . DailyI in Analysis Recipient Age Begins Need State of LTC Cost
. No Richard 59 80 5.0 ND $174
.
Data and Assumptions Richard and Linda Jones
Prepared by Piper Jaffray Financial Advisor 63 Piper Jaffray
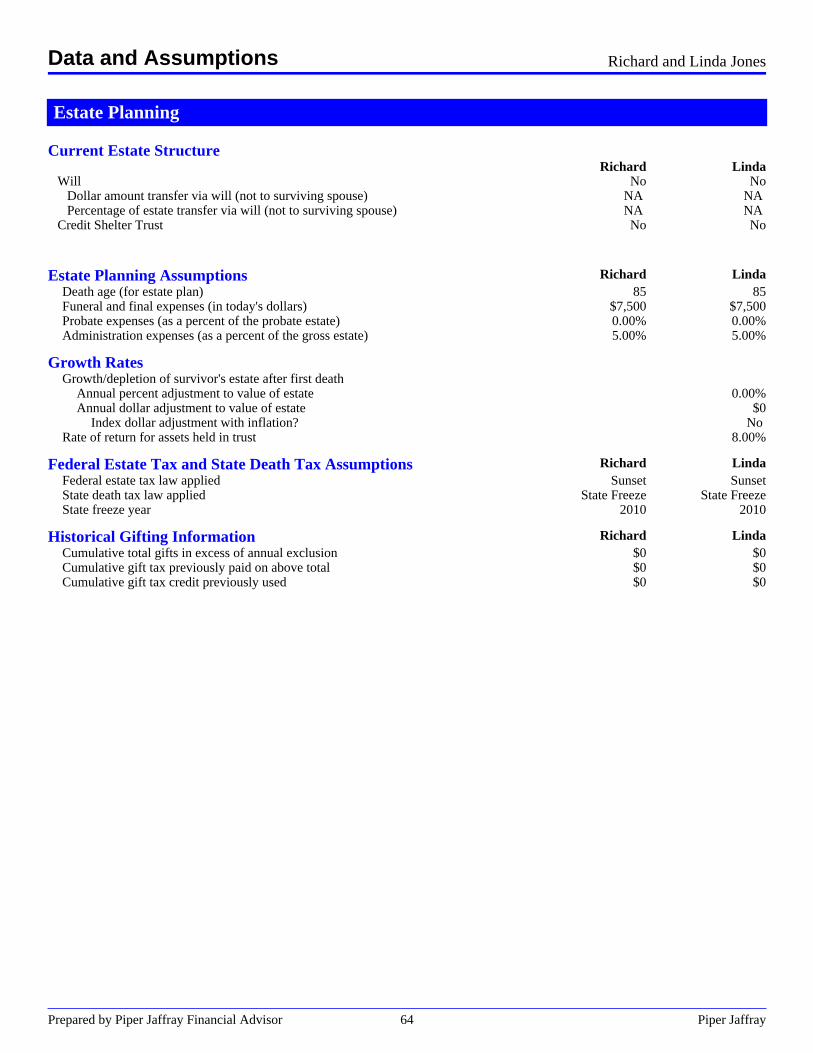
Estate Planning
Current Estate StructureRichard Linda
Will No NoDollar amount transfer via will (not to surviving spouse) NA NAPercentage of estate transfer via will (not to surviving spouse) NA NA
Credit Shelter Trust No No
.
Estate Planning Assumptions Richard LindaDeath age (for estate plan) 85 85Funeral and final expenses (in today's dollars) $7,500 $7,500Probate expenses (as a percent of the probate estate) 0.00% 0.00%Administration expenses (as a percent of the gross estate) 5.00% 5.00%
Growth RatesGrowth/depletion of survivor's estate after first death
Annual percent adjustment to value of estate 0.00%Annual dollar adjustment to value of estate $0
Index dollar adjustment with inflation? NoRate of return for assets held in trust 8.00%
Federal Estate Tax and State Death Tax Assumptions Richard LindaFederal estate tax law applied Sunset SunsetState death tax law applied State Freeze State FreezeState freeze year 2010 2010
Historical Gifting Information Richard LindaCumulative total gifts in excess of annual exclusion $0 $0Cumulative gift tax previously paid on above total $0 $0Cumulative gift tax credit previously used $0 $0
Data and Assumptions Richard and Linda Jones
Prepared by Piper Jaffray Financial Advisor 64 Piper Jaffray

.
Glossary ofKey Terms
Prepared by Piper Jaffray Financial Advisor 65 Piper Jaffray
Asset Allocation Glossary
Aggressive investment mix - Asset mixes that have more risk relative to other mixes are referred to as aggressive. Aggressive mixeswill often provide higher potential returns, but with a greater degree of uncertainty. Aggressive mixes do not always produce higheractual returns than more conservative asset mixes.
Annuity assets - Amounts invested in an annuity contract with an insurance company. Annuity assets accumulate tax-deferred. IRSminimum withdrawal calculations are not applied to annuity assets. When withdrawn, the deferred income is taxed as ordinaryincome.
Asset allocation - The process of determining the proportions of your portfolio that will be invested in the available asset classes.
Asset class - A standard term used to broadly define a category of potential investments.
Asset mix - The percentage weightings (or mix) of different asset classes held in the portfolio. A portfolio may have separate assetmixes for taxable and tax-deferred holdings. The composite asset mix represents the combination of taxable and tax-deferred holdings.
Back test - Shows how the present asset mix and a proposed asset mix might have performed historically if invested among the sameavailable asset classes. Actual historical returns are used to represent the performance of each asset class over a common time period.
Book value - The cost basis of an investment. For nonqualified investments this is generally the amount that was paid for theinvestment when it was originally acquired. If yield is reinvested in the nonqualified investment, the basis is adjusted upwards toreflect the amount reinvested.
Conservative investment mix - Asset mixes that have low risk relative to other mixes are referred to as conservative. Conservativemixes will often provide lower long-term returns than more aggressive asset mixes, but with a greater degree of certainty.
Current dollars - The value of an asset stated in terms of the actual dollars held, not in terms of purchasing power.
Efficient frontier - A line developed by plotting asset mixes, ranging from conservative to aggressive, that provide the best tradeoffbetween risk and return. These efficient asset mixes provide (1) the maximum possible assumed return for a given level of risk and (2)the minimum possible level of risk for a given level of assumed return.
Index proxy - Each asset class is assigned a proxy market index (see market index) that is most representative of that particular assetclass. This index proxy should exhibit underlying financial characteristics similar to those of the asset class. The historical data fromthe proxy is used to simulate the returns for the asset class.
Indices - See market index.
Inflated dollars - A forecast of asset value measured in terms of purchasing power. Because of inflation, investment dollars willprobably not be able to buy as much in the future as they can today.
Market index - Any recognized economic or financial indicator used to evaluate and measure changes in value over the short-termand the long-term.
Nonqualified assets - Assets that are currently subject to federal, state, and local taxes.
Qualified assets - Assets that allow investment earnings to accumulate with tax advantage. Qualified assets are normally invested in a401(k), 403(b), SEP, Keogh, or IRA.
Glossary - Asset Allocation Richard and Linda Jones
Prepared by Piper Jaffray Financial Advisor 66 Piper Jaffray

Asset Allocation Glossary
Return - The increase or decrease in value of an investment expressed as a percentage of the total amount invested. The return or rateof return is the sum of two components: the yield and appreciation. Yield is the income received from the investment. Appreciation isthe growth in value of the investment.
Actual return - The historical return earned by an investment for a given year.
Annual return - The return earned by an investment during a one-year period.
Annualized return - The total return earned by an investment over a multiple year period and reported as the average annualreturn that would need to be earned each year of the period to attain the total performance of the investment.
Assumed return - See expected return.
Compound return - The total, non-annualized return earned by an investment over a multiple-year period. See also total return.
Expected return - The return that an investment is expected to earn in the next year. The expected return is generally reported asthe average historical return over a multiple year period.
Historical return - See actual return.
Inflation adjusted returns - Returns that are adjusted for inflation. The adjustment is made by calculating the difference betweenthe actual returns and the inflation rate.
Range of returns - The range of historical annual returns for an investment over a multiple year period reported as a high and alow return. The reported high is the highest annual return realized during the period. The reported low is the lowest.
Total return - The total return measured by combining the total income received (yield) and all capital appreciation from aninvestment over the entire holding period of that investment.
Yield - The current cash income received from an investment in an asset class. Bonds provide yield in the form of interestpayments. Stocks provide yield through dividends.
Risk - The unpredictability of investment returns. The chance that the actual return from investment in an asset class will be differentfrom its assumed return. Risk is measured statistically using standard deviation.
Risk tolerance analysis - An analysis that attempts to determine the risk tolerance of a client by scoring the client's answers toquestions on a risk profile. The client's risk tolerance is translated to an associated risk region on the efficient frontier, and theportfolio that matches the client's risk tolerance is recommended from the efficient frontier.
Sharpe ratio - A measure of the incremental assumed return (in inflated dollars) provided by an asset class or asset mix for takingadditional risk. Higher Sharpe Ratio values are desirable.
Standard deviation - An estimate of the possible future dispersion (or divergence) of the actual returns from an asset class around itsexpected return. The standard deviation for an asset class represents its estimated average annual investment risk. Investment risk isbased on the notion of uncertainty. The less certain it is that the asset class will generate its expected return, the higher the risk of thatasset class.
Time horizon - The amount of time an investment is held. Asset allocation planning focuses on the long-term financial objectives ofan investor. A growth-oriented asset allocation plan will produce years with losses. In the past, however, the acceptance of short-termrisks has been rewarded with high long-term returns.
Turnover Rate - The estimated average portion of the holdings in an Asset Class that are expected to be bought and sold each year.The turnover rate is used to calculate the realized capital growth and capital gains taxes in financial forecasts.
Yield - The current cash income received from investment in an asset class. Bonds provide yield in the form of interest payments.Stocks provide yield through dividends.
Glossary - Asset Allocation Richard and Linda Jones
Prepared by Piper Jaffray Financial Advisor 67 Piper Jaffray
Accumulation Glossary
Accumulation goal - A goal that will require the use of your savings or investments. The purpose of the goal planning analysis is todetermine if you have accumulated sufficient funds to meet your goals. If you do not have sufficient funds already set aside, thesystem will determine the necessary monthly amount that will need to be invested to meet the goal.
Asset returns - The combined current income and capital appreciation from an investment. Generally, income tax is levied on currentincome in the year it is received and on capital appreciation when the asset is sold, unless the asset is held in a tax-deferred investmentvehicle such as an IRA or other qualified plan.
College Tuition Deduction - Taxpayers may deduct $4,000 per year for qualified higher education expenses. The $4,000 deduction isphased out when adjusted gross income is between certain amounts, depending on tax filing status ($65,000-$80,000 if single, and$130,000-$160,000 if married filing jointly). This deduction is not available during the same year a Hope or Lifetime Learning Creditis claimed for the same student. This deduction is available to taxpayers even if they do not itemize their personal deductions.
Coverdell education savings account - Formerly known as education IRAs, these accounts can be used to fund qualified educationexpenses for grades K-12 and for higher education. Qualified expenses have been expanded to include tutoring, computer equipment,and room and board, in addition to the traditional qualified expenses of tuition and books. Non-deductible contributions of up to$2,000 per student per year may be made. Contributions may continue until the student reaches age 18 and are allowable until April15th following the tax year. Contributions can be made after age 18 for a special needs beneficiary. The $2,000 maximum contributionis phased out for single persons with adjusted gross income between $95,000 and $110,000, and married persons filing jointly withadjusted gross income between $190,000 and $220,000. Earnings grow tax-deferred and distributions are free from federal taxation ifused for qualified expenses. State tax treatment varies. If distributions are not used for qualified expenses they are subject to a federaltax penalty of 10%.
Education funding goal - A goal to accumulate sufficient funds to pay for the costs of educating a student.
Education IRAs - See Coverdell education savings account.
Funding period - The time horizon during which funding for education or other goals continues. For this analysis, the period isassumed to begin today and continue until either 1) withdrawals to meet the need begin or 2) the period of need ends. The analysiswill determine the necessary monthly savings amount required to meet the need based on the type of funding period you choose.
Hope Credit - A taxpayer can claim a tax credit up to a maximum of $1,500 per student per year (100% for the first $1,000 and 50%on the second $1,000 of qualifying educational expenses). The tax credit is phased out when adjusted gross income is between certainamounts, depending on tax filing status ($43,000-$53,000 if single, and $87,000-$107,000 if married filing jointly). To qualify, thestudent must be within their first two years of higher education and registered at least half-time. The credit covers qualified expenses,which are limited to tuition and fees required for enrollment. Books, room and board, and other living expenses are not qualifiedexpenses for this credit.
Income tax - Annual tax levied by the federal government, most states, and some local governments, on an individual's earnings andcapital appreciation.
Inflation - The overall upward price movement of goods and services in an economy, usually measured by the Consumer Price Indexand stated as a rate of increase.
IRAs - A tax-deferred retirement account for an individual that permits individuals to set aside up to $4,000 per year, with earningstax-deferred until withdrawals begin at age 59 1/2 or later (or earlier, with a 10% penalty). Only those who do not participate in apension plan at work, or who do participate and meet certain income guidelines, can make deductible contributions to an IRA. Allothers can make contributions to an IRA on a non-deductible basis. Such contributions qualify as a deduction against income earned inthat year and interest accumulates tax-deferred until the funds are withdrawn. Withdrawals from a Traditional IRA or Roth IRA thatare used to pay for qualified education expenses are not subject to the 10% early withdrawal penalty. Expenses may include suchitems as tuition, books, fees, room and board, supplies, and equipment.
Glossary - Goal Planning Analysis Richard and Linda Jones
Prepared by Piper Jaffray Financial Advisor 68 Piper Jaffray
Accumulation Glossary
Lifetime Learning Credit - Each year 20% of qualified expenses incurred may be claimed as a credit, up to $2,000. The tax credit isphased out when adjusted gross income is between $43,000 - $53,000 if single, and $87,000 - $107,000 if married filing jointly (forthe 2005 tax year; may index with inflation going forward). The Lifetime Learning Credit is available to students who are enrolled atleast half-time and registered in undergraduate or graduate courses. The credit is available only for qualified expenses, which arelimited to tuition and fees required for enrollment. Books, room and board, and other living expenses are not qualified expenses forthis credit.
Limits on Itemized Deductions - If your adjusted gross income is too high, the total value of what you're allowed to deduct is itselfreduced. If your adjusted gross income exceeds $145,950 in 2005, the deductions must be reduced by 3% of your income that exceedsthe $145,950 threshold. Under this same provision however, no more than 80% of your deductions can be phased out.
Return - The increase or decrease in value of a return on an investment expressed as a percentage of the total amount invested. Thereturn or rate of return is the sum of two components: the yield and appreciation. Generally, expected return increases as the level ofrisk in the investment increases.
Risk - The unpredictability of investment returns. The chance that the actual return from investment in an asset class will be differentfrom its assumed return. Risk is measured statistically using standard deviation.
Section 529 plans - A qualified tuition program administered by a state and named after Section 529 of the IRS code in which specialtax benefits are available. Plans differ from state to state and are normally either prepaid tuition plans or special college savings planaccounts. Earnings grow federal income tax-deferred. When assets are withdrawn for qualified expenses such as tuition, room andboard, books, and required supplies, they are federal income tax free. State tax treatment varies. There are no participation restrictionsbased on income. Parents, other relatives, and even family friends can open accounts on behalf of the same beneficiary. However,there may be a limit on the total amount in each account. Assets can be used to pay for qualified higher education expenses at anyaccredited post-secondary institution in the United States that is eligible to participate in federal student aid programs. The contributorretains control of assets until withdrawals are made. You can change the beneficiary to be another family member of the originalbeneficiary without paying a penalty, and money can be withdrawn at any time. If your beneficiary receives a scholarship for highereducation expenses, you may withdraw an amount equal to the value of the scholarship without paying a penalty. You may also makepenalty-free withdrawals in the event of the death or disability of the beneficiary. Non-qualified withdrawals of earnings will be taxedas ordinary income at your rate, and a federally mandated penalty equal to 10% of the gain will apply. There are fees and chargesassociated with a 529 college savings plan and the underlying investment options are subject to market risk.
Student Loan Interest Deductibility - Persons with qualified education loans may claim a deduction for loan interest paid, therebyreducing their taxable income. The interest deduction is phased out when adjusted gross income is between $50,000 - $65,000 ifsingle, and $105,000 - $135,000 if married filing jointly (for the 2005 tax year; may index with inflation going forward).
Glossary - Goal Planning Analysis Richard and Linda Jones
Prepared by Piper Jaffray Financial Advisor 69 Piper Jaffray

Financial Statements Glossary
Cash flow statement - A summary of an individual's cash flow over a given period of time.
Inflows - Money earned through employment and investments, or payments received from others such as the government orinsurance companies. Includes amounts received by incurring new debt.
Outflows - Use of the money received as inflows. Includes expenditures and amounts invested during the period of the cash flowstatement.
Net cash flow - The difference between your sources/inflows and your uses/outflows.
Disability insurance - An insurance policy that pays benefits in the event that the policyholder becomes incapable of working. Thesepolicies have no cash value and technically are not assets that are normally included in a net worth statement. However, the coverageprovided by these policies is extremely valuable to a family or individual in the case of a disability. Therefore, all disability policiesare listed in the insurance section of the net worth statement of this report.
Income tax estimate - An estimate of the amount you will pay in income taxes to federal, state and local governments. This amount isan estimate only. For an exact tax statement see a tax professional. An estimate is sufficient to learn of appropriate planning devicesthat can be implemented to help your net worth grow.
Alternative minimum tax - An alternative tax calculation created by congress to ensure that high-income individuals pay at leastsome minimum amount of tax, regardless of deductions, credits or exemptions. It operates by adding certain tax-preference itemsback into adjusted gross income and recalculating taxes. If the calculated AMT is greater than the calculated income tax, theindividual will pay the AMT amount.
Marginal income tax rate - The highest rate of tax that an individual pays on income. This rate is measured by the tax paid onthe final dollar of taxable income. This rate is also called the marginal tax bracket, the tax bracket, or tax rate of an individual. Forpurposes of this analysis, an individual's marginal tax rate is a total of the marginal rates for federal, state, and local taxes.
Effective income tax rate - The average rate of tax that an individual pays on all income. This rate is measured by dividing totaltaxes paid by total income. This rate is different than the marginal rate. The marginal rate measures the highest rate of tax on thefinal dollar of income. This rate measures the average tax rate on all income.
Life insurance - Insurance that is paid to a beneficiary when an insured individual dies. The most common life insurance policies arewhole life policies and term policies. While life policies generally have a cash value, term policies have no cash value. Normally, onlylife insurance policies with cash value are listed on a net worth statement. However, in this analysis all life insurance policies arelisted.
Net worth statement - Provides a quantitative summary of an individual's financial condition at a specific point in time. It lists assets,liabilities, and net worth. The net worth statement is sometimes called a balance sheet or statement of financial condition.
Assets - Any item of economic value which you own especially that which could be converted to cash. Examples are cash,securities, a house, a car, and other property.
Liabilities - A financial obligation, or debt.
Net worth - The approximate amount that would be left if you sold all your assets and paid off all your debt.
Pro forma statements - Projections of an individual's net worth and cash flow statements based on a set of assumptions. Pro formastatements are projected for 1, 5, 10, or many years into the future.
Ratio analysis - Financial ratios are used to analyze an individual's liquidity, solvency, level of debt, and other key financialmeasures. Ratios can provide early warning of financial problems, or they can be used to track your progress toward financial goals.The following key ratios are included with your net worth statement, your cash flow statement, and your income tax estimate.
Debt to equity ratio - Total liabilities divided by total assets. A measure of an individual's leverage, which means the percentageof assets that are funded by debt. A lower ratio indicates greater financial health.
Current ratio - Cash divided by liabilities. A measure of an individual's ability to meet debt obligations; the higher the ratio, themore liquid the individual is.
Glossary - Financial Statements Richard and Linda Jones
Prepared by Piper Jaffray Financial Advisor 70 Piper Jaffray

Financial Statements Glossary
Debt to income ratio - Total debt payments divided by income. A measure of an individual's ability to meet debt servicerequirements. This ratio is used by lenders to indicate the borrower's ability to repay loans. A lower ratio indicates greaterfinancial health. Many financial institutions will not lend to an individual whose ratio is greater than 30-40%.
Months of cash flow on hand - Income divided by living expenses. A measure of an individual's ability to meet requiredexpenses in the case of an emergency (such as the loss of a job). The number of months of cash should not be too high (returnsearned on cash investments are generally very low), but should be high enough to meet emergency expenses. A good rule ofthumb is to have an amount equivalent to 6 months worth of expenses held in liquid assets.
Glossary - Financial Statements Richard and Linda Jones
Prepared by Piper Jaffray Financial Advisor 71 Piper Jaffray
Retirement Glossary
Alternatives - Your retirement situation is projected based on your desired spending and current pattern of investing. Alternatives areplanning tools that require implementation and that, may provide additional retirement resources. A new retirement situation isprojected based on the alternative pattern (the suggested pattern) of investing and desired spending.
Annuity - Life insurance annuity contracts are useful planning tools that have two phases: the accumulation phase and theannuitization phase. During the accumulation phase, you make a lump-sum payment or periodic payments to an insurance company,which invests the funds in a portfolio that earns a return. The portfolio value fluctuates with that of the underlying securities within theportfolio, and the portfolio grows tax-deferred. During the annuitization period, you receive regular payments from the annuity.Generally, the payments continue until you die or until your spouse dies, if later.
Asset returns - The combined return stated as an annual percentage consisting of current income and capital appreciation from aninvestment.
Defined benefit pensions - Traditional pensions plans that promise workers a specific monthly benefit at retirement. The amount ofthe benefit is known or can be determined in advance and is usually based on factors that include earnings, age at retirement, andlength of service. The benefit is usually stated as a percentage of final salary and years of service, or as a specific amount and years ofservice. For example, a benefit might be stated as two percent of final salary for every year worked at the company, or as $100 permonth for every year worked at the company. Payments generally continue for the longer of the life of the worker of the life of theworker's spouse, but may be reduced when paid to a surviving spouse. Payments may be guaranteed by the Pension Benefit GuaranteeCorporation, a federal agency.
Full benefit retirement age - The age at which a qualifying individual can begin receiving full Social Security benefits withoutreduction for early retirement. For individuals born before 1938, full benefit retirement age is 65. This age is gradually increased forindividuals born after 1937 until it reaches age 67 for individuals born in 1960 or later.
Inflation - The overall upward price movement of goods and services in an economy, usually measured by the Consumer Price Indexand stated as a rate of increase.
Investment assets - Assets that are currently subject to federal, state, and local taxes. Be sure to indicate the appropriate percentageavailable to fund retirement.
Life expectancy - The age to which you are expected to live. In this retirement analysis, funding will be provided until the age thatyou indicate as your life expectancy. Because, individual health and longevity circumstances vary, and no one knows the exact time ofdeath, an age should be selected that is appropriate for your individual circumstances.
Longevity - Living longer than expected can be a problem if you are using assets to fund retirement. If your assets run out before youdie, you may not be able to support yourself. Longevity planning should include an evaluation of how long your family membersbefore you have lived. If you have a history of longevity in your family, you should plan for a long life expectancy. Annuities providea good planning strategy for longevity concerns. A life annuity guarantees a periodic income throughout your (and potentially yourspouse's) entire life.
Long-term care needs - If you reach a point in life where you are not physically or mentally able to care for yourself, you will likelyincur long-term care expenses. Generally, the best provision for long-term care expenses is a long-term care insurance policy.
Net assets withdrawn - In this analysis, retirement spending goals are first met by any contractual income that the retiree is expectedto receive. If the spending goal cannot be completely funded by contractual income during any month in retirement, assets arewithdrawn to provide for the need. Since taxes may be due upon withdrawal of an asset, the system withdraws an amount sufficient toprovide for the need and to pay any taxes due. The net asset withdrawal is the amount available after taxes to meet retirement spendingneeds.
Other government benefits - Benefits that are paid by any government entity to an individual in place of, or in addition to SocialSecurity retirement benefits. Benefits may include state retirement benefits, railroad retirement benefits, federal retirement benefits, orany other payments made by a government entity.
Glossary - Retirement Planning Analysis Richard and Linda Jones
Prepared by Piper Jaffray Financial Advisor 72 Piper Jaffray
Retirement Glossary
Percentage of assets available - You are able to indicate the percentage of your assets that are available to help meet your retirementspending goals. Generally, this will be 100%, unless you do not have access to part of an asset or you would like that asset to bepreserved and passed to heirs.
Retirement needs - In this analysis, retirement needs consist of your basic spending goal and any additional spending goals that youhave defined. The basic spending goal is assumed to continue until death. For married couples, the basic spending goal continuesbeyond the first to die until the surviving partner's death, but is adjusted at the first death by the percentage you input should beavailable for the surviving spouse. You are able to indicate the beginning and ending period for any additional goals. Please note thatall goals are spending goals which means they are amounts you wish to spend and should not include any income taxes you may berequired to pay. The system will estimate any income taxes due based on the rates input in the assumptions screen.
Retirement period - The period that begins when and individual quits working (retires) and continues until death. In this analysis, amarried couple's retirement period is assumed to begin when the first partner retires and continues until the longer of the partners' lifeexpectancies.
Retirement plans - Accounts that are used to accumulate funds for retirement. Generally, retirement plans are tax deferred whichmeans taxes are not paid on earnings until withdrawals from the account begin. Contributions to retirement plans may also betax-deductible which means taxes are not paid on the amounts contributed to the plan until withdrawals begin. Tax deductiblecontributions are called qualified contributions. Non-qualified contributions are made to a retirement plan after taxes are paid on thecontribution amount. These accounts include 401(k), 403(b), SEP, Keogh, and IRAs.
Roth accounts - Include Roth IRAs and Roth 401(k)s. Contributions to Roth accounts are not tax deductible, but withdrawals fromRoth accounts are tax-free, as long as certain requirements are met. You can make tax-free withdrawals as long as you have had theIRA for 5 years, or you begin withdrawals after the owner reaches age 59 1/2.
Social Security - Social Security retirement benefits are paid to a qualifying individual every month after the benefits begin, until thatperson dies. Benefits may begin any time after a qualifying individual reaches age 62. However, benefits will be reduced if they beginbefore the individual reaches full benefit age.
Social Security statement - A statement that the Social Security Administration sends to all wage earners each year on or around thewage earner's birthday. The statement estimates the wage earner's expected benefit assuming the person continues to work until thefull benefit retirement age.
Spending goal - The amount that you desire to spend annually during retirement. This amount should be an after-tax amount. Theanalysis will inflate this amount each year during retirement. Before the amount is provided, the analysis will estimate taxes onincome and taxes that may be due as assets are consumed. Amounts remaining after-taxes are available to provide for the spendinggoal.
Survivor - For married individuals, retirement funding is provided until the last life expectancy is reached. If there is a period betweenthe life expectancies of the partners, funding is provided after the first death at an adjusted level based on the inflated originalspending goal and the percentage provided for the survivor.
Tax deferral - Money accumulates inside of qualified plans tax deferred, which means that taxes are not paid on the earnings withinthe plan until withdrawals from the plan are made.
Work during retirement - Employment after the date one retires from one's career, sometimes necessary to meet financial needs.Generally, post-retirement employment will provide a lower income or involve fewer hours.
Working spouse's pre-retirement income - Marriage partners may not retire at the same time. Since this analysis assumes that theretirement period begins when the first partner retires, there may be a time during the retirement funding period in which one of thepartners is working. The after-tax adjusted income from this partner can be made to be available to meet retirement needs. If youindicate that this income is available, it is reduced by income taxes, Social Security taxes, and any contributions made to retirementplans during the period in which one partner is working and the other is retired.
Glossary - Retirement Planning Analysis Richard and Linda Jones
Prepared by Piper Jaffray Financial Advisor 73 Piper Jaffray
Estate Glossary
Assets - All property with any incidence of ownership by the estate. Ownership of assets determines the estate tax treatment applied tothe asset upon death. Assets can be owned directly, JTWROS, as community property, or as tennants in common.
Directly held assets - Any property owned solely by an individual. The individual generally has the right to direct the disposal ofthe asset upon death.
JTWROS assets - Ownership of property by two or more people in which the surviving owner(s) automatically gain ownershipof a decedent's interest.
Community property assets - Any property that a married couple has acquired during their marriage. In certain states(community property states), ownership, and thus the right to dispose of the property, is divided equally between partners.
Tenants in common assets - Ownership of property by two people in which the first-to-die's portion of the asset can be used tofund a credit shelter trust.
Life insurance - Insurance to be paid to a beneficiary when the insured dies. If the insured is also the owner of the policy, theproceeds are included in the decedent's estate.
Beneficiary - An entity, usually an individual or an estate, that receives benefits under a will, retirement plan, or insurance policy.
Credit shelter trust - A trust that utilizes the unified gift and estate tax credit to reduce estate taxes at the surviving spouse's death. Atthe grantor's death, an amount equal to the federal unified credit is transferred to the trust. In this way, this amount is sheltered fromestate tax calculations.
Current net estate - An individual's net estate assuming immediate death. See net estate.
Current gross estate - An individual's gross estate assuming immediate death. See gross estate.
Distributions - Distributions refer to all payments made by the estate. Distributions include payments to creditors, beneficiaries, andgovernments for estate taxes. Estate planning generally tries to maximize the final distribution to beneficiaries.
Estate preservation - Actions taken to reduce the burden of estate taxes and settlement costs and thus maximize the final distributionto beneficiaries.
Estate taxes - When you die, the federal government will assess the value of your estate by adding the value of your assets less anyliabilities plus the death benefits of any life insurance policies that you own. Your estate tax will be based on this assessed value and isgenerally paid by the estate before any distribution of estate assets are made.
Funding options - Funding refers to paying estate taxes. Even after all preservation options are exhausted, some estate taxes may stillbe due upon death.
Gross estate - All property owned by an individual prior to any distribution of that property under the terms of a will or trust. Thegross estate includes the value of proceeds from life insurance that the decedent owned, and 50% of assets owned in joint tenancy,50% of community property assets (if in a community property state).
Liabilities - A financial obligation, claim, or debt that needs to be paid by the estate before estate taxes are calculated. A joint liabilitymay not need to be paid by the estate.
Life insurance - Insurance to be paid to a beneficiary when the insured dies. Life insurance proceeds are included in an individual'sestate if that individual retained any incidence of ownership in the policy.
Marital deduction - An estate tax provision that allows an individual to transfer an unlimited amount of property to his/her spousewithout incurring any estate tax.
Glossary - Estate Planning Analysis Richard and Linda Jones
Prepared by Piper Jaffray Financial Advisor 74 Piper Jaffray

Estate Glossary
Marital distribution - Represents the actual value of assets that pass to the surviving spouse. This amount may be different than themarital deduction because joint liabilities are not assumed to be paid off at the first death.
Net estate - The net estate is the gross estate reduced by any liabilities. Used in calculating estate taxes
Probate - Probate is the legal process of determining who gets what from the estate of passing legal title from the estate to the heir.Upon your death, any property that you own directly must pass through probate. Property help in joint tenancy does not need to passthrough probate because survivors automatically gain ownership.
Property - Property is described as either real or personal. Real property is real estate. Personal property is everything else. Personalproperty includes physical assets such as automobiles, equipment, and household items, as well as financial assets, such as securities,notes or loans receivable, bank accounts, cash, and insurance policies.
Settlement costs - All expenses necessary to settle or finalize the distributions from the estate. Settlement costs include funeralexpenses, estate administration costs, and probate expenses.
Will - A legally enforceable document that allows you to direct the transfer of assets after your death, to designate a personalrepresentative, and to nominate a guardian for your minor children. A will is also called a testament.
Glossary - Estate Planning Analysis Richard and Linda Jones
Prepared by Piper Jaffray Financial Advisor 75 Piper Jaffray

Notes
.
.
.
.
.
.
.
.
.
.
.
.
.
.
.
.
.
.
.
.
.
.
.
.
.
.
.
.
.
.
.
.
Comprehensive Financial Plan Richard and Linda Jones
Prepared by Piper Jaffray Financial Advisor 76 Piper Jaffray