Embed Size (px)
Citation preview
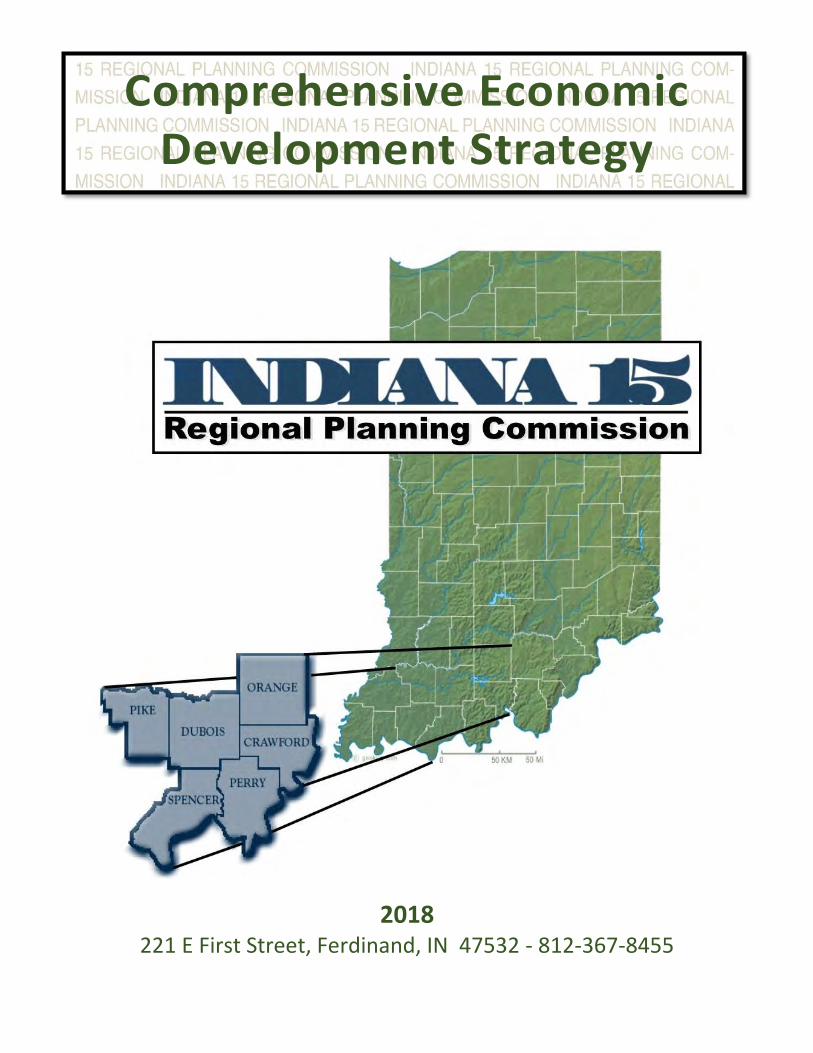
2018 221 E First Street, Ferdinand, IN 47532 - 812-367-8455
Comprehensive Economic Development Strategy
Page | 2
Contents Executive Summary 3
Introduction 4 Regional Collaboration 4
Evidence Basis for the Plan 4 Regional Demographic Data 4 Regional Economic Data 6 Regional Assets 8 Potential Barriers and Related Strategies 9
Regional Economic Goals 9
Regional Economic Development Plan 10 Goal 1: Help Businesses Succeed 10 Goal 2: Enhance Quality of Regional Connectivity 13 Goal 3: Enhance Quality of Life 15 Goal 4: Attract Tourists/Enhance Arts 18
Evaluation Plan 20 Key Measures and Strategies to Track Progress 20
Appendix 21
A: CEDS and SET members 21 B: Regional Data 23 C: Target Industry Clusters Regional Data Snapshot 25 D: Regional Snapshot 26 E: Prioritized County and Regional Projects 72 F: 2017 Newsletter: Year in Review 87
Page | 3
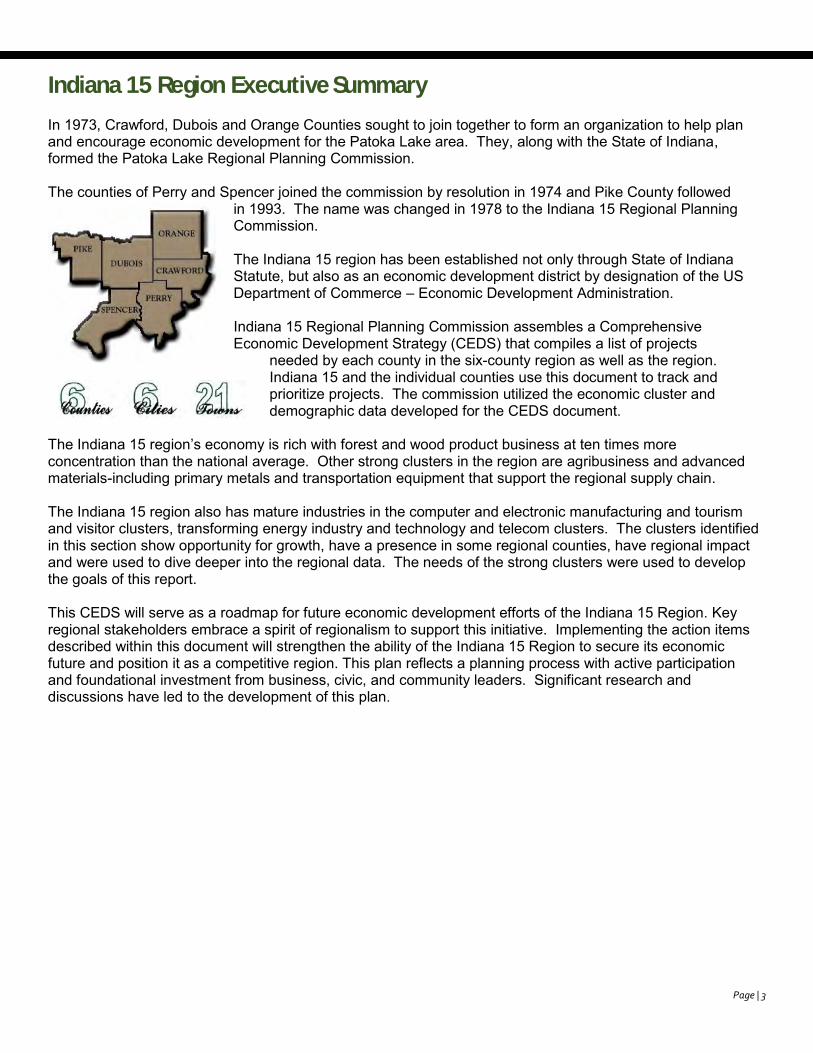
Indiana 15 Region Executive Summary In 1973, Crawford, Dubois and Orange Counties sought to join together to form an organization to help plan and encourage economic development for the Patoka Lake area. They, along with the State of Indiana, formed the Patoka Lake Regional Planning Commission. The counties of Perry and Spencer joined the commission by resolution in 1974 and Pike County followed
in 1993. The name was changed in 1978 to the Indiana 15 Regional Planning Commission. The Indiana 15 region has been established not only through State of Indiana Statute, but also as an economic development district by designation of the US Department of Commerce – Economic Development Administration. Indiana 15 Regional Planning Commission assembles a Comprehensive Economic Development Strategy (CEDS) that compiles a list of projects
needed by each county in the six-county region as well as the region. Indiana 15 and the individual counties use this document to track and prioritize projects. The commission utilized the economic cluster and demographic data developed for the CEDS document.
The Indiana 15 region’s economy is rich with forest and wood product business at ten times more concentration than the national average. Other strong clusters in the region are agribusiness and advanced materials-including primary metals and transportation equipment that support the regional supply chain. The Indiana 15 region also has mature industries in the computer and electronic manufacturing and tourism and visitor clusters, transforming energy industry and technology and telecom clusters. The clusters identified in this section show opportunity for growth, have a presence in some regional counties, have regional impact and were used to dive deeper into the regional data. The needs of the strong clusters were used to develop the goals of this report.
This CEDS will serve as a roadmap for future economic development efforts of the Indiana 15 Region. Key regional stakeholders embrace a spirit of regionalism to support this initiative. Implementing the action items described within this document will strengthen the ability of the Indiana 15 Region to secure its economic future and position it as a competitive region. This plan reflects a planning process with active participation and foundational investment from business, civic, and community leaders. Significant research and discussions have led to the development of this plan.
Page | 4
Introduction
Regional Collaboration
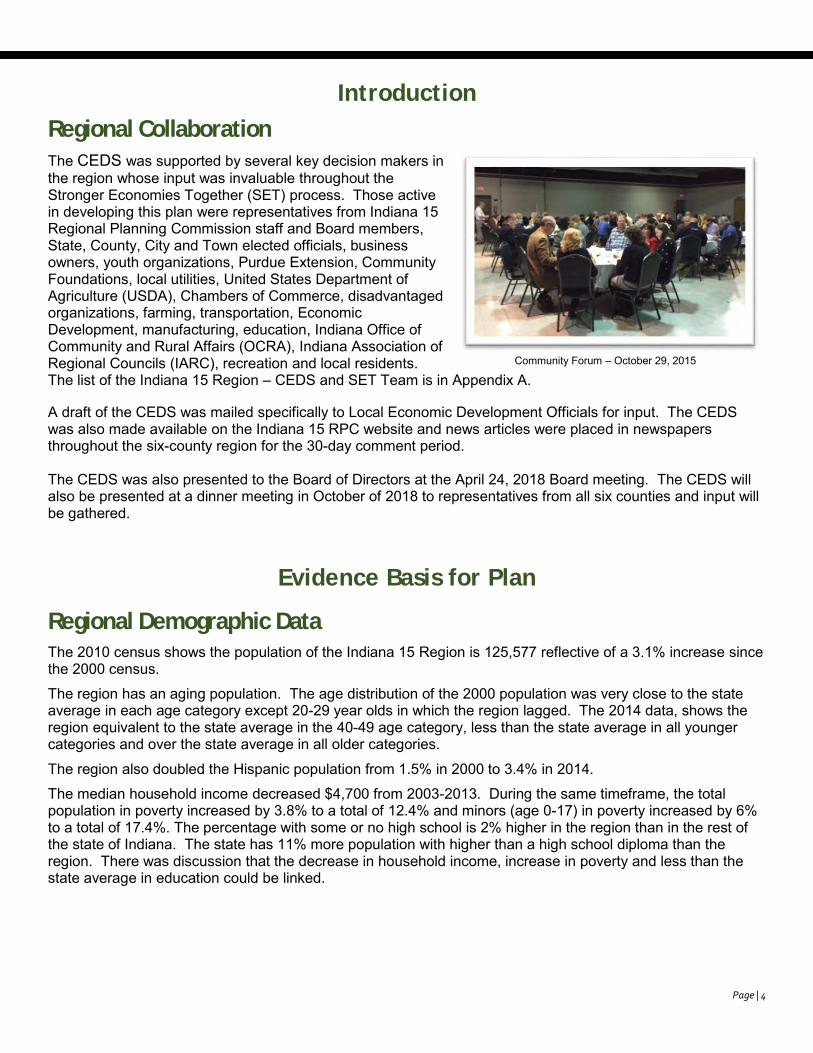
The CEDS was supported by several key decision makers in the region whose input was invaluable throughout the Stronger Economies Together (SET) process. Those active in developing this plan were representatives from Indiana 15 Regional Planning Commission staff and Board members, State, County, City and Town elected officials, business owners, youth organizations, Purdue Extension, Community Foundations, local utilities, United States Department of Agriculture (USDA), Chambers of Commerce, disadvantaged organizations, farming, transportation, Economic Development, manufacturing, education, Indiana Office of Community and Rural Affairs (OCRA), Indiana Association of Regional Councils (IARC), recreation and local residents. The list of the Indiana 15 Region – CEDS and SET Team is in Appendix A. A draft of the CEDS was mailed specifically to Local Economic Development Officials for input. The CEDS was also made available on the Indiana 15 RPC website and news articles were placed in newspapers throughout the six-county region for the 30-day comment period. The CEDS was also presented to the Board of Directors at the April 24, 2018 Board meeting. The CEDS will also be presented at a dinner meeting in October of 2018 to representatives from all six counties and input will be gathered.
Evidence Basis for Plan
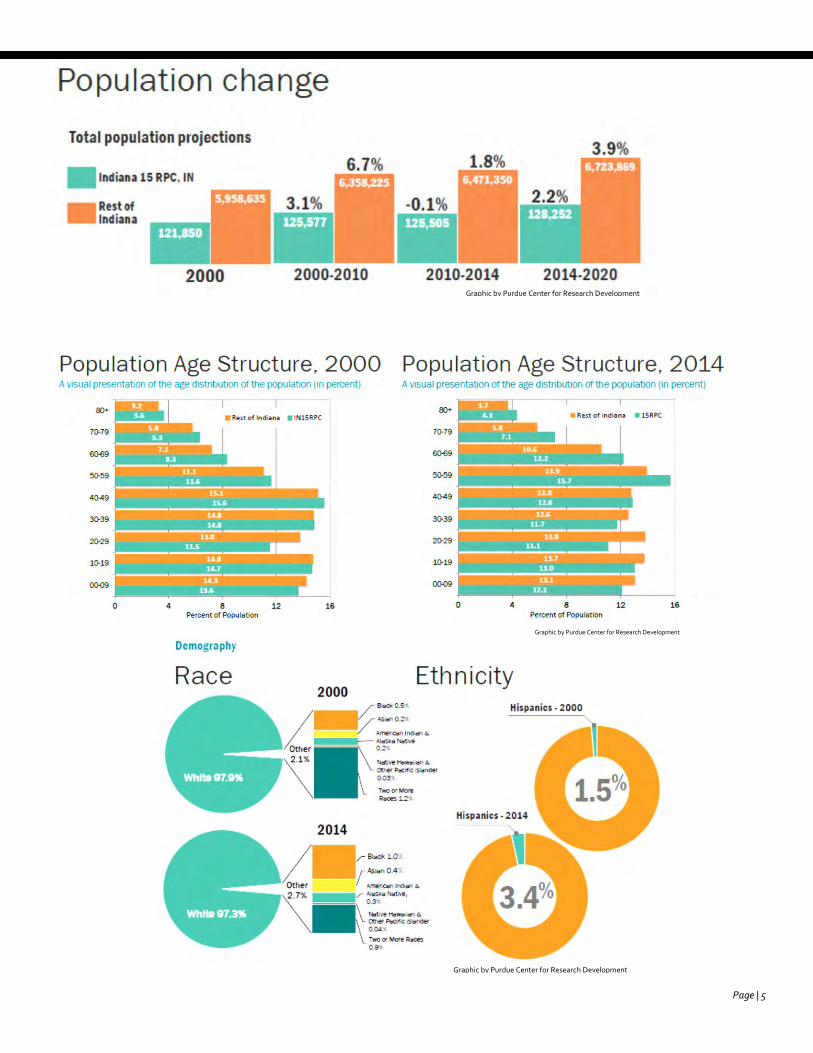
Regional Demographic Data The 2010 census shows the population of the Indiana 15 Region is 125,577 reflective of a 3.1% increase since the 2000 census.
The region has an aging population. The age distribution of the 2000 population was very close to the state average in each age category except 20-29 year olds in which the region lagged. The 2014 data, shows the region equivalent to the state average in the 40-49 age category, less than the state average in all younger categories and over the state average in all older categories.
The region also doubled the Hispanic population from 1.5% in 2000 to 3.4% in 2014.
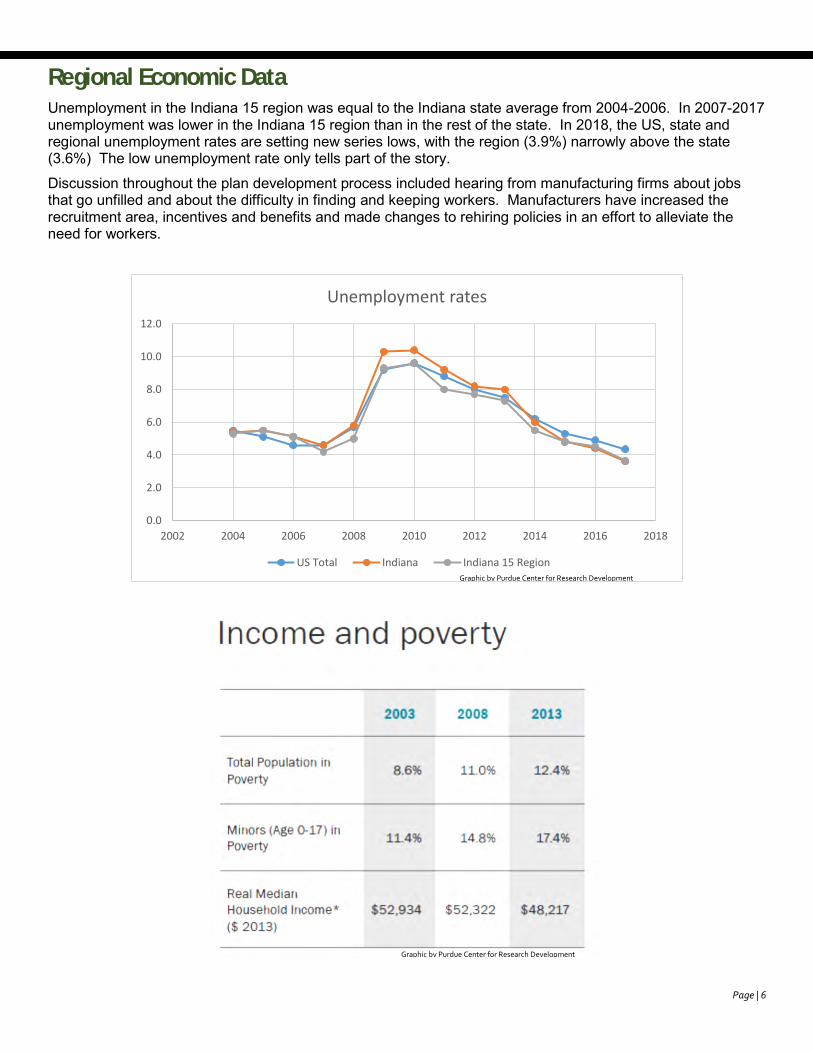
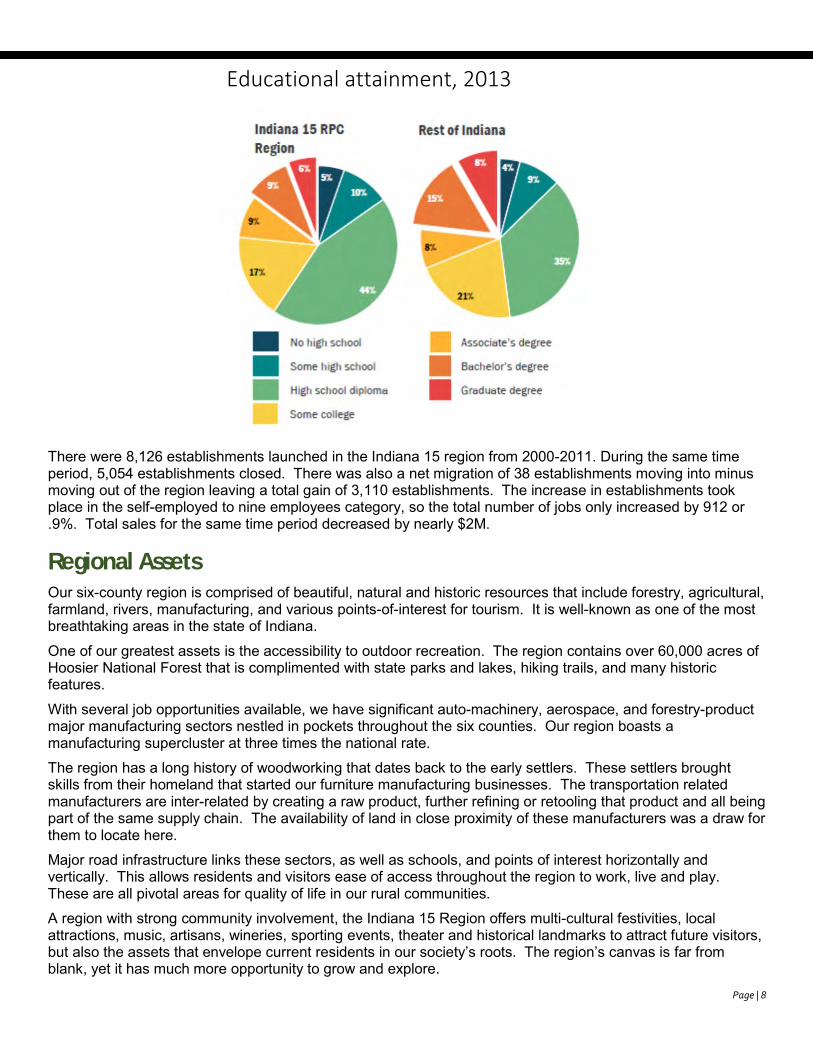
The median household income decreased $4,700 from 2003-2013. During the same timeframe, the total population in poverty increased by 3.8% to a total of 12.4% and minors (age 0-17) in poverty increased by 6% to a total of 17.4%. The percentage with some or no high school is 2% higher in the region than in the rest of the state of Indiana. The state has 11% more population with higher than a high school diploma than the region. There was discussion that the decrease in household income, increase in poverty and less than the state average in education could be linked.
Community Forum – October 29, 2015
Page | 5
Graphic by Purdue Center for Research Development
Graphic by Purdue Center for Research Development
Graphic by Purdue Center for Research Development
Page | 6
Regional Economic Data Unemployment in the Indiana 15 region was equal to the Indiana state average from 2004-2006. In 2007-2017 unemployment was lower in the Indiana 15 region than in the rest of the state. In 2018, the US, state and regional unemployment rates are setting new series lows, with the region (3.9%) narrowly above the state (3.6%) The low unemployment rate only tells part of the story.
Discussion throughout the plan development process included hearing from manufacturing firms about jobs that go unfilled and about the difficulty in finding and keeping workers. Manufacturers have increased the recruitment area, incentives and benefits and made changes to rehiring policies in an effort to alleviate the need for workers.
0.0
2.0
4.0
6.0
8.0
10.0
12.0
2002 2004 2006 2008 2010 2012 2014 2016 2018
Unemployment rates
US Total Indiana Indiana 15 RegionGraphic by Purdue Center for Research Development
Graphic by Purdue Center for Research Development
Page | 7
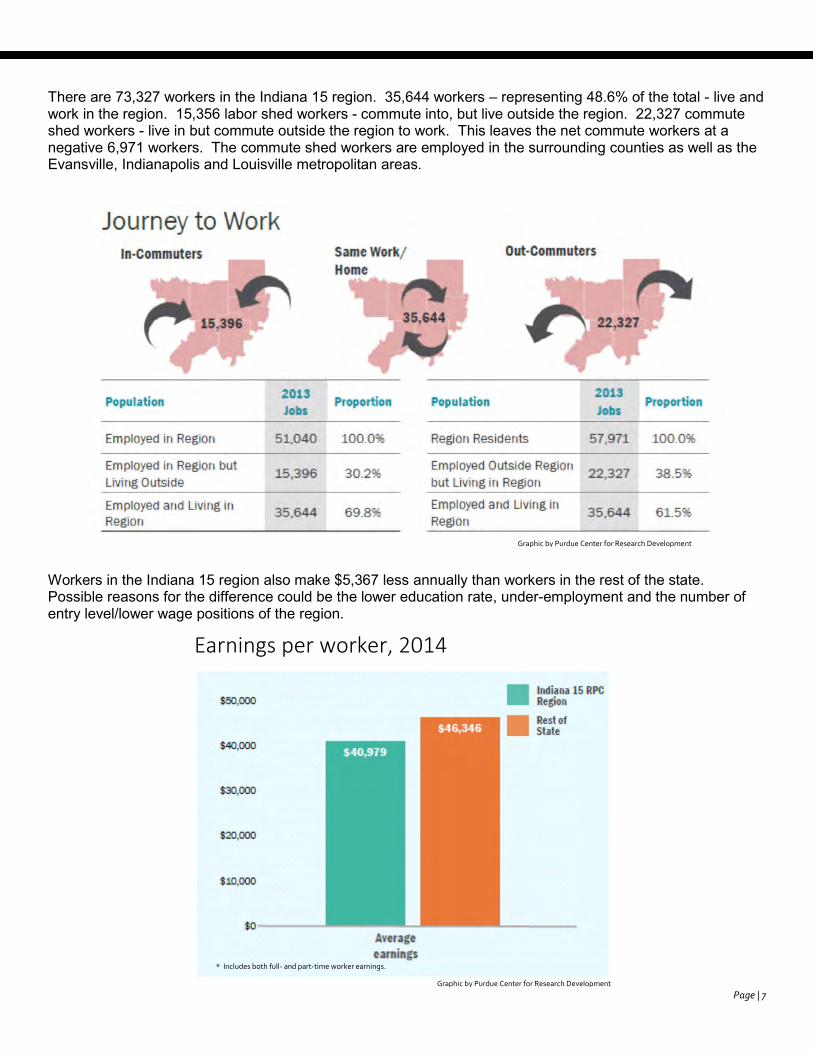
There are 73,327 workers in the Indiana 15 region. 35,644 workers – representing 48.6% of the total - live and work in the region. 15,356 labor shed workers - commute into, but live outside the region. 22,327 commute shed workers - live in but commute outside the region to work. This leaves the net commute workers at a negative 6,971 workers. The commute shed workers are employed in the surrounding counties as well as the Evansville, Indianapolis and Louisville metropolitan areas.
Workers in the Indiana 15 region also make $5,367 less annually than workers in the rest of the state. Possible reasons for the difference could be the lower education rate, under-employment and the number of entry level/lower wage positions of the region.
Earnings per worker, 2014
Graphic by Purdue Center for Research Development
Graphic by Purdue Center for Research Development
* Includes both full- and part-time worker earnings.
Page | 8
Educational attainment, 2013
There were 8,126 establishments launched in the Indiana 15 region from 2000-2011. During the same time period, 5,054 establishments closed. There was also a net migration of 38 establishments moving into minus moving out of the region leaving a total gain of 3,110 establishments. The increase in establishments took place in the self-employed to nine employees category, so the total number of jobs only increased by 912 or .9%. Total sales for the same time period decreased by nearly $2M.
Regional Assets Our six-county region is comprised of beautiful, natural and historic resources that include forestry, agricultural, farmland, rivers, manufacturing, and various points-of-interest for tourism. It is well-known as one of the most breathtaking areas in the state of Indiana.
One of our greatest assets is the accessibility to outdoor recreation. The region contains over 60,000 acres of Hoosier National Forest that is complimented with state parks and lakes, hiking trails, and many historic features.
With several job opportunities available, we have significant auto-machinery, aerospace, and forestry-product major manufacturing sectors nestled in pockets throughout the six counties. Our region boasts a manufacturing supercluster at three times the national rate.
The region has a long history of woodworking that dates back to the early settlers. These settlers brought skills from their homeland that started our furniture manufacturing businesses. The transportation related manufacturers are inter-related by creating a raw product, further refining or retooling that product and all being part of the same supply chain. The availability of land in close proximity of these manufacturers was a draw for them to locate here.
Major road infrastructure links these sectors, as well as schools, and points of interest horizontally and vertically. This allows residents and visitors ease of access throughout the region to work, live and play. These are all pivotal areas for quality of life in our rural communities.
A region with strong community involvement, the Indiana 15 Region offers multi-cultural festivities, local attractions, music, artisans, wineries, sporting events, theater and historical landmarks to attract future visitors, but also the assets that envelope current residents in our society’s roots. The region’s canvas is far from blank, yet it has much more opportunity to grow and explore.
Page | 9
Potential Barriers and Related Strategies During the strategy sessions, the top five challenges to the strategic plan were identified. The first barrier in the region is the lack of affordable housing. Housing stock is aging quickly in most areas of the region and there is a strong need for quality affordable housing to attract new residents. Specifically, workforce housing needs to be addressed. A large number of employees commute to their work place because of the lack of acceptable housing located near their employer.
While the work ethic is strong, the region is in need of a more skilled workforce. The region plan needs to address the job skills training and education elements to support the region’s employers. The region also has not been successful in retaining post high school students (age 20-29) to remain in, return to or move to the region for employment after they complete their education.
Substance abuse and mental health continue to be a concern in the communities. The region lacks the adequate amount of support needed to deal with the substance abuse and mental health issues. Alcohol abuse among minors and the increased use of methamphetamines are the biggest abuses facing the region. In 2015, 49 clandestine meth labs were seized by law enforcement in the region. This issue could also contribute to the lack of qualified workers, due to failed drug tests or lack of good role models at home.
The state’s property tax caps that were issued on tax bills due in 2012 have resulted in declining tax revenues for local governments. Local governments have not been able to invest in the needed infrastructure and have had to cut services to their residents as a result of the decrease in revenue. While the quality of education is good, a few schools have faced closure because of the operating deficits due to decreases in funding.
The manufacturers and businesses in the region have positions that go unfilled because of issues raised above and the inability to keep workers. If these businesses do not fill open positions, they will find ways to operate without them such as replacement with robotics, or move to areas with willing workers.
An overarching challenge for the region is to actively work regionally. It is easy to come up with projects for individual counties, but more focus needs to be put on projects that enhance the region to become more competitive.
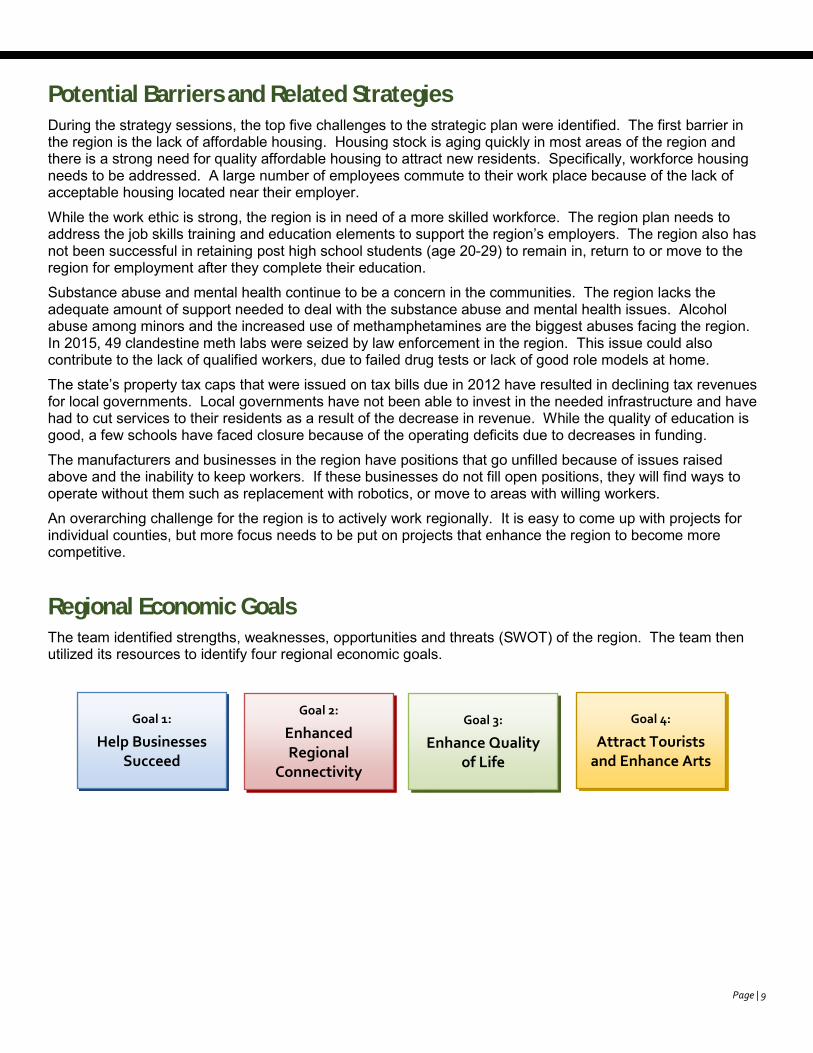
Regional Economic Goals The team identified strengths, weaknesses, opportunities and threats (SWOT) of the region. The team then utilized its resources to identify four regional economic goals.
Goal 1:
Help Businesses Succeed
Goal 2:
Enhanced Regional
Connectivity
Goal 4:
Attract Tourists and Enhance Arts
Goal 3:
Enhance Quality of Life
Page | 10
Regional Economic Development Plan
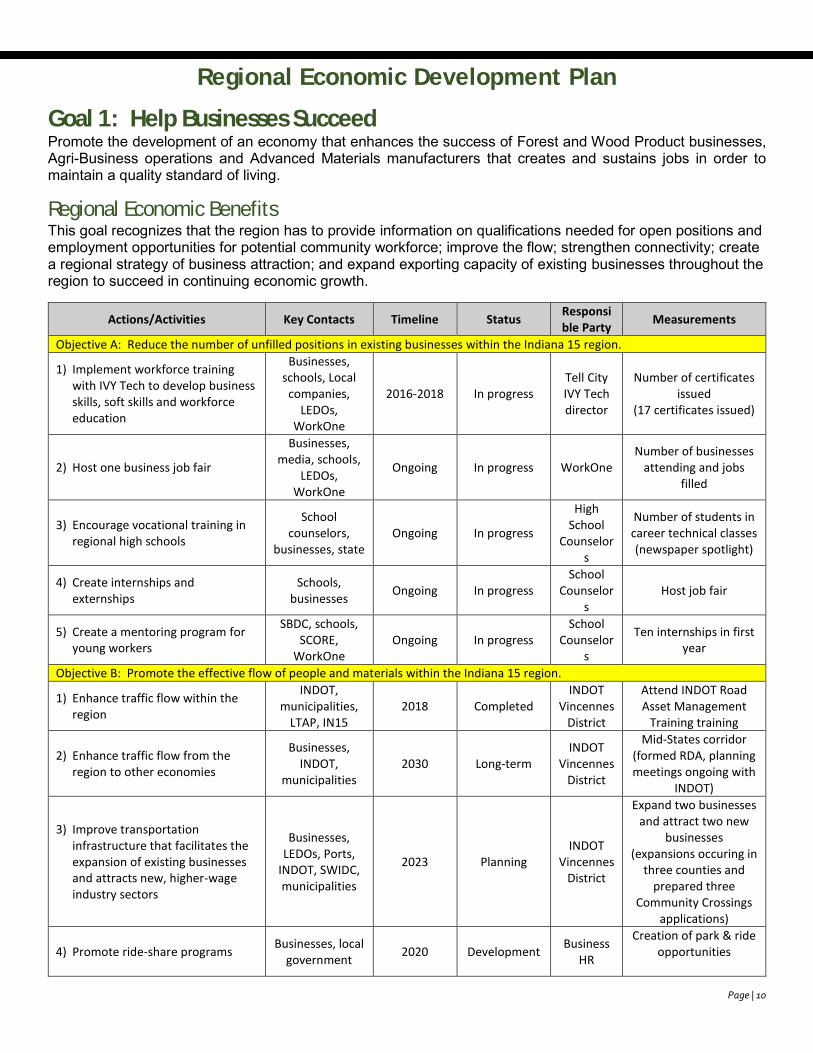
Goal 1: Help Businesses Succeed Promote the development of an economy that enhances the success of Forest and Wood Product businesses, Agri-Business operations and Advanced Materials manufacturers that creates and sustains jobs in order to maintain a quality standard of living.
Regional Economic Benefits This goal recognizes that the region has to provide information on qualifications needed for open positions and employment opportunities for potential community workforce; improve the flow; strengthen connectivity; create a regional strategy of business attraction; and expand exporting capacity of existing businesses throughout the region to succeed in continuing economic growth.
Actions/Activities Key Contacts Timeline Status Responsible Party
Measurements
Objective A: Reduce the number of unfilled positions in existing businesses within the Indiana 15 region.
1) Implement workforce training with IVY Tech to develop business skills, soft skills and workforce education
Businesses, schools, Local
companies, LEDOs,
WorkOne
2016-2018 In progress Tell City IVY Tech director
Number of certificates issued
(17 certificates issued)
2) Host one business job fair
Businesses, media, schools,
LEDOs, WorkOne
Ongoing In progress WorkOne Number of businesses
attending and jobs filled
3) Encourage vocational training in regional high schools
School counselors,
businesses, state Ongoing In progress
High School
Counselors
Number of students in career technical classes (newspaper spotlight)
4) Create internships and externships
Schools, businesses
Ongoing In progress School
Counselors
Host job fair
5) Create a mentoring program for young workers
SBDC, schools, SCORE,
WorkOne Ongoing In progress
School Counselor
s
Ten internships in first year
Objective B: Promote the effective flow of people and materials within the Indiana 15 region.
1) Enhance traffic flow within the region
INDOT, municipalities,
LTAP, IN15 2018 Completed
INDOT Vincennes
District
Attend INDOT Road Asset Management
Training training
2) Enhance traffic flow from the region to other economies
Businesses, INDOT,
municipalities 2030 Long-term
INDOT Vincennes
District
Mid-States corridor (formed RDA, planning meetings ongoing with
INDOT)
3) Improve transportation infrastructure that facilitates the expansion of existing businesses and attracts new, higher-wage industry sectors
Businesses, LEDOs, Ports,
INDOT, SWIDC, municipalities
2023 Planning INDOT
Vincennes District
Expand two businesses and attract two new
businesses (expansions occuring in
three counties and prepared three
Community Crossings applications)
4) Promote ride-share programs Businesses, local
government 2020 Development
Business HR
Creation of park & ride opportunities
Page | 11
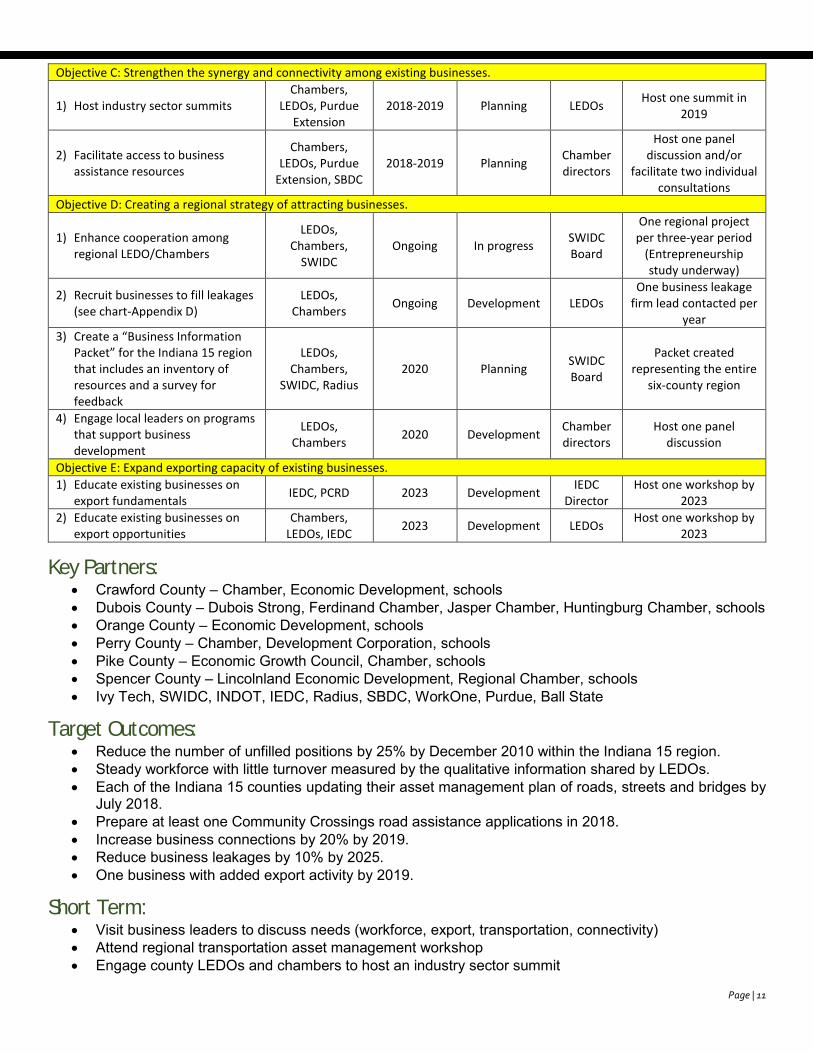
Objective C: Strengthen the synergy and connectivity among existing businesses.
1) Host industry sector summits Chambers,
LEDOs, Purdue Extension
2018-2019 Planning LEDOs Host one summit in
2019
2) Facilitate access to business assistance resources
Chambers, LEDOs, Purdue
Extension, SBDC 2018-2019 Planning
Chamber directors
Host one panel discussion and/or
facilitate two individual consultations
Objective D: Creating a regional strategy of attracting businesses.
1) Enhance cooperation among regional LEDO/Chambers
LEDOs, Chambers,
SWIDC Ongoing In progress
SWIDC Board
One regional project per three-year period
(Entrepreneurship study underway)
2) Recruit businesses to fill leakages (see chart-Appendix D)
LEDOs, Chambers
Ongoing Development LEDOs One business leakage
firm lead contacted per year
3) Create a “Business Information Packet” for the Indiana 15 region that includes an inventory of resources and a survey for feedback
LEDOs, Chambers,
SWIDC, Radius 2020 Planning
SWIDC Board
Packet created representing the entire
six-county region
4) Engage local leaders on programs that support business development
LEDOs, Chambers
2020 Development Chamber directors
Host one panel discussion
Objective E: Expand exporting capacity of existing businesses.
1) Educate existing businesses on export fundamentals
IEDC, PCRD 2023 Development IEDC
Director Host one workshop by
2023
2) Educate existing businesses on export opportunities
Chambers, LEDOs, IEDC
2023 Development LEDOs Host one workshop by
2023
Key Partners: Crawford County – Chamber, Economic Development, schools Dubois County – Dubois Strong, Ferdinand Chamber, Jasper Chamber, Huntingburg Chamber, schools Orange County – Economic Development, schools Perry County – Chamber, Development Corporation, schools Pike County – Economic Growth Council, Chamber, schools Spencer County – Lincolnland Economic Development, Regional Chamber, schools Ivy Tech, SWIDC, INDOT, IEDC, Radius, SBDC, WorkOne, Purdue, Ball State
Target Outcomes: Reduce the number of unfilled positions by 25% by December 2010 within the Indiana 15 region. Steady workforce with little turnover measured by the qualitative information shared by LEDOs. Each of the Indiana 15 counties updating their asset management plan of roads, streets and bridges by
July 2018. Prepare at least one Community Crossings road assistance applications in 2018. Increase business connections by 20% by 2019. Reduce business leakages by 10% by 2025. One business with added export activity by 2019.
Short Term: Visit business leaders to discuss needs (workforce, export, transportation, connectivity) Attend regional transportation asset management workshop Engage county LEDOs and chambers to host an industry sector summit
Page | 12
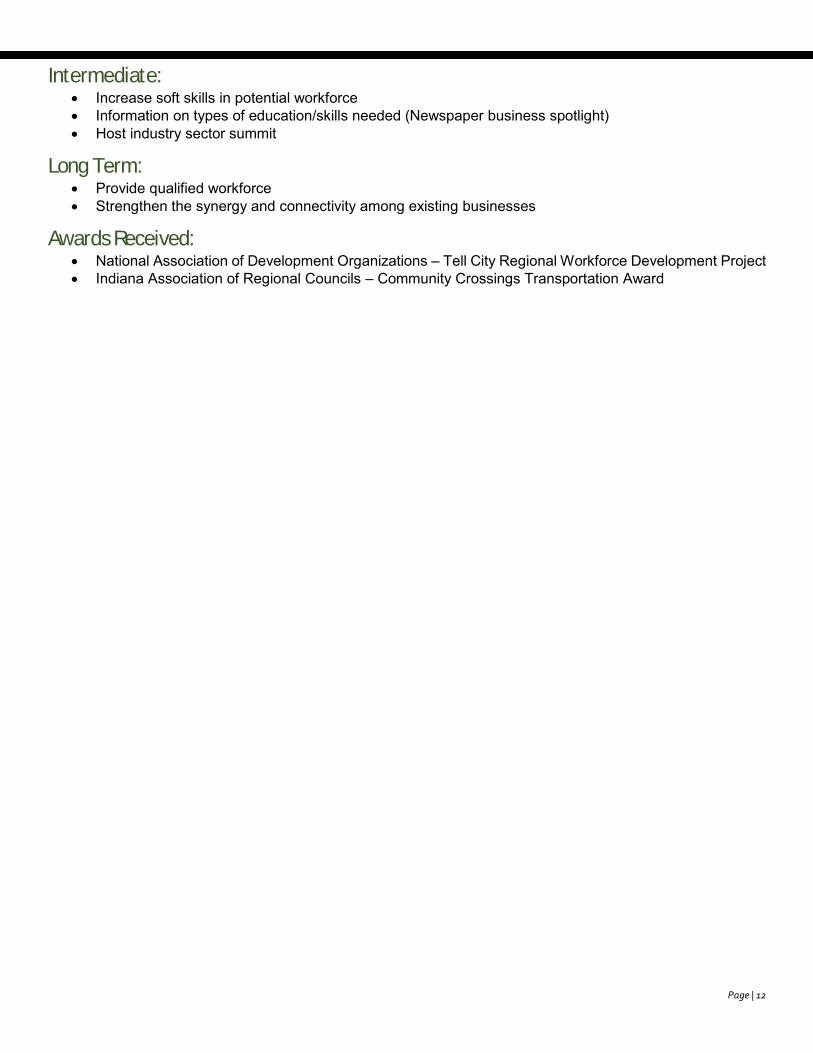
Intermediate: Increase soft skills in potential workforce Information on types of education/skills needed (Newspaper business spotlight) Host industry sector summit
Long Term: Provide qualified workforce Strengthen the synergy and connectivity among existing businesses
Awards Received: National Association of Development Organizations – Tell City Regional Workforce Development Project Indiana Association of Regional Councils – Community Crossings Transportation Award
Page | 13
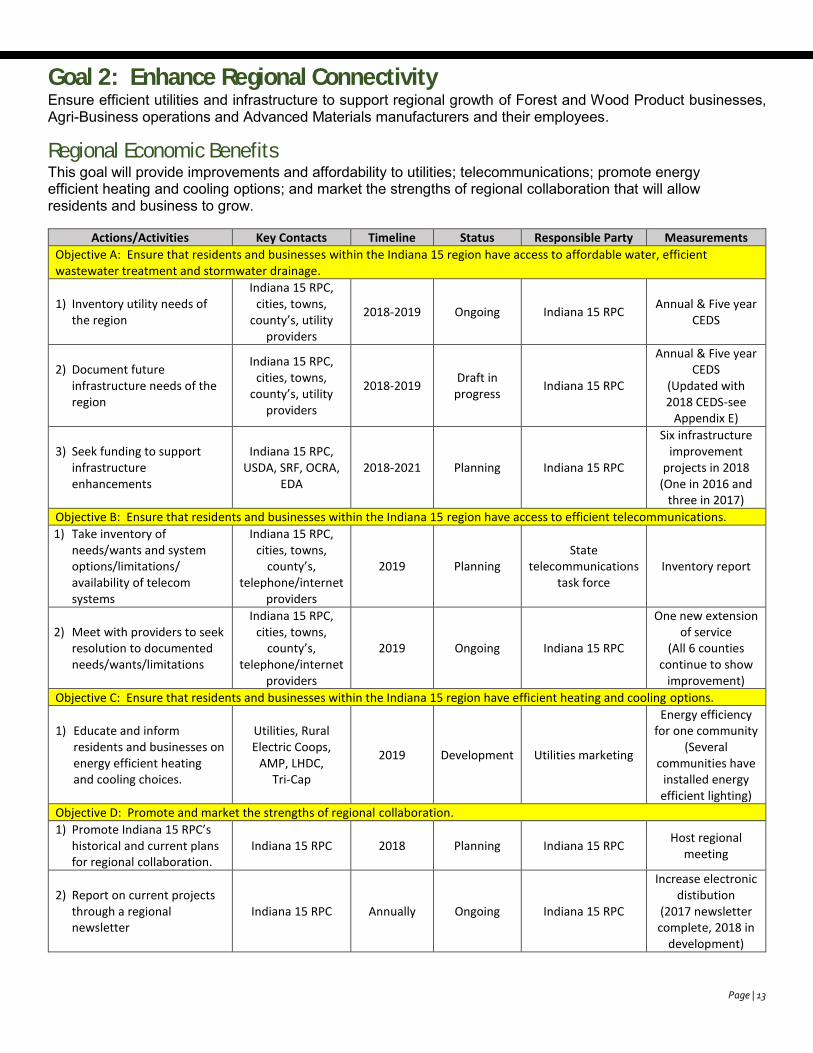
Goal 2: Enhance Regional Connectivity Ensure efficient utilities and infrastructure to support regional growth of Forest and Wood Product businesses, Agri-Business operations and Advanced Materials manufacturers and their employees.
Regional Economic Benefits This goal will provide improvements and affordability to utilities; telecommunications; promote energy efficient heating and cooling options; and market the strengths of regional collaboration that will allow residents and business to grow.
Actions/Activities Key Contacts Timeline Status Responsible Party Measurements
Objective A: Ensure that residents and businesses within the Indiana 15 region have access to affordable water, efficient wastewater treatment and stormwater drainage.
1) Inventory utility needs of the region
Indiana 15 RPC, cities, towns,
county’s, utility providers
2018-2019 Ongoing Indiana 15 RPC Annual & Five year
CEDS
2) Document future infrastructure needs of the region
Indiana 15 RPC, cities, towns,
county’s, utility providers
2018-2019 Draft in
progress Indiana 15 RPC
Annual & Five year CEDS
(Updated with 2018 CEDS-see
Appendix E)
3) Seek funding to support infrastructure enhancements
Indiana 15 RPC, USDA, SRF, OCRA,
EDA 2018-2021 Planning Indiana 15 RPC
Six infrastructure improvement
projects in 2018 (One in 2016 and
three in 2017)
Objective B: Ensure that residents and businesses within the Indiana 15 region have access to efficient telecommunications.
1) Take inventory of needs/wants and system options/limitations/ availability of telecom systems
Indiana 15 RPC, cities, towns,
county’s, telephone/internet
providers
2019 Planning State
telecommunications task force
Inventory report
2) Meet with providers to seek resolution to documented needs/wants/limitations
Indiana 15 RPC, cities, towns,
county’s, telephone/internet
providers
2019 Ongoing Indiana 15 RPC
One new extension of service
(All 6 counties continue to show
improvement)
Objective C: Ensure that residents and businesses within the Indiana 15 region have efficient heating and cooling options.
1) Educate and inform residents and businesses on energy efficient heating and cooling choices.
Utilities, Rural Electric Coops,
AMP, LHDC, Tri-Cap
2019 Development Utilities marketing
Energy efficiency for one community
(Several communities have
installed energy efficient lighting)
Objective D: Promote and market the strengths of regional collaboration.
1) Promote Indiana 15 RPC’s historical and current plans for regional collaboration.
Indiana 15 RPC 2018 Planning Indiana 15 RPC Host regional
meeting
2) Report on current projects through a regional newsletter
Indiana 15 RPC Annually Ongoing Indiana 15 RPC
Increase electronic distibution
(2017 newsletter complete, 2018 in
development)
Page | 14
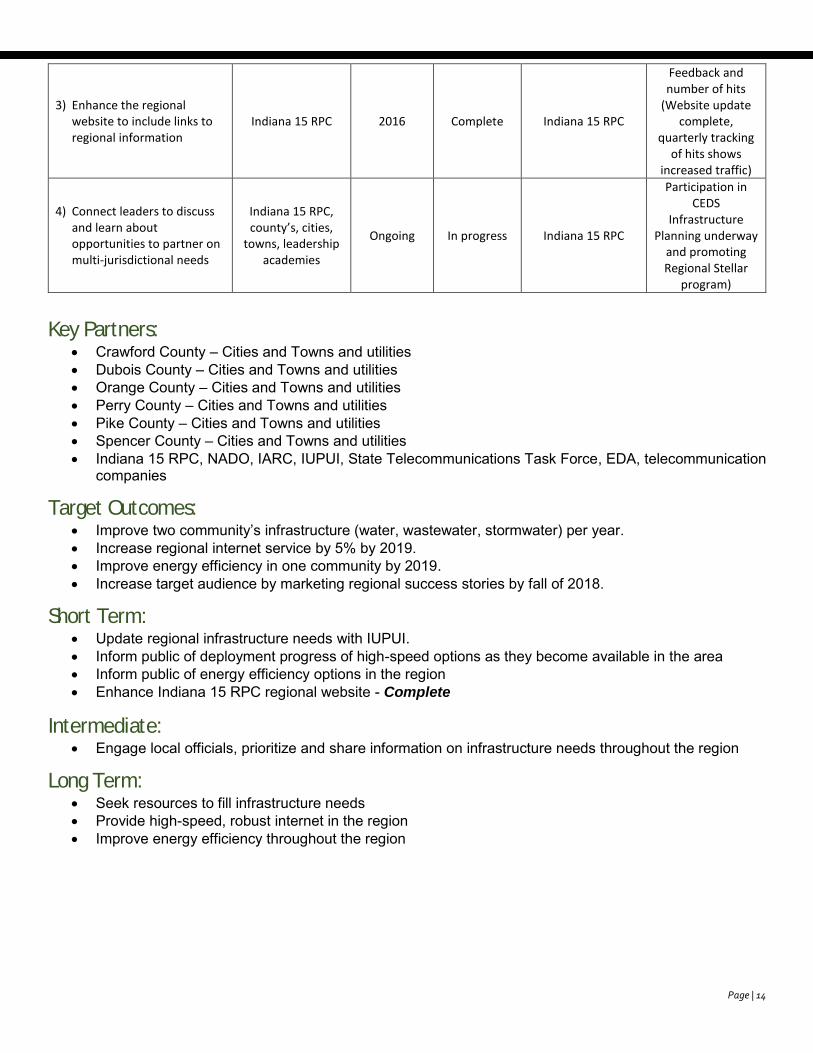
3) Enhance the regional website to include links to regional information
Indiana 15 RPC 2016 Complete Indiana 15 RPC
Feedback and number of hits
(Website update complete,
quarterly tracking of hits shows
increased traffic)
4) Connect leaders to discuss and learn about opportunities to partner on multi-jurisdictional needs
Indiana 15 RPC, county’s, cities,
towns, leadership academies
Ongoing In progress Indiana 15 RPC
Participation in CEDS
Infrastructure Planning underway
and promoting Regional Stellar
program)
Key Partners:
Crawford County – Cities and Towns and utilities Dubois County – Cities and Towns and utilities Orange County – Cities and Towns and utilities Perry County – Cities and Towns and utilities Pike County – Cities and Towns and utilities Spencer County – Cities and Towns and utilities Indiana 15 RPC, NADO, IARC, IUPUI, State Telecommunications Task Force, EDA, telecommunication
companies
Target Outcomes: Improve two community’s infrastructure (water, wastewater, stormwater) per year. Increase regional internet service by 5% by 2019. Improve energy efficiency in one community by 2019. Increase target audience by marketing regional success stories by fall of 2018.
Short Term: Update regional infrastructure needs with IUPUI. Inform public of deployment progress of high-speed options as they become available in the area Inform public of energy efficiency options in the region Enhance Indiana 15 RPC regional website - Complete
Intermediate: Engage local officials, prioritize and share information on infrastructure needs throughout the region
Long Term: Seek resources to fill infrastructure needs Provide high-speed, robust internet in the region Improve energy efficiency throughout the region
Page | 15
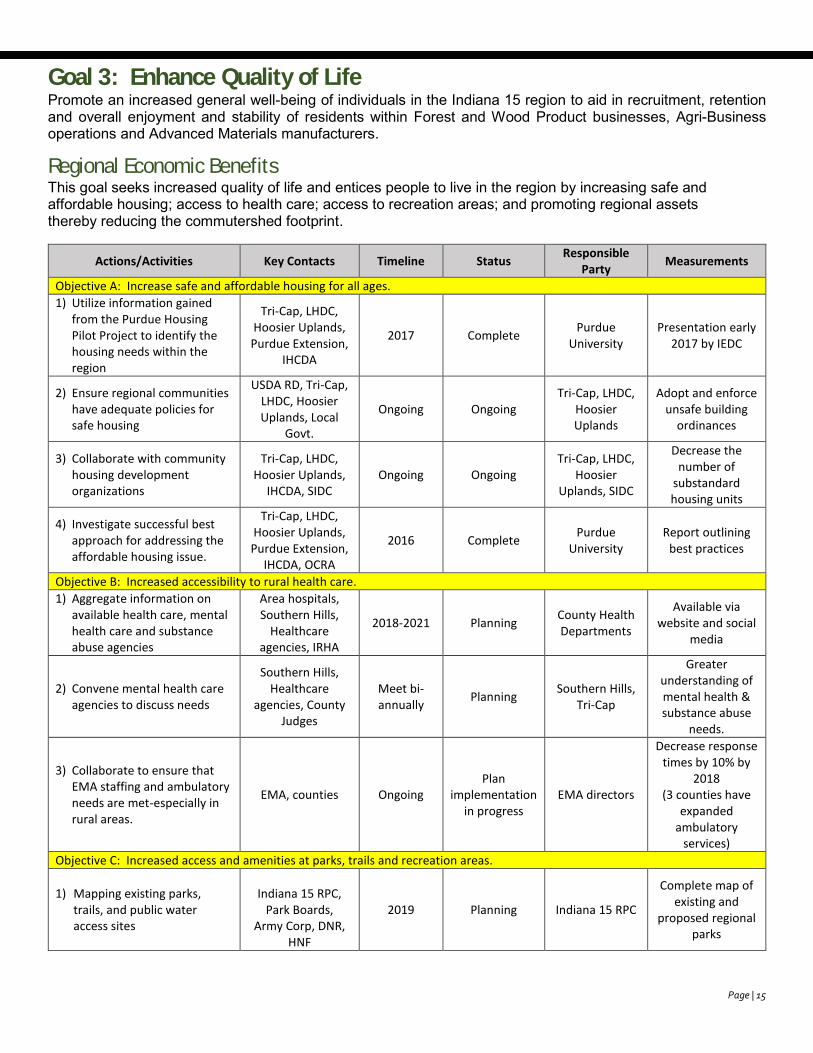
Goal 3: Enhance Quality of Life Promote an increased general well-being of individuals in the Indiana 15 region to aid in recruitment, retention and overall enjoyment and stability of residents within Forest and Wood Product businesses, Agri-Business operations and Advanced Materials manufacturers.
Regional Economic Benefits This goal seeks increased quality of life and entices people to live in the region by increasing safe and affordable housing; access to health care; access to recreation areas; and promoting regional assets thereby reducing the commutershed footprint.
Actions/Activities Key Contacts Timeline Status Responsible
Party Measurements
Objective A: Increase safe and affordable housing for all ages.
1) Utilize information gained from the Purdue Housing Pilot Project to identify the housing needs within the region
Tri-Cap, LHDC, Hoosier Uplands, Purdue Extension,
IHCDA
2017 Complete Purdue
University Presentation early
2017 by IEDC
2) Ensure regional communities have adequate policies for safe housing
USDA RD, Tri-Cap, LHDC, Hoosier Uplands, Local
Govt.
Ongoing Ongoing Tri-Cap, LHDC,
Hoosier Uplands
Adopt and enforce unsafe building
ordinances
3) Collaborate with community housing development organizations
Tri-Cap, LHDC, Hoosier Uplands,
IHCDA, SIDC Ongoing Ongoing
Tri-Cap, LHDC, Hoosier
Uplands, SIDC
Decrease the number of
substandard housing units
4) Investigate successful best approach for addressing the affordable housing issue.
Tri-Cap, LHDC, Hoosier Uplands, Purdue Extension,
IHCDA, OCRA
2016 Complete Purdue
University Report outlining
best practices
Objective B: Increased accessibility to rural health care.
1) Aggregate information on available health care, mental health care and substance abuse agencies
Area hospitals, Southern Hills,
Healthcare agencies, IRHA
2018-2021 Planning County Health Departments
Available via website and social
media
2) Convene mental health care agencies to discuss needs
Southern Hills, Healthcare
agencies, County Judges
Meet bi-annually
Planning Southern Hills,
Tri-Cap
Greater understanding of mental health & substance abuse
needs.
3) Collaborate to ensure that EMA staffing and ambulatory needs are met-especially in rural areas.
EMA, counties Ongoing Plan
implementation in progress
EMA directors
Decrease response times by 10% by
2018 (3 counties have
expanded ambulatory
services)
Objective C: Increased access and amenities at parks, trails and recreation areas.
1) Mapping existing parks, trails, and public water access sites
Indiana 15 RPC,
Park Boards, Army Corp, DNR,
HNF
2019 Planning Indiana 15 RPC
Complete map of existing and
proposed regional parks
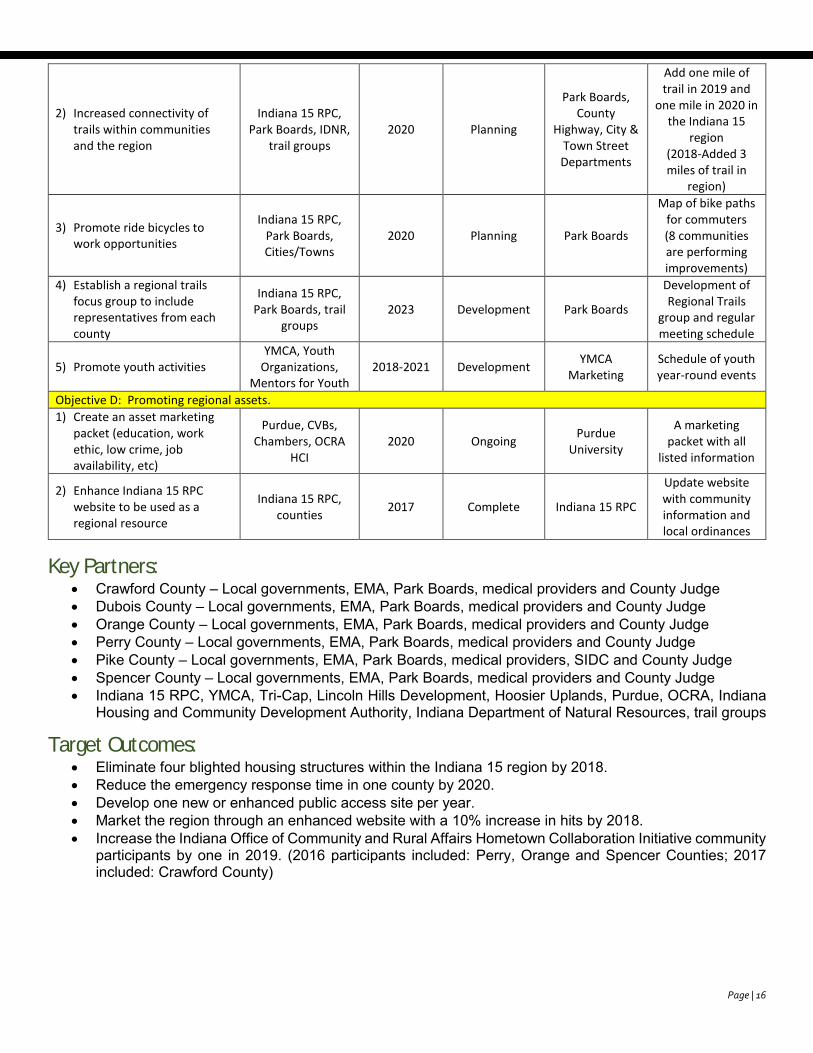
Page | 16
2) Increased connectivity of trails within communities and the region
Indiana 15 RPC, Park Boards, IDNR,
trail groups 2020 Planning
Park Boards, County
Highway, City & Town Street Departments
Add one mile of trail in 2019 and
one mile in 2020 in the Indiana 15
region (2018-Added 3 miles of trail in
region)
3) Promote ride bicycles to work opportunities
Indiana 15 RPC, Park Boards, Cities/Towns
2020 Planning Park Boards
Map of bike paths for commuters (8 communities are performing improvements)
4) Establish a regional trails focus group to include representatives from each county
Indiana 15 RPC, Park Boards, trail
groups 2023 Development Park Boards
Development of Regional Trails
group and regular meeting schedule
5) Promote youth activities YMCA, Youth
Organizations, Mentors for Youth
2018-2021 Development YMCA
Marketing Schedule of youth year-round events
Objective D: Promoting regional assets.
1) Create an asset marketing packet (education, work ethic, low crime, job availability, etc)
Purdue, CVBs, Chambers, OCRA
HCI 2020 Ongoing
Purdue University
A marketing packet with all
listed information
2) Enhance Indiana 15 RPC website to be used as a regional resource
Indiana 15 RPC, counties
2017 Complete Indiana 15 RPC
Update website with community information and local ordinances
Key Partners: Crawford County – Local governments, EMA, Park Boards, medical providers and County Judge Dubois County – Local governments, EMA, Park Boards, medical providers and County Judge Orange County – Local governments, EMA, Park Boards, medical providers and County Judge Perry County – Local governments, EMA, Park Boards, medical providers and County Judge Pike County – Local governments, EMA, Park Boards, medical providers, SIDC and County Judge Spencer County – Local governments, EMA, Park Boards, medical providers and County Judge Indiana 15 RPC, YMCA, Tri-Cap, Lincoln Hills Development, Hoosier Uplands, Purdue, OCRA, Indiana
Housing and Community Development Authority, Indiana Department of Natural Resources, trail groups
Target Outcomes: Eliminate four blighted housing structures within the Indiana 15 region by 2018. Reduce the emergency response time in one county by 2020. Develop one new or enhanced public access site per year. Market the region through an enhanced website with a 10% increase in hits by 2018. Increase the Indiana Office of Community and Rural Affairs Hometown Collaboration Initiative community
participants by one in 2019. (2016 participants included: Perry, Orange and Spencer Counties; 2017 included: Crawford County)
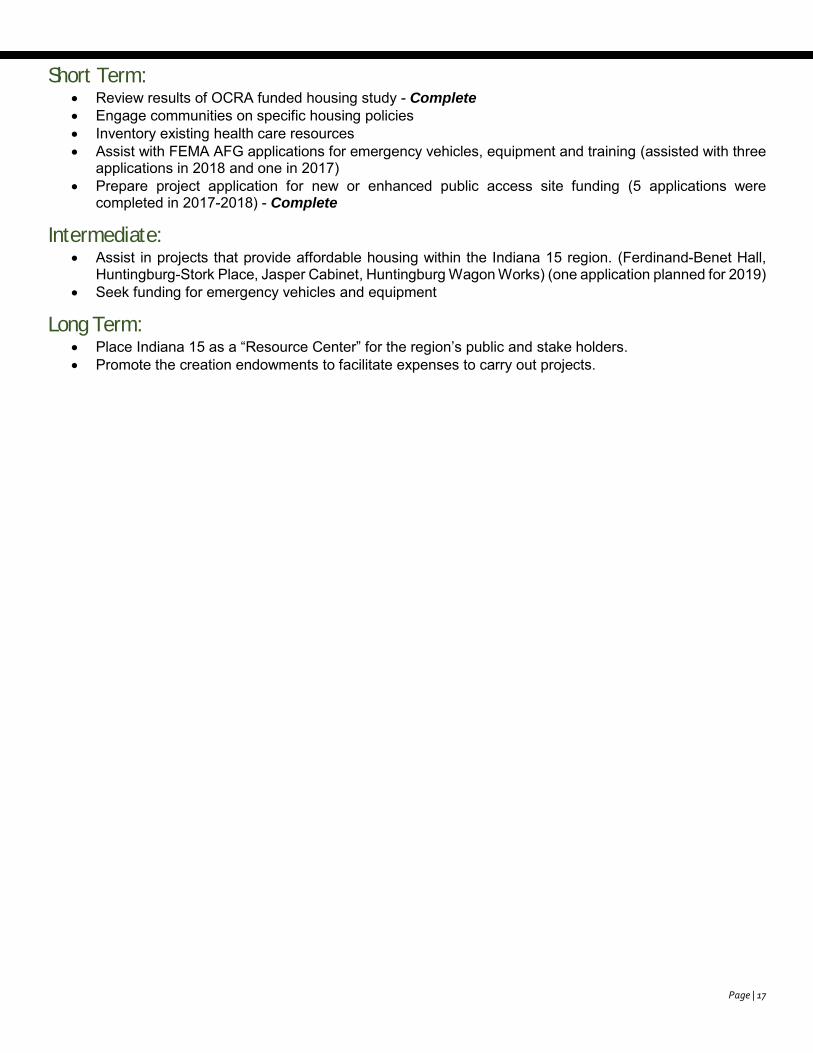
Page | 17
Short Term: Review results of OCRA funded housing study - Complete Engage communities on specific housing policies Inventory existing health care resources Assist with FEMA AFG applications for emergency vehicles, equipment and training (assisted with three
applications in 2018 and one in 2017) Prepare project application for new or enhanced public access site funding (5 applications were
completed in 2017-2018) - Complete
Intermediate: Assist in projects that provide affordable housing within the Indiana 15 region. (Ferdinand-Benet Hall,
Huntingburg-Stork Place, Jasper Cabinet, Huntingburg Wagon Works) (one application planned for 2019) Seek funding for emergency vehicles and equipment
Long Term: Place Indiana 15 as a “Resource Center” for the region’s public and stake holders. Promote the creation endowments to facilitate expenses to carry out projects.
Page | 18
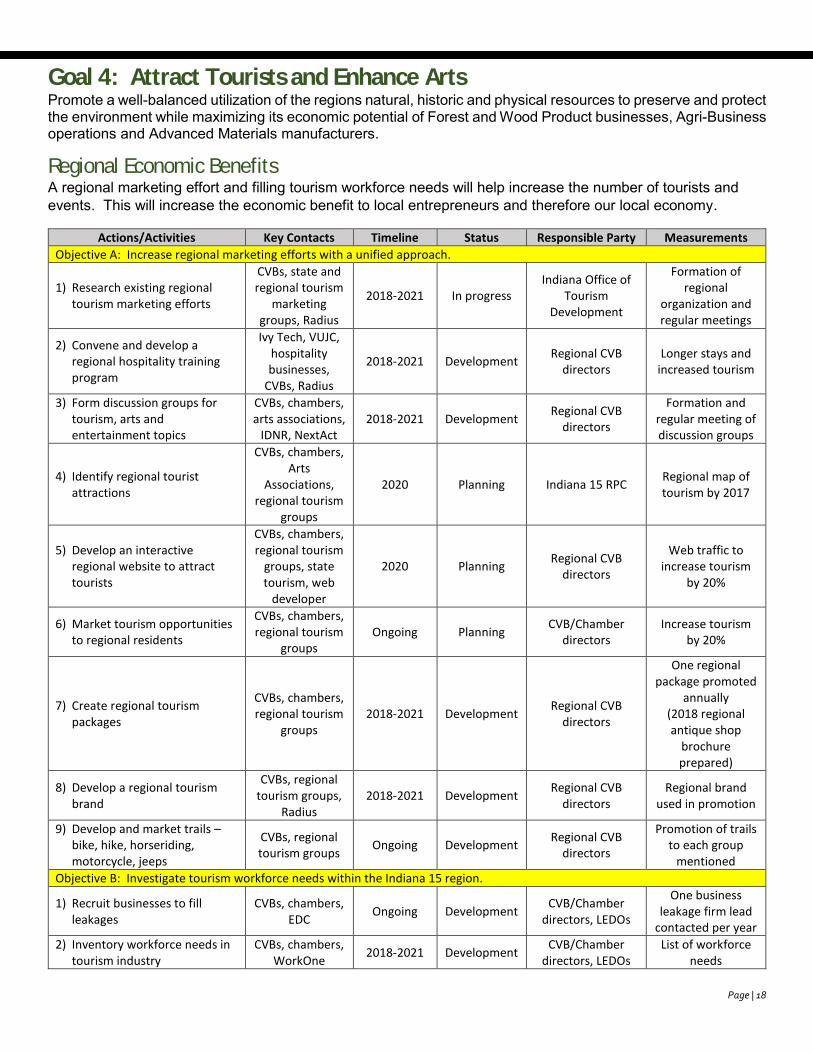
Goal 4: Attract Tourists and Enhance Arts Promote a well-balanced utilization of the regions natural, historic and physical resources to preserve and protect the environment while maximizing its economic potential of Forest and Wood Product businesses, Agri-Business operations and Advanced Materials manufacturers.
Regional Economic Benefits A regional marketing effort and filling tourism workforce needs will help increase the number of tourists and events. This will increase the economic benefit to local entrepreneurs and therefore our local economy.
Actions/Activities Key Contacts Timeline Status Responsible Party Measurements
Objective A: Increase regional marketing efforts with a unified approach.
1) Research existing regional tourism marketing efforts
CVBs, state and regional tourism
marketing groups, Radius
2018-2021 In progress Indiana Office of
Tourism Development
Formation of regional
organization and regular meetings
2) Convene and develop a regional hospitality training program
Ivy Tech, VUJC, hospitality businesses,
CVBs, Radius
2018-2021 Development Regional CVB
directors Longer stays and
increased tourism
3) Form discussion groups for tourism, arts and entertainment topics
CVBs, chambers, arts associations,
IDNR, NextAct 2018-2021 Development
Regional CVB directors
Formation and regular meeting of discussion groups
4) Identify regional tourist attractions
CVBs, chambers, Arts
Associations, regional tourism
groups
2020 Planning Indiana 15 RPC Regional map of tourism by 2017
5) Develop an interactive regional website to attract tourists
CVBs, chambers, regional tourism
groups, state tourism, web
developer
2020 Planning Regional CVB
directors
Web traffic to increase tourism
by 20%
6) Market tourism opportunities to regional residents
CVBs, chambers, regional tourism
groups Ongoing Planning
CVB/Chamber directors
Increase tourism by 20%
7) Create regional tourism packages
CVBs, chambers, regional tourism
groups 2018-2021 Development
Regional CVB directors
One regional package promoted
annually (2018 regional antique shop
brochure prepared)
8) Develop a regional tourism brand
CVBs, regional tourism groups,
Radius 2018-2021 Development
Regional CVB directors
Regional brand used in promotion
9) Develop and market trails – bike, hike, horseriding, motorcycle, jeeps
CVBs, regional tourism groups
Ongoing Development Regional CVB
directors
Promotion of trails to each group
mentioned
Objective B: Investigate tourism workforce needs within the Indiana 15 region.
1) Recruit businesses to fill leakages
CVBs, chambers, EDC
Ongoing Development CVB/Chamber
directors, LEDOs
One business leakage firm lead
contacted per year
2) Inventory workforce needs in tourism industry
CVBs, chambers, WorkOne
2018-2021 Development CVB/Chamber
directors, LEDOs List of workforce
needs
Page | 19
Key Partners: Crawford County – CVB and Chamber Dubois County – CVB and Chamber, NextAct Orange County – CVB and Chamber, West Baden CVB Perry County – CVB and Chamber Pike County – Tourism and Chamber Spencer County – CVB and Chamber, Holiday World marketing WorkOne, Radius, arts groups, IDNR, VUJC, regional and state tourism groups
Target Outcomes: Increase regional tourism income by 10% by 2019. Activate a unified regional CVB group by 2020.
Short Term: Engage CVBs to discuss a regionally unified strategic approach to increase tourism income Inventory regional tourism assets for use in marketing materials Work with Indiana 15 counties to duplicate Perry County’s unified website approach (Chamber, Economic
Development, Tourism, Government, Education, etc).
Intermediate: Implement the regional hospitality training program via stakeholder engagement
Long Term: Develop a regional brand and unified marketing strategy.
Page | 20
Evaluation Plan
Feedback from Public Comment Period: The CEDS was advertised for public comment from March 28-April 28, 2018. The following modifications were made based on feedback:
Comments received from the Mayor of Rockport on additional projects were added to the plan. Comments received from the Town of Alton on additions and changes were incorporated. A comment was received fromn Jeff Quyle with Radius stating they had initiated a regional marketing
plan for Crawford Dubois and Orange County tourism. This information is noted in Goal 3. Comments received from Perry County LEDO stating three items pertaining to the Perry County Port are
funded and underway. Also clarifications on Can-Clay site, brownfield needs, interchange needs, potable water needs and the Annex building. He also added two additional planning items for development. These comments were incorporated into the project list in the appendix.
Comments received from an Indiana 15 Board member clarified listings on the Orange County Project list for the French Lick airport and on the Perry County list for the community center need.
Key Measures and Strategies to Track Progress: The implementation status of this Comprehensive Economic Development Strategy will be an agenda item on the Indiana 15 Regional Planning Commission Board of Directors quarterly meeting. The goals, objectives and outcomes are included in part of the Comprehensive Economic Development Strategy reported to the Economic Development Administration.
Page | 21
Appendix
Appendix A – CEDS and SET Members
Crawford County – Bill Byrd – Retired Business owner/Indiana 15 RPC Board/Utility Crawford County – Randy Gilmore – Past County Commissioner/Former Indiana 15 RPC Board Crawford County – Linda Gilmore – Resident Crawford County – Stephen Bartels – Business Owner/County Council/Indiana 15 RPC Board/State Legislator Crawford County – Morton Dale – County Commissioner/Community Organization Crawford County – Bill Breeding – County Council/Business/Agriculture/The Aged Crawford County – Patricia Hahus – Alton Town Council/Community Organization/Women Crawford County – Michael Haverstock – Marengo Town Council/Utility/Community Organization Dubois County – Ashlee Sudbury – Purdue Dubois County – Beverly Schulthise – Former Ferdinand Clerk-Treasurer/Indiana 15 RPC Board Dubois County – Charmian Klem – County Council/Indiana 15 RPC Board/Education/Women Dubois County – Courtney Knies – Youth/Current Blend Entrepreneurship Center Dubois County – Dave Wylam – Resident Dubois County – Debbie Johnson – Ferdinand Town Council
Dubois County – Doug Merkel – Utility Dubois County – Drew Englert – Resident Dubois County – Jan Dougan – Purdue Dubois County – Gary Dougan – Resident Dubois County – Larry Vollmer – Past County Commissioner/Former Indiana 15 RPC Board Dubois County – Kenneth Eck – Purdue Dubois County – Nancy Eckerle – Chamber of Commerce/Jasper City Council/Not-for-Profit Dubois County – Nick Hostetter – County Commissioner/Indiana 15 RPC Board/Business
Dubois County – Paul Lorey – Indiana 15 RPC Board/Business/Finance/Agriculture Dubois County – Mike Ellis – Indiana 15 RPC Board/Professions/Public Health Dubois County – Neil Elkins – Disadvantaged
Dubois County – Phil Ahrens – Resident/Realtor Dubois County – Terry Seitz – Mayor Jasper Dubois County – Travis McQueen – Transportation Orange County – Don Brewer – County Commissioner
Orange County – Imojean Dedrick – Community Foundation Orange County – Cathy Hardin – Community Foundation Orange County – Rudy Freeman – Indiana 15 RPC Board/County Highway Supervisor/Farmer Orange County – Matt Henderson – Indiana 15 RPC Board/Business/Professions/Utilities Orange County – John Harrison – Indiana 15 RPC Board Orange County – Tanya Hall – Purdue
Perry County – Alvin Evans – Economic Development Perry County – Erin Emerson – Economic Development/Not-for-Profit Perry County – Jeff Rogers – Manufacturing Perry County – Jody French – Education/County Council Perry County – Larry James – County Commissioner Perry County – Lee Chestnut – Economic Development Perry County – Mary Snyder – Mayor Cannelton Perry County – Mary Roberson – Education/Youth Perry County – Tara Damin – Women
Perry County – Thomas Hauser – Perry County Council/Indiana 15 RPC Board/Agriculture/Public Health Pike County – Ashley Willis – Economic Development Pike County – Jon Craig – Business/Pike County Progress Partners/Indiana 15 RPC Board Spencer County – Al Logsdon – County Commissioner/Indiana 15 RPC Board/Education Spencer County – Gay Ann Harney – Mayor of Rockport/Indiana 15 RPC Board/Community Organizations Spencer County – Jack Kroeger – County Council Spencer County – Jeff Lindsey – Business Owner Spencer County – John Bowen – Recreation/Santa Claus Town Council Spencer County – Mason Seay – Chrisney Town Council/Indiana 15 RPC Board/Finance Spencer County – Don Wertman – Dale Town Council/Indiana 15 RPC Board Spencer County – Angie Fischer – Grandview Town Council/Indiana 15 RPC Board/Community Organizations
Page | 22
Spencer County – Michael Johannes – Santa Claus Town Council/Indiana 15 RPC Board/Business Spencer County – Nick Held – Purdue Spencer County – Todd Ruxer – County Council/Indiana 15 RPC Board/Community Organizations Spencer County – Tom Utter – Economic Development Crawford/Dubois/Orange/Perry/Pike/Spencer – Lisa Gehlhausen – Indiana 15 RPC Crawford/Dubois/Orange/Perry/Pike/Spencer – Nathan Held – Indiana 15 RPC Crawford/Dubois/Orange/Perry/Pike/Spencer – Cheri Taylor – Indiana 15 RPC Crawford/Dubois/Orange/Perry/Pike/Spencer – Terri Weyer – USDA Crawford/Dubois/Orange/Perry/Pike/Spencer – Craig McGowan – USDA Crawford/Dubois/Orange/Perry/Pike/Spencer – Deb Boudreau – USDA Crawford/Dubois/Orange/Perry/Pike/Spencer – Wayne Dubble – USDA Crawford/Dubois/Orange/Perry/Pike/Spencer – Mark Beckman – USDA Crawford/Dubois/Orange/Perry/Pike/Spencer – Jim Heck – WorkOne Crawford/Dubois/Orange/Perry/Pike/Spencer – Tony Goben – Senator Donnelly’s office Crawford/Dubois/Orange/Perry/Pike/Spencer – Larry Ordner – Congressman Bucshon’s office
Crawford/Dubois/Orange/Perry/Pike/Spencer – Mike Strahl – USDA Dubois/Pike/Spencer – Mark Messmer – Former State Senator
Crawford/Dubois/Orange/Perry/Pike/Spencer – Terri Weyer – USDA Crawford/Dubois/Orange/Perry/Pike/Spencer – Theresa Chriss-Hartwig – IARC Heather Strohm – Purdue Bo Beaulieu – Purdue
Page | 23
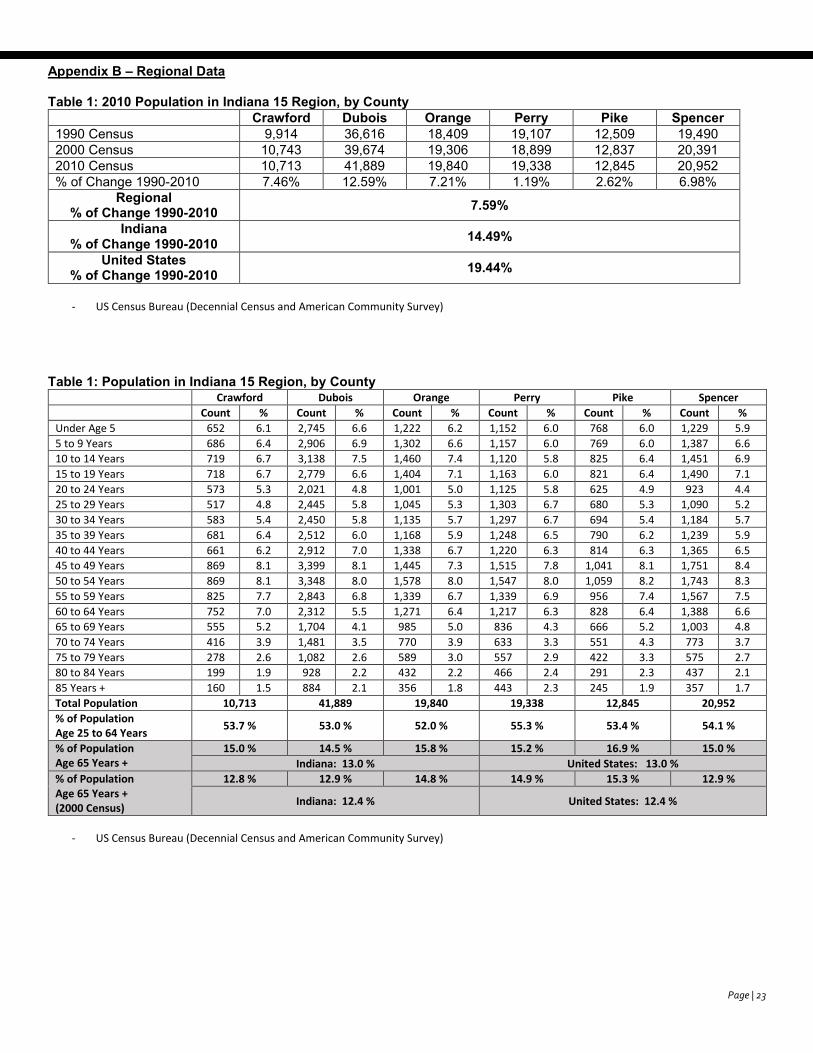
Appendix B – Regional Data Table 1: 2010 Population in Indiana 15 Region, by County
Crawford Dubois Orange Perry Pike Spencer 1990 Census 9,914 36,616 18,409 19,107 12,509 19,490 2000 Census 10,743 39,674 19,306 18,899 12,837 20,391 2010 Census 10,713 41,889 19,840 19,338 12,845 20,952 % of Change 1990-2010 7.46% 12.59% 7.21% 1.19% 2.62% 6.98%
Regional % of Change 1990-2010 7.59%
Indiana % of Change 1990-2010 14.49%
United States % of Change 1990-2010 19.44%
- US Census Bureau (Decennial Census and American Community Survey)
Table 1: Population in Indiana 15 Region, by County
Crawford Dubois Orange Perry Pike Spencer
Count % Count % Count % Count % Count % Count %
Under Age 5 652 6.1 2,745 6.6 1,222 6.2 1,152 6.0 768 6.0 1,229 5.9
5 to 9 Years 686 6.4 2,906 6.9 1,302 6.6 1,157 6.0 769 6.0 1,387 6.6
10 to 14 Years 719 6.7 3,138 7.5 1,460 7.4 1,120 5.8 825 6.4 1,451 6.9
15 to 19 Years 718 6.7 2,779 6.6 1,404 7.1 1,163 6.0 821 6.4 1,490 7.1
20 to 24 Years 573 5.3 2,021 4.8 1,001 5.0 1,125 5.8 625 4.9 923 4.4
25 to 29 Years 517 4.8 2,445 5.8 1,045 5.3 1,303 6.7 680 5.3 1,090 5.2
30 to 34 Years 583 5.4 2,450 5.8 1,135 5.7 1,297 6.7 694 5.4 1,184 5.7
35 to 39 Years 681 6.4 2,512 6.0 1,168 5.9 1,248 6.5 790 6.2 1,239 5.9
40 to 44 Years 661 6.2 2,912 7.0 1,338 6.7 1,220 6.3 814 6.3 1,365 6.5
45 to 49 Years 869 8.1 3,399 8.1 1,445 7.3 1,515 7.8 1,041 8.1 1,751 8.4
50 to 54 Years 869 8.1 3,348 8.0 1,578 8.0 1,547 8.0 1,059 8.2 1,743 8.3
55 to 59 Years 825 7.7 2,843 6.8 1,339 6.7 1,339 6.9 956 7.4 1,567 7.5
60 to 64 Years 752 7.0 2,312 5.5 1,271 6.4 1,217 6.3 828 6.4 1,388 6.6
65 to 69 Years 555 5.2 1,704 4.1 985 5.0 836 4.3 666 5.2 1,003 4.8
70 to 74 Years 416 3.9 1,481 3.5 770 3.9 633 3.3 551 4.3 773 3.7
75 to 79 Years 278 2.6 1,082 2.6 589 3.0 557 2.9 422 3.3 575 2.7
80 to 84 Years 199 1.9 928 2.2 432 2.2 466 2.4 291 2.3 437 2.1
85 Years + 160 1.5 884 2.1 356 1.8 443 2.3 245 1.9 357 1.7
Total Population 10,713 41,889 19,840 19,338 12,845 20,952
% of Population Age 25 to 64 Years
53.7 % 53.0 % 52.0 % 55.3 % 53.4 % 54.1 %
% of Population Age 65 Years +
15.0 % 14.5 % 15.8 % 15.2 % 16.9 % 15.0 %
Indiana: 13.0 % United States: 13.0 %
% of Population Age 65 Years + (2000 Census)
12.8 % 12.9 % 14.8 % 14.9 % 15.3 % 12.9 %
Indiana: 12.4 % United States: 12.4 %
- US Census Bureau (Decennial Census and American Community Survey)
Page | 24
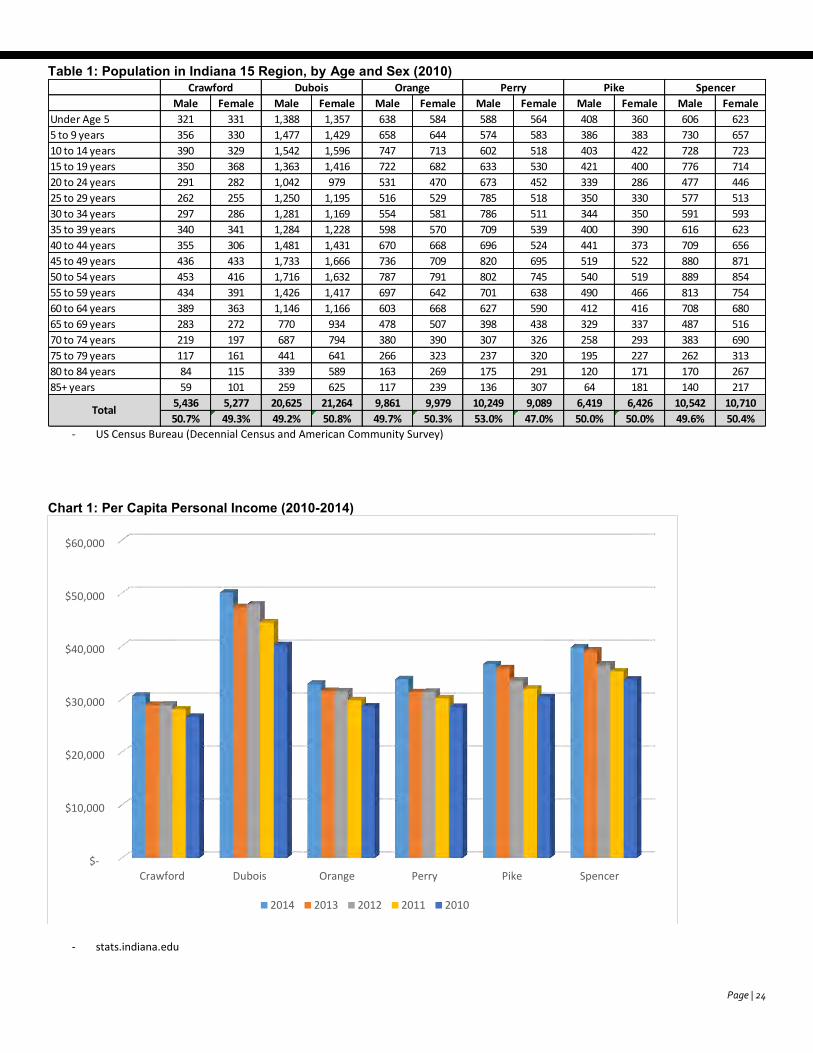
Table 1: Population in Indiana 15 Region, by Age and Sex (2010)
- US Census Bureau (Decennial Census and American Community Survey)
Chart 1: Per Capita Personal Income (2010-2014)
- stats.indiana.edu
Male Female Male Female Male Female Male Female Male Female Male Female
Under Age 5 321 331 1,388 1,357 638 584 588 564 408 360 606 623
5 to 9 years 356 330 1,477 1,429 658 644 574 583 386 383 730 657
10 to 14 years 390 329 1,542 1,596 747 713 602 518 403 422 728 723
15 to 19 years 350 368 1,363 1,416 722 682 633 530 421 400 776 714
20 to 24 years 291 282 1,042 979 531 470 673 452 339 286 477 446
25 to 29 years 262 255 1,250 1,195 516 529 785 518 350 330 577 513
30 to 34 years 297 286 1,281 1,169 554 581 786 511 344 350 591 593
35 to 39 years 340 341 1,284 1,228 598 570 709 539 400 390 616 623
40 to 44 years 355 306 1,481 1,431 670 668 696 524 441 373 709 656
45 to 49 years 436 433 1,733 1,666 736 709 820 695 519 522 880 871
50 to 54 years 453 416 1,716 1,632 787 791 802 745 540 519 889 854
55 to 59 years 434 391 1,426 1,417 697 642 701 638 490 466 813 754
60 to 64 years 389 363 1,146 1,166 603 668 627 590 412 416 708 680
65 to 69 years 283 272 770 934 478 507 398 438 329 337 487 516
70 to 74 years 219 197 687 794 380 390 307 326 258 293 383 690
75 to 79 years 117 161 441 641 266 323 237 320 195 227 262 313
80 to 84 years 84 115 339 589 163 269 175 291 120 171 170 267
85+ years 59 101 259 625 117 239 136 307 64 181 140 217
5,436 5,277 20,625 21,264 9,861 9,979 10,249 9,089 6,419 6,426 10,542 10,710
50.7% 49.3% 49.2% 50.8% 49.7% 50.3% 53.0% 47.0% 50.0% 50.0% 49.6% 50.4%Total
SpencerCrawford Dubois Orange Perry Pike
$-
$10,000
$20,000
$30,000
$40,000
$50,000
$60,000
Crawford Dubois Orange Perry Pike Spencer
2014 2013 2012 2011 2010
Page | 25
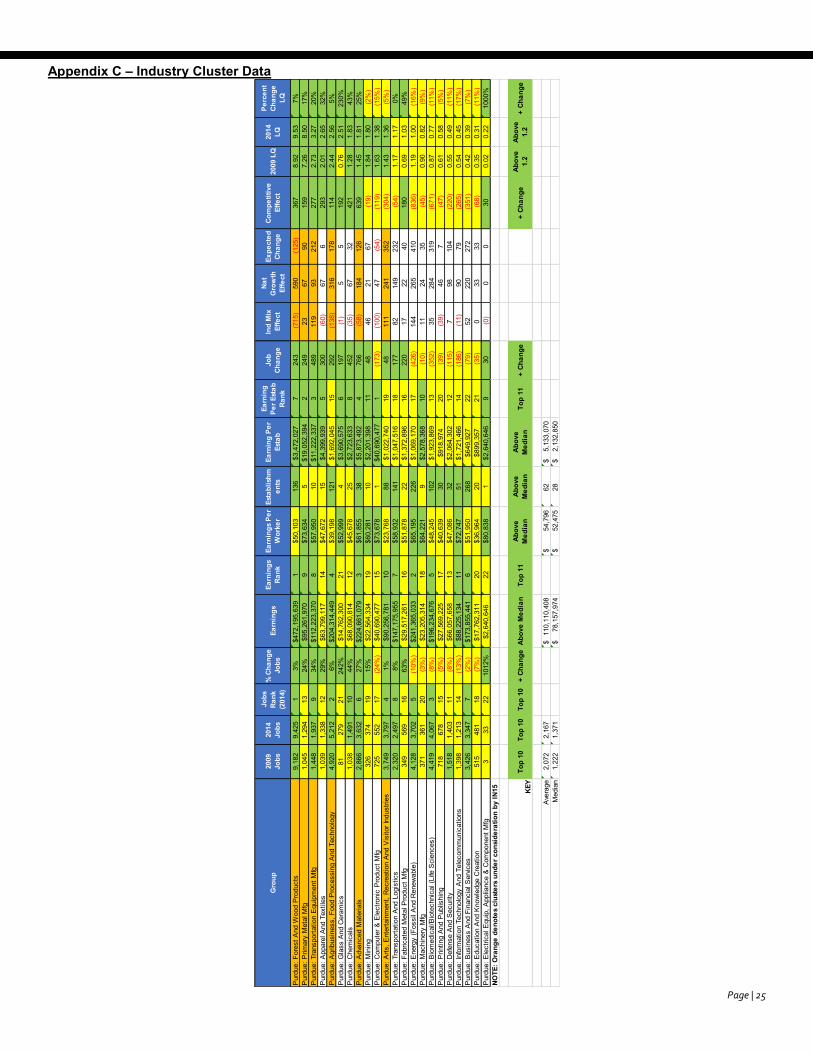
Appendix C – Industry Cluster Data
Gro
up20
09
Jobs
2014
Jo
bs
Jobs
Ra
nk
(201
4)
% C
hang
e Jo
bsEa
rnin
gsEa
rnin
gs
Rank
Ea
rnin
gs P
er
Wor
ker
Esta
blis
hmen
tsEa
rnin
g Pe
r Es
tab
Earn
ing
Per E
stab
Ra
nk
Job
Chan
geIn
d M
ix
Effe
ct
Nat
Gro
wth
Ef
fect
Expe
cted
Ch
ange
Com
petit
ive
Effe
ct20
09 L
Q20
14
LQ
Perc
ent
Chan
ge
LQ
Pur
due:
For
est A
nd W
ood
Pro
duct
s9,
182
9,42
51
3%$4
72,1
95,6
391
$50,
103
136
$3,4
72,0
277
243
(715
)59
0 (1
25)
367
8.92
9.53
7%P
urdu
e: P
rimar
y M
etal
Mfg
1,04
51,
294
1324
%$9
5,26
1,97
09
$73,
634
5$1
9,05
2,39
42
249
2367
9015
97.
268.
5017
%P
urdu
e: T
rans
porta
tion
Equ
ipm
ent M
fg1,
448
1,93
79
34%
$112
,223
,370
8$5
7,95
010
$11,
222,
337
348
911
993
212
277
2.73
3.27
20%
Pur
due:
App
arel
And
Tex
tiles
1,03
91,
338
1229
%$6
3,79
9,11
714
$47,
672
15$4
,399
,939
530
0 (6
0)67
629
32.
012.
6532
%P
urdu
e: A
grib
usin
ess,
Foo
d P
roce
ssin
g A
nd T
echn
olog
y4,
920
5,21
22
6%$2
04,3
14,4
494
$39,
198
121
$1,6
92,0
4515
292
(138
)31
617
811
42.
442.
565%
Pur
due:
Gla
ss A
nd C
eram
ics
8127
921
242%
$14,
762,
300
21$5
2,99
94
$3,6
90,5
756
197
(1)
55
192
0.76
2.51
230%
Pur
due:
Che
mic
als
1,03
81,
491
1044
%$6
8,09
0,81
412
$45,
678
25$2
,723
,633
845
2 (3
5)67
3242
11.
281.
8343
%P
urdu
e: A
dvan
ced
Mat
eria
ls2,
866
3,63
26
27%
$224
,661
,079
3$6
1,85
538
$5,8
73,4
924
766
(58)
184
126
639
1.45
1.81
25%
Pur
due:
Min
ing
326
374
1915
%$2
2,56
4,33
419
$60,
281
10$2
,201
,398
1148
4621
67 (1
9)1.
841.
80 (2
%)
Pur
due:
Com
pute
r & E
lect
roni
c P
rodu
ct M
fg72
555
217
(24%
)$4
0,69
0,47
715
$73,
678
1$4
0,69
0,47
71
(173
) (1
00)
47 (5
4) (1
19)
1.63
1.38
(15%
)P
urdu
e: A
rts, E
nter
tain
men
t, R
ecre
atio
n A
nd V
isito
r Ind
ustri
es3,
749
3,79
74
1%$9
0,25
6,78
110
$23,
768
88$1
,022
,740
1948
111
241
352
(304
)1.
431.
36 (5
%)
Pur
due:
Tra
nspo
rtatio
n A
nd L
ogis
tics
2,32
02,
497
88%
$147
,175
,955
7$5
8,93
214
1$1
,047
,516
1817
782
149
232
(54)
1.17
1.17
0%P
urdu
e: F
abric
ated
Met
al P
rodu
ct M
fg34
956
916
63%
$29,
517,
261
16$5
1,87
822
$1,3
72,8
9616
220
1722
4018
00.
691.
0349
%P
urdu
e: E
nerg
y (F
ossi
l And
Ren
ewab
le)
4,12
83,
702
5 (1
0%)
$241
,365
,033
2$6
5,19
522
6$1
,069
,170
17 (4
26)
144
265
410
(836
)1.
191.
00 (1
6%)
Pur
due:
Mac
hine
ry M
fg37
136
120
(3%
)$2
3,20
5,31
418
$64,
221
9$2
,578
,368
10 (1
0)11
2435
(45)
0.90
0.82
(9%
)P
urdu
e: B
iom
edic
al/B
iote
chni
cal (
Life
Sci
ence
s)4,
419
4,06
73
(8%
)$1
96,2
34,6
765
$48,
245
102
$1,9
23,8
6913
(352
)35
284
319
(671
)0.
870.
77 (1
1%)
Pur
due:
Prin
ting
And
Pub
lishi
ng71
867
815
(5%
)$2
7,56
9,22
517
$40,
639
30$9
18,9
7420
(39)
(39)
467
(47)
0.61
0.58
(5%
)P
urdu
e: D
efen
se A
nd S
ecur
ity1,
518
1,40
311
(8%
)$6
6,05
7,65
813
$47,
086
32$2
,064
,302
12 (1
15)
798
104
(220
)0.
550.
49 (1
1%)
Pur
due:
Info
rmat
ion
Tech
nolo
gy A
nd T
elec
omm
unic
atio
ns1,
398
1,21
314
(13%
)$8
8,22
5,13
411
$72,
747
51$1
,721
,466
14 (1
86)
(11)
9079
(265
)0.
540.
45 (1
7%)
Pur
due:
Bus
ines
s A
nd F
inan
cial
Ser
vices
3,42
63,
347
7 (2
%)
$173
,855
,441
6$5
1,95
026
8$6
49,9
2722
(79)
5222
027
2 (3
51)
0.42
0.39
(7%
)P
urdu
e: E
duca
tion
And
Kno
wle
dge
Cre
atio
n51
548
118
(7%
)$1
7,76
2,31
120
$36,
964
20$8
99,3
5721
(35)
033
33 (6
8)0.
350.
31 (1
1%)
Pur
due:
Ele
ctric
al E
quip
, App
lianc
e &
Com
pone
nt M
fg3
3322
1012
%$2
,640
,646
22$8
0,83
81
$2,6
40,6
469
30 (0
)0
030
0.02
0.22
1000
%NO
TE: O
rang
e de
note
s cl
uste
rs u
nder
con
side
ratio
n by
IN15 KE
YTo
p 10
Top
10To
p 10
+ Ch
ange
Abov
e M
edia
nTo
p 11
Abov
e M
edia
nAb
ove
Med
ian
Abov
e M
edia
nTo
p 11
+ Ch
ange
+ Ch
ange
Abov
e 1.
2Ab
ove
1.2
+ Ch
ange
Ave
rage
2,07
22,
167
110,
110,
408
$
54,7
96$
62
5,13
3,07
0$
M
edia
n1,
222
1,37
178
,157
,974
$
52
,475
$
282,
132,
850
$

Page | 26
Appendix D – Regional Snapshot
Indiana 15 Regional Planning Commission Region, Indiana
Regional Data SnapshotTarget Industry ClustersSET Session 2
Overview0102
Table of contents
Target Industry Clusters
03 Industry Cluster Comparison

01overview
Indiana 15 RPC Region, Indiana
4
Overview
section 01
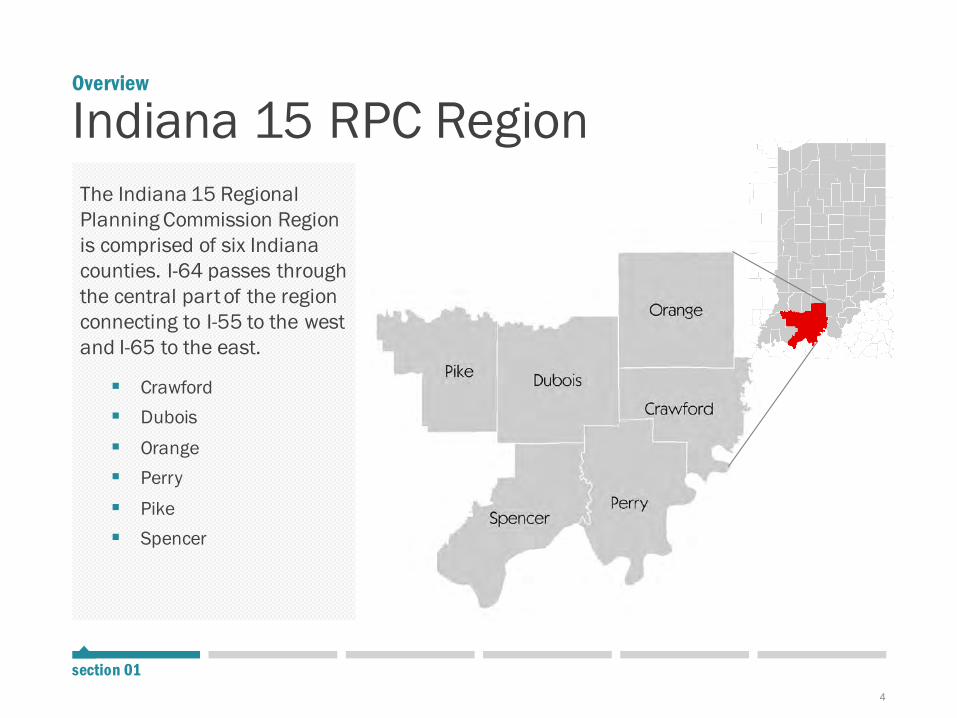
Indiana 15 RPC RegionThe Indiana 15 Regional Planning Commission Region is comprised of six Indiana counties. I-64 passes through the central part of the region connecting to I-55 to the west and I-65 to the east.
Crawford Dubois
Orange Perry
Pike Spencer
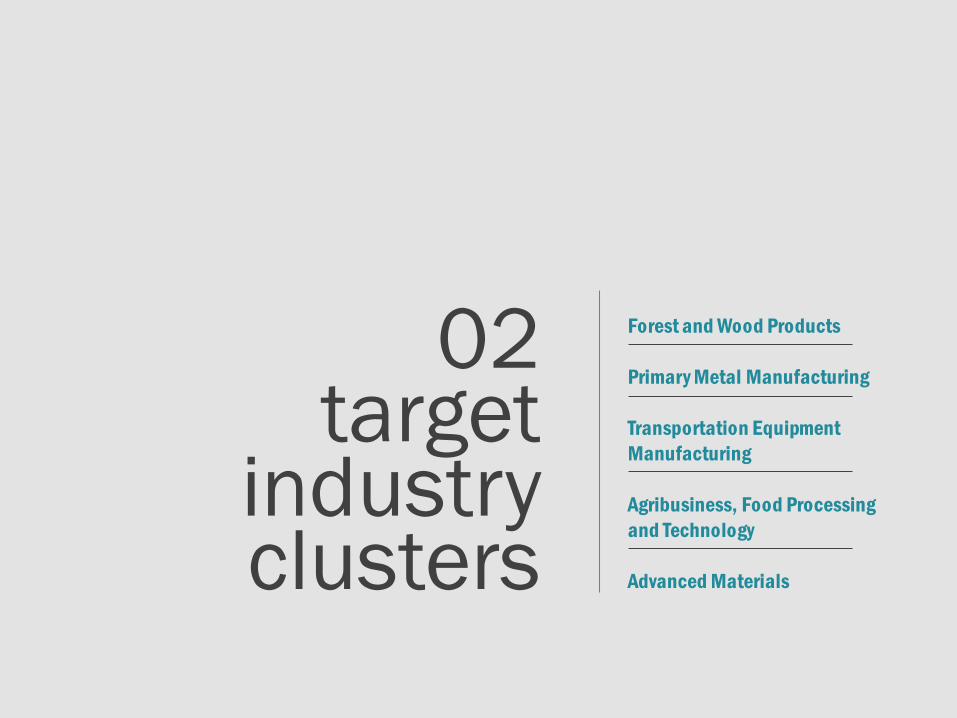
02target
industry clusters
Forest and Wood Products
Primary Metal Manufacturing
Transportation Equipment Manufacturing
Agribusiness, Food Processing and Technology
Advanced Materials
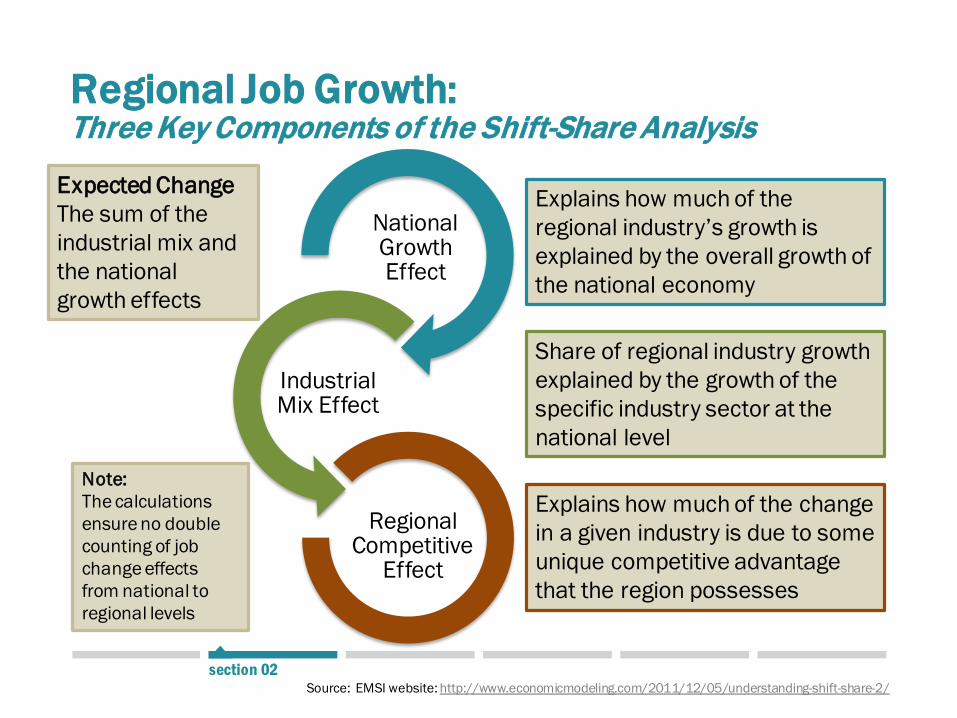
Regional Job Growth: Three Key Components of the Shift-Share Analysis
National Growth Effect
Industrial Mix Effect
Regional Competitive
Effect
Source: EMSI website: http://www.economicmodeling.com/2011/12/05/understanding-shift-share-2/
Share of regional industry growth explained by the growth of the specific industry sector at the national level
Explains how much of the regional industry’s growth is explained by the overall growth of the national economy
Explains how much of the change in a given industry is due to some unique competitive advantage that the region possesses
Expected ChangeThe sum of the industrial mix and the national growth effects
Note:The calculations ensure no double counting of job change effects from national to regional levels
section 02
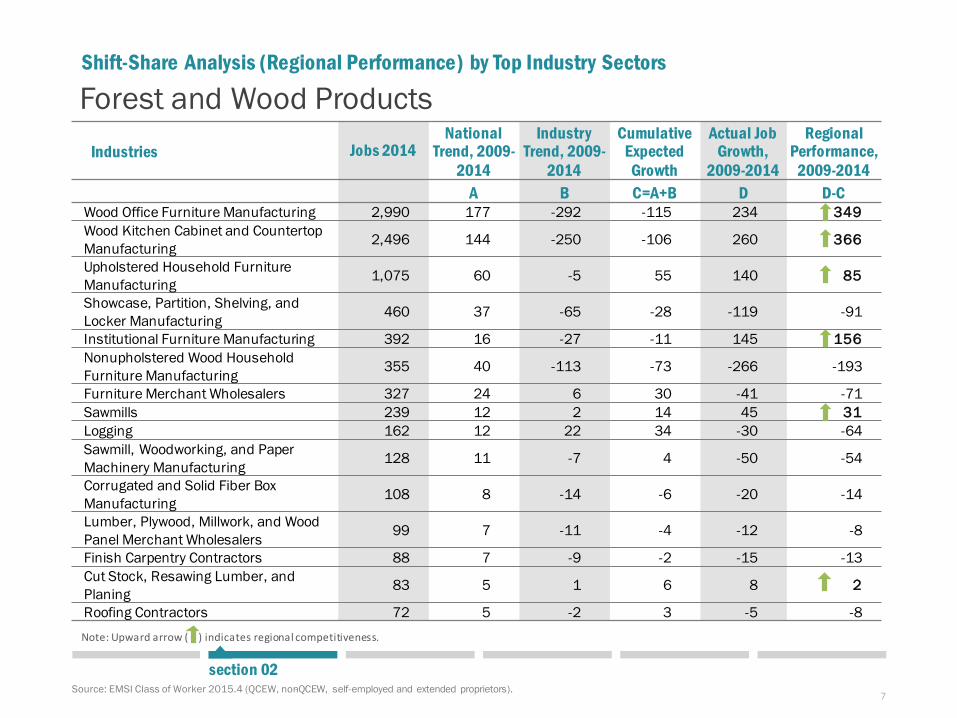
7
section 02Source: EMSI Class of Worker 2015.4 (QCEW, non-QCEW, self-employed and extended proprietors).
Forest and Wood ProductsIndustries Jobs 2014
National Trend, 2009-
2014
Industry Trend, 2009-
2014
Cumulative Expected
Growth
Actual Job Growth,
2009-2014
Regional Performance,
2009-2014A B C=A+B D D-C
Wood Office Furniture Manufacturing 2,990 177 -292 -115 234 349Wood Kitchen Cabinet and Countertop Manufacturing 2,496 144 -250 -106 260 366
Upholstered Household Furniture Manufacturing 1,075 60 -5 55 140 85
Showcase, Partition, Shelving, and Locker Manufacturing 460 37 -65 -28 -119 -91
Institutional Furniture Manufacturing 392 16 -27 -11 145 156Nonupholstered Wood Household Furniture Manufacturing 355 40 -113 -73 -266 -193
Furniture Merchant Wholesalers 327 24 6 30 -41 -71Sawmills 239 12 2 14 45 31Logging 162 12 22 34 -30 -64Sawmill, Woodworking, and Paper Machinery Manufacturing 128 11 -7 4 -50 -54
Corrugated and Solid Fiber Box Manufacturing 108 8 -14 -6 -20 -14
Lumber, Plywood, Millwork, and Wood Panel Merchant Wholesalers 99 7 -11 -4 -12 -8
Finish Carpentry Contractors 88 7 -9 -2 -15 -13Cut Stock, Resawing Lumber, and Planing 83 5 1 6 8 2
Roofing Contractors 72 5 -2 3 -5 -8
Shift-Share Analysis (Regional Performance) by Top Industry Sectors
Note: Upward arrow ( ) indicates regional competitiveness.
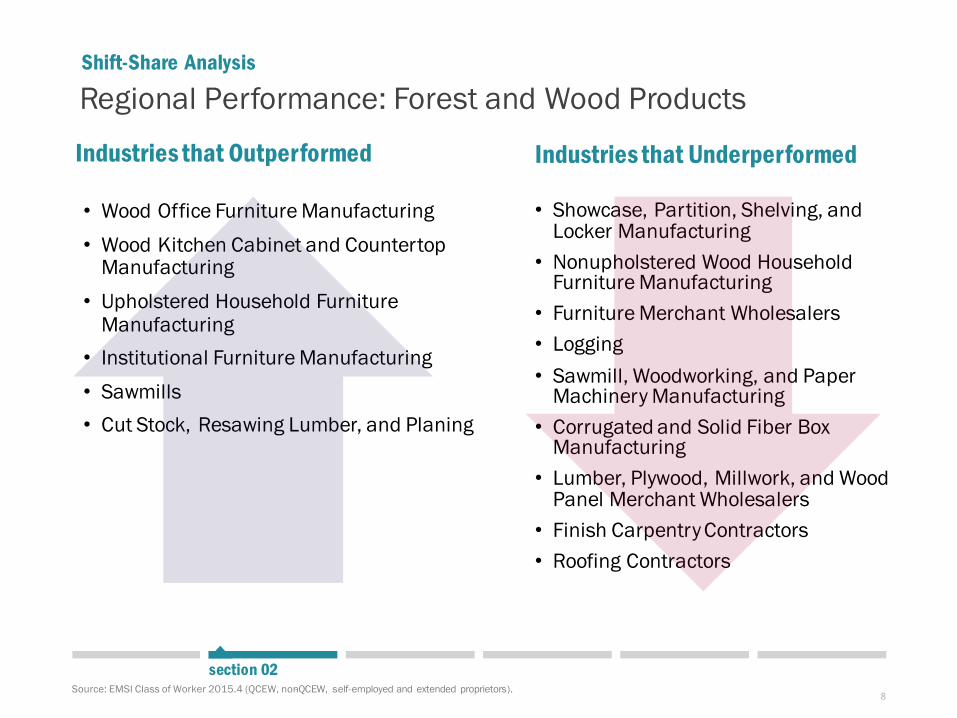
8
section 02Source: EMSI Class of Worker 2015.4 (QCEW, non-QCEW, self-employed and extended proprietors).
Industries that Outperformed
• Wood Office Furniture Manufacturing• Wood Kitchen Cabinet and Countertop
Manufacturing• Upholstered Household Furniture
Manufacturing• Institutional Furniture Manufacturing• Sawmills• Cut Stock, Resawing Lumber, and Planing
Industries that Underperformed
• Showcase, Partition, Shelving, and Locker Manufacturing
• Nonupholstered Wood Household Furniture Manufacturing
• Furniture Merchant Wholesalers• Logging• Sawmill, Woodworking, and Paper
Machinery Manufacturing• Corrugated and Solid Fiber Box
Manufacturing• Lumber, Plywood, Millwork, and Wood
Panel Merchant Wholesalers• Finish Carpentry Contractors• Roofing Contractors
Regional Performance: Forest and Wood ProductsShift-Share Analysis
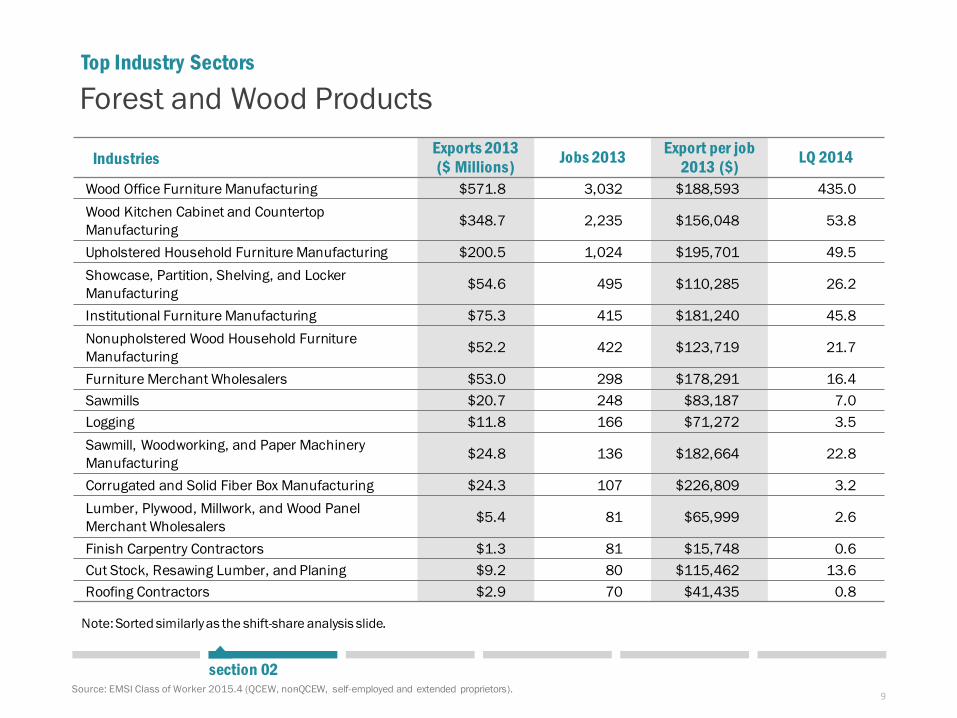
9
Forest and Wood Products
Source: EMSI Class of Worker 2015.4 (QCEW, non-QCEW, self-employed and extended proprietors).
Industries Exports 2013($ Millions) Jobs 2013 Export per job
2013 ($) LQ 2014
Wood Office Furniture Manufacturing $571.8 3,032 $188,593 435.0 Wood Kitchen Cabinet and Countertop Manufacturing $348.7 2,235 $156,048 53.8
Upholstered Household Furniture Manufacturing $200.5 1,024 $195,701 49.5 Showcase, Partition, Shelving, and Locker Manufacturing $54.6 495 $110,285 26.2
Institutional Furniture Manufacturing $75.3 415 $181,240 45.8 Nonupholstered Wood Household Furniture Manufacturing $52.2 422 $123,719 21.7
Furniture Merchant Wholesalers $53.0 298 $178,291 16.4 Sawmills $20.7 248 $83,187 7.0 Logging $11.8 166 $71,272 3.5 Sawmill, Woodworking, and Paper Machinery Manufacturing $24.8 136 $182,664 22.8
Corrugated and Solid Fiber Box Manufacturing $24.3 107 $226,809 3.2 Lumber, Plywood, Millwork, and Wood Panel Merchant Wholesalers $5.4 81 $65,999 2.6
Finish Carpentry Contractors $1.3 81 $15,748 0.6 Cut Stock, Resawing Lumber, and Planing $9.2 80 $115,462 13.6 Roofing Contractors $2.9 70 $41,435 0.8
Top Industry Sectors
section 02
Note: Sorted similarly as the shift-share analysis slide.
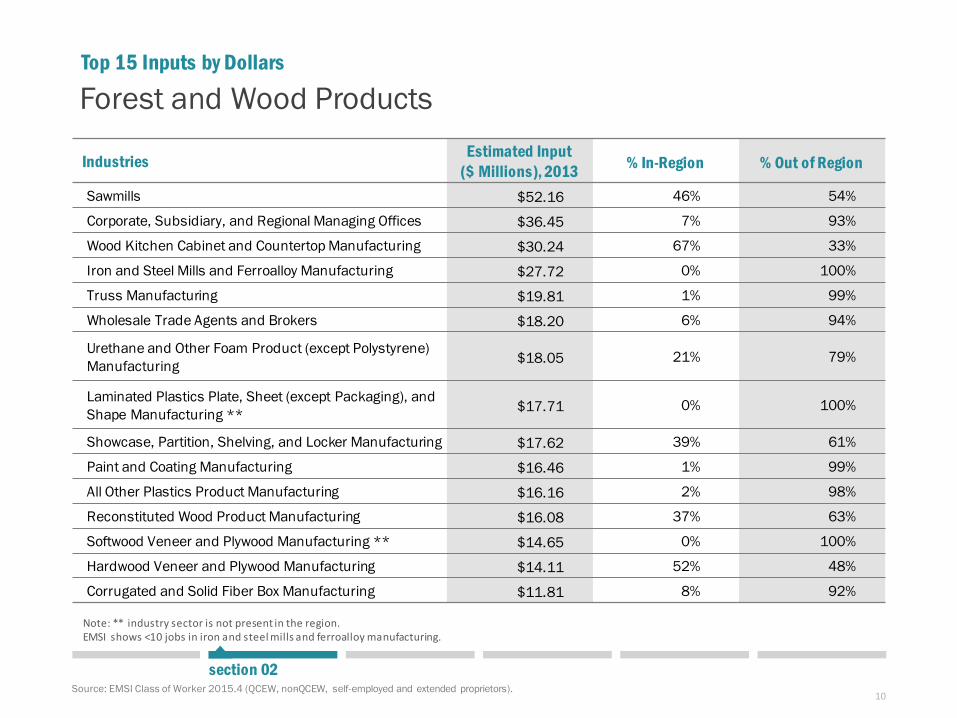
10
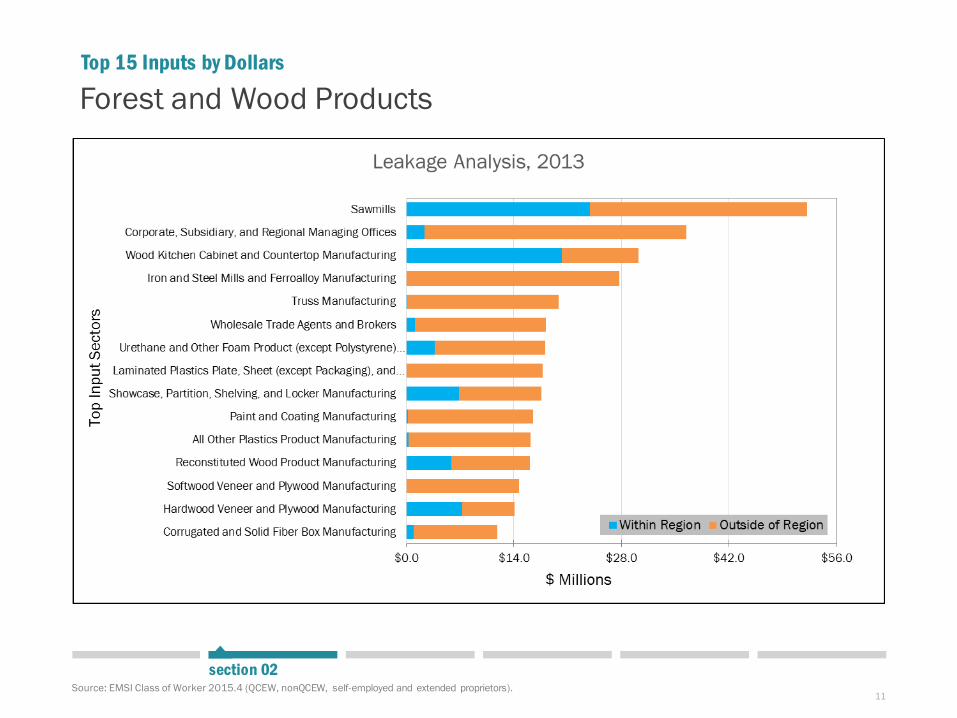
Industries Estimated Input ($ Millions), 2013 % In-Region % Out of Region
Sawmills $52.16 46% 54%
Corporate, Subsidiary, and Regional Managing Offices $36.45 7% 93%
Wood Kitchen Cabinet and Countertop Manufacturing $30.24 67% 33%
Iron and Steel Mills and Ferroalloy Manufacturing $27.72 0% 100%
Truss Manufacturing $19.81 1% 99%
Wholesale Trade Agents and Brokers $18.20 6% 94%
Urethane and Other Foam Product (except Polystyrene) Manufacturing $18.05 21% 79%
Laminated Plastics Plate, Sheet (except Packaging), and Shape Manufacturing ** $17.71 0% 100%
Showcase, Partition, Shelving, and Locker Manufacturing $17.62 39% 61%
Paint and Coating Manufacturing $16.46 1% 99%
All Other Plastics Product Manufacturing $16.16 2% 98%
Reconstituted Wood Product Manufacturing $16.08 37% 63%
Softwood Veneer and Plywood Manufacturing ** $14.65 0% 100%
Hardwood Veneer and Plywood Manufacturing $14.11 52% 48%
Corrugated and Solid Fiber Box Manufacturing $11.81 8% 92%
Top 15 Inputs by Dollars
Note: ** industry sector is not present in the region. EMSI shows <10 jobs in iron and steel mills and ferroalloy manufacturing.
Source: EMSI Class of Worker 2015.4 (QCEW, non-QCEW, self-employed and extended proprietors).
section 02
Forest and Wood Products
11
Top 15 Inputs by Dollars
Source: EMSI Class of Worker 2015.4 (QCEW, non-QCEW, self-employed and extended proprietors). section 02
Forest and Wood Products
12
Top Occupations
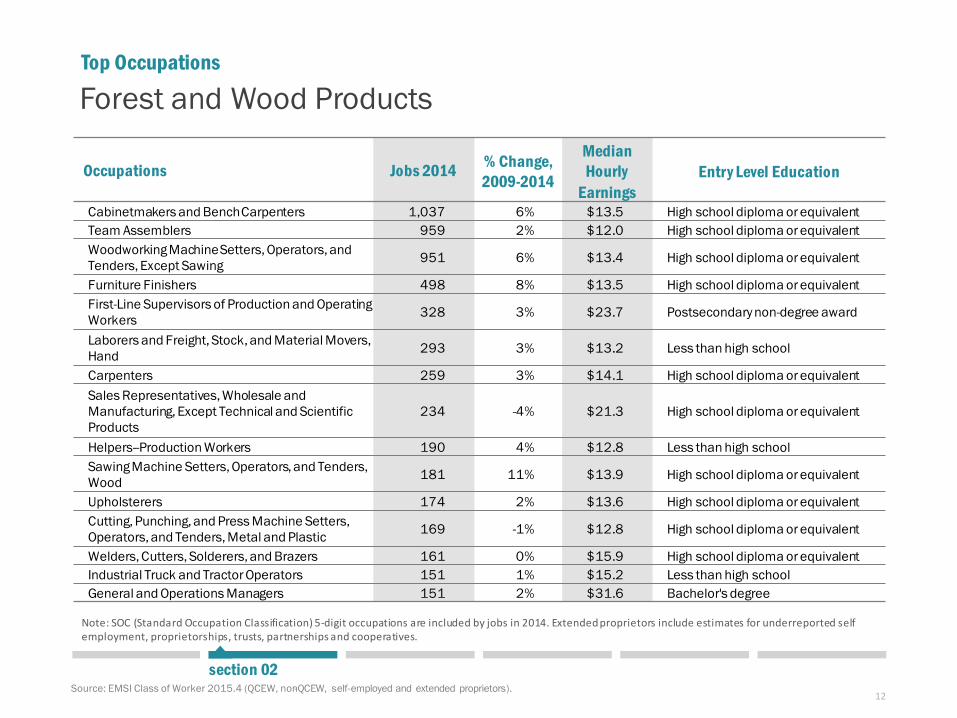
Occupations Jobs 2014 % Change, 2009-2014
Median Hourly
EarningsEntry Level Education
Cabinetmakers and Bench Carpenters 1,037 6% $13.5 High school diploma or equivalentTeam Assemblers 959 2% $12.0 High school diploma or equivalentWoodworking Machine Setters, Operators, and Tenders, Except Sawing 951 6% $13.4 High school diploma or equivalent
Furniture Finishers 498 8% $13.5 High school diploma or equivalentFirst-Line Supervisors of Production and Operating Workers 328 3% $23.7 Postsecondary non-degree award
Laborers and Freight, Stock, and Material Movers, Hand 293 3% $13.2 Less than high school
Carpenters 259 3% $14.1 High school diploma or equivalentSales Representatives, Wholesale and Manufacturing, Except Technical and Scientific Products
234 -4% $21.3 High school diploma or equivalent
Helpers--Production Workers 190 4% $12.8 Less than high schoolSawing Machine Setters, Operators, and Tenders, Wood 181 11% $13.9 High school diploma or equivalent
Upholsterers 174 2% $13.6 High school diploma or equivalentCutting, Punching, and Press Machine Setters, Operators, and Tenders, Metal and Plastic 169 -1% $12.8 High school diploma or equivalent
Welders, Cutters, Solderers, and Brazers 161 0% $15.9 High school diploma or equivalentIndustrial Truck and Tractor Operators 151 1% $15.2 Less than high schoolGeneral and Operations Managers 151 2% $31.6 Bachelor's degree
Note: SOC (Standard Occupation Classification) 5-digit occupations are included by jobs in 2014. Extended proprietors include estimates for underreported self employment, proprietorships, trusts, partnerships and cooperatives.
Source: EMSI Class of Worker 2015.4 (QCEW, non-QCEW, self-employed and extended proprietors). section 02
Forest and Wood Products
13
section 02Source: EMSI Class of Worker 2015.4 (QCEW, non-QCEW, self-employed and extended proprietors).
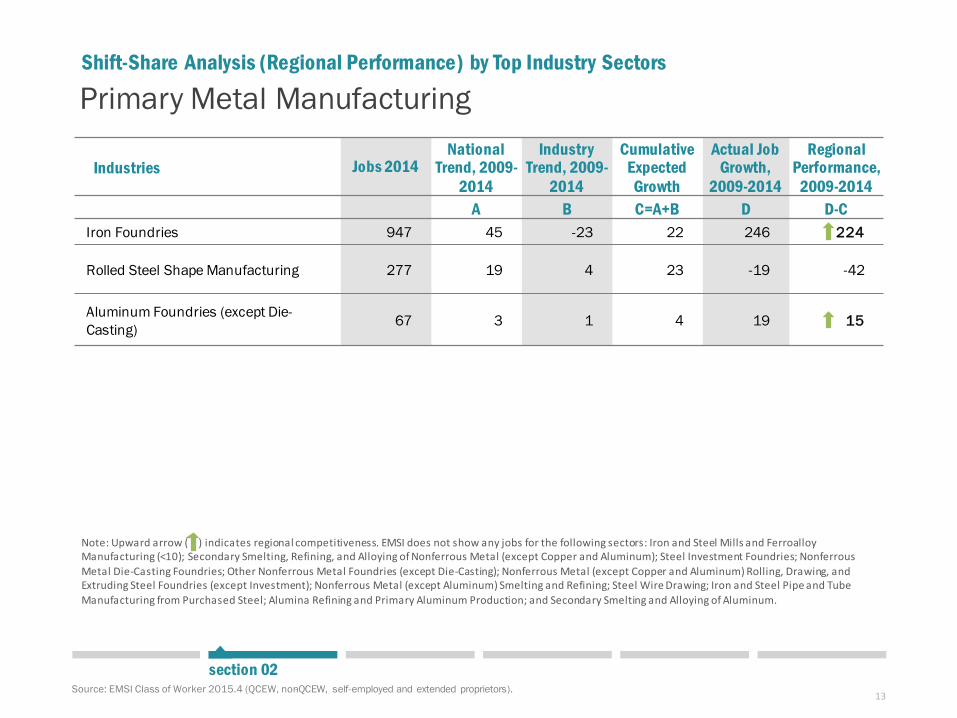
Primary Metal Manufacturing
Industries Jobs 2014National
Trend, 2009-2014
Industry Trend, 2009-
2014
Cumulative Expected
Growth
Actual Job Growth,
2009-2014
Regional Performance,
2009-2014A B C=A+B D D-C
Iron Foundries 947 45 -23 22 246 224
Rolled Steel Shape Manufacturing 277 19 4 23 -19 -42
Aluminum Foundries (except Die-Casting) 67 3 1 4 19 15
Shift-Share Analysis (Regional Performance) by Top Industry Sectors
Note: Upward arrow ( ) indicates regional competitiveness. EMSI does not show any jobs for the following sectors: Iron and Steel Mills and Ferroalloy Manufacturing (<10); Secondary Smelting, Refining, and Alloying of Nonferrous Metal (except Copper and Aluminum); Steel Investment Foundries; Nonferrous Metal Die-Casting Foundries; Other Nonferrous Metal Foundries (except Die-Casting); Nonferrous Metal (except Copper and Aluminum) Rolling, Drawing, and Extruding Steel Foundries (except Investment); Nonferrous Metal (except Aluminum) Smelting and Refining; Steel Wire Drawing; Iron and Steel Pipe and Tube Manufacturing from Purchased Steel; Alumina Refining and Primary Aluminum Production; and Secondary Smelting and Alloying of Aluminum.
14
section 02Source: EMSI Class of Worker 2015.4 (QCEW, non-QCEW, self-employed and extended proprietors).
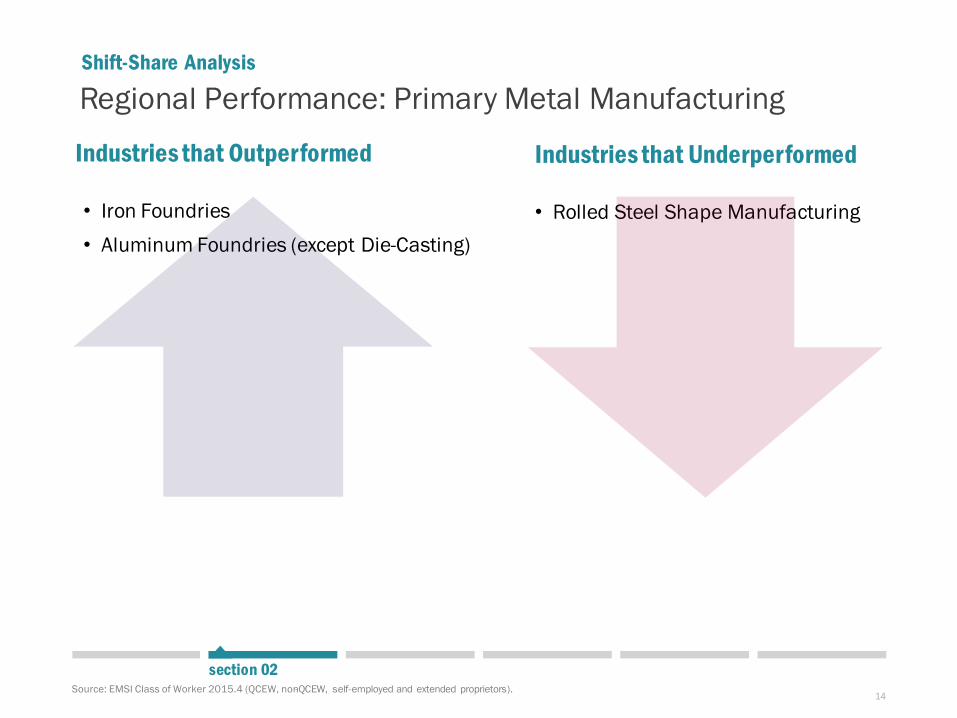
Industries that Outperformed
• Iron Foundries• Aluminum Foundries (except Die-Casting)
Industries that Underperformed
• Rolled Steel Shape Manufacturing
Regional Performance: Primary Metal ManufacturingShift-Share Analysis
15
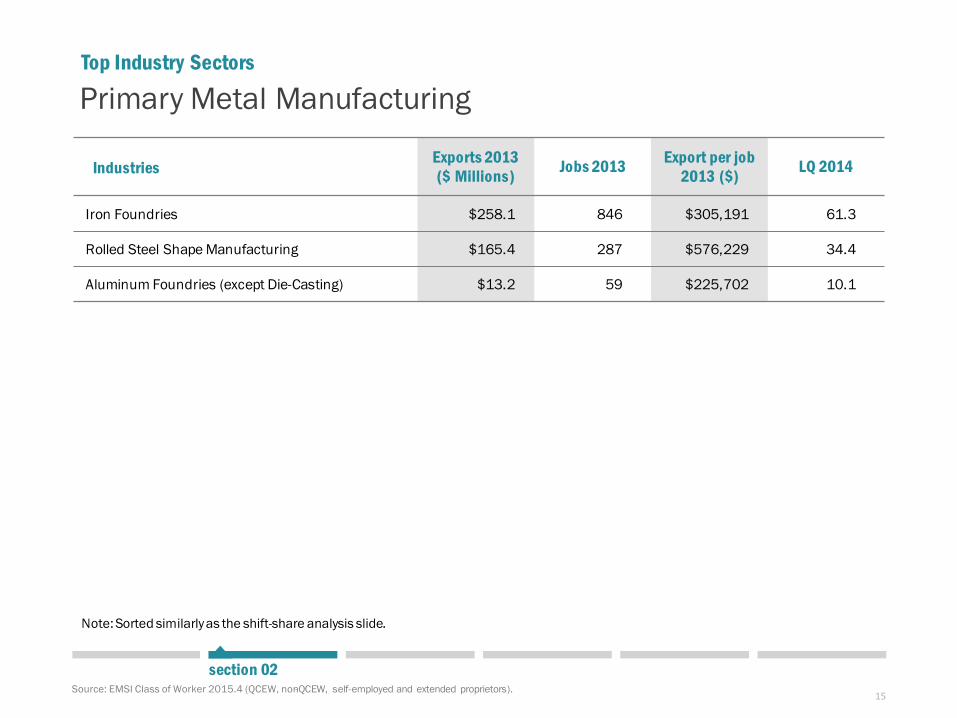
Primary Metal Manufacturing
Source: EMSI Class of Worker 2015.4 (QCEW, non-QCEW, self-employed and extended proprietors).
Industries Exports 2013($ Millions) Jobs 2013 Export per job
2013 ($) LQ 2014
Iron Foundries $258.1 846 $305,191 61.3
Rolled Steel Shape Manufacturing $165.4 287 $576,229 34.4
Aluminum Foundries (except Die-Casting) $13.2 59 $225,702 10.1
Top Industry Sectors
section 02
Note: Sorted similarly as the shift-share analysis slide.
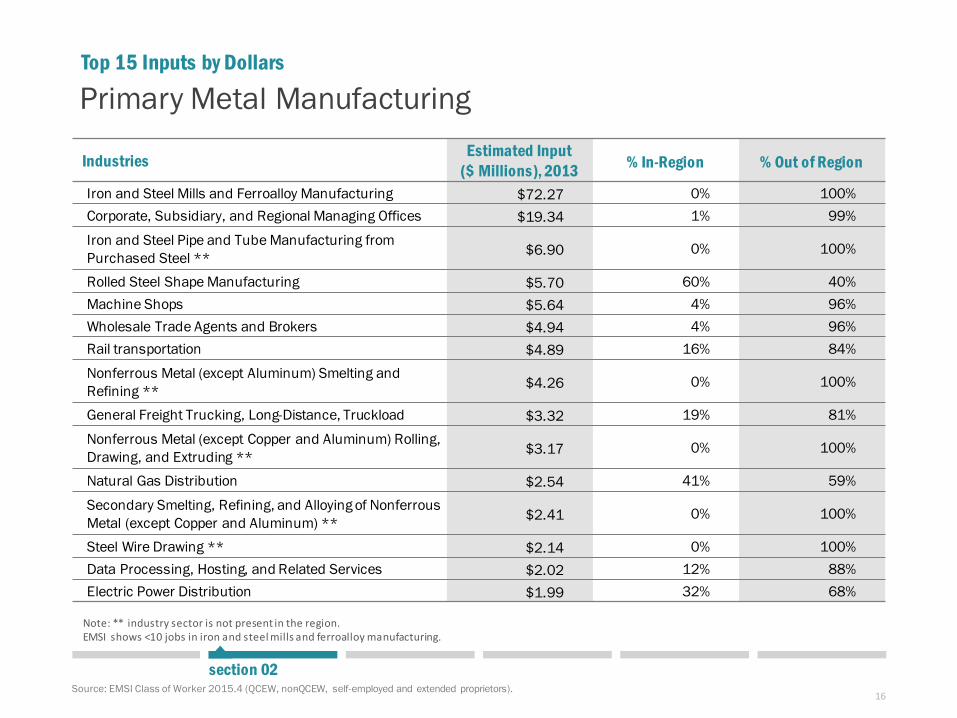
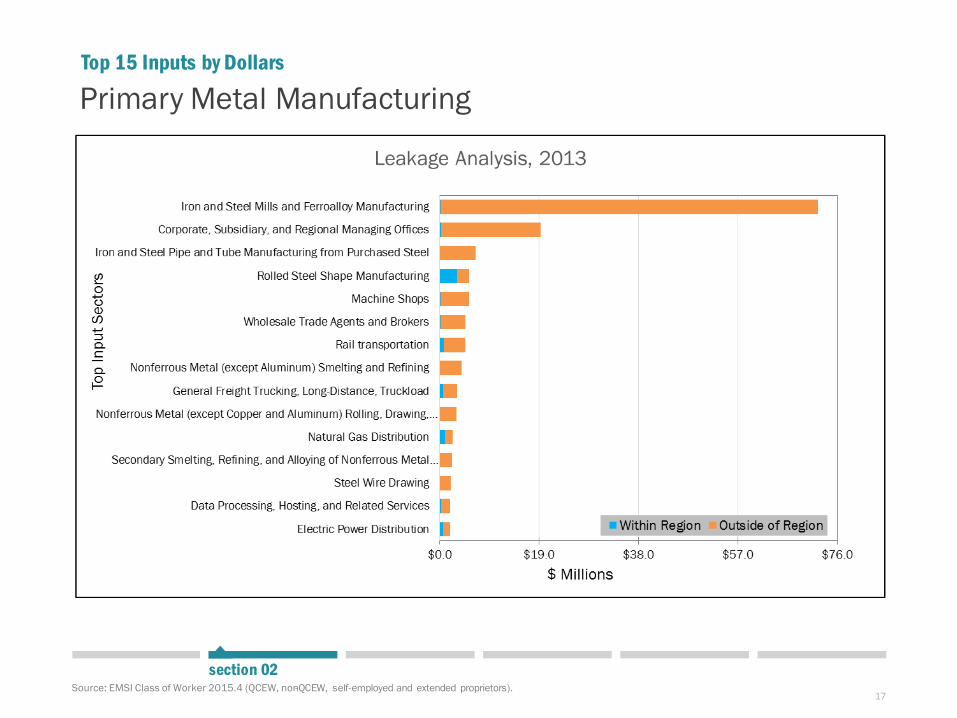
16
Industries Estimated Input ($ Millions), 2013 % In-Region % Out of Region
Iron and Steel Mills and Ferroalloy Manufacturing $72.27 0% 100%Corporate, Subsidiary, and Regional Managing Offices $19.34 1% 99%
Iron and Steel Pipe and Tube Manufacturing from Purchased Steel ** $6.90 0% 100%
Rolled Steel Shape Manufacturing $5.70 60% 40%Machine Shops $5.64 4% 96%Wholesale Trade Agents and Brokers $4.94 4% 96%Rail transportation $4.89 16% 84%
Nonferrous Metal (except Aluminum) Smelting and Refining ** $4.26 0% 100%
General Freight Trucking, Long-Distance, Truckload $3.32 19% 81%
Nonferrous Metal (except Copper and Aluminum) Rolling, Drawing, and Extruding ** $3.17 0% 100%
Natural Gas Distribution $2.54 41% 59%
Secondary Smelting, Refining, and Alloying of Nonferrous Metal (except Copper and Aluminum) ** $2.41 0% 100%
Steel Wire Drawing ** $2.14 0% 100%Data Processing, Hosting, and Related Services $2.02 12% 88%Electric Power Distribution $1.99 32% 68%
Top 15 Inputs by Dollars
Note: ** industry sector is not present in the region.EMSI shows <10 jobs in iron and steel mills and ferroalloy manufacturing.
Source: EMSI Class of Worker 2015.4 (QCEW, non-QCEW, self-employed and extended proprietors).
section 02
Primary Metal Manufacturing
17
Top 15 Inputs by Dollars
Source: EMSI Class of Worker 2015.4 (QCEW, non-QCEW, self-employed and extended proprietors). section 02
Primary Metal Manufacturing
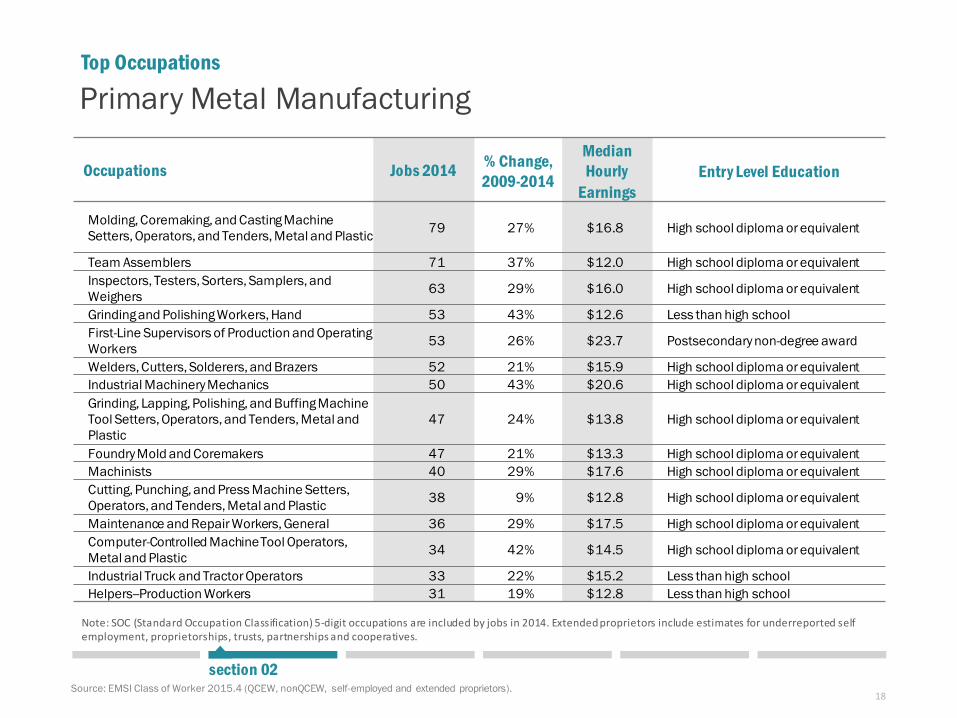
18
Top Occupations
Occupations Jobs 2014 % Change, 2009-2014
Median Hourly
EarningsEntry Level Education
Molding, Coremaking, and Casting Machine Setters, Operators, and Tenders, Metal and Plastic 79 27% $16.8 High school diploma or equivalent
Team Assemblers 71 37% $12.0 High school diploma or equivalentInspectors, Testers, Sorters, Samplers, and Weighers 63 29% $16.0 High school diploma or equivalent
Grinding and Polishing Workers, Hand 53 43% $12.6 Less than high schoolFirst-Line Supervisors of Production and Operating Workers 53 26% $23.7 Postsecondary non-degree award
Welders, Cutters, Solderers, and Brazers 52 21% $15.9 High school diploma or equivalentIndustrial Machinery Mechanics 50 43% $20.6 High school diploma or equivalentGrinding, Lapping, Polishing, and Buffing Machine Tool Setters, Operators, and Tenders, Metal and Plastic
47 24% $13.8 High school diploma or equivalent
Foundry Mold and Coremakers 47 21% $13.3 High school diploma or equivalentMachinists 40 29% $17.6 High school diploma or equivalentCutting, Punching, and Press Machine Setters, Operators, and Tenders, Metal and Plastic 38 9% $12.8 High school diploma or equivalent
Maintenance and Repair Workers, General 36 29% $17.5 High school diploma or equivalentComputer-Controlled Machine Tool Operators, Metal and Plastic 34 42% $14.5 High school diploma or equivalent
Industrial Truck and Tractor Operators 33 22% $15.2 Less than high schoolHelpers--Production Workers 31 19% $12.8 Less than high school
Note: SOC (Standard Occupation Classification) 5-digit occupations are included by jobs in 2014. Extended proprietors include estimates for underreported self employment, proprietorships, trusts, partnerships and cooperatives.
Source: EMSI Class of Worker 2015.4 (QCEW, non-QCEW, self-employed and extended proprietors). section 02
Primary Metal Manufacturing
19
section 02Source: EMSI Class of Worker 2015.4 (QCEW, non-QCEW, self-employed and extended proprietors).
Transportation Equipment Manufacturing
Industries Jobs 2014National
Trend, 2009-2014
Industry Trend, 2009-
2014
Cumulative Expected
Growth
Actual Job Growth,
2009-2014
Regional Performance,
2009-2014A B C=A+B D D-C
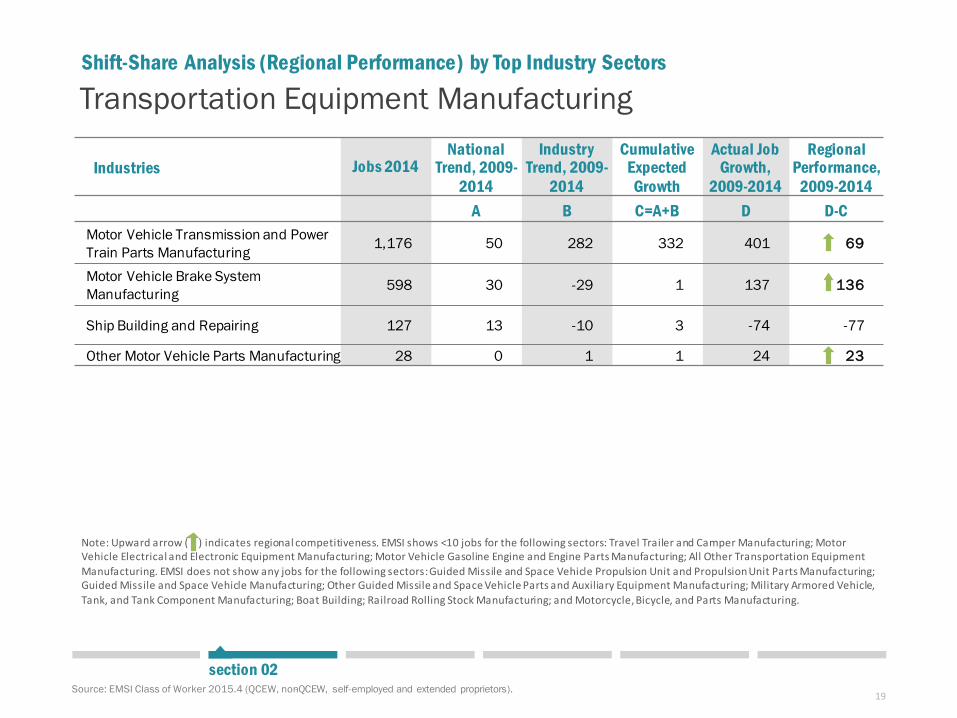
Motor Vehicle Transmission and Power Train Parts Manufacturing 1,176 50 282 332 401 69
Motor Vehicle Brake System Manufacturing 598 30 -29 1 137 136
Ship Building and Repairing 127 13 -10 3 -74 -77
Other Motor Vehicle Parts Manufacturing 28 0 1 1 24 23
Shift-Share Analysis (Regional Performance) by Top Industry Sectors
Note: Upward arrow ( ) indicates regional competitiveness. EMSI shows <10 jobs for the following sectors: Travel Trailer and Camper Manufacturing; Motor Vehicle Electrical and Electronic Equipment Manufacturing; Motor Vehicle Gasoline Engine and Engine Parts Manufacturing; All Other Transportation Equipment Manufacturing. EMSI does not show any jobs for the following sectors: Guided Missile and Space Vehicle Propulsion Unit and Propulsion Unit Parts Manufacturing; Guided Missile and Space Vehicle Manufacturing; Other Guided Missile and Space Vehicle Parts and Auxiliary Equipment Manufacturing; Military Armored Vehicle, Tank, and Tank Component Manufacturing; Boat Building; Railroad Rolling Stock Manufacturing; and Motorcycle, Bicycle, and Parts Manufacturing.
20
section 02Source: EMSI Class of Worker 2015.4 (QCEW, non-QCEW, self-employed and extended proprietors).
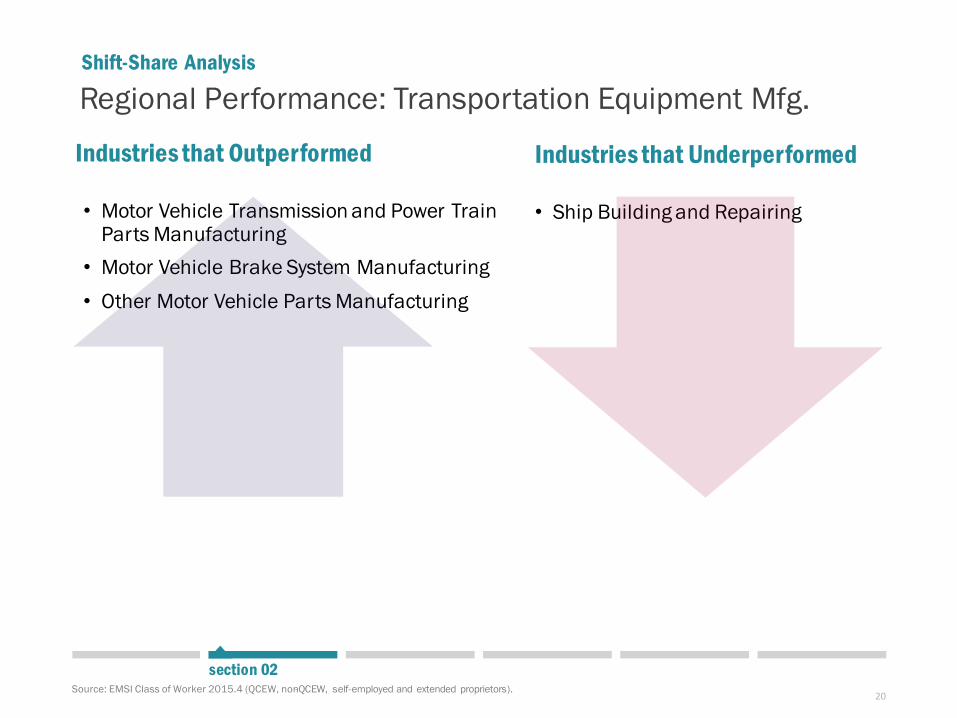
Industries that Outperformed
• Motor Vehicle Transmission and Power Train Parts Manufacturing
• Motor Vehicle Brake System Manufacturing • Other Motor Vehicle Parts Manufacturing
Industries that Underperformed
• Ship Building and Repairing
Regional Performance: Transportation Equipment Mfg.Shift-Share Analysis
21
Transportation Equipment Manufacturing
Source: EMSI Class of Worker 2015.4 (QCEW, non-QCEW, self-employed and extended proprietors).
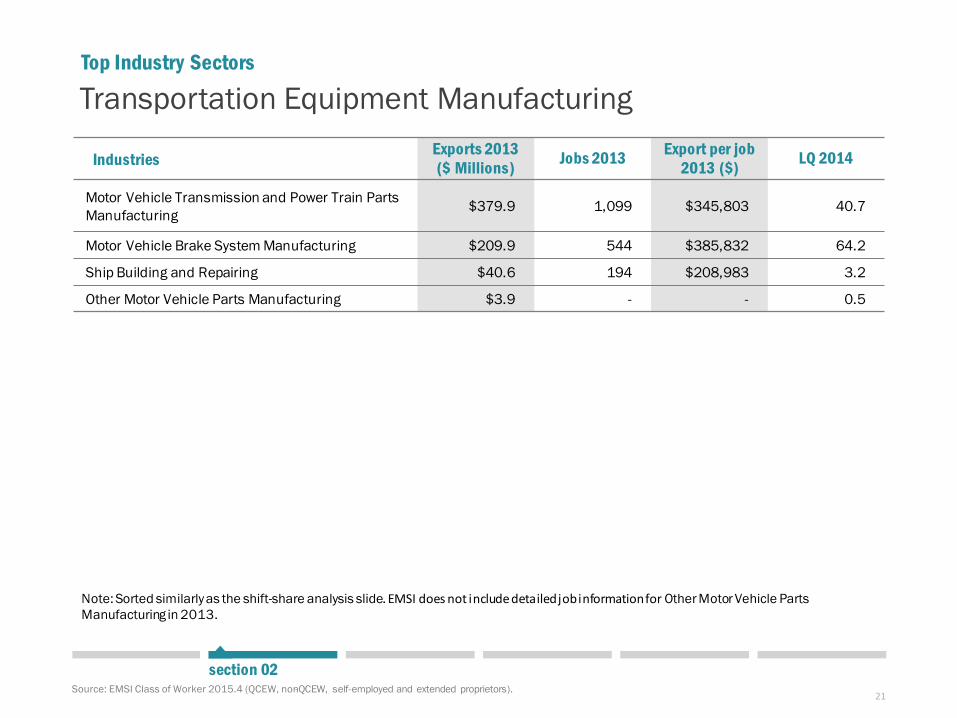
Industries Exports 2013($ Millions) Jobs 2013 Export per job
2013 ($) LQ 2014
Motor Vehicle Transmission and Power Train Parts Manufacturing $379.9 1,099 $345,803 40.7
Motor Vehicle Brake System Manufacturing $209.9 544 $385,832 64.2
Ship Building and Repairing $40.6 194 $208,983 3.2
Other Motor Vehicle Parts Manufacturing $3.9 - - 0.5
Top Industry Sectors
section 02
Note: Sorted similarly as the shift-share analysis slide. EMSI does not include detailed job information for Other Motor Vehicle Parts Manufacturing in 2013.
22
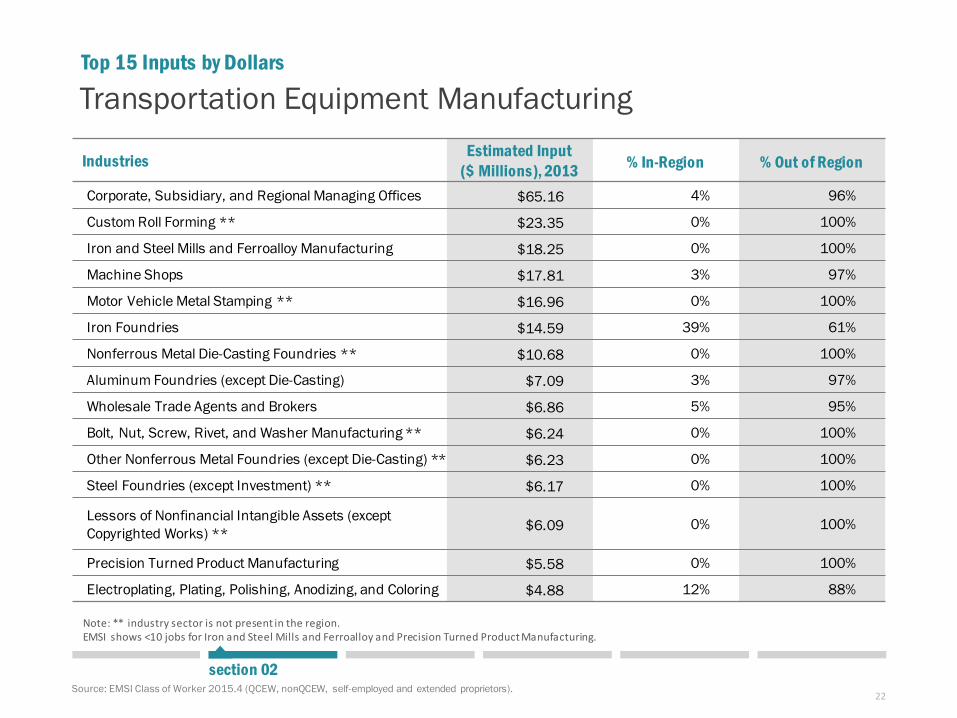
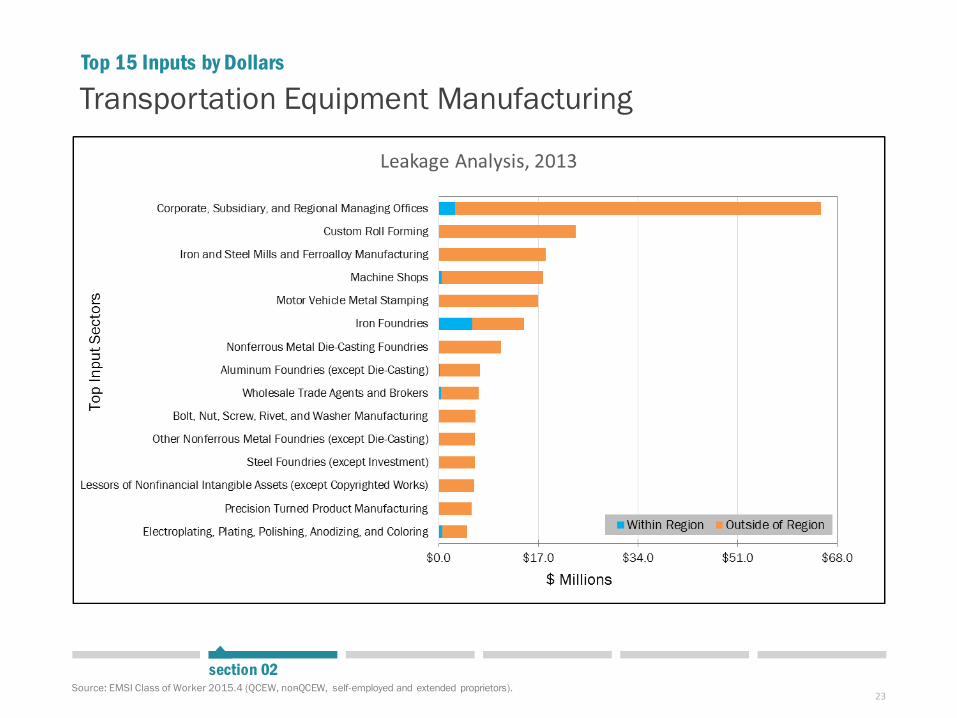
Industries Estimated Input ($ Millions), 2013 % In-Region % Out of Region
Corporate, Subsidiary, and Regional Managing Offices $65.16 4% 96%
Custom Roll Forming ** $23.35 0% 100%
Iron and Steel Mills and Ferroalloy Manufacturing $18.25 0% 100%
Machine Shops $17.81 3% 97%
Motor Vehicle Metal Stamping ** $16.96 0% 100%
Iron Foundries $14.59 39% 61%
Nonferrous Metal Die-Casting Foundries ** $10.68 0% 100%
Aluminum Foundries (except Die-Casting) $7.09 3% 97%
Wholesale Trade Agents and Brokers $6.86 5% 95%
Bolt, Nut, Screw, Rivet, and Washer Manufacturing ** $6.24 0% 100%
Other Nonferrous Metal Foundries (except Die-Casting) ** $6.23 0% 100%
Steel Foundries (except Investment) ** $6.17 0% 100%
Lessors of Nonfinancial Intangible Assets (except Copyrighted Works) ** $6.09 0% 100%
Precision Turned Product Manufacturing $5.58 0% 100%
Electroplating, Plating, Polishing, Anodizing, and Coloring $4.88 12% 88%
Top 15 Inputs by Dollars
Note: ** industry sector is not present in the region.EMSI shows <10 jobs for Iron and Steel Mills and Ferroalloy and Precision Turned Product Manufacturing.
Source: EMSI Class of Worker 2015.4 (QCEW, non-QCEW, self-employed and extended proprietors).
section 02
Transportation Equipment Manufacturing
23
Top 15 Inputs by Dollars
Source: EMSI Class of Worker 2015.4 (QCEW, non-QCEW, self-employed and extended proprietors). section 02
Transportation Equipment Manufacturing
24
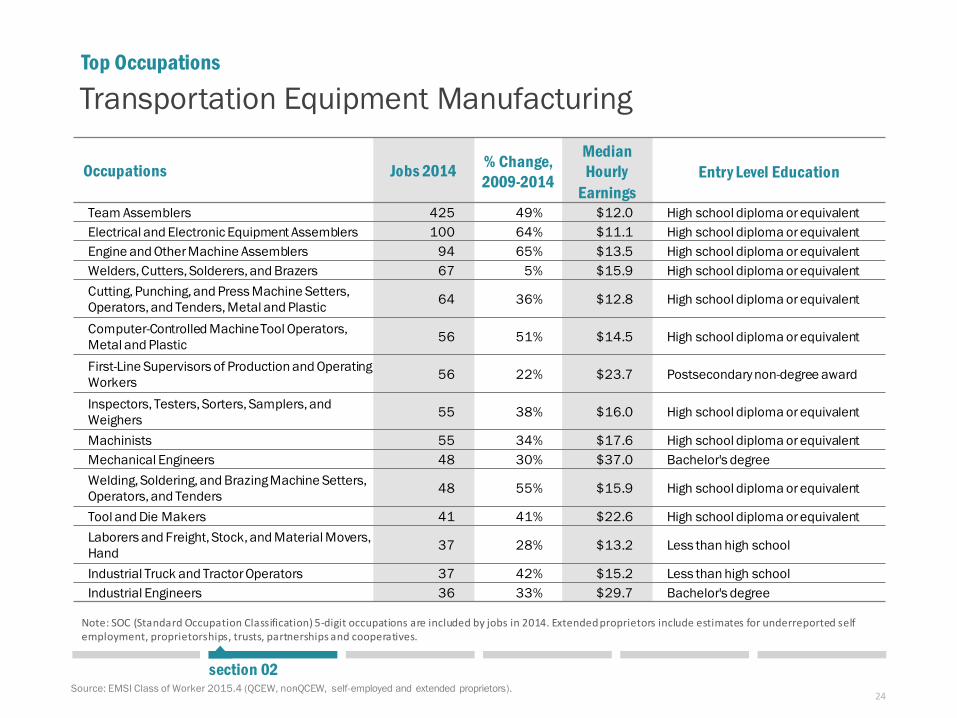
Top Occupations
Occupations Jobs 2014 % Change, 2009-2014
Median Hourly
EarningsEntry Level Education
Team Assemblers 425 49% $12.0 High school diploma or equivalentElectrical and Electronic Equipment Assemblers 100 64% $11.1 High school diploma or equivalentEngine and Other Machine Assemblers 94 65% $13.5 High school diploma or equivalentWelders, Cutters, Solderers, and Brazers 67 5% $15.9 High school diploma or equivalentCutting, Punching, and Press Machine Setters, Operators, and Tenders, Metal and Plastic 64 36% $12.8 High school diploma or equivalent
Computer-Controlled Machine Tool Operators, Metal and Plastic 56 51% $14.5 High school diploma or equivalent
First-Line Supervisors of Production and Operating Workers 56 22% $23.7 Postsecondary non-degree award
Inspectors, Testers, Sorters, Samplers, and Weighers 55 38% $16.0 High school diploma or equivalent
Machinists 55 34% $17.6 High school diploma or equivalentMechanical Engineers 48 30% $37.0 Bachelor's degreeWelding, Soldering, and Brazing Machine Setters, Operators, and Tenders 48 55% $15.9 High school diploma or equivalent
Tool and Die Makers 41 41% $22.6 High school diploma or equivalentLaborers and Freight, Stock, and Material Movers, Hand 37 28% $13.2 Less than high school
Industrial Truck and Tractor Operators 37 42% $15.2 Less than high schoolIndustrial Engineers 36 33% $29.7 Bachelor's degree
Note: SOC (Standard Occupation Classification) 5-digit occupations are included by jobs in 2014. Extended proprietors include estimates for underreported self employment, proprietorships, trusts, partnerships and cooperatives.
Source: EMSI Class of Worker 2015.4 (QCEW, non-QCEW, self-employed and extended proprietors). section 02
Transportation Equipment Manufacturing
25
section 02Source: EMSI Class of Worker 2015.4 (QCEW, non-QCEW, self-employed and extended proprietors).
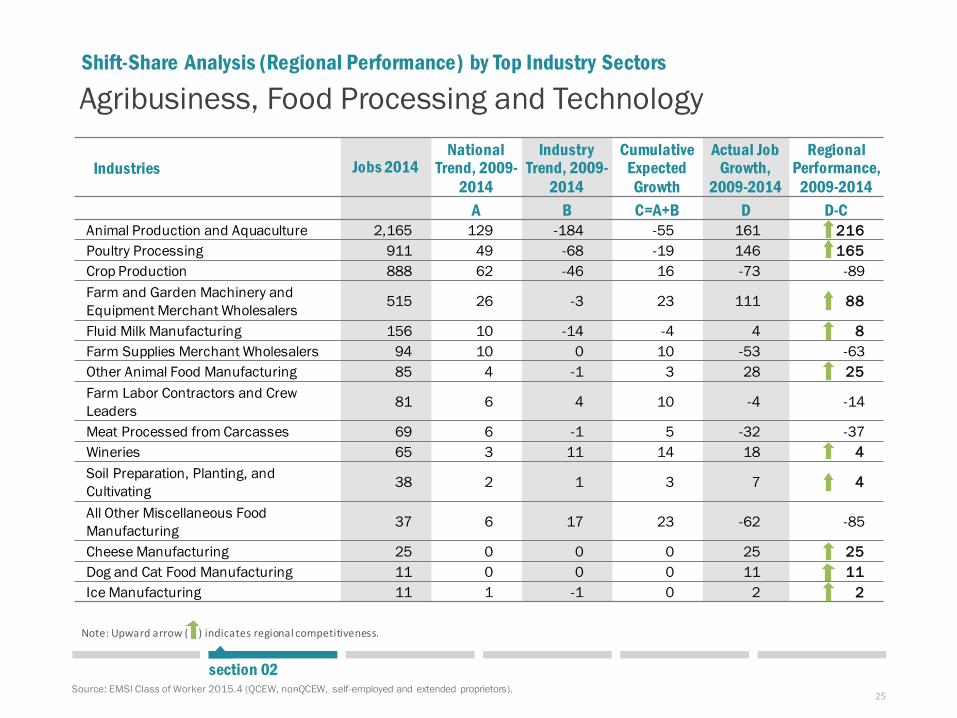
Agribusiness, Food Processing and Technology
Industries Jobs 2014National
Trend, 2009-2014
Industry Trend, 2009-
2014
Cumulative Expected
Growth
Actual Job Growth,
2009-2014
Regional Performance,
2009-2014A B C=A+B D D-C
Animal Production and Aquaculture 2,165 129 -184 -55 161 216Poultry Processing 911 49 -68 -19 146 165Crop Production 888 62 -46 16 -73 -89Farm and Garden Machinery and Equipment Merchant Wholesalers 515 26 -3 23 111 88
Fluid Milk Manufacturing 156 10 -14 -4 4 8Farm Supplies Merchant Wholesalers 94 10 0 10 -53 -63Other Animal Food Manufacturing 85 4 -1 3 28 25Farm Labor Contractors and Crew Leaders 81 6 4 10 -4 -14
Meat Processed from Carcasses 69 6 -1 5 -32 -37Wineries 65 3 11 14 18 4Soil Preparation, Planting, and Cultivating 38 2 1 3 7 4
All Other Miscellaneous Food Manufacturing 37 6 17 23 -62 -85
Cheese Manufacturing 25 0 0 0 25 25Dog and Cat Food Manufacturing 11 0 0 0 11 11Ice Manufacturing 11 1 -1 0 2 2
Shift-Share Analysis (Regional Performance) by Top Industry Sectors
Note: Upward arrow ( ) indicates regional competitiveness.
26
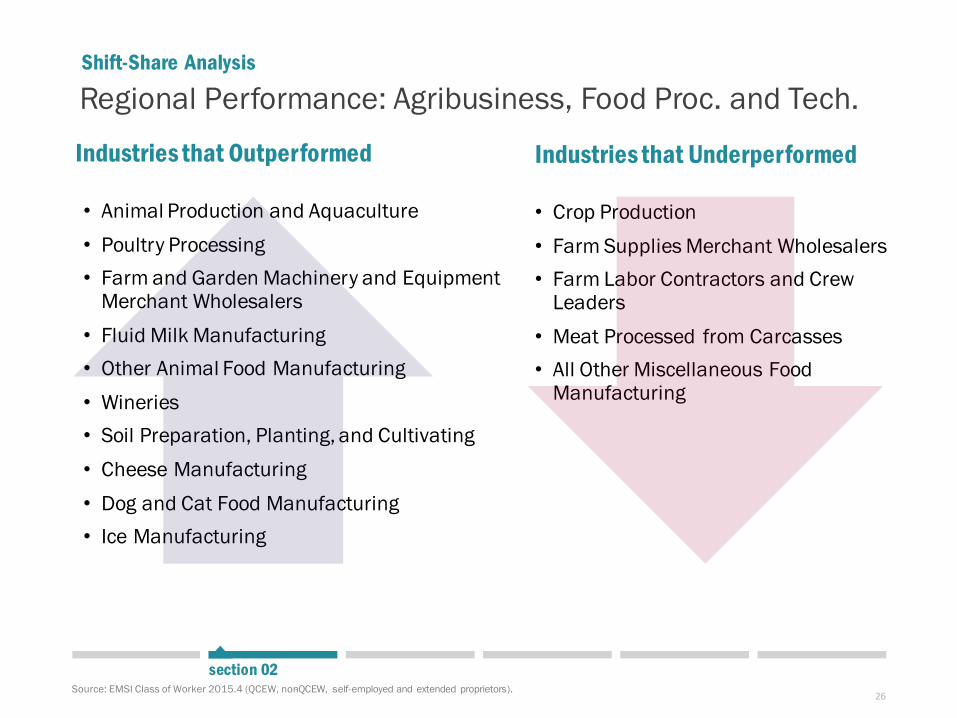
section 02Source: EMSI Class of Worker 2015.4 (QCEW, non-QCEW, self-employed and extended proprietors).
Industries that Outperformed
• Animal Production and Aquaculture• Poultry Processing • Farm and Garden Machinery and Equipment
Merchant Wholesalers• Fluid Milk Manufacturing• Other Animal Food Manufacturing• Wineries• Soil Preparation, Planting, and Cultivating• Cheese Manufacturing• Dog and Cat Food Manufacturing• Ice Manufacturing
Industries that Underperformed
• Crop Production• Farm Supplies Merchant Wholesalers• Farm Labor Contractors and Crew
Leaders• Meat Processed from Carcasses• All Other Miscellaneous Food
Manufacturing
Regional Performance: Agribusiness, Food Proc. and Tech.Shift-Share Analysis
27
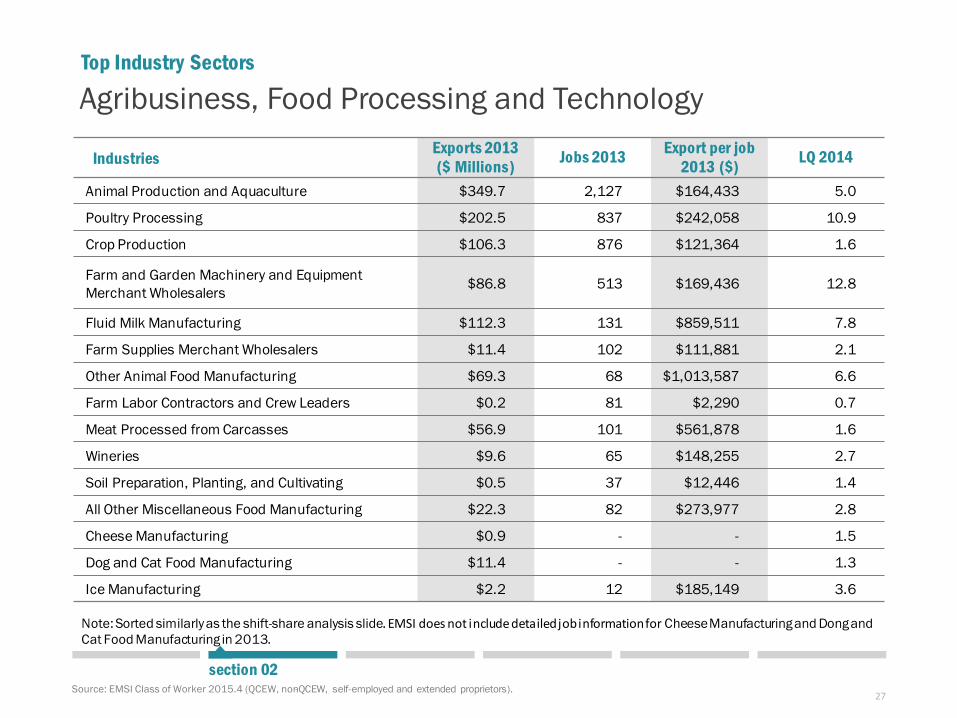
Agribusiness, Food Processing and Technology
Source: EMSI Class of Worker 2015.4 (QCEW, non-QCEW, self-employed and extended proprietors).
Industries Exports 2013($ Millions) Jobs 2013 Export per job
2013 ($) LQ 2014
Animal Production and Aquaculture $349.7 2,127 $164,433 5.0
Poultry Processing $202.5 837 $242,058 10.9
Crop Production $106.3 876 $121,364 1.6
Farm and Garden Machinery and Equipment Merchant Wholesalers $86.8 513 $169,436 12.8
Fluid Milk Manufacturing $112.3 131 $859,511 7.8
Farm Supplies Merchant Wholesalers $11.4 102 $111,881 2.1
Other Animal Food Manufacturing $69.3 68 $1,013,587 6.6
Farm Labor Contractors and Crew Leaders $0.2 81 $2,290 0.7
Meat Processed from Carcasses $56.9 101 $561,878 1.6
Wineries $9.6 65 $148,255 2.7
Soil Preparation, Planting, and Cultivating $0.5 37 $12,446 1.4
All Other Miscellaneous Food Manufacturing $22.3 82 $273,977 2.8
Cheese Manufacturing $0.9 - - 1.5
Dog and Cat Food Manufacturing $11.4 - - 1.3
Ice Manufacturing $2.2 12 $185,149 3.6
Top Industry Sectors
section 02
Note: Sorted similarly as the shift-share analysis slide. EMSI does not include detailed job information for Cheese Manufacturing and Dong and Cat Food Manufacturing in 2013.
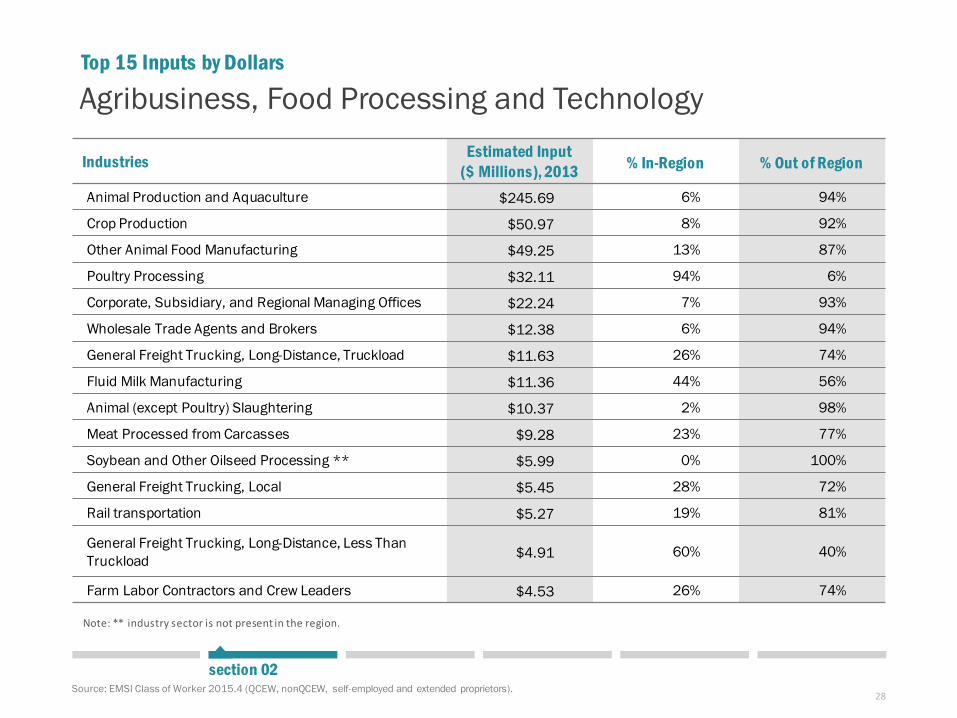
28
Industries Estimated Input ($ Millions), 2013 % In-Region % Out of Region
Animal Production and Aquaculture $245.69 6% 94%
Crop Production $50.97 8% 92%
Other Animal Food Manufacturing $49.25 13% 87%
Poultry Processing $32.11 94% 6%
Corporate, Subsidiary, and Regional Managing Offices $22.24 7% 93%
Wholesale Trade Agents and Brokers $12.38 6% 94%
General Freight Trucking, Long-Distance, Truckload $11.63 26% 74%
Fluid Milk Manufacturing $11.36 44% 56%
Animal (except Poultry) Slaughtering $10.37 2% 98%
Meat Processed from Carcasses $9.28 23% 77%
Soybean and Other Oilseed Processing ** $5.99 0% 100%
General Freight Trucking, Local $5.45 28% 72%
Rail transportation $5.27 19% 81%
General Freight Trucking, Long-Distance, Less Than Truckload $4.91 60% 40%
Farm Labor Contractors and Crew Leaders $4.53 26% 74%
Top 15 Inputs by Dollars
Note: ** industry sector is not present in the region.
Source: EMSI Class of Worker 2015.4 (QCEW, non-QCEW, self-employed and extended proprietors).
section 02
Agribusiness, Food Processing and Technology
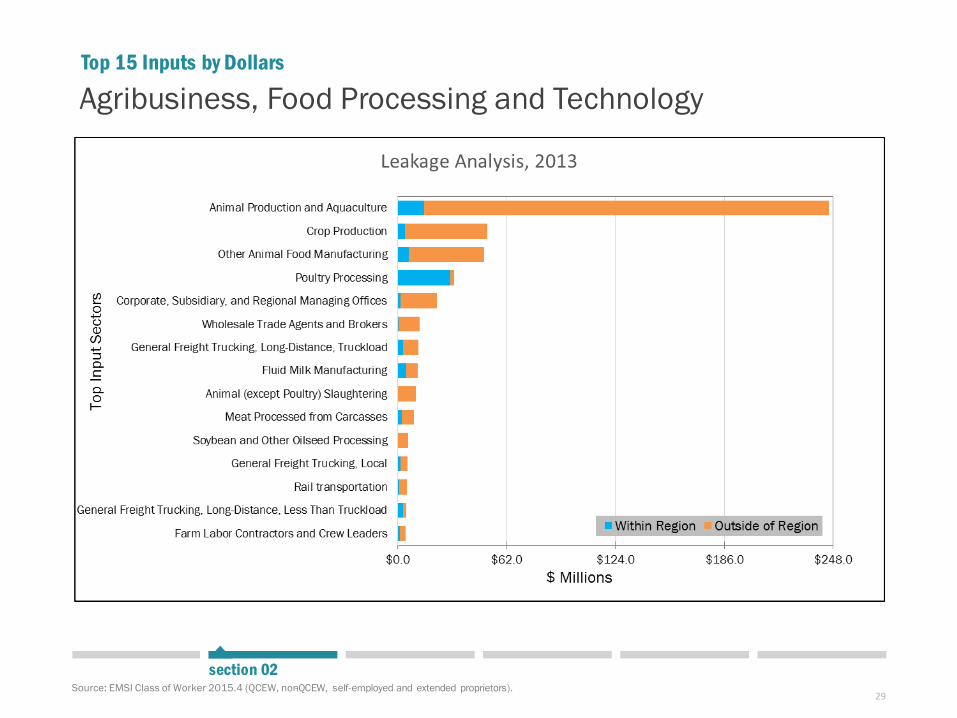
29
Top 15 Inputs by Dollars
Source: EMSI Class of Worker 2015.4 (QCEW, non-QCEW, self-employed and extended proprietors). section 02
Agribusiness, Food Processing and Technology
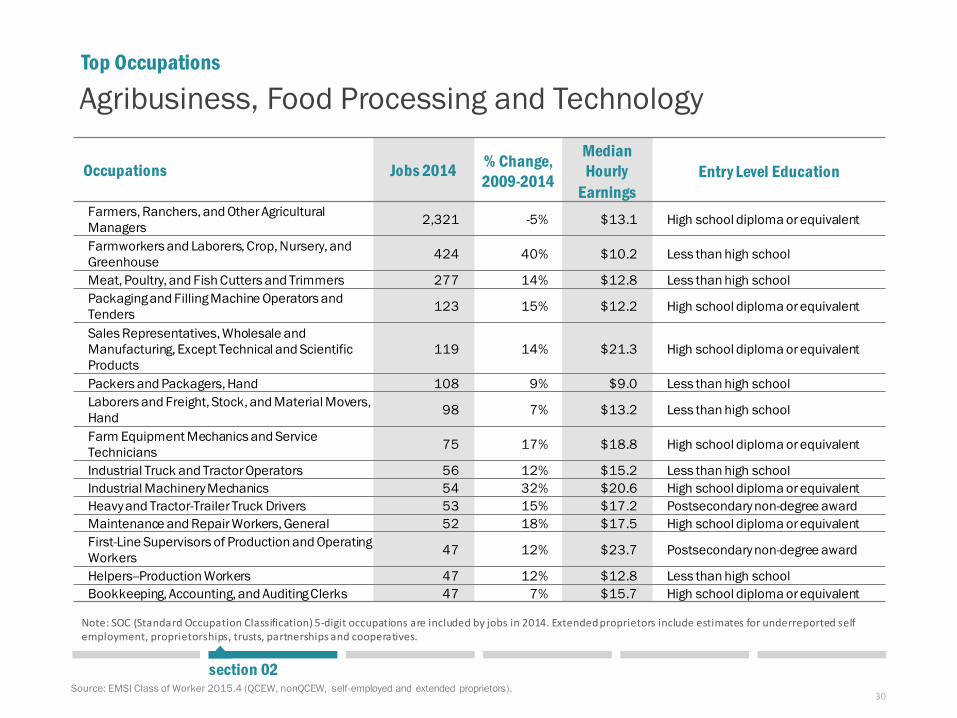
30
Top Occupations
Occupations Jobs 2014 % Change, 2009-2014
Median Hourly
EarningsEntry Level Education
Farmers, Ranchers, and Other Agricultural Managers 2,321 -5% $13.1 High school diploma or equivalent
Farmworkers and Laborers, Crop, Nursery, and Greenhouse 424 40% $10.2 Less than high school
Meat, Poultry, and Fish Cutters and Trimmers 277 14% $12.8 Less than high schoolPackaging and Filling Machine Operators and Tenders 123 15% $12.2 High school diploma or equivalent
Sales Representatives, Wholesale and Manufacturing, Except Technical and Scientific Products
119 14% $21.3 High school diploma or equivalent
Packers and Packagers, Hand 108 9% $9.0 Less than high schoolLaborers and Freight, Stock, and Material Movers, Hand 98 7% $13.2 Less than high school
Farm Equipment Mechanics and Service Technicians 75 17% $18.8 High school diploma or equivalent
Industrial Truck and Tractor Operators 56 12% $15.2 Less than high schoolIndustrial Machinery Mechanics 54 32% $20.6 High school diploma or equivalentHeavy and Tractor-Trailer Truck Drivers 53 15% $17.2 Postsecondary non-degree awardMaintenance and Repair Workers, General 52 18% $17.5 High school diploma or equivalentFirst-Line Supervisors of Production and Operating Workers 47 12% $23.7 Postsecondary non-degree award
Helpers--Production Workers 47 12% $12.8 Less than high schoolBookkeeping, Accounting, and Auditing Clerks 47 7% $15.7 High school diploma or equivalent
Note: SOC (Standard Occupation Classification) 5-digit occupations are included by jobs in 2014. Extended proprietors include estimates for underreported self employment, proprietorships, trusts, partnerships and cooperatives.
Source: EMSI Class of Worker 2015.4 (QCEW, non-QCEW, self-employed and extended proprietors). section 02
Agribusiness, Food Processing and Technology
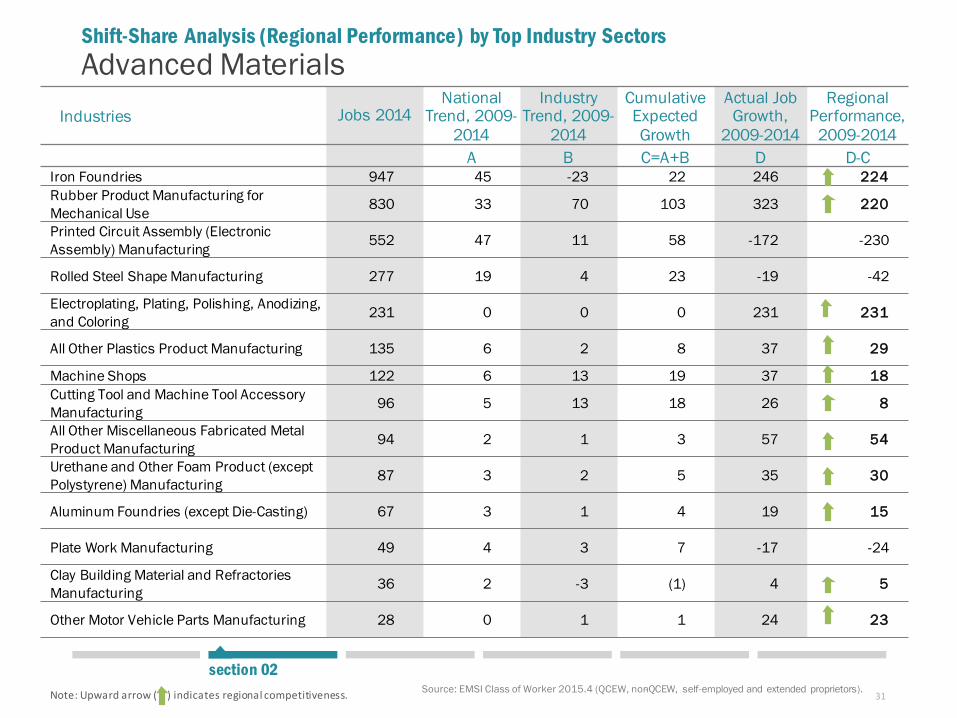
31
section 02Source: EMSI Class of Worker 2015.4 (QCEW, non-QCEW, self-employed and extended proprietors).
Advanced MaterialsIndustries Jobs 2014
National Trend, 2009-
2014
Industry Trend, 2009-
2014
Cumulative Expected Growth
Actual Job Growth,
2009-2014
Regional Performance,
2009-2014A B C=A+B D D-C
Iron Foundries 947 45 -23 22 246 224Rubber Product Manufacturing for Mechanical Use 830 33 70 103 323 220
Printed Circuit Assembly (Electronic Assembly) Manufacturing 552 47 11 58 -172 -230
Rolled Steel Shape Manufacturing 277 19 4 23 -19 -42
Electroplating, Plating, Polishing, Anodizing, and Coloring 231 0 0 0 231 231
All Other Plastics Product Manufacturing 135 6 2 8 37 29
Machine Shops 122 6 13 19 37 18Cutting Tool and Machine Tool Accessory Manufacturing 96 5 13 18 26 8
All Other Miscellaneous Fabricated Metal Product Manufacturing 94 2 1 3 57 54
Urethane and Other Foam Product (except Polystyrene) Manufacturing 87 3 2 5 35 30
Aluminum Foundries (except Die-Casting) 67 3 1 4 19 15
Plate Work Manufacturing 49 4 3 7 -17 -24
Clay Building Material and Refractories Manufacturing 36 2 -3 (1) 4 5
Other Motor Vehicle Parts Manufacturing 28 0 1 1 24 23
Shift-Share Analysis (Regional Performance) by Top Industry Sectors
Note: Upward arrow ( ) indicates regional competitiveness.
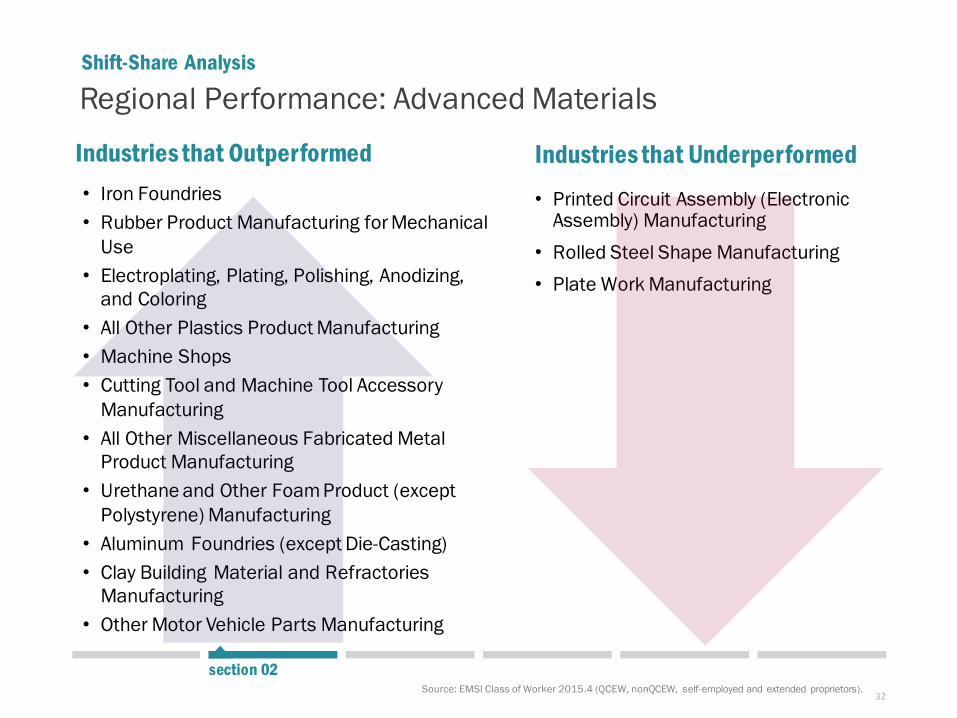
32
section 02Source: EMSI Class of Worker 2015.4 (QCEW, non-QCEW, self-employed and extended proprietors).
Industries that Outperformed• Iron Foundries• Rubber Product Manufacturing for Mechanical
Use• Electroplating, Plating, Polishing, Anodizing,
and Coloring• All Other Plastics Product Manufacturing• Machine Shops• Cutting Tool and Machine Tool Accessory
Manufacturing• All Other Miscellaneous Fabricated Metal
Product Manufacturing• Urethane and Other Foam Product (except
Polystyrene) Manufacturing• Aluminum Foundries (except Die-Casting)• Clay Building Material and Refractories
Manufacturing• Other Motor Vehicle Parts Manufacturing
Industries that Underperformed• Printed Circuit Assembly (Electronic
Assembly) Manufacturing• Rolled Steel Shape Manufacturing• Plate Work Manufacturing
Regional Performance: Advanced MaterialsShift-Share Analysis
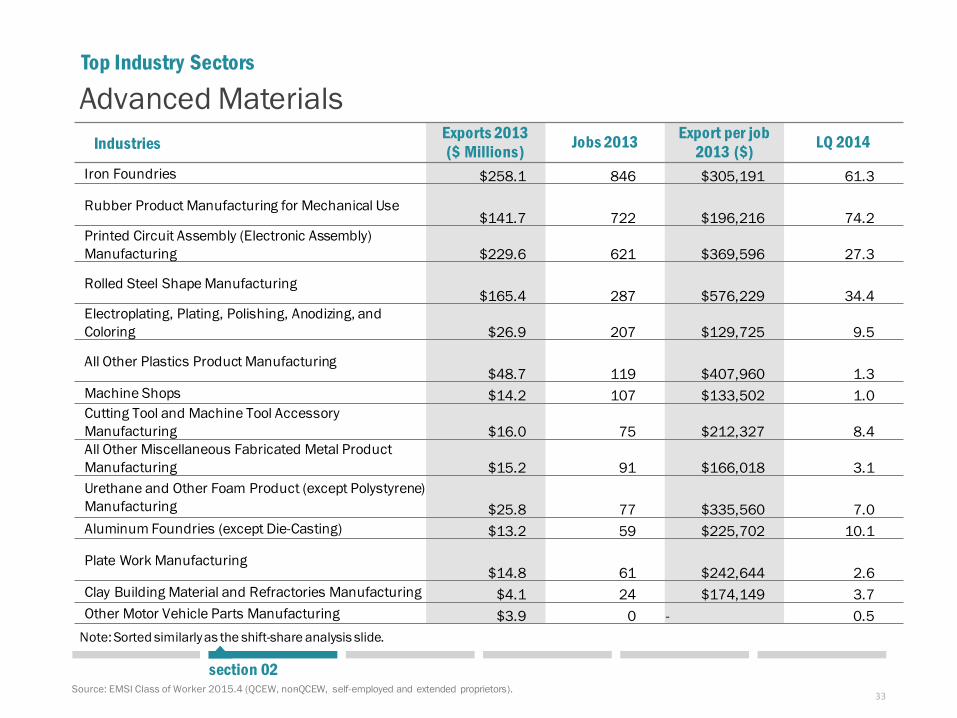
33
Advanced Materials
Source: EMSI Class of Worker 2015.4 (QCEW, non-QCEW, self-employed and extended proprietors).
Industries Exports 2013($ Millions) Jobs 2013 Export per job
2013 ($) LQ 2014
Iron Foundries $258.1 846 $305,191 61.3
Rubber Product Manufacturing for Mechanical Use$141.7 722 $196,216 74.2
Printed Circuit Assembly (Electronic Assembly) Manufacturing $229.6 621 $369,596 27.3
Rolled Steel Shape Manufacturing$165.4 287 $576,229 34.4
Electroplating, Plating, Polishing, Anodizing, and Coloring $26.9 207 $129,725 9.5
All Other Plastics Product Manufacturing$48.7 119 $407,960 1.3
Machine Shops $14.2 107 $133,502 1.0Cutting Tool and Machine Tool Accessory Manufacturing $16.0 75 $212,327 8.4All Other Miscellaneous Fabricated Metal Product Manufacturing $15.2 91 $166,018 3.1Urethane and Other Foam Product (except Polystyrene) Manufacturing $25.8 77 $335,560 7.0Aluminum Foundries (except Die-Casting) $13.2 59 $225,702 10.1
Plate Work Manufacturing$14.8 61 $242,644 2.6
Clay Building Material and Refractories Manufacturing $4.1 24 $174,149 3.7Other Motor Vehicle Parts Manufacturing $3.9 0 - 0.5
Top Industry Sectors
section 02
Note: Sorted similarly as the shift-share analysis slide.
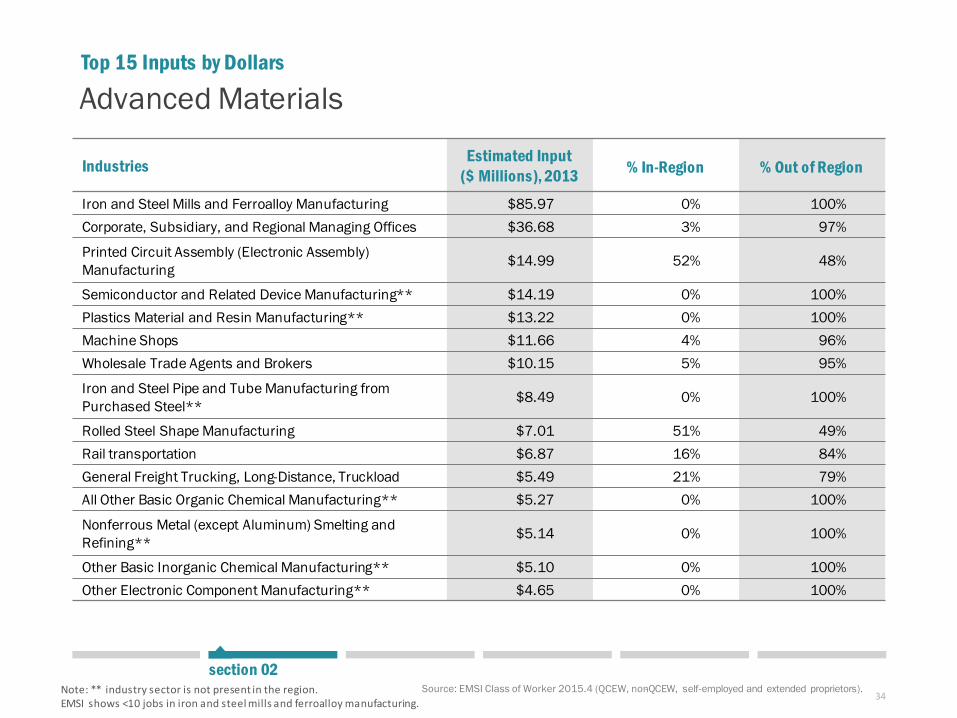
34
Industries Estimated Input ($ Millions), 2013 % In-Region % Out of Region
Iron and Steel Mills and Ferroalloy Manufacturing $85.97 0% 100%Corporate, Subsidiary, and Regional Managing Offices $36.68 3% 97%
Printed Circuit Assembly (Electronic Assembly) Manufacturing $14.99 52% 48%
Semiconductor and Related Device Manufacturing** $14.19 0% 100%Plastics Material and Resin Manufacturing** $13.22 0% 100%Machine Shops $11.66 4% 96%Wholesale Trade Agents and Brokers $10.15 5% 95%
Iron and Steel Pipe and Tube Manufacturing from Purchased Steel** $8.49 0% 100%
Rolled Steel Shape Manufacturing $7.01 51% 49%Rail transportation $6.87 16% 84%General Freight Trucking, Long-Distance, Truckload $5.49 21% 79%All Other Basic Organic Chemical Manufacturing** $5.27 0% 100%
Nonferrous Metal (except Aluminum) Smelting and Refining** $5.14 0% 100%
Other Basic Inorganic Chemical Manufacturing** $5.10 0% 100%Other Electronic Component Manufacturing** $4.65 0% 100%
Top 15 Inputs by Dollars
Note: ** industry sector is not present in the region. EMSI shows <10 jobs in iron and steel mills and ferroalloy manufacturing.
Source: EMSI Class of Worker 2015.4 (QCEW, non-QCEW, self-employed and extended proprietors).
section 02
Advanced Materials
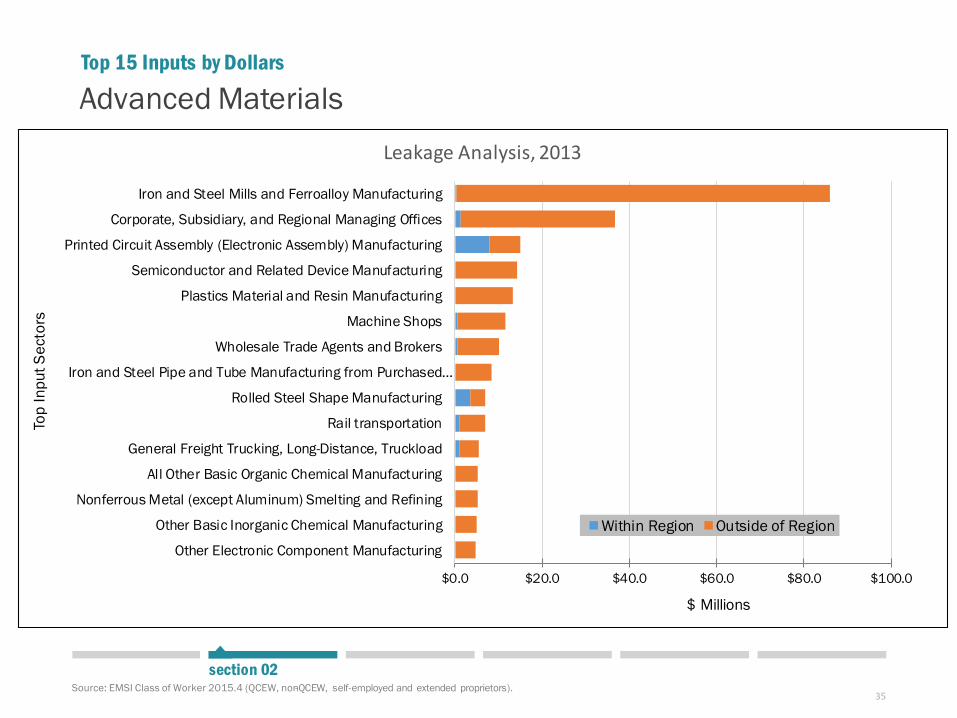
35
Top 15 Inputs by Dollars
Source: EMSI Class of Worker 2015.4 (QCEW, non-QCEW, self-employed and extended proprietors). section 02
Advanced Materials
$0.0 $20.0 $40.0 $60.0 $80.0 $100.0
Other Electronic Component Manufacturing
Other Basic Inorganic Chemical Manufacturing
Nonferrous Metal (except Aluminum) Smelting and Refining
All Other Basic Organic Chemical Manufacturing
General Freight Trucking, Long-Distance, Truckload
Rail transportation
Rolled Steel Shape Manufacturing
Iron and Steel Pipe and Tube Manufacturing from Purchased…
Wholesale Trade Agents and Brokers
Machine Shops
Plastics Material and Resin Manufacturing
Semiconductor and Related Device Manufacturing
Printed Circuit Assembly (Electronic Assembly) Manufacturing
Corporate, Subsidiary, and Regional Managing Offices
Iron and Steel Mills and Ferroalloy Manufacturing
$ Millions
Top
Inpu
t Sec
tors
Leakage Analysis, 2013
Within Region Outside of Region
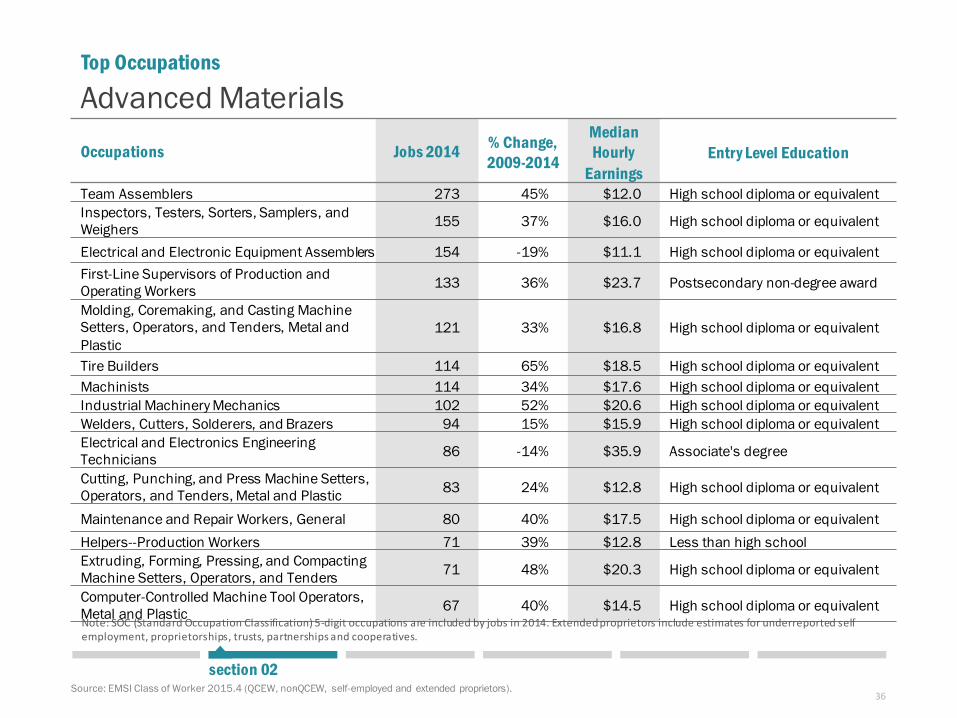
36
Top Occupations
Occupations Jobs 2014 % Change, 2009-2014
Median Hourly
EarningsEntry Level Education
Team Assemblers 273 45% $12.0 High school diploma or equivalentInspectors, Testers, Sorters, Samplers, and Weighers 155 37% $16.0 High school diploma or equivalent
Electrical and Electronic Equipment Assemblers 154 -19% $11.1 High school diploma or equivalentFirst-Line Supervisors of Production and Operating Workers 133 36% $23.7 Postsecondary non-degree award
Molding, Coremaking, and Casting Machine Setters, Operators, and Tenders, Metal and Plastic
121 33% $16.8 High school diploma or equivalent
Tire Builders 114 65% $18.5 High school diploma or equivalentMachinists 114 34% $17.6 High school diploma or equivalentIndustrial Machinery Mechanics 102 52% $20.6 High school diploma or equivalentWelders, Cutters, Solderers, and Brazers 94 15% $15.9 High school diploma or equivalentElectrical and Electronics Engineering Technicians 86 -14% $35.9 Associate's degree
Cutting, Punching, and Press Machine Setters, Operators, and Tenders, Metal and Plastic 83 24% $12.8 High school diploma or equivalent
Maintenance and Repair Workers, General 80 40% $17.5 High school diploma or equivalentHelpers--Production Workers 71 39% $12.8 Less than high schoolExtruding, Forming, Pressing, and Compacting Machine Setters, Operators, and Tenders 71 48% $20.3 High school diploma or equivalent
Computer-Controlled Machine Tool Operators, Metal and Plastic 67 40% $14.5 High school diploma or equivalentNote: SOC (Standard Occupation Classification) 5-digit occupations are included by jobs in 2014. Extended proprietors include estimates for underreported self employment, proprietorships, trusts, partnerships and cooperatives.
Source: EMSI Class of Worker 2015.4 (QCEW, non-QCEW, self-employed and extended proprietors). section 02
Advanced Materials
03Cluster
Comparisons
Forest and Wood Products
Primary Metal Manufacturing
Transportation Equipment Manufacturing
Agribusiness, Food Processing and Technology
Advanced Materials
Arts and Recreation
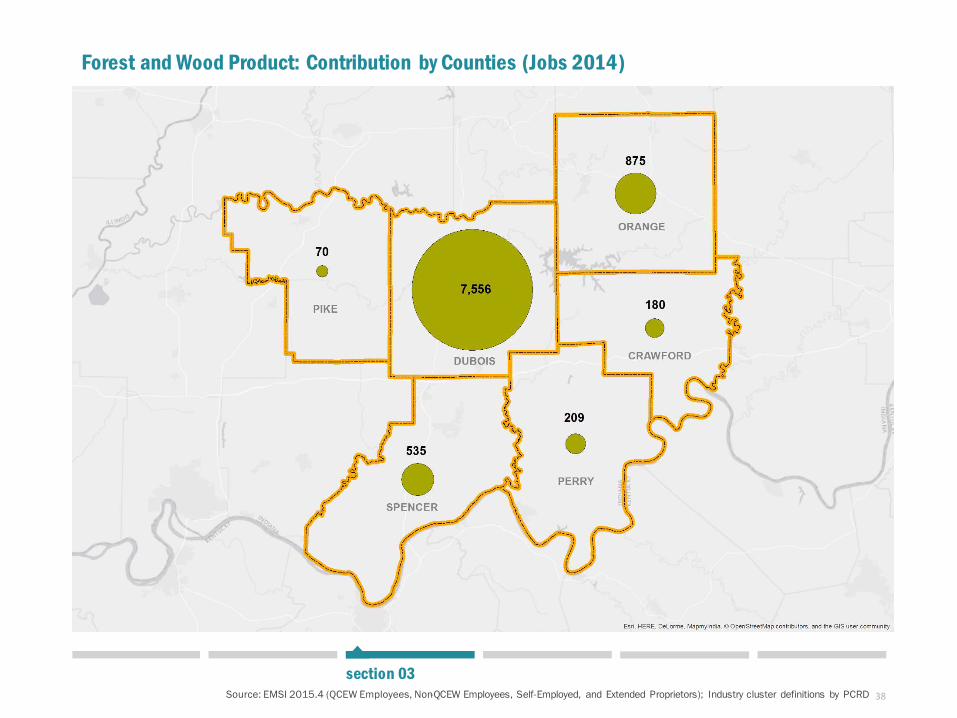
38Source: EMSI 2015.4 (QCEW Employees, Non-QCEW Employees, Self-Employed, and Extended Proprietors); Industry cluster definitions by PCRD
section 03
Forest and Wood Product: Contribution by Counties (Jobs 2014)
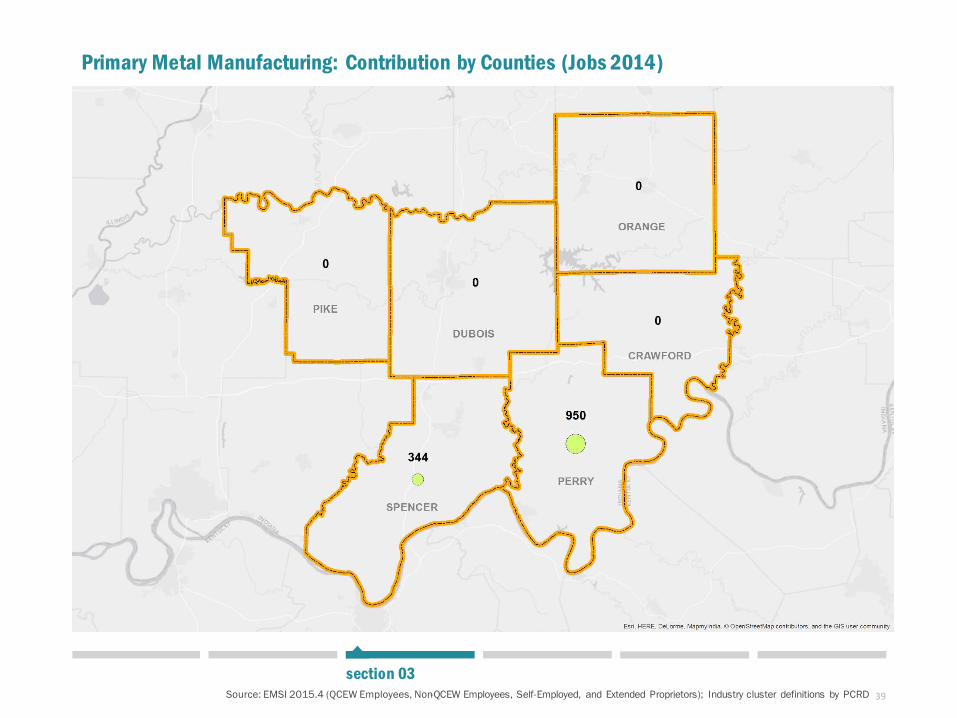
39Source: EMSI 2015.4 (QCEW Employees, Non-QCEW Employees, Self-Employed, and Extended Proprietors); Industry cluster definitions by PCRD
section 03
Primary Metal Manufacturing: Contribution by Counties (Jobs 2014)
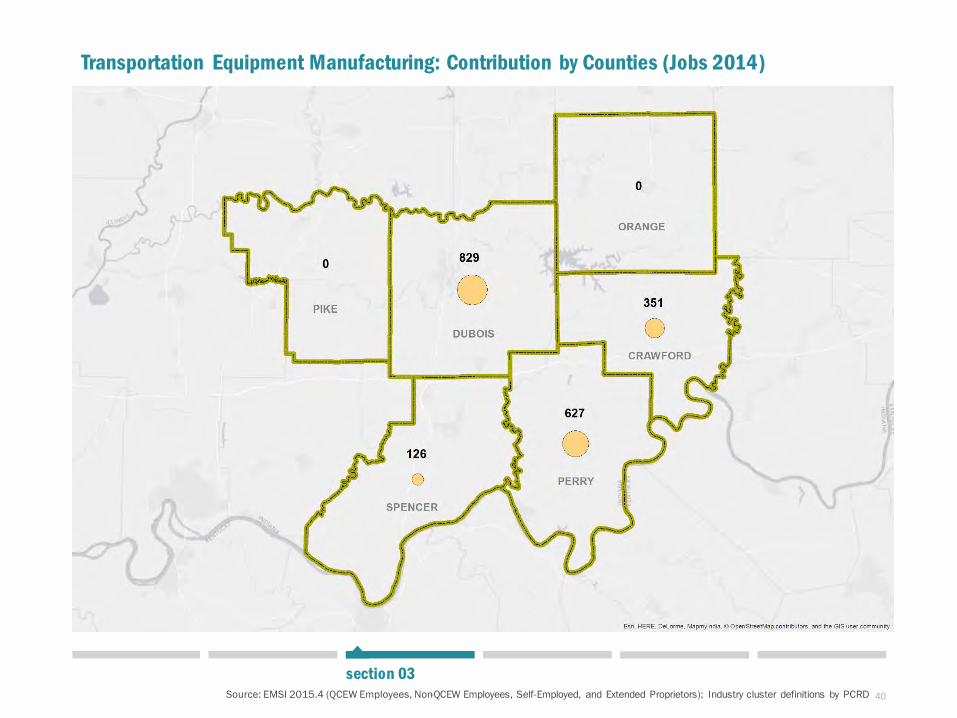
40Source: EMSI 2015.4 (QCEW Employees, Non-QCEW Employees, Self-Employed, and Extended Proprietors); Industry cluster definitions by PCRD
section 03
Transportation Equipment Manufacturing: Contribution by Counties (Jobs 2014)
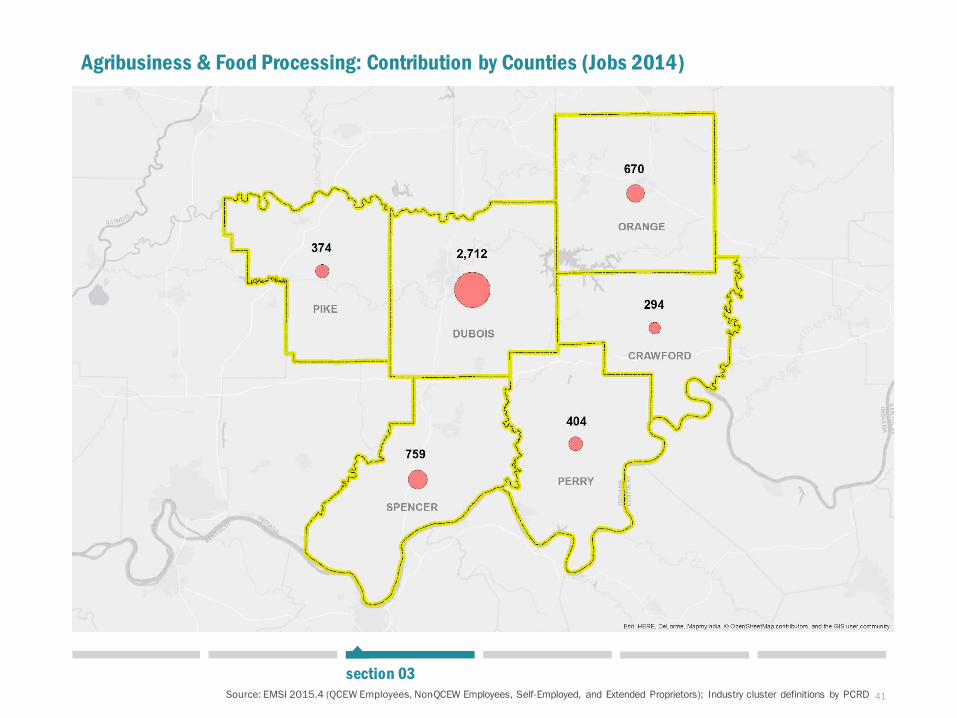
41Source: EMSI 2015.4 (QCEW Employees, Non-QCEW Employees, Self-Employed, and Extended Proprietors); Industry cluster definitions by PCRD
section 03
Agribusiness & Food Processing: Contribution by Counties (Jobs 2014)
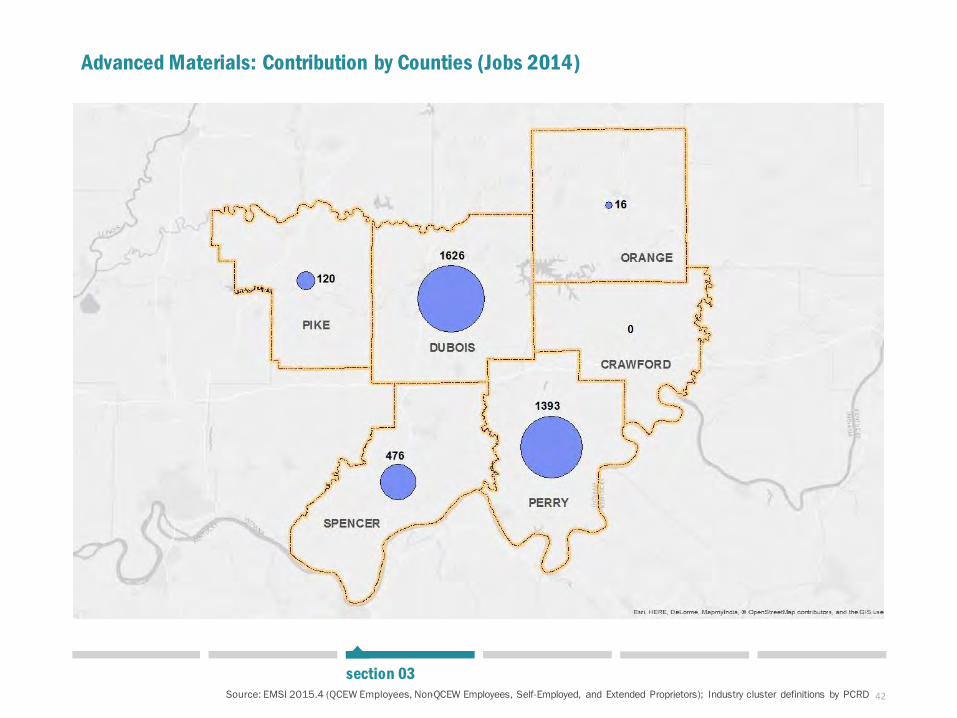
42Source: EMSI 2015.4 (QCEW Employees, Non-QCEW Employees, Self-Employed, and Extended Proprietors); Industry cluster definitions by PCRD
section 03
Advanced Materials: Contribution by Counties (Jobs 2014)
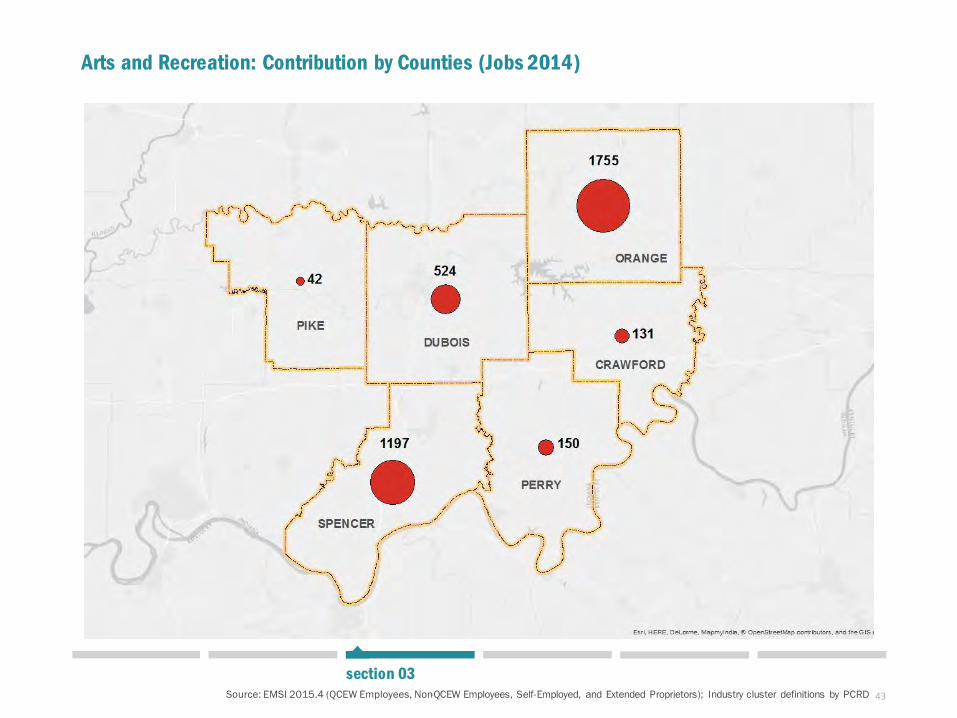
43Source: EMSI 2015.4 (QCEW Employees, Non-QCEW Employees, Self-Employed, and Extended Proprietors); Industry cluster definitions by PCRD
section 03
Arts and Recreation: Contribution by Counties (Jobs 2014)
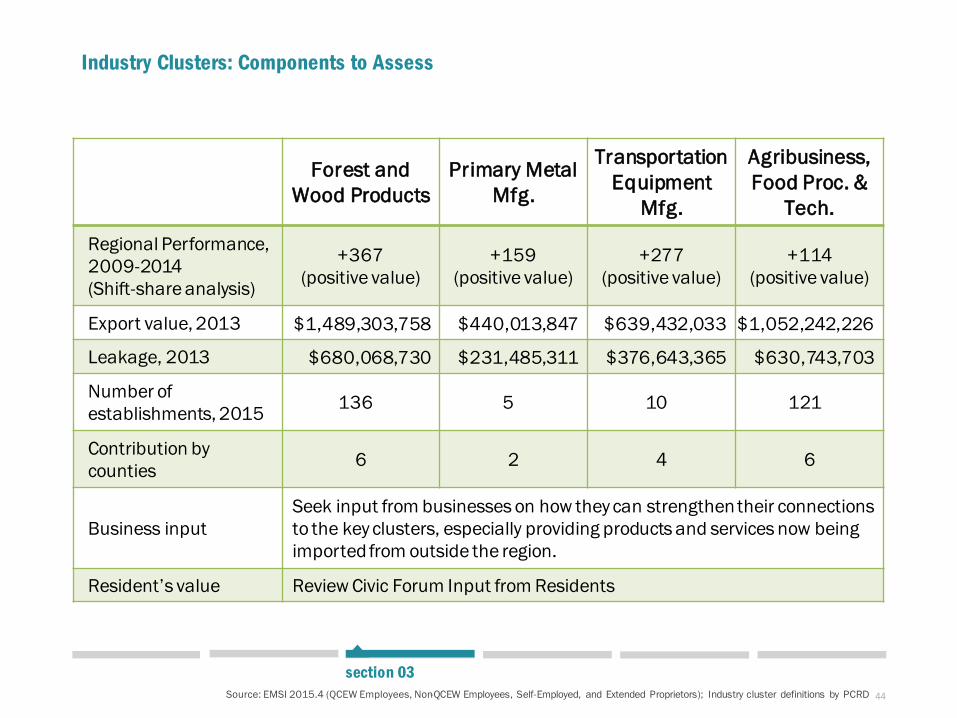
44Source: EMSI 2015.4 (QCEW Employees, Non-QCEW Employees, Self-Employed, and Extended Proprietors); Industry cluster definitions by PCRD
section 03
Forest and Wood Products
Primary Metal Mfg.
Transportation Equipment
Mfg.
Agribusiness,Food Proc. &
Tech.
Regional Performance, 2009-2014 (Shift-share analysis)
+367(positive value)
+159(positive value)
+277(positive value)
+114(positive value)
Export value, 2013 $1,489,303,758 $440,013,847 $639,432,033 $1,052,242,226
Leakage, 2013 $680,068,730 $231,485,311 $376,643,365 $630,743,703
Number of establishments, 2015 136 5 10 121
Contribution by counties 6 2 4 6
Business inputSeek input from businesses on how they can strengthen their connections to the key clusters, especially providing products and services now being imported from outside the region.
Resident’s value Review Civic Forum Input from Residents
Industry Clusters: Components to Assess
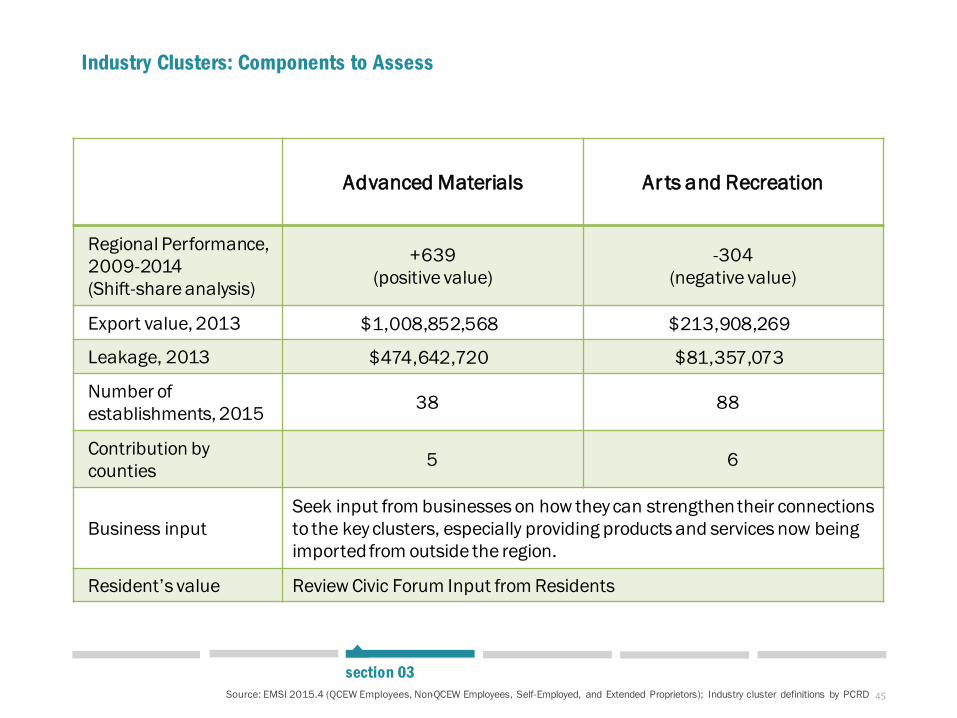
45Source: EMSI 2015.4 (QCEW Employees, Non-QCEW Employees, Self-Employed, and Extended Proprietors); Industry cluster definitions by PCRD
section 03
Advanced Materials Ar ts and Recreation
Regional Performance, 2009-2014 (Shift-share analysis)
+639(positive value)
-304(negative value)
Export value, 2013 $1,008,852,568 $213,908,269
Leakage, 2013 $474,642,720 $81,357,073
Number of establishments, 2015 38 88
Contribution by counties 5 6
Business inputSeek input from businesses on how they can strengthen their connections to the key clusters, especially providing products and services now being imported from outside the region.
Resident’s value Review Civic Forum Input from Residents
Industry Clusters: Components to Assess

Page | 72
Appendix E – Prioritized County and Regional Projects
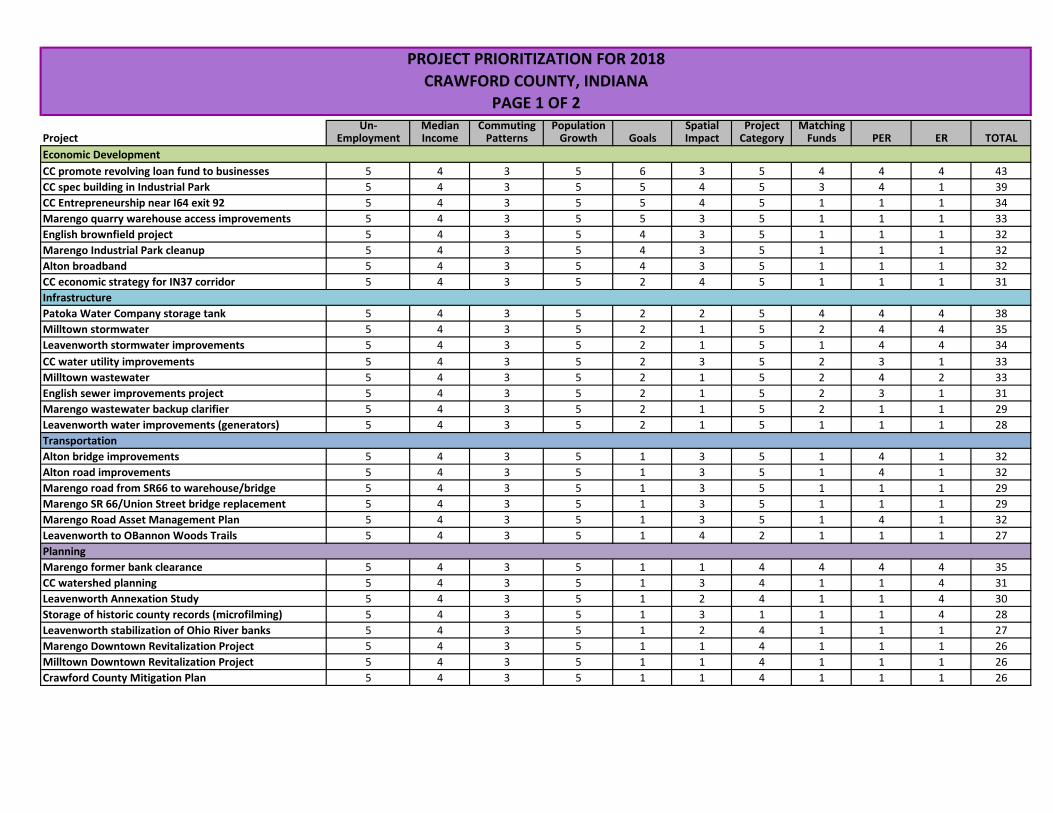
Un- Median Commuting Population Spatial Project MatchingProject Employment Income Patterns Growth Goals Impact Category Funds PER ER TOTAL
CC promote revolving loan fund to businesses 5 4 3 5 6 3 5 4 4 4 43
CC spec building in Industrial Park 5 4 3 5 5 4 5 3 4 1 39
CC Entrepreneurship near I64 exit 92 5 4 3 5 5 4 5 1 1 1 34
Marengo quarry warehouse access improvements 5 4 3 5 5 3 5 1 1 1 33
English brownfield project 5 4 3 5 4 3 5 1 1 1 32
Marengo Industrial Park cleanup 5 4 3 5 4 3 5 1 1 1 32
Alton broadband 5 4 3 5 4 3 5 1 1 1 32
CC economic strategy for IN37 corridor 5 4 3 5 2 4 5 1 1 1 31
Patoka Water Company storage tank 5 4 3 5 2 2 5 4 4 4 38
Milltown stormwater 5 4 3 5 2 1 5 2 4 4 35
Leavenworth stormwater improvements 5 4 3 5 2 1 5 1 4 4 34
CC water utility improvements 5 4 3 5 2 3 5 2 3 1 33
Milltown wastewater 5 4 3 5 2 1 5 2 4 2 33
English sewer improvements project 5 4 3 5 2 1 5 2 3 1 31
Marengo wastewater backup clarifier 5 4 3 5 2 1 5 2 1 1 29
Leavenworth water improvements (generators) 5 4 3 5 2 1 5 1 1 1 28
Alton bridge improvements 5 4 3 5 1 3 5 1 4 1 32
Alton road improvements 5 4 3 5 1 3 5 1 4 1 32
Marengo road from SR66 to warehouse/bridge 5 4 3 5 1 3 5 1 1 1 29
Marengo SR 66/Union Street bridge replacement 5 4 3 5 1 3 5 1 1 1 29
Marengo Road Asset Management Plan 5 4 3 5 1 3 5 1 4 1 32
Leavenworth to OBannon Woods Trails 5 4 3 5 1 4 2 1 1 1 27
Marengo former bank clearance 5 4 3 5 1 1 4 4 4 4 35
CC watershed planning 5 4 3 5 1 3 4 1 1 4 31
Leavenworth Annexation Study 5 4 3 5 1 2 4 1 1 4 30
Storage of historic county records (microfilming) 5 4 3 5 1 3 1 1 1 4 28
Leavenworth stabilization of Ohio River banks 5 4 3 5 1 2 4 1 1 1 27
Marengo Downtown Revitalization Project 5 4 3 5 1 1 4 1 1 1 26
Milltown Downtown Revitalization Project 5 4 3 5 1 1 4 1 1 1 26
Crawford County Mitigation Plan 5 4 3 5 1 1 4 1 1 1 26
PROJECT PRIORITIZATION FOR 2018
CRAWFORD COUNTY, INDIANA
PAGE 1 OF 2
Economic Development
Infrastructure
Transportation
Planning
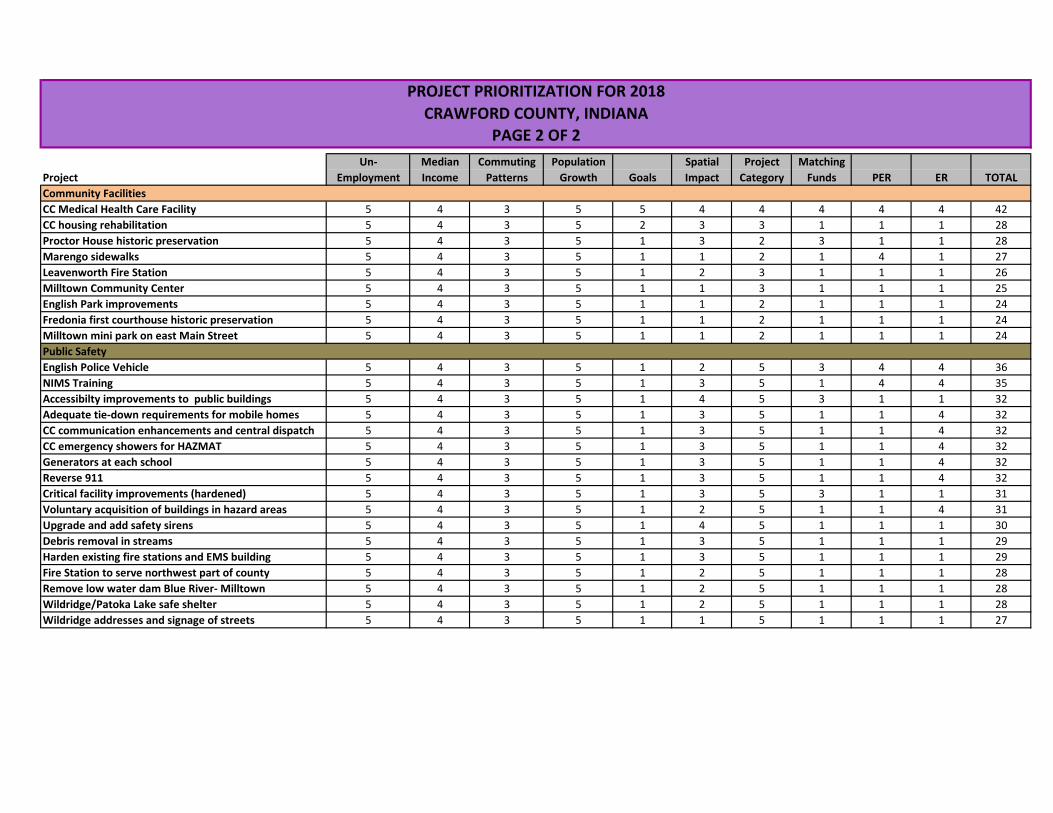
Un- Median Commuting Population Spatial Project Matching
Project Employment Income Patterns Growth Goals Impact Category Funds PER ER TOTAL
CC Medical Health Care Facility 5 4 3 5 5 4 4 4 4 4 42
CC housing rehabilitation 5 4 3 5 2 3 3 1 1 1 28
Proctor House historic preservation 5 4 3 5 1 3 2 3 1 1 28
Marengo sidewalks 5 4 3 5 1 1 2 1 4 1 27
Leavenworth Fire Station 5 4 3 5 1 2 3 1 1 1 26
Milltown Community Center 5 4 3 5 1 1 3 1 1 1 25
English Park improvements 5 4 3 5 1 1 2 1 1 1 24
Fredonia first courthouse historic preservation 5 4 3 5 1 1 2 1 1 1 24
Milltown mini park on east Main Street 5 4 3 5 1 1 2 1 1 1 24
English Police Vehicle 5 4 3 5 1 2 5 3 4 4 36
NIMS Training 5 4 3 5 1 3 5 1 4 4 35
Accessibilty improvements to public buildings 5 4 3 5 1 4 5 3 1 1 32
Adequate tie-down requirements for mobile homes 5 4 3 5 1 3 5 1 1 4 32
CC communication enhancements and central dispatch 5 4 3 5 1 3 5 1 1 4 32
CC emergency showers for HAZMAT 5 4 3 5 1 3 5 1 1 4 32
Generators at each school 5 4 3 5 1 3 5 1 1 4 32
Reverse 911 5 4 3 5 1 3 5 1 1 4 32
Critical facility improvements (hardened) 5 4 3 5 1 3 5 3 1 1 31
Voluntary acquisition of buildings in hazard areas 5 4 3 5 1 2 5 1 1 4 31
Upgrade and add safety sirens 5 4 3 5 1 4 5 1 1 1 30
Debris removal in streams 5 4 3 5 1 3 5 1 1 1 29
Harden existing fire stations and EMS building 5 4 3 5 1 3 5 1 1 1 29
Fire Station to serve northwest part of county 5 4 3 5 1 2 5 1 1 1 28
Remove low water dam Blue River- Milltown 5 4 3 5 1 2 5 1 1 1 28
Wildridge/Patoka Lake safe shelter 5 4 3 5 1 2 5 1 1 1 28
Wildridge addresses and signage of streets 5 4 3 5 1 1 5 1 1 1 27
Public Safety
PROJECT PRIORITIZATION FOR 2018
CRAWFORD COUNTY, INDIANA
PAGE 2 OF 2
Community Facilities
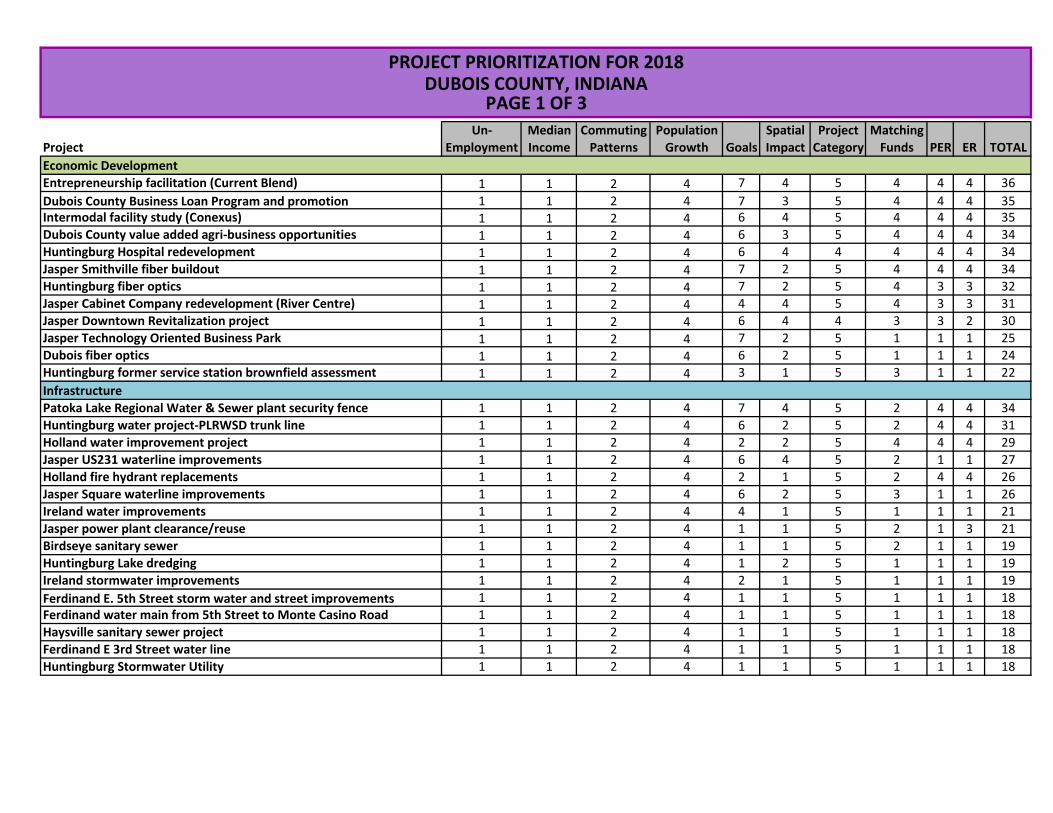
Un- Median Commuting Population Spatial Project Matching
Project Employment Income Patterns Growth Goals Impact Category Funds PER ER TOTAL
Entrepreneurship facilitation (Current Blend) 1 1 2 4 7 4 5 4 4 4 36
Dubois County Business Loan Program and promotion 1 1 2 4 7 3 5 4 4 4 35Intermodal facility study (Conexus) 1 1 2 4 6 4 5 4 4 4 35
Dubois County value added agri-business opportunities 1 1 2 4 6 3 5 4 4 4 34
Huntingburg Hospital redevelopment 1 1 2 4 6 4 4 4 4 4 34
Jasper Smithville fiber buildout 1 1 2 4 7 2 5 4 4 4 34
Huntingburg fiber optics 1 1 2 4 7 2 5 4 3 3 32
Jasper Cabinet Company redevelopment (River Centre) 1 1 2 4 4 4 5 4 3 3 31
Jasper Downtown Revitalization project 1 1 2 4 6 4 4 3 3 2 30
Jasper Technology Oriented Business Park 1 1 2 4 7 2 5 1 1 1 25
Dubois fiber optics 1 1 2 4 6 2 5 1 1 1 24
Huntingburg former service station brownfield assessment 1 1 2 4 3 1 5 3 1 1 22
Patoka Lake Regional Water & Sewer plant security fence 1 1 2 4 7 4 5 2 4 4 34
Huntingburg water project-PLRWSD trunk line 1 1 2 4 6 2 5 2 4 4 31
Holland water improvement project 1 1 2 4 2 2 5 4 4 4 29
Jasper US231 waterline improvements 1 1 2 4 6 4 5 2 1 1 27
Holland fire hydrant replacements 1 1 2 4 2 1 5 2 4 4 26
Jasper Square waterline improvements 1 1 2 4 6 2 5 3 1 1 26
Ireland water improvements 1 1 2 4 4 1 5 1 1 1 21
Jasper power plant clearance/reuse 1 1 2 4 1 1 5 2 1 3 21
Birdseye sanitary sewer 1 1 2 4 1 1 5 2 1 1 19
Huntingburg Lake dredging 1 1 2 4 1 2 5 1 1 1 19
Ireland stormwater improvements 1 1 2 4 2 1 5 1 1 1 19
Ferdinand E. 5th Street storm water and street improvements 1 1 2 4 1 1 5 1 1 1 18
Ferdinand water main from 5th Street to Monte Casino Road 1 1 2 4 1 1 5 1 1 1 18
Haysville sanitary sewer project 1 1 2 4 1 1 5 1 1 1 18
Ferdinand E 3rd Street water line 1 1 2 4 1 1 5 1 1 1 18
Huntingburg Stormwater Utility 1 1 2 4 1 1 5 1 1 1 18
PROJECT PRIORITIZATION FOR 2018DUBOIS COUNTY, INDIANA
PAGE 1 OF 3
Economic Development
Infrastructure
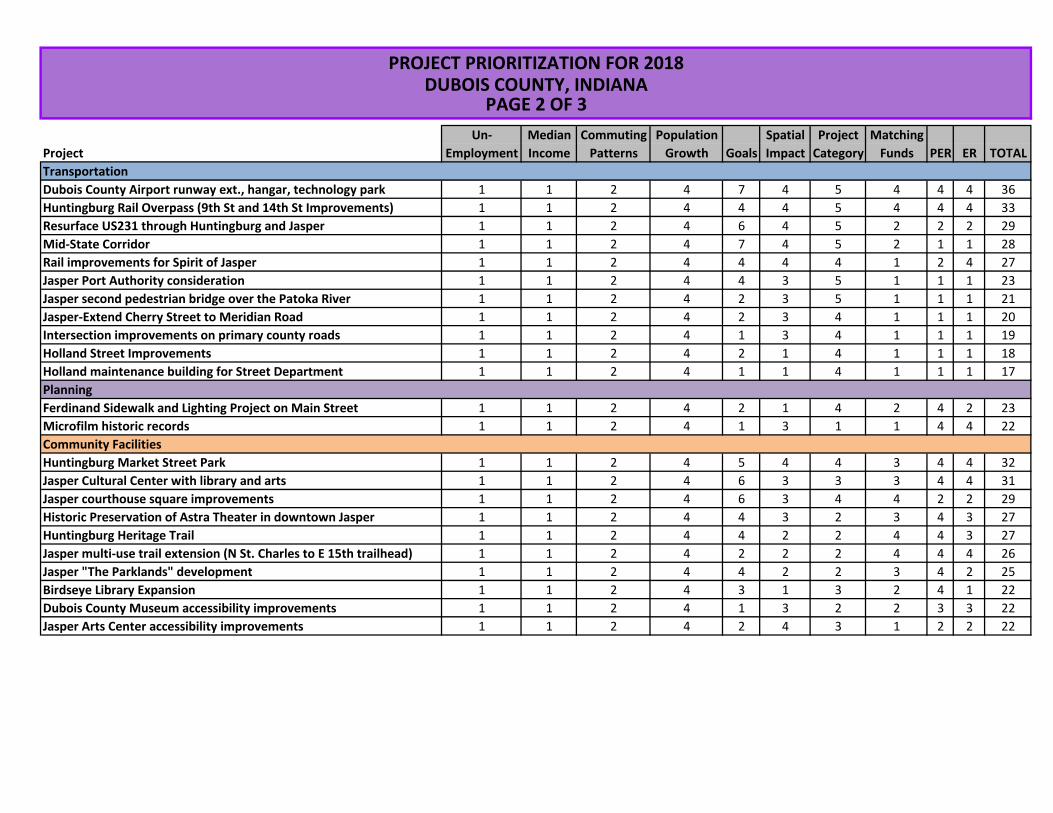
Un- Median Commuting Population Spatial Project Matching
Project Employment Income Patterns Growth Goals Impact Category Funds PER ER TOTAL
Dubois County Airport runway ext., hangar, technology park 1 1 2 4 7 4 5 4 4 4 36
Huntingburg Rail Overpass (9th St and 14th St Improvements) 1 1 2 4 4 4 5 4 4 4 33
Resurface US231 through Huntingburg and Jasper 1 1 2 4 6 4 5 2 2 2 29
Mid-State Corridor 1 1 2 4 7 4 5 2 1 1 28
Rail improvements for Spirit of Jasper 1 1 2 4 4 4 4 1 2 4 27
Jasper Port Authority consideration 1 1 2 4 4 3 5 1 1 1 23
Jasper second pedestrian bridge over the Patoka River 1 1 2 4 2 3 5 1 1 1 21
Jasper-Extend Cherry Street to Meridian Road 1 1 2 4 2 3 4 1 1 1 20
Intersection improvements on primary county roads 1 1 2 4 1 3 4 1 1 1 19
Holland Street Improvements 1 1 2 4 2 1 4 1 1 1 18
Holland maintenance building for Street Department 1 1 2 4 1 1 4 1 1 1 17
Ferdinand Sidewalk and Lighting Project on Main Street 1 1 2 4 2 1 4 2 4 2 23
Microfilm historic records 1 1 2 4 1 3 1 1 4 4 22
Huntingburg Market Street Park 1 1 2 4 5 4 4 3 4 4 32
Jasper Cultural Center with library and arts 1 1 2 4 6 3 3 3 4 4 31
Jasper courthouse square improvements 1 1 2 4 6 3 4 4 2 2 29
Historic Preservation of Astra Theater in downtown Jasper 1 1 2 4 4 3 2 3 4 3 27
Huntingburg Heritage Trail 1 1 2 4 4 2 2 4 4 3 27
Jasper multi-use trail extension (N St. Charles to E 15th trailhead) 1 1 2 4 2 2 2 4 4 4 26
Jasper "The Parklands" development 1 1 2 4 4 2 2 3 4 2 25
Birdseye Library Expansion 1 1 2 4 3 1 3 2 4 1 22
Dubois County Museum accessibility improvements 1 1 2 4 1 3 2 2 3 3 22
Jasper Arts Center accessibility improvements 1 1 2 4 2 4 3 1 2 2 22
Community Facilities
Transportation
Planning
PROJECT PRIORITIZATION FOR 2018DUBOIS COUNTY, INDIANA
PAGE 2 OF 3
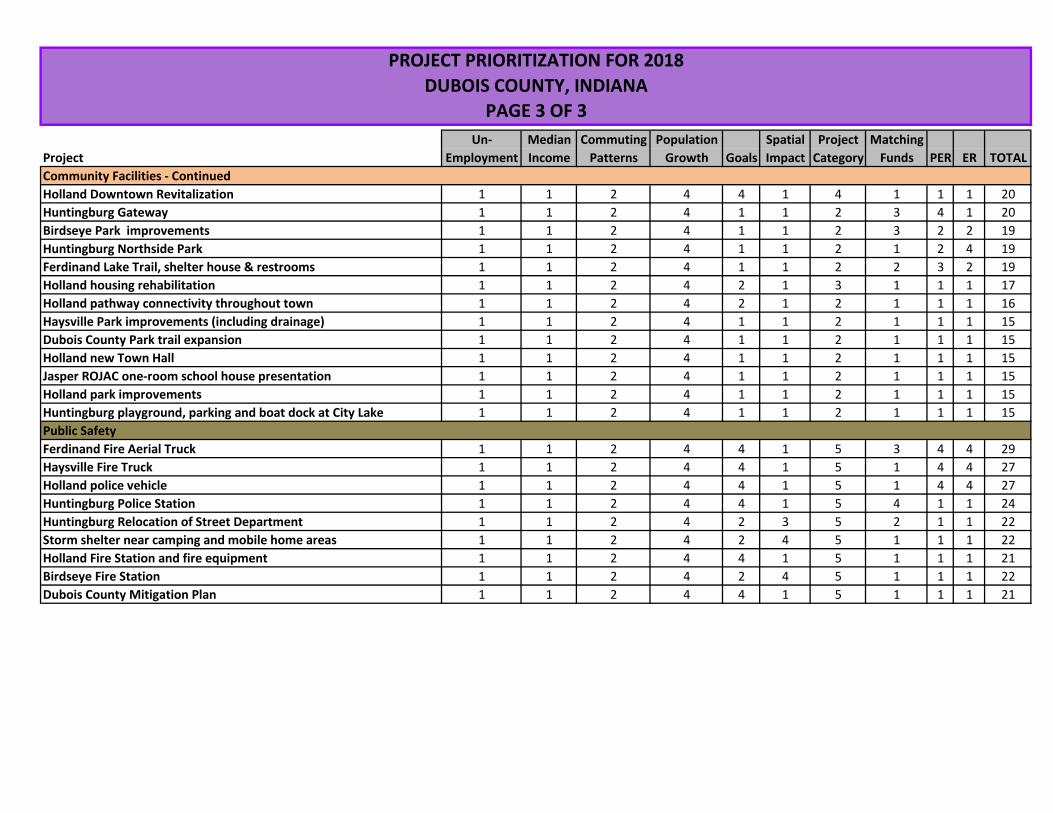
Un- Median Commuting Population Spatial Project Matching
Project Employment Income Patterns Growth Goals Impact Category Funds PER ER TOTAL
Holland Downtown Revitalization 1 1 2 4 4 1 4 1 1 1 20
Huntingburg Gateway 1 1 2 4 1 1 2 3 4 1 20
Birdseye Park improvements 1 1 2 4 1 1 2 3 2 2 19
Huntingburg Northside Park 1 1 2 4 1 1 2 1 2 4 19
Ferdinand Lake Trail, shelter house & restrooms 1 1 2 4 1 1 2 2 3 2 19
Holland housing rehabilitation 1 1 2 4 2 1 3 1 1 1 17
Holland pathway connectivity throughout town 1 1 2 4 2 1 2 1 1 1 16
Haysville Park improvements (including drainage) 1 1 2 4 1 1 2 1 1 1 15
Dubois County Park trail expansion 1 1 2 4 1 1 2 1 1 1 15
Holland new Town Hall 1 1 2 4 1 1 2 1 1 1 15
Jasper ROJAC one-room school house presentation 1 1 2 4 1 1 2 1 1 1 15
Holland park improvements 1 1 2 4 1 1 2 1 1 1 15
Huntingburg playground, parking and boat dock at City Lake 1 1 2 4 1 1 2 1 1 1 15
Ferdinand Fire Aerial Truck 1 1 2 4 4 1 5 3 4 4 29
Haysville Fire Truck 1 1 2 4 4 1 5 1 4 4 27
Holland police vehicle 1 1 2 4 4 1 5 1 4 4 27
Huntingburg Police Station 1 1 2 4 4 1 5 4 1 1 24
Huntingburg Relocation of Street Department 1 1 2 4 2 3 5 2 1 1 22
Storm shelter near camping and mobile home areas 1 1 2 4 2 4 5 1 1 1 22
Holland Fire Station and fire equipment 1 1 2 4 4 1 5 1 1 1 21
Birdseye Fire Station 1 1 2 4 2 4 5 1 1 1 22
Dubois County Mitigation Plan 1 1 2 4 4 1 5 1 1 1 21
Community Facilities - Continued
Public Safety
DUBOIS COUNTY, INDIANA
PAGE 3 OF 3
PROJECT PRIORITIZATION FOR 2018
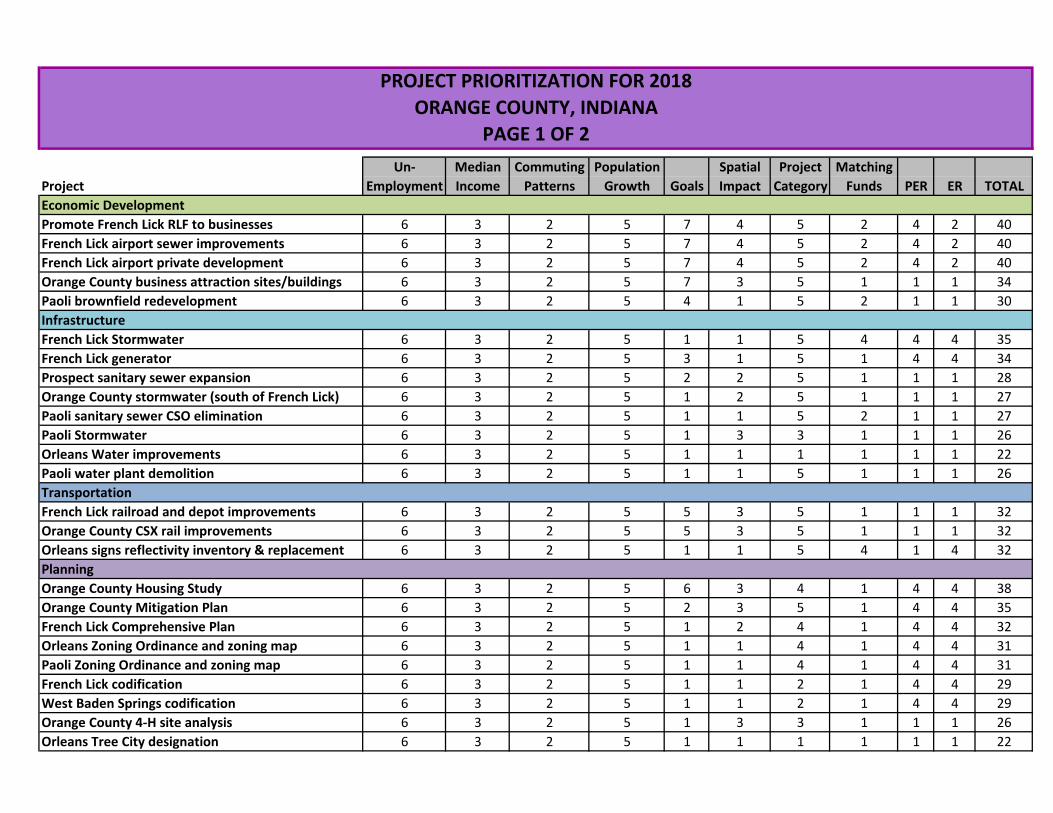
Un- Median Commuting Population Spatial Project Matching
Project Employment Income Patterns Growth Goals Impact Category Funds PER ER TOTAL
Promote French Lick RLF to businesses 6 3 2 5 7 4 5 2 4 2 40
French Lick airport sewer improvements 6 3 2 5 7 4 5 2 4 2 40
French Lick airport private development 6 3 2 5 7 4 5 2 4 2 40
Orange County business attraction sites/buildings 6 3 2 5 7 3 5 1 1 1 34
Paoli brownfield redevelopment 6 3 2 5 4 1 5 2 1 1 30
French Lick Stormwater 6 3 2 5 1 1 5 4 4 4 35
French Lick generator 6 3 2 5 3 1 5 1 4 4 34
Prospect sanitary sewer expansion 6 3 2 5 2 2 5 1 1 1 28
Orange County stormwater (south of French Lick) 6 3 2 5 1 2 5 1 1 1 27
Paoli sanitary sewer CSO elimination 6 3 2 5 1 1 5 2 1 1 27
Paoli Stormwater 6 3 2 5 1 3 3 1 1 1 26
Orleans Water improvements 6 3 2 5 1 1 1 1 1 1 22
Paoli water plant demolition 6 3 2 5 1 1 5 1 1 1 26
French Lick railroad and depot improvements 6 3 2 5 5 3 5 1 1 1 32
Orange County CSX rail improvements 6 3 2 5 5 3 5 1 1 1 32
Orleans signs reflectivity inventory & replacement 6 3 2 5 1 1 5 4 1 4 32
Orange County Housing Study 6 3 2 5 6 3 4 1 4 4 38
Orange County Mitigation Plan 6 3 2 5 2 3 5 1 4 4 35
French Lick Comprehensive Plan 6 3 2 5 1 2 4 1 4 4 32
Orleans Zoning Ordinance and zoning map 6 3 2 5 1 1 4 1 4 4 31
Paoli Zoning Ordinance and zoning map 6 3 2 5 1 1 4 1 4 4 31
French Lick codification 6 3 2 5 1 1 2 1 4 4 29
West Baden Springs codification 6 3 2 5 1 1 2 1 4 4 29
Orange County 4-H site analysis 6 3 2 5 1 3 3 1 1 1 26
Orleans Tree City designation 6 3 2 5 1 1 1 1 1 1 22
PROJECT PRIORITIZATION FOR 2018
PAGE 1 OF 2
Planning
Transportation
Infrastructure
Economic Development
ORANGE COUNTY, INDIANA
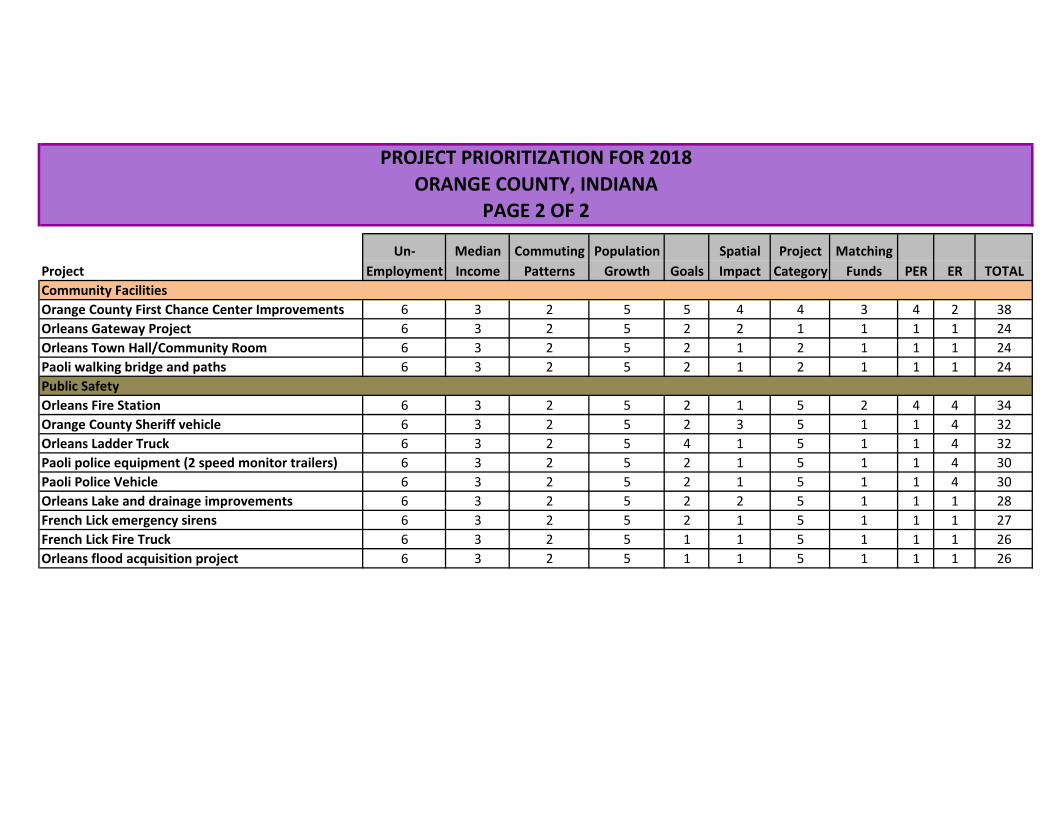
Un- Median Commuting Population Spatial Project Matching
Project Employment Income Patterns Growth Goals Impact Category Funds PER ER TOTAL
Orange County First Chance Center Improvements 6 3 2 5 5 4 4 3 4 2 38
Orleans Gateway Project 6 3 2 5 2 2 1 1 1 1 24
Orleans Town Hall/Community Room 6 3 2 5 2 1 2 1 1 1 24
Paoli walking bridge and paths 6 3 2 5 2 1 2 1 1 1 24
Orleans Fire Station 6 3 2 5 2 1 5 2 4 4 34
Orange County Sheriff vehicle 6 3 2 5 2 3 5 1 1 4 32
Orleans Ladder Truck 6 3 2 5 4 1 5 1 1 4 32
Paoli police equipment (2 speed monitor trailers) 6 3 2 5 2 1 5 1 1 4 30
Paoli Police Vehicle 6 3 2 5 2 1 5 1 1 4 30
Orleans Lake and drainage improvements 6 3 2 5 2 2 5 1 1 1 28
French Lick emergency sirens 6 3 2 5 2 1 5 1 1 1 27
French Lick Fire Truck 6 3 2 5 1 1 5 1 1 1 26
Orleans flood acquisition project 6 3 2 5 1 1 5 1 1 1 26
Public Safety
Community Facilities
PROJECT PRIORITIZATION FOR 2018
ORANGE COUNTY, INDIANA
PAGE 2 OF 2
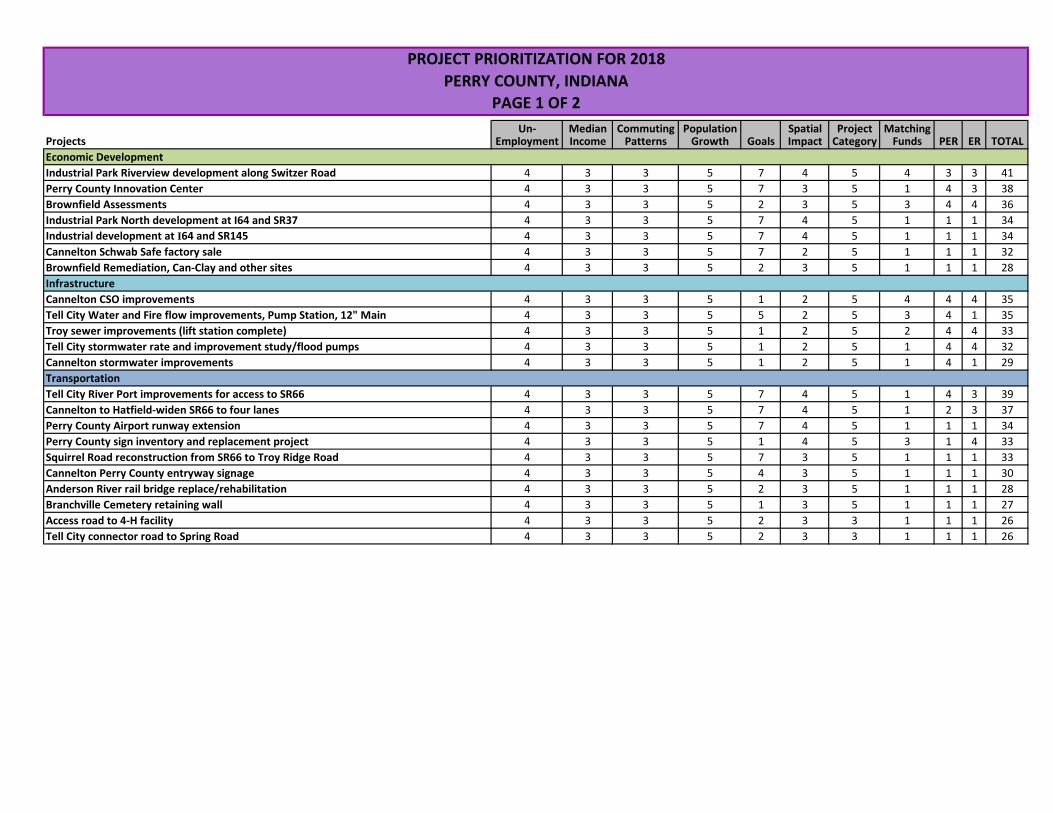
Un- Median Commuting Population Spatial Project MatchingEmployment Income Patterns Growth Goals Impact Category Funds PER ER TOTAL
Industrial Park Riverview development along Switzer Road 4 3 3 5 7 4 5 4 3 3 41
Perry County Innovation Center 4 3 3 5 7 3 5 1 4 3 38
Brownfield Assessments 4 3 3 5 2 3 5 3 4 4 36
Industrial Park North development at I64 and SR37 4 3 3 5 7 4 5 1 1 1 34
Industrial development at I64 and SR145 4 3 3 5 7 4 5 1 1 1 34
Cannelton Schwab Safe factory sale 4 3 3 5 7 2 5 1 1 1 32
Brownfield Remediation, Can-Clay and other sites 4 3 3 5 2 3 5 1 1 1 28
Cannelton CSO improvements 4 3 3 5 1 2 5 4 4 4 35
Tell City Water and Fire flow improvements, Pump Station, 12" Main 4 3 3 5 5 2 5 3 4 1 35
Troy sewer improvements (lift station complete) 4 3 3 5 1 2 5 2 4 4 33
Tell City stormwater rate and improvement study/flood pumps 4 3 3 5 1 2 5 1 4 4 32
Cannelton stormwater improvements 4 3 3 5 1 2 5 1 4 1 29
Tell City River Port improvements for access to SR66 4 3 3 5 7 4 5 1 4 3 39
Cannelton to Hatfield-widen SR66 to four lanes 4 3 3 5 7 4 5 1 2 3 37
Perry County Airport runway extension 4 3 3 5 7 4 5 1 1 1 34
Perry County sign inventory and replacement project 4 3 3 5 1 4 5 3 1 4 33
Squirrel Road reconstruction from SR66 to Troy Ridge Road 4 3 3 5 7 3 5 1 1 1 33
Cannelton Perry County entryway signage 4 3 3 5 4 3 5 1 1 1 30
Anderson River rail bridge replace/rehabilitation 4 3 3 5 2 3 5 1 1 1 28
Branchville Cemetery retaining wall 4 3 3 5 1 3 5 1 1 1 27
Access road to 4-H facility 4 3 3 5 2 3 3 1 1 1 26
Tell City connector road to Spring Road 4 3 3 5 2 3 3 1 1 1 26
Projects
PROJECT PRIORITIZATION FOR 2018
PERRY COUNTY, INDIANA
Economic Development
Infrastructure
Transportation
PAGE 1 OF 2
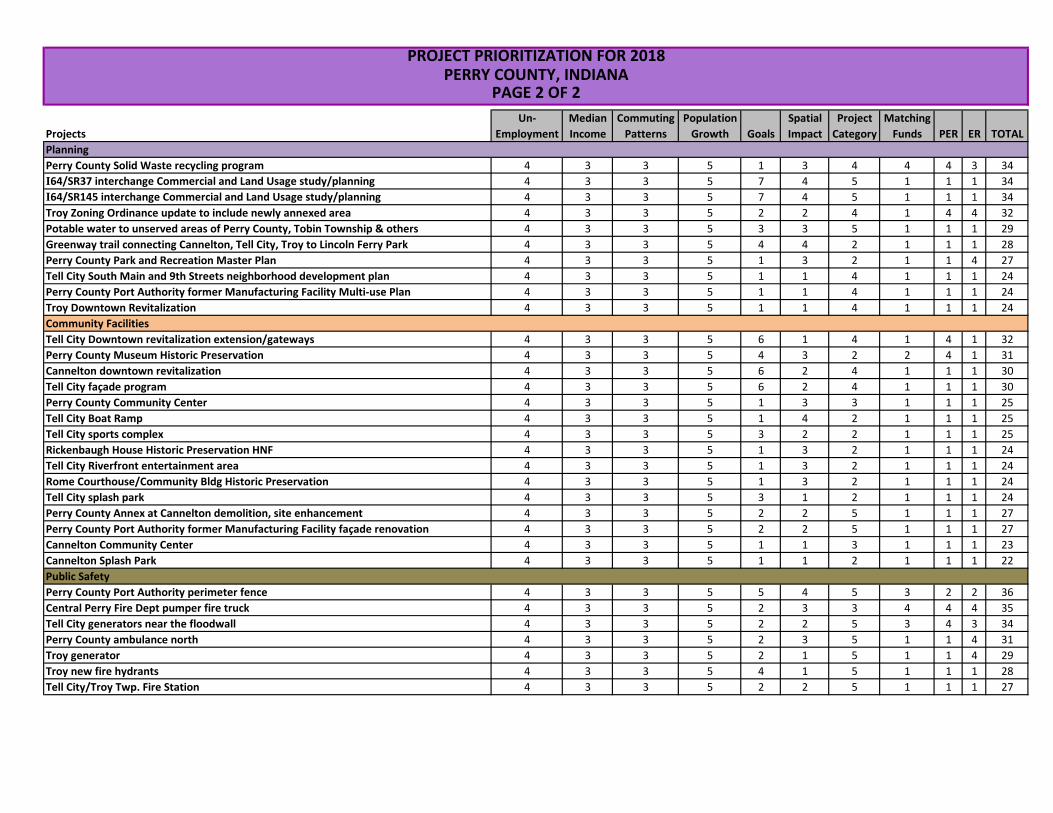
Un- Median Commuting Population Spatial Project Matching
Employment Income Patterns Growth Goals Impact Category Funds PER ER TOTAL
Perry County Solid Waste recycling program 4 3 3 5 1 3 4 4 4 3 34
I64/SR37 interchange Commercial and Land Usage study/planning 4 3 3 5 7 4 5 1 1 1 34
I64/SR145 interchange Commercial and Land Usage study/planning 4 3 3 5 7 4 5 1 1 1 34
Troy Zoning Ordinance update to include newly annexed area 4 3 3 5 2 2 4 1 4 4 32
Potable water to unserved areas of Perry County, Tobin Township & others 4 3 3 5 3 3 5 1 1 1 29
Greenway trail connecting Cannelton, Tell City, Troy to Lincoln Ferry Park 4 3 3 5 4 4 2 1 1 1 28
Perry County Park and Recreation Master Plan 4 3 3 5 1 3 2 1 1 4 27
Tell City South Main and 9th Streets neighborhood development plan 4 3 3 5 1 1 4 1 1 1 24
Perry County Port Authority former Manufacturing Facility Multi-use Plan 4 3 3 5 1 1 4 1 1 1 24
Troy Downtown Revitalization 4 3 3 5 1 1 4 1 1 1 24
Tell City Downtown revitalization extension/gateways 4 3 3 5 6 1 4 1 4 1 32
Perry County Museum Historic Preservation 4 3 3 5 4 3 2 2 4 1 31
Cannelton downtown revitalization 4 3 3 5 6 2 4 1 1 1 30
Tell City façade program 4 3 3 5 6 2 4 1 1 1 30
Perry County Community Center 4 3 3 5 1 3 3 1 1 1 25
Tell City Boat Ramp 4 3 3 5 1 4 2 1 1 1 25
Tell City sports complex 4 3 3 5 3 2 2 1 1 1 25
Rickenbaugh House Historic Preservation HNF 4 3 3 5 1 3 2 1 1 1 24
Tell City Riverfront entertainment area 4 3 3 5 1 3 2 1 1 1 24
Rome Courthouse/Community Bldg Historic Preservation 4 3 3 5 1 3 2 1 1 1 24
Tell City splash park 4 3 3 5 3 1 2 1 1 1 24
Perry County Annex at Cannelton demolition, site enhancement 4 3 3 5 2 2 5 1 1 1 27
Perry County Port Authority former Manufacturing Facility façade renovation 4 3 3 5 2 2 5 1 1 1 27
Cannelton Community Center 4 3 3 5 1 1 3 1 1 1 23
Cannelton Splash Park 4 3 3 5 1 1 2 1 1 1 22
Perry County Port Authority perimeter fence 4 3 3 5 5 4 5 3 2 2 36
Central Perry Fire Dept pumper fire truck 4 3 3 5 2 3 3 4 4 4 35
Tell City generators near the floodwall 4 3 3 5 2 2 5 3 4 3 34
Perry County ambulance north 4 3 3 5 2 3 5 1 1 4 31
Troy generator 4 3 3 5 2 1 5 1 1 4 29
Troy new fire hydrants 4 3 3 5 4 1 5 1 1 1 28
Tell City/Troy Twp. Fire Station 4 3 3 5 2 2 5 1 1 1 27
Planning
Community Facilities
Public Safety
PROJECT PRIORITIZATION FOR 2018PERRY COUNTY, INDIANA
PAGE 2 OF 2
Projects
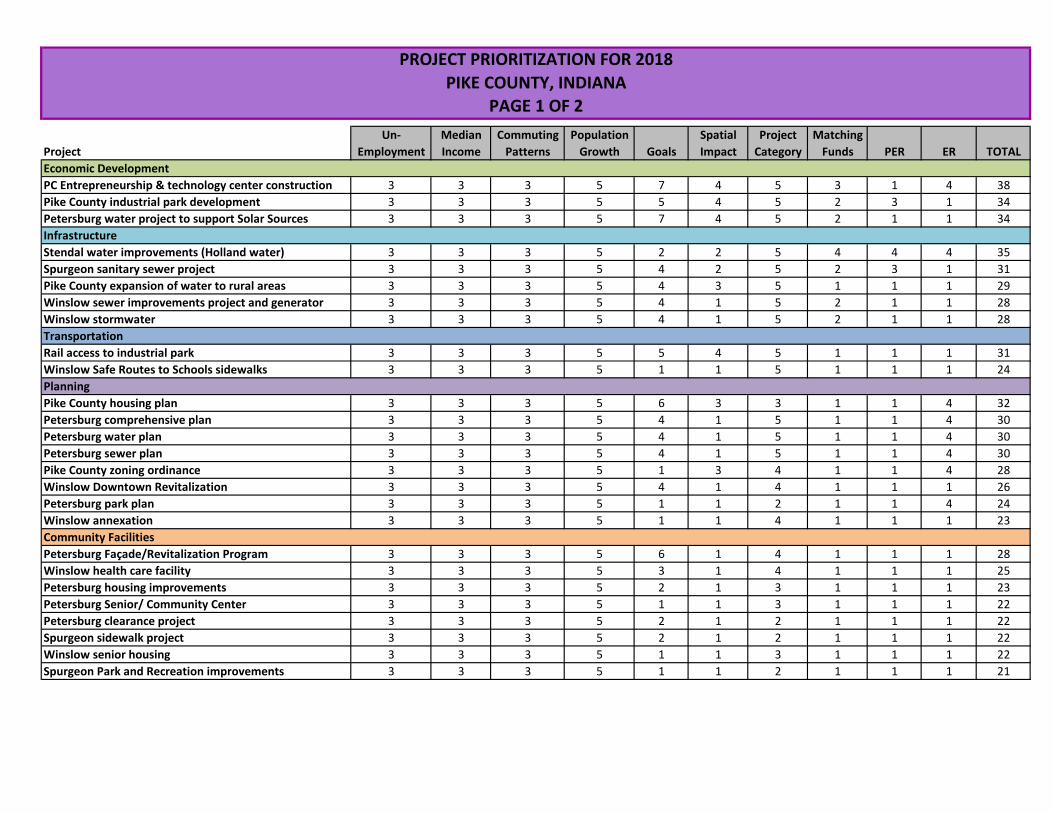
Un- Median Commuting Population Spatial Project Matching
Project Employment Income Patterns Growth Goals Impact Category Funds PER ER TOTAL
PC Entrepreneurship & technology center construction 3 3 3 5 7 4 5 3 1 4 38
Pike County industrial park development 3 3 3 5 5 4 5 2 3 1 34
Petersburg water project to support Solar Sources 3 3 3 5 7 4 5 2 1 1 34
Stendal water improvements (Holland water) 3 3 3 5 2 2 5 4 4 4 35
Spurgeon sanitary sewer project 3 3 3 5 4 2 5 2 3 1 31
Pike County expansion of water to rural areas 3 3 3 5 4 3 5 1 1 1 29
Winslow sewer improvements project and generator 3 3 3 5 4 1 5 2 1 1 28
Winslow stormwater 3 3 3 5 4 1 5 2 1 1 28
Rail access to industrial park 3 3 3 5 5 4 5 1 1 1 31
Winslow Safe Routes to Schools sidewalks 3 3 3 5 1 1 5 1 1 1 24
Pike County housing plan 3 3 3 5 6 3 3 1 1 4 32
Petersburg comprehensive plan 3 3 3 5 4 1 5 1 1 4 30
Petersburg water plan 3 3 3 5 4 1 5 1 1 4 30
Petersburg sewer plan 3 3 3 5 4 1 5 1 1 4 30
Pike County zoning ordinance 3 3 3 5 1 3 4 1 1 4 28
Winslow Downtown Revitalization 3 3 3 5 4 1 4 1 1 1 26
Petersburg park plan 3 3 3 5 1 1 2 1 1 4 24
Winslow annexation 3 3 3 5 1 1 4 1 1 1 23
Petersburg Façade/Revitalization Program 3 3 3 5 6 1 4 1 1 1 28
Winslow health care facility 3 3 3 5 3 1 4 1 1 1 25
Petersburg housing improvements 3 3 3 5 2 1 3 1 1 1 23
Petersburg Senior/ Community Center 3 3 3 5 1 1 3 1 1 1 22
Petersburg clearance project 3 3 3 5 2 1 2 1 1 1 22
Spurgeon sidewalk project 3 3 3 5 2 1 2 1 1 1 22
Winslow senior housing 3 3 3 5 1 1 3 1 1 1 22
Spurgeon Park and Recreation improvements 3 3 3 5 1 1 2 1 1 1 21
PROJECT PRIORITIZATION FOR 2018
PIKE COUNTY, INDIANA
Economic Development
Community Facilities
Planning
Transportation
Infrastructure
PAGE 1 OF 2
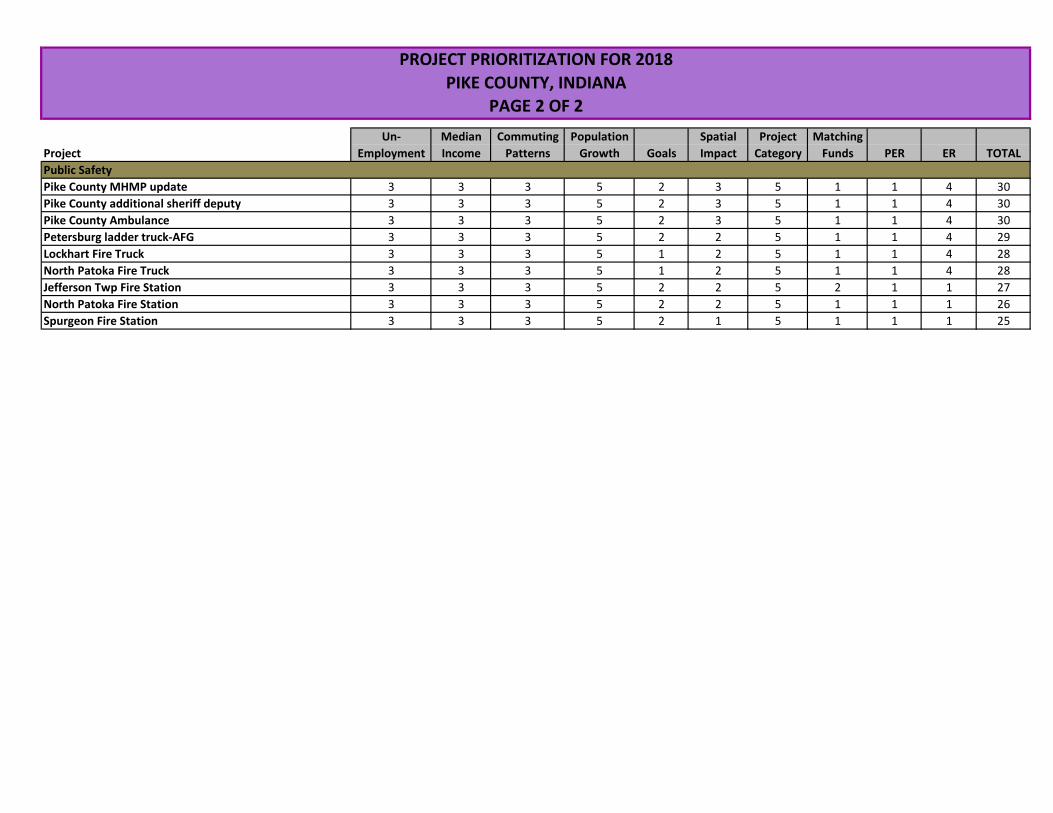
Un- Median Commuting Population Spatial Project Matching
Project Employment Income Patterns Growth Goals Impact Category Funds PER ER TOTAL
Pike County MHMP update 3 3 3 5 2 3 5 1 1 4 30
Pike County additional sheriff deputy 3 3 3 5 2 3 5 1 1 4 30
Pike County Ambulance 3 3 3 5 2 3 5 1 1 4 30
Petersburg ladder truck-AFG 3 3 3 5 2 2 5 1 1 4 29
Lockhart Fire Truck 3 3 3 5 1 2 5 1 1 4 28
North Patoka Fire Truck 3 3 3 5 1 2 5 1 1 4 28
Jefferson Twp Fire Station 3 3 3 5 2 2 5 2 1 1 27
North Patoka Fire Station 3 3 3 5 2 2 5 1 1 1 26
Spurgeon Fire Station 3 3 3 5 2 1 5 1 1 1 25
Public Safety
PROJECT PRIORITIZATION FOR 2018
PIKE COUNTY, INDIANA
PAGE 2 OF 2
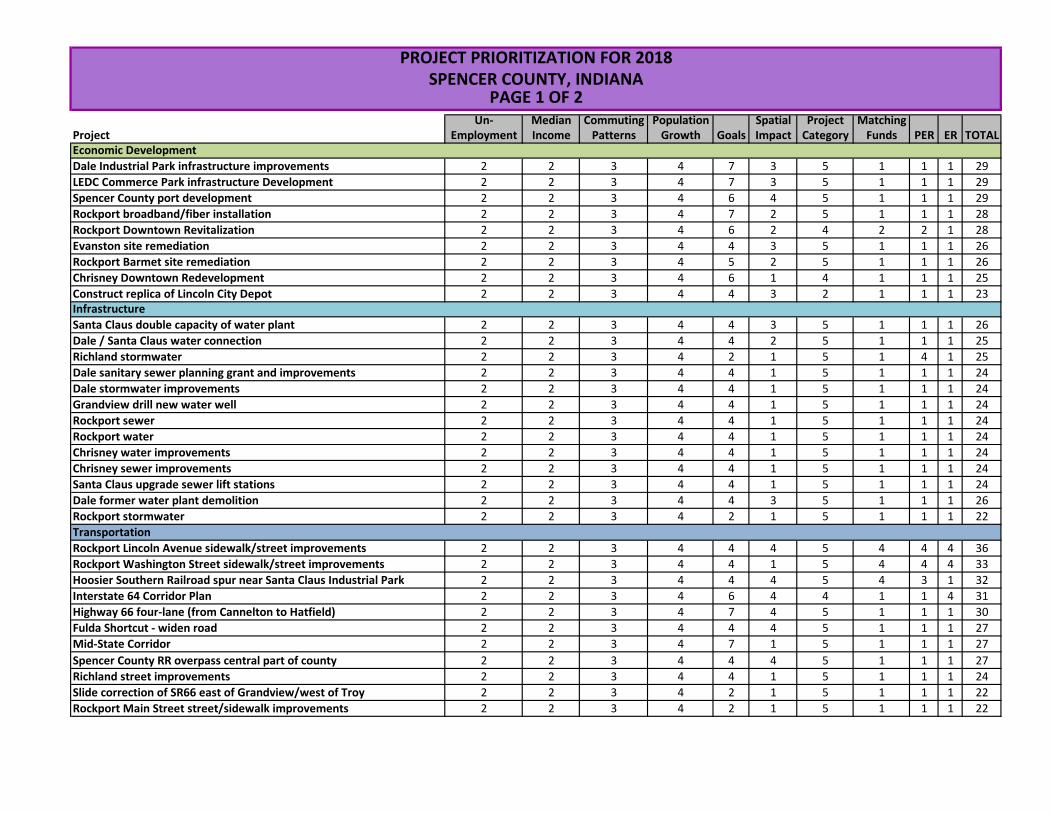
Un- Median Commuting Population Spatial Project MatchingProject Employment Income Patterns Growth Goals Impact Category Funds PER ER TOTAL
Dale Industrial Park infrastructure improvements 2 2 3 4 7 3 5 1 1 1 29
LEDC Commerce Park infrastructure Development 2 2 3 4 7 3 5 1 1 1 29
Spencer County port development 2 2 3 4 6 4 5 1 1 1 29
Rockport broadband/fiber installation 2 2 3 4 7 2 5 1 1 1 28
Rockport Downtown Revitalization 2 2 3 4 6 2 4 2 2 1 28
Evanston site remediation 2 2 3 4 4 3 5 1 1 1 26
Rockport Barmet site remediation 2 2 3 4 5 2 5 1 1 1 26
Chrisney Downtown Redevelopment 2 2 3 4 6 1 4 1 1 1 25
Construct replica of Lincoln City Depot 2 2 3 4 4 3 2 1 1 1 23
Santa Claus double capacity of water plant 2 2 3 4 4 3 5 1 1 1 26
Dale / Santa Claus water connection 2 2 3 4 4 2 5 1 1 1 25
Richland stormwater 2 2 3 4 2 1 5 1 4 1 25
Dale sanitary sewer planning grant and improvements 2 2 3 4 4 1 5 1 1 1 24
Dale stormwater improvements 2 2 3 4 4 1 5 1 1 1 24
Grandview drill new water well 2 2 3 4 4 1 5 1 1 1 24
Rockport sewer 2 2 3 4 4 1 5 1 1 1 24
Rockport water 2 2 3 4 4 1 5 1 1 1 24
Chrisney water improvements 2 2 3 4 4 1 5 1 1 1 24
Chrisney sewer improvements 2 2 3 4 4 1 5 1 1 1 24
Santa Claus upgrade sewer lift stations 2 2 3 4 4 1 5 1 1 1 24
Dale former water plant demolition 2 2 3 4 4 3 5 1 1 1 26
Rockport stormwater 2 2 3 4 2 1 5 1 1 1 22
Rockport Lincoln Avenue sidewalk/street improvements 2 2 3 4 4 4 5 4 4 4 36
Rockport Washington Street sidewalk/street improvements 2 2 3 4 4 1 5 4 4 4 33
Hoosier Southern Railroad spur near Santa Claus Industrial Park 2 2 3 4 4 4 5 4 3 1 32
Interstate 64 Corridor Plan 2 2 3 4 6 4 4 1 1 4 31
Highway 66 four-lane (from Cannelton to Hatfield) 2 2 3 4 7 4 5 1 1 1 30
Fulda Shortcut - widen road 2 2 3 4 4 4 5 1 1 1 27
Mid-State Corridor 2 2 3 4 7 1 5 1 1 1 27
Spencer County RR overpass central part of county 2 2 3 4 4 4 5 1 1 1 27
Richland street improvements 2 2 3 4 4 1 5 1 1 1 24
Slide correction of SR66 east of Grandview/west of Troy 2 2 3 4 2 1 5 1 1 1 22
Rockport Main Street street/sidewalk improvements 2 2 3 4 2 1 5 1 1 1 22
PROJECT PRIORITIZATION FOR 2018SPENCER COUNTY, INDIANA
PAGE 1 OF 2
Economic Development
Infrastructure
Transportation
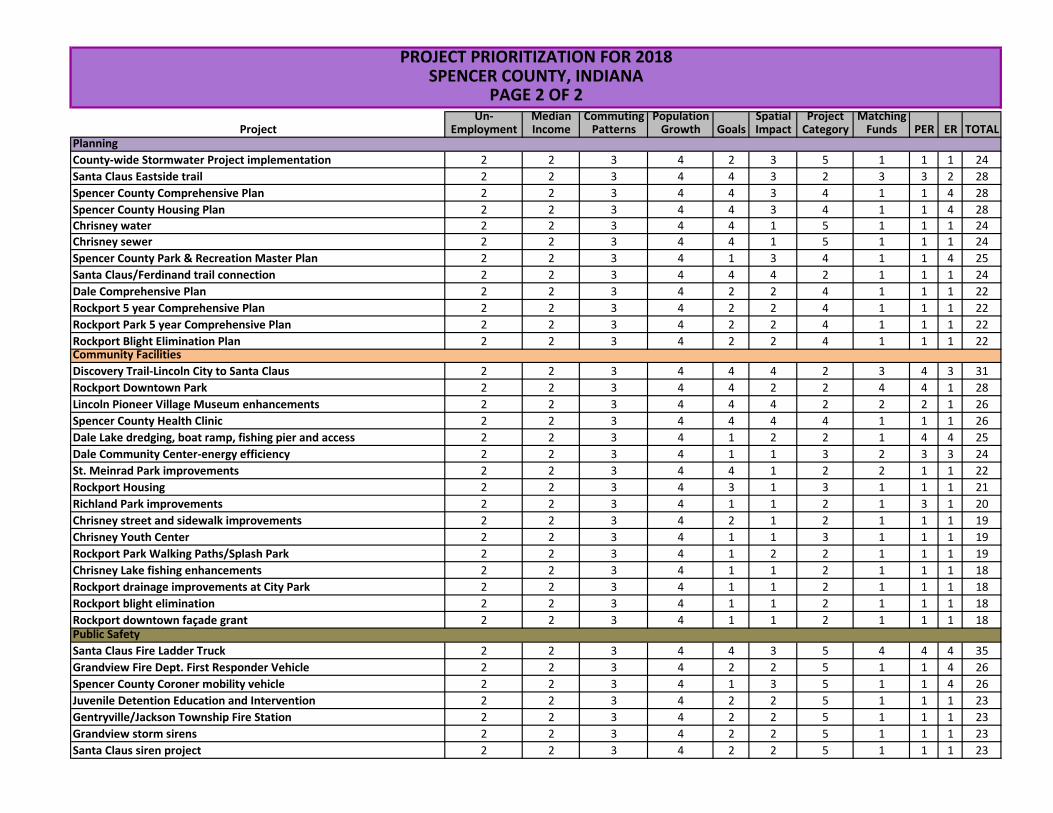
Un- Median Commuting Population Spatial Project MatchingProject Employment Income Patterns Growth Goals Impact Category Funds PER ER TOTAL
County-wide Stormwater Project implementation 2 2 3 4 2 3 5 1 1 1 24
Santa Claus Eastside trail 2 2 3 4 4 3 2 3 3 2 28
Spencer County Comprehensive Plan 2 2 3 4 4 3 4 1 1 4 28
Spencer County Housing Plan 2 2 3 4 4 3 4 1 1 4 28
Chrisney water 2 2 3 4 4 1 5 1 1 1 24
Chrisney sewer 2 2 3 4 4 1 5 1 1 1 24
Spencer County Park & Recreation Master Plan 2 2 3 4 1 3 4 1 1 4 25
Santa Claus/Ferdinand trail connection 2 2 3 4 4 4 2 1 1 1 24
Dale Comprehensive Plan 2 2 3 4 2 2 4 1 1 1 22
Rockport 5 year Comprehensive Plan 2 2 3 4 2 2 4 1 1 1 22
Rockport Park 5 year Comprehensive Plan 2 2 3 4 2 2 4 1 1 1 22
Rockport Blight Elimination Plan 2 2 3 4 2 2 4 1 1 1 22
Discovery Trail-Lincoln City to Santa Claus 2 2 3 4 4 4 2 3 4 3 31
Rockport Downtown Park 2 2 3 4 4 2 2 4 4 1 28
Lincoln Pioneer Village Museum enhancements 2 2 3 4 4 4 2 2 2 1 26
Spencer County Health Clinic 2 2 3 4 4 4 4 1 1 1 26
Dale Lake dredging, boat ramp, fishing pier and access 2 2 3 4 1 2 2 1 4 4 25
Dale Community Center-energy efficiency 2 2 3 4 1 1 3 2 3 3 24
St. Meinrad Park improvements 2 2 3 4 4 1 2 2 1 1 22
Rockport Housing 2 2 3 4 3 1 3 1 1 1 21
Richland Park improvements 2 2 3 4 1 1 2 1 3 1 20
Chrisney street and sidewalk improvements 2 2 3 4 2 1 2 1 1 1 19
Chrisney Youth Center 2 2 3 4 1 1 3 1 1 1 19
Rockport Park Walking Paths/Splash Park 2 2 3 4 1 2 2 1 1 1 19
Chrisney Lake fishing enhancements 2 2 3 4 1 1 2 1 1 1 18
Rockport drainage improvements at City Park 2 2 3 4 1 1 2 1 1 1 18
Rockport blight elimination 2 2 3 4 1 1 2 1 1 1 18
Rockport downtown façade grant 2 2 3 4 1 1 2 1 1 1 18
Santa Claus Fire Ladder Truck 2 2 3 4 4 3 5 4 4 4 35
Grandview Fire Dept. First Responder Vehicle 2 2 3 4 2 2 5 1 1 4 26
Spencer County Coroner mobility vehicle 2 2 3 4 1 3 5 1 1 4 26
Juvenile Detention Education and Intervention 2 2 3 4 2 2 5 1 1 1 23
Gentryville/Jackson Township Fire Station 2 2 3 4 2 2 5 1 1 1 23
Grandview storm sirens 2 2 3 4 2 2 5 1 1 1 23
Santa Claus siren project 2 2 3 4 2 2 5 1 1 1 23
Planning
Community Facilities
Public Safety
PAGE 2 OF 2
PROJECT PRIORITIZATION FOR 2018SPENCER COUNTY, INDIANA
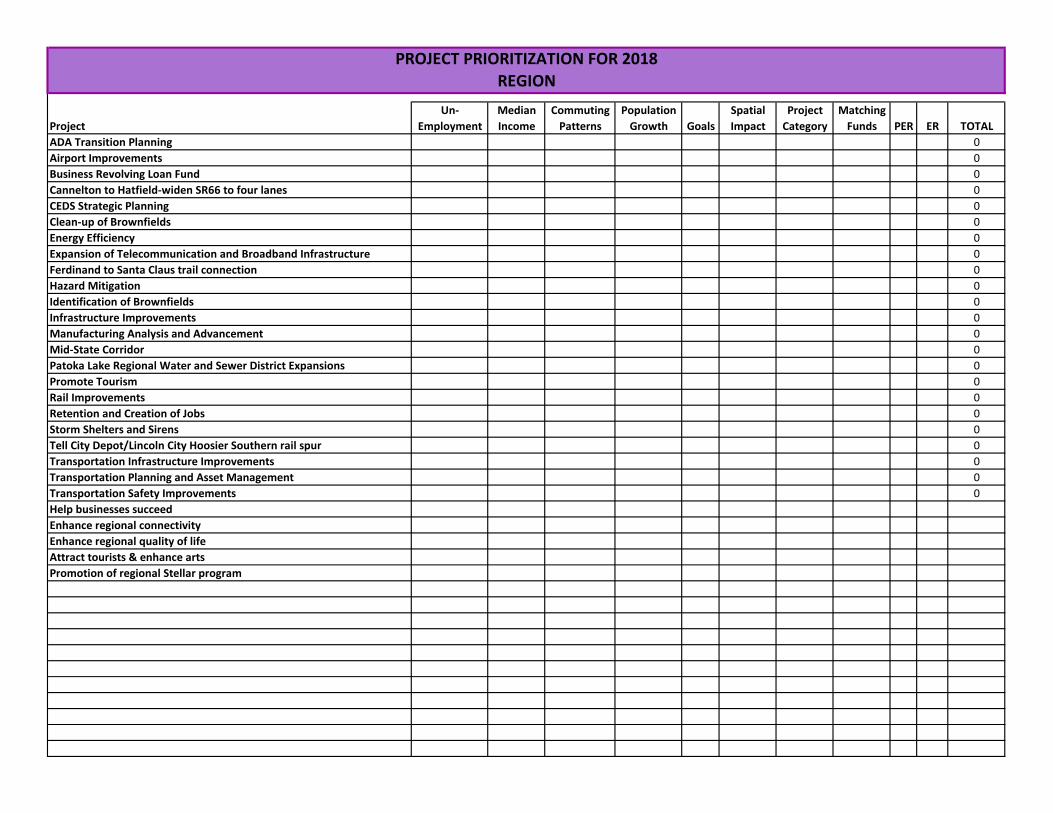
Un- Median Commuting Population Spatial Project Matching
Project Employment Income Patterns Growth Goals Impact Category Funds PER ER TOTAL
ADA Transition Planning 0
Airport Improvements 0
Business Revolving Loan Fund 0
Cannelton to Hatfield-widen SR66 to four lanes 0
CEDS Strategic Planning 0
Clean-up of Brownfields 0
Energy Efficiency 0
Expansion of Telecommunication and Broadband Infrastructure 0
Ferdinand to Santa Claus trail connection 0
Hazard Mitigation 0
Identification of Brownfields 0
Infrastructure Improvements 0
Manufacturing Analysis and Advancement 0
Mid-State Corridor 0
Patoka Lake Regional Water and Sewer District Expansions 0
Promote Tourism 0
Rail Improvements 0
Retention and Creation of Jobs 0
Storm Shelters and Sirens 0
Tell City Depot/Lincoln City Hoosier Southern rail spur 0
Transportation Infrastructure Improvements 0
Transportation Planning and Asset Management 0
Transportation Safety Improvements 0
Help businesses succeed
Enhance regional connectivity
Enhance regional quality of life
Attract tourists & enhance arts
Promotion of regional Stellar program
PROJECT PRIORITIZATION FOR 2018
REGION

Page | 87
Appendix F – 2017 Newsletter: Year in Review
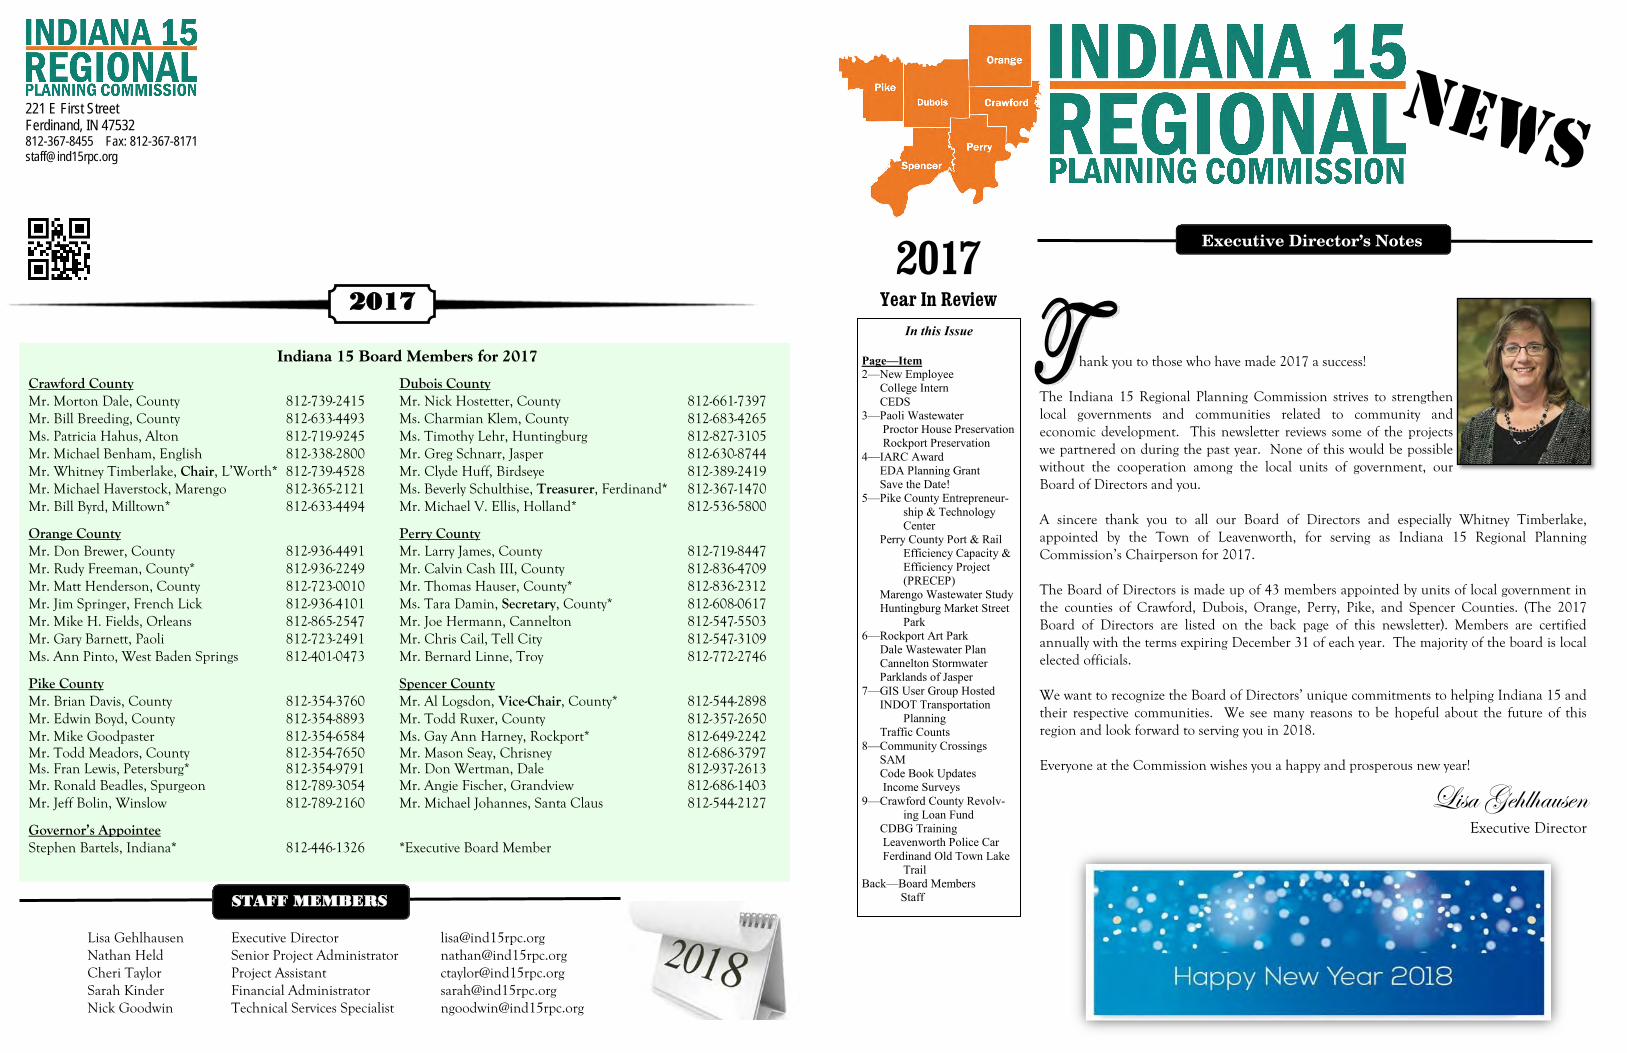
Indiana 15 Board Members for 2017 Crawford County Dubois County Mr. Morton Dale, County 812-739-2415 Mr. Nick Hostetter, County 812-661-7397 Mr. Bill Breeding, County 812-633-4493 Ms. Charmian Klem, County 812-683-4265 Ms. Patricia Hahus, Alton 812-719-9245 Ms. Timothy Lehr, Huntingburg 812-827-3105 Mr. Michael Benham, English 812-338-2800 Mr. Greg Schnarr, Jasper 812-630-8744 Mr. Whitney Timberlake, Chair, L’Worth* 812-739-4528 Mr. Clyde Huff, Birdseye 812-389-2419 Mr. Michael Haverstock, Marengo 812-365-2121 Ms. Beverly Schulthise, Treasurer, Ferdinand* 812-367-1470 Mr. Bill Byrd, Milltown* 812-633-4494 Mr. Michael V. Ellis, Holland* 812-536-5800
Orange County Perry County Mr. Don Brewer, County 812-936-4491 Mr. Larry James, County 812-719-8447 Mr. Rudy Freeman, County* 812-936-2249 Mr. Calvin Cash III, County 812-836-4709 Mr. Matt Henderson, County 812-723-0010 Mr. Thomas Hauser, County* 812-836-2312 Mr. Jim Springer, French Lick 812-936-4101 Ms. Tara Damin, Secretary, County* 812-608-0617 Mr. Mike H. Fields, Orleans 812-865-2547 Mr. Joe Hermann, Cannelton 812-547-5503 Mr. Gary Barnett, Paoli 812-723-2491 Mr. Chris Cail, Tell City 812-547-3109 Ms. Ann Pinto, West Baden Springs 812-401-0473 Mr. Bernard Linne, Troy 812-772-2746
Pike County Spencer County Mr. Brian Davis, County 812-354-3760 Mr. Al Logsdon, Vice-Chair, County* 812-544-2898 Mr. Edwin Boyd, County 812-354-8893 Mr. Todd Ruxer, County 812-357-2650 Mr. Mike Goodpaster 812-354-6584 Ms. Gay Ann Harney, Rockport* 812-649-2242 Mr. Todd Meadors, County 812-354-7650 Mr. Mason Seay, Chrisney 812-686-3797 Ms. Fran Lewis, Petersburg* 812-354-9791 Mr. Don Wertman, Dale 812-937-2613 Mr. Ronald Beadles, Spurgeon 812-789-3054 Mr. Angie Fischer, Grandview 812-686-1403 Mr. Jeff Bolin, Winslow 812-789-2160 Mr. Michael Johannes, Santa Claus 812-544-2127
Governor’s Appointee Stephen Bartels, Indiana* 812-446-1326 *Executive Board Member
221 E First Street Ferdinand, IN 47532 812-367-8455 Fax: 812-367-8171 [email protected]
Lisa Gehlhausen Executive Director [email protected] Nathan Held Senior Project Administrator [email protected] Cheri Taylor Project Assistant [email protected] Sarah Kinder Financial Administrator [email protected] Nick Goodwin Technical Services Specialist [email protected]
STAFF MEMBERS
2017 Year In Review
hank you to those who have made 2017 a success!
The Indiana 15 Regional Planning Commission strives to strengthen local governments and communities related to community and economic development. This newsletter reviews some of the projects we partnered on during the past year. None of this would be possible without the cooperation among the local units of government, our Board of Directors and you. A sincere thank you to all our Board of Directors and especially Whitney Timberlake, appointed by the Town of Leavenworth, for serving as Indiana 15 Regional Planning Commission’s Chairperson for 2017. The Board of Directors is made up of 43 members appointed by units of local government in the counties of Crawford, Dubois, Orange, Perry, Pike, and Spencer Counties. (The 2017 Board of Directors are listed on the back page of this newsletter). Members are certified annually with the terms expiring December 31 of each year. The majority of the board is local elected officials. We want to recognize the Board of Directors’ unique commitments to helping Indiana 15 and their respective communities. We see many reasons to be hopeful about the future of this region and look forward to serving you in 2018. Everyone at the Commission wishes you a happy and prosperous new year!
Lisa Gehlhausen Executive Director
In this Issue
Page—Item 2—New Employee
College Intern
CEDS
3—Paoli Wastewater
Proctor House Preservation
Rockport Preservation
4—IARC Award
EDA Planning Grant
Save the Date!
5—Pike County Entrepreneur-
ship & Technology
Center
Perry County Port & Rail
Efficiency Capacity &
Efficiency Project
(PRECEP)
Marengo Wastewater Study
Huntingburg Market Street
Park
6—Rockport Art Park
Dale Wastewater Plan
Cannelton Stormwater
Parklands of Jasper
7—GIS User Group Hosted
INDOT Transportation
Planning
Traffic Counts
8—Community Crossings
SAM
Code Book Updates
Income Surveys
9—Crawford County Revolv-
ing Loan Fund
CDBG Training
Leavenworth Police Car
Ferdinand Old Town Lake
Trail
Back—Board Members
Staff
Executive Director’s Notes
2017
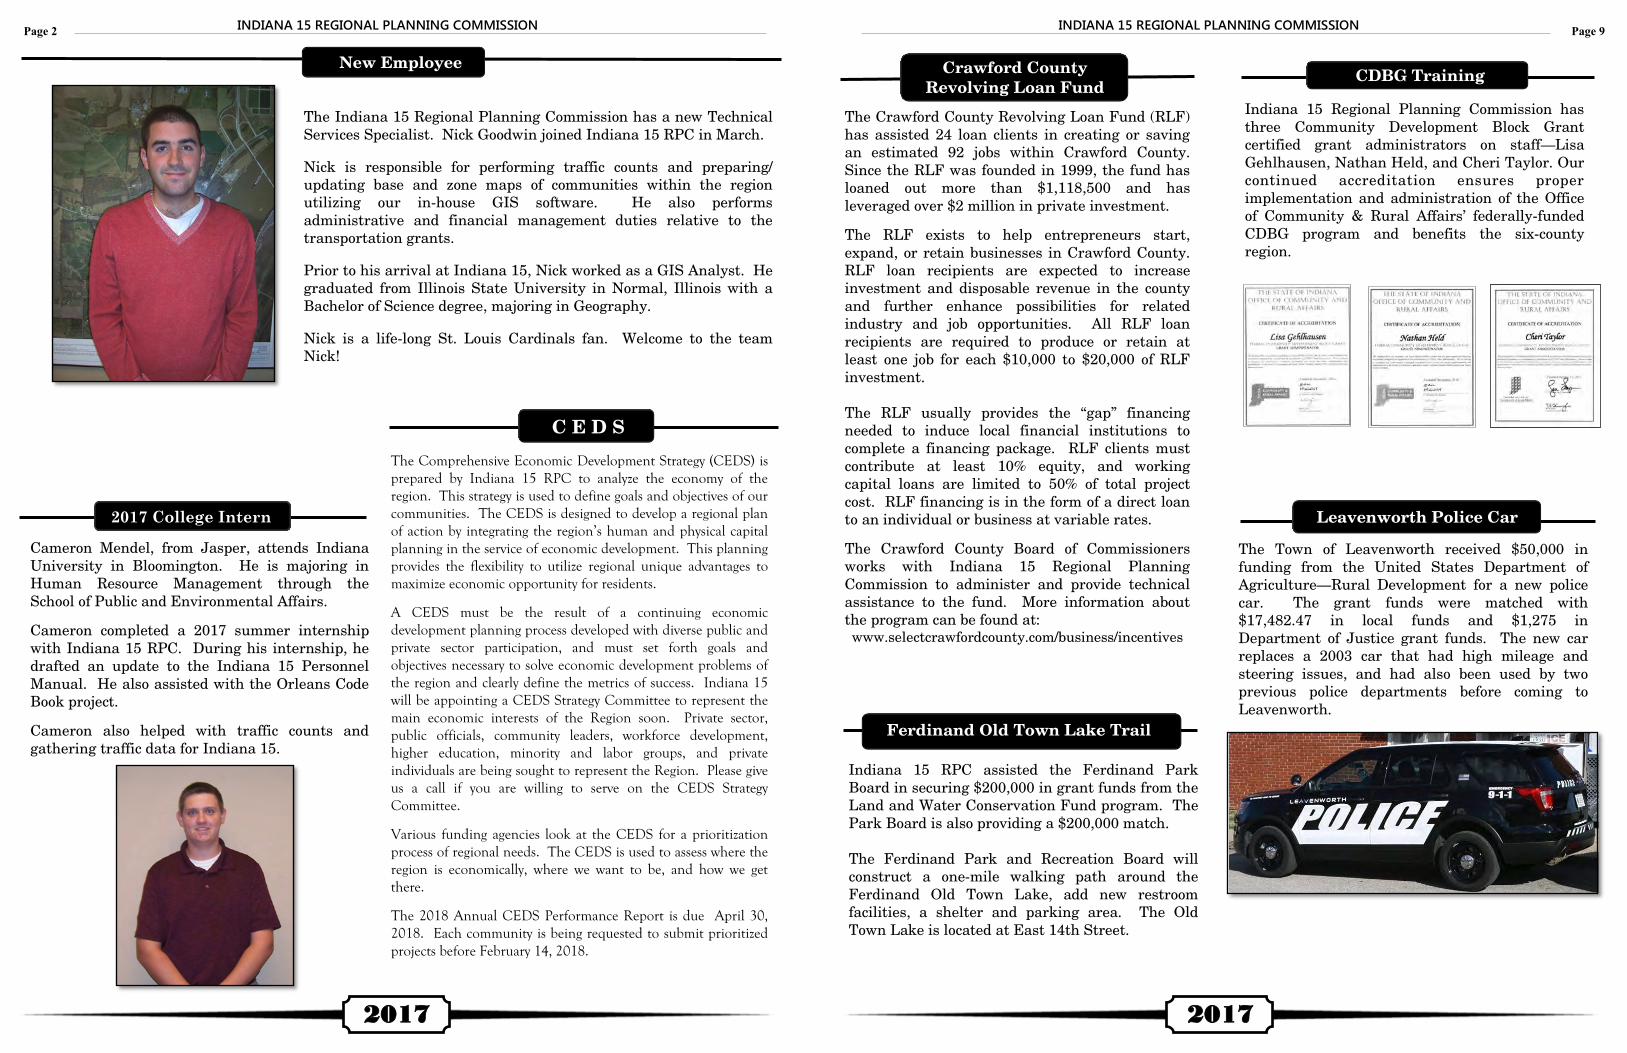
2017 College Intern
Indiana 15 Regional Planning Commission has
three Community Development Block Grant
certified grant administrators on staff—Lisa
Gehlhausen, Nathan Held, and Cheri Taylor. Our
continued accreditation ensures proper
implementation and administration of the Office
of Community & Rural Affairs’ federally-funded
CDBG program and benefits the six-county
region.
CDBG Training
Cameron Mendel, from Jasper, attends Indiana
University in Bloomington. He is majoring in
Human Resource Management through the
School of Public and Environmental Affairs.
Cameron completed a 2017 summer internship
with Indiana 15 RPC. During his internship, he
drafted an update to the Indiana 15 Personnel
Manual. He also assisted with the Orleans Code
Book project.
Cameron also helped with traffic counts and
gathering traffic data for Indiana 15.
Page 9 Page 2
The Indiana 15 Regional Planning Commission has a new Technical
Services Specialist. Nick Goodwin joined Indiana 15 RPC in March.
Nick is responsible for performing traffic counts and preparing/
updating base and zone maps of communities within the region
utilizing our in-house GIS software. He also performs
administrative and financial management duties relative to the
transportation grants.
Prior to his arrival at Indiana 15, Nick worked as a GIS Analyst. He
graduated from Illinois State University in Normal, Illinois with a
Bachelor of Science degree, majoring in Geography.
Nick is a life-long St. Louis Cardinals fan. Welcome to the team
Nick!
New Employee
2017 2017
L C E D S
The Comprehensive Economic Development Strategy (CEDS) is prepared by Indiana 15 RPC to analyze the economy of the region. This strategy is used to define goals and objectives of our communities. The CEDS is designed to develop a regional plan of action by integrating the region’s human and physical capital planning in the service of economic development. This planning provides the flexibility to utilize regional unique advantages to maximize economic opportunity for residents.
A CEDS must be the result of a continuing economic development planning process developed with diverse public and private sector participation, and must set forth goals and objectives necessary to solve economic development problems of the region and clearly define the metrics of success. Indiana 15 will be appointing a CEDS Strategy Committee to represent the main economic interests of the Region soon. Private sector, public officials, community leaders, workforce development, higher education, minority and labor groups, and private individuals are being sought to represent the Region. Please give us a call if you are willing to serve on the CEDS Strategy Committee.
Various funding agencies look at the CEDS for a prioritization process of regional needs. The CEDS is used to assess where the region is economically, where we want to be, and how we get there.
The 2018 Annual CEDS Performance Report is due April 30, 2018. Each community is being requested to submit prioritized projects before February 14, 2018.
Crawford County
Revolving Loan Fund
The Crawford County Revolving Loan Fund (RLF)
has assisted 24 loan clients in creating or saving
an estimated 92 jobs within Crawford County.
Since the RLF was founded in 1999, the fund has
loaned out more than $1,118,500 and has
leveraged over $2 million in private investment.
The RLF exists to help entrepreneurs start,
expand, or retain businesses in Crawford County.
RLF loan recipients are expected to increase
investment and disposable revenue in the county
and further enhance possibilities for related
industry and job opportunities. All RLF loan
recipients are required to produce or retain at
least one job for each $10,000 to $20,000 of RLF
investment.
The RLF usually provides the “gap” financing
needed to induce local financial institutions to
complete a financing package. RLF clients must
contribute at least 10% equity, and working
capital loans are limited to 50% of total project
cost. RLF financing is in the form of a direct loan
to an individual or business at variable rates.
The Crawford County Board of Commissioners
works with Indiana 15 Regional Planning
Commission to administer and provide technical
assistance to the fund. More information about
the program can be found at:
www.selectcrawfordcounty.com/business/incentives
INDIANA 15 REGIONAL PLANNING COMMISSION INDIANA 15 REGIONAL PLANNING COMMISSION
Leavenworth Police Car
The Town of Leavenworth received $50,000 in
funding from the United States Department of
Agriculture—Rural Development for a new police
car. The grant funds were matched with
$17,482.47 in local funds and $1,275 in
Department of Justice grant funds. The new car
replaces a 2003 car that had high mileage and
steering issues, and had also been used by two
previous police departments before coming to
Leavenworth.
Ferdinand Old Town Lake Trail
Indiana 15 RPC assisted the Ferdinand Park
Board in securing $200,000 in grant funds from the
Land and Water Conservation Fund program. The
Park Board is also providing a $200,000 match.
The Ferdinand Park and Recreation Board will
construct a one-mile walking path around the
Ferdinand Old Town Lake, add new restroom
facilities, a shelter and parking area. The Old
Town Lake is located at East 14th Street.
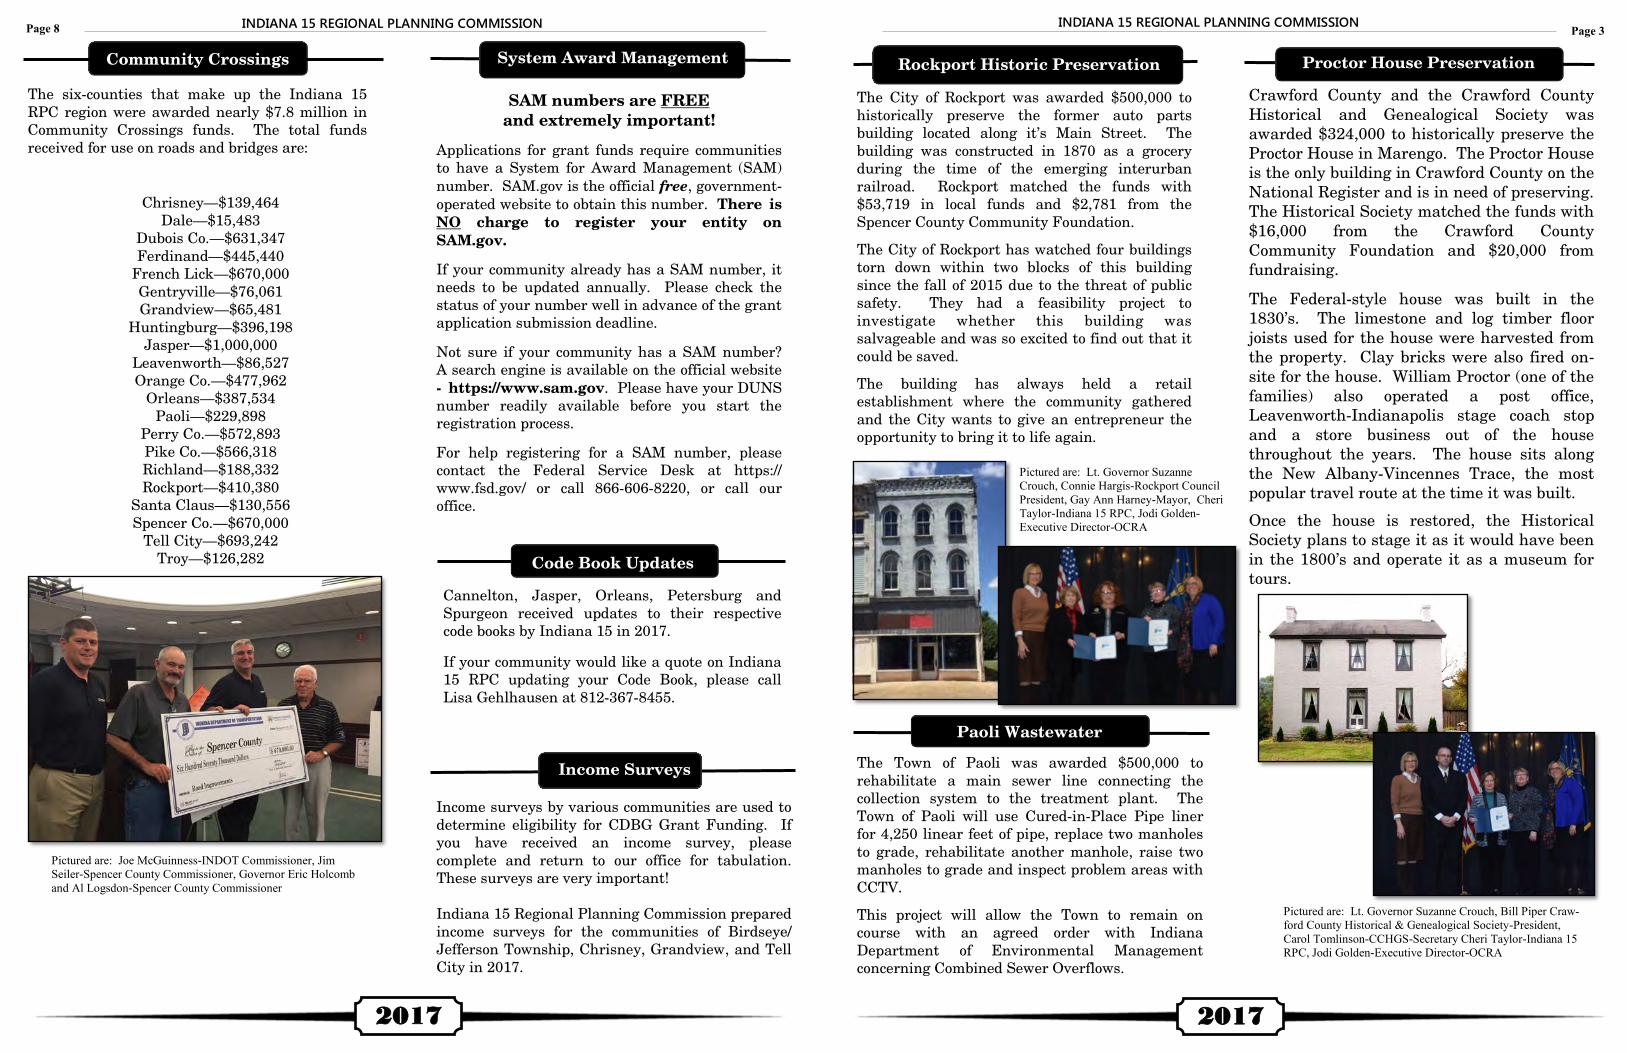
2014
Income Surveys
Income surveys by various communities are used to
determine eligibility for CDBG Grant Funding. If
you have received an income survey, please
complete and return to our office for tabulation.
These surveys are very important!
Indiana 15 Regional Planning Commission prepared
income surveys for the communities of Birdseye/
Jefferson Township, Chrisney, Grandview, and Tell
City in 2017.
Placed-Based
Investment Fund
SAM numbers are FREE
and extremely important!
Applications for grant funds require communities
to have a System for Award Management (SAM)
number. SAM.gov is the official free, government-
operated website to obtain this number. There is
NO charge to register your entity on
SAM.gov.
If your community already has a SAM number, it
needs to be updated annually. Please check the
status of your number well in advance of the grant
application submission deadline.
Not sure if your community has a SAM number?
A search engine is available on the official website
- https://www.sam.gov. Please have your DUNS
number readily available before you start the
registration process.
For help registering for a SAM number, please
contact the Federal Service Desk at https://
www.fsd.gov/ or call 866-606-8220, or call our
office.
The System Award Management
Paoli Wastewater
The Town of Paoli was awarded $500,000 to
rehabilitate a main sewer line connecting the
collection system to the treatment plant. The
Town of Paoli will use Cured-in-Place Pipe liner
for 4,250 linear feet of pipe, replace two manholes
to grade, rehabilitate another manhole, raise two
manholes to grade and inspect problem areas with
CCTV.
This project will allow the Town to remain on
course with an agreed order with Indiana
Department of Environmental Management
concerning Combined Sewer Overflows.
Proctor House Preservation
Page 8 Page 3
Crawford County and the Crawford County
Historical and Genealogical Society was
awarded $324,000 to historically preserve the
Proctor House in Marengo. The Proctor House
is the only building in Crawford County on the
National Register and is in need of preserving.
The Historical Society matched the funds with
$16,000 from the Crawford County
Community Foundation and $20,000 from
fundraising.
The Federal-style house was built in the
1830’s. The limestone and log timber floor
joists used for the house were harvested from
the property. Clay bricks were also fired on-
site for the house. William Proctor (one of the
families) also operated a post office,
Leavenworth-Indianapolis stage coach stop
and a store business out of the house
throughout the years. The house sits along
the New Albany-Vincennes Trace, the most
popular travel route at the time it was built.
Once the house is restored, the Historical
Society plans to stage it as it would have been
in the 1800’s and operate it as a museum for
tours.
2017 2017
Cannelton, Jasper, Orleans, Petersburg and
Spurgeon received updates to their respective
code books by Indiana 15 in 2017.
If your community would like a quote on Indiana
15 RPC updating your Code Book, please call
Lisa Gehlhausen at 812-367-8455.
Code Book Updates
INDIANA 15 REGIONAL PLANNING COMMISSION INDIANA 15 REGIONAL PLANNING COMMISSION
Rockport Historic Preservation
The City of Rockport was awarded $500,000 to
historically preserve the former auto parts
building located along it’s Main Street. The
building was constructed in 1870 as a grocery
during the time of the emerging interurban
railroad. Rockport matched the funds with
$53,719 in local funds and $2,781 from the
Spencer County Community Foundation.
The City of Rockport has watched four buildings
torn down within two blocks of this building
since the fall of 2015 due to the threat of public
safety. They had a feasibility project to
investigate whether this building was
salvageable and was so excited to find out that it
could be saved.
The building has always held a retail
establishment where the community gathered
and the City wants to give an entrepreneur the
opportunity to bring it to life again.
Community Crossings
The six-counties that make up the Indiana 15
RPC region were awarded nearly $7.8 million in
Community Crossings funds. The total funds
received for use on roads and bridges are:
Chrisney—$139,464
Dale—$15,483
Dubois Co.—$631,347
Ferdinand—$445,440
French Lick—$670,000
Gentryville—$76,061
Grandview—$65,481
Huntingburg—$396,198
Jasper—$1,000,000
Leavenworth—$86,527
Orange Co.—$477,962
Orleans—$387,534
Paoli—$229,898
Perry Co.—$572,893
Pike Co.—$566,318
Richland—$188,332
Rockport—$410,380
Santa Claus—$130,556
Spencer Co.—$670,000
Tell City—$693,242
Troy—$126,282
Pictured are: Joe McGuinness-INDOT Commissioner, Jim
Seiler-Spencer County Commissioner, Governor Eric Holcomb
and Al Logsdon-Spencer County Commissioner
Pictured are: Lt. Governor Suzanne Crouch, Bill Piper Craw-
ford County Historical & Genealogical Society-President,
Carol Tomlinson-CCHGS-Secretary Cheri Taylor-Indiana 15
RPC, Jodi Golden-Executive Director-OCRA
Pictured are: Lt. Governor Suzanne
Crouch, Connie Hargis-Rockport Council
President, Gay Ann Harney-Mayor, Cheri
Taylor-Indiana 15 RPC, Jodi Golden-
Executive Director-OCRA
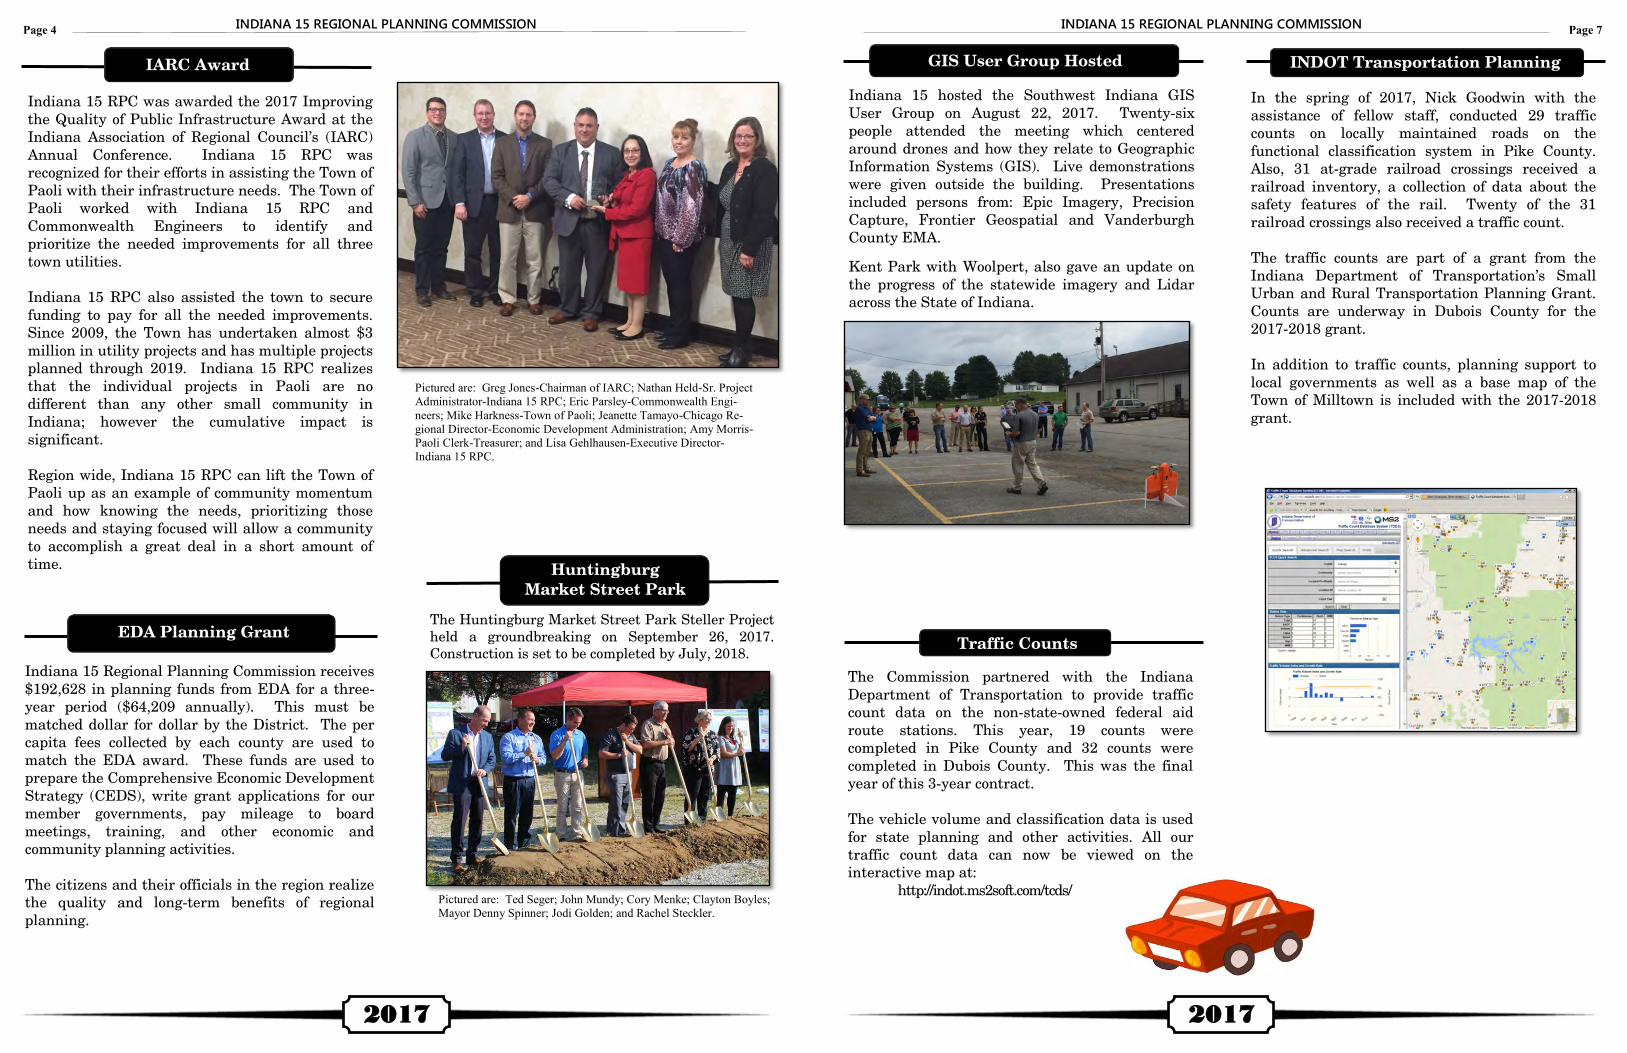
Page 7 Page 4
GIS User Group Hosted
2017 2017
Indiana 15 hosted the Southwest Indiana GIS
User Group on August 22, 2017. Twenty-six
people attended the meeting which centered
around drones and how they relate to Geographic
Information Systems (GIS). Live demonstrations
were given outside the building. Presentations
included persons from: Epic Imagery, Precision
Capture, Frontier Geospatial and Vanderburgh
County EMA.
Kent Park with Woolpert, also gave an update on
the progress of the statewide imagery and Lidar
across the State of Indiana.
Traffic Counts
The Commission partnered with the Indiana
Department of Transportation to provide traffic
count data on the non-state-owned federal aid
route stations. This year, 19 counts were
completed in Pike County and 32 counts were
completed in Dubois County. This was the final
year of this 3-year contract.
The vehicle volume and classification data is used
for state planning and other activities. All our
traffic count data can now be viewed on the
interactive map at:
http://indot.ms2soft.com/tcds/
Indiana 15 RPC was awarded the 2017 Improving
the Quality of Public Infrastructure Award at the
Indiana Association of Regional Council’s (IARC)
Annual Conference. Indiana 15 RPC was
recognized for their efforts in assisting the Town of
Paoli with their infrastructure needs. The Town of
Paoli worked with Indiana 15 RPC and
Commonwealth Engineers to identify and
prioritize the needed improvements for all three
town utilities.
Indiana 15 RPC also assisted the town to secure
funding to pay for all the needed improvements.
Since 2009, the Town has undertaken almost $3
million in utility projects and has multiple projects
planned through 2019. Indiana 15 RPC realizes
that the individual projects in Paoli are no
different than any other small community in
Indiana; however the cumulative impact is
significant.
Region wide, Indiana 15 RPC can lift the Town of
Paoli up as an example of community momentum
and how knowing the needs, prioritizing those
needs and staying focused will allow a community
to accomplish a great deal in a short amount of
time.
IARC Award
Pictured are: Greg Jones-Chairman of IARC; Nathan Held-Sr. Project
Administrator-Indiana 15 RPC; Eric Parsley-Commonwealth Engi-
neers; Mike Harkness-Town of Paoli; Jeanette Tamayo-Chicago Re-
gional Director-Economic Development Administration; Amy Morris-
Paoli Clerk-Treasurer; and Lisa Gehlhausen-Executive Director-
Indiana 15 RPC.
INDIANA 15 REGIONAL PLANNING COMMISSION INDIANA 15 REGIONAL PLANNING COMMISSION
INDOT Transportation Planning
In the spring of 2017, Nick Goodwin with the
assistance of fellow staff, conducted 29 traffic
counts on locally maintained roads on the
functional classification system in Pike County.
Also, 31 at-grade railroad crossings received a
railroad inventory, a collection of data about the
safety features of the rail. Twenty of the 31
railroad crossings also received a traffic count.
The traffic counts are part of a grant from the
Indiana Department of Transportation’s Small
Urban and Rural Transportation Planning Grant.
Counts are underway in Dubois County for the
2017-2018 grant.
In addition to traffic counts, planning support to
local governments as well as a base map of the
Town of Milltown is included with the 2017-2018
grant.
EDA Planning Grant
Indiana 15 Regional Planning Commission receives
$192,628 in planning funds from EDA for a three-
year period ($64,209 annually). This must be
matched dollar for dollar by the District. The per
capita fees collected by each county are used to
match the EDA award. These funds are used to
prepare the Comprehensive Economic Development
Strategy (CEDS), write grant applications for our
member governments, pay mileage to board
meetings, training, and other economic and
community planning activities.
The citizens and their officials in the region realize
the quality and long-term benefits of regional
planning.
The Huntingburg Market Street Park Steller Project
held a groundbreaking on September 26, 2017.
Construction is set to be completed by July, 2018.
Huntingburg
Market Street Park
Pictured are: Ted Seger; John Mundy; Cory Menke; Clayton Boyles;
Mayor Denny Spinner; Jodi Golden; and Rachel Steckler.
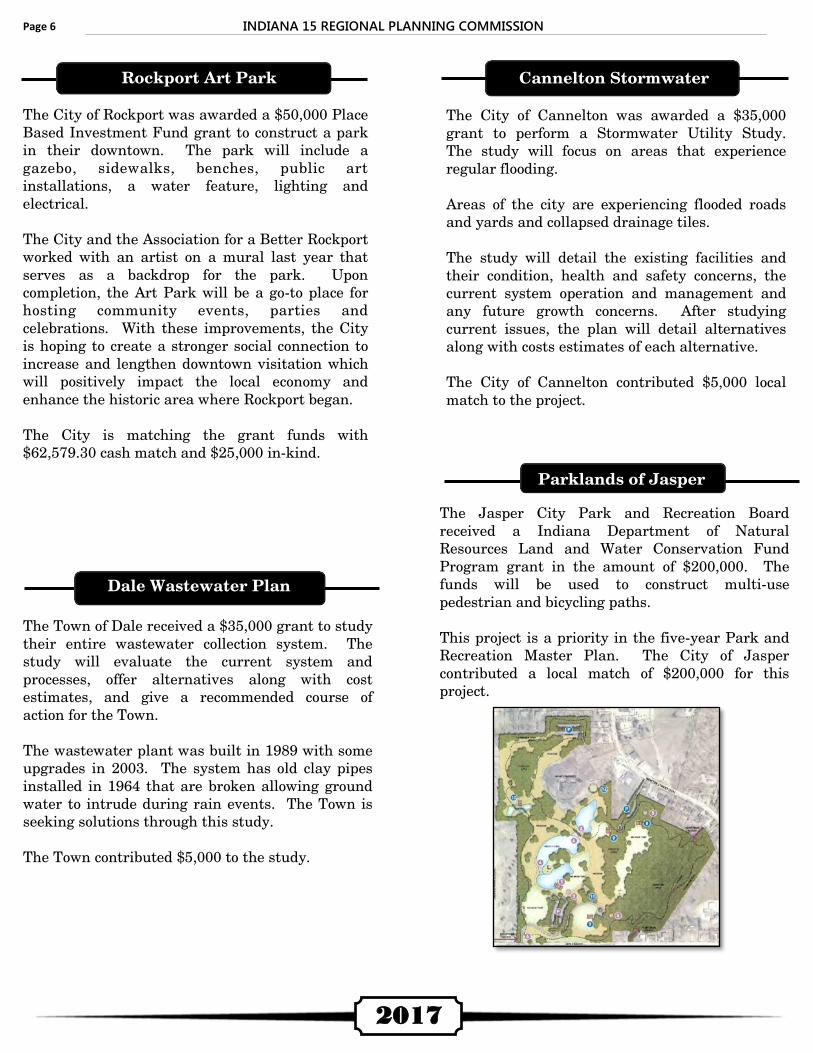
Page 6
The City of Rockport was awarded a $50,000 Place
Based Investment Fund grant to construct a park
in their downtown. The park will include a
gazebo, sidewalks, benches, public art
installations, a water feature, lighting and
electrical.
The City and the Association for a Better Rockport
worked with an artist on a mural last year that
serves as a backdrop for the park. Upon
completion, the Art Park will be a go-to place for
hosting community events, parties and
celebrations. With these improvements, the City
is hoping to create a stronger social connection to
increase and lengthen downtown visitation which
will positively impact the local economy and
enhance the historic area where Rockport began.
The City is matching the grant funds with
$62,579.30 cash match and $25,000 in-kind.
Rockport Art Park
2017
Parklands of Jasper
The Jasper City Park and Recreation Board
received a Indiana Department of Natural
Resources Land and Water Conservation Fund
Program grant in the amount of $200,000. The
funds will be used to construct multi-use
pedestrian and bicycling paths.
This project is a priority in the five-year Park and
Recreation Master Plan. The City of Jasper
contributed a local match of $200,000 for this
project.
The City of Cannelton was awarded a $35,000
grant to perform a Stormwater Utility Study.
The study will focus on areas that experience
regular flooding.
Areas of the city are experiencing flooded roads
and yards and collapsed drainage tiles.
The study will detail the existing facilities and
their condition, health and safety concerns, the
current system operation and management and
any future growth concerns. After studying
current issues, the plan will detail alternatives
along with costs estimates of each alternative.
The City of Cannelton contributed $5,000 local
match to the project.
Cannelton Stormwater
INDIANA 15 REGIONAL PLANNING COMMISSION
Dale Wastewater Plan
The Town of Dale received a $35,000 grant to study
their entire wastewater collection system. The
study will evaluate the current system and
processes, offer alternatives along with cost
estimates, and give a recommended course of
action for the Town.
The wastewater plant was built in 1989 with some
upgrades in 2003. The system has old clay pipes
installed in 1964 that are broken allowing ground
water to intrude during rain events. The Town is
seeking solutions through this study.
The Town contributed $5,000 to the study.
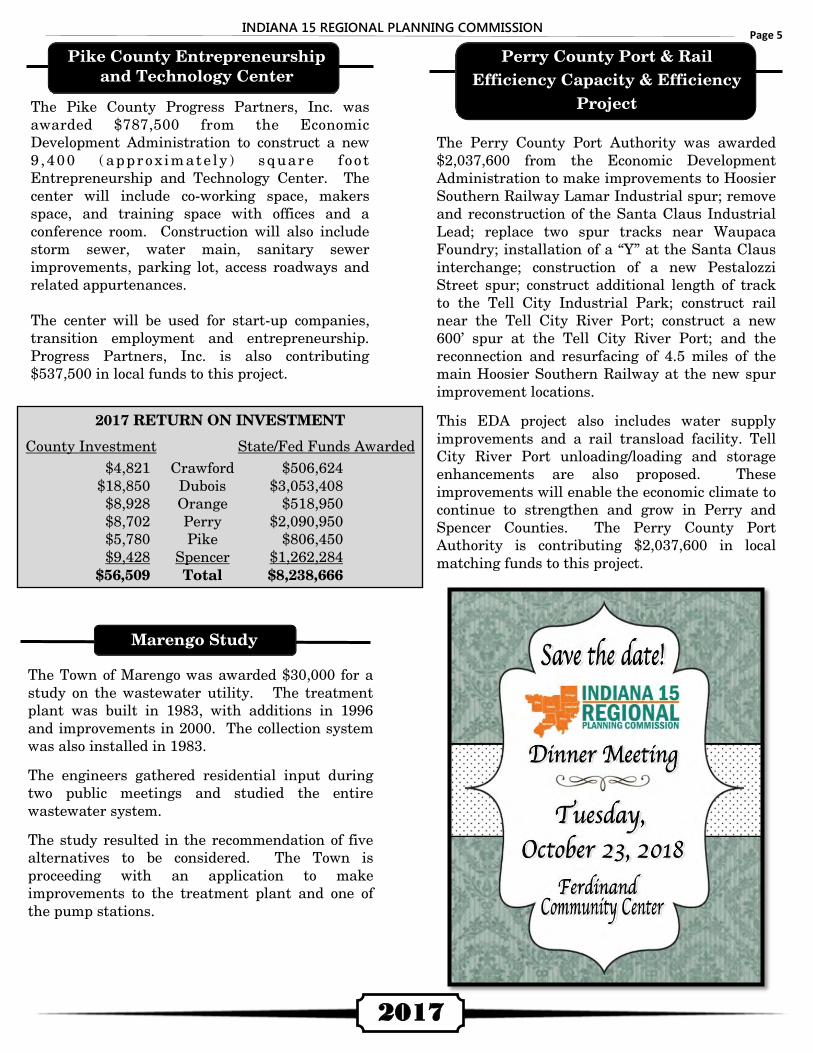
Page 5
2017
INDIANA 15 REGIONAL PLANNING COMMISSION
Marengo Study
The Town of Marengo was awarded $30,000 for a
study on the wastewater utility. The treatment
plant was built in 1983, with additions in 1996
and improvements in 2000. The collection system
was also installed in 1983.
The engineers gathered residential input during
two public meetings and studied the entire
wastewater system.
The study resulted in the recommendation of five
alternatives to be considered. The Town is
proceeding with an application to make
improvements to the treatment plant and one of
the pump stations.
The Perry County Port Authority was awarded
$2,037,600 from the Economic Development
Administration to make improvements to Hoosier
Southern Railway Lamar Industrial spur; remove
and reconstruction of the Santa Claus Industrial
Lead; replace two spur tracks near Waupaca
Foundry; installation of a “Y” at the Santa Claus
interchange; construction of a new Pestalozzi
Street spur; construct additional length of track
to the Tell City Industrial Park; construct rail
near the Tell City River Port; construct a new
600’ spur at the Tell City River Port; and the
reconnection and resurfacing of 4.5 miles of the
main Hoosier Southern Railway at the new spur
improvement locations.
This EDA project also includes water supply
improvements and a rail transload facility. Tell
City River Port unloading/loading and storage
enhancements are also proposed. These
improvements will enable the economic climate to
continue to strengthen and grow in Perry and
Spencer Counties. The Perry County Port
Authority is contributing $2,037,600 in local
matching funds to this project.
Perry County Port & Rail
Efficiency Capacity & Efficiency
Project
Pike County Entrepreneurship
and Technology Center
The Pike County Progress Partners, Inc. was
awarded $787,500 from the Economic
Development Administration to construct a new
9 ,400 (approx im ate ly ) square f oo t
Entrepreneurship and Technology Center. The
center will include co-working space, makers
space, and training space with offices and a
conference room. Construction will also include
storm sewer, water main, sanitary sewer
improvements, parking lot, access roadways and
related appurtenances.
The center will be used for start-up companies,
transition employment and entrepreneurship.
Progress Partners, Inc. is also contributing
$537,500 in local funds to this project.
2017 RETURN ON INVESTMENT
County Investment State/Fed Funds Awarded
$4,821
$18,850
$8,928
$8,702
$5,780
$9,428
$56,509
Crawford
Dubois
Orange
Perry
Pike
Spencer
Total
$506,624
$3,053,408
$518,950
$2,090,950
$806,450
$1,262,284
$8,238,666