Embed Size (px)
Citation preview

Proceedings of the 63rd Gulf and Caribbean Fisheries Institute November 1 - 5, 2010 San Juan, Puerto Rico
Comprehensive Census of the Marine Commercial Fishery of Puerto Rico, 2008
DANIEL MATOS-CARABALLO1* and JUAN J. AGAR2
1Puerto Rico Department of Natural and Environmental Resources, Fisheries Research Laboratory,
P.O. Box 3665, Mayaguez Puerto Rico 00680. *[email protected]. 2NOAA Fisheries , Southeast Fisheries Science Center, 75 Virginia Beach Drive, Miami Florida 33149 USA.
ABSTRACT Puerto Rico’s Law 278 of November 29th, 1998, also knows as Puerto Rico’s Fishing Law, define that a full time commercial
fisher is a person that receive 50% or a higher income from the fishing activity. A part-time commercial fisher (CF) receives less
than 50% of their income from the fishing activity. The Regulation 6768, knows as Puerto Rico’s Fishing Regulation, established that a part time CF has a minimum of 20% of the total income must be produce by his fishing activity. The mentioned definitions
required that the CF must submit their IRS documents to receive a commercial fisher license. Most CF did not like to reports their
income to the IRS because they belief that they are poor, thus they do not have the income to contribute to the local government. During 2004-07, the DNER Commercial Fisheries Statistics Program (CFSP) observed that many CF left the fishing activity. Also
they observed that many CF were active but they did not obtained the commercial fishing license. The mentioned facts conclude the
necessity to realize this fishing census. During January-November 2008, the CFSP personnel realized a fishing census at the 42 coastal Puerto Rico’s municipalities.
The census goals were: obtain data to determine the total number of active CF, socioeconomic information, number and length of
active commercial vessels, number of motors and the motor’s horsepower and determine the number and type of active gears. All
goals were reached and results and discussed in this paper.
KEY WORDS: Commercial, fishers, fishery, socioeconomics, Puerto Rico
Censo Comprensivo de la Pesquería Marina Comercial de Puerto Rico, 2008 La Ley 278 de Noviembre 29 de 1998, conocida como Ley de Pesca de Puerto Rico, define un pescador comercial (PC) a
tiempo completo como el que obtiene un 50% o más de sus entradas por la pesca. Un PC a tiempo parcial quien obtiene menos de un 50% de sus entradas de la pesca. El Reglamento 6768, conocido como Reglamento de Pesca de Puerto Rico, establece que un PC
tiempo a parcial obtiene un mínimo de 20% de sus entradas de la pesca. Estas definiciones establecen que los PC tienen que someter
sus Planillas de Contribución sobre Ingresos al Departamento de Hacienda. La mayoría de los PC no les gusta hacer este requisito por entender que son muy pobres y que no tienen entradas para pagar al gobierno local. Durante el 2004-07, personal del Programa
de Estadísticas Pesqueras Comerciales (PEPC) del DRNA observó que muchos PC se retiraron de la actividad pesquera. También
observaron que muchos PC se mantenían activos en la pesquería pero no adquirieron su licencia. Los mencionados factores concluyen la necesidad de realizar un censo pesquero en Puerto Rico.
Durante Enero – Noviembre de 2008, personal de PEPC realizaron un censo de pesca comercial en los 42 municipios
costaneros de Puerto Rico. Los objetivos del censo fueron: obtener datos para determinar el número total de PC activos, informa-ción socioeconómica, número y longitud de embarcaciones, número de motores y sus caballos de fuerza, y determinar el número y
tipo de artes. Todos los objetivos fueron alcanzados y son discutidos en este reporte.
PALABRAS CLAVE: Comercial, pescador, pesquería, socioeconómica, Puerto Rico
Le Recensement Complet de la Pêcherie Commerciale Marine de la Porto Rico, 2008 MOTS CLÉS: Commerciale, poissons, pêcherie, Porto Rico
INTRODUCTION
Puerto Rico’s fishery is artisanal. Important features of Puerto Rico’s (PR) fishery include multispecies nature,
multigear competition, population pressure, technological change and often the absorption of unemployed or part time
labors. The fishery resource of Puerto Rico have to date shown the classic signs of overfishing which include reduced total
landings, declining catch per unit effort, shifts to catch per unit effort, shifts to catch smaller sized individuals and recruit-
ment failures (Matos-Caraballo 2005).
PR’s Law 278 of November 29th, 1998, also knows as Puerto Rico’s Fishing Law, define that a full time commercial
fisher is a person that receive 50% or higher of this income from the fishing activity. A part-time commercial fisher
receives less than 50% of their income from the fishing activity. The Regulation 6768, knows as PR’s Fishing Regulation,
established that a part-time commercial fisher has a minimum of 20% of the total income must be produce by his fishing
activity. The mentioned definitions required that the commercial fishes must submit their IRS documents to receive a
commercial fisher license. Most commercial fishers did not like to report their income to the IRS because they think they
are poor and do not have the income to contribute to the local government. Also, many fishers retired by age of 62 or
higher were very angry, because they are not supposed to pay taxes. Even though the PR’s Department of Agriculture
concedes that the full-time fishers will have a tax deduction of 90% of their income, most fishers were angry with the
definitions. In March 12, 2004, the Department of Natural and Environmental Resources (DNER) implemented the
Regulation 6768, that describes the commercial fisher definitions and many closed seasons for various species of fish and

Page 100 63rd Gulf and Caribbean Fisheries Institute
shellfish, marine reserves, banning the beach seine, and
other important management actions to conserve the
overexploited fishing resources. The fishers were very
angry with the DNER because of these conservation
actions (Matos-Caraballo In press) that resulted in a
decreased of fishing activity. Immediately the Commercial
Fisheries Statistics Program (CFSP) port sampler and the
author received hostility from many commercial fishers.
Also, many commercial fishers stopped to submit their
landings to CFSP. Many others did not cooperate with
port sampler collection of the biostatistics data. However,
the hostility decreased during 2006. During 2004 - 2007,
CFSP observed that many commercial fishers left the
fishing activity for many reasons.
The mentioned facts confirm the necessity to realize
this fishing census. The complexity of Puerto Rico’s
fishery and to the continuing and constant changes in the
fishing communities, assessing the status of the artisanal
fishery in Puerto Rico is necessary through a census
(Matos Caraballo et. al. 2005).
Information on the universe of commercial fishing in
Puerto Rico (number of active commercial fishers, vessels,
gears, and socioeconomic data) will provide fishery
managers with precise and accurate data. This data will
enable them to formulate measures that will be applicable
to the current operations of the fishery and result in a better
management of the fishery resources. Thus, the objective
of this project is to describe the universe of the commercial
fishery in Puerto Rico in order to help fishery managers in
the formulation of the management strategies. The goals of
this project are:
i) Collect data to determine the total number of
active commercial fishers,
ii) Obtain socioeconomic information (for example
to classify each commercial fishers in his
corresponding category as: full time or part time),
iii) Collect data to determine the number and length
of active commercial vessels, number of motors
and the motor’s horsepower, and
iv) Collect data to determine the number and type of
active gears.
MATERIALS AND METHODS
Personnel from the CFSP realized the census.
Three port samplers, two statiscs clerk and principal
investigator interviewed all fishers. They visited the 42
coastal municipalities and the 92 fishing centers (landing
areas), to identify and interview every active commercial
fisherman (Figure 1). The coastal municipalities of
Quebradillas, Manatí and Toa Baja do not have commer-
cial fishing activity during 2007 - 2008.
The CFSP personnel organize commercial fishers
meetings in every fishing center. All the commercial
fishers that attended were interviewed. The fishers that did
not assist to the meeting were identified. Later, the port
samplers tried to reach these fishers at the dock or at their
home. Identified commercial fishers that did not cooperate
were accounted. The CFSP personnel tried to get the
information about the vessels and gears from other fishers
that know the elusive person. Every included questions to
determine the following information:
i) Fishing center
ii) Fisher name
iii) Nickname
iv) Age
v) Fishing Center
vi) Municipality where the fisher lives
vii) Postal address and telephone number
viii) License number
ix) Number of hours spent weekly in a fishery. Less
than 40 hours was considered a part time fisher-
man. Forty or more hours were considered full
time.
x) Fishing association belonging to.
xi) Number of vessels used in the commercial fishery
xii) Length of each vessel (feet)
xiii) Horsepower for every motor
xiv) Fishing categories (e.g. reef fish, pelagic, deep
snapper, bait)
xv) Catch handling (gutted, iced, nothing)
xvi) Fish marketing: sells the catch to a fishing
association, private fishing enterprise, a restau-
rant, own business, walking)
Figure 1. Distribution of fishing centers in Puerto Rico.

Matos-Caraballo, D. and J.J. Agar GCFI:63 (2011) Page 101
xvii)Number and description by gear type (e.g. fish
trap, trammel net, hand line).
xviii)Socioeconomic information (number of depend-
ents, highest education reached, socioeconomic
problems that affected his business).
xix) How fishers feel about the status of the fishery
resource compared with the past (better, same,
worst)
All the information was entered in Microsoft Access
format. Later the information was analyzed using Mi-
crosoft Excel. The results were compared with previous
census, to note if a significant difference or trends occurred
during the last census of 2002.
The individual fishers and/or business that cooperated
giving information to this project are protected by Mag-
nuson Act’s confidential regulations and PR’s Fishing
Law. On the other hand, this census is the first that
includes interviews to the commercial marine ornamental
fishers.
Table 1. Commercial Fishers by Category, Average Age and Municipality during 2008.
Location Captain Helper Full Time Part Time Average Age (years) Total Fishers NORTH 129 33 105 57 44 162 Isabela 9 4 4 9 51 13 Quebradillas 0 0 0 0 0 0 Camuy 6 3 3 6 48 9 Hatillo 3 1 0 4 48 4 Arecibo 27 3 25 5 49 30 Barceloneta 6 0 6 0 60 6 Manatí 0 0 0 0 0 0 Vega Baja 13 2 9 6 48 15 Vega Alta 8 1 8 1 57 9 Dorado 11 1 5 7 52 12 Toa Baja 0 0 0 0 0 0 Cataño 10 0 9 1 56 10 San Juan 19 9 23 5 60 28 Carolina 1 0 1 0 62 1 Loíza 8 4 5 7 50 12 Río Grande 2 0 2 0 59 2 Luquillo 6 5 5 6 53 11 EAST 125 30 122 34 55 155 Fajardo 37 6 37 7 52 43 Ceiba 3 0 3 0 67 3 Naguabo 19 8 21 6 54 27 Humacao 4 0 4 0 61 4 Yabucoa 2 0 2 0 51 2 Maunabo 10 1 10 1 49 11 Culebra 11 1 1 11 57 12 Vieques 39 14 44 9 45 53 SOUTH 168 65 176 56 48 233 Patillas 4 0 0 3 42 3 Arroyo 4 0 4 0 66 4 Guayama 12 3 11 4 39 15 Salinas 25 11 25 11 55 36 Santa Isabel 2 2 3 1 57 4 Juana Díaz 15 4 15 4 49 19 Ponce 22 1 17 6 57 23 Peñuelas 13 4 13 4 52 17 Guayanilla 10 8 13 5 53 18 Guánica 21 14 27 8 42 35 Lajas 40 18 48 10 54 58 WEST 216 102 252 66 50 318 Cabo Rojo 105 45 136 14 46 150 Mayaguez 33 10 25 18 54 43 Añasco 8 6 9 5 47 14 Rincón 40 23 46 17 41 63 Aguada 6 5 9 2 56 11 Aguadilla 24 13 27 10 55 37 TOTAL 638 230 655 213 49 868
Page 102 63rd Gulf and Caribbean Fisheries Institute
RESULTS
A total of 868 commercial fishers were interviewed by
the port samplers (Table 1). A 75% (655) of persons
mentioned that they were full time fishers and 25% (219)
mentioned that they were part time fishers (Table 1). The
west coast had the highest number of fishers by coast, with
318 (37%). The municipality that reported more fishers
was Cabo Rojo, with 150 (Table 1). A total of 74% were
captains (owner of his own fishing vessel) and 26% were
helpers. A total of 528 commercial fishers (60%) men-
tioned that they belong to fishing association.
Average age for all PR’s commercial fishers was 49
years old (Table 1). The older average age by coast was
the east coast, with 55 years old (Table 1). On the other
hand, the younger average age by coast was the south and
north coast with 44 years old (Table 1). The municipality
of Ceiba reported the older population of fishers, with 67
years old and Guayama had the younger with an average
of 39 years old.
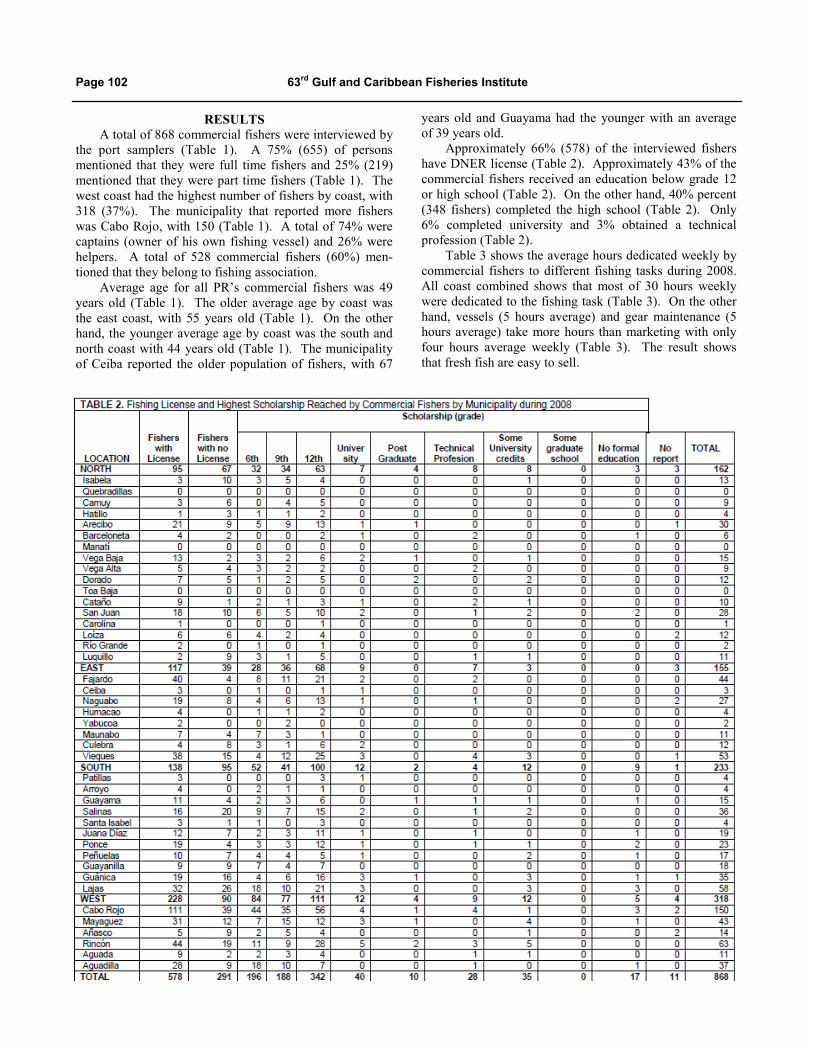
Approximately 66% (578) of the interviewed fishers
have DNER license (Table 2). Approximately 43% of the
commercial fishers received an education below grade 12
or high school (Table 2). On the other hand, 40% percent
(348 fishers) completed the high school (Table 2). Only
6% completed university and 3% obtained a technical
profession (Table 2).
Table 3 shows the average hours dedicated weekly by
commercial fishers to different fishing tasks during 2008.
All coast combined shows that most of 30 hours weekly
were dedicated to the fishing task (Table 3). On the other
hand, vessels (5 hours average) and gear maintenance (5
hours average) take more hours than marketing with only
four hours average weekly (Table 3). The result shows
that fresh fish are easy to sell.

Matos-Caraballo, D. and J.J. Agar GCFI:63 (2011) Page 103
Table 3. Average Hours Dedicated Weekly by Commercial Fishers to different fishing tasks by Coast during 2008.
Coast Fishing Vessel
Maintenance Gears
Maintenance Marketing Total Interviews
North 30 4 4 4 162
East 32 4 4 4 155
South 31 5 6 5 233
West 33 7 7 4 318
Average for all coasts combined 32 5 5 4 868
Table 5. Percentage of Marine Fishing Locations Where Commercial Fishers Target their Catches During 2008. (Note: Because is
a mult-gear fishery, the fishers are able to fish in more than one category)
Location Shore Shelf Break Continental Shelf Oceanic Waters Total of
Interviews
North 66 83 90 46 162
East 48 67 84 60 155
South 22 45 93 25 233
West 14 52 71 27 318
Percentage of all Coasts Combined 32 59 82 36 868
Table 6. Percentage of How Commercial Fishers Manage of the Fish and Shellfish Catch by Coast
during 2008.
Coast Gutted and Ice
Gutted with no Ice Whole in Ice
Whole without
Ice
Conserve alive in a Water
Compartment Total of
Interviews
NORTH 10 0 72 13 2 162
EAST 8 3 53 13 21 155
SOUTH 37 28 19 17 0 233
WEST 24 41 15 19 5 318 Puerto Rico all Coasts
Combined 22 23 34 16 6 868
Page 104 63rd Gulf and Caribbean Fisheries Institute
Puerto Rico’s fishery is multigear and multispecies.
The commercial fishers target different categories of fish
and shellfish and most of them fish more than one
category. Table 4 shows percentage of fishers target
categories by coast and all coast combined. Reef fishes
were targeted by 77% of PR commercial fishers, 56%
targeted deep water snapper, 49% lobster, 42% pelagic
fishes, 33% conch and 31% bait (Table 4). Ornamental
fishery was targetet by 2% (Table 4).
Due to the multispecies and multigear fishery, it was
observed that most fishers exploited two or more fishing
locations. A total of 32 % of the fishers interviewed fished
on the shore, 82 % on the continental shelf, 59 % on the
shelf edge and 36 % on oceanic waters (Table 5).
PR’s commercial fishers manage the catch in different
ways. Table 6 shows the percentage of catch management
by coast and for all coast combined. Whole fish in ice was
used by 34% of all commercial fishers, 22% used gutted
and Ice (Table 6). Gutted and no ice was used by 23% of
the total fishers, and whole without ice was used by 16%.
In the west coast 41% of the fishers used gutted without ice
(Table 6).
Commercial fishers would use two or more ways to
market their catch. Fishing marketing results by coast is
shown in Table 7. All coast shows that approximately
70% of the commercial fishers sell the whole catch using
one market choice. On all coasts Fish Houses Fishing
Association and Walking were the most used ways to sell
the catch (Table 7).
A total of 670 active fishing vessels were reported in
Puerto Rico during 2008 (Table 8). From this 53% were
constructed since 1990 to 2008. A total of 49.7% of the
fishing vessels has a length of 20 - 29 feet (Table 8),
followed by 47.6% fishing vessels from 10-19 feet length.
A total of 72% of the total vessels interviewed were
constructed of fiberglass. The horse power (HP) average
for motors in Puerto Rico was 80.1 HP.
Fishing vessels electronic equipment and haul
equipment reported by coast are shown in Table 9. Results
of fishing gear by coast are shown in tables 9. A total of
10,244 hook and line units were reported (Table 9). Hand
lines were 56% of total hook and line gears, followed by
troll lines to catch pelagic fishes was 13%, and the
anchored bottom lines was 11% to fish deep water snapper.
Most commercial fishers used hook and line gear to obtain
their catch. On the other hand, net categories reported
1,712 units (Table 9). The beach seine was banned since
March 12, 2007, due to this fact data from this gear was
not asked in this census. From the total net gears, lobster
trammel nets were 44%, gill nets were 21 %, fish trammel
nets were only 6 %, and the cast nets were 29 % . Trap
categories reported 9,597 units (Table 9C). From the total
of traps the reef fish trap was 47 % , lobster trap was 41%
and 12% was deep water snapper traps (Table 9). On the
other hand 142 commercial fishers practiced skin diving
and 246 practiced SCUBA diving. A total of 775 SCUBA
tanks, 375 harpoons or spears, and 322 snares to catch
lobster, were reported (Table 9). Twelve of the mentioned
divers were dedicated to practice commercial ornamental
fishery, the equipment reported by them were the orna-
mental hand nets and slurp guns (Table 9).
The average number of crew per fishing vessel in the
PR’s commercial fishery was 2 (Table 10). The income
produced by commercial fishing activity was grouped by
100% - 75; 74 - 50%; 49% - 20%; and less than 20%
(because the PRFR established that a commercial fisher
has a minimum 20%). A total of 80% of the interviewed
commercial fishers mentioned that they produced an
income greater than 50% from their fishing activity (Table
10).
The census asked commercial fishers about their
perception of the fishery status in 2008, compared with the
period when they began to fish. Only 8% of the commer-
cial fishers reported that they had the perception that the
fishery resources are better than in the past (Table 11).
However, 45% of commercial fishers thought that fishery
status is the same (Table 11). On the other hand, 46% of
the commercial fishers thought the fishery resources are
worst than in the past (Table 11). A total of 28.5% fishers
think that the main reason that affected the worst fishery
resource status was pollution (Table 11), followed by
12%;fishers that think habitat destruction was responsible
(Table 11). Only 9% of commercial fishers think that
overfishing is the main reason for the fishery resources
declination (Table 11). In other causes that resulted in a
worst status of fishery resource, 13% commercial fishers
mentioned global warming and 10% mentioned that the
DNER fishing regulations (Table 11).
The census asked commercial fishers to report the
three most significant socioeconomic problems. The
CFSP personnel conferred with all fishers to report their
opinion in this report. Due to the mentioned fact, socioec-
onomic problems noted were grouped by different
categories and subcategories (Table 11). Most of the
census interviews occurred when the cost of gasoline and
diesel were around $4.00/gallon, thus 59.7% of the fishers
mentioned the operational cost was very high and resulted
in a decrease of fishing trips (Table 11). The next category
most reported was the DNER Fishing Regulations 6768, a
total of 35% of the fishers noted this category. The
subcategory of whole Fishing Regulations was noted by
150 fishers, the subcategory of Closed Season was noted
by 109 fishers. Marketing was noted by 146 fishers,
especially the subcategory of Weak Economy, resulted in
Slow Sales noted by 9% of the fishers.
DISCUSSION
In 1931, a total of 1,403 active commercial fishers
were reported in Puerto Rico (Jarvis 1932). The number of
active commercial fishers, vessels, and motors were very
similar for the census of 1988, 1996 and 2002, although a
decreased was observed in 2008 census show in Figure 2

Matos-Caraballo, D. and J.J. Agar GCFI:63 (2011) Page 105
North Coast East
Coast
Marketing 100 % -
75 % 74 % - 50 %
49 % - 25 % < 24 %
100 % - 75 %
74 % - 50 %
49 % - 25 % < 24 %
Fishing Association 26 10 0 0 21 4 0 0
Restaurants 2 0 1 0 3 2 2 0
Fish House 15 0 0 0 24 13 0 0 Owner of Fish House 5 0 0 0 1 0 0 0
Walking 28 10 0 2 28 11 4 0
South Coast
West Coast
Marketing 100 % - 75 %
74 % - 50 %
49 % - 25 % < 24 %
100 % - 75 %
74 % - 50 %
49 % - 25 % < 24 %
Fishing Asociation 28 1 0 0 20 3 0 0
Restaurants 0 1 0 0 9 1 1
Fish House 25 2 0 0 40 1 0 0 Owner of Fish House 6 0 0 0 4 0 0 0
Walking 36 2 2 0 23 2 1 0
Table 7. Percentage of How Commercial Fishers Marketing Their Catch During 2008.
Table 8. Vessel characteristics of commercial fishing fleet.
North Coast
East Coast
South Coast
West Coast
Puerto Rico N
Number of fishing vessels 134 124 176 236 670 868 Number of gasoline and diesel engines 132 134 181 255 702 868 Average length of primary vessel (ft) 18.8 21.0 19.2 19.9 19.7 624 Average total engine propulsion of primary vessel (hp)* 78.2 103.1 64.9 80.1 80.1 642 Average crew size 1.9 2.0 1.9 1.9 1.9 847
Percentage of primary vessels whose length lies between (ft) < 10 0 1.8 0.6 0 0.5 624 10-19.9 55.0 16.5 55.8 52.5 47.6 624 20-29.9 45.0 75.2 43 44.8 49.7 624 30-39.9 0 6.4 0.6 2.3 2.1 624 > = 40 0 0 0 0.5 0.2 624
Percentage of primary vessels being built between < = 1969 7.7 5.3 4.3 1.4 4.1 583 1970-1979 16.3 17.3 13.6 21.7 17.7 583 1980-1989 17.8 21.3 25.3 17.5 20.2 583 1990-1999 25.6 34.7 27.2 28.6 28.3 583 > = 2000 32.6 21.3 29.6 30.9 29.7 583
Percentage of primary vessels that have hulls made of Aluminum 1.5 0 1.2 0.4 0.8 641 Fiberglass 72 82.9 48.8 62.3 64.7 641 Wood 9.8 0.8 15.7 18.2 12.5 641
Fiberglass and wood 16.7 16.3 34.3 18.6 21.8 641

Page 106 63rd Gulf and Caribbean Fisheries Institute
Table 9. Number of primary vessels, fishing gear and equipment by coastal regions.
North Coast East Coast South Coast West Coast Puerto Rico N
Total lines 2,493 2,266 2,704 2,781 10,244 868
Total Skin/Scuba 42 118 91 108 359 868
Total traps 419 2,886 3,508 2,774 9,597 868
Total nets 318 340 543 511 1,712 868 Global Positioning System (GPS) 47 60 32 120 259 868
Depth finders 62 37 40 75 214 868
Fish finders 60 60 35 41 196 868
Radios 62 29 40 70 201 868 Emergency Position Indicating Radio Beacons (EPIRB) 0 6 5 24 35 868
Cellular phones 94 95 72 132 393 868
Electric reels 89 24 35 69 217 868
Hydraulic reels 1 8 10 17 36 868
Winches 22 41 26 37 126 868
Snares 23 101 78 120 322 868
Spears 52 85 136 102 375 868
Tanks 74 192 204 305 775 868
Gaffs 82 68 256 172 578 868
Baskets 12 70 82 111 275 868
Slurp guns 0 1 0 2 3 868
Table 10. Average Crew per fishing vessel and Number of Commercial Fishers by their Percentage of Income
Produced from fishing Activity by Coast in 2008.
% of Income Produced by Fishing Activity Total of Interviews
Average Crew per Vessel 100-75 % 74-50 % 49-20 %
Less than 20 % NO REPORT
NORTH 2 45 48 43 25 1 162
EAST 2 91 17 26 20 25 155
SOUTH 2 139 65 16 15 0 233
WEST 2 230 62 18 10 5 318 Puerto Rico all Coasts Combined 2 505 192 103 70 31 874
(Matos-Caraballo et. al. 1989, Matos-Caraballo 1997,
Matos-Caraballo 2005). The decreased of active commer-
cial fishers during 1996 – 2002 occurred mostly because of
the overfishing resources (Matos Caraballo, 2007). On the
other hand, the 2008 census shows another decreased in
the number of only 868 active commercial fishers. This is
the lowest number of active fishers in Puerto Rico since
1931. This event occurred primarily because of the fishing
regulations established in 2004. The law 278 of November
29th, 1998, and the PR’s Fishing Regulation 6768 estab-
lished definitions for commercial fishers and required the
every commercial fisher must submit the finance records to
Hacienda Department (Puerto Rico’s IRS). Many fishers
claimed to CFSP personnel that they do not have a fishing
license because they did not want to do their taxes to keep
receiving the PR’s welfare and health care. Most of the
mentioned persons were part-time fishers. Another
requirement to commercial fisher is to monthly complete
the sales tax report. Most persons did not like to write
these reports, so they did not have the fishing license.
Another burden for part-time fishers is that they have to
pay taxes for the fishing income, while full-time fishers
have tax free for 90% of their fishing income. On the other
hand, most of full-time fishers have fishing licenses
because of the Agriculture Department financial assistance
and because of the DNER Rangers pressure. Another fact
that incentive part-time fisher to move to other jobs was
the implementation of the fishing regulations as closed
seasons during the spawning aggregations that produced
high profits and the minimum legal sizes. These regula-
tions decrease the income of all fishers, but were most
sensitive to part-time fishers. The percentage of full-time

Matos-Caraballo, D. and J.J. Agar GCFI:63 (2011) Page 107
Table 11. Perceptions about the biological and socio-economic condition of the fishery by region.
North Coast
East Coast
South Coast
West Coast
Puerto Rico N
Perception of fish stock condition (%)
Better off than other years 2.6 16.9 3.5 11.0 8.4 843 Same than other years 41.7 35.9 48.7 49.2 45.4 843 Worse off than other years 55.8 47.2 47.8 39.7 46.1 843
Reasons for the declining condition of fish stocks (%) Overfishing 10.5 5.8 9.4 9.7 9.1 868
Pollution 48.8 31.6 29.2 16.0 28.5 868
Habitat destruction 15.4 23.2 12.0 5.7 12.3 868 Other reasons 24.1 21.3 30.0 31.1 27.8 868 Other reasons for the declining condition of fish stocks
Regulations 17.9 39.4 37.1 41.1 36.1 241 Weather and ocean conditions 46.1 24.2 35.7 26.3 31.9 241
Climate change 5.1 9.1 22.9 15.1 14.9 241
User conflicts 7.7 9.1 4.3 9.1 7.5 241 1.03 6.1 0 2.0 3.3 241 Coastal development
Main socio-economic issues High fuel costs 79.6 43.2 56.2 60.14 59.7 868 High fishing costs (excluding fuel) 15.4 20.0 26.6 27.7 23.7 868
Regulations 28.4 22.6 37.8 42.4 35.0 868 Weather and ocean condi-tions 15.4 10.3 20.6 9.8 13.8 868 Coastal development 13.6 1.9 6.9 4.1 6.2 868 User conflicts 1.23 2.6 2.6 2.5 2.3 868 High cost of life 15.4 13.5 4.7 3.8 7.9 868 Low fish prices and slow markets 14.2 25.2 5.11 5.0 10.4 868
0
200
400
600
800
1000
1200
1400
1600
1800
2000
1988 1996 2002 2008Number of Fishermen, Vessels and
Motors
Year
Figure 2. Number of Active Commercial Fishermen, Vessels, and Motors Reported in Puerto Rico's Fishing Census between 1988-2008
FISHERMEN
VESSELS

Page 108 63rd Gulf and Caribbean Fisheries Institute
fishers increased from 64 % in 2002 (Matos-Caraballo et
al. 2007) to 75% in 2008. This fact is important because
the reduction in active commercial fishers occurred mostly
in part-time fishers. West coast (324) fishers and the
municipality of Cabo Rojo (150 fishers) continued being
the most active coast and municipality, respectively. Also,
it is important to mention that 64% of the fishers had
fishing licenses. During most of 2008, the cost of
gasoline was over $4.00/gallon, reducing the fishery
activity, and resulting in less active commercial fishers.
For the 2002 census, it was observed that although
595 less active commercial fishers moved to other jobs, 3.5
millions of pounds have been reported per year in Puerto
Rico since 1995 - 2002, meaning that fishery resource
continue on high pressure during this period (Matos-
Caraballo 2007). On the contrary, for 2008 fishery census
fewer fishers and also landings reported decreased to 1.3
millions pounds. This occurred because of the fishing
regulations (e.g. closed seasons) and for the decreased
number of commercial fishers. The number of fishing
vessels (Figure 2) and fishing gear decreased during the
same period (Figure 3). Thus, it is concluded that the
fishing pressure decreased during 2002 - 2008.
Average ages per coast show that the distribution of
active commercial fishers varies from 44 to 57 years. The
average age for all Puerto Rico’s commercial fishers was
49 years. That means that most of commercial fishers are
relatively old persons. The east coast had 253 active
commercial fishers in 2002 (Matos-Caraballo et al. 2005),
decreasing to only 155 in 2008. The average age for the
east coast fishers was 55 years old. The commercial
fishery in the east coast has been reducing dramatically
during the last six years. If a significant number of young
fishers do not enter to work in this profession in the next
10 years for Puerto Rico, the commercial fishery activity
would disappear. On the other hand, in my experience I
learned that every successful recreational fisher will sell
his catch. In Puerto Rico, the number of recreational
fishers was estimated in 200,000. Thus, it is very probable
that many successful recreational fishers will enter into the
commercial fishery in the following years. However, the
DNER and NOAA must continue to monitoring this
activity in the coming years.
Tropical marine waters have high biodiversity. Due to
this fact, Puerto Rico’s fishery is multispecies and multi-
gear. The census data confirms that most fisher in Puerto
Rico use two or more fishing locations and two or more
fishing types and gears. Geographical site influences the
fishing location and fishing type. For example Aguada and
Aguadilla have a small continental shelf, the oceanic
waters are close to the coast, and thus the fishers from
those municipalities practice more pelagic fisheries. The
north coast has approximately six months of strong surges
that difficult vessel fishing trips, thus they practice more
inshore fishing. The continental shelf contains the first
two species most landed in pounds, lobster and conch, and
also contains all reef fish species. The use of the conti-
nental shelf was 70% in 1996, 83% in 2002 and 82% in
2008.. The shelf break decreased from 43% in 1996 to
19% in 2002, increased to 59% in 2008. Since 1992, the
CFSP mentioned that 90% of silk snapper Lutjanus
vivanus, was caught before reaching the minimum size of
sexual maturation, 410 mm Fork Length (Matos-Caraballo
2007). The fishing regulations established during 2004-
2007, a minimum legal size. Since 2007, the minimum
legal size was changed to closed season (October –
December). CFSP biostatistics data analysis of deepwater
snapper species including the silk snapper shows that the
resource started to improve since 2004. It is expected that
the closed season will help the recovery of silk snapper.
However, queen snapper is also fished heavily at the shelf
break. In 1996, a 46% of active commercial fishers
exploited the oceanic waters, in 2002 48%, and in 2008
only 35%. The high cost of the fuel and the fishing
regulations were responsible for the decrease in this
practice. The use of the shore decreased from 31% in
1996 to 17% in 2002, increasing to 32% in 2008. Again,
the high costs of fuel stimulate more fishers to fish on
shore.
The target species shows that 77% of the fishers catch
reef fishes, however, the CFSP shows that the most
targeted species during the last five years were the lobster
($6.00/pound) and conch ($4.00/pound). A total of 72%
of all fishers interviewed targeted at least one of these
species, mostly because the fishers know that the cost per
pound for these two species increases their earnings.
Trammel nets and fish traps were targeting lobsters for the
past five years, decreasing the pressure on reef fishes.
The same reason explained why 58% of the fishers
targeted the deep water snapper ($3.50/pound). The
market first class reef fish category cost only $1.60/
pound. Only 56% of commercial fishers used ice to
healthy conserve their catch. Most SCUBA divers and
pelagic fishers from the northwest mentioned that their
catch is keeping alive when they arrive to the dock. On
the other hand, the reef fishes and deep water snapper
fishers mentioned that without ice it was very difficult to
conserve the catch in healthy conditions (31%).
Data collected during this census, suggested that
fishers learned to better market their catch. They spent an
average of only four hours marketing their catch. Most
fish buyers mentioned to CFSP personnel how difficult it
is to keep fishers selling constantly to the same fish buyer.
The problem is that one fish buyer increases the price, and
the fishers immediately sell the catch to this person. Also,
most fishers use two or more marketing strategies to
increase their income. However, during 2008, approxi-
mately 66% of the fishers sold their catch to fishing
associations, fish houses, or restaurants. Approximately
36% of the fishers sold their catch walking, but they
mentioned that they had a number of customers that are
easy to sell their catch. The percentage of fishers selling

Matos-Caraballo, D. and J.J. Agar GCFI:63 (2011) Page 109
by walking decreased from 41% in 1995 - 1996 to 28% in
2002, to 36% in 2008. The percentage of fishers that sold
their catch to their own fish store changed from 13% in
1995 - 1996, to 3% in 2002, increasing to 6% in 2008.
Many fishers claim that many restaurants are using fish
products from USA, Brazil, or Mexico.
Significant changes occurred in the fishing gear used
in Puerto Rico during 1988 - 2008 (Figure 43). Lines
decreased for the first time since 1988 census (Figure 3).
Nets and divers were very similar since 2002 - 2008
(Figure 3).
On the other hand, traps decreased dramatically since
1996, when 15,877 were reported to only 9,597 in 2008
(Figure 3). The fish trap was the most used gear in PR
during the 1960s until 1982, when this gear reported
approximately 50 - 70% of total landings (Juhl and Suárez
-Caabro 1973, Matos-Caraballo In press). During the
2007 - 2008, traps reported only 15% of the total landings.
Trap fishers mentioned many reasons for this decrease.
First, commercial fishers think that fish trap’s high cost
limited the number of users. Second, trap fishers claim
that many divers steal the traps underwater. Also, other
trap’s fishers steal traps belonging to their peers. The fish
trap stealing issue has resulted in fisher fights offshore,
and during the last three years approximately 10 diver’s
vessel were burned in criminal actions. Divers suspected
that these criminal actions were organized by trap fishers,
which believe that they steal their trap’s catch. However,
no one has been accused for the mentioned acts, and all
divers claim that they did not steal from traps. On the
other hand, the fish traps caught an average of 15 pounds/
trap haul during late 1960s, and for the last years was an
average of 1 pound/trap haul (Matos-Caraballo 2007).
Another important reason for the decrease mentioned by
some fishers, and confirmed by the CFSP data, is the
overfishing reef fish resource.
The number of nets reported 1996 were similar to
2008. However, the beach seine has been banned since
March 12th, 2007, due to this fact there is no mention of
this gear included in this census. Even though, many
fishers request reconsideration to use the gear again. They
recommend increasing the seine mesh size and/or the
DNER established specific locations for the use of this
gear. On the other hand, many fishers mentioned that this
gear destroys many juvenile species, such as mackerels,
jacks, and snappers, thus the ban must continue. Other
fishers recommend the elimination of the trammel net,
because this gear is submerged for weeks to catch lobster.
During the period, many fish species are caught and
discarded, because when fisher checked the trammel only
twice a day, so the fish die and are discomposed when the
nets are pulled. The Fishery Regulation 6768, mentions
that the trammel net must be submerged, but the owner
must be near to the gear. Since March 2007, the beach
seine is legally permitted by the DNER. The size of the
beach seine net mesh increased from 0.5 in to 2 inches. In
future census, information about the beach seine must be
collected.
A total of 2,505 more line units were reported in 2002
census than in 1995 - 1996 (Matos-Caraballo 1997, Matos-
Caraballo et al. 2005). On the contrary, the line category
decreased by 1,295 units in 2008 compared with the 2002
fishing census. This decrease is explained by the reduction
of 286 fishers since the 2002 fishing census. Most fishers
use lines, so that explains the reduction. Also, the part-
time fishers that abandoned the commercial fishery use
mainly lines. However, the line category is the most
effective and efficient gear to catch commercial fish such
as snappers, groupers, tunas, dolphin fish, and mackerels.
The divers (skin and SCUBA) were 36 % in 1996, and
in 2002 increased to 53% of the total fishers (Matos-
Caraballo et al. 2005). In 2008, divers were 41% of the
total active commercial fishers. Due to the decrease in the
fishery resource, the fishers were obligated to use more
active gears to improve their catches. The divers’ main
targets are the lobster and conch. During 2004 - 2007,
lobster and conch were the most reported landed species in
Puerto Rico. Divers also have another advantage, they can
fish when the weather hinders other fishing activities.
Also, it has been observed that younger commercial fishers
are divers.
The divers category included the ornamental fishers.
Previous to the year 2001, when the DNER established a
special permit for this activity and the implementation of
the Regulation 6768 in 2004, the ornamental fishery was
practiced with very little government intervention (Matos-
Caraballo et al. 2008). After the mentioned period, they
did have fishing licenses, did have to report their landings
to the DNER/CFSP, and also needed a special permit to
practice ornamental fishing. Because previous to the 2004
the CFSP had no contact with ornamental fishers, thus they
were not interviewed in the 1988, 1996, and 2002 fishing
census. They started to submit their reports in 2003, and
they have been cooperative to CFSP. They also were very
friendly and cooperative with the census personnel.
Approximately 15 ornamental fishers were interviewed. In
the group were high school and university students who
practice the ornamental fishery as a part-time activity,
using their profit to pay school tuition. Some ornamental
fishers only practices skin diving, mostly in the northwest
rocky beaches. The group mentioned that they practice
conservation and claim to the DNER to add more species
to be legally caught for this business. They also mentioned
that the operational costs were too high, and importation of
products from the Indo-Pacific makes the business very
competitive. They mentioned that probably every Puerto
Rico’s pet shop that sells Caribbean ornamental fishes has
one or two illegal ornamental fishers. They think that
probably 20 or more illegal ornamental fishers are active.
The census personnel tried to identify these fishers,
interviewing pet shops owners, but they said that they
bought from USA dealers. The census personnel recom-

Page 110 63rd Gulf and Caribbean Fisheries Institute
mend to DNER Rangers a more aggressive surveillance
and enforcement to characterize this illegal activity.
The average crew per fishing vessel in the PR’s
commercial fishery was two. It is known that divers
fishing mostly has a crew composed of three fishers. That
means that many fishers practice fishing activity alone.
The fishing activity contains a personal high risk, thus
fishing alone can have fatal results. During the fishing
census, at least two lone commercial fishers died. On the
other hand, a total of 80% of the interviewed commercial
fishers produced an income higher by 50% from other
fishing activity. That means 80% of the interviewed
fishers consider themselves full-time commercial fishers,
although 75% described themselves as full-time fishers.
The commercial fishers perception about the fishery
status in 2008, shows that only 8% of them think the
resource is better, 45% have the perception that it is the
same compared with the period when they began to fish.
On the other hand, 46% of the fishers reported that they
thought the fishery resources are poorer than in the past.
Twenty-eight percent of the interviewed fishers mentioned
that the main reason that affected fishery resources is
coastal pollution. On the other hand, 12% of the fishers
think that habitat destruction was mainly responsible.
Although they are correct in these conclusion, unfortunate-
ly most commercial fishers did not recognize that they over
-exploit the fishing resources. Just 9% of commercial
fishers think that overfishing is one of the main reasons for
the poor status of fishery resources. Compared with 2002,
when a total of 22% of the interviewed fishers mentioned
that over-fishing was one of the main responsible factors
for poor fishing resources, this represented a decrease of
10%. The data clearly show that Puerto Rico fishery has
been overfished since the 1980s (Matos-Caraballo 2007).
Thus, the DNER must work harder to educate commercial
fishers about overfishing resources. If they accepted the
overfishing factor they will cooperate more with the
conservationist fishing regulations. On the other hand,
resulted very interesting observed that 15% of commercial
fishers mentioned global warming as an important factor
that affected the fishery results. They are correct because
global warming cause coral reef bleaching and temperature
changes and more hurricanes that affected the fishery
resources. Hernandez, et al. (In press) describes that in
2005, a coral bleaching event affected PR’s east coast and
the Islands of Vieques and Culebra, resulting in the coral
mass mortality. Hernandez et al. (In press) also mentioned
that coral bleaching is direct a result from global warming.
The 2005 PR’s coral bleaching event declined the cover of
coral reef living tissue around 60% - 95%. This event
reduced the coral reef habitat. Also it is noted that global
warming was a result of pollution. Is interesting to observe
the contrast that how the fishers were well educated about
global warming and uneducated about overfishing. The
DNER has the challenge to educate commercial fishers
about fishing regulations. One example that shows the
mentioned need is that 36% of the interviewed commercial
fishers mentioned that the DNER fishing regulations were
responsible for the worst status of the fishery resource.
This group claims that the fishery resource is worst
because of the closed seasons and minimum legal sizes.
Regulations to conserve fishery resource can not be
responsible to make worst the fishery resource. Again, the
DNER must develop an educational program to commer-
cial fishers.
0
2000
4000
6000
8000
10000
12000
14000
16000
18000
1988 1996 2002 2008
Nu
mb
er
of
Ge
ars
Year
Figure 3. Number of Lines, Tramps, Nets, and Divers Reported in Puerto Rico During 1988-2008
LINESTRAMPSNETSDIVERS

Matos-Caraballo, D. and J.J. Agar GCFI:63 (2011) Page 111
Commercial fishers reported many serious socioeco-
nomic problems that affected them (Table 11); I will
comment on the most significant. The main socioeconom-
ic problem mentioned by 60% of interviewed fishers, was
the high fuel cost that affected significantly their business.
Because the cost of the gasoline was around $4.00/gallon
during the period of the census interview period, they
mentioned they had to reduce the fishing trips. When the
fuel cost is high in Puerto Rico, all other products prices
also increase. Fishing lines, hooks, nets, wire to build
traps, and the cost of air to refill SCUBA tanks increases.
The cost of food, electricity, and water service increases
too. In addition to the mentioned high cost, fishers
claimed that because of the slow economy they cannot
increase the fishing catch cost per pound. Even though
they did not increase the price per pound, commercial
fishers mentioned that the fish and shellfish sales were too
slow. Although that the fuel price decreased for the last
interviews to around $2.00 per gallon, the operation cost
continued to be considered high by fishers. The economy
continues to be considered weak. Thirty-five percent of
the interviewed fishers mentioned that the DNER Fishing
Regulations 6768, reduce their fishing activity resulting in
a decreased of their income (e.g. closed seasons, minimum
legal size, etc.). This is a good sign, because three years
ago probably 75% of the fishers thought that way.
However, many fishers recognized today that closed
seasons resulting in larger fishes and heavier catch. Those
fishers support stronger enforcement to protect the closed
season species. This is another good sign that the commer-
cial fishers have accepted the benefits of the conservation
actions in the DNER Fishing Regulations. On the other
hand, the CFSP observed a decrease in landings reported
from 2004 - 2006 (Matos-Caraballo 2007). Matos-
Caranballo (In press) mentioned that the closed seasons
will reduce the fishing activity and help to conserve fishery
resources. Also, it is expected that the fishing regulations,
such as closed seasons, will help to recover the Puerto
Rico’s overfished resources. Also, in the regulations
issues, commercial fishers mentioned the license category
was noted as a socioeconomic problem. Fishers claim the
DNER fishing license process was too slow. They also
mentioned they sent fishing applications to DNER and
after 3 - 6 months they did not receive communication
from DNER. Others mentioned they would like to
eliminate the IRS section and/or the minimum percentage
to be a commercial fisher. Another DNER activity that
was mentioned by 8% of the commercial fishers was the
ranger’s interventions. They mentioned that many times
they were boarded twice a day or three or more times per
week. Commercial fishers claim that 90% of the interven-
tion occurred for safety inspection (e.g. fire extinguisher,
sailing lights, and Bengals lights) not due to fishing
regulation. They recommend to the DNER to establish a
form signed by the ranger and deliver to the commercial
fisher after a safety inspection. If other rangers want to
inspect the boat again, the fisher just shows the inspection
form, so the rangers do not have repeated the inspection in
a couple of months. However, the rangers are free to
inspect the fishing catch and the gear at any time.
CONCLUSION
The number of fishers in Puerto Rico did not show a
significant change since 1931 - 1996. However, 595 less
active commercial fishers were found in 2002, compared
to 1996 census. Then in the 2008 census, reported 874
commercial active fishers that mean 295 less fishers
compared with 2002. This is the lowest number since
1932. The mentioned reduction occurred for four main
reasons:
i) The CFSP, NOAA Fisheries have shown strong
evidence that support the overfishing problem in
Puerto Rico. Decrease in landings, catch of
juvenile individuals, change in catch composition
and change in gear used. Many fishers left the
commercial fisheries because of the limited
resources.
ii) Also as many fishers claim there is evidence of
habitat degradation and pollution that affected
negatively the fishery resource (NOAA’s Plan
Development Team 1990). A total of 46% of
commercial fishers in Puerto Rico mentioned that
the fishery resource is worst that in the past. As a
result of pollution, fishers mentioned the global
warming effect that results in coral bleaching and
coral mortality on the Puerto Rico east coast,
Vieques and Culebra. These facts affected the
fishery resources.
iii) The implementation of the Puerto Rico’s Fishing
Regulations 6768 that contains closed seasons for
many species, minimum legal sizes for other
species and requires the Hacienda Department
financial records. All those regulations discour-
age many fishers to continue in the commercial
fishers.
iv) During 2008 the fuel cost increased dramatically.
This fact resulted in a decrease in commercial
fishing effort because fishers reduce their fishing
trips. However, they were not able to increase
the fish and shellfish cost per pound because of
the slow economy.
The implementation of Law 278 of November 28th,
1998 and the Puerto Rico’s Fishing Regulations 6768 will
help in the conservation of fishery resources. The
immediate result was a decrease in number of fishers
resulting in a decline of fishing effort on the resources
(decrease in active fishers, boats and fishing gears). Also,
fishers mentioned that the closed seasons improve the
protected species. They recommend more surveillance to
protect species during the closed seasons.

Page 112 63rd Gulf and Caribbean Fisheries Institute
The DNER must develop outreach and education to
commercial fishers to teach the importance of the conser-
vation regulations. For example, any person before
receiving his fishing license should participate in fishing
conservation training. In this training, the person will
receive education to conserve and know the fishing
regulations. Also, the DNER rangers must develop a
commercial fishing vessel safety inspection sheet to
eliminate and/or diminish the multiple inspections to the
same vessel in a short period (daily or weekly) by different
rangers. However, the DNER can inspect the fishing catch
every day for all fishing vessels.
Puerto Rico’s commercial fisher’s average age was 49
years old. Due to the old age of most commercial fishers,
the future of this activity is uncertain. However, it is
expected that a significant number of successful recreation-
al fishers will enter into the commercial fishery to replace
the retired commercial fishers. Puerto Rico’s commercial
fishery will continue to be a good business, 80% of those
interviewed reported.
ACKNOWLEDGEMENT I want to express my deep gratitude to all that made possible this
fisheries census. To NOAA Fisheries, Caribbean Fishery Management
Council and Puerto Rico’s Department of Natural and Environmental
Resources (DNER) that provided the funds. Also, I want to acknowledge Port Samplers Jesús León, Héctor Y. López, and Luis Rivera, who
collected most of the the data. To Statistics Clerks Alabaiz Mercado and
Lucía T. Vargas, whom assisted port samplers to interview commercial fishers on the field, enter the data in computers and helped to create the
tables and figures of this report. To Aida Rosario, Director of FRL and
to Dr. Juan Agar, NOAA Fisheries for their valuable contributions to this
report. To Graciela García Moliner and María de los Angeles Irizarry
from the CFMC for their valuable help in the administrative issues.
Finally, I want to acknowledge all the commercial fishers that participated during the data collection; without their support this project couldn’t been
a success.
LITERATURE CITED Hernandez, E. and R. Hernandezet. [In press]. Global warming and
Caribbean coral reefs collapse: The case of star corals (Montastraea
annularis and M. Faveolata) in Puerto Rico. Proceedings of the 11th Coral Reef International Symposium, Fort Lauderdale, Florida,
USA. July, 2008.
Jarvis, N.D. 1932. The Fisheries of Puerto Rico. U.S. Department of Commerce, Bureau of Fisheries, Investigational Report. 13:1-41.
Juhl, R. and J. Suárez Caabro. 1973. Fish pot Fisheries in Puerto Rico.
Agricultural and Fisheries Contributions. Area of Special Services. Department of Agriculture Volume 4. 18 pp.
Matos-Caraballo, D. 2009. Lessons Learned from the Puerto Rico’s
Commercial Fishery, 1988-2008. Proceedings of the Gulf and
Caribbean Fisheries Institute 61:123-128.
Matos-Caraballo, D. 1997. Puerto Rico Fishery Census, 1995-96.
PuertoRico DRNA Final technical report to NOAA/NMFS Saltonstall-Kennedy Program. January 1997. 21 pp.
Matos-Caraballo, D. 2005. Status of the Fishery in Puerto Rico, 1990-
1993. Proceedings of the Gulf and Caribbean Fisheries Institute 47:217-235.
Matos-Caraballo, D. 2007. Puerto Rico’s Small Scale Commercial
Fisheries Statistics 2004-07. DNER Final Report to NOAA Fisheries. 229 pp.
Matos-Caraballo, D. and A. Mercado-Porrata. 2008. Decription of the ornamental fishery in Puerto Rico, 1997-2005. Proceedings of the
Gulf and Caribbean Fisheries Institute 60:97-107
Matos-Caraballo, D., M. Cartagena-Haddock, and N. Peña-Alvarado. 2005. Comprehensive Census of the Marine Commercial Fishery of
Puerto Rico. Proceedings of the Gulf and Caribbean Fisheries
Institute 56:97-110. Matos- Caraballo, D. and Z. Torres Rosado. 1989. Comprehensive
Census of the fishery of Puerto Rico. 1988. Technical Report.
CODREMAR 1(3): 1-55 NOAA Plan Development Team. 1990. The potential of marine
Reserves for free reef fish management in the U.S. Southern
Atlantic. NOAA Technical Memorandum NMFS-SEFC-261 1: 65-91