Embed Size (px)
Citation preview
Comprehensive Benefit-Cost Analysis
November 8, 2017
Vince Bernardin, PhD

Overview
3RSG
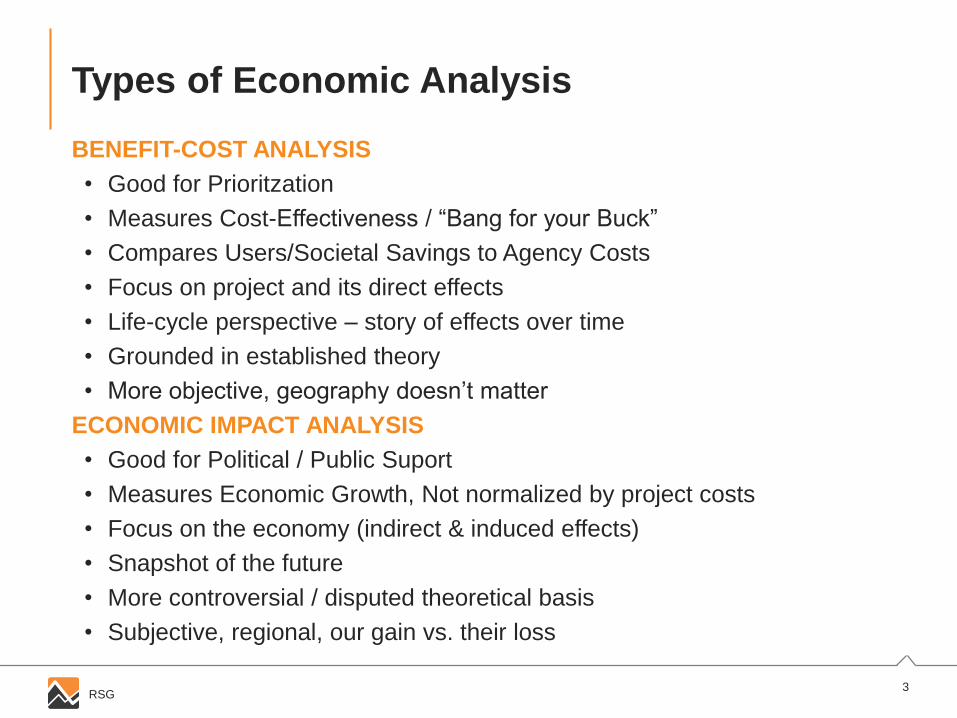
Types of Economic Analysis
BENEFIT-COST ANALYSIS
• Good for Prioritzation
• Measures Cost-Effectiveness / “Bang for your Buck”
• Compares Users/Societal Savings to Agency Costs
• Focus on project and its direct effects
• Life-cycle perspective – story of effects over time
• Grounded in established theory
• More objective, geography doesn’t matter
ECONOMIC IMPACT ANALYSIS
• Good for Political / Public Suport
• Measures Economic Growth, Not normalized by project costs
• Focus on the economy (indirect & induced effects)
• Snapshot of the future
• More controversial / disputed theoretical basis
• Subjective, regional, our gain vs. their loss
4RSG
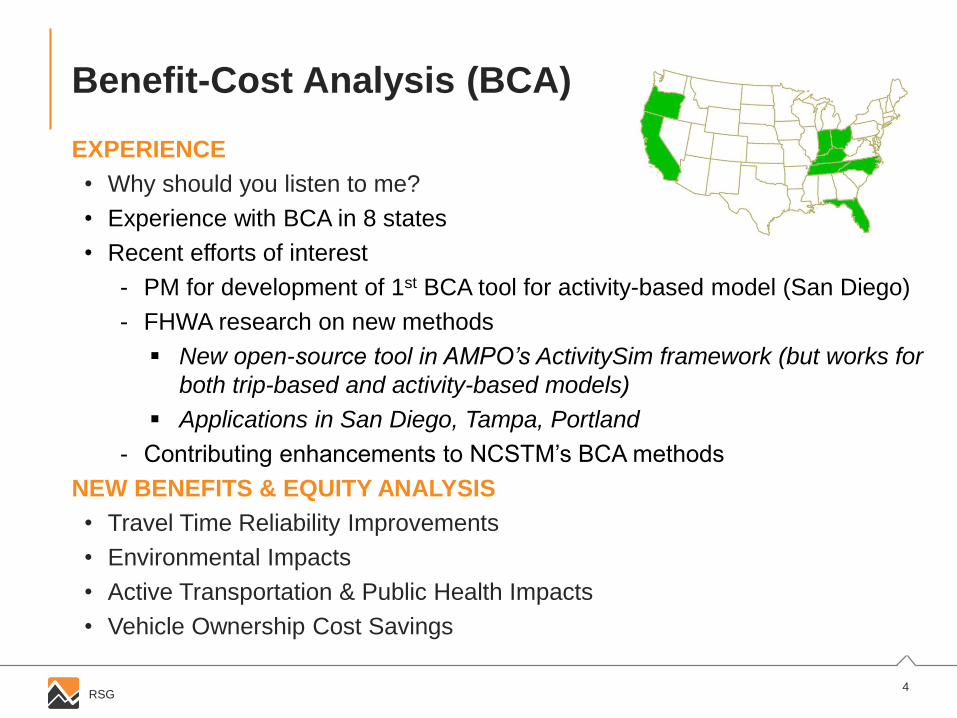
EXPERIENCE
• Why should you listen to me?
• Experience with BCA in 8 states
• Recent efforts of interest
- PM for development of 1st BCA tool for activity-based model (San Diego)
- FHWA research on new methods
New open-source tool in AMPO’s ActivitySim framework (but works for
both trip-based and activity-based models)
Applications in San Diego, Tampa, Portland
- Contributing enhancements to NCSTM’s BCA methods
NEW BENEFITS & EQUITY ANALYSIS
• Travel Time Reliability Improvements
• Environmental Impacts
• Active Transportation & Public Health Impacts
• Vehicle Ownership Cost Savings
Benefit-Cost Analysis (BCA)
5RSG
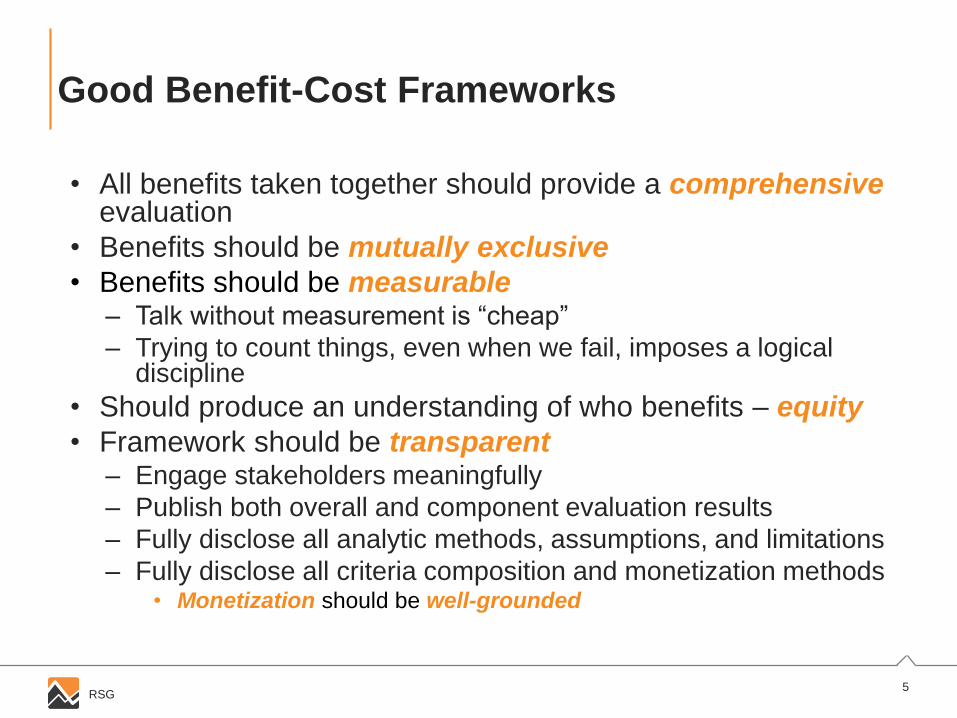
• All benefits taken together should provide a comprehensiveevaluation
• Benefits should be mutually exclusive
• Benefits should be measurable– Talk without measurement is “cheap”
– Trying to count things, even when we fail, imposes a logical discipline
• Should produce an understanding of who benefits – equity
• Framework should be transparent– Engage stakeholders meaningfully
– Publish both overall and component evaluation results
– Fully disclose all analytic methods, assumptions, and limitations
– Fully disclose all criteria composition and monetization methods• Monetization should be well-grounded
Good Benefit-Cost Frameworks
6RSG
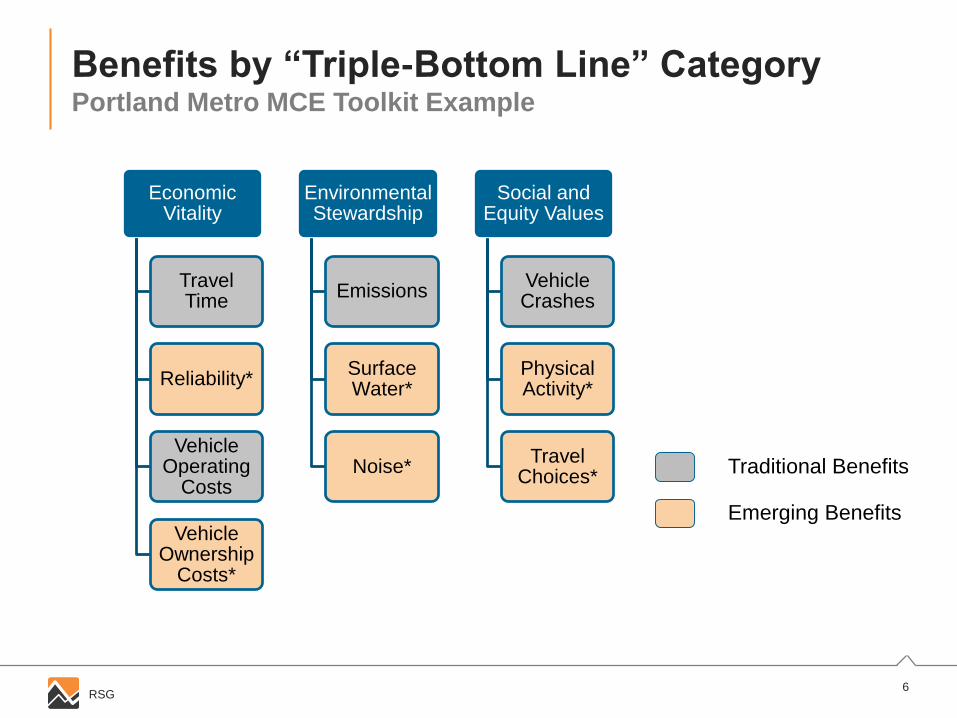
Benefits by “Triple-Bottom Line” CategoryPortland Metro MCE Toolkit Example
Economic Vitality
Travel Time
Reliability*
Vehicle Operating
Costs
Vehicle Ownership
Costs*
Environmental Stewardship
Emissions
Surface Water*
Noise*
Social and Equity Values
Vehicle Crashes
Physical Activity*
Travel Choices*
Traditional Benefits
Emerging Benefits

Economic Vitality Benefits
8RSG
Travel TimeA Mobility Benefit
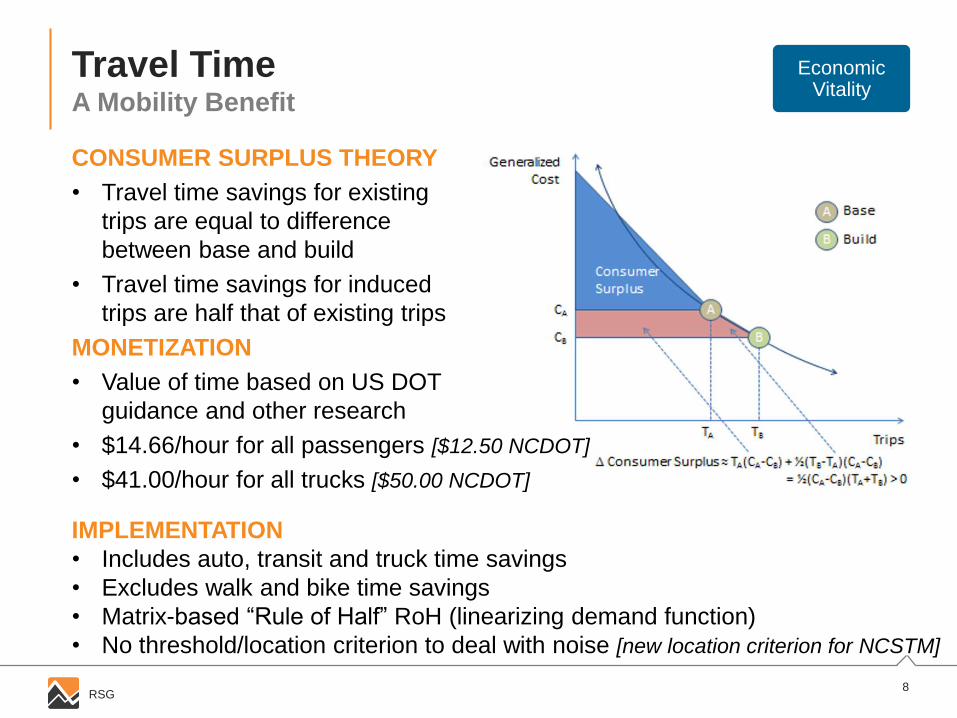
CONSUMER SURPLUS THEORY
• Travel time savings for existing
trips are equal to difference
between base and build
• Travel time savings for induced
trips are half that of existing trips
MONETIZATION
• Value of time based on US DOT
guidance and other research
• $14.66/hour for all passengers [$12.50 NCDOT]
• $41.00/hour for all trucks [$50.00 NCDOT]
Economic Vitality
IMPLEMENTATION
• Includes auto, transit and truck time savings
• Excludes walk and bike time savings
• Matrix-based “Rule of Half” RoH (linearizing demand function)
• No threshold/location criterion to deal with noise [new location criterion for NCSTM]
9RSG
Travel Time ReliabilityA Mobility Benefit
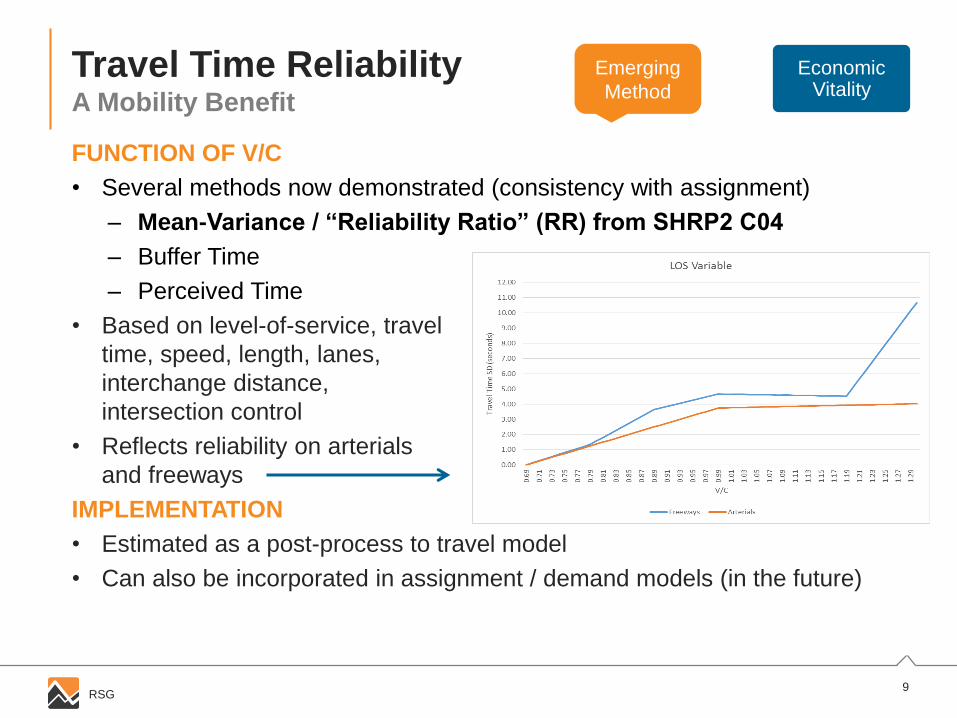
FUNCTION OF V/C
• Several methods now demonstrated (consistency with assignment)
– Mean-Variance / “Reliability Ratio” (RR) from SHRP2 C04
– Buffer Time
– Perceived Time
• Based on level-of-service, travel
time, speed, length, lanes,
interchange distance,
intersection control
• Reflects reliability on arterials
and freeways
IMPLEMENTATION
• Estimated as a post-process to travel model
• Can also be incorporated in assignment / demand models (in the future)
Economic Vitality
Emerging
Method
10RSG
Vehicle Operating CostsA Mobility Benefit
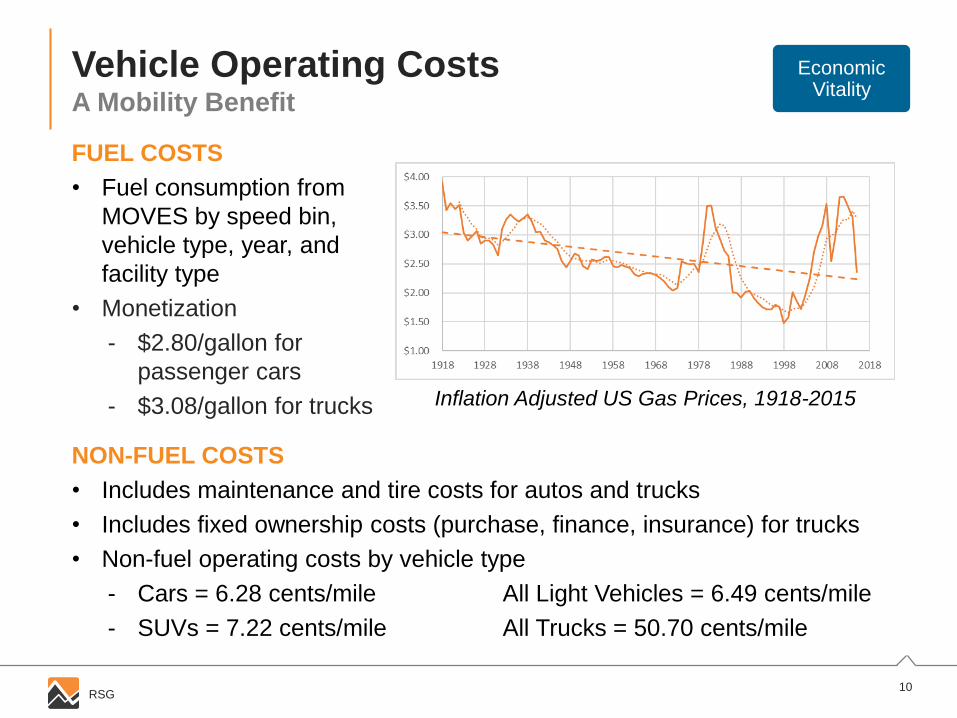
FUEL COSTS
• Fuel consumption from
MOVES by speed bin,
vehicle type, year, and
facility type
• Monetization
- $2.80/gallon for
passenger cars
- $3.08/gallon for trucks
Economic Vitality
Inflation Adjusted US Gas Prices, 1918-2015
NON-FUEL COSTS
• Includes maintenance and tire costs for autos and trucks
• Includes fixed ownership costs (purchase, finance, insurance) for trucks
• Non-fuel operating costs by vehicle type
- Cars = 6.28 cents/mile All Light Vehicles = 6.49 cents/mile
- SUVs = 7.22 cents/mile All Trucks = 50.70 cents/mile
11RSG
Vehicle Ownership CostsA Mobility Benefit
AUTO OWNERSHIP MODEL
• Applies only to passenger cars
• Produces vehicles per household for 0, 1, 2, 3+ categories
MONETIZATION
• Includes purchase and depreciation, financing, insurance
- avoid double-counting of maintenance under vehicle operating costs
• Based on AAA’s Your Driving Costs
- Average annual ownership costs for autos = $6,611
UNCERTAINTY
• Impact of ride-sharing services and emerging technologies such as
automated vehicles is uncertain and not reflected yet – but will be in future
Economic Vitality
Emerging
Method

Environmental Stewardship
13RSG
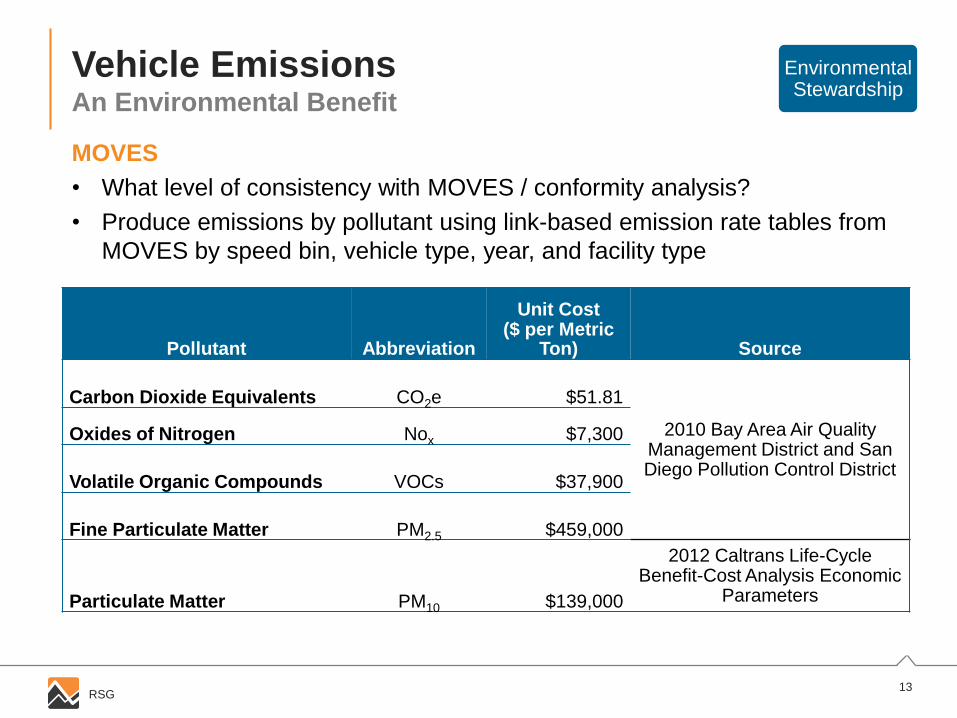
Vehicle Emissions An Environmental Benefit
MOVES
• What level of consistency with MOVES / conformity analysis?
• Produce emissions by pollutant using link-based emission rate tables from
MOVES by speed bin, vehicle type, year, and facility type
Environmental Stewardship
Pollutant Abbreviation
Unit Cost ($ per Metric
Ton) Source
Carbon Dioxide Equivalents CO2e $51.81
2010 Bay Area Air Quality Management District and San Diego Pollution Control District
Oxides of Nitrogen Nox $7,300
Volatile Organic Compounds VOCs $37,900
Fine Particulate Matter PM2.5 $459,000
Particulate Matter PM10 $139,000
2012 Caltrans Life-CycleBenefit-Cost Analysis Economic
Parameters
14RSG
Surface Water PollutionAn Environmental Benefit
DEFINITION
• Represents deposit of rubber particles, oil and other pollutants on roads
that wash into storm water
• Does not account for the cost to mitigate these impacts
- Option to exclude benefits if mitigation is addressed
• Does not distinguish
- Cars and trucks
- Drainage approaches on different roads
FUNCTION OF VMT
• Per VMT rate for all vehicles = $0.01625/mile
• Based on research from WSDOT, Volpe Institute,
and Victoria Transport Policy Institute
Environmental Stewardship
Emerging
Method
15RSG
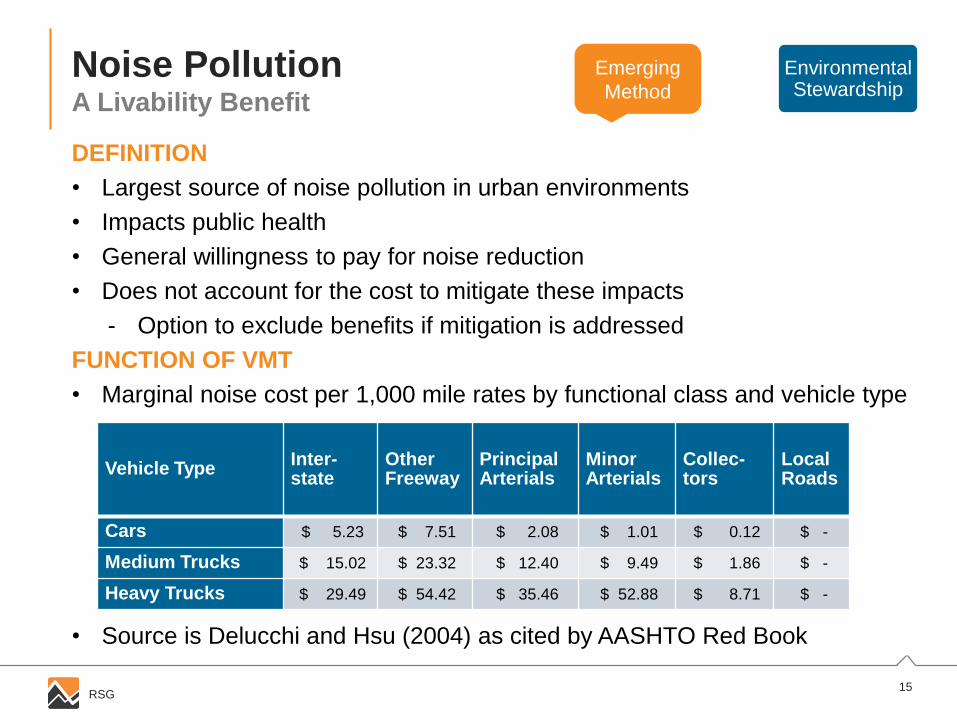
Noise PollutionA Livability Benefit
DEFINITION
• Largest source of noise pollution in urban environments
• Impacts public health
• General willingness to pay for noise reduction
• Does not account for the cost to mitigate these impacts
- Option to exclude benefits if mitigation is addressed
FUNCTION OF VMT
• Marginal noise cost per 1,000 mile rates by functional class and vehicle type
• Source is Delucchi and Hsu (2004) as cited by AASHTO Red Book
Environmental Stewardship
Vehicle TypeInter-state
Other Freeway
Principal Arterials
Minor Arterials
Collec-tors
Local Roads
Cars $ 5.23 $ 7.51 $ 2.08 $ 1.01 $ 0.12 $ -
Medium Trucks $ 15.02 $ 23.32 $ 12.40 $ 9.49 $ 1.86 $ -
Heavy Trucks $ 29.49 $ 54.42 $ 35.46 $ 52.88 $ 8.71 $ -
Emerging
Method
Social / Equity Benefits
17RSG
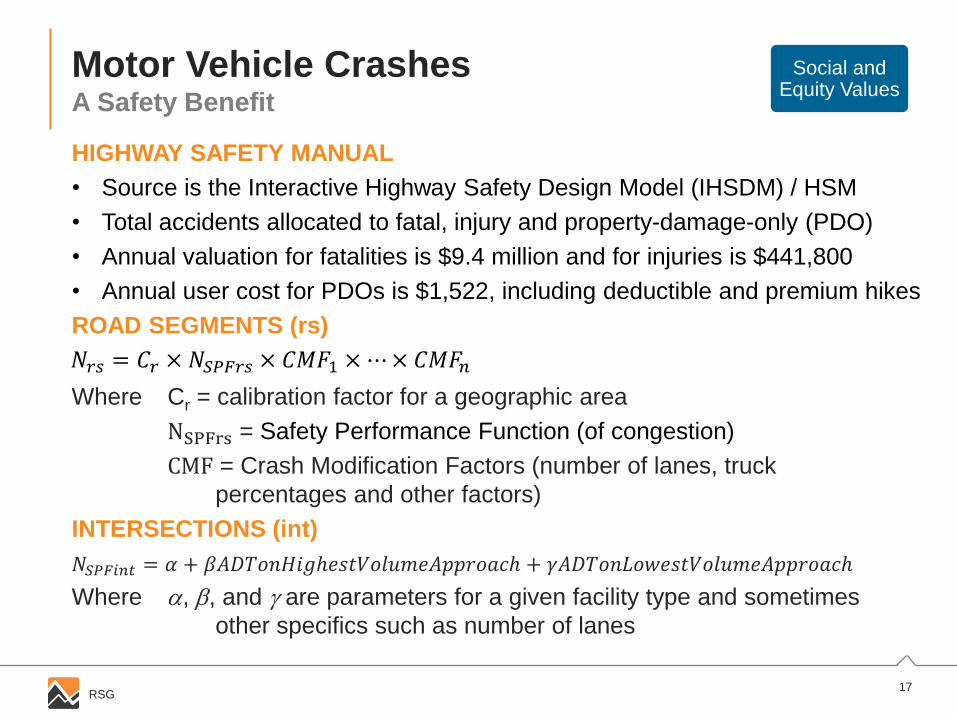
Motor Vehicle CrashesA Safety Benefit
HIGHWAY SAFETY MANUAL
• Source is the Interactive Highway Safety Design Model (IHSDM) / HSM
• Total accidents allocated to fatal, injury and property-damage-only (PDO)
• Annual valuation for fatalities is $9.4 million and for injuries is $441,800
• Annual user cost for PDOs is $1,522, including deductible and premium hikes
ROAD SEGMENTS (rs)
Where Cr = calibration factor for a geographic area
NSPFrs = Safety Performance Function (of congestion)
CMF = Crash Modification Factors (number of lanes, truck
percentages and other factors)
INTERSECTIONS (int)
𝑁𝑆𝑃𝐹𝑖𝑛𝑡 = 𝛼 + 𝛽𝐴𝐷𝑇𝑜𝑛𝐻𝑖𝑔ℎ𝑒𝑠𝑡𝑉𝑜𝑙𝑢𝑚𝑒𝐴𝑝𝑝𝑟𝑜𝑎𝑐ℎ + 𝛾𝐴𝐷𝑇𝑜𝑛𝐿𝑜𝑤𝑒𝑠𝑡𝑉𝑜𝑙𝑢𝑚𝑒𝐴𝑝𝑝𝑟𝑜𝑎𝑐ℎ
Where , , and are parameters for a given facility type and sometimes
other specifics such as number of lanes
Social and Equity Values
𝑁𝑟𝑠 = 𝐶𝑟 × 𝑁𝑆𝑃𝐹𝑟𝑠 × 𝐶𝑀𝐹1 ×⋯× 𝐶𝑀𝐹𝑛
18RSG
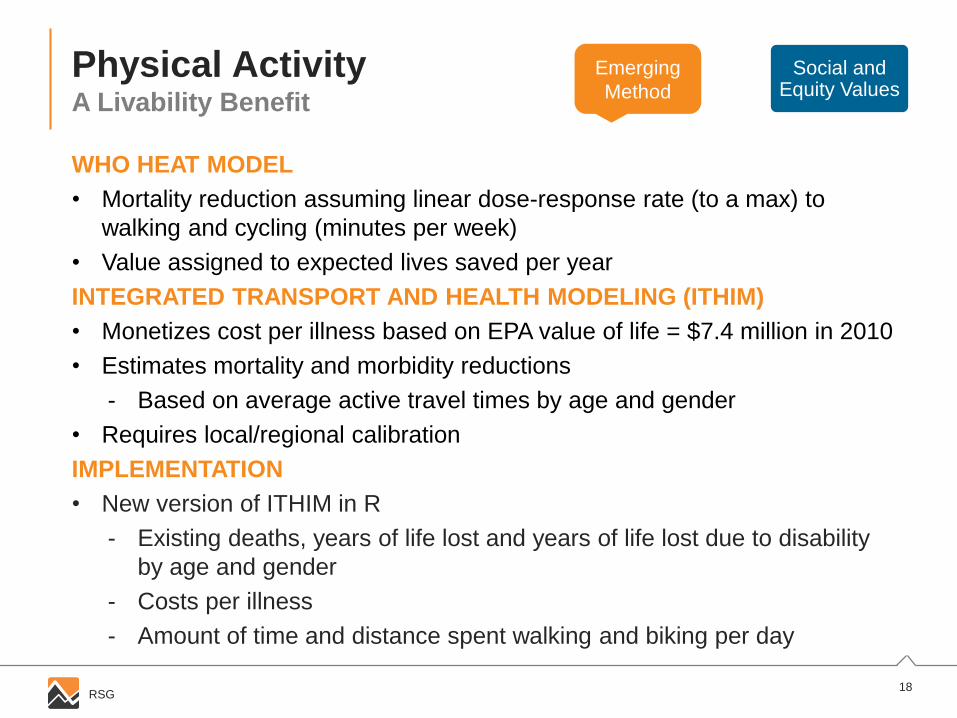
Physical ActivityA Livability Benefit
WHO HEAT MODEL
• Mortality reduction assuming linear dose-response rate (to a max) to
walking and cycling (minutes per week)
• Value assigned to expected lives saved per year
INTEGRATED TRANSPORT AND HEALTH MODELING (ITHIM)
• Monetizes cost per illness based on EPA value of life = $7.4 million in 2010
• Estimates mortality and morbidity reductions
- Based on average active travel times by age and gender
• Requires local/regional calibration
IMPLEMENTATION
• New version of ITHIM in R
- Existing deaths, years of life lost and years of life lost due to disability
by age and gender
- Costs per illness
- Amount of time and distance spent walking and biking per day
Social and Equity Values
Emerging
Method
19RSG
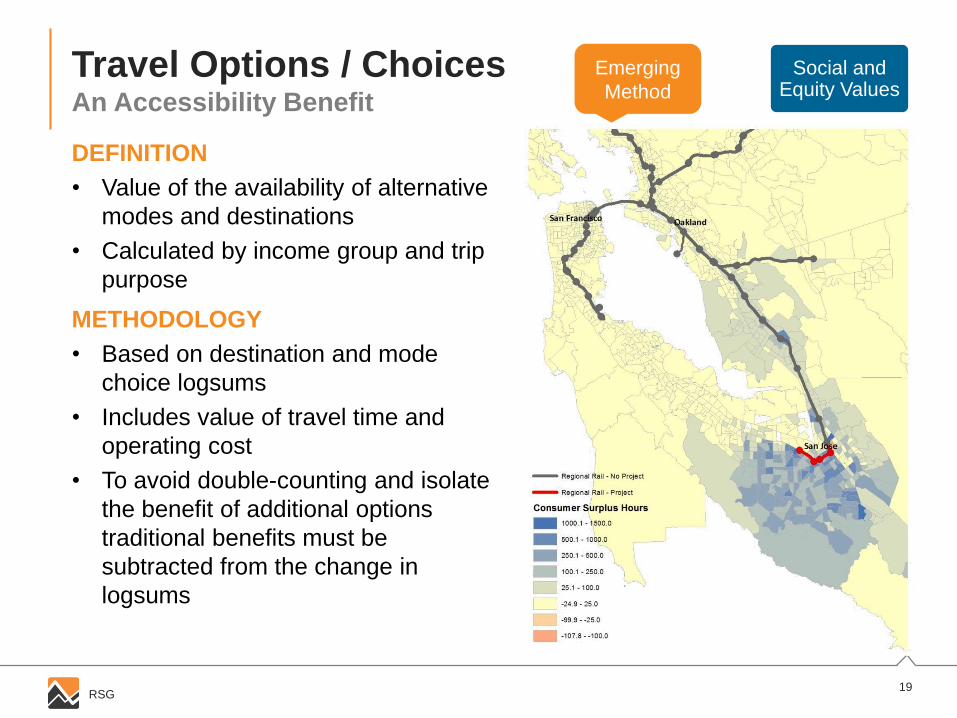
Travel Options / ChoicesAn Accessibility Benefit
DEFINITION
• Value of the availability of alternative
modes and destinations
• Calculated by income group and trip
purpose
Social and Equity Values
METHODOLOGY
• Based on destination and mode
choice logsums
• Includes value of travel time and
operating cost
• To avoid double-counting and isolate
the benefit of additional options
traditional benefits must be
subtracted from the change in
logsums
Emerging
Method
Equity Analysis
21RSG
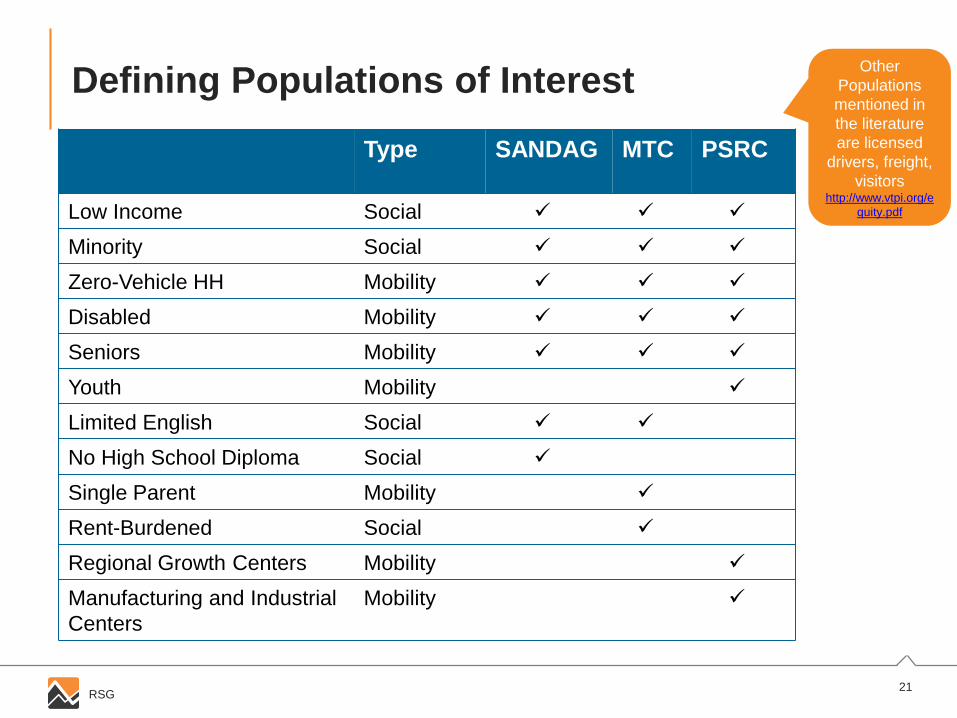
Defining Populations of Interest
Type SANDAG MTC PSRC
Low Income Social
Minority Social
Zero-Vehicle HH Mobility
Disabled Mobility
Seniors Mobility
Youth Mobility
Limited English Social
No High School Diploma Social
Single Parent Mobility
Rent-Burdened Social
Regional Growth Centers Mobility
Manufacturing and Industrial
Centers
Mobility
Other
Populations
mentioned in
the literature
are licensed
drivers, freight,
visitorshttp://www.vtpi.org/e
quity.pdf
22RSG
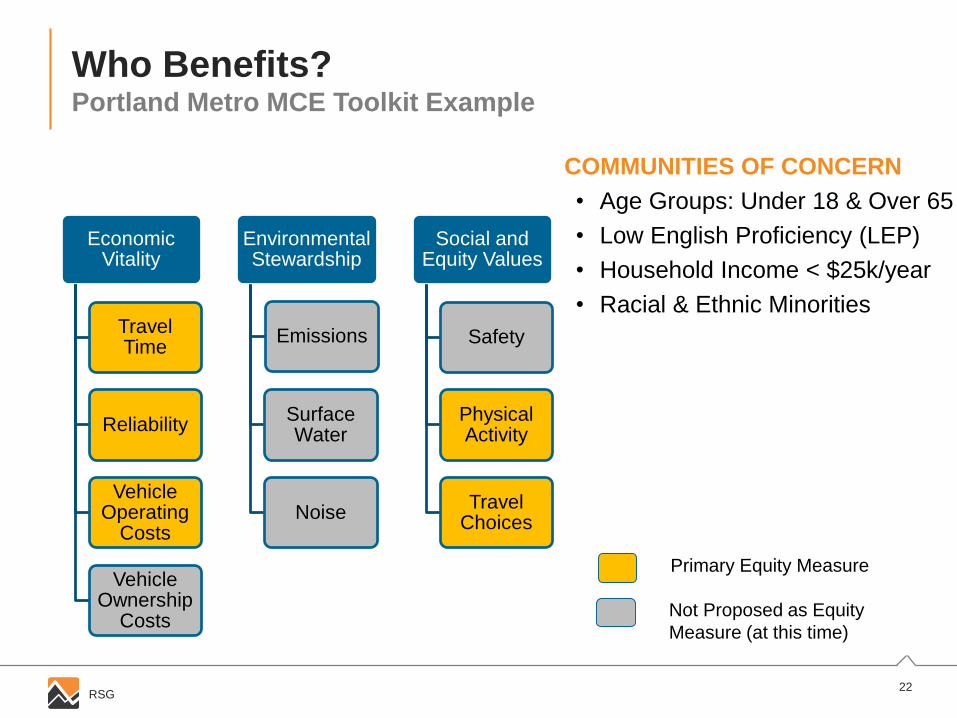
Who Benefits?Portland Metro MCE Toolkit Example
Economic Vitality
Travel Time
Reliability
Vehicle Operating
Costs
Vehicle Ownership
Costs
Environmental Stewardship
Emissions
Surface Water
Noise
Social and Equity Values
Safety
Physical Activity
Travel Choices
Not Proposed as Equity
Measure (at this time)
Primary Equity Measure
COMMUNITIES OF CONCERN
• Age Groups: Under 18 & Over 65
• Low English Proficiency (LEP)
• Household Income < $25k/year
• Racial & Ethnic Minorities
23RSG
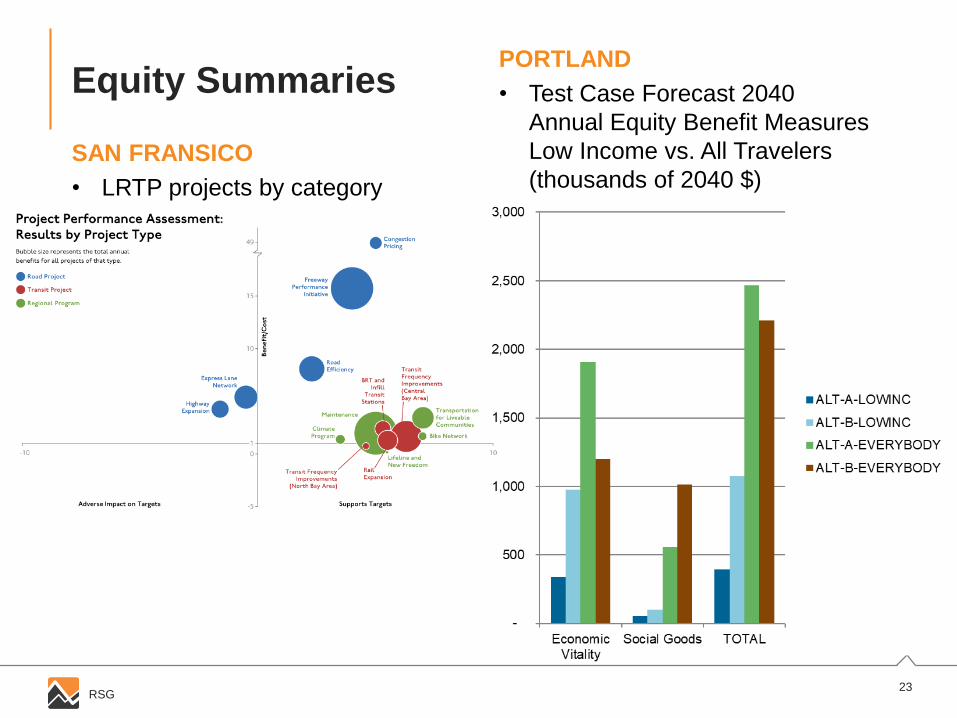
Equity Summaries
SAN FRANSICO
• LRTP projects by category
PORTLAND
• Test Case Forecast 2040
Annual Equity Benefit Measures
Low Income vs. All Travelers
(thousands of 2040 $)

Model Convergence
25RSG
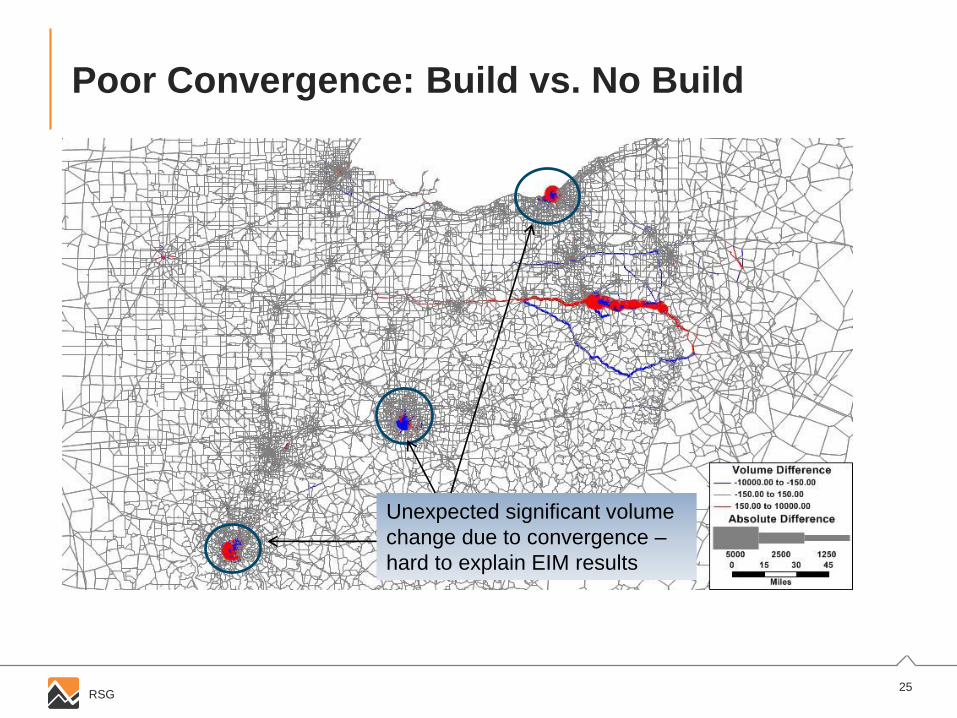
Poor Convergence: Build vs. No Build
Unexpected significant volume
change due to convergence –
hard to explain EIM results
26RSG
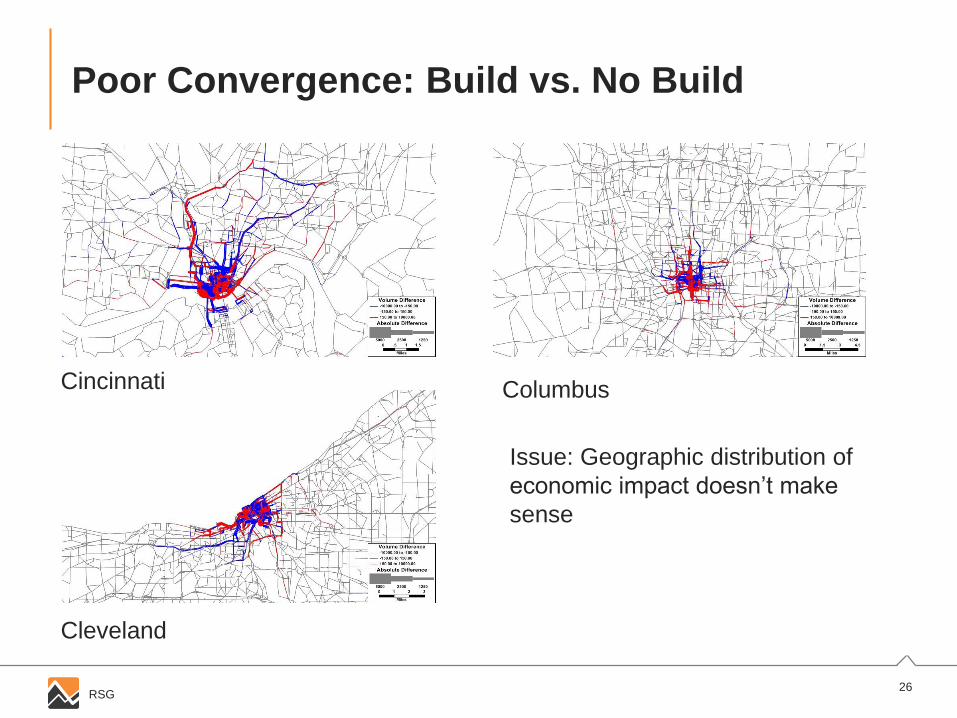
Poor Convergence: Build vs. No Build
Cincinnati Columbus
Cleveland
Issue: Geographic distribution of
economic impact doesn’t make
sense
27RSG
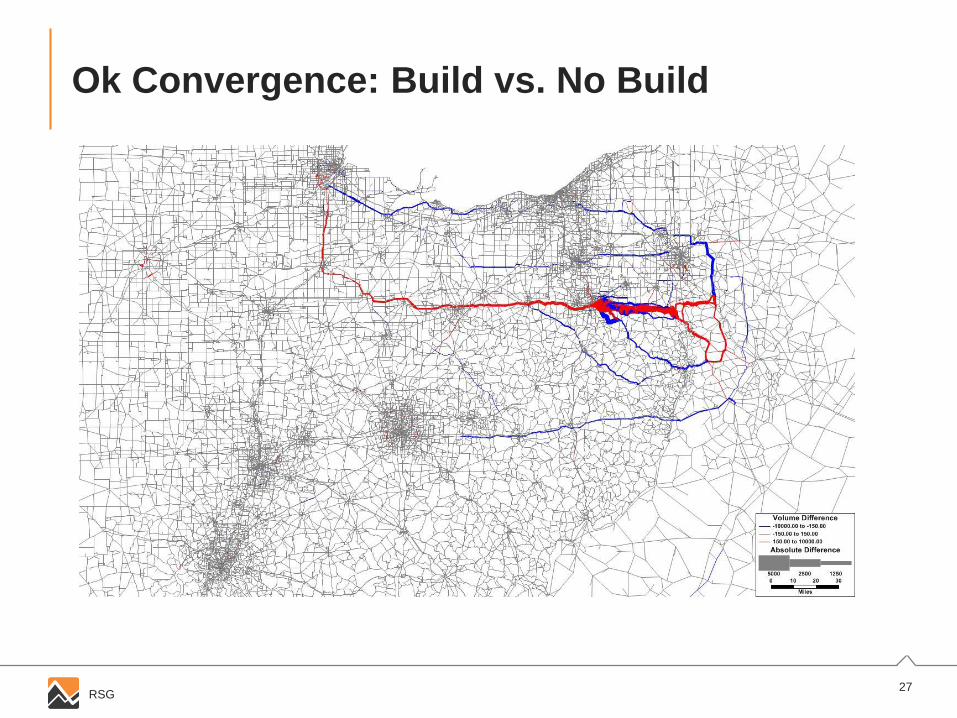
Ok Convergence: Build vs. No Build
28RSG
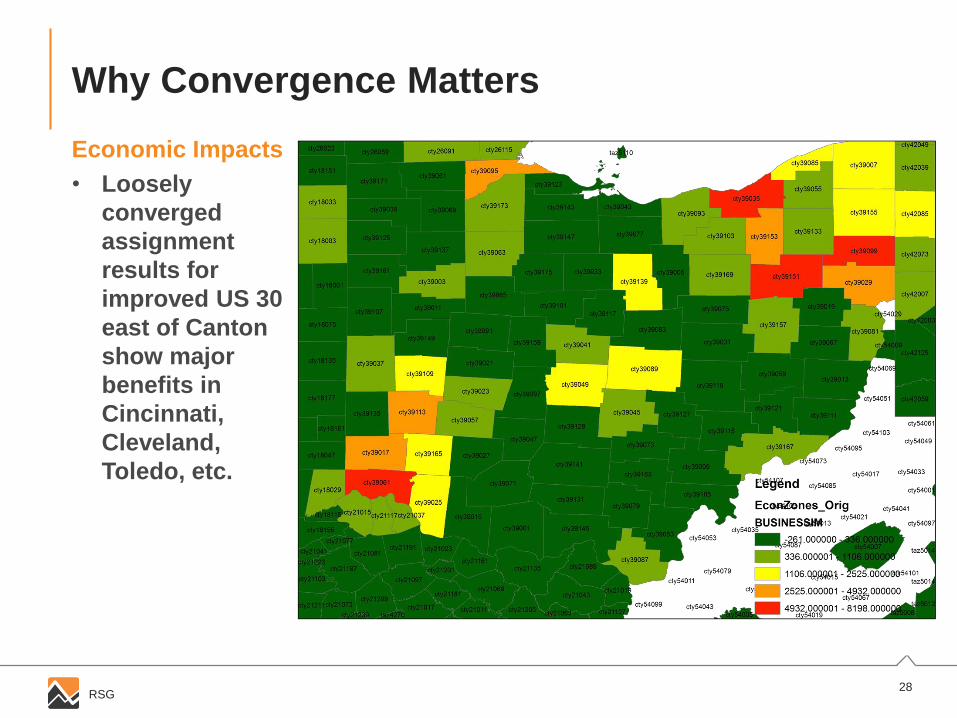
Why Convergence Matters
Economic Impacts
• Loosely
converged
assignment
results for
improved US 30
east of Canton
show major
benefits in
Cincinnati,
Cleveland,
Toledo, etc.
29RSG
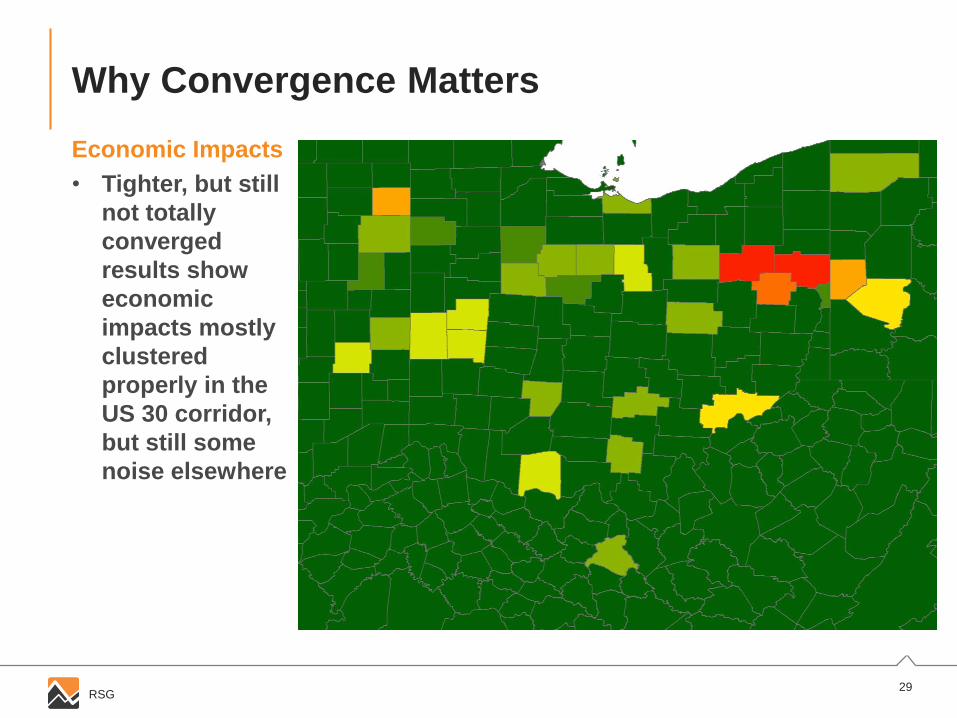
Why Convergence Matters
Economic Impacts
• Tighter, but still
not totally
converged
results show
economic
impacts mostly
clustered
properly in the
US 30 corridor,
but still some
noise elsewhere

Final Thoughts
31RSG
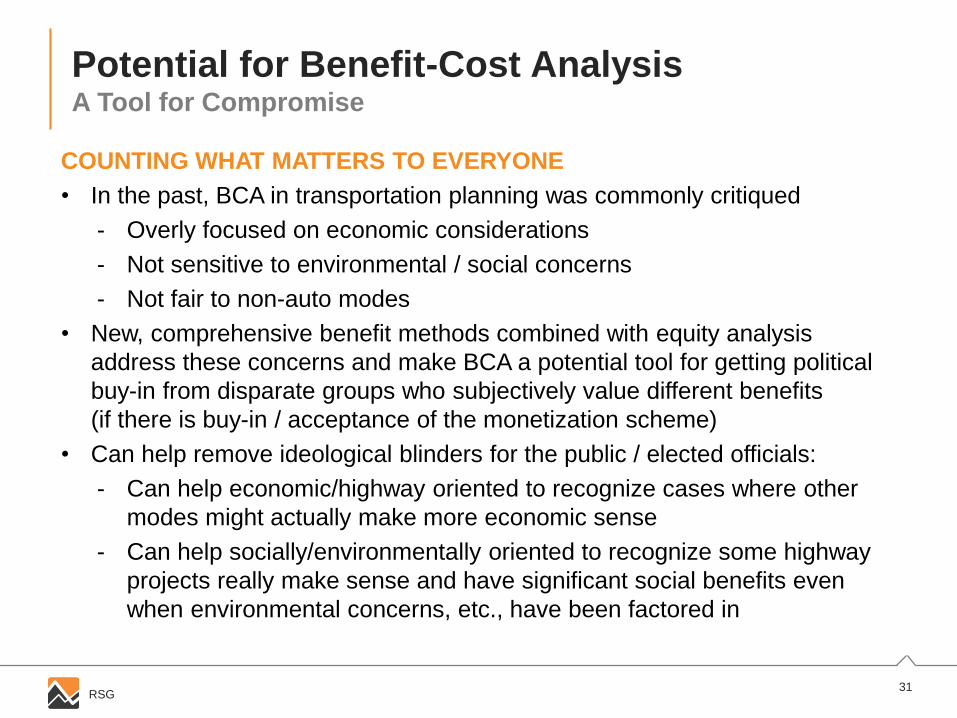
Potential for Benefit-Cost AnalysisA Tool for Compromise
COUNTING WHAT MATTERS TO EVERYONE
• In the past, BCA in transportation planning was commonly critiqued
- Overly focused on economic considerations
- Not sensitive to environmental / social concerns
- Not fair to non-auto modes
• New, comprehensive benefit methods combined with equity analysis
address these concerns and make BCA a potential tool for getting political
buy-in from disparate groups who subjectively value different benefits
(if there is buy-in / acceptance of the monetization scheme)
• Can help remove ideological blinders for the public / elected officials:
- Can help economic/highway oriented to recognize cases where other
modes might actually make more economic sense
- Can help socially/environmentally oriented to recognize some highway
projects really make sense and have significant social benefits even
when environmental concerns, etc., have been factored in
www.rsginc.com
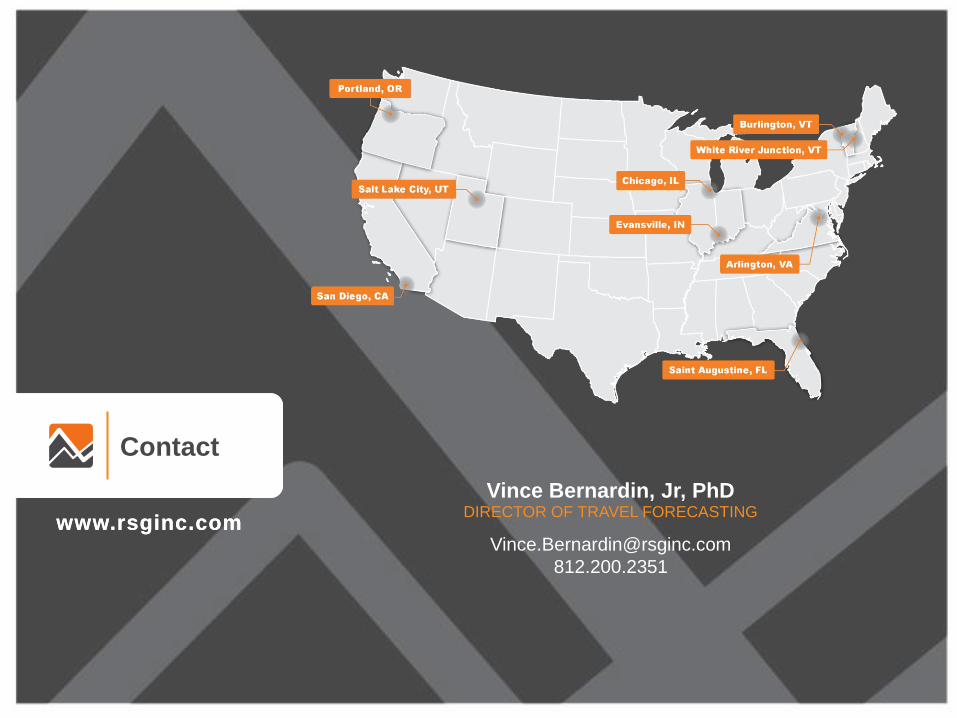
Contacts
www.rsginc.com
Contact
Vince Bernardin, Jr, PhDDIRECTOR OF TRAVEL FORECASTING
812.200.2351
33RSG
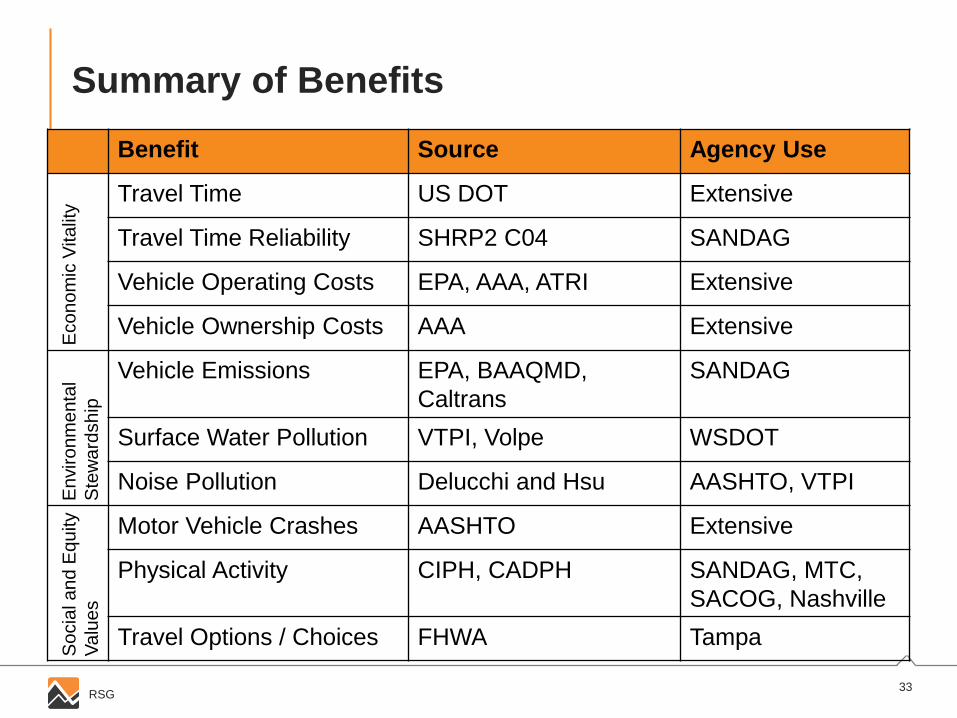
Summary of Benefits
Benefit Source Agency Use
Eco
no
mic
Vita
lity
Travel Time US DOT Extensive
Travel Time Reliability SHRP2 C04 SANDAG
Vehicle Operating Costs EPA, AAA, ATRI Extensive
Vehicle Ownership Costs AAA Extensive
En
viro
nm
en
tal
Ste
wa
rdsh
ip
Vehicle Emissions EPA, BAAQMD,
Caltrans
SANDAG
Surface Water Pollution VTPI, Volpe WSDOT
Noise Pollution Delucchi and Hsu AASHTO, VTPI
So
cia
l a
nd
Eq
uity
Va
lue
s
Motor Vehicle Crashes AASHTO Extensive
Physical Activity CIPH, CADPH SANDAG, MTC,
SACOG, Nashville
Travel Options / Choices FHWA Tampa


![Principles and Standards for Benefit–Cost Analysis] Introduction- Professionalizing Benefit–Cost Analysis](https://img.pdfslide.us/doc/110x75/56d6beb21a28ab30169333bb/principles-and-standards-for-benefitcost-analysis-introduction-professionalizing.jpg)