Embed Size (px)
Citation preview
Comprehensive Assessment of Milk Composition inTransgenic Cloned CattleRan Zhang1., Chengdong Guo1., Shunchao Sui1, Tian Yu2, Jianwu Wang3, Ning Li1*
1 State Key Laboratory of Agrobiotechnology, China Agricultural University, Beijing, China, 2 Wuxi Kingenew Biotechnology Co., Ltd., Wuxi, Jiangsu Province, China,
3 Beijing GenProtein Biotech Company Ltd., Beijing, China
Abstract
The development of transgenic cloned animals offers new opportunities for agriculture, biomedicine and environmentalscience. Expressing recombinant proteins in dairy animals to alter their milk composition is considered beneficial for humanhealth. However, relatively little is known about the expression profile of the proteins in milk derived from transgenic clonedanimals. In this study, we compared the proteome and nutrient composition of the colostrum and mature milk from threelines of transgenic cloned (TC) cattle that specifically express human a-lactalbumin (TC-LA), lactoferrin (TC-LF) or lysozyme(TC-LZ) in the mammary gland with those from cloned non-transgenic (C) and conventionally bred normal animals (N).Protein expression profile identification was performed, 37 proteins were specifically expressed in the TC animals and 70protein spots that were classified as 22 proteins with significantly altered expression levels in the TC and C groupscompared to N group. Assessment of the relationship of the transgene effect and normal variability in the milk proteinprofiles in each group indicated that the variation in the endogenous protein profiles of the three TC groups was within thelimit of natural variability. More than 50 parameters for the colostrum and mature milk were compared between each TCgroup and the N controls. The data revealed essentially similar profiles for all groups. This comprehensive studydemonstrated that in TC cattle the mean values for the measured milk parameters were all within the normal range,suggesting that the expression of a transgene does not affect the composition of milk.
Citation: Zhang R, Guo C, Sui S, Yu T, Wang J, et al. (2012) Comprehensive Assessment of Milk Composition in Transgenic Cloned Cattle. PLoS ONE 7(11): e49697.doi:10.1371/journal.pone.0049697
Editor: Xiuhcun Tian, University of Connecticut, United States of America
Received July 31, 2012; Accepted October 10, 2012; Published November 21, 2012
Copyright: � 2012 Zhang et al. This is an open-access article distributed under the terms of the Creative Commons Attribution License, which permitsunrestricted use, distribution, and reproduction in any medium, provided the original author and source are credited.
Funding: This project was supported by the ‘‘863’’ High-Tech Research Development Project (project grant numbers 2010AA10A105 and 2011AA100601). Thefunders had no role in study design, data collection and analysis, decision to publish, or preparation of the manuscript.
Competing Interests: Two of the authors are employed by the commercial companies, Wuxi Kingenew Biotechnology Co., Ltd. and Beijing GenProteinBiotech Company Ltd., who have a role in performing the experiment, analyzing the data and preparing the manuscript. There are no further patents, productsin development or marketed products to declare. This does not alter the authors’ adherence to all the PLOS ONE policies on sharing data andmaterials.
* E-mail: [email protected]
. These authors contributed equally to this work.
Introduction
The rapid development of transgenic technology has led to the
generation of a broad spectrum of transgenic cloned animals for
agricultural and biomedical use [1,2]. Among numerous applica-
tions, expressing recombinant human proteins with benefits for
human health and nutrition has become a reality (http://www.gtc-
bio.com/; http://www.pharming.com/). However, some aspects
of the process of cloning transgenic animals, such as epigenetic
reprogramming, exogenous gene insertion and pleiotropy, have
increased the attention paid to the risks of consuming these foods
and to the health of the animals [3–5]. Therefore, studying the
composition of the products of these transgenic cloned livestock is
important to demonstrate whether there is a risk associated with
foods produced from these animals compared with food from
conventionally bred animals.
Since 2001, the FDA has conducted an intensive evaluation that
includes the examination of the safety of food from cloned animals
and the risks of cloning to animal health. The accumulated data
indicate that the gross composition of milk and meat from cloned
animals is within the normal range and is as safe as milk and meat
from conventionally bred cattle [6–8]. Meanwhile, similar
considerations have been given to the safety of food produced
from transgenic animals. Transgenesis and cloning belong to two
different risk groups because new transgenes are introduced into
the genome of transgenic animals but not in cloned animals.
Therefore, the analysis of the risk of consuming foods from
transgenic animals should focus on characterization of the
expected products of the transgene and any other unintended
changes [9]. To date, very limited published information is
available on the composition of food products derived from
transgenic cloned animals. One study that examined the
production of milk containing higher than normal levels of bovine
b-casein and k-casein revealed that the nutritional composition of
the milk from the transgenic cloned cattle and conventionally bred
cattle was similar [10].
However, some unanswered concerns remain. Whether the
protein profiles of milk from transgenic cloned cattle are altered by
the cloning technology or by the expression of exogenous human
genes in bovine mammary epithelial cells, and the mechanism by
which such changes might occur, is unknown. Technological
advances in proteomics have allowed an increased understanding
and characterization of milk proteins. Previous proteomic studies
have focused on the identification of milk whey proteins and have
PLOS ONE | www.plosone.org 1 November 2012 | Volume 7 | Issue 11 | e49697
the advantage of being able to detect, identify and characterize a
large number of milk proteins simultaneously, including low-
abundance proteins [11–13]. Thus, current proteomic technology
is an essential component of addressing the food safety concerns
associated with transgenic technology and of making the milk from
transgenic cloned animals more attractive to consumers.
Previously, we described the generation of three lines of
transgenic cloned cattle that specifically express human a-
lactalbumin (TC-LA), lactoferrin (TC-LF) or lysozyme (TC-LZ)
in milk as a result of the integration of a specific transgene into the
genome and were cloned by subsequent SCNT [14–16]. The
major changes observed between milk from these animals and
milk from conventionally bred animals were the high levels of
human milk proteins. Thus, the milk of these transgenic animals
has very different properties from that of conventionally bred
animals and provides a unique model for evaluating the effects of
exogenous transgenes on the profile of the endogenous milk
proteins. The objective of this study was to examine differences in
the milk proteome and other important milk components in the
colostrum and mature milk from three transgenic cloned cattle
lines. This comprehensive study provides unequivocal evidence
that the expression of a transgene does not affect the composition
of milk, and these results may assist with the assessment of the
safety of food derived from transgenic cloned animals.
Materials and Methods
TC Cattle and Matched Breed ControlsThe three different lines of transgenic cattle expressing
approximately 0.01 mg/mL hLZ (n = 10), 1.5 mg/mL ha-LA
(n = 4), or 3.5 mg/mL hLF (n = 3), as described previously [14–
16], were used for the milk composition analysis, with the C (n = 3)
and N animals (n = 9) used as controls. In briefly, the concentra-
tion of the recombinant proteins was assayed by ELISA using
Human Lactoferrin ELISA Kit (Bethyl, Montgomery, TX, USA),
Human LYZ ELISA Kit (Abnova, Taiwan) and Human LALBA
ELISA Kit (Abnova, Taiwan), respectively, according to the
manufacturer’s instructions. The absorbance of the product was
measured at 450 nm using a model 550 microplate reader (Bio-
Rad, Hercules, CA). All TC cattle lines and C cattle were
produced by SCNT, with the C control cattle being from the
unmodified donor nuclear cell lines that were used to produce the
TC cattle following the introduction of the transgenes. In addition,
the Holstein cow breed N cattle had a genetic background similar
to that of the transgenic cloned cattle. The cattle were similar in
age and lactation period and were housed under the same
conditions.
Milk Sample CollectionThe protocol was approved by the Institutional Animal Care
and Use Committee of China Agricultural University (ID:
SKLAB-2010-05-01). The colostrum was obtained during the
initial three days of lactation and mature milk was obtained on the
30th, 60th and 90th day after lactation. Milk was collected from the
cows twice daily and was pooled to form one daily sample. A
portion of the samples was used for the analysis of the milk
nutrient composition. The remaining portion was centrifuged at
25006g for 30 min at 4uC to obtain the skim milk fraction and
subsequently ultracentrifuged at 150,0006g for 1 h at 4uC to
remove the casein micelles. The supernatant (whey fraction) of
each cow per day was collected and stored at 280uC for ELISA
analysis. For the proteomics analysis, three days of mature whey
samples from each cow was pooled together to generate one
individual sample and then individual samples in the same groups
(TC-LZ, TC-LA, TC-LF, C and N) were pooled again to generate
one group sample according to the equal protein mass (three days
of whey samples from nine control cows were pooled and then
analyzed separately for HCA and PCA analysis).
2D SDS-PAGEThe whey protein was precipitated using a 2D Clean-UP kit
(GE Healthcare). Whey proteins (1 mg) were loaded onto IPG
strips (linear, 24 cm length, pH 4–7) by overnight rehydration at
20uC. The IEF was performed using IPGphor III (GE Healthcare)
by gradually increasing the voltage. SDS-PAGE was performed
using an Ettan DALT System (GE Healthcare) and the protein
spots were visualized by ‘‘blue-silver’’ staining. The image analysis
was performed using the Image Master 2D Platinum 6.0 software
(GE Healthcare). Student’s t-tests were performed on the proteins
showing greater than 2-fold changes, and p#0.05 were considered
to be significant.
LC-MS/MS AnalysisThe in-solution tryptic digestion proteins (200 mg) were
analyzed using 2D-Nano-LC-ESI-MS/MS, performed on a nano
Acquity UPLC (Waters) connected to a LTQ Orbitrap XL mass
spectrometer (Thermo Fisher). Each scan cycle consisted of one
full MS scan in profile mode followed by five MS/MS scans in
centroid mode. The acquired MS/MS spectra were used to search
against a non-redundant protein Bovidae database using the
SEQUEST program in the BioWorksTM 3.3.1 software suite with
the following parameters: the mass tolerance of 1.4 Da for
precursor ions and 1.0 Da for fragment ions, allowing two missed
cleavage. The false discovery rate was less than 1%, which was
calculated using a database containing reversed sequences. The
peptide identifications were filtered by PeptideProphet with a
confidence level of 95% and protein identifications were accepted
with greater than 99% probability [17].
MALDI-TOF MS/MS AnalysisIn-gel digestion was performed using standard protocols [18].
The peptides were analyzed on a 4700 MALDI-TOF/TOF mass
spectrometer (Applied Biosystems) operated in reflector positive
mode, followed by MS/MS of eight most-intense peptide ions.
The acquired MS/MS spectra were used to search against a
BOVINEnr database in the MASCOT software with the following
parameters: a peptide tolerance of 100 ppm, a fragment tolerance
of 0.6 Da, allowing one trypsin missed cleavage.
Quantitative Analysis of Major Whey ProteinsThe amount of seven major bovine whey proteins (b-LG, a-LA,
BSA, IgG, IgA, IgM and transferrin) in the colostrum and mature
milk from the five groups of animals was determined using an
enzyme-linked immunosorbent assay (ELISA) kit (Bethyl, Mon-
tgomery, TX, USA) according to the manufacturer’s instructions.
The absorbance of the product was measured at 450 nm using a
model 550 microplate reader (Bio-Rad, Hercules, CA).
Nutrient Composition AnalysisThe whole-milk samples were delivered to the Beijing Research
Institute for Nutritional Resources, which establishes the criteria
and methods for the analysis of large quantities of biochemical and
nutritional components. More than 50 nutritional components
were analyzed and they include 18 kinds of amino acids, 4 kinds of
total fatty acids as well as 16 kinds of specific fatty acid profiles,
mineral (K, Na, Ca, Mg, Fe, Zn, Se and P) and vitamin contents
(vitamin A, vitamin B1, vitamin B2, Vitamin B3, vitamin B5,
Milk Composition of Transgenic Cloned Cattle
PLOS ONE | www.plosone.org 2 November 2012 | Volume 7 | Issue 11 | e49697
vitamin B12 and vitamin C). The entire composition was
measured according to the national food safety standard raw milk
issued by China’s Ministry of Health (GB19301-2010). All values
show standard deviation and statistically analyzed using t-test
(*p,0.05).
Results
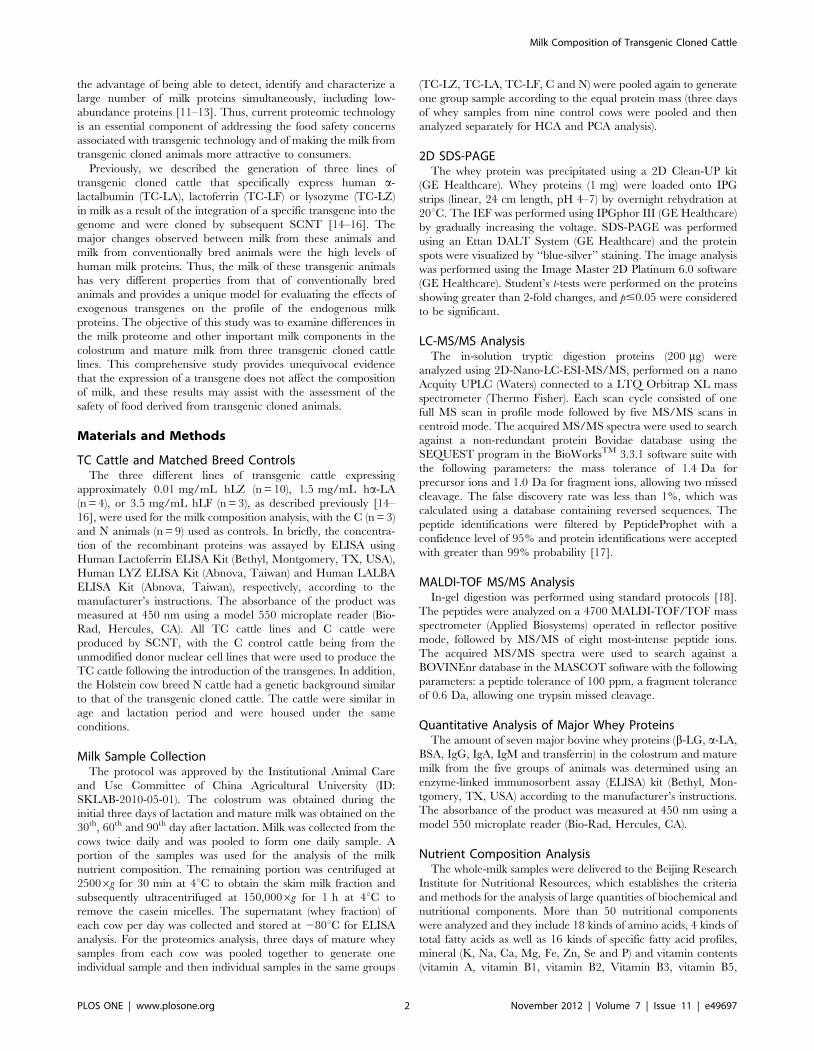
Overview of Milk Whey Proteome and Identification ofSpecifically Expressed Proteins in the TC Groups
The milk protein compositions of each group were compared
comprehensively using 2D-Nano-LC-MS/MS. Database searches
using the fragmentation spectra as experimental material identified
unique proteins from distinct peptides, and 215, 258, 172, 236 and
262 proteins were identified in the TC-LZ, TC-LA, TC-LF, C and
N groups, respectively. Venn diagrams of the protein profiles of
the TC-LZ, TC-LA, TC-LF and C groups were created with
respect to the N group. The TC-LZ had 182 proteins in common
with the N group, and 33 and 80 proteins were unique to the TC-
LZ and N groups, respectively (Figure 1A). A similar distribution
was found for the TC-LA, TC-LF and C groups (Figure 1B–1D).
Altogether, 44 proteins were identified that were exclusive to the
TC groups, 7 of which had been previously confirmed to be
present in milk from cattle of the background strain using similar
technological strategies [19–21]. The TC and C groups had 26
proteins in common that were not detected in the N group
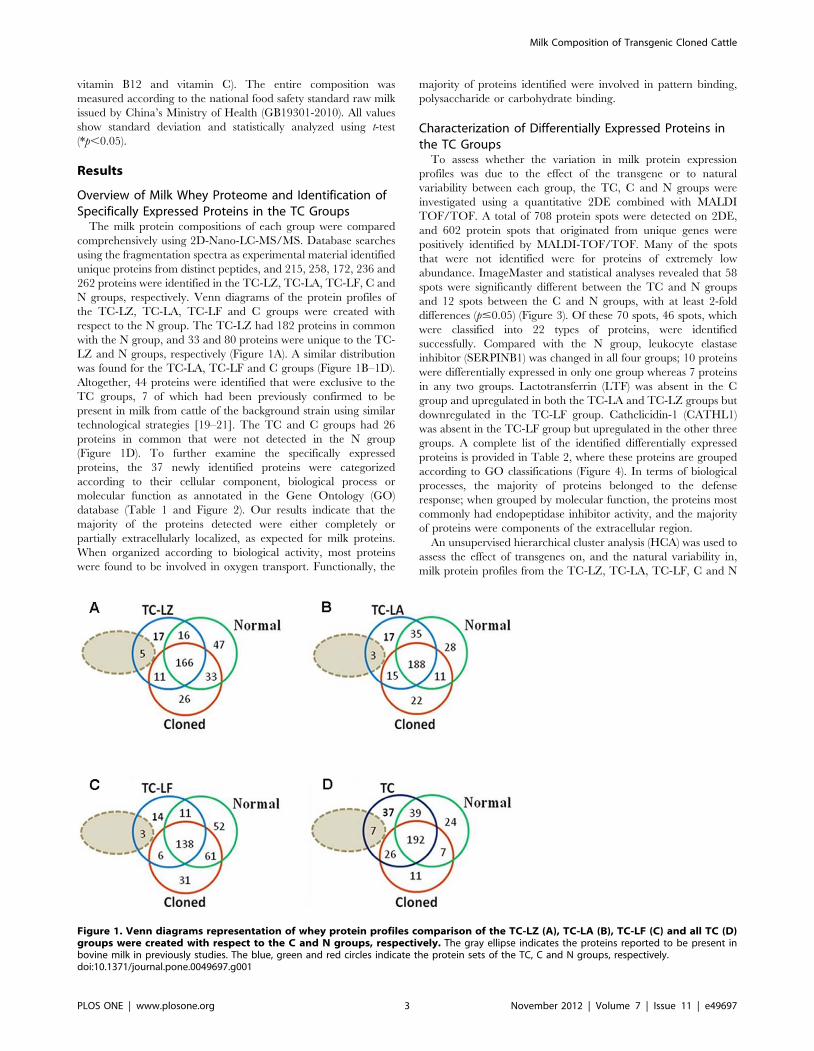
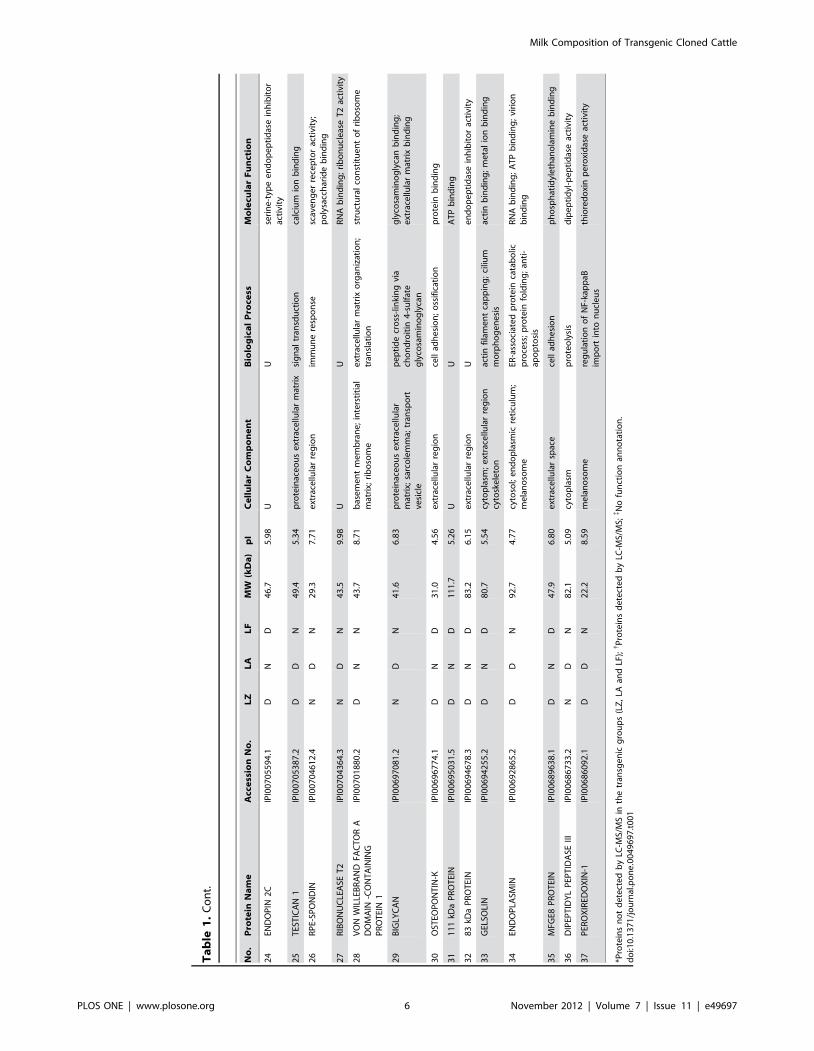
(Figure 1D). To further examine the specifically expressed
proteins, the 37 newly identified proteins were categorized
according to their cellular component, biological process or
molecular function as annotated in the Gene Ontology (GO)
database (Table 1 and Figure 2). Our results indicate that the
majority of the proteins detected were either completely or
partially extracellularly localized, as expected for milk proteins.
When organized according to biological activity, most proteins
were found to be involved in oxygen transport. Functionally, the
majority of proteins identified were involved in pattern binding,
polysaccharide or carbohydrate binding.
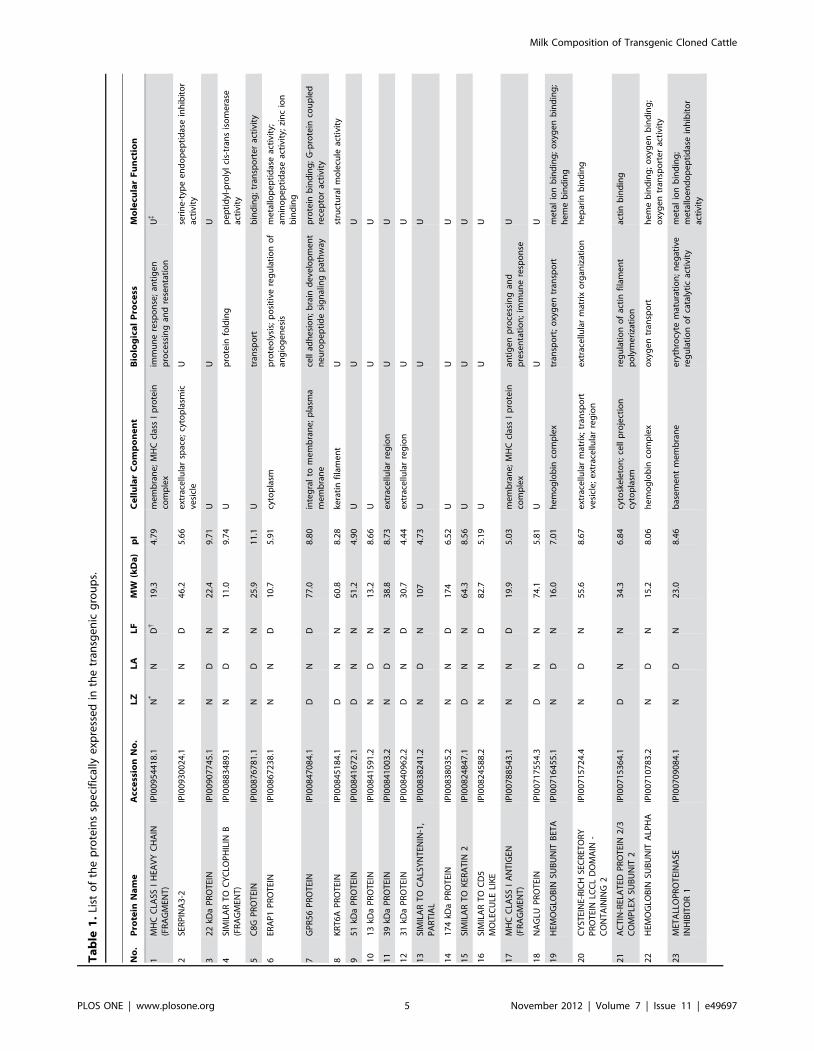
Characterization of Differentially Expressed Proteins inthe TC Groups
To assess whether the variation in milk protein expression
profiles was due to the effect of the transgene or to natural
variability between each group, the TC, C and N groups were
investigated using a quantitative 2DE combined with MALDI
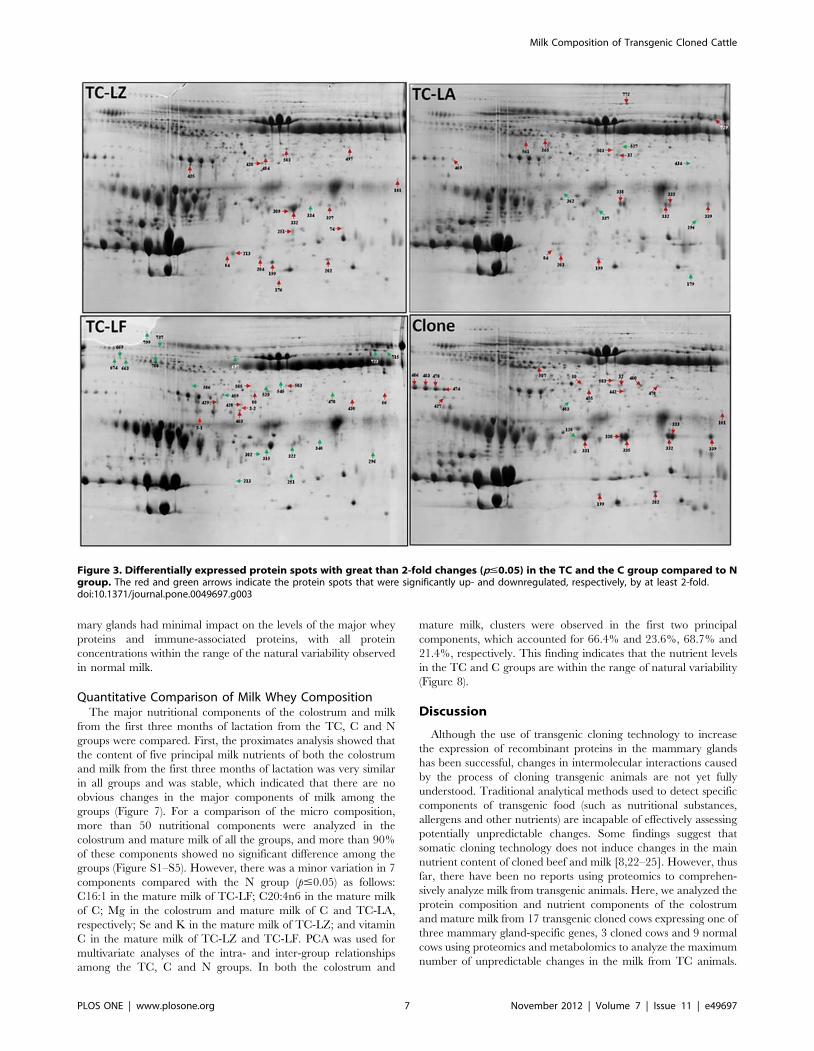
TOF/TOF. A total of 708 protein spots were detected on 2DE,
and 602 protein spots that originated from unique genes were
positively identified by MALDI-TOF/TOF. Many of the spots
that were not identified were for proteins of extremely low
abundance. ImageMaster and statistical analyses revealed that 58
spots were significantly different between the TC and N groups
and 12 spots between the C and N groups, with at least 2-fold
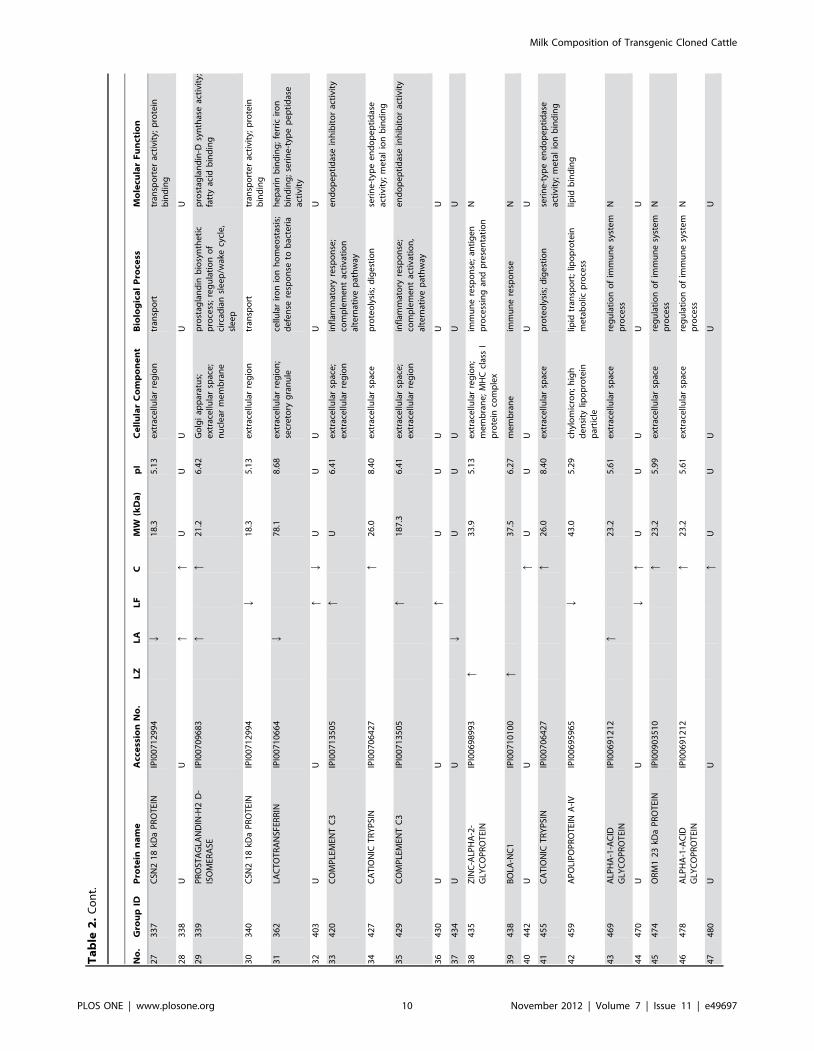
differences (p#0.05) (Figure 3). Of these 70 spots, 46 spots, which
were classified into 22 types of proteins, were identified
successfully. Compared with the N group, leukocyte elastase
inhibitor (SERPINB1) was changed in all four groups; 10 proteins
were differentially expressed in only one group whereas 7 proteins
in any two groups. Lactotransferrin (LTF) was absent in the C
group and upregulated in both the TC-LA and TC-LZ groups but
downregulated in the TC-LF group. Cathelicidin-1 (CATHL1)
was absent in the TC-LF group but upregulated in the other three
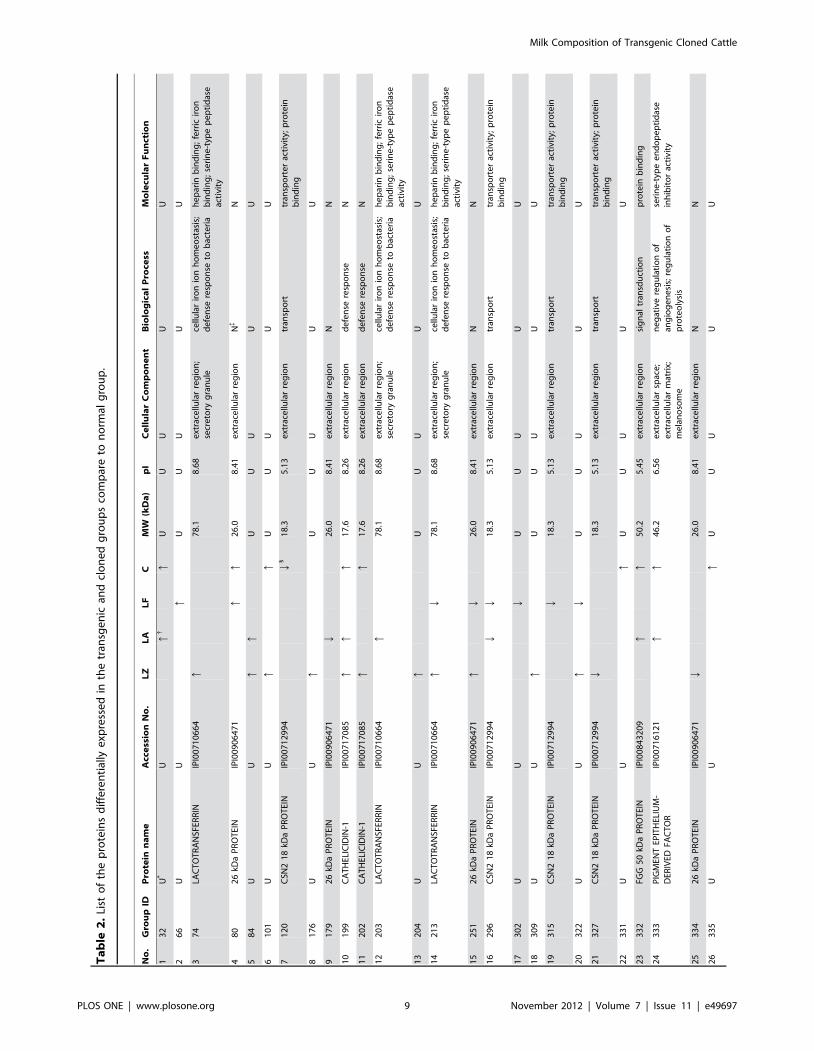
groups. A complete list of the identified differentially expressed
proteins is provided in Table 2, where these proteins are grouped
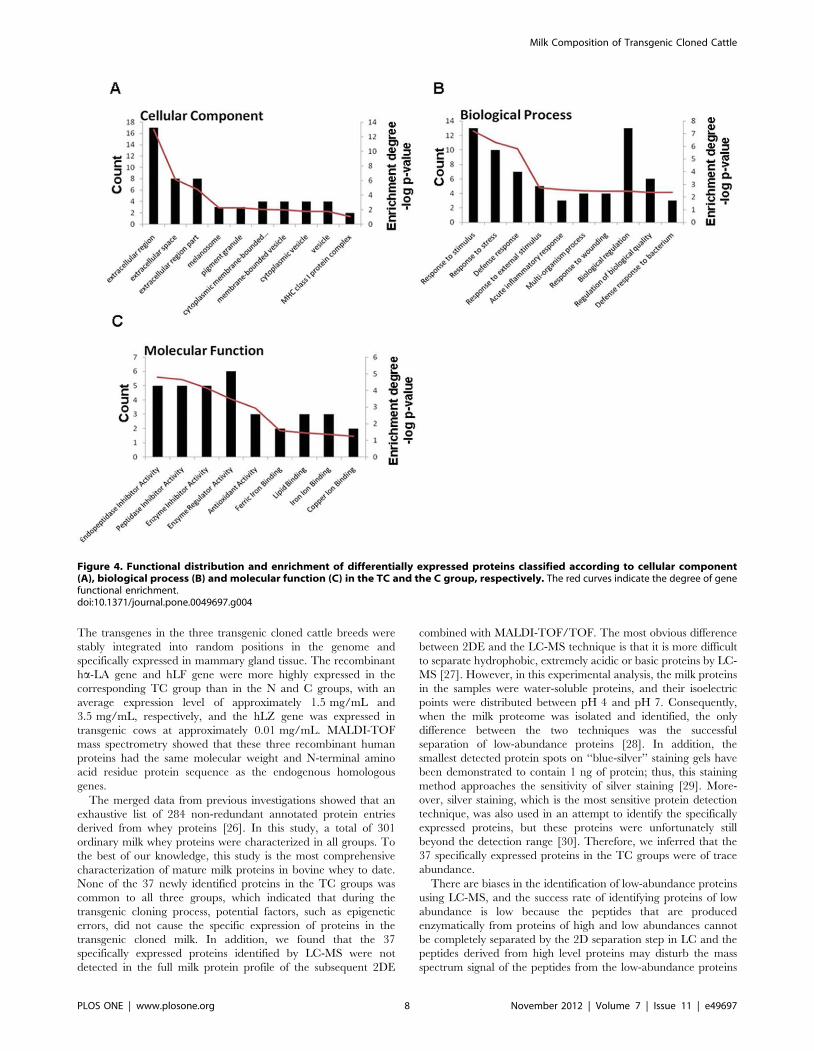
according to GO classifications (Figure 4). In terms of biological
processes, the majority of proteins belonged to the defense
response; when grouped by molecular function, the proteins most
commonly had endopeptidase inhibitor activity, and the majority
of proteins were components of the extracellular region.
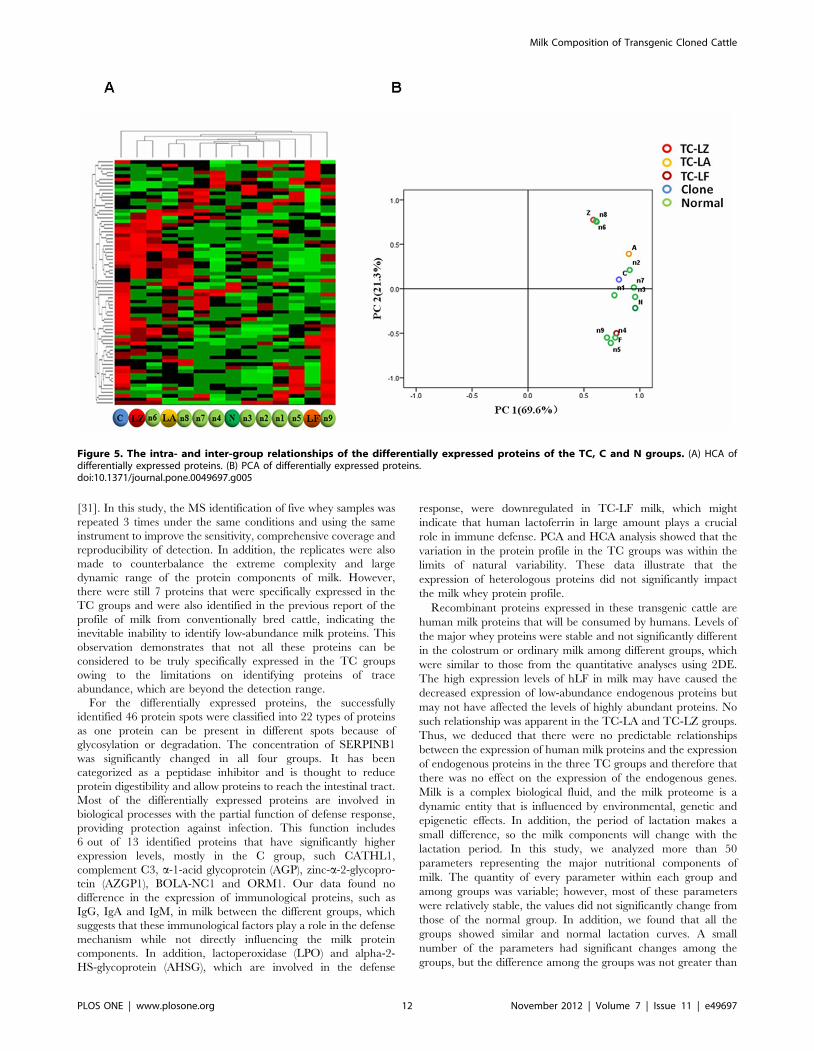
An unsupervised hierarchical cluster analysis (HCA) was used to
assess the effect of transgenes on, and the natural variability in,
milk protein profiles from the TC-LZ, TC-LA, TC-LF, C and N
Figure 1. Venn diagrams representation of whey protein profiles comparison of the TC-LZ (A), TC-LA (B), TC-LF (C) and all TC (D)groups were created with respect to the C and N groups, respectively. The gray ellipse indicates the proteins reported to be present inbovine milk in previously studies. The blue, green and red circles indicate the protein sets of the TC, C and N groups, respectively.doi:10.1371/journal.pone.0049697.g001
Milk Composition of Transgenic Cloned Cattle
PLOS ONE | www.plosone.org 3 November 2012 | Volume 7 | Issue 11 | e49697
groups in an unbiased manner. The heat map and hierarchical
tree revealed that there was no difference between any TC group
and the N group or between the direct clustering of the three TC
groups and the C group (Figure 5A). The TC-LZ and TC-LA
groups clustered with the normal samples n6 and n8, respectively.
The TC-LF group clustered with samples n1-n8, and the TC-LZ
and TC-LA groups both clustered with the normal sample n9.
These results indicated that each TC group was closer to the
normal samples than to the other TC groups or the C group.
A principal component analysis (PCA) was then used to analyze
the significant differentially expressed spots from the 2D data.
Specifically, there was no visible separation of any detected spots
between the TC and N samples within the first two components
(Figure 5B), with 69.6% of the variation allocated to the first
component (PC1) and 21.3% of the variation allocated to the
second component (PC2). These data showed a pattern largely
similar to that generated by the HCA analysis, in which the three
transgenes and their products showed very little impact on the
milk protein profiles greater than that of natural variability. Thus,
these data also suggest that the insertion of the three different
exogenous human genes has no major impact on the general milk
protein composition.
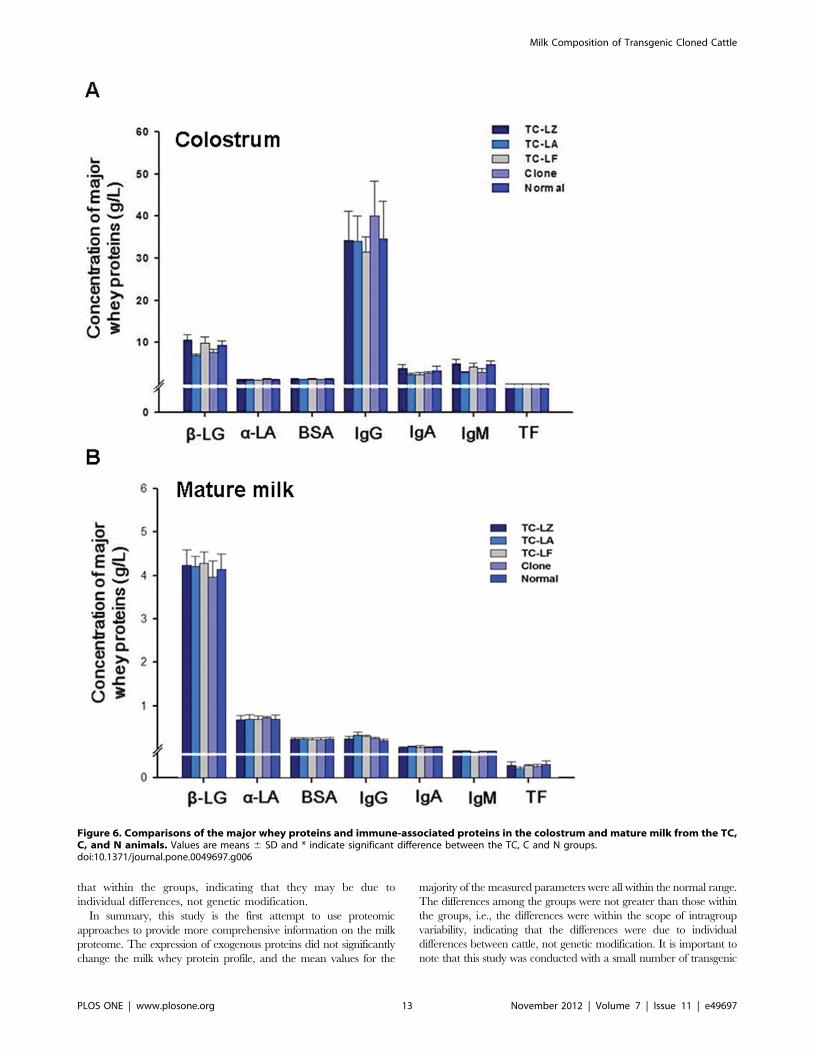
Quantitative Comparison of Abundant Whey Proteinsand Antibodies
An ELISA was used not only to obtain an accurate measure-
ment of the concentration of the major highly abundant bovine
whey proteins and immune-associated proteins (b-lactoglobulin, a-
lactalbumin, serum albumin, transferrin, IgG, IgM and IgA) in the
colostrum and mature milk for individual cows in the three TC
groups and the N group but also to verify the quantitative
proteomic results from the 2D PAGE statistical analyses.
Overall, the concentrations of these major whey proteins,
particularly the three most highly abundant whey proteins (b-
lactoglobulin, a-lactalbumin and bovine serum albumin), were
similar in the colostrum and mature milk and were not different
between the TC, C and N groups (Figure 6). Although there were
some minor fluctuations in the concentration of some proteins in
the colostrum and mature milk of the TC groups, the range in the
concentrations of the seven major whey proteins from the TC and
C groups were not significantly different from those from the N
group, which were largely within the bounds reported previously
for common breeds of dairy cows in China. The results showed
that the expression of additional human mammary gland-specific
genes (a-lactalbumin, lactoferrin and lysozyme) in bovine mam-
Figure 2. Functional distribution and enrichment of specifically expressed proteins classified according to cellular component (A),biological process (B) and molecular function (C) in the TC groups, respectively. The red curves indicate the degree of functionalenrichment of a particular gene.doi:10.1371/journal.pone.0049697.g002
Milk Composition of Transgenic Cloned Cattle
PLOS ONE | www.plosone.org 4 November 2012 | Volume 7 | Issue 11 | e49697
Ta
ble
1.
List
of
the
pro
tein
ssp
eci
fica
llye
xpre
sse
din
the
tran
sge
nic
gro
up
s.
No
.P
rote
inN
am
eA
cce
ssio
nN
o.
LZ
LA
LF
MW
(kD
a)
pI
Ce
llu
lar
Co
mp
on
en
tB
iolo
gic
al
Pro
cess
Mo
lecu
lar
Fu
nct
ion
1M
HC
CLA
SSI
HEA
VY
CH
AIN
(FR
AG
MEN
T)
IPI0
09
54
41
8.1
N*
ND{
19
.34
.79
me
mb
ran
e;
MH
Ccl
ass
Ip
rote
inco
mp
lex
imm
un
ere
spo
nse
;an
tig
en
pro
cess
ing
and
rese
nta
tio
nU{
2SE
RP
INA
3-2
IPI0
09
30
02
4.1
NN
D4
6.2
5.6
6e
xtra
cellu
lar
spac
e;
cyto
pla
smic
vesi
cle
Use
rin
e-t
ype
en
do
pe
pti
das
ein
hib
ito
rac
tivi
ty
32
2kD
aP
RO
TEI
NIP
I00
90
77
45
.1N
DN
22
.49
.71
UU
U
4SI
MIL
AR
TO
CY
CLO
PH
ILIN
B(F
RA
GM
ENT
)IP
I00
88
34
89
.1N
DN
11
.09
.74
Up
rote
info
ldin
gp
ep
tid
yl-p
roly
lci
s-tr
ans
iso
me
rase
acti
vity
5C
8G
PR
OT
EIN
IPI0
08
76
78
1.1
ND
N2
5.9
11
.1U
tran
spo
rtb
ind
ing
;tr
ansp
ort
er
acti
vity
6ER
AP
1P
RO
TEI
NIP
I00
86
72
38
.1N
ND
10
.75
.91
cyto
pla
smp
rote
oly
sis;
po
siti
vere
gu
lati
on
of
ang
iog
en
esi
sm
eta
llop
ep
tid
ase
acti
vity
;am
ino
pe
pti
das
eac
tivi
ty;
zin
cio
nb
ind
ing
7G
PR
56
PR
OT
EIN
IPI0
08
47
08
4.1
DN
D7
7.0
8.8
0in
teg
ral
tom
em
bra
ne
;p
lasm
am
em
bra
ne
cell
adh
esi
on
;b
rain
de
velo
pm
en
tn
eu
rop
ep
tid
esi
gn
alin
gp
ath
way
pro
tein
bin
din
g;
G-p
rote
inco
up
led
rece
pto
rac
tivi
ty
8K
RT
6A
PR
OT
EIN
IPI0
08
45
18
4.1
DN
N6
0.8
8.2
8ke
rati
nfi
lam
en
tU
stru
ctu
ral
mo
lecu
leac
tivi
ty
95
1kD
aP
RO
TEI
NIP
I00
84
16
72
.1D
NN
51
.24
.90
UU
U
10
13
kDa
PR
OT
EIN
IPI0
08
41
59
1.2
ND
N1
3.2
8.6
6U
UU
11
39
kDa
PR
OT
EIN
IPI0
08
41
00
3.2
ND
N3
8.8
8.7
3e
xtra
cellu
lar
reg
ion
UU
12
31
kDa
PR
OT
EIN
IPI0
08
40
96
2.2
DN
D3
0.7
4.4
4e
xtra
cellu
lar
reg
ion
UU
13
SIM
ILA
RT
OC
ALS
YN
TEN
IN-1
,P
AR
TIA
LIP
I00
83
82
41
.2N
DN
10
74
.73
UU
U
14
17
4kD
aP
RO
TEI
NIP
I00
83
80
35
.2N
ND
17
46
.52
UU
U
15
SIM
ILA
RT
OK
ERA
TIN
2IP
I00
82
48
47
.1D
NN
64
.38
.56
UU
U
16
SIM
ILA
RT
OC
D5
MO
LEC
ULE
LIK
EIP
I00
82
45
88
.2N
ND
82
.75
.19
UU
U
17
MH
CC
LASS
IA
NT
IGEN
(FR
AG
MEN
T)
IPI0
07
88
54
3.1
NN
D1
9.9
5.0
3m
em
bra
ne
;M
HC
clas
sI
pro
tein
com
ple
xan
tig
en
pro
cess
ing
and
pre
sen
tati
on
;im
mu
ne
resp
on
seU
18
NA
GLU
PR
OT
EIN
IPI0
07
17
55
4.3
DN
N7
4.1
5.8
1U
UU
19
HEM
OG
LOB
INSU
BU
NIT
BET
AIP
I00
71
64
55
.1N
DN
16
.07
.01
he
mo
glo
bin
com
ple
xtr
ansp
ort
;o
xyg
en
tran
spo
rtm
eta
lio
nb
ind
ing
;o
xyg
en
bin
din
g;
he
me
bin
din
g
20
CY
STEI
NE-
RIC
HSE
CR
ETO
RY
PR
OT
EIN
LCC
LD
OM
AIN
-C
ON
TA
ININ
G2
IPI0
07
15
72
4.4
ND
N5
5.6
8.6
7e
xtra
cellu
lar
mat
rix;
tran
spo
rtve
sicl
e;
ext
race
llula
rre
gio
ne
xtra
cellu
lar
mat
rix
org
aniz
atio
nh
ep
arin
bin
din
g
21
AC
TIN
-REL
AT
EDP
RO
TEI
N2
/3C
OM
PLE
XSU
BU
NIT
2IP
I00
71
53
64
.1D
NN
34
.36
.84
cyto
ske
leto
n;
cell
pro
ject
ion
cyto
pla
smre
gu
lati
on
of
acti
nfi
lam
en
tp
oly
me
riza
tio
nac
tin
bin
din
g
22
HEM
OG
LOB
INSU
BU
NIT
ALP
HA
IPI0
07
10
78
3.2
ND
N1
5.2
8.0
6h
em
og
lob
inco
mp
lex
oxy
ge
ntr
ansp
ort
he
me
bin
din
g;
oxy
ge
nb
ind
ing
;o
xyg
en
tran
spo
rte
rac
tivi
ty
23
MET
ALL
OP
RO
TEI
NA
SEIN
HIB
ITO
R1
IPI0
07
09
08
4.1
ND
N2
3.0
8.4
6b
ase
me
nt
me
mb
ran
ee
ryth
rocy
tem
atu
rati
on
;n
eg
ativ
ere
gu
lati
on
of
cata
lyti
cac
tivi
tym
eta
lio
nb
ind
ing
;m
eta
lloe
nd
op
ep
tid
ase
inh
ibit
or
acti
vity
Milk Composition of Transgenic Cloned Cattle
PLOS ONE | www.plosone.org 5 November 2012 | Volume 7 | Issue 11 | e49697
Ta
ble
1.
Co
nt.
No
.P
rote
inN
am
eA
cce
ssio
nN
o.
LZ
LA
LF
MW
(kD
a)
pI
Ce
llu
lar
Co
mp
on
en
tB
iolo
gic
al
Pro
cess
Mo
lecu
lar
Fu
nct
ion
24
END
OP
IN2
CIP
I00
70
55
94
.1D
ND
46
.75
.98
UU
seri
ne
-typ
ee
nd
op
ep
tid
ase
inh
ibit
or
acti
vity
25
TES
TIC
AN
1IP
I00
70
53
87
.2D
DN
49
.45
.34
pro
tein
ace
ou
se
xtra
cellu
lar
mat
rix
sig
nal
tran
sdu
ctio
nca
lciu
mio
nb
ind
ing
26
RP
E-SP
ON
DIN
IPI0
07
04
61
2.4
ND
N2
9.3
7.7
1e
xtra
cellu
lar
reg
ion
imm
un
ere
spo
nse
scav
en
ge
rre
cep
tor
acti
vity
;p
oly
sacc
har
ide
bin
din
g
27
RIB
ON
UC
LEA
SET
2IP
I00
70
43
64
.3N
DN
43
.59
.98
UU
RN
Ab
ind
ing
;ri
bo
nu
cle
ase
T2
acti
vity
28
VO
NW
ILLE
BR
AN
DFA
CT
OR
AD
OM
AIN
-CO
NT
AIN
ING
PR
OT
EIN
1
IPI0
07
01
88
0.2
DN
N4
3.7
8.7
1b
ase
me
nt
me
mb
ran
e;
inte
rsti
tial
mat
rix;
rib
oso
me
ext
race
llula
rm
atri
xo
rgan
izat
ion
;tr
ansl
atio
nst
ruct
ura
lco
nst
itu
en
to
fri
bo
som
e
29
BIG
LYC
AN
IPI0
06
97
08
1.2
ND
N4
1.6
6.8
3p
rote
inac
eo
us
ext
race
llula
rm
atri
x;sa
rco
lem
ma;
tran
spo
rtve
sicl
e
pe
pti
de
cro
ss-l
inki
ng
via
cho
nd
roit
in4
-su
lfat
eg
lyco
sam
ino
gly
can
gly
cosa
min
og
lyca
nb
ind
ing
;e
xtra
cellu
lar
mat
rix
bin
din
g
30
OST
EOP
ON
TIN
-KIP
I00
69
67
74
.1D
ND
31
.04
.56
ext
race
llula
rre
gio
nce
llad
he
sio
n;
oss
ific
atio
np
rote
inb
ind
ing
31
11
1kD
aP
RO
TEI
NIP
I00
69
50
31
.5D
ND
11
1.7
5.2
6U
UA
TP
bin
din
g
32
83
kDa
PR
OT
EIN
IPI0
06
94
67
8.3
DN
D8
3.2
6.1
5e
xtra
cellu
lar
reg
ion
Ue
nd
op
ep
tid
ase
inh
ibit
or
acti
vity
33
GEL
SOLI
NIP
I00
69
42
55
.2D
ND
80
.75
.54
cyto
pla
sm;
ext
race
llula
rre
gio
ncy
tosk
ele
ton
acti
nfi
lam
en
tca
pp
ing
;ci
lium
mo
rph
og
en
esi
sac
tin
bin
din
g;
me
tal
ion
bin
din
g
34
END
OP
LASM
INIP
I00
69
28
65
.2D
DN
92
.74
.77
cyto
sol;
en
do
pla
smic
reti
culu
m;
me
lan
oso
me
ER-a
sso
ciat
ed
pro
tein
cata
bo
licp
roce
ss;
pro
tein
fold
ing
;an
ti-
apo
pto
sis
RN
Ab
ind
ing
;A
TP
bin
din
g;
viri
on
bin
din
g
35
MFG
E8P
RO
TEI
NIP
I00
68
96
38
.1D
ND
47
.96
.80
ext
race
llula
rsp
ace
cell
adh
esi
on
ph
osp
hat
idyl
eth
ano
lam
ine
bin
din
g
36
DIP
EPT
IDY
LP
EPT
IDA
SEIII
IPI0
06
86
73
3.2
ND
N8
2.1
5.0
9cy
top
lasm
pro
teo
lysi
sd
ipe
pti
dyl
-pe
pti
das
eac
tivi
ty
37
PER
OX
IRED
OX
IN-1
IPI0
06
86
09
2.1
DD
N2
2.2
8.5
9m
ela
no
som
ere
gu
lati
on
of
NF-
kap
paB
imp
ort
into
nu
cle
us
thio
red
oxi
np
ero
xid
ase
acti
vity
*Pro
tein
sn
ot
de
tect
ed
by
LC-M
S/M
Sin
the
tran
sge
nic
gro
up
s(L
Z,
LAan
dLF
);{ P
rote
ins
de
tect
ed
by
LC-M
S/M
S;{ N
ofu
nct
ion
ann
ota
tio
n.
do
i:10
.13
71
/jo
urn
al.p
on
e.0
04
96
97
.t0
01
Milk Composition of Transgenic Cloned Cattle
PLOS ONE | www.plosone.org 6 November 2012 | Volume 7 | Issue 11 | e49697
mary glands had minimal impact on the levels of the major whey
proteins and immune-associated proteins, with all protein
concentrations within the range of the natural variability observed
in normal milk.
Quantitative Comparison of Milk Whey CompositionThe major nutritional components of the colostrum and milk
from the first three months of lactation from the TC, C and N
groups were compared. First, the proximates analysis showed that
the content of five principal milk nutrients of both the colostrum
and milk from the first three months of lactation was very similar
in all groups and was stable, which indicated that there are no
obvious changes in the major components of milk among the
groups (Figure 7). For a comparison of the micro composition,
more than 50 nutritional components were analyzed in the
colostrum and mature milk of all the groups, and more than 90%
of these components showed no significant difference among the
groups (Figure S1–S5). However, there was a minor variation in 7
components compared with the N group (p#0.05) as follows:
C16:1 in the mature milk of TC-LF; C20:4n6 in the mature milk
of C; Mg in the colostrum and mature milk of C and TC-LA,
respectively; Se and K in the mature milk of TC-LZ; and vitamin
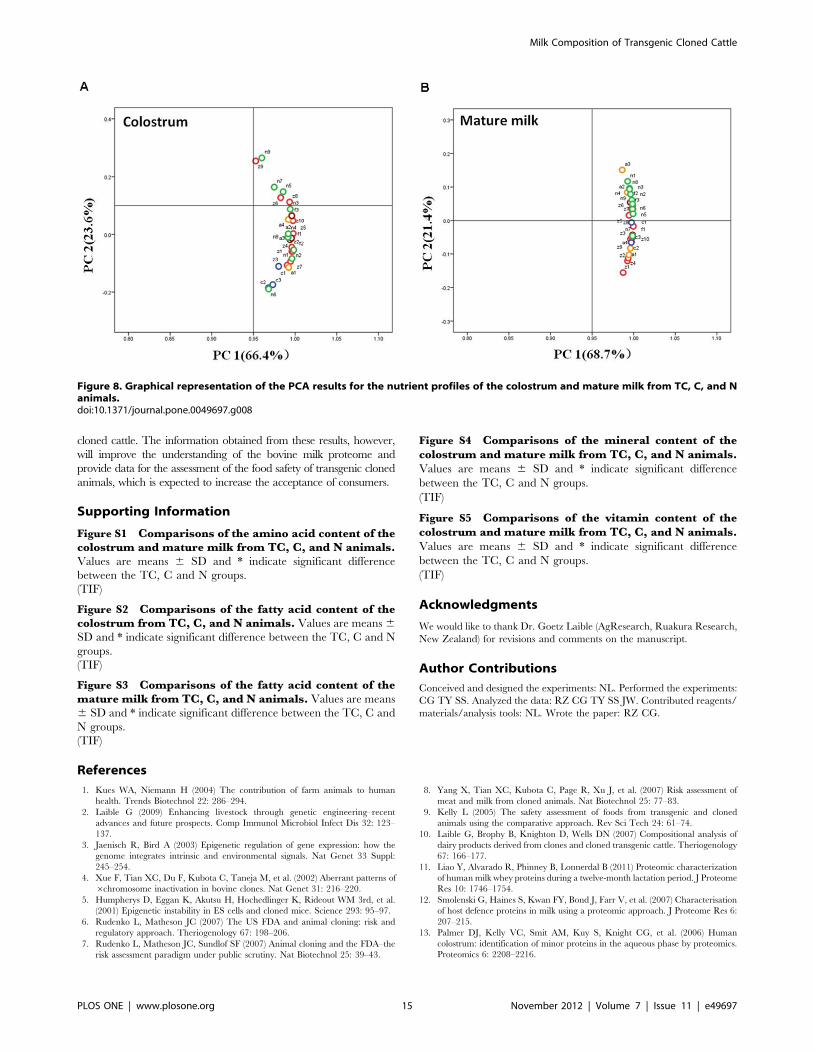
C in the mature milk of TC-LZ and TC-LF. PCA was used for
multivariate analyses of the intra- and inter-group relationships
among the TC, C and N groups. In both the colostrum and
mature milk, clusters were observed in the first two principal
components, which accounted for 66.4% and 23.6%, 68.7% and
21.4%, respectively. This finding indicates that the nutrient levels
in the TC and C groups are within the range of natural variability
(Figure 8).
Discussion
Although the use of transgenic cloning technology to increase
the expression of recombinant proteins in the mammary glands
has been successful, changes in intermolecular interactions caused
by the process of cloning transgenic animals are not yet fully
understood. Traditional analytical methods used to detect specific
components of transgenic food (such as nutritional substances,
allergens and other nutrients) are incapable of effectively assessing
potentially unpredictable changes. Some findings suggest that
somatic cloning technology does not induce changes in the main
nutrient content of cloned beef and milk [8,22–25]. However, thus
far, there have been no reports using proteomics to comprehen-
sively analyze milk from transgenic animals. Here, we analyzed the
protein composition and nutrient components of the colostrum
and mature milk from 17 transgenic cloned cows expressing one of
three mammary gland-specific genes, 3 cloned cows and 9 normal
cows using proteomics and metabolomics to analyze the maximum
number of unpredictable changes in the milk from TC animals.
Figure 3. Differentially expressed protein spots with great than 2-fold changes (p#0.05) in the TC and the C group compared to Ngroup. The red and green arrows indicate the protein spots that were significantly up- and downregulated, respectively, by at least 2-fold.doi:10.1371/journal.pone.0049697.g003
Milk Composition of Transgenic Cloned Cattle
PLOS ONE | www.plosone.org 7 November 2012 | Volume 7 | Issue 11 | e49697
The transgenes in the three transgenic cloned cattle breeds were
stably integrated into random positions in the genome and
specifically expressed in mammary gland tissue. The recombinant
ha-LA gene and hLF gene were more highly expressed in the
corresponding TC group than in the N and C groups, with an
average expression level of approximately 1.5 mg/mL and
3.5 mg/mL, respectively, and the hLZ gene was expressed in
transgenic cows at approximately 0.01 mg/mL. MALDI-TOF
mass spectrometry showed that these three recombinant human
proteins had the same molecular weight and N-terminal amino
acid residue protein sequence as the endogenous homologous
genes.
The merged data from previous investigations showed that an
exhaustive list of 284 non-redundant annotated protein entries
derived from whey proteins [26]. In this study, a total of 301
ordinary milk whey proteins were characterized in all groups. To
the best of our knowledge, this study is the most comprehensive
characterization of mature milk proteins in bovine whey to date.
None of the 37 newly identified proteins in the TC groups was
common to all three groups, which indicated that during the
transgenic cloning process, potential factors, such as epigenetic
errors, did not cause the specific expression of proteins in the
transgenic cloned milk. In addition, we found that the 37
specifically expressed proteins identified by LC-MS were not
detected in the full milk protein profile of the subsequent 2DE
combined with MALDI-TOF/TOF. The most obvious difference
between 2DE and the LC-MS technique is that it is more difficult
to separate hydrophobic, extremely acidic or basic proteins by LC-
MS [27]. However, in this experimental analysis, the milk proteins
in the samples were water-soluble proteins, and their isoelectric
points were distributed between pH 4 and pH 7. Consequently,
when the milk proteome was isolated and identified, the only
difference between the two techniques was the successful
separation of low-abundance proteins [28]. In addition, the
smallest detected protein spots on ‘‘blue-silver’’ staining gels have
been demonstrated to contain 1 ng of protein; thus, this staining
method approaches the sensitivity of silver staining [29]. More-
over, silver staining, which is the most sensitive protein detection
technique, was also used in an attempt to identify the specifically
expressed proteins, but these proteins were unfortunately still
beyond the detection range [30]. Therefore, we inferred that the
37 specifically expressed proteins in the TC groups were of trace
abundance.
There are biases in the identification of low-abundance proteins
using LC-MS, and the success rate of identifying proteins of low
abundance is low because the peptides that are produced
enzymatically from proteins of high and low abundances cannot
be completely separated by the 2D separation step in LC and the
peptides derived from high level proteins may disturb the mass
spectrum signal of the peptides from the low-abundance proteins
Figure 4. Functional distribution and enrichment of differentially expressed proteins classified according to cellular component(A), biological process (B) and molecular function (C) in the TC and the C group, respectively. The red curves indicate the degree of genefunctional enrichment.doi:10.1371/journal.pone.0049697.g004
Milk Composition of Transgenic Cloned Cattle
PLOS ONE | www.plosone.org 8 November 2012 | Volume 7 | Issue 11 | e49697
Ta
ble
2.
List
of
the
pro
tein
sd
iffe
ren
tial
lye
xpre
sse
din
the
tran
sge
nic
and
clo
ne
dg
rou
ps
com
par
eto
no
rmal
gro
up
.
No
.G
rou
pID
Pro
tein
na
me
Acc
ess
ion
No
.L
ZL
AL
FC
MW
(kD
a)
pI
Ce
llu
lar
Co
mp
on
en
tB
iolo
gic
al
Pro
cess
Mo
lecu
lar
Fu
nct
ion
13
2U
*U
q{
qU
UU
UU
26
6U
Uq
UU
UU
U
37
4LA
CT
OT
RA
NSF
ERR
INIP
I00
71
06
64
q7
8.1
8.6
8e
xtra
cellu
lar
reg
ion
;se
cre
tory
gra
nu
lece
llula
rir
on
ion
ho
me
ost
asis
;d
efe
nse
resp
on
seto
bac
teri
ah
ep
arin
bin
din
g;
ferr
icir
on
bin
din
g;
seri
ne
-typ
ep
ep
tid
ase
acti
vity
48
02
6kD
aP
RO
TEI
NIP
I00
90
64
71
26
.08
.41
ext
race
llula
rre
gio
nN{
N
58
4U
Uq
qU
UU
UU
61
01
UU
UU
UU
U
71
20
CSN
21
8kD
aP
RO
TEI
NIP
I00
71
29
94
Q1
18
.35
.13
ext
race
llula
rre
gio
ntr
ansp
ort
tran
spo
rte
rac
tivi
ty;
pro
tein
bin
din
g
81
76
UU
qU
UU
UU
91
79
26
kDa
PR
OT
EIN
IPI0
09
06
47
1Q
26
.08
.41
ext
race
llula
rre
gio
nN
N
10
19
9C
AT
HEL
ICID
IN-1
IPI0
07
17
08
5q
17
.68
.26
ext
race
llula
rre
gio
nd
efe
nse
resp
on
seN
11
20
2C
AT
HEL
ICID
IN-1
IPI0
07
17
08
5q
q1
7.6
8.2
6e
xtra
cellu
lar
reg
ion
de
fen
sere
spo
nse
N
12
20
3LA
CT
OT
RA
NSF
ERR
INIP
I00
71
06
64
q7
8.1
8.6
8e
xtra
cellu
lar
reg
ion
;se
cre
tory
gra
nu
lece
llula
rir
on
ion
ho
me
ost
asis
;d
efe
nse
resp
on
seto
bac
teri
ah
ep
arin
bin
din
g;
ferr
icir
on
bin
din
g;
seri
ne
-typ
ep
ep
tid
ase
acti
vity
13
20
4U
Uq
UU
UU
U
14
21
3LA
CT
OT
RA
NSF
ERR
INIP
I00
71
06
64
78
.18
.68
ext
race
llula
rre
gio
n;
secr
eto
ryg
ran
ule
cellu
lar
iro
nio
nh
om
eo
stas
is;
de
fen
sere
spo
nse
tob
acte
ria
he
par
inb
ind
ing
;fe
rric
iro
nb
ind
ing
;se
rin
e-t
ype
pe
pti
das
eac
tivi
ty
15
25
12
6kD
aP
RO
TEI
NIP
I00
90
64
71
26
.08
.41
ext
race
llula
rre
gio
nN
N
16
29
6C
SN2
18
kDa
PR
OT
EIN
IPI0
07
12
99
4Q
Q1
8.3
5.1
3e
xtra
cellu
lar
reg
ion
tran
spo
rttr
ansp
ort
er
acti
vity
;p
rote
inb
ind
ing
17
30
2U
UQ
UU
UU
U
18
30
9U
Uq
UU
UU
U
19
31
5C
SN2
18
kDa
PR
OT
EIN
IPI0
07
12
99
4Q
18
.35
.13
ext
race
llula
rre
gio
ntr
ansp
ort
tran
spo
rte
rac
tivi
ty;
pro
tein
bin
din
g
20
32
2U
Uq
QU
UU
UU
21
32
7C
SN2
18
kDa
PR
OT
EIN
IPI0
07
12
99
4Q
18
.35
.13
ext
race
llula
rre
gio
ntr
ansp
ort
tran
spo
rte
rac
tivi
ty;
pro
tein
bin
din
g
22
33
1U
Uq
UU
UU
U
23
33
2FG
G5
0kD
aP
RO
TEI
NIP
I00
84
32
09
50
.25
.45
ext
race
llula
rre
gio
nsi
gn
altr
ansd
uct
ion
pro
tein
bin
din
g
24
33
3P
IGM
ENT
EPIT
HEL
IUM
-D
ERIV
EDFA
CT
OR
IPI0
07
16
12
1q
q4
6.2
6.5
6e
xtra
cellu
lar
spac
e;
ext
race
llula
rm
atri
x;m
ela
no
som
e
ne
gat
ive
reg
ula
tio
no
fan
gio
ge
ne
sis;
reg
ula
tio
no
fp
rote
oly
sis
seri
ne
-typ
ee
nd
op
ep
tid
ase
inh
ibit
or
acti
vity
25
33
42
6kD
aP
RO
TEI
NIP
I00
90
64
71
Q2
6.0
8.4
1e
xtra
cellu
lar
reg
ion
NN
26
33
5U
Uq
UU
UU
U
Milk Composition of Transgenic Cloned Cattle
PLOS ONE | www.plosone.org 9 November 2012 | Volume 7 | Issue 11 | e49697
Ta
ble
2.
Co
nt.
No
.G
rou
pID
Pro
tein
na
me
Acc
ess
ion
No
.L
ZL
AL
FC
MW
(kD
a)
pI
Ce
llu
lar
Co
mp
on
en
tB
iolo
gic
al
Pro
cess
Mo
lecu
lar
Fu
nct
ion
27
33
7C
SN2
18
kDa
PR
OT
EIN
IPI0
07
12
99
4Q
18
.35
.13
ext
race
llula
rre
gio
ntr
ansp
ort
tran
spo
rte
rac
tivi
ty;
pro
tein
bin
din
g
28
33
8U
Uq
qU
UU
UU
29
33
9P
RO
STA
GLA
ND
IN-H
2D
-IS
OM
ERA
SEIP
I00
70
96
83
21
.26
.42
Go
lgi
app
arat
us;
ext
race
llula
rsp
ace
;n
ucl
ear
me
mb
ran
e
pro
stag
lan
din
bio
syn
the
tic
pro
cess
;re
gu
lati
on
of
circ
adia
nsl
ee
p/w
ake
cycl
e,
sle
ep
pro
stag
lan
din
-Dsy
nth
ase
acti
vity
;fa
tty
acid
bin
din
g
30
34
0C
SN2
18
kDa
PR
OT
EIN
IPI0
07
12
99
4Q
18
.35
.13
ext
race
llula
rre
gio
ntr
ansp
ort
tran
spo
rte
rac
tivi
ty;
pro
tein
bin
din
g
31
36
2LA
CT
OT
RA
NSF
ERR
INIP
I00
71
06
64
Q7
8.1
8.6
8e
xtra
cellu
lar
reg
ion
;se
cre
tory
gra
nu
lece
llula
rir
on
ion
ho
me
ost
asis
;d
efe
nse
resp
on
seto
bac
teri
ah
ep
arin
bin
din
g;
ferr
icir
on
bin
din
g;
seri
ne
-typ
ep
ep
tid
ase
acti
vity
32
40
3U
Uq
QU
UU
UU
33
42
0C
OM
PLE
MEN
TC
3IP
I00
71
35
05
qU
6.4
1e
xtra
cellu
lar
spac
e;
ext
race
llula
rre
gio
nin
flam
mat
ory
resp
on
se;
com
ple
me
nt
acti
vati
on
alte
rnat
ive
pat
hw
ay
en
do
pe
pti
das
ein
hib
ito
rac
tivi
ty
34
42
7C
AT
ION
ICT
RY
PSI
NIP
I00
70
64
27
q2
6.0
8.4
0e
xtra
cellu
lar
spac
ep
rote
oly
sis;
dig
est
ion
seri
ne
-typ
ee
nd
op
ep
tid
ase
acti
vity
;m
eta
lio
nb
ind
ing
35
42
9C
OM
PLE
MEN
TC
3IP
I00
71
35
05
q1
87
.36
.41
ext
race
llula
rsp
ace
;e
xtra
cellu
lar
reg
ion
infl
amm
ato
ryre
spo
nse
;co
mp
lem
en
tac
tiva
tio
n,
alte
rnat
ive
pat
hw
ay
en
do
pe
pti
das
ein
hib
ito
rac
tivi
ty
36
43
0U
Uq
UU
UU
U
37
43
4U
UQ
UU
UU
U
38
43
5Z
INC
-ALP
HA
-2-
GLY
CO
PR
OT
EIN
IPI0
06
98
99
3q
33
.95
.13
ext
race
llula
rre
gio
n;
me
mb
ran
e;
MH
Ccl
ass
Ip
rote
inco
mp
lex
imm
un
ere
spo
nse
;an
tig
en
pro
cess
ing
and
pre
sen
tati
on
N
39
43
8B
OLA
-NC
1IP
I00
71
01
00
q3
7.5
6.2
7m
em
bra
ne
imm
un
ere
spo
nse
N
40
44
2U
Uq
UU
UU
U
41
45
5C
AT
ION
ICT
RY
PSI
NIP
I00
70
64
27
q2
6.0
8.4
0e
xtra
cellu
lar
spac
ep
rote
oly
sis;
dig
est
ion
seri
ne
-typ
ee
nd
op
ep
tid
ase
acti
vity
;m
eta
lio
nb
ind
ing
42
45
9A
PO
LIP
OP
RO
TEI
NA
-IV
IPI0
06
95
96
5Q
43
.05
.29
chyl
om
icro
n;
hig
hd
en
sity
lipo
pro
tein
par
ticl
e
lipid
tran
spo
rt;
lipo
pro
tein
me
tab
olic
pro
cess
lipid
bin
din
g
43
46
9A
LPH
A-1
-AC
IDG
LYC
OP
RO
TEI
NIP
I00
69
12
12
q2
3.2
5.6
1e
xtra
cellu
lar
spac
ere
gu
lati
on
of
imm
un
esy
ste
mp
roce
ssN
44
47
0U
UQ
qU
UU
UU
45
47
4O
RM
12
3kD
aP
RO
TEI
NIP
I00
90
35
10
q2
3.2
5.9
9e
xtra
cellu
lar
spac
ere
gu
lati
on
of
imm
un
esy
ste
mp
roce
ssN
46
47
8A
LPH
A-1
-AC
IDG
LYC
OP
RO
TEI
NIP
I00
69
12
12
q2
3.2
5.6
1e
xtra
cellu
lar
spac
ere
gu
lati
on
of
imm
un
esy
ste
mp
roce
ssN
47
48
0U
Uq
UU
UU
U
Milk Composition of Transgenic Cloned Cattle
PLOS ONE | www.plosone.org 10 November 2012 | Volume 7 | Issue 11 | e49697
Ta
ble
2.
Co
nt.
No
.G
rou
pID
Pro
tein
na
me
Acc
ess
ion
No
.L
ZL
AL
FC
MW
(kD
a)
pI
Ce
llu
lar
Co
mp
on
en
tB
iolo
gic
al
Pro
cess
Mo
lecu
lar
Fu
nct
ion
48
48
3A
LPH
A-1
-AC
IDG
LYC
OP
RO
TEI
NIP
I00
69
12
12
q2
3.2
5.6
1e
xtra
cellu
lar
spac
ere
gu
lati
on
of
imm
un
esy
ste
mp
roce
ssN
49
48
4C
AT
HEP
SIN
BIP
I00
69
20
61
q3
6.7
5.6
8ly
soso
me
;m
ito
cho
nd
rio
np
rote
oly
sis;
reg
ula
tio
no
fca
taly
tic
acti
vity
cyst
ein
e-t
ype
en
do
pe
pti
das
eac
tivi
ty
50
49
7U
Uq
UU
UU
U
51
50
3SE
RP
INB
1LE
UK
OC
YT
EEL
AST
ASE
INH
IBIT
OR
IPI0
07
10
78
9q
q4
2.2
5.7
0cy
top
lasm
reg
ula
tio
no
fp
rote
oly
sis
seri
ne
-typ
ee
nd
op
ep
tid
ase
inh
ibit
or
acti
vity
52
50
5U
UQ
UU
UU
U
53
50
6U
UQ
UU
UU
U
54
52
7A
LBP
RO
TEI
NIP
I00
70
83
98
Q6
9.5
5.8
2e
xtra
cellu
lar
spac
etr
ansp
ort
N
55
52
9A
LBP
RO
TEI
NIP
I00
70
83
98
Q6
9.5
5.8
2e
xtra
cellu
lar
spac
etr
ansp
ort
N
56
54
5A
LBP
RO
TEI
NIP
I00
70
83
98
Q6
9.5
5.8
2e
xtra
cellu
lar
spac
etr
ansp
ort
N
57
56
1U
Uq
UU
UU
U
58
56
5U
Uq
UU
UU
U
59
58
7U
Uq
UU
UU
U
60
66
3A
LPH
A-2
-HS-
GLY
CO
PR
OT
EIN
IPI0
07
07
10
1Q
38
.45
.25
ext
race
llula
rsp
ace
acu
te-p
has
ere
spo
nse
;o
ssif
icat
ion
;re
gu
lati
on
of
infl
amm
ato
ryre
spo
nse
cyst
ein
e-t
ype
en
do
pe
pti
das
ein
hib
ito
rac
tivi
ty
61
66
9A
LPH
A-2
-HS-
GLY
CO
PR
OT
EIN
IPI0
07
07
10
1Q
38
.45
.25
ext
race
llula
rsp
ace
acu
te-p
has
ere
spo
nse
;o
ssif
icat
ion
;re
gu
lati
on
of
infl
amm
ato
ryre
spo
nse
cyst
ein
e-t
ype
en
do
pe
pti
das
ein
hib
ito
rac
tivi
ty
62
67
42
6kD
aP
RO
TEI
NIP
I00
90
64
71
Q2
6.0
8.4
1e
xtra
cellu
lar
reg
ion
NN
63
69
7H
SPA
8H
EAT
SHO
CK
CO
GN
AT
E7
1kD
aP
RO
TEI
NIP
I00
70
85
26
Q7
1.2
5.3
7ce
llsu
rfac
e;
nu
cle
olu
s;m
ela
no
som
ere
spo
nse
tost
ress
;re
gu
lati
on
of
cell
cycl
eA
TP
bin
din
g;
AT
Pas
eac
tivi
ty,
cou
ple
d
64
70
0A
LPH
A-1
B-
GLY
CO
PR
OT
EIN
IPI0
06
92
68
6Q
53
.65
.29
ext
race
llula
rre
gio
nN
N
65
71
5SE
RO
TR
AN
SFER
RIN
IPI0
06
90
53
4Q
77
.86
.75
ext
race
llula
rre
gio
nce
llula
rir
on
ion
ho
me
ost
asis
ferr
icir
on
bin
din
g
66
72
3SE
RO
TR
AN
SFER
RIN
IPI0
06
90
53
4Q
77
.86
.75
ext
race
llula
rre
gio
nce
llula
rir
on
ion
ho
me
ost
asis
ferr
icir
on
bin
din
g
67
72
9P
IGR
ISO
FOR
MLO
NG
OF
PO
LYM
ERIC
IMM
UN
OG
LOB
ULI
NR
ECEP
TO
R
IPI0
06
96
71
4q
82
.47
.07
ext
race
llula
rre
gio
n;
pla
sma
me
mb
ran
eN
N
68
73
7LA
CT
OP
ERO
XID
ASE
IPI0
07
16
15
7Q
80
.68
.83
ext
race
llula
rsp
ace
de
fen
sere
spo
nse
tob
acte
ria;
hyd
rog
en
pe
roxi
de
cata
bo
licp
roce
ss
he
me
bin
din
g;
pe
roxi
das
eac
tivi
ty
69
77
2C
OM
PLE
MEN
TC
3IP
I00
71
35
05
q1
87
.36
.41
ext
race
llula
rsp
ace
;e
xtra
cellu
lar
reg
ion
infl
amm
ato
ryre
spo
nse
;co
mp
lem
en
tac
tiva
tio
n,
alte
rnat
ive
pat
hw
ay
en
do
pe
pti
das
ein
hib
ito
rac
tivi
ty
70
79
9C
AT
ION
ICT
RY
PSI
NIP
I00
70
64
27
Q2
6.0
8.4
0e
xtra
cellu
lar
spac
ep
rote
oly
sis;
dig
est
ion
seri
ne
-typ
ee
nd
op
ep
tid
ase
acti
vity
;m
eta
lio
nb
ind
ing
*Pro
tein
sn
ot
ide
nti
fie
db
yM
ALD
I-T
OF/
TO
F;{ U
pre
gu
late
dp
rote
ins
sho
win
gg
reat
er
than
2-f
old
chan
ge
sin
the
TC
(LZ
,LA
and
LF)
and
Cg
rou
ps
com
par
ed
toN
gro
up
(p#
0.0
5);
{ No
fun
ctio
nan
no
tati
on
;1D
ow
nre
gu
late
dp
rote
ins
sho
win
gg
reat
er
than
2-f
old
chan
ge
sin
the
TC
and
Cg
rou
ps
com
par
ed
toN
gro
up
(p#
0.0
5).
do
i:10
.13
71
/jo
urn
al.p
on
e.0
04
96
97
.t0
02
Milk Composition of Transgenic Cloned Cattle
PLOS ONE | www.plosone.org 11 November 2012 | Volume 7 | Issue 11 | e49697
[31]. In this study, the MS identification of five whey samples was
repeated 3 times under the same conditions and using the same
instrument to improve the sensitivity, comprehensive coverage and
reproducibility of detection. In addition, the replicates were also
made to counterbalance the extreme complexity and large
dynamic range of the protein components of milk. However,
there were still 7 proteins that were specifically expressed in the
TC groups and were also identified in the previous report of the
profile of milk from conventionally bred cattle, indicating the
inevitable inability to identify low-abundance milk proteins. This
observation demonstrates that not all these proteins can be
considered to be truly specifically expressed in the TC groups
owing to the limitations on identifying proteins of trace
abundance, which are beyond the detection range.
For the differentially expressed proteins, the successfully
identified 46 protein spots were classified into 22 types of proteins
as one protein can be present in different spots because of
glycosylation or degradation. The concentration of SERPINB1
was significantly changed in all four groups. It has been
categorized as a peptidase inhibitor and is thought to reduce
protein digestibility and allow proteins to reach the intestinal tract.
Most of the differentially expressed proteins are involved in
biological processes with the partial function of defense response,
providing protection against infection. This function includes
6 out of 13 identified proteins that have significantly higher
expression levels, mostly in the C group, such CATHL1,
complement C3, a-1-acid glycoprotein (AGP), zinc-a-2-glycopro-
tein (AZGP1), BOLA-NC1 and ORM1. Our data found no
difference in the expression of immunological proteins, such as
IgG, IgA and IgM, in milk between the different groups, which
suggests that these immunological factors play a role in the defense
mechanism while not directly influencing the milk protein
components. In addition, lactoperoxidase (LPO) and alpha-2-
HS-glycoprotein (AHSG), which are involved in the defense
response, were downregulated in TC-LF milk, which might
indicate that human lactoferrin in large amount plays a crucial
role in immune defense. PCA and HCA analysis showed that the
variation in the protein profile in the TC groups was within the
limits of natural variability. These data illustrate that the
expression of heterologous proteins did not significantly impact
the milk whey protein profile.
Recombinant proteins expressed in these transgenic cattle are
human milk proteins that will be consumed by humans. Levels of
the major whey proteins were stable and not significantly different
in the colostrum or ordinary milk among different groups, which
were similar to those from the quantitative analyses using 2DE.
The high expression levels of hLF in milk may have caused the
decreased expression of low-abundance endogenous proteins but
may not have affected the levels of highly abundant proteins. No
such relationship was apparent in the TC-LA and TC-LZ groups.
Thus, we deduced that there were no predictable relationships
between the expression of human milk proteins and the expression
of endogenous proteins in the three TC groups and therefore that
there was no effect on the expression of the endogenous genes.
Milk is a complex biological fluid, and the milk proteome is a
dynamic entity that is influenced by environmental, genetic and
epigenetic effects. In addition, the period of lactation makes a
small difference, so the milk components will change with the
lactation period. In this study, we analyzed more than 50
parameters representing the major nutritional components of
milk. The quantity of every parameter within each group and
among groups was variable; however, most of these parameters
were relatively stable, the values did not significantly change from
those of the normal group. In addition, we found that all the
groups showed similar and normal lactation curves. A small
number of the parameters had significant changes among the
groups, but the difference among the groups was not greater than
Figure 5. The intra- and inter-group relationships of the differentially expressed proteins of the TC, C and N groups. (A) HCA ofdifferentially expressed proteins. (B) PCA of differentially expressed proteins.doi:10.1371/journal.pone.0049697.g005
Milk Composition of Transgenic Cloned Cattle
PLOS ONE | www.plosone.org 12 November 2012 | Volume 7 | Issue 11 | e49697
that within the groups, indicating that they may be due to
individual differences, not genetic modification.
In summary, this study is the first attempt to use proteomic
approaches to provide more comprehensive information on the milk
proteome. The expression of exogenous proteins did not significantly
change the milk whey protein profile, and the mean values for the
majority of the measured parameters were all within the normal range.
The differences among the groups were not greater than those within
the groups, i.e., the differences were within the scope of intragroup
variability, indicating that the differences were due to individual
differences between cattle, not genetic modification. It is important to
note that this study was conducted with a small number of transgenic
Figure 6. Comparisons of the major whey proteins and immune-associated proteins in the colostrum and mature milk from the TC,C, and N animals. Values are means 6 SD and * indicate significant difference between the TC, C and N groups.doi:10.1371/journal.pone.0049697.g006
Milk Composition of Transgenic Cloned Cattle
PLOS ONE | www.plosone.org 13 November 2012 | Volume 7 | Issue 11 | e49697
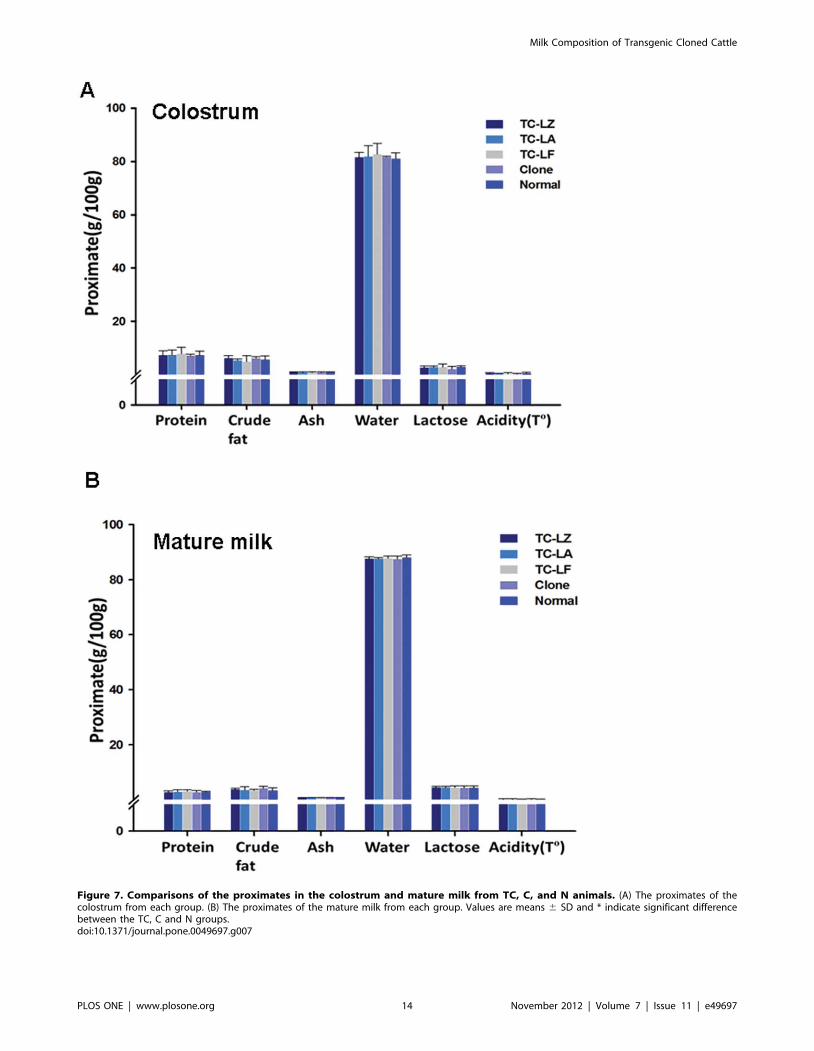
Figure 7. Comparisons of the proximates in the colostrum and mature milk from TC, C, and N animals. (A) The proximates of thecolostrum from each group. (B) The proximates of the mature milk from each group. Values are means 6 SD and * indicate significant differencebetween the TC, C and N groups.doi:10.1371/journal.pone.0049697.g007
Milk Composition of Transgenic Cloned Cattle
PLOS ONE | www.plosone.org 14 November 2012 | Volume 7 | Issue 11 | e49697
cloned cattle. The information obtained from these results, however,
will improve the understanding of the bovine milk proteome and
provide data for the assessment of the food safety of transgenic cloned
animals, which is expected to increase the acceptance of consumers.
Supporting Information
Figure S1 Comparisons of the amino acid content of thecolostrum and mature milk from TC, C, and N animals.Values are means 6 SD and * indicate significant difference
between the TC, C and N groups.
(TIF)
Figure S2 Comparisons of the fatty acid content of thecolostrum from TC, C, and N animals. Values are means 6
SD and * indicate significant difference between the TC, C and N
groups.
(TIF)
Figure S3 Comparisons of the fatty acid content of themature milk from TC, C, and N animals. Values are means
6 SD and * indicate significant difference between the TC, C and
N groups.
(TIF)
Figure S4 Comparisons of the mineral content of thecolostrum and mature milk from TC, C, and N animals.Values are means 6 SD and * indicate significant difference
between the TC, C and N groups.
(TIF)
Figure S5 Comparisons of the vitamin content of thecolostrum and mature milk from TC, C, and N animals.Values are means 6 SD and * indicate significant difference
between the TC, C and N groups.
(TIF)
Acknowledgments
We would like to thank Dr. Goetz Laible (AgResearch, Ruakura Research,
New Zealand) for revisions and comments on the manuscript.
Author Contributions
Conceived and designed the experiments: NL. Performed the experiments:
CG TY SS. Analyzed the data: RZ CG TY SS JW. Contributed reagents/
materials/analysis tools: NL. Wrote the paper: RZ CG.
References
1. Kues WA, Niemann H (2004) The contribution of farm animals to human
health. Trends Biotechnol 22: 286–294.
2. Laible G (2009) Enhancing livestock through genetic engineering–recent
advances and future prospects. Comp Immunol Microbiol Infect Dis 32: 123–
137.
3. Jaenisch R, Bird A (2003) Epigenetic regulation of gene expression: how the
genome integrates intrinsic and environmental signals. Nat Genet 33 Suppl:
245–254.
4. Xue F, Tian XC, Du F, Kubota C, Taneja M, et al. (2002) Aberrant patterns of
6chromosome inactivation in bovine clones. Nat Genet 31: 216–220.
5. Humpherys D, Eggan K, Akutsu H, Hochedlinger K, Rideout WM 3rd, et al.
(2001) Epigenetic instability in ES cells and cloned mice. Science 293: 95–97.
6. Rudenko L, Matheson JC (2007) The US FDA and animal cloning: risk and
regulatory approach. Theriogenology 67: 198–206.
7. Rudenko L, Matheson JC, Sundlof SF (2007) Animal cloning and the FDA–the
risk assessment paradigm under public scrutiny. Nat Biotechnol 25: 39–43.
8. Yang X, Tian XC, Kubota C, Page R, Xu J, et al. (2007) Risk assessment of
meat and milk from cloned animals. Nat Biotechnol 25: 77–83.
9. Kelly L (2005) The safety assessment of foods from transgenic and cloned
animals using the comparative approach. Rev Sci Tech 24: 61–74.
10. Laible G, Brophy B, Knighton D, Wells DN (2007) Compositional analysis of
dairy products derived from clones and cloned transgenic cattle. Theriogenology
67: 166–177.
11. Liao Y, Alvarado R, Phinney B, Lonnerdal B (2011) Proteomic characterization
of human milk whey proteins during a twelve-month lactation period. J Proteome
Res 10: 1746–1754.
12. Smolenski G, Haines S, Kwan FY, Bond J, Farr V, et al. (2007) Characterisation
of host defence proteins in milk using a proteomic approach. J Proteome Res 6:
207–215.
13. Palmer DJ, Kelly VC, Smit AM, Kuy S, Knight CG, et al. (2006) Human
colostrum: identification of minor proteins in the aqueous phase by proteomics.
Proteomics 6: 2208–2216.
Figure 8. Graphical representation of the PCA results for the nutrient profiles of the colostrum and mature milk from TC, C, and Nanimals.doi:10.1371/journal.pone.0049697.g008
Milk Composition of Transgenic Cloned Cattle
PLOS ONE | www.plosone.org 15 November 2012 | Volume 7 | Issue 11 | e49697
14. Wang J, Yang P, Tang B, Sun X, Zhang R, et al. (2008) Expression and
characterization of bioactive recombinant human alpha-lactalbumin in the milkof transgenic cloned cows. J Dairy Sci 91: 4466–4476.
15. Yang P, Wang J, Gong G, Sun X, Zhang R, et al. (2008) Cattle mammary
bioreactor generated by a novel procedure of transgenic cloning for large-scaleproduction of functional human lactoferrin. PLoS One 3: e3453.
16. Yang B, Wang J, Tang B, Liu Y, Guo C, et al. (2011) Characterization ofbioactive recombinant human lysozyme expressed in milk of cloned transgenic
cattle. PLoS One 6: e17593.
17. Nesvizhskii AI, Keller A, Kolker E, Aebersold R (2003) A statistical model foridentifying proteins by tandem mass spectrometry. Anal Chem 75: 4646–4658.
18. Shevchenko A, Tomas H, Havlis J, Olsen JV, Mann M (2006) In-gel digestionfor mass spectrometric characterization of proteins and proteomes. Nat Protoc 1:
2856–2860.19. Smolenski G, Haines S, Kwan FY, Bond J, Farr V, et al. (2007) Characterisation
of host defence proteins in milk using a proteomic approach. J Proteome Res 6:
207–215.20. D’Amato A, Bachi A, Fasoli E, Boschetti E, Peltre G, et al. (2009) In-depth
exploration of cow’s whey proteome via combinatorial peptide ligand libraries.J Proteome Res 8: 3925–3936.
21. Le A, Barton LD, Sanders JT, Zhang Q (2011) Exploration of bovine milk
proteome in colostral and mature whey using an ion-exchange approach.J Proteome Res 10: 692–704.
22. Heyman Y, Chavatte-Palmer P, Berthelot V, Fromentin G, Hocquette JF, et al.(2007) Assessing the quality of products from cloned cattle: an integrative
approach. Theriogenology 67: 134–141.
23. Tian XC, Kubota C, Sakashita K, Izaike Y, Okano R, et al. (2005) Meat and
milk compositions of bovine clones. Proc Natl Acad Sci U S A 102: 6261–6266.
24. Walker SC, Christenson RK, Ruiz RP, Reeves DE, Pratt SL, et al. (2007)
Comparison of meat composition from offspring of cloned and conventionally
produced boars. Theriogenology 67: 178–184.
25. Norman HD, Walsh MK (2004) Performance of dairy cattle clones and
evaluation of their milk composition. Cloning Stem Cells 6: 157–164.
26. D’Alessandro A, Zolla L, Scaloni A (2011) The bovine milk proteome:
cherishing, nourishing and fostering molecular complexity. An interactomics
and functional overview. Mol Biosyst 7: 579–597.
27. Gorg A, Drews O, Luck C, Weiland F, Weiss W (2009) 2-DE with IPGs.
Electrophoresis 30 Suppl 1: S122–132.
28. Mann M, Kelleher NL (2008) Precision proteomics: the case for high resolution
and high mass accuracy. Proc Natl Acad Sci U S A 105: 18132–18138.
29. Candiano G, Bruschi M, Musante L, Santucci L, Ghiggeri GM, et al. (2004)
Blue silver: a very sensitive colloidal Coomassie G-250 staining for proteome
analysis. Electrophoresis 25: 1327–1333.
30. Pink M, Verma N, Rettenmeier AW, Schmitz-Spanke S (2010) CBB staining
protocol with higher sensitivity and mass spectrometric compatibility. Electro-
phoresis 31: 593–598.
31. Gygi SP, Corthals GL, Zhang Y, Rochon Y, Aebersold R (2000) Evaluation of
two-dimensional gel electrophoresis-based proteome analysis technology. Proc
Natl Acad Sci U S A 97: 9390–9395.
Milk Composition of Transgenic Cloned Cattle
PLOS ONE | www.plosone.org 16 November 2012 | Volume 7 | Issue 11 | e49697