Embed Size (px)
Citation preview
TOWN OF WINDSOR, CONNECTICUT COMPREHENSIVE ANNUAL FINANCIAL REPORT
JUNE 30, 2015
For the Fiscal Year Ended June 30, 2015

The Town of Windsor, Connecticut
Comprehensive Annual Financial Report
Fiscal Year Ended June 30, 2015
Prepared by: Department of Financial Accounting & Reporting
Robert Metcalf Finance Director
James Bourke Linda Collins
Assistant Finance Director Town Accountant

Contents
I. Introductory Section – Unaudited Letter of Transmittal i-v Certificate of Achievement for Excellence in Financial Reporting vi Organization Chart - Windsor Town Government vii Principal Town Officials viii
II. Financial Section
Independent Auditor’s Report 1-3 Management’s Discussion and Analysis - Unaudited 5-14
Basic Financial Statements Government-Wide Financial Statements: Statement of net position (deficits) 15 Statement of activities 16
Fund Financial Statements:
Balance sheet – governmental funds 17 Statement of revenues, expenditures and changes in fund balances -
governmental funds 18 Statement of revenues, expenditures and changes in fund balances of
governmental funds to the statement of activities 19 Statement of net position (deficits) – proprietary funds 20 Statement of revenues, expenses and changes in fund net position (deficits) -
proprietary funds 21 Statement of cash flows – proprietary funds 22 Statement of fiduciary net position – fiduciary funds 23 Statement of changes in fiduciary net position – pension and OPEB trust funds 24 Notes to financial statements 25-65
Contents
Required Supplementary Information - Unaudited
Schedule of investment returns – defined benefit plan 67 Schedule of employer contributions – defined benefit plan 68 Schedule of changes in net pension liability (NPL) and related ratios – defined benefit
plan 69 Schedule of contributions – MERS 70 Schedule of the Town’s proportionate share of the net pension liability - MERS 71 Schedule of the Town’s proportionate share of the net pension liability – teachers’
retirement system 72 Schedule of funding progress and schedule of employer contributions – OPEB 73 Statement of revenues, expenditures and changes in budgetary fund balance –
budgetary basis – budget and actual – general fund 74 Note to required supplementary information 75-76
Combining and Individual Fund Financial Statements and Other Schedules
Nonmajor Governmental Funds
Combining balance sheet – nonmajor governmental funds 78-79 Combining statement of revenues, expenditures and changes in fund balances –
nonmajor governmental funds 80-81
Nonmajor Enterprise Funds
Combining statement of net positions – nonmajor enterprise funds 83 Combining statement of revenues, expenses and changes in fund net positions –
nonmajor enterprise funds 84 Combining statement of cash flows – nonmajor enterprise funds 85
Fiduciary Funds
Combining statement of changes in assets and liabilities – agency funds 87
Capital Asset Schedule
Capital assets used in the operation of governmental funds – net of depreciation 89
Other Schedules
Balance sheet – by account – general fund 91 Schedule of revenues, expenditures and changes in fund balance – by account –
general fund 92 Schedule of property taxes levied, collected and outstanding 94-95 Schedule of changes in bond indebtedness 96-97
Contents
III. Statistical Section – Unaudited
Net position by component 100-101 Changes in net position 102-105 Program revenues by function/program 106-107 Fund balances, governmental funds 108-109 Changes in fund balances, governmental funds 110-111 Tax revenues by source, governmental funds 112 Assessed value and estimated actual value of taxable property 114-115 Principal property taxpayers 116 Property tax levies and collections 118-119 Ratios of net general bonded debt outstanding by type 120 Direct and overlapping governmental activities debt 121 Legal debt margin information 122-123 Schedule of debt limitation 124 Calculation of direct debt and current debt ratios 125 Demographic and economic statistics 126 Principal employers 127 Full-time equivalent town government employees by functions/programs 128-131 Operating indicators by function/program 132-133 Capital asset statistics by function/program 134-135


Introductory Section

275 Broad Street • Windsor, Connecticut 06095 • www.townofwindsorct.com i
December 30, 2015
To the Honorable Mayor and Members of the Windsor Town Council Town of Windsor, Connecticut State law requires that every general-purpose local government publish within six months of the close of each fiscal year a complete set of audited financial statements. This report is published to fulfill that requirement for the fiscal year ended June 30, 2015. Management assumes full responsibility for the completeness and reliability of the information contained in this report, based upon a comprehensive framework of internal control that it has established for this purpose. Because the cost of internal control should not exceed anticipated benefits, the objective is to provide reasonable, rather than absolute, assurance that the financial statements are free of any material misstatements. RSM US LLP, Certified Public Accountants, has issued an unmodified opinion on the Town of Windsor’s financial statements for the year ended June 30, 2015. The independent auditor’s report is located at the front of the financial statement section of this annual report. The independent audit of the financial statements of the Town of Windsor was part of a broader state and federally mandated Single Audit designed to meet the special needs of federal and state grantor agencies. The standards governing the Federal and State Single Audit engagements require the independent auditor to report not only on the fair presentation of the financial statements, but also on the audited government’s internal controls over financial reporting and compliance for each ,major federal and state programs. These reports are available in the Town of Windsor’s separately issued Federal and State Compliance Reports. Management’s discussion and analysis (MD&A) immediately follows the independent auditor’s report and provides a narrative introduction, overview, and analysis of the basic financial statements. MD&A complements this letter of transmittal and should be read in conjunction with it.
ii
The financial reporting entity (the government) includes all the funds of the primary government (i.e., the Town of Windsor as legally defined), as well as all of its component units. Component units are legally separate entities for which the primary government is financially accountable. There are no agencies or entities that should be, but are not, combined with the financial statements of the Town. The Government Finance Officers Association of the United States and Canada (GFOA) awarded a Certificate of Achievement for Excellence in Financial Reporting to the Town of Windsor for its comprehensive annual financial report for the fiscal year ended June 30, 2014. This was the 30th consecutive year that the government has achieved this prestigious award. In order to be awarded a Certificate of Achievement, a government must publish an easily readable and efficiently organized comprehensive annual financial report. This report must satisfy both generally accepted accounting principles and applicable legal requirements. A Certificate of Achievement is valid for a period of one year only. We believe that our current comprehensive annual financial report continues to meet the Certificate of Achievement Program’s requirements and we are submitting it to the GFOA to determine its eligibility for another certificate. ORGANIZATION Description of the Town and Organization Windsor is the location of the first English settlement in Connecticut, settled in 1633 by a congregation relocating from the Plymouth Colony. Bordering Hartford to the north, Windsor covers a 31.1 square mile area on the west bank of the Connecticut River. It is located an equal distance from New York and Boston. The Town center is only minutes from Bradley International Airport and is also well served by a railway to New Haven and New York. Interstate 91, a major expressway to New York and northern New England, traverses the Town, as does the Farmington River. The Town of Windsor is organized under the Council Manager form of government. The Town Charter was recognized in the 1947 session of the General Assembly of Connecticut and approved by a referendum vote of the Town in the same year. It has been amended by a special act of the State Legislature and in 1998 by local referenda under the permissive features of the home rule law for Connecticut municipalities. A bipartisan Council of nine members elected biennially performs the legislative function. The Town Council elects a Mayor from its membership for the two year term. The Town Manager is the Chief Executive Officer of the Town and is directly responsible to the Town Council for the administration of municipal operations. The Town provides a comprehensive range of municipal services as directed by the statutes of the State of Connecticut and the charter of the Town of Windsor. These include: education, library services, recreation, health, social services, police and fire protection, regulation of commercial development, construction and maintenance of public infrastructure, and general administrative services. Other highly desirable services are available, with no or limited impact on the taxpayer dollars, through the Town of Windsor's four enterprise funds. A Sanitary Landfill is operated in conjunction with the Town of Bloomfield; the Discovery Center provides early childhood education to Windsor residents and employees of local businesses; and the Caring Connection provides an alternative to institutional care for elderly and handicapped adults in the town. The Landfill discontinued accepting municipal solid waste (MSW) June 30, 2014 but has converted to a recycling and transfer station facility for residents.
iii
In addition to general government activities, the Town Council oversees the Town of Windsor Retirement Defined Benefit Plan and it is therefore included in this reporting entity. As part of the FY 2012 budget process, management took steps to reduce the town’s cost of providing retirement benefits for future employees resulting in the Town Council amending the Personnel Rules requiring all non-affiliated full-time employees hired after July 1, 2011 to participate in a 401 (a) defined contribution plan. As of July 1, 2013 all new employees (except public safety officers) participate in the 401 (a) defined contribution plan. This plan is not included in the reporting entity as it does not meet the reporting criterion. In addition, the Metropolitan District Commission, the Wilson and Windsor Fire Districts and the Windsor Volunteer Ambulance Association have not met the established criteria for inclusion in the reporting entity, and accordingly are excluded from this report. Use of this report by Town Service Units is encouraged when furnishing information to interested parties. Economic Condition and Outlook Long-term planning for the efficient use of the Town's land resources began in 1924 and is guided by the town’s Plan of Conservation and Development which is updated at regular intervals. Comprehensive zoning regulations were first adopted in 1931 and have been revised periodically as necessary. Residential development in Windsor is primarily of the single family, owner-occupied type, but with some multi-family rental as well as condominium development. With large tracts of land once dedicated principally to agricultural use located at its northern and western perimeter, the Town has been able to make significant progress in attracting new commerce and industry. The Windsor Town Council has adopted formal, written economic development policies. These policies not only identify the incentives that are available to companies who may wish to locate or expand in Windsor, but also clearly outline the services that Town officials will provide to new and existing businesses. The Town is committed to working with new businesses through all phases of their preparations and ultimate move to Windsor. Town officials are also committed to providing similar, appropriate services for existing businesses in addition to trying to address any concerns that these businesses experience with either local or regional issues. Windsor is an important regional employment center in New England’s Knowledge Corridor. It is strategically located between Hartford, Connecticut and Springfield, Massachusetts on Interstate I-91 and adjoining Bradley International Airport. Windsor maintains a diversified economic base. Major industries include business and financial services, precision manufacturing, software development, regional distribution, data management and hospitality. With a jobs base of more than 24,000, Windsor ranks fifth among Hartford area communities in total non-retail employment. Major private employers include Hartford Life, VOYA, Alstom Power Systems, CIGNA, Westinghouse Electric, Northeast Utilities, Walgreen Co., Konica Minolta and Permasteelisa North America. Between 2000 and 2013, Windsor experienced substantial growth. More than five million square feet of new commercial space was constructed during this period including 300,000 square feet of retail, 1.2 million square feet of office, and 3.5 million square feet of industrial/distribution space. In addition, more than 580 new hotel rooms and conference space were built to serve the growing business community. Most recently, Amazon.com has opened a 1.5 million square foot fulfillment center.
iv
Looking forward, the Town of Windsor is taking steps to sustain its growth and the quality of its development. A variety of initiatives are underway to further improve highway access, manage transportation demand and enhance community livability. All approvals have been granted for a 600-acre mixed-use project in the Day Hill Road corporate area known as Great Pond Village. This project will add value to existing space and provide opportunities for new workforce housing. The Redevelopment Agency is pursuing redevelopment of key properties and planning for development to support and benefit from planned commuter rail service expansion in the town center. Financial Information The Town's management is responsible for establishing and maintaining an internal control structure designed to ensure that its assets are protected from loss, theft or misuse, and to ensure that adequate accounting data is compiled to allow for spending to be managed within fixed budget limitations and for the preparation of financial statements in conformity with generally accepted accounting principles. The internal control structure is designed to provide reasonable, but not absolute, assurance that these objectives are met. The concept of reasonable assurance recognizes that: (l) the cost of a control should not exceed the benefits likely to be derived; and (2) the valuation of costs and benefits requires estimates and judgments by management. All internal control evaluations occur within the above framework. We believe that the Town's internal accounting controls adequately safeguard assets and provide reasonable assurance of proper recording of financial transactions. The Finance Department is responsible for providing the financial services for the Town including: property tax assessment, tax collection, financial accounting and reporting, payroll and accounts payable, risk management, disbursement functions, debt management, pension administration, purchasing, special financial analysis and benefits processing. Long-Range Financial Planning Annually, the Town Manager prepares a six-year Capital Improvement Plan (CIP) in accordance with the Town Charter, which is reviewed by the Capital Improvements Committee, Town Improvements Committee of the Town Council, and the full Town Council. The approved 2016-2021 CIP adopted in August of 2015 includes both town general government and Board of Education projects involving road improvements, building renovations, new building facilities, major equipment purchases, and other capital improvements totaling $155,171,486. As part of the capital planning improvements process, the Town evaluates funding requirements and prioritization for all projects by conducting a comprehensive debt analysis. This analysis consists of a review of current debt and the impact of incurring future debt on the Town’s mill rate, existing debt service, and future operating budgets. A review of the current interest rate environment and various debt structures is also conducted to determine the affordability of additional debt. A five-year financial forecast is prepared on an annual basis by the Town Manager and Finance Director for review and discussion with the Finance Committee and Town Council. This process allows the town to look at issues such as budget sustainability, and provides an opportunity to institute revenue and budgetary changes in a timely manner in anticipation of future events.
v
Independent Audit State statutes require an annual audit be conducted by independent certified public accountants. In compliance with this requirement, the Town Council selected RSM US LLP to perform the audit for fiscal year 2015. The auditor's report on the basic financial statements and combining and individual fund statements and schedules is included in the financial section of this report. The auditor's reports related specifically to the Federal and State Single Audit Acts are included in separate documents. Acknowledgements The preparation of this report could not have been accomplished without the hard work and dedication of the Finance Department staff; Robert Metcalf, Finance Director; James Bourke, Assistant Finance Director and Linda Collins, Town Accountant. Their invaluable assistance made the preparation of this report an easier task. Sincerely, Peter Souza Town Manager
vi
vii
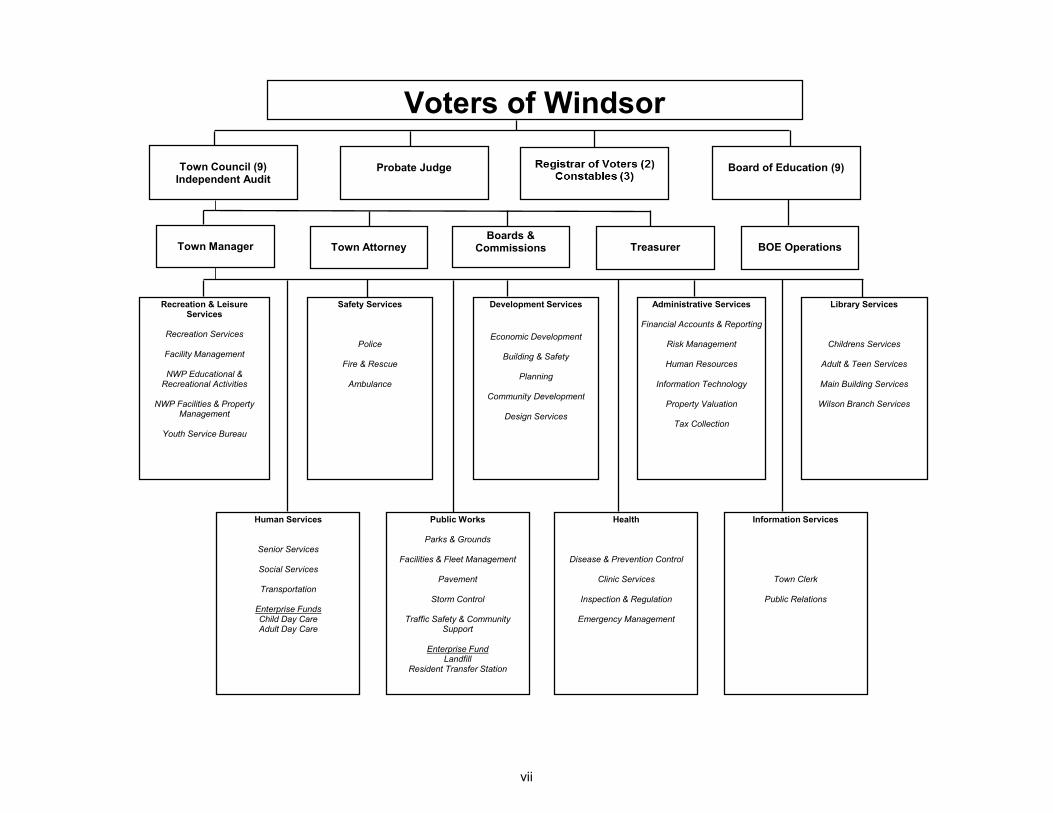
Voters of Windsor
Town Council (9)Independent Audit
Probate Judge Board of Education (9)
Town Manager Town Attorney TreasurerBoards &
Commissions BOE Operations
Recreation & Leisure Services
Recreation Services
Facility Management
NWP Educational & Recreational Activities
NWP Facilities & Property Management
Youth Service Bureau
Safety Services
Police
Fire & Rescue
Ambulance
Development Services
Economic Development
Building & Safety
Planning
Community Development
Design Services
Administrative Services
Financial Accounts & Reporting
Risk Management
Human Resources
Information Technology
Property Valuation
Tax Collection
Library Services
Childrens Services
Adult & Teen Services
Main Building Services
Wilson Branch Services
Human Services
Senior Services
Social Services
Transportation
Enterprise FundsChild Day CareAdult Day Care
Public Works
Parks & Grounds
Facilities & Fleet Management
Pavement
Storm Control
Traffic Safety & Community Support
Enterprise FundLandfill
Resident Transfer Station
Health
Disease & Prevention Control
Clinic Services
Inspection & Regulation
Emergency Management
Information Services
Town Clerk
Public Relations
viii
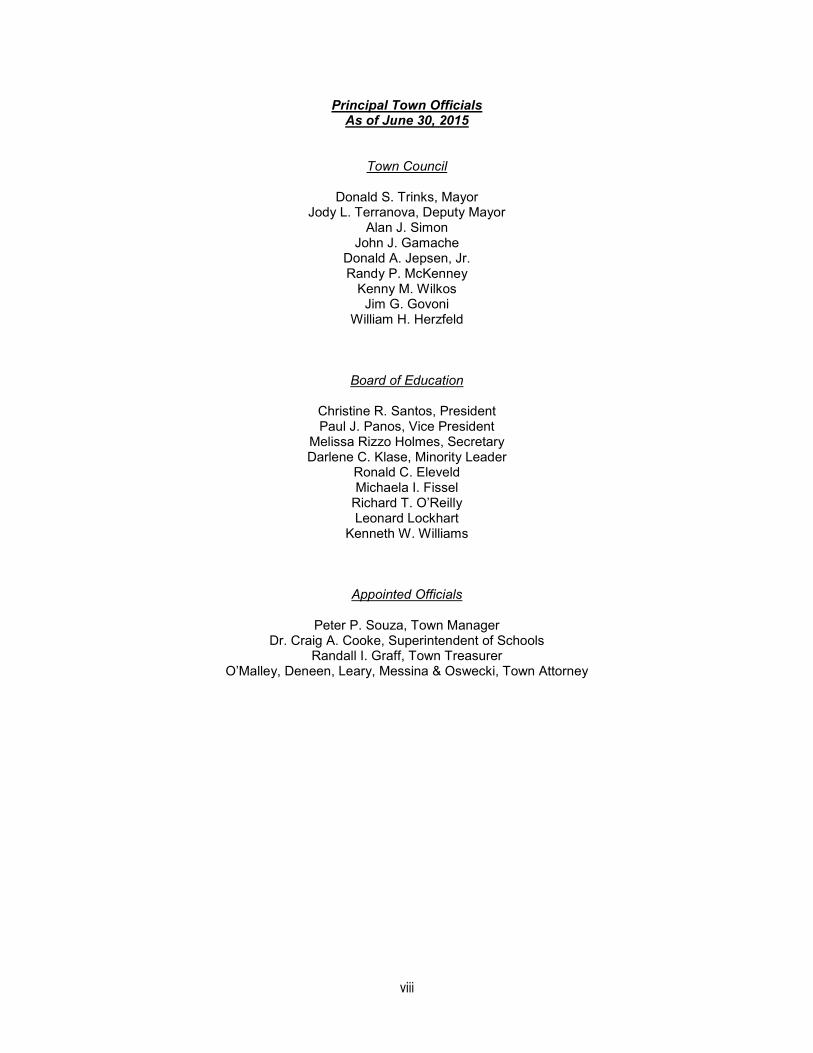
Principal Town Officials As of June 30, 2015
Town Council
Donald S. Trinks, Mayor Jody L. Terranova, Deputy Mayor
Alan J. Simon John J. Gamache
Donald A. Jepsen, Jr. Randy P. McKenney
Kenny M. Wilkos Jim G. Govoni
William H. Herzfeld
Board of Education
Christine R. Santos, President Paul J. Panos, Vice President
Melissa Rizzo Holmes, Secretary Darlene C. Klase, Minority Leader
Ronald C. Eleveld Michaela I. Fissel
Richard T. O’Reilly Leonard Lockhart
Kenneth W. Williams
Appointed Officials
Peter P. Souza, Town Manager Dr. Craig A. Cooke, Superintendent of Schools
Randall I. Graff, Town Treasurer O’Malley, Deneen, Leary, Messina & Oswecki, Town Attorney

Financial Section

1
Independent Auditor’s Report To the Members of the Town Council Town of Windsor, Connecticut Report on the Financial Statements We have audited the accompanying financial statements of the governmental activities, the business type activities, each major fund and the aggregate remaining fund information of the Town of Windsor, Connecticut (the Town) as of and for the fiscal year ended June 30, 2015, and the related notes to the financial statements which collectively comprise the Town’s basic financial statements as listed in the table of contents. Management’s Responsibility for the Financial Statements Management is responsible for the preparation and fair presentation of these financial statements in accordance with accounting principles generally accepted in the United States of America; this includes the design, implementation, and maintenance of internal control relevant to the preparation and fair presentation of financial statements that are free from material misstatement, whether due to fraud or error. Auditor’s Responsibility Our responsibility is to express opinions on these financial statements based on our audit. We conducted our audit in accordance with auditing standards generally accepted in the United States of America and the standards applicable to financial audits contained in Government Auditing Standards, issued by the Comptroller General of the United States. Those standards require that we plan and perform the audit to obtain reasonable assurance about whether the financial statements are free from material misstatement. An audit involves performing procedures to obtain audit evidence about the amounts and disclosures in the financial statements. The procedures selected depend on the auditor’s judgment, including the assessment of the risks of material misstatement of the financial statements, whether due to fraud or error. In making those risk assessments, the auditor considers internal control relevant to the entity’s preparation and fair presentation of the financial statements in order to design audit procedures that are appropriate in the circumstances, but not for the purpose of expressing an opinion on the effectiveness of the entity’s internal control. Accordingly, we express no such opinion. An audit also includes evaluating the appropriateness of accounting policies used and the reasonableness of significant accounting estimates made by management, as well as evaluating the overall presentation of the financial statements. We believe that the audit evidence we have obtained is sufficient and appropriate to provide a basis for our audit opinions. Opinions In our opinion, the financial statements referred to above present fairly, in all material respects, the respective financial position of the governmental activities, the business-type activities, each major fund, and the aggregate remaining fund information of the Town of Windsor, Connecticut as of June 30, 2015, and the respective changes in financial position and, where applicable, cash flows thereof for the year then ended in accordance with accounting principles generally accepted in the United States of America.
2
Emphasis of Matter—Adoption of Standards As explained in the Summary of Significant Accounting Policies in the Note 1 to the financial statements, the Town adopted Governmental Accounting Standards Board (GASB) Statement No. 68, Accounting and Financial Reporting for Pensions, an amendment of GASB Statement No. 27, and GASB Statement No. 71, Pension Transition for Contributions Made Subsequent to the Measurement Date – and amendment of GASB 68, which resulted in the Town restating net position for recognition of the Town’s pension related activity incurred prior to July 1, 2014. Our opinion is not modified with respect to this matter. Other Matters Required Supplementary Information Accounting principles generally accepted in the United States of America require that the Management Discussion and Analysis, the schedules of investment returns, employer contributions and the schedule of changes in net pension plan liability and related ratios – defined benefit plans, schedules of contributions and the Town’s proportionate share of the net pension liability – MERS plan and the schedule of the Town’s proportionate share of the net pension liability – teachers’ retirement system, the schedules of funding progress and employer contributions for other post-employment benefits and the General Fund budgetary comparison information be presented to supplement the basic financial statements. Such information, although not a part of the basic financial statements, is required by the Governmental Accounting Standards Board who considers it to be an essential part of financial reporting for placing the basic financial statements in an appropriate operational, economic, or historical context. We have applied certain limited procedures to the required supplementary information in accordance with auditing standards generally accepted in the United States of America, which consisted of inquiries of management about the methods of preparing the information and comparing the information for consistency with management’s responses to our inquiries, the basic financial statements, and other knowledge we obtained during our audit of the basic financial statements. We do not express an opinion or provide any assurance on the information because the limited procedures do not provide us with sufficient evidence to express an opinion or provide any assurance. Supplementary Information Our audit was conducted for the purpose of forming opinions on the financial statements that collectively comprise the Town’s basic financial statements. The introductory section, combining and individual fund financial statements and other schedules, and statistical section are presented for purposes of additional analysis and are not a required part of the basic financial statements. The combining and individual fund financial statements and other schedules are the responsibility of management and were derived from and relates directly to the underlying accounting and other records used to prepare the basic financial statements. Such information has been subjected to the auditing procedures applied in the audit of the basic financial statements and certain additional procedures, including comparing and reconciling such information directly to the underlying accounting and other records used to prepare the basic financial statements or to the basic financial statements themselves, and other additional procedures in accordance with auditing standards generally accepted in the United States of America. In our opinion, the combining and individual fund financial statements and other schedules are fairly stated, in all material respects, in relation to the basic financial statements as a whole. The introductory and statistical sections, as listed in the table of contents, have not been subjected to the auditing procedures applied in the audit of the basic financial statements, and accordingly, we do not express an opinion or provide any assurance on them.
3
Other Reporting Required by Government Auditing Standards In accordance with Government Auditing Standards, we have also issued our report dated December 30, 2015 on our consideration of the Town’s internal control over financial reporting and on our tests of its compliance with certain provisions of laws, regulations, contracts, and grant agreements and other matters. The purpose of that report is to describe the scope of our testing of internal control over financial reporting and compliance and the results of that testing, and not to provide an opinion on internal control over financial reporting or on compliance. That report is an integral part of an audit performed in accordance with Government Auditing Standards in considering the Town’s internal control over financial reporting and compliance.
New Haven, Connecticut December 30, 2015

4
This page intentionally left blank.
5
Town of Windsor, Connecticut Management’s Discussion and Analysis- unaudited
June 30, 2015 As management of the Town of Windsor, Connecticut (the "Town") we offer readers of the financial statements this narrative overview and analysis of the financial activities of the Town of Windsor for the fiscal year ended June 30, 2015. We encourage readers to consider the information presented here along with additional information we have furnished in our letter of transmittal, as well as the Town's basic financial statements that follow this section. Financial Highlights
• As of July 1, 2014, the Town was required to implement GASB Statement No. 68 related to pensions. This Statement required that the unrestricted net position of the government-wide financial statements as of July 1, 2014 be restated and decreased in the amount of $5,968,306. The decrease did not result from a change in benefits offered to employees, only the presentation of the liability on the balance sheet of the government-wide financial statements. Additional information on GASB Statement No. 68 can be found in Note 1 on page 25 under ‘Accounting standards adopted in the current year.’
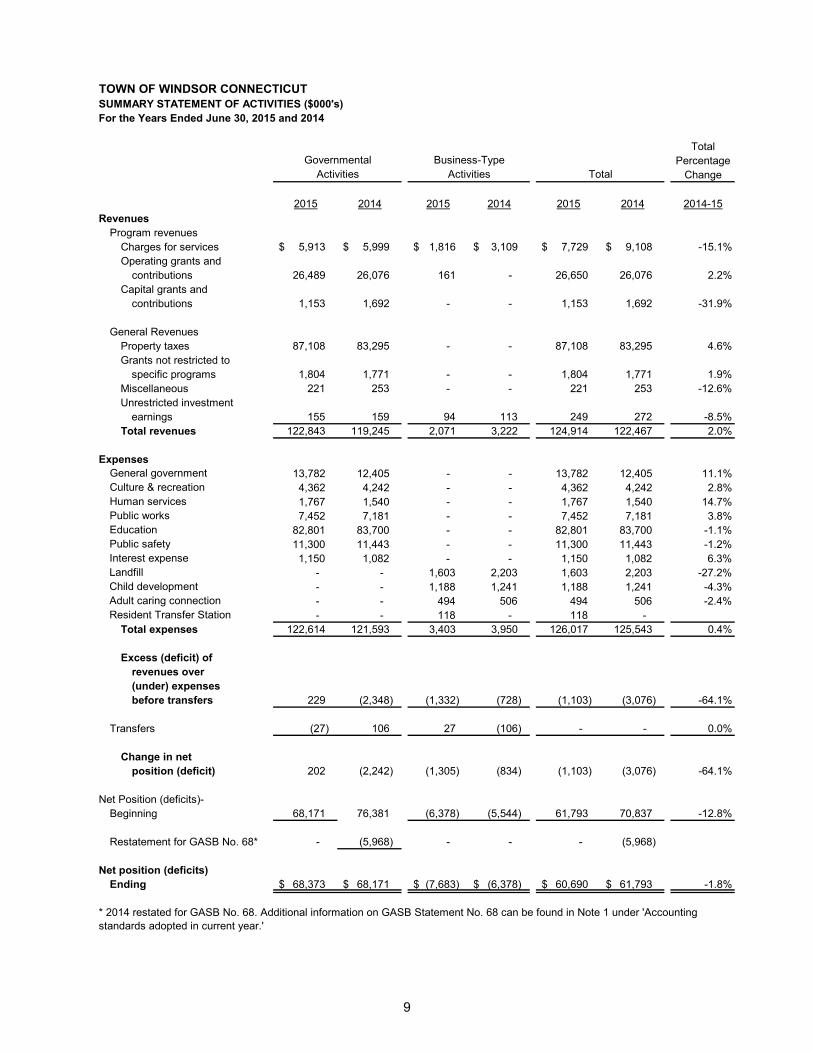
• On a government-wide basis, the assets and deferred outflows of resources of the Town of Windsor exceeded its liabilities and deferred inflows of resources resulting in total net position at the close of the fiscal year of $60.7 million. Total net position for Governmental Activities at fiscal year-end were $68.4 million, which was an increase of $202 thousand from the restated FY 14 net position. Total net position (deficits) for Business-Type Activities were ($7.7 million), which was a decrease of $1.3 million from FY 14. The net deficit for Business-Type Activities is due to post-closure costs for the landfill.
• Government-wide expenses were $126.0 million, which is an increase of $474 thousand from FY 14. Government-wide revenues were $124.9 million, which is an increase of $2.4 million from FY 14.
• At the close of the year, the Town's governmental funds reported, on a current financial resource basis, combined ending fund balances of $39.1 million, an increase of $3.4 million from the prior fiscal year.
• At the end of the current fiscal year, the total fund balance for the General Fund was $23.6 million, an increase of $2.4 million from the prior fiscal year. Of the total General Fund fund balance as of June 30, 2015, $19.0 million represents unassigned fund balance. Unassigned fund balance at year-end represents 16.9% of total FY 15 General Fund expenditures and transfers, and 17.8% of FY 16 budgeted expenditures and transfers.
Overview of the Financial Statements This discussion and analysis is intended to serve as an introduction to the Town's basic financial statements. The basic financial statements are comprised of three components: 1) government-wide financial statements, 2) fund financial statements, and 3) notes to the financial statements. This report also contains other supplementary information as well as the basic financial statements.
Government-Wide Financial Statements The government-wide financial statements are designed to provide readers with a broad overview of the Town of Windsor's finances, in a manner similar to private-sector business. All of the resources the Town has at its disposal are shown, including major assets such as buildings and infrastructure. A thorough accounting of the cost of government is rendered because the statements present all costs, not just how much was collected and disbursed. They provide both long-term and short-term information about the Town's overall financial status.
6
The statement of net position presents information on all of the Town's assets and deferred outflows of resources and liabilities and deferred inflows of resources, with the difference reported as net position. One can think of the Town's net position - the difference between assets and deferred outflows of resources and liabilities and deferred inflows of resources - as one way to measure the Town's financial health or financial position. Over time, increases or decreases in net position may serve as an indicator of whether the financial position of the Town is improving or deteriorating. It speaks to the question of whether or not the Town, as a whole, is better or worse off as a result of this year's activities. Other non-financial factors will need to be considered, however, such as changes in the Town's property tax base and the condition of the Town's infrastructure, to assess the overall health of the Town of Windsor. The statement of activities presents information showing how the Town's net position changed during the most recent fiscal year. All of the current year's revenues and expenses are taken into account regardless of when cash is received or paid. Thus, revenues and expenses are reported in this statement for some items that will only result in cash flow in some future fiscal period; uncollected taxes are an example. Both of the government-wide financial statements distinguish functions of the Town of Windsor that are supported by taxes and intergovernmental revenues (governmental activities) from other functions that are intended to recover all or a significant portion of their costs through user fees and charges (business type activities).
• Governmental activities of the Town of Windsor encompass most of the Town's basic services and include general government, public safety, public works, human services, culture and recreation, and education. Property taxes, charges for services, and state and federal grants finance most of these activities.
• Business-type activities of the Town of Windsor include the Landfill, Resident Transfer Station, Milo Peck Child Development center, and the Caring Connection Adult Day Care center. They are reported here as the Town charges fees to customers to help cover all or most of the cost of operations.
The government-wide financial statements (statement of net position and statement of activities) can be found on pages 15-16 of this report.
Fund Financial Statements A fund is a grouping of related accounts that is used to maintain control and accountability over resources that have been segregated for specific activities or objectives. The Town, like other state and local governments, uses fund accounting to ensure and demonstrate compliance with finance-related legal requirements. The Town has three kinds of funds: Governmental funds. Governmental funds are used to account for essentially the same functions reported as governmental activities in the government-wide financial statements. However, unlike the government-wide financial statements, governmental fund financial statements focus on near-term inflows and outflows of spendable resources, as well as on balances of spendable resources available at the end of the fiscal year. Such information may be useful in evaluating a government's near-term financing requirements. Because the focus of governmental funds is narrower than that of the government-wide financial statements, it is useful to compare the information presented for governmental funds with similar information presented for governmental activities in the government-wide financial statements. By doing so, readers may better understand the long-term impact of the government's near-term financing decisions. Both the governmental fund balance sheet and the governmental fund statement of revenues, expenditures, and changes in fund balances provide a reconciliation to facilitate this comparison between governmental funds and governmental activities. The Town maintains ten (10) individual governmental funds. Information is presented separately in the governmental fund balance sheet and in the governmental fund statement of revenues, expenditures, and
7
changes in fund balances for the General Fund and the Capital Projects Fund, which are considered to be major funds. Data from the other governmental funds are combined into a single, aggregated presentation as other governmental funds. Non-major governmental funds for the Town of Windsor include the Community Development Block Grant, Cafeteria Fund, Educational Grant Programs, J. Bartash Trust Fund, Treehouse Fund, Debt Service Fund, Other Special Revenue Funds and Open Space Fund. The report provides individual fund data for each of these non-major governmental funds in the combining balance sheets on pages 78-79 and in the combining statement of revenues, expenditures and changes in fund balance on pages 80-81. The Town adopts an annual appropriated budget for its General Fund. A budgetary comparison statement has been provided for the General Fund to demonstrate compliance with the authorized budget. The statements of General Fund revenues on a budgetary basis and General Fund expenditures, encumbrances and transfers out on a budgetary basis can be found on page 74. The basic governmental fund financial statements (balance sheet and statement of revenues, expenditures and changes in fund balances) can be found on pages 17-18 of this report. Proprietary funds. The Town of Windsor maintains two different types of proprietary funds, four enterprise funds and an internal service fund. Enterprise funds are used to report the same functions presented as business-type activities in the government-wide financial statements. The Town of Windsor uses enterprise funds to account for its Landfill closing, Resident Transfer Station, Milo Peck Child Development Center, and the Caring Connection Adult Day Care Center. Internal service funds are an accounting device used to accumulate and allocate certain costs internally among the Town of Windsor's various functions. The Town of Windsor uses one (1) internal service fund to account for its risk management costs related to Workers' Compensation, Property, Liability, and Employee and Retiree Health Insurance. Because these internal services predominantly benefit governmental rather than business-type functions, they have been included within governmental activities in the government-wide financial statements Proprietary funds provide the same type of information as the government-wide financial statements, only in more detail. The proprietary fund financial statements provide separate information for the Landfill Enterprise Fund which is considered to be the only major proprietary fund of the Town of Windsor. The report combines the Milo Peck Child Development Center and the Caring Connection Adult Day Care Center and Transfer Station into the non-major funds of the Town of Windsor. Individual fund data for the internal service fund is also provided as a separate column in the proprietary fund financial statements. The proprietary fund financial statements can be found on pages 20-22 of this report. Fiduciary funds. Fiduciary funds are used to account for resources held for the benefit of parties outside the government. Fiduciary funds are not reflected in the government-wide financial statement because the resources of those funds are not available to provide services to the Town's constituency. The Town has one pension trust fund, one Other Post-Employment Benefits trust fund, and five agency funds. The accounting used for fiduciary funds is similar to the accounting for proprietary funds. The basic fiduciary fund financial statements are in pages 23-24 of this report.
Notes to the Financial Statements The notes provide additional information that is essential to a full understanding of the data provided in the government-wide and fund financial statements. The notes to the financial statements are in pages 25 to 65 of this report. Other Information In addition to the basic financial statements and accompanying notes, this report also presents certain required supplementary information.
8
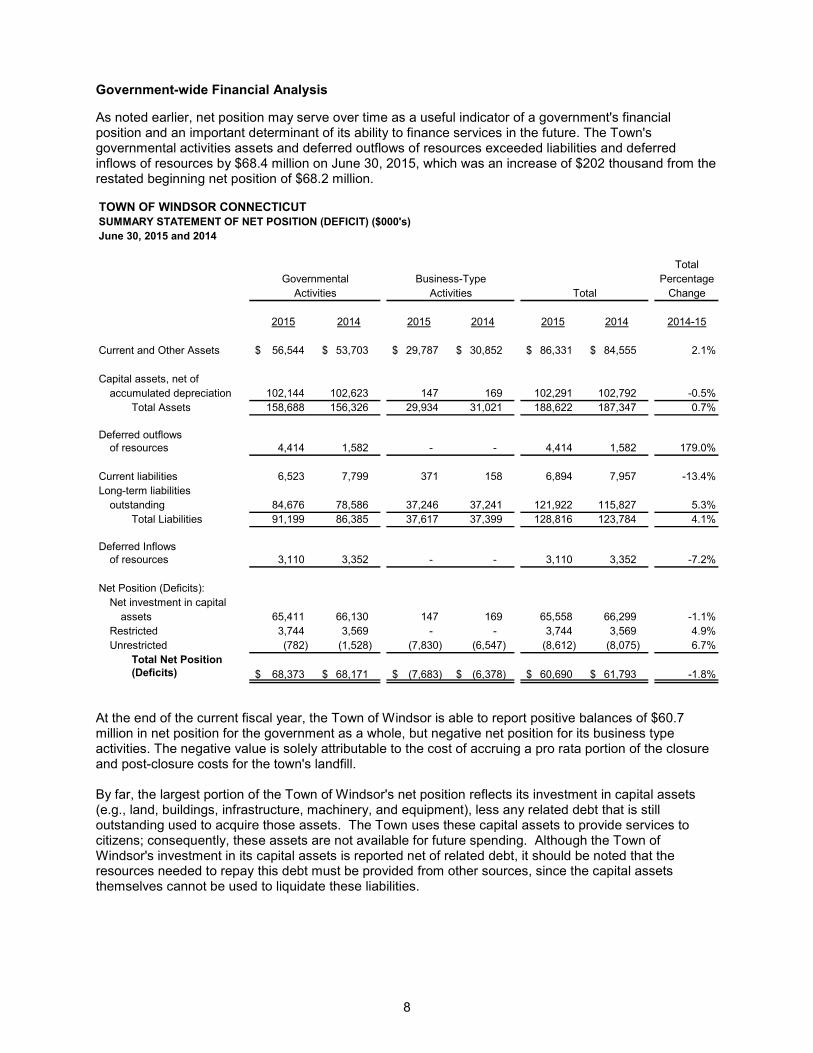
Government-wide Financial Analysis As noted earlier, net position may serve over time as a useful indicator of a government's financial position and an important determinant of its ability to finance services in the future. The Town's governmental activities assets and deferred outflows of resources exceeded liabilities and deferred inflows of resources by $68.4 million on June 30, 2015, which was an increase of $202 thousand from the restated beginning net position of $68.2 million. TOWN OF WINDSOR CONNECTICUTSUMMARY STATEMENT OF NET POSITION (DEFICIT) ($000's)June 30, 2015 and 2014
TotalPercentage
Change
2015 2014 2015 2014 2015 2014 2014-15
Current and Other Assets 56,544 $ 53,703 $ 29,787 $ 30,852 $ 86,331 $ 84,555 $ 2.1%
Capital assets, net of accumulated depreciation 102,144 102,623 147 169 102,291 102,792 -0.5%
Total Assets 158,688 156,326 29,934 31,021 188,622 187,347 0.7%
Deferred outflowsof resources 4,414 1,582 - - 4,414 1,582 179.0%
Current liabilities 6,523 7,799 371 158 6,894 7,957 -13.4%Long-term liabilities
outstanding 84,676 78,586 37,246 37,241 121,922 115,827 5.3%Total Liabilities 91,199 86,385 37,617 37,399 128,816 123,784 4.1%
Deferred Inflowsof resources 3,110 3,352 - - 3,110 3,352 -7.2%
Net Position (Deficits):Net investment in capital
assets 65,411 66,130 147 169 65,558 66,299 -1.1%Restricted 3,744 3,569 - - 3,744 3,569 4.9%Unrestricted (782) (1,528) (7,830) (6,547) (8,612) (8,075) 6.7%
Total Net Position(Deficits) 68,373 $ 68,171 $ (7,683) $ (6,378) $ 60,690 $ 61,793 $ -1.8%
TotalGovernmental Business-Type
Activities Activities
At the end of the current fiscal year, the Town of Windsor is able to report positive balances of $60.7 million in net position for the government as a whole, but negative net position for its business type activities. The negative value is solely attributable to the cost of accruing a pro rata portion of the closure and post-closure costs for the town's landfill. By far, the largest portion of the Town of Windsor's net position reflects its investment in capital assets (e.g., land, buildings, infrastructure, machinery, and equipment), less any related debt that is still outstanding used to acquire those assets. The Town uses these capital assets to provide services to citizens; consequently, these assets are not available for future spending. Although the Town of Windsor's investment in its capital assets is reported net of related debt, it should be noted that the resources needed to repay this debt must be provided from other sources, since the capital assets themselves cannot be used to liquidate these liabilities.
9
TOWN OF WINDSOR CONNECTICUTSUMMARY STATEMENT OF ACTIVITIES ($000's)For the Years Ended June 30, 2015 and 2014
TotalPercentage
Change
2015 2014 2015 2014 2015 2014 2014-15Revenues
Program revenuesCharges for services 5,913 $ 5,999 $ 1,816 $ 3,109 $ 7,729 $ 9,108 $ -15.1%Operating grants and
contributions 26,489 26,076 161 - 26,650 26,076 2.2%Capital grants and
contributions 1,153 1,692 - - 1,153 1,692 -31.9%
General RevenuesProperty taxes 87,108 83,295 - - 87,108 83,295 4.6%Grants not restricted to
specific programs 1,804 1,771 - - 1,804 1,771 1.9%Miscellaneous 221 253 - - 221 253 -12.6%Unrestricted investment
earnings 155 159 94 113 249 272 -8.5%Total revenues 122,843 119,245 2,071 3,222 124,914 122,467 2.0%
ExpensesGeneral government 13,782 12,405 - - 13,782 12,405 11.1%Culture & recreation 4,362 4,242 - - 4,362 4,242 2.8%Human services 1,767 1,540 - - 1,767 1,540 14.7%Public works 7,452 7,181 - - 7,452 7,181 3.8%Education 82,801 83,700 - - 82,801 83,700 -1.1%Public safety 11,300 11,443 - - 11,300 11,443 -1.2%Interest expense 1,150 1,082 - - 1,150 1,082 6.3%Landfill - - 1,603 2,203 1,603 2,203 -27.2%Child development - - 1,188 1,241 1,188 1,241 -4.3%Adult caring connection - - 494 506 494 506 -2.4%Resident Transfer Station - - 118 - 118 -
Total expenses 122,614 121,593 3,403 3,950 126,017 125,543 0.4%
Excess (deficit) ofrevenues over (under) expensesbefore transfers 229 (2,348) (1,332) (728) (1,103) (3,076) -64.1%
Transfers (27) 106 27 (106) - - 0.0%
Change in net position (deficit) 202 (2,242) (1,305) (834) (1,103) (3,076) -64.1%
Net Position (deficits)-Beginning 68,171 76,381 (6,378) (5,544) 61,793 70,837 -12.8%
Restatement for GASB No. 68* - (5,968) - - - (5,968)
Net position (deficits)Ending 68,373 $ 68,171 $ (7,683) $ (6,378) $ 60,690 $ 61,793 $ -1.8%
* 2014 restated for GASB No. 68. Additional information on GASB Statement No. 68 can be found in Note 1 under 'Accounting standards adopted in current year.'
TotalGovernmental Business-Type
Activities Activities
10
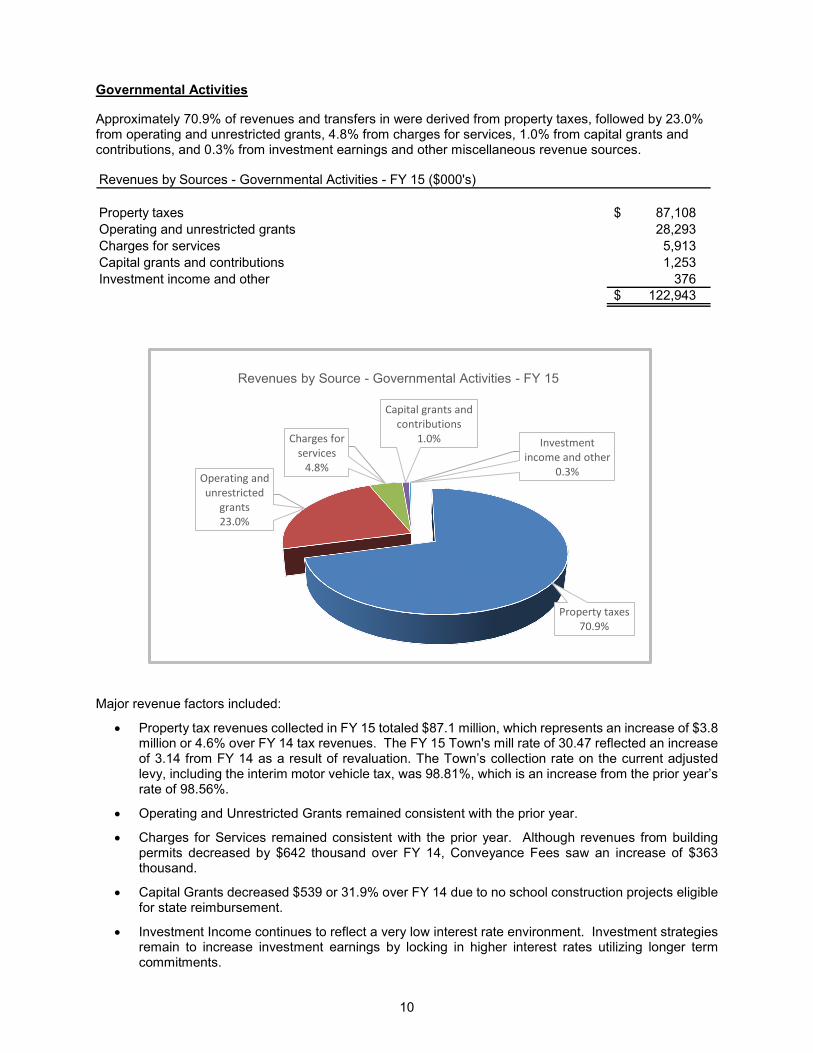
Governmental Activities Approximately 70.9% of revenues and transfers in were derived from property taxes, followed by 23.0% from operating and unrestricted grants, 4.8% from charges for services, 1.0% from capital grants and contributions, and 0.3% from investment earnings and other miscellaneous revenue sources. Revenues by Sources - Governmental Activities - FY 15 ($000's)
Property taxes 87,108 $ Operating and unrestricted grants 28,293 Charges for services 5,913 Capital grants and contributions 1,253 Investment income and other 376
122,943 $
Property taxes70.9%
Operating and unrestricted
grants23.0%
Charges for services
4.8%
Capital grants and contributions
1.0% Investment income and other
0.3%
Revenues by Source - Governmental Activities - FY 15
Major revenue factors included:
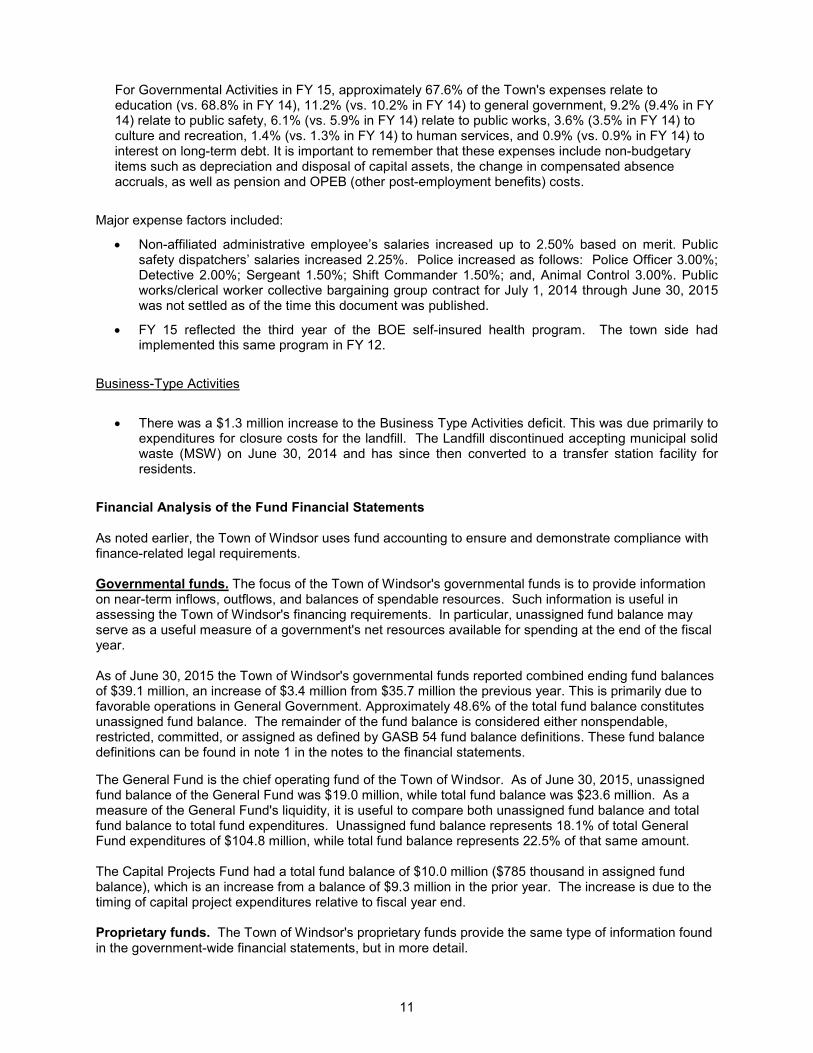
• Property tax revenues collected in FY 15 totaled $87.1 million, which represents an increase of $3.8 million or 4.6% over FY 14 tax revenues. The FY 15 Town's mill rate of 30.47 reflected an increase of 3.14 from FY 14 as a result of revaluation. The Town’s collection rate on the current adjusted levy, including the interim motor vehicle tax, was 98.81%, which is an increase from the prior year’s rate of 98.56%.
• Operating and Unrestricted Grants remained consistent with the prior year.
• Charges for Services remained consistent with the prior year. Although revenues from building permits decreased by $642 thousand over FY 14, Conveyance Fees saw an increase of $363 thousand.
• Capital Grants decreased $539 or 31.9% over FY 14 due to no school construction projects eligible for state reimbursement.
• Investment Income continues to reflect a very low interest rate environment. Investment strategies remain to increase investment earnings by locking in higher interest rates utilizing longer term commitments.
11
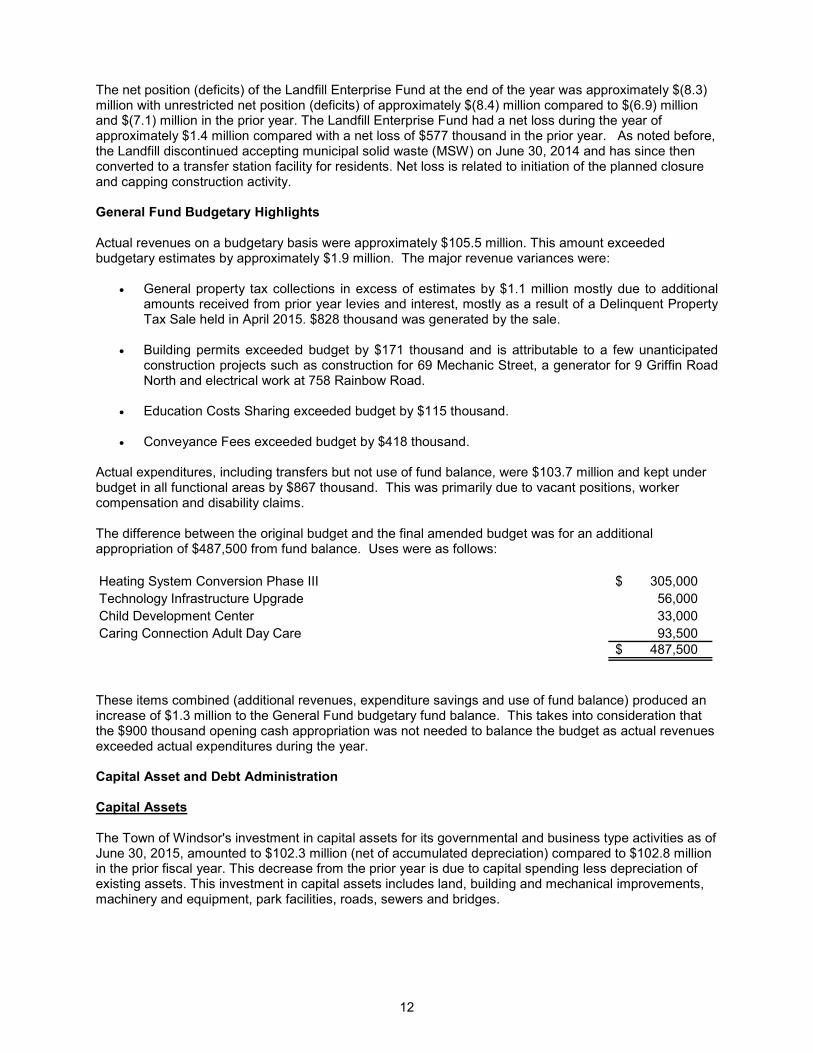
For Governmental Activities in FY 15, approximately 67.6% of the Town's expenses relate to education (vs. 68.8% in FY 14), 11.2% (vs. 10.2% in FY 14) to general government, 9.2% (9.4% in FY 14) relate to public safety, 6.1% (vs. 5.9% in FY 14) relate to public works, 3.6% (3.5% in FY 14) to culture and recreation, 1.4% (vs. 1.3% in FY 14) to human services, and 0.9% (vs. 0.9% in FY 14) to interest on long-term debt. It is important to remember that these expenses include non-budgetary items such as depreciation and disposal of capital assets, the change in compensated absence accruals, as well as pension and OPEB (other post-employment benefits) costs.
Major expense factors included:
• Non-affiliated administrative employee’s salaries increased up to 2.50% based on merit. Public safety dispatchers’ salaries increased 2.25%. Police increased as follows: Police Officer 3.00%; Detective 2.00%; Sergeant 1.50%; Shift Commander 1.50%; and, Animal Control 3.00%. Public works/clerical worker collective bargaining group contract for July 1, 2014 through June 30, 2015 was not settled as of the time this document was published.
• FY 15 reflected the third year of the BOE self-insured health program. The town side had implemented this same program in FY 12.
Business-Type Activities
• There was a $1.3 million increase to the Business Type Activities deficit. This was due primarily to expenditures for closure costs for the landfill. The Landfill discontinued accepting municipal solid waste (MSW) on June 30, 2014 and has since then converted to a transfer station facility for residents.
Financial Analysis of the Fund Financial Statements As noted earlier, the Town of Windsor uses fund accounting to ensure and demonstrate compliance with finance-related legal requirements. Governmental funds. The focus of the Town of Windsor's governmental funds is to provide information on near-term inflows, outflows, and balances of spendable resources. Such information is useful in assessing the Town of Windsor's financing requirements. In particular, unassigned fund balance may serve as a useful measure of a government's net resources available for spending at the end of the fiscal year. As of June 30, 2015 the Town of Windsor's governmental funds reported combined ending fund balances of $39.1 million, an increase of $3.4 million from $35.7 million the previous year. This is primarily due to favorable operations in General Government. Approximately 48.6% of the total fund balance constitutes unassigned fund balance. The remainder of the fund balance is considered either nonspendable, restricted, committed, or assigned as defined by GASB 54 fund balance definitions. These fund balance definitions can be found in note 1 in the notes to the financial statements. The General Fund is the chief operating fund of the Town of Windsor. As of June 30, 2015, unassigned fund balance of the General Fund was $19.0 million, while total fund balance was $23.6 million. As a measure of the General Fund's liquidity, it is useful to compare both unassigned fund balance and total fund balance to total fund expenditures. Unassigned fund balance represents 18.1% of total General Fund expenditures of $104.8 million, while total fund balance represents 22.5% of that same amount. The Capital Projects Fund had a total fund balance of $10.0 million ($785 thousand in assigned fund balance), which is an increase from a balance of $9.3 million in the prior year. The increase is due to the timing of capital project expenditures relative to fiscal year end. Proprietary funds. The Town of Windsor's proprietary funds provide the same type of information found in the government-wide financial statements, but in more detail.
12
The net position (deficits) of the Landfill Enterprise Fund at the end of the year was approximately $(8.3) million with unrestricted net position (deficits) of approximately $(8.4) million compared to $(6.9) million and $(7.1) million in the prior year. The Landfill Enterprise Fund had a net loss during the year of approximately $1.4 million compared with a net loss of $577 thousand in the prior year. As noted before, the Landfill discontinued accepting municipal solid waste (MSW) on June 30, 2014 and has since then converted to a transfer station facility for residents. Net loss is related to initiation of the planned closure and capping construction activity. General Fund Budgetary Highlights Actual revenues on a budgetary basis were approximately $105.5 million. This amount exceeded budgetary estimates by approximately $1.9 million. The major revenue variances were:
• General property tax collections in excess of estimates by $1.1 million mostly due to additional amounts received from prior year levies and interest, mostly as a result of a Delinquent Property Tax Sale held in April 2015. $828 thousand was generated by the sale.
• Building permits exceeded budget by $171 thousand and is attributable to a few unanticipated
construction projects such as construction for 69 Mechanic Street, a generator for 9 Griffin Road North and electrical work at 758 Rainbow Road.
• Education Costs Sharing exceeded budget by $115 thousand.
• Conveyance Fees exceeded budget by $418 thousand.
Actual expenditures, including transfers but not use of fund balance, were $103.7 million and kept under budget in all functional areas by $867 thousand. This was primarily due to vacant positions, worker compensation and disability claims. The difference between the original budget and the final amended budget was for an additional appropriation of $487,500 from fund balance. Uses were as follows: Heating System Conversion Phase III 305,000 $ Technology Infrastructure Upgrade 56,000 Child Development Center 33,000 Caring Connection Adult Day Care 93,500
487,500 $
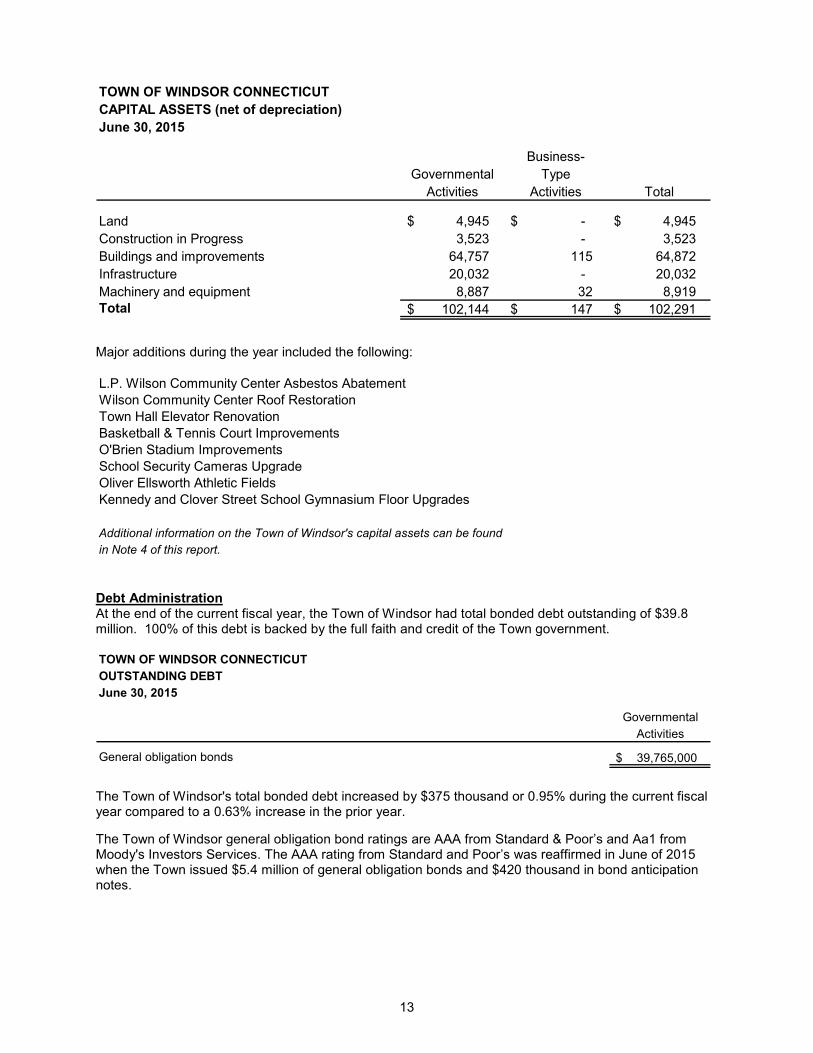
These items combined (additional revenues, expenditure savings and use of fund balance) produced an increase of $1.3 million to the General Fund budgetary fund balance. This takes into consideration that the $900 thousand opening cash appropriation was not needed to balance the budget as actual revenues exceeded actual expenditures during the year. Capital Asset and Debt Administration Capital Assets The Town of Windsor's investment in capital assets for its governmental and business type activities as of June 30, 2015, amounted to $102.3 million (net of accumulated depreciation) compared to $102.8 million in the prior fiscal year. This decrease from the prior year is due to capital spending less depreciation of existing assets. This investment in capital assets includes land, building and mechanical improvements, machinery and equipment, park facilities, roads, sewers and bridges.
13
TOWN OF WINDSOR CONNECTICUTCAPITAL ASSETS (net of depreciation)June 30, 2015
Business-Governmental Type
Activities Activities Total
Land 4,945 $ -$ 4,945 $ Construction in Progress 3,523 - 3,523 Buildings and improvements 64,757 115 64,872 Infrastructure 20,032 - 20,032 Machinery and equipment 8,887 32 8,919 Total 102,144 $ 147 $ 102,291 $
Major additions during the year included the following: L.P. Wilson Community Center Asbestos AbatementWilson Community Center Roof RestorationTown Hall Elevator RenovationBasketball & Tennis Court ImprovementsO'Brien Stadium ImprovementsSchool Security Cameras UpgradeOliver Ellsworth Athletic FieldsKennedy and Clover Street School Gymnasium Floor Upgrades
Additional information on the Town of Windsor's capital assets can be found in Note 4 of this report.
Debt Administration At the end of the current fiscal year, the Town of Windsor had total bonded debt outstanding of $39.8 million. 100% of this debt is backed by the full faith and credit of the Town government. TOWN OF WINDSOR CONNECTICUTOUTSTANDING DEBTJune 30, 2015
GovernmentalActivities
General obligation bonds 39,765,000 $
The Town of Windsor's total bonded debt increased by $375 thousand or 0.95% during the current fiscal year compared to a 0.63% increase in the prior year. The Town of Windsor general obligation bond ratings are AAA from Standard & Poor’s and Aa1 from Moody's Investors Services. The AAA rating from Standard and Poor’s was reaffirmed in June of 2015 when the Town issued $5.4 million of general obligation bonds and $420 thousand in bond anticipation notes.
14
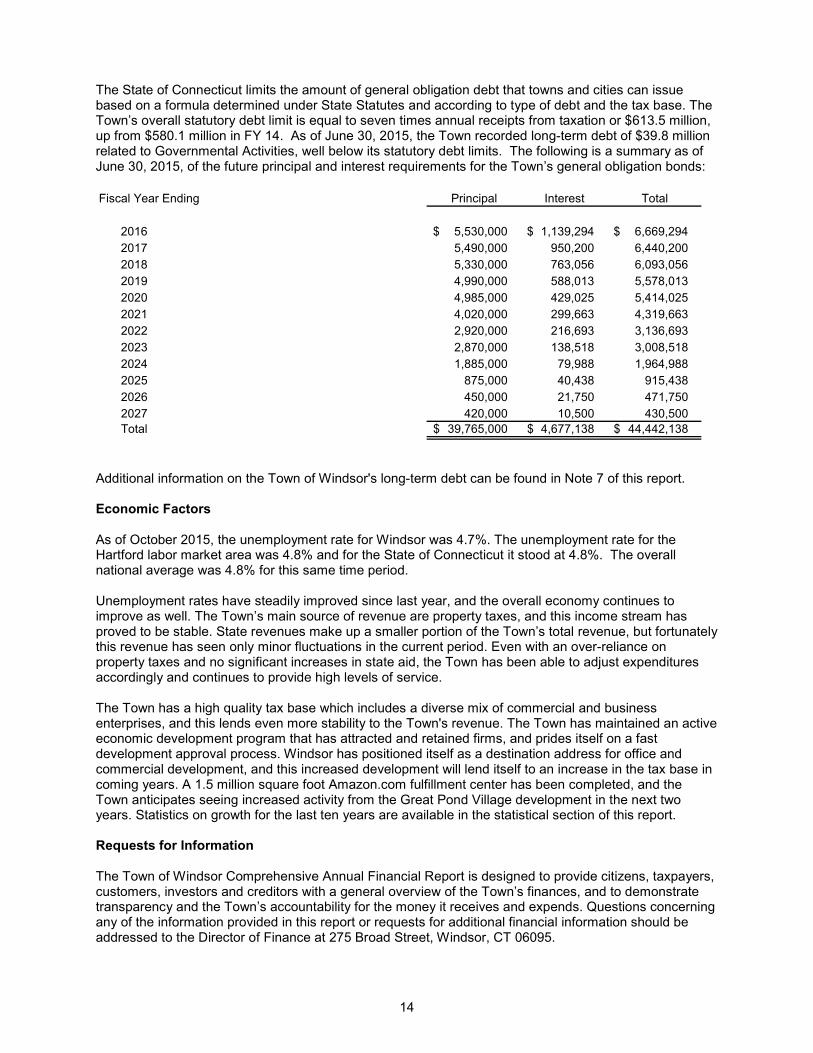
The State of Connecticut limits the amount of general obligation debt that towns and cities can issue based on a formula determined under State Statutes and according to type of debt and the tax base. The Town’s overall statutory debt limit is equal to seven times annual receipts from taxation or $613.5 million, up from $580.1 million in FY 14. As of June 30, 2015, the Town recorded long-term debt of $39.8 million related to Governmental Activities, well below its statutory debt limits. The following is a summary as of June 30, 2015, of the future principal and interest requirements for the Town’s general obligation bonds: Fiscal Year Ending Principal Interest Total
2016 5,530,000 $ 1,139,294 $ 6,669,294 $ 2017 5,490,000 950,200 6,440,200 2018 5,330,000 763,056 6,093,056 2019 4,990,000 588,013 5,578,013 2020 4,985,000 429,025 5,414,025 2021 4,020,000 299,663 4,319,663 2022 2,920,000 216,693 3,136,693 2023 2,870,000 138,518 3,008,518 2024 1,885,000 79,988 1,964,988 2025 875,000 40,438 915,438 2026 450,000 21,750 471,750 2027 420,000 10,500 430,500 Total 39,765,000 $ 4,677,138 $ 44,442,138 $
Additional information on the Town of Windsor's long-term debt can be found in Note 7 of this report. Economic Factors As of October 2015, the unemployment rate for Windsor was 4.7%. The unemployment rate for the Hartford labor market area was 4.8% and for the State of Connecticut it stood at 4.8%. The overall national average was 4.8% for this same time period. Unemployment rates have steadily improved since last year, and the overall economy continues to improve as well. The Town’s main source of revenue are property taxes, and this income stream has proved to be stable. State revenues make up a smaller portion of the Town’s total revenue, but fortunately this revenue has seen only minor fluctuations in the current period. Even with an over-reliance on property taxes and no significant increases in state aid, the Town has been able to adjust expenditures accordingly and continues to provide high levels of service. The Town has a high quality tax base which includes a diverse mix of commercial and business enterprises, and this lends even more stability to the Town's revenue. The Town has maintained an active economic development program that has attracted and retained firms, and prides itself on a fast development approval process. Windsor has positioned itself as a destination address for office and commercial development, and this increased development will lend itself to an increase in the tax base in coming years. A 1.5 million square foot Amazon.com fulfillment center has been completed, and the Town anticipates seeing increased activity from the Great Pond Village development in the next two years. Statistics on growth for the last ten years are available in the statistical section of this report. Requests for Information The Town of Windsor Comprehensive Annual Financial Report is designed to provide citizens, taxpayers, customers, investors and creditors with a general overview of the Town’s finances, and to demonstrate transparency and the Town’s accountability for the money it receives and expends. Questions concerning any of the information provided in this report or requests for additional financial information should be addressed to the Director of Finance at 275 Broad Street, Windsor, CT 06095.

Basic Financial Statements

15
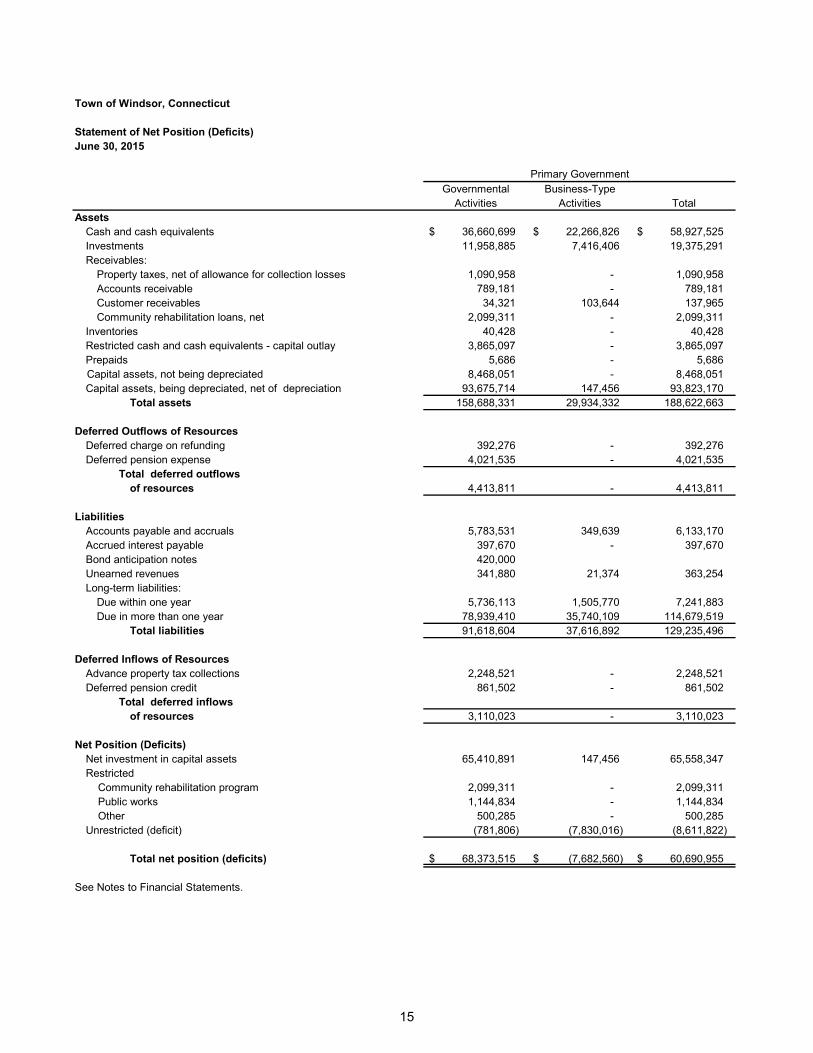
Town of Windsor, Connecticut
Statement of Net Position (Deficits)June 30, 2015
Governmental Business-TypeActivities Activities Total
AssetsCash and cash equivalents 36,660,699 $ 22,266,826 $ 58,927,525 $ Investments 11,958,885 7,416,406 19,375,291 Receivables:
Property taxes, net of allowance for collection losses 1,090,958 - 1,090,958 Accounts receivable 789,181 - 789,181 Customer receivables 34,321 103,644 137,965 Community rehabilitation loans, net 2,099,311 - 2,099,311
Inventories 40,428 - 40,428 Restricted cash and cash equivalents - capital outlay 3,865,097 - 3,865,097 Prepaids 5,686 - 5,686
Capital assets, not being depreciated 8,468,051 - 8,468,051 Capital assets, being depreciated, net of depreciation 93,675,714 147,456 93,823,170
Total assets 158,688,331 29,934,332 188,622,663
Deferred Outflows of ResourcesDeferred charge on refunding 392,276 - 392,276 Deferred pension expense 4,021,535 - 4,021,535
Total deferred outflows of resources 4,413,811 - 4,413,811
LiabilitiesAccounts payable and accruals 5,783,531 349,639 6,133,170 Accrued interest payable 397,670 - 397,670 Bond anticipation notes 420,000 Unearned revenues 341,880 21,374 363,254 Long-term liabilities:
Due within one year 5,736,113 1,505,770 7,241,883 Due in more than one year 78,939,410 35,740,109 114,679,519
Total liabilities 91,618,604 37,616,892 129,235,496
Deferred Inflows of ResourcesAdvance property tax collections 2,248,521 - 2,248,521 Deferred pension credit 861,502 - 861,502
Total deferred inflowsof resources 3,110,023 - 3,110,023
Net Position (Deficits)Net investment in capital assets 65,410,891 147,456 65,558,347 Restricted Community rehabilitation program 2,099,311 - 2,099,311 Public works 1,144,834 - 1,144,834 Other 500,285 - 500,285 Unrestricted (deficit) (781,806) (7,830,016) (8,611,822)
Total net position (deficits) 68,373,515 $ (7,682,560) $ 60,690,955 $
See Notes to Financial Statements.
Primary Government
16
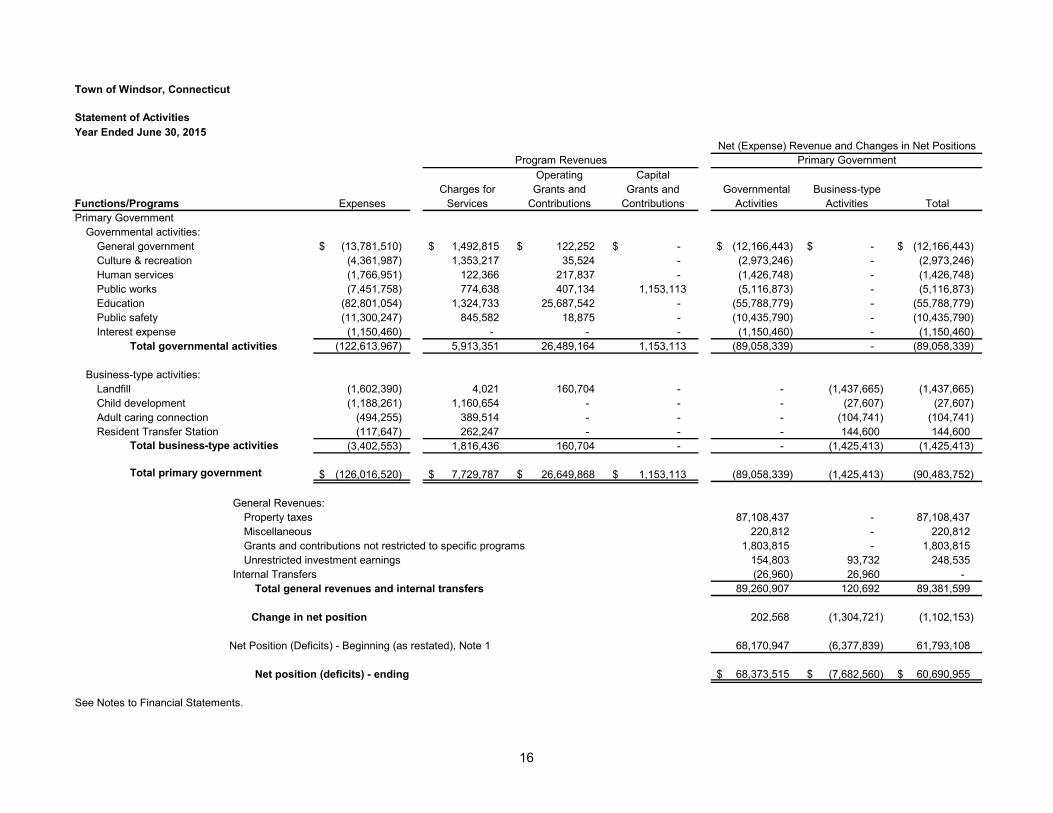
Town of Windsor, Connecticut
Year Ended June 30, 2015
Operating CapitalCharges for Grants and Grants and Governmental Business-type
Functions/Programs Expenses Services Contributions Contributions Activities Activities TotalPrimary Government
Governmental activities:General government (13,781,510) $ 1,492,815 $ 122,252 $ -$ (12,166,443) $ -$ (12,166,443) $ Culture & recreation (4,361,987) 1,353,217 35,524 - (2,973,246) - (2,973,246) Human services (1,766,951) 122,366 217,837 - (1,426,748) - (1,426,748) Public works (7,451,758) 774,638 407,134 1,153,113 (5,116,873) - (5,116,873) Education (82,801,054) 1,324,733 25,687,542 - (55,788,779) - (55,788,779) Public safety (11,300,247) 845,582 18,875 - (10,435,790) - (10,435,790) Interest expense (1,150,460) - - - (1,150,460) - (1,150,460)
Total governmental activities (122,613,967) 5,913,351 26,489,164 1,153,113 (89,058,339) - (89,058,339)
Business-type activities:Landfill (1,602,390) 4,021 160,704 - - (1,437,665) (1,437,665) Child development (1,188,261) 1,160,654 - - - (27,607) (27,607) Adult caring connection (494,255) 389,514 - - - (104,741) (104,741) Resident Transfer Station (117,647) 262,247 - - - 144,600 144,600
Total business-type activities (3,402,553) 1,816,436 160,704 - - (1,425,413) (1,425,413)
Total primary government (126,016,520) $ 7,729,787 $ 26,649,868 $ 1,153,113 $ (89,058,339) (1,425,413) (90,483,752)
General Revenues:Property taxes 87,108,437 - 87,108,437 Miscellaneous 220,812 - 220,812 Grants and contributions not restricted to specific programs 1,803,815 - 1,803,815 Unrestricted investment earnings 154,803 93,732 248,535
Internal Transfers (26,960) 26,960 - Total general revenues and internal transfers 89,260,907 120,692 89,381,599
Change in net position 202,568 (1,304,721) (1,102,153)
Net Position (Deficits) - Beginning (as restated), Note 1 68,170,947 (6,377,839) 61,793,108
Net position (deficits) - ending 68,373,515 $ (7,682,560) $ 60,690,955 $
See Notes to Financial Statements.
Statement of Activities
Net (Expense) Revenue and Changes in Net PositionsProgram Revenues Primary Government
17
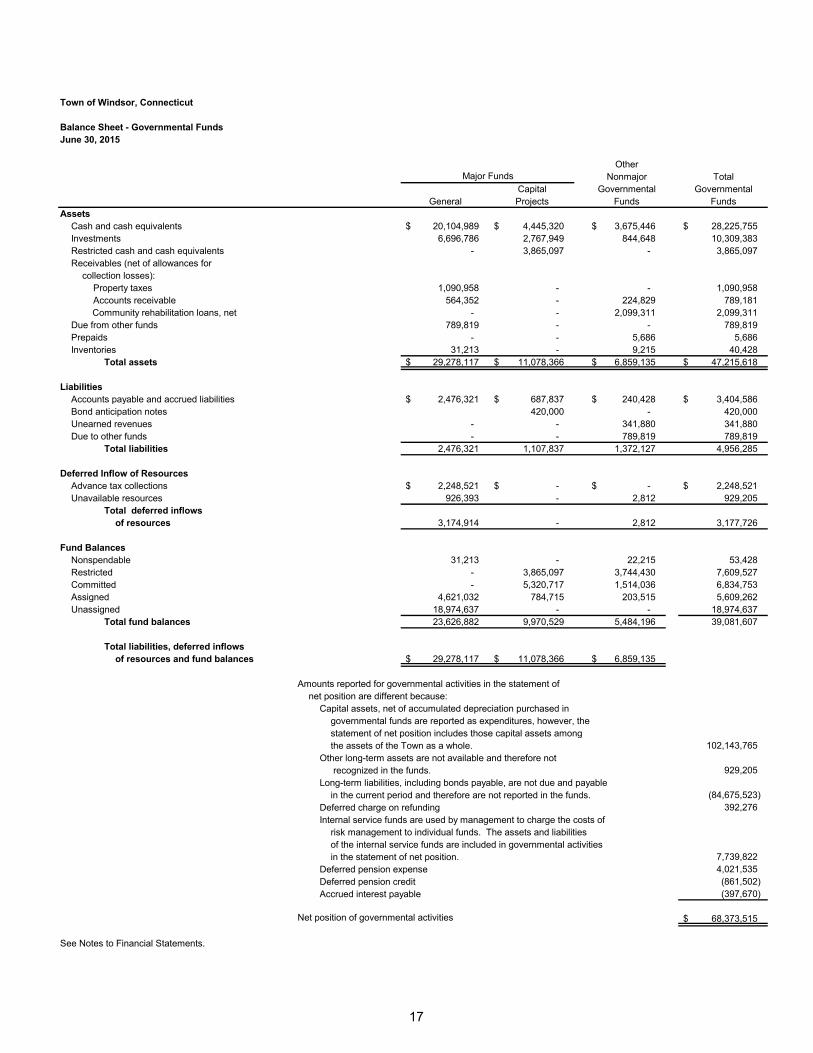
Town of Windsor, Connecticut
Balance Sheet - Governmental FundsJune 30, 2015
OtherNonmajor Total
Capital Governmental GovernmentalGeneral Projects Funds Funds
AssetsCash and cash equivalents 20,104,989 $ 4,445,320 $ 3,675,446 $ 28,225,755 $ Investments 6,696,786 2,767,949 844,648 10,309,383 Restricted cash and cash equivalents - 3,865,097 - 3,865,097 Receivables (net of allowances for
collection losses):Property taxes 1,090,958 - - 1,090,958 Accounts receivable 564,352 - 224,829 789,181
Community rehabilitation loans, net - - 2,099,311 2,099,311 Due from other funds 789,819 - - 789,819 Prepaids - - 5,686 5,686 Inventories 31,213 - 9,215 40,428
Total assets 29,278,117 $ 11,078,366 $ 6,859,135 $ 47,215,618 $
LiabilitiesAccounts payable and accrued liabilities 2,476,321 $ 687,837 $ 240,428 $ 3,404,586 $ Bond anticipation notes 420,000 - 420,000 Unearned revenues - - 341,880 341,880 Due to other funds - - 789,819 789,819
Total liabilities 2,476,321 1,107,837 1,372,127 4,956,285
Deferred Inflow of ResourcesAdvance tax collections 2,248,521 $ -$ -$ 2,248,521 $ Unavailable resources 926,393 - 2,812 929,205
Total deferred inflowsof resources 3,174,914 - 2,812 3,177,726
Fund BalancesNonspendable 31,213 - 22,215 53,428 Restricted - 3,865,097 3,744,430 7,609,527 Committed - 5,320,717 1,514,036 6,834,753 Assigned 4,621,032 784,715 203,515 5,609,262 Unassigned 18,974,637 - - 18,974,637
Total fund balances 23,626,882 9,970,529 5,484,196 39,081,607
Total liabilities, deferred inflowsof resources and fund balances 29,278,117 $ 11,078,366 $ 6,859,135 $
Amounts reported for governmental activities in the statement ofnet position are different because:
Capital assets, net of accumulated depreciation purchased ingovernmental funds are reported as expenditures, however, thestatement of net position includes those capital assets amongthe assets of the Town as a whole. 102,143,765
Other long-term assets are not available and therefore not recognized in the funds. 929,205
Long-term liabilities, including bonds payable, are not due and payablein the current period and therefore are not reported in the funds. (84,675,523)
Deferred charge on refunding 392,276 Internal service funds are used by management to charge the costs of
risk management to individual funds. The assets and liabilitiesof the internal service funds are included in governmental activitiesin the statement of net position. 7,739,822
Deferred pension expense 4,021,535 Deferred pension credit (861,502) Accrued interest payable (397,670)
Net position of governmental activities 68,373,515 $
See Notes to Financial Statements.
Major Funds
18
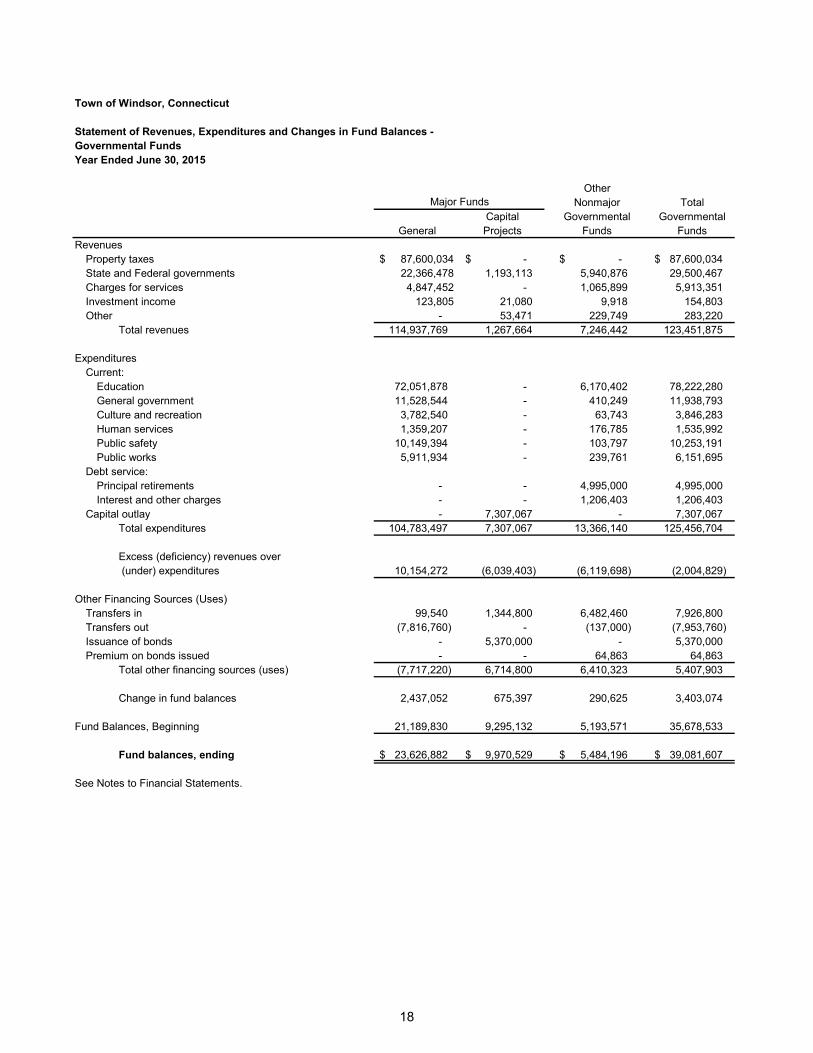
Town of Windsor, Connecticut
Statement of Revenues, Expenditures and Changes in Fund Balances - Governmental FundsYear Ended June 30, 2015
OtherNonmajor Total
Capital Governmental GovernmentalGeneral Projects Funds Funds
RevenuesProperty taxes 87,600,034$ -$ -$ 87,600,034 $ State and Federal governments 22,366,478 1,193,113 5,940,876 29,500,467 Charges for services 4,847,452 - 1,065,899 5,913,351 Investment income 123,805 21,080 9,918 154,803 Other - 53,471 229,749 283,220
Total revenues 114,937,769 1,267,664 7,246,442 123,451,875
ExpendituresCurrent:
Education 72,051,878 - 6,170,402 78,222,280 General government 11,528,544 - 410,249 11,938,793 Culture and recreation 3,782,540 - 63,743 3,846,283 Human services 1,359,207 - 176,785 1,535,992 Public safety 10,149,394 - 103,797 10,253,191 Public works 5,911,934 - 239,761 6,151,695
Debt service:Principal retirements - - 4,995,000 4,995,000 Interest and other charges - - 1,206,403 1,206,403
Capital outlay - 7,307,067 - 7,307,067 Total expenditures 104,783,497 7,307,067 13,366,140 125,456,704
Excess (deficiency) revenues over (under) expenditures 10,154,272 (6,039,403) (6,119,698) (2,004,829)
Other Financing Sources (Uses)Transfers in 99,540 1,344,800 6,482,460 7,926,800 Transfers out (7,816,760) - (137,000) (7,953,760) Issuance of bonds - 5,370,000 - 5,370,000 Premium on bonds issued - - 64,863 64,863
Total other financing sources (uses) (7,717,220) 6,714,800 6,410,323 5,407,903
Change in fund balances 2,437,052 675,397 290,625 3,403,074
Fund Balances, Beginning 21,189,830 9,295,132 5,193,571 35,678,533
Fund balances, ending 23,626,882 $ 9,970,529 $ 5,484,196 $ 39,081,607 $
See Notes to Financial Statements.
Major Funds
19
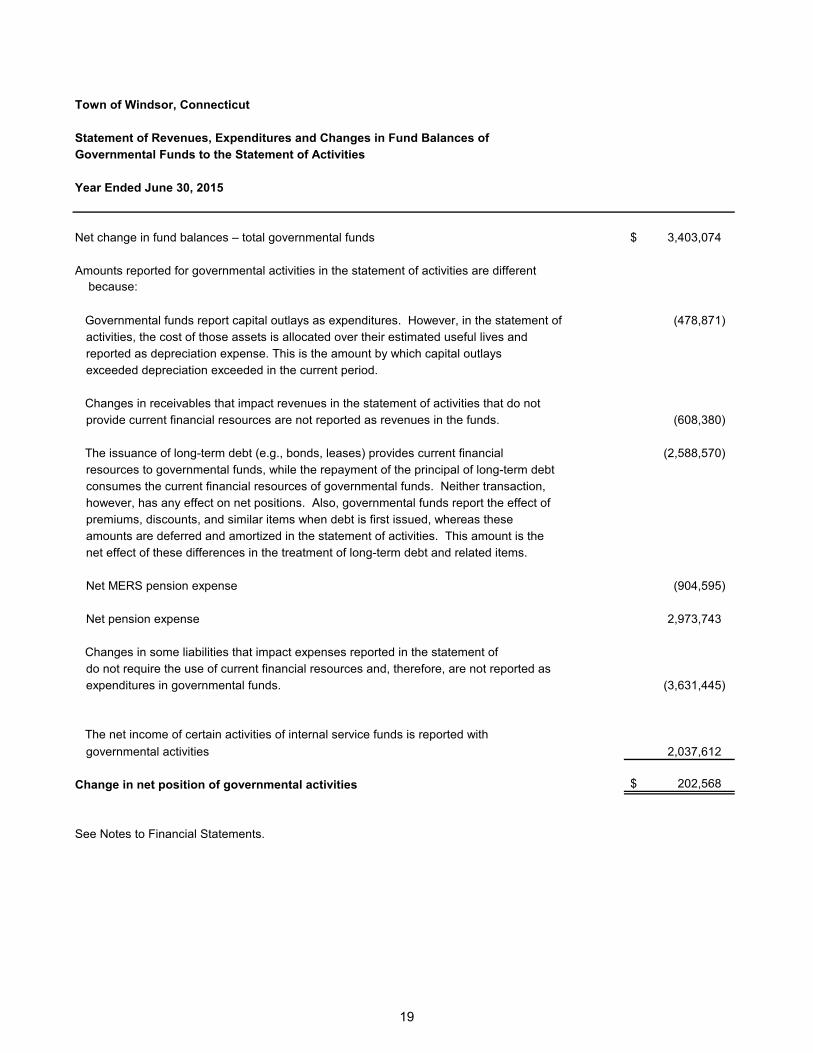
Town of Windsor, Connecticut
Statement of Revenues, Expenditures and Changes in Fund Balances ofGovernmental Funds to the Statement of Activities
Year Ended June 30, 2015
Net change in fund balances – total governmental funds 3,403,074 $
Amounts reported for governmental activities in the statement of activities are different because:
Governmental funds report capital outlays as expenditures. However, in the statement of (478,871) activities, the cost of those assets is allocated over their estimated useful lives and reported as depreciation expense. This is the amount by which capital outlaysexceeded depreciation exceeded in the current period.
Changes in receivables that impact revenues in the statement of activities that do not provide current financial resources are not reported as revenues in the funds. (608,380)
The issuance of long-term debt (e.g., bonds, leases) provides current financial (2,588,570) resources to governmental funds, while the repayment of the principal of long-term debtconsumes the current financial resources of governmental funds. Neither transaction, however, has any effect on net positions. Also, governmental funds report the effect ofpremiums, discounts, and similar items when debt is first issued, whereas theseamounts are deferred and amortized in the statement of activities. This amount is thenet effect of these differences in the treatment of long-term debt and related items.
Net MERS pension expense (904,595)
Net pension expense 2,973,743
Changes in some liabilities that impact expenses reported in the statement ofdo not require the use of current financial resources and, therefore, are not reported as expenditures in governmental funds. (3,631,445)
The net income of certain activities of internal service funds is reported withgovernmental activities 2,037,612
Change in net position of governmental activities 202,568 $
See Notes to Financial Statements.
20
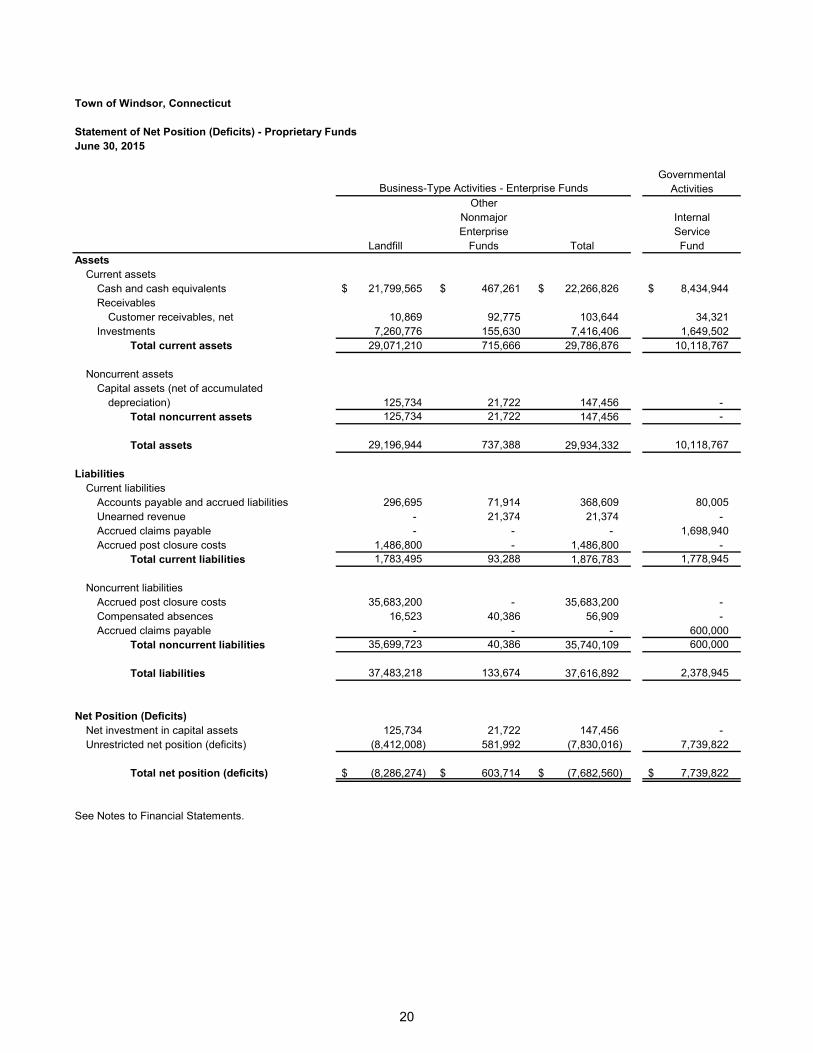
Town of Windsor, Connecticut
Statement of Net Position (Deficits) - Proprietary FundsJune 30, 2015
GovernmentalActivities
OtherNonmajor InternalEnterprise Service
Landfill Funds Total FundAssets
Current assetsCash and cash equivalents 21,799,565 $ 467,261 $ 22,266,826 $ 8,434,944 $ Receivables
Customer receivables, net 10,869 92,775 103,644 34,321 Investments 7,260,776 155,630 7,416,406 1,649,502
Total current assets 29,071,210 715,666 29,786,876 10,118,767
Noncurrent assetsCapital assets (net of accumulated
depreciation) 125,734 21,722 147,456 - Total noncurrent assets 125,734 21,722 147,456 -
Total assets 29,196,944 737,388 29,934,332 10,118,767
LiabilitiesCurrent liabilities
Accounts payable and accrued liabilities 296,695 71,914 368,609 80,005 Unearned revenue - 21,374 21,374 - Accrued claims payable - - - 1,698,940 Accrued post closure costs 1,486,800 - 1,486,800 -
Total current liabilities 1,783,495 93,288 1,876,783 1,778,945
Noncurrent liabilitiesAccrued post closure costs 35,683,200 - 35,683,200 - Compensated absences 16,523 40,386 56,909 - Accrued claims payable - - - 600,000
Total noncurrent liabilities 35,699,723 40,386 35,740,109 600,000
Total liabilities 37,483,218 133,674 37,616,892 2,378,945
Net Position (Deficits)Net investment in capital assets 125,734 21,722 147,456 - Unrestricted net position (deficits) (8,412,008) 581,992 (7,830,016) 7,739,822
Total net position (deficits) (8,286,274) $ 603,714 $ (7,682,560) $ 7,739,822 $
See Notes to Financial Statements.
Business-Type Activities - Enterprise Funds
21
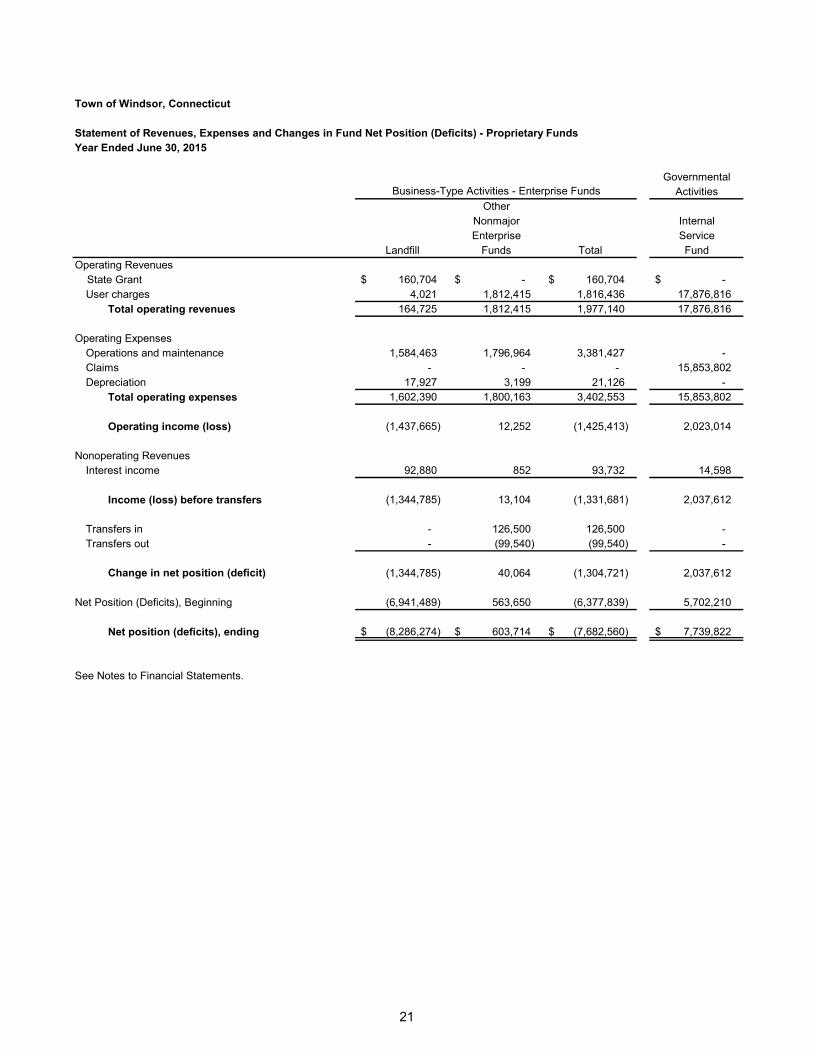
Town of Windsor, Connecticut
Statement of Revenues, Expenses and Changes in Fund Net Position (Deficits) - Proprietary FundsYear Ended June 30, 2015
GovernmentalActivities
OtherNonmajor InternalEnterprise Service
Landfill Funds Total FundOperating Revenues State Grant 160,704 $ -$ 160,704 $ -$
User charges 4,021 1,812,415 1,816,436 17,876,816 Total operating revenues 164,725 1,812,415 1,977,140 17,876,816
Operating ExpensesOperations and maintenance 1,584,463 1,796,964 3,381,427 - Claims - - - 15,853,802 Depreciation 17,927 3,199 21,126 -
Total operating expenses 1,602,390 1,800,163 3,402,553 15,853,802
Operating income (loss) (1,437,665) 12,252 (1,425,413) 2,023,014
Nonoperating RevenuesInterest income 92,880 852 93,732 14,598
Income (loss) before transfers (1,344,785) 13,104 (1,331,681) 2,037,612
Transfers in - 126,500 126,500 - Transfers out - (99,540) (99,540) -
Change in net position (deficit) (1,344,785) 40,064 (1,304,721) 2,037,612
Net Position (Deficits), Beginning (6,941,489) 563,650 (6,377,839) 5,702,210
Net position (deficits), ending (8,286,274) $ 603,714 $ (7,682,560) $ 7,739,822 $
See Notes to Financial Statements.
Business-Type Activities - Enterprise Funds
22
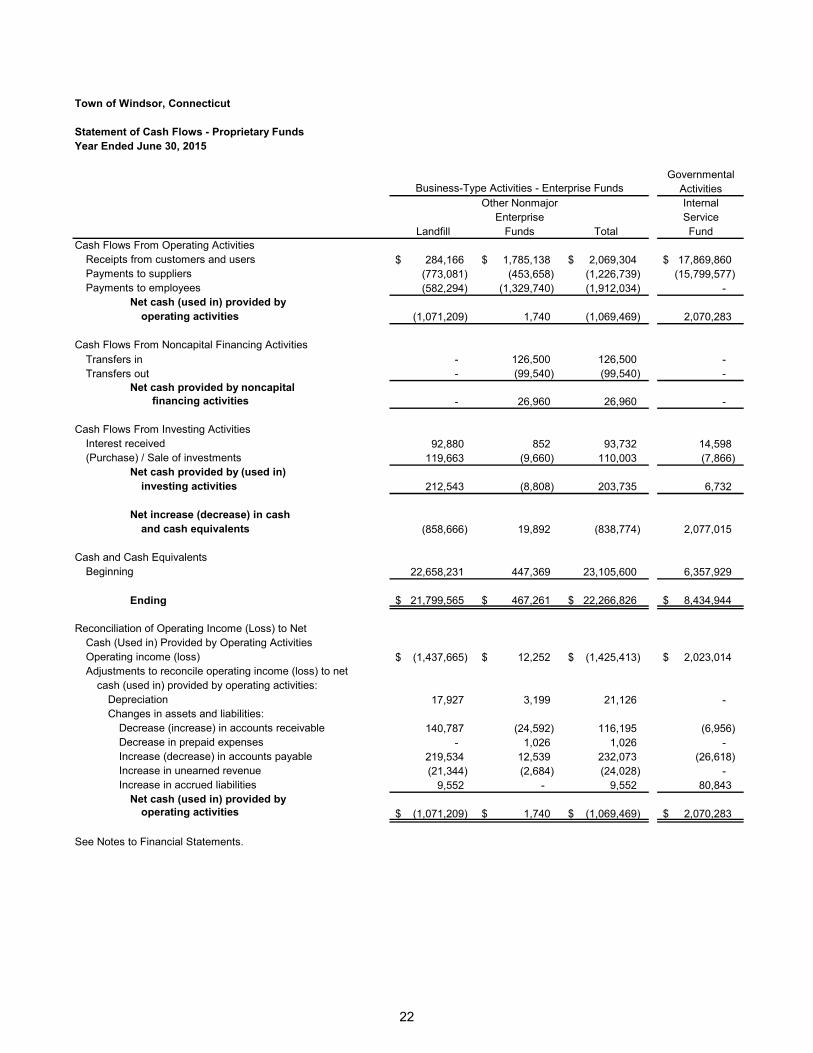
Town of Windsor, Connecticut
Statement of Cash Flows - Proprietary FundsYear Ended June 30, 2015
GovernmentalActivities
Other Nonmajor InternalEnterprise Service
Landfill Funds Total FundCash Flows From Operating Activities
Receipts from customers and users 284,166 $ 1,785,138 $ 2,069,304 $ 17,869,860 $ Payments to suppliers (773,081) (453,658) (1,226,739) (15,799,577) Payments to employees (582,294) (1,329,740) (1,912,034) -
Net cash (used in) provided byoperating activities (1,071,209) 1,740 (1,069,469) 2,070,283
Cash Flows From Noncapital Financing ActivitiesTransfers in - 126,500 126,500 - Transfers out - (99,540) (99,540) -
Net cash provided by noncapitalfinancing activities - 26,960 26,960 -
Cash Flows From Investing ActivitiesInterest received 92,880 852 93,732 14,598 (Purchase) / Sale of investments 119,663 (9,660) 110,003 (7,866)
Net cash provided by (used in)investing activities 212,543 (8,808) 203,735 6,732
Net increase (decrease) in cashand cash equivalents (858,666) 19,892 (838,774) 2,077,015
Cash and Cash EquivalentsBeginning 22,658,231 447,369 23,105,600 6,357,929
Ending 21,799,565 $ 467,261 $ 22,266,826 $ 8,434,944 $
Reconciliation of Operating Income (Loss) to NetCash (Used in) Provided by Operating ActivitiesOperating income (loss) (1,437,665) $ 12,252 $ (1,425,413) $ 2,023,014 $ Adjustments to reconcile operating income (loss) to net
cash (used in) provided by operating activities:Depreciation 17,927 3,199 21,126 - Changes in assets and liabilities:
Decrease (increase) in accounts receivable 140,787 (24,592) 116,195 (6,956) Decrease in prepaid expenses - 1,026 1,026 - Increase (decrease) in accounts payable 219,534 12,539 232,073 (26,618) Increase in unearned revenue (21,344) (2,684) (24,028) - Increase in accrued liabilities 9,552 - 9,552 80,843
Net cash (used in) provided byoperating activities (1,071,209) $ 1,740 $ (1,069,469) $ 2,070,283 $
See Notes to Financial Statements.
Business-Type Activities - Enterprise Funds
23
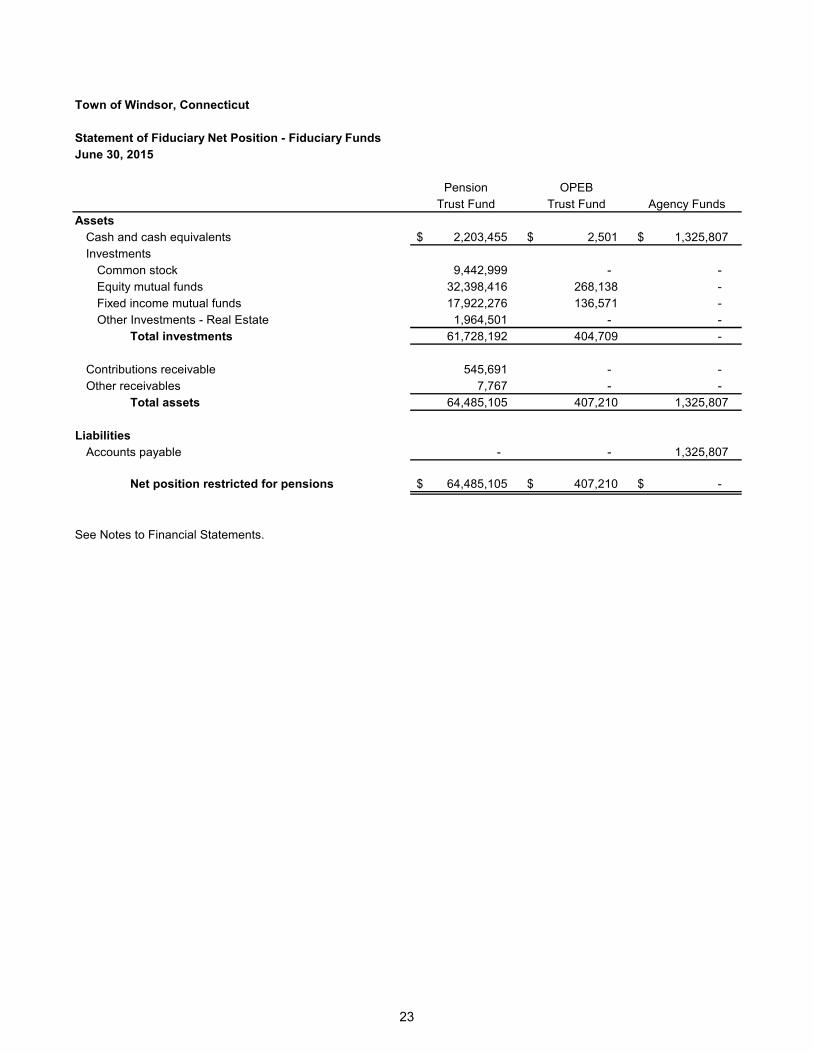
Town of Windsor, Connecticut
Statement of Fiduciary Net Position - Fiduciary FundsJune 30, 2015
Pension OPEBTrust Fund Trust Fund Agency Funds
AssetsCash and cash equivalents 2,203,455 $ 2,501 $ 1,325,807 $ Investments
Common stock 9,442,999 - - Equity mutual funds 32,398,416 268,138 - Fixed income mutual funds 17,922,276 136,571 - Other Investments - Real Estate 1,964,501 - -
Total investments 61,728,192 404,709 -
Contributions receivable 545,691 - - Other receivables 7,767 - -
Total assets 64,485,105 407,210 1,325,807
LiabilitiesAccounts payable - - 1,325,807
Net position restricted for pensions 64,485,105 $ 407,210 $ -$
See Notes to Financial Statements.
24
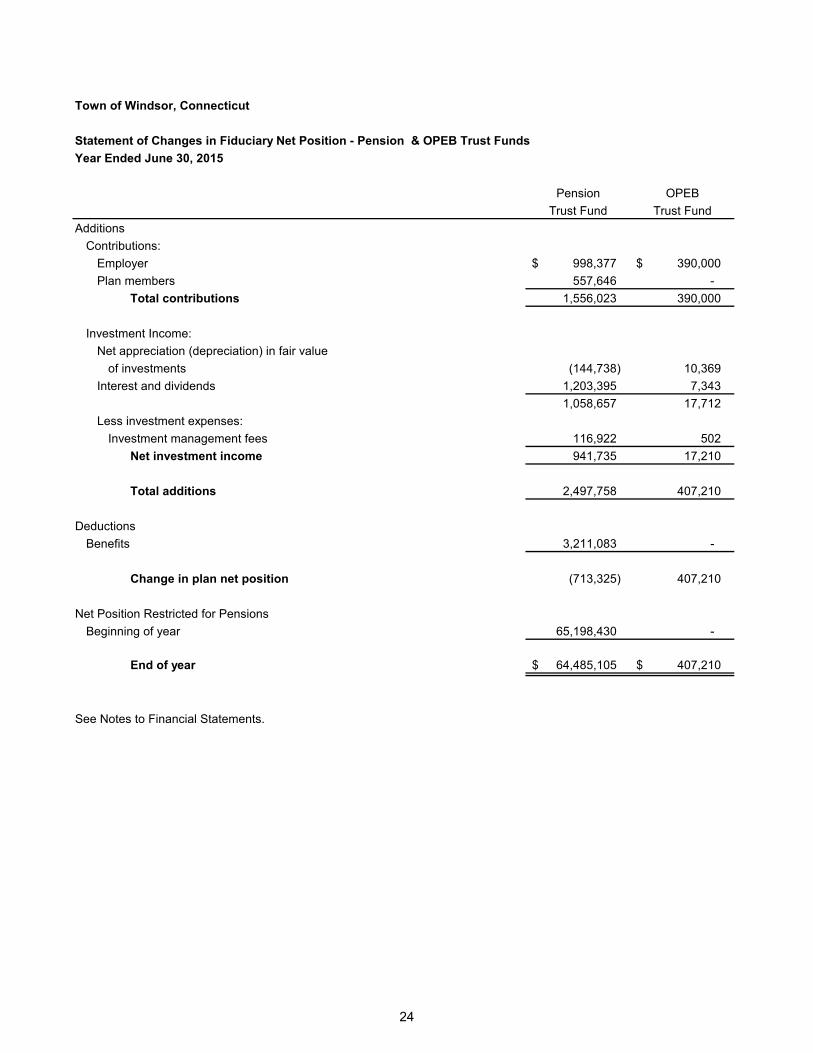
Town of Windsor, Connecticut
Statement of Changes in Fiduciary Net Position - Pension & OPEB Trust FundsYear Ended June 30, 2015
Pension OPEBTrust Fund Trust Fund
AdditionsContributions:
Employer 998,377 $ 390,000 $ Plan members 557,646 -
Total contributions 1,556,023 390,000
Investment Income:Net appreciation (depreciation) in fair value
of investments (144,738) 10,369 Interest and dividends 1,203,395 7,343
1,058,657 17,712 Less investment expenses:
Investment management fees 116,922 502 Net investment income 941,735 17,210
Total additions 2,497,758 407,210
DeductionsBenefits 3,211,083 -
Change in plan net position (713,325) 407,210
Net Position Restricted for PensionsBeginning of year 65,198,430 -
End of year 64,485,105 $ 407,210 $
See Notes to Financial Statements.
Town of Windsor, Connecticut Notes to Financial Statements
25
Note 1. Summary of Significant Accounting Policies
Reporting entity: The Town of Windsor, Connecticut (the Town) was founded by English settlers in 1633, making it the first town in the State of Connecticut. The Town operates under a Council-Manager form of government and provides the following services as authorized by its Charter: public safety, public works, sanitation, health and social services, culture-recreation, education, planning and zoning, and general administrative services. The Charter was most recently revised (via referendum) in 1998. The accompanying financial statements conform to accounting principles generally accepted in the United States of America as applicable to governments. Accounting principles generally accepted in the United States of America require that the reporting entity include (1) the primary government, (2) organizations for which the primary government is financially accountable and (3) other organizations for which the nature and significance of their relationship with the primary government are such that exclusion would cause the reporting entity’s financial statements to be misleading or incomplete. The criteria provided in Government Accounting Standards Board Statement Codification Section 2100 have been considered and there are no agencies or entities that should be, but are not, combined in the financial statements of the Town. Government-wide and fund financial statements: The government-wide financial statements (i.e., the statement of net position and the statement of activities) report information on all of the non-fiduciary activities of the Town. For the most part, the effect of interfund activity has been removed from these statements. Governmental activities, which normally are supported by taxes and intergovernmental revenues, are reported separately from business-type activities, which rely to a significant extent on fees and charges for support. The statement of activities demonstrates the degree to which the direct expenses of a given function or segment is offset by program revenues. Direct expenses are those that are clearly identifiable with a specific function or segment. Program revenues include 1) charges to customers or applicants who purchase, use, or directly benefit from goods, services, or privileges provided by a given function or segment and 2) grants and contributions that are restricted to meeting the operational or capital requirements of a particular function or segment. Taxes and other items not properly included among program revenues are reported instead as general revenues. Separate fund financial statements are provided for governmental funds, proprietary funds, and fiduciary funds, even though the latter are excluded from the government-wide financial statements. Major individual governmental funds and major individual enterprise funds are reported as separate columns in the fund financial statements. Accounting standards adopted in the current year and restatement of net position: GASB Statement No. 68, Accounting and Financial Reporting for Pensions, and its amendment, GASB Statement No. 71, was implemented on July 1, 2014. This statement revised and established new financial reporting requirements for most governments that provide their employees with pension benefits. Among other requirements, Statement No. 68 required governments providing defined benefit pensions to recognize their long-term obligation for pension benefits as a liability for the first time and calls for immediate recognition of more pension expense than is currently required. The effects of the implementation of this statement are as follows: The beginning net position was decreased by $5,968,306, a net pension liability of $7,059,191 was increased and, a deferred pension expense of $1,090,885 was increased. Details can be found in Note 8. The adoption of this GASB standard also provided additional disclosures for the State Teachers’ Retirement System.
Town of Windsor, Connecticut Notes to Financial Statements
26
Note 1. Summary of Significant Accounting Policies (Continued)
GASB Statement No. 69, Government Combinations and Disposals of Government Operations, was implemented on July 1, 2014. This statement provided guidance for determining whether a specific government combination is a government merger, acquisition, or a transfer of operations, which will improve accounting for mergers and acquisitions among state and local governments. The implementation of this statement had no impact on the Region’s financial statements. Measurement focus, basis of accounting, and financial statement presentation: The government-wide, proprietary fund and fiduciary fund financial statements are reported using the economic resources measurement focus and the accrual basis of accounting. However, agency funds, unlike other fiduciary funds, report only assets and liabilities and do not have a measurement focus, and follow the accrual basis of accounting. Revenues are recorded when earned and expenses are recorded when a liability is incurred, regardless of the timing of related cash flows. Property taxes are recognized as revenues in the year for which they are levied for. Intergovernmental grants and entitlements and similar items are recognized as revenue as soon as all eligibility requirements imposed by the provider have been met. Governmental fund financial statements are reported using the current financial resources measurement focus and the modified accrual basis of accounting. Revenues are recognized as soon as they are both measurable and available. Revenues are considered to be available when they are collectible within the current period or soon enough thereafter to pay liabilities of the current period. For this purpose, the Town considers revenues to be available if they are collected within 60 days of the end of the current fiscal period. Expenditures are generally recorded when a liability is incurred except for debt service expenditures, as well as expenditures related to compensated absences, pension obligations, claims and judgments, and other post-employment benefits which are recorded only when payment is due (matured). Property taxes when levied for, intergovernmental revenue when eligibility requirements are met, licenses, charges for services and interest associated with the current fiscal period are all considered to be measurable and so have been recognized as revenues of the current fiscal period, if available. All other revenue items are considered to be measurable and available only when cash is received by the Town.
Governmental funds: Governmental funds are those through which most governmental functions typically are financed. Governmental fund reporting focuses on the sources, uses and balances of current financial resources. Expendable assets are assigned to the various governmental funds according to the purposes for which they may or must be used. Current liabilities are assigned to the fund from which they will be paid. The difference between governmental fund assets and liabilities is reported as fund balance. The following are the Town’s major governmental funds: The General Fund is the Town’s primary operating fund. The General Fund is used to account for and report all financial resources not accounted for and reported in another fund.
The Capital Project Fund is used to account for and report financial resources that are restricted, committed or assigned to expenditure for capital outlay other than reported in proprietary funds.
The other governmental funds of the Town are considered nonmajor and are as follows:
The Special Revenue Funds are used to account for and report the proceeds of specific revenue sources that are restricted or committed to expenditure for specified purposes other than debt service or capital projects.
The Debt Service Fund is used to account for and report financial resources that are restricted, committed or assigned to expenditure for principal and interest.
Town of Windsor, Connecticut Notes to Financial Statements
27
Note 1. Summary of Significant Accounting Policies (Continued)
Proprietary funds: Proprietary fund reporting focuses on the determination of operating income, changes in net position, financial position and cash flows. The Town reports the following major proprietary fund:
The Landfill Fund accounts for the operations of the Windsor-Bloomfield Sanitary Landfill. The other proprietary funds of the Town are considered nonmajor and are as follows:
The Milo Peck Child Development Center Fund and the Caring Connection Adult Day Care Center Fund and the Resident Transfer Station Fund.
Additionally, the Town reports the following proprietary fund:
The Internal Service Fund accounts for all general health, auto, fire, heart and hypertension, and workers’ compensation insurance activity, including premiums and claims.
Fiduciary funds:
The Pension Trust Fund, a fiduciary fund, accounts for the activities of the Town’s defined benefit pension plan which accumulates resources for pension benefit payments to qualified employees upon retirement. The OPEB Trust Fund, a fiduciary fund, accounts for the activities of the Town’s other post employment benefit plan which accumulates resources for medical benefit payments to qualified employees upon retirement. The Agency Funds, fiduciary funds, account for monies held as a custodian for outside student groups and agencies and are used for performance bonds, adult education and scholarships.
As a general rule, the effect of inter-fund activity has been eliminated from the government-wide financial statements. Exceptions to this general rule are charges between the enterprise funds and various other functions of the government. Elimination of these charges would distort the direct costs and program revenues reported for the various functions concerned. Amounts reported as program revenues include 1) charges to customers or applicants for goods, services, or privileges provided, 2) operating grants and contributions, and 3) capital grants and contributions, including special assessments. Internally dedicated resources are reported as general revenues rather than as program revenues. Likewise, general revenues include all taxes. Proprietary funds distinguish operating revenues and expenses from non-operating items. Operating revenues and expenses generally result from providing services in connection with a proprietary fund’s principal ongoing operations, which include premium charges and claims. The principal operating revenues of the proprietary funds are charges to customers for services. Operating expenses for the funds include the cost of operations and maintenance, and depreciation on capital assets. All revenues and expenses not meeting this definition are reported as non-operating revenues and expenses. Accounting estimates: The preparation of financial statements in conformity with accounting principles generally accepted in the United States of America requires management to make estimates and assumptions that affect the reported amounts of assets and liabilities and disclosure of contingent assets and liabilities at the date of the financial statements and the reported amounts of revenues, expenses and expenditures during the reporting period. Actual results could differ from those estimates.
Town of Windsor, Connecticut Notes to Financial Statements
28
Note 1. Summary of Significant Accounting Policies (Continued)
Property taxes: Property taxes are assessed as of October 1, and are levied for on the following July 1, and due in one installment, July 1. Motor vehicle taxes are due in one installment on July 1, and supplemental motor vehicle taxes are due in full January 1. Taxes become delinquent thirty days after the installment is due. Liens are filed by the last day of the fiscal year. Delinquent real estate taxes are billed at least twice a year, with interest charged at a rate of 1.5 percent per month. Delinquent motor vehicle and personal property accounts are transferred to a suspense account after three years, at which time they cease to be carried as receivables. However, they remain valid claims for up to 15 years after being levied. Cash and cash equivalents: The Town classifies money market funds, Short-Term Investment Fund (STIF) investments, treasury bills and certificates of deposit having original maturities of three months or less when purchased as cash equivalents. Restricted cash and cash equivalents: Certain assets are classified as restricted because their use is limited. Restricted cash and cash equivalents in the Capital Projects Fund are to be used for construction purposes. Allowance for doubtful accounts: Accounts, notes receivable and community development loans are reported net of allowance for doubtful accounts. The allowance for doubtful accounts represents those accounts which are deemed uncollectible based on past collection history and on analysis of creditor’s ability to pay. Valuation of investments: Investments are reported at fair value. Fair values of securities held directly are based on quotations from national securities exchanges, except for pooled funds for which fair values are estimated as detailed below.
Pooled Funds: The fair value of shares in managed investment pools is based on unit values reported by the funds.
Inventories and prepaids: Inventories are stated at cost, determined on the first-in, first-out basis. Inventories of governmental funds are recorded as expenditures/expenses when consumed rather than when purchased. Certain payments to vendors reflect costs applicable to future accounting periods and are recorded as prepaid items. The cost of prepaid items is recorded as expenditures/expenses when consumed rather than when purchased. Deferred outflows/inflows of resources: In addition to assets, the statement of net position will sometimes report a separate section for deferred outflows of resources. This separate financial statement element, deferred outflows of resources, represents a consumption of net position or fund balance that applies to a future period or periods and so will not be recognized as an outflow of resources (expense/expenditure) until then. The Town reports a deferred charge on refunding and deferred outflows related to pension in the government-wide statement of net position. A deferred charge on refunding results from the difference in the carrying value of refunded debt and its reacquisition price. This amount is deferred and amortized over the shorter of the life of the refunded or refunding debt. A deferred outflow of resources related to pension results from differences between expected and actual experience, changes in assumptions or other inputs. These amounts are deferred and included in pension expense in a systematic and rational manner over a period equal to the average of the expected remaining service lives of all employees that are provided with benefits through the pension plan (active employees and inactive employees).
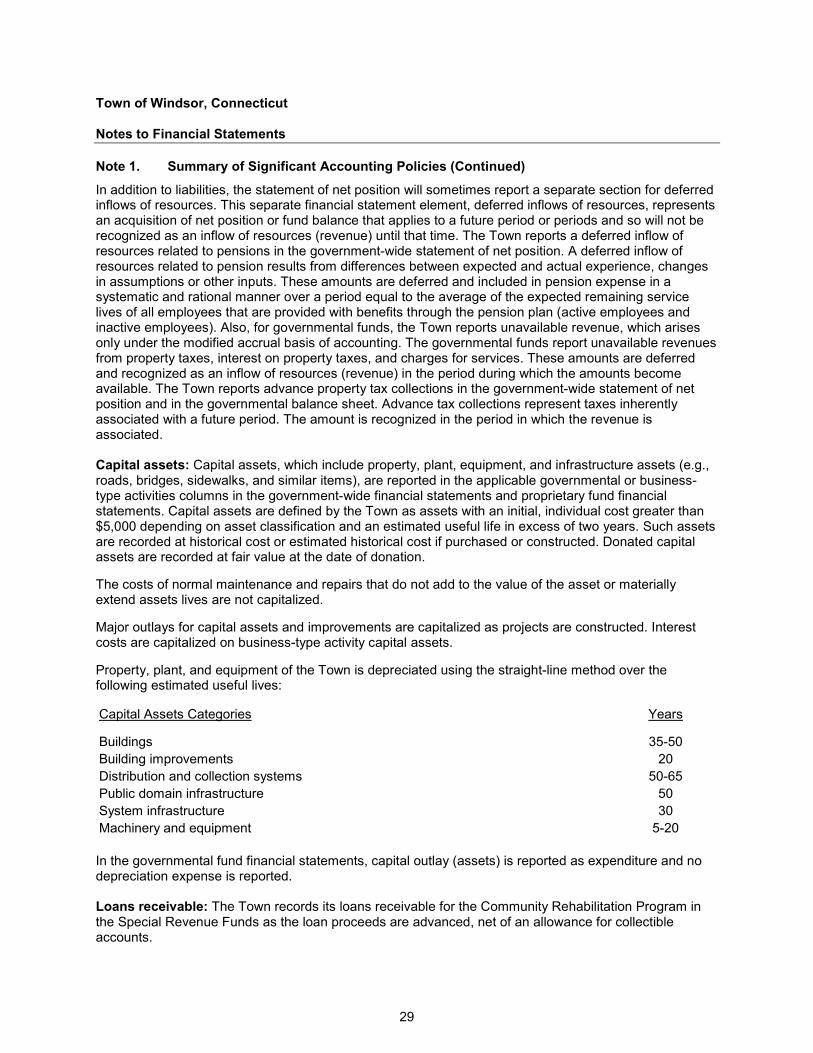
Town of Windsor, Connecticut Notes to Financial Statements
29
Note 1. Summary of Significant Accounting Policies (Continued)
In addition to liabilities, the statement of net position will sometimes report a separate section for deferred inflows of resources. This separate financial statement element, deferred inflows of resources, represents an acquisition of net position or fund balance that applies to a future period or periods and so will not be recognized as an inflow of resources (revenue) until that time. The Town reports a deferred inflow of resources related to pensions in the government-wide statement of net position. A deferred inflow of resources related to pension results from differences between expected and actual experience, changes in assumptions or other inputs. These amounts are deferred and included in pension expense in a systematic and rational manner over a period equal to the average of the expected remaining service lives of all employees that are provided with benefits through the pension plan (active employees and inactive employees). Also, for governmental funds, the Town reports unavailable revenue, which arises only under the modified accrual basis of accounting. The governmental funds report unavailable revenues from property taxes, interest on property taxes, and charges for services. These amounts are deferred and recognized as an inflow of resources (revenue) in the period during which the amounts become available. The Town reports advance property tax collections in the government-wide statement of net position and in the governmental balance sheet. Advance tax collections represent taxes inherently associated with a future period. The amount is recognized in the period in which the revenue is associated. Capital assets: Capital assets, which include property, plant, equipment, and infrastructure assets (e.g., roads, bridges, sidewalks, and similar items), are reported in the applicable governmental or business-type activities columns in the government-wide financial statements and proprietary fund financial statements. Capital assets are defined by the Town as assets with an initial, individual cost greater than $5,000 depending on asset classification and an estimated useful life in excess of two years. Such assets are recorded at historical cost or estimated historical cost if purchased or constructed. Donated capital assets are recorded at fair value at the date of donation. The costs of normal maintenance and repairs that do not add to the value of the asset or materially extend assets lives are not capitalized. Major outlays for capital assets and improvements are capitalized as projects are constructed. Interest costs are capitalized on business-type activity capital assets. Property, plant, and equipment of the Town is depreciated using the straight-line method over the following estimated useful lives: Capital Assets Categories Years
Buildings 35-50Building improvements 20Distribution and collection systems 50-65Public domain infrastructure 50System infrastructure 30Machinery and equipment 5-20 In the governmental fund financial statements, capital outlay (assets) is reported as expenditure and no depreciation expense is reported. Loans receivable: The Town records its loans receivable for the Community Rehabilitation Program in the Special Revenue Funds as the loan proceeds are advanced, net of an allowance for collectible accounts.
Town of Windsor, Connecticut Notes to Financial Statements
30
Note 1. Summary of Significant Accounting Policies (Continued)
Net pension liability: The net pension liability is measured as the portion of the actuarial present value of projected benefits that is attributed to past periods of employee service (total pension liability), net of the pension plan’s fiduciary net position. The pension plan’s fiduciary net position is determined using the same valuation methods that are used by the pension plan for purposes of preparing its statement of fiduciary net position. The net pension liability is measured as of a date (measurement date) no earlier than the end of the employer’s prior fiscal year, consistently applied from period to period. Compensated absences: Under the terms of its various union contracts, Town and Board of Education employees are granted vacation in varying amounts based on length of service. Sick leave does not vest. Town employees may carry over a limited number of unused vacation days (up to 30 days) to subsequent years and, in the event of termination, employees are reimbursed for accumulated vacation. Board of Education employees may carry over a limited number of unused vacation days to the next fiscal year. Vacation leave expenditures are recognized in the governmental fund financial statements in the current year to the extent they are paid or due (matured). The liability for the remainder of the accrued vacation earned and not due is reported in the government-wide and proprietary fund financial statements. The General Fund is typically used to liquidate the liability for compensated absences. Long-term obligations: In the government-wide and proprietary fund financial statements, long-term debt and other long-term obligations are reported as liabilities in the applicable governmental activities, business-type activities, or proprietary fund type statement of net position. Bond principal premiums and discount are deferred and amortized over the life of the bonds using the effective interest method. Bonds payable are reported net of the applicable bond premium or discount. Bond issuance costs are expensed as incurred. In the fund financial statements, governmental fund types recognize bond premiums and discounts, as well as bond issuance costs, during the current period. Bond principal payments are recorded as expenditures. The face amount of debt issued is reported as other financing sources. Premiums received on debt issuances are reported as other financing sources while discounts on debt issuances are reported as other financing uses. Issuance costs, whether or not withheld from the actual debt proceeds received, are reported as debt service expenditures. Landfill closure and post-closure: The Town accounts for the cost and estimated costs for closure and post-closure care costs in its Landfill Fund. The Landfill Fund is an enterprise fund. Enterprise funds account for the estimated total current costs of landfill closure and post-closure and are recognized as an expense and liability in each period in which the landfill accepts solid waste. Estimated total current costs are based on use. The Landfill discontinued accepting municipal solid waste (MSW) as of June 30, 2014 and has converted to a transfer station facility for residents. Pension accounting:
Pension Trust Fund: The Pension Trust Fund is reported on the accrual basis of accounting. Employee contributions are recognized in the period in which the contributions are due. Employer contributions to the plan are recognized when due and the Town has made a formal commitment to provide the contributions. Benefits and refunds are recognized when due and payable in accordance with the terms of each plan.
Town of Windsor, Connecticut Notes to Financial Statements
31
Note 1. Summary of Significant Accounting Policies (Continued)
Net other post-employment benefit obligations:
Governmental Funds and Governmental Activities: In governmental funds, expenditures are recognized when they are paid or are expected to be paid with current available resources. In governmental activities, expense is recognized based on actuarially required contributions. The net OPEB obligation (asset), the cumulative differences between annual OPEB cost and the Town’s contributions to the plan since July 1, 2008, are calculated on an actuarial basis consistent with the requirements of Government Accounting Standards Board Statement No. 45. The OPEB obligation (asset) is recorded in the government-wide financial statements.
Encumbrances: Encumbrances represent commitments related to unperformed contracts for goods or services. Encumbrance accounting, under which purchase orders, contracts and other commitments for the expenditure of resources are recorded to reserve that portion of the applicable appropriation, is utilized in the governmental funds. Encumbrances outstanding at year-end are reported as assigned fund balance as they do not constitute either expenditures or liabilities. All other General Fund appropriations lapse at year-end. Net position: In the Government-Wide and Proprietary Fund Financial Statements, net position is classified in the following categories:
Net investment in capital assets: The net investment in capital assets component of net position consists of capital assets, net of accumulated depreciation, reduced by the outstanding balances of bonds, notes, or other borrowings that are attributable to the acquisition, construction or improvement of those assets. Deferred outflows of resources and deferred inflows of resources that are attributable to the acquisition, construction, or improvement of those assets or related debt are included in this component of net position. Restricted net position: These amounts are restricted to specific purposes when constraints placed on the use of resources are either (a) externally imposed by creditors (such as debt covenants), grantors, contributors, or laws or regulations of other governments; or (b) imposed by law through constitutional provisions or enabling legislations. Unrestricted net position (deficit): This category represents the net position of the Town, which are not restricted for any project or other purpose. A deficit will require future funding.
Fund balance: In the government fund financial statements, the Town classified fund balances as follows:
Nonspendable Fund Balance: Amounts which cannot be spent either because they are in a nonspendable form or because they are legally or contractually required to be maintained intact. Restricted Fund Balance: These amounts are restricted to specific purposes when constraints placed on the use of resources are either (a) externally imposed by creditors (such as debt covenants), grantors, contributors, or laws or regulations of other governments; or (b) imposed by law through constitutional provisions or enabling legislations. Committed fund balance: This represents amounts constrained prior to year-end for a specific purpose by a government using its highest level of decision-making authority (Town of Windsor Town Council) in the form of a Resolution. Once adopted, the limitation, imposed by the resolution remains in place until a similar action is taken to remove or revise the limitation.
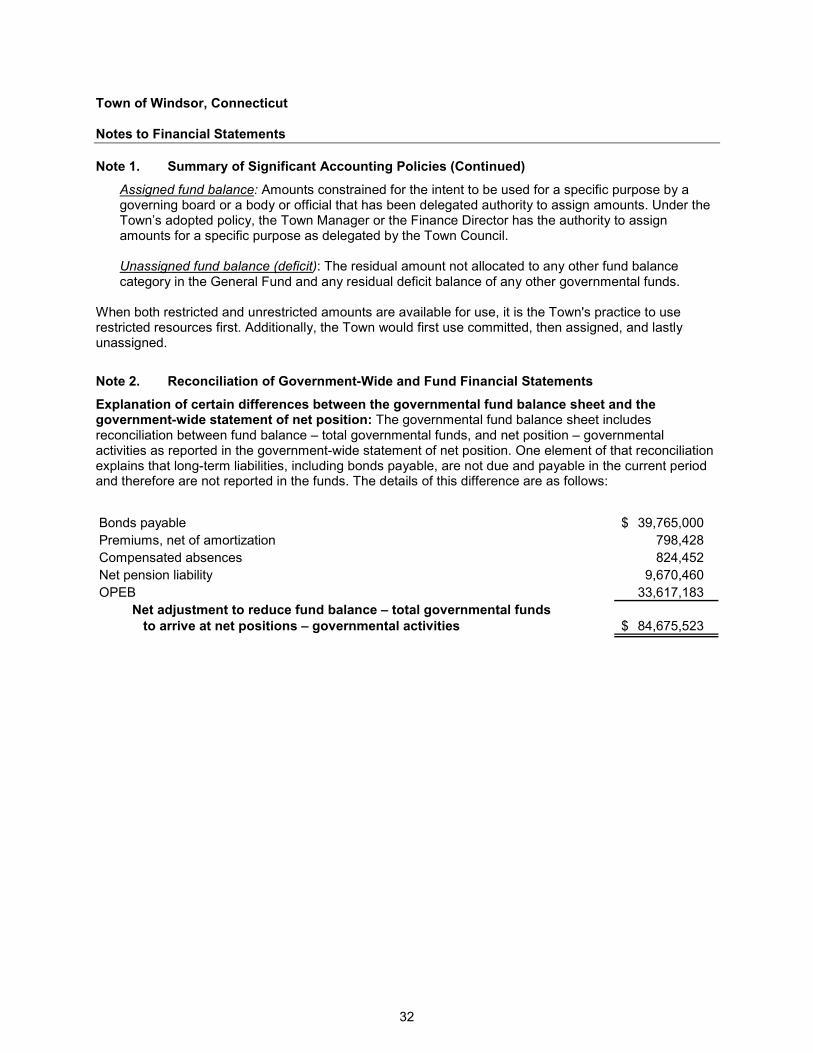
Town of Windsor, Connecticut Notes to Financial Statements
32
Note 1. Summary of Significant Accounting Policies (Continued)
Assigned fund balance: Amounts constrained for the intent to be used for a specific purpose by a governing board or a body or official that has been delegated authority to assign amounts. Under the Town’s adopted policy, the Town Manager or the Finance Director has the authority to assign amounts for a specific purpose as delegated by the Town Council. Unassigned fund balance (deficit): The residual amount not allocated to any other fund balance category in the General Fund and any residual deficit balance of any other governmental funds.
When both restricted and unrestricted amounts are available for use, it is the Town's practice to use restricted resources first. Additionally, the Town would first use committed, then assigned, and lastly unassigned.
Note 2. Reconciliation of Government-Wide and Fund Financial Statements
Explanation of certain differences between the governmental fund balance sheet and the government-wide statement of net position: The governmental fund balance sheet includes reconciliation between fund balance – total governmental funds, and net position – governmental activities as reported in the government-wide statement of net position. One element of that reconciliation explains that long-term liabilities, including bonds payable, are not due and payable in the current period and therefore are not reported in the funds. The details of this difference are as follows: Bonds payable 39,765,000 $ Premiums, net of amortization 798,428 Compensated absences 824,452 Net pension liability 9,670,460 OPEB 33,617,183
Net adjustment to reduce fund balance – total governmental fundsto arrive at net positions – governmental activities 84,675,523 $
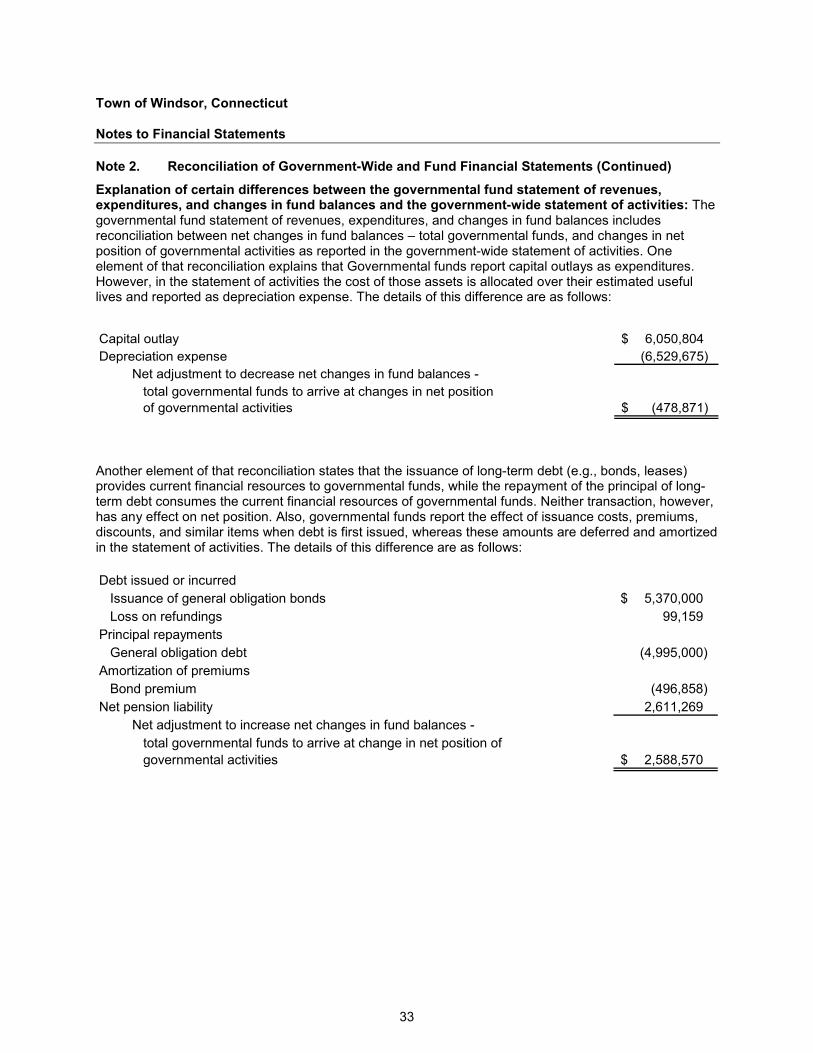
Town of Windsor, Connecticut Notes to Financial Statements
33
Note 2. Reconciliation of Government-Wide and Fund Financial Statements (Continued)
Explanation of certain differences between the governmental fund statement of revenues, expenditures, and changes in fund balances and the government-wide statement of activities: The governmental fund statement of revenues, expenditures, and changes in fund balances includes reconciliation between net changes in fund balances – total governmental funds, and changes in net position of governmental activities as reported in the government-wide statement of activities. One element of that reconciliation explains that Governmental funds report capital outlays as expenditures. However, in the statement of activities the cost of those assets is allocated over their estimated useful lives and reported as depreciation expense. The details of this difference are as follows: Capital outlay 6,050,804 $ Depreciation expense (6,529,675)
Net adjustment to decrease net changes in fund balances -total governmental funds to arrive at changes in net positionof governmental activities (478,871) $
Another element of that reconciliation states that the issuance of long-term debt (e.g., bonds, leases) provides current financial resources to governmental funds, while the repayment of the principal of long-term debt consumes the current financial resources of governmental funds. Neither transaction, however, has any effect on net position. Also, governmental funds report the effect of issuance costs, premiums, discounts, and similar items when debt is first issued, whereas these amounts are deferred and amortized in the statement of activities. The details of this difference are as follows: Debt issued or incurred
Issuance of general obligation bonds 5,370,000 $ Loss on refundings 99,159
Principal repaymentsGeneral obligation debt (4,995,000)
Amortization of premiumsBond premium (496,858)
Net pension liability 2,611,269 Net adjustment to increase net changes in fund balances -
total governmental funds to arrive at change in net position ofgovernmental activities 2,588,570 $
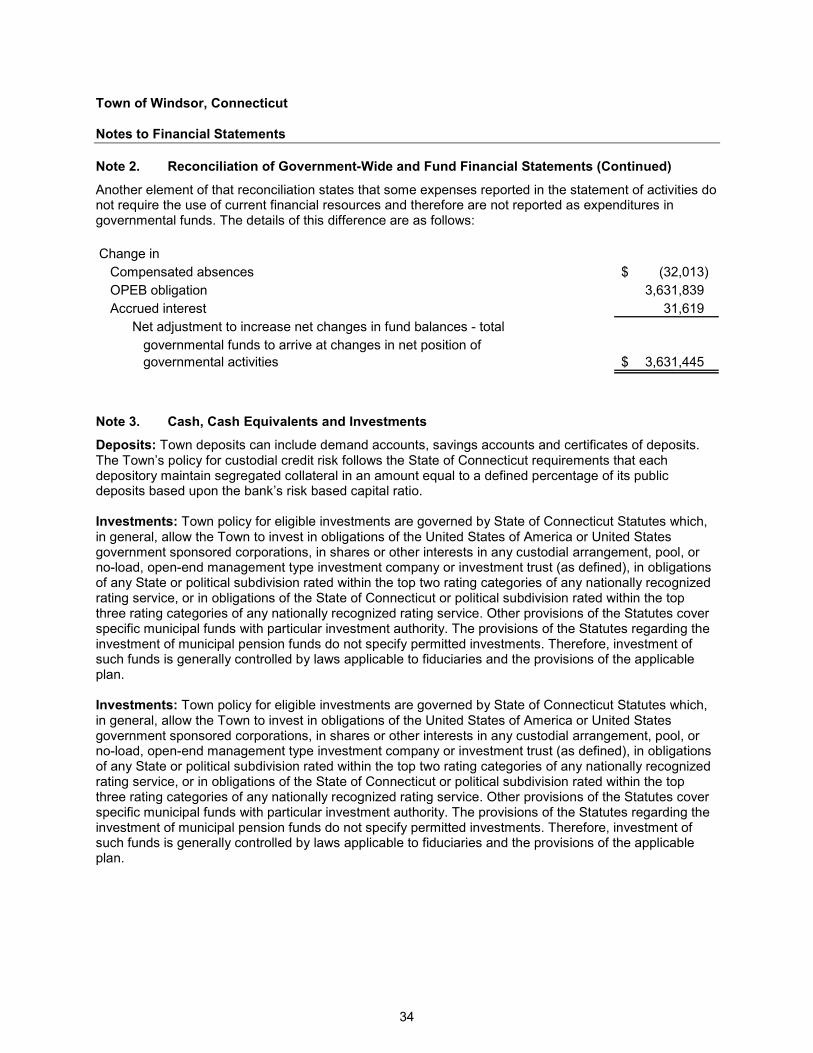
Town of Windsor, Connecticut Notes to Financial Statements
34
Note 2. Reconciliation of Government-Wide and Fund Financial Statements (Continued)
Another element of that reconciliation states that some expenses reported in the statement of activities do not require the use of current financial resources and therefore are not reported as expenditures in governmental funds. The details of this difference are as follows: Change in
Compensated absences (32,013) $ OPEB obligation 3,631,839 Accrued interest 31,619
Net adjustment to increase net changes in fund balances - total governmental funds to arrive at changes in net position ofgovernmental activities 3,631,445 $
Note 3. Cash, Cash Equivalents and Investments
Deposits: Town deposits can include demand accounts, savings accounts and certificates of deposits. The Town’s policy for custodial credit risk follows the State of Connecticut requirements that each depository maintain segregated collateral in an amount equal to a defined percentage of its public deposits based upon the bank’s risk based capital ratio. Investments: Town policy for eligible investments are governed by State of Connecticut Statutes which, in general, allow the Town to invest in obligations of the United States of America or United States government sponsored corporations, in shares or other interests in any custodial arrangement, pool, or no-load, open-end management type investment company or investment trust (as defined), in obligations of any State or political subdivision rated within the top two rating categories of any nationally recognized rating service, or in obligations of the State of Connecticut or political subdivision rated within the top three rating categories of any nationally recognized rating service. Other provisions of the Statutes cover specific municipal funds with particular investment authority. The provisions of the Statutes regarding the investment of municipal pension funds do not specify permitted investments. Therefore, investment of such funds is generally controlled by laws applicable to fiduciaries and the provisions of the applicable plan. Investments: Town policy for eligible investments are governed by State of Connecticut Statutes which, in general, allow the Town to invest in obligations of the United States of America or United States government sponsored corporations, in shares or other interests in any custodial arrangement, pool, or no-load, open-end management type investment company or investment trust (as defined), in obligations of any State or political subdivision rated within the top two rating categories of any nationally recognized rating service, or in obligations of the State of Connecticut or political subdivision rated within the top three rating categories of any nationally recognized rating service. Other provisions of the Statutes cover specific municipal funds with particular investment authority. The provisions of the Statutes regarding the investment of municipal pension funds do not specify permitted investments. Therefore, investment of such funds is generally controlled by laws applicable to fiduciaries and the provisions of the applicable plan.
Town of Windsor, Connecticut Notes to Financial Statements
35
Note 3. Cash, Cash Equivalents and Investments (Continued)
The Town has an investment policy for its pension funds providing an asset allocation average, over a full market cycle, of approximately 70% equities (or equivalents) and 30% fixed income and cash (or equivalents). For purposes of this document, a full market cycle is defined by the Board to be no less than three years, or more than seven years. However, within a market cycle, investment allocation should not exceed the following:
a. No more than twenty-five percent (25%) of the portfolio, at fair value, is to be invested in any one of eleven (11) major industrial groups as defined by SEI’s Funds Evaluation Service (see Appendix A for SEI/S&P industry sectors). No more than ten percent (10%) of the market value of the total portfolio shall be held in equity securities of any one corporation. The investment manager shall have full discretion as to the selection of individual equity issues. The Committee reserves the right to impose restrictions if the occasion arises (i.e. social investing criteria).
b. Fixed income investments should be made only in obligations of the U.S. government, agencies
of the U.S. government and U.S. corporations whose debt obligations are minimally rated Baa by Moody’s or BBB by Standard and Poor’s’. The fixed income portfolio should be diversified between issuers within each sector with no one issuer comprising more than 15% of the aggregate fixed income portfolio. This does not apply to issues of the U.S. Treasury or other federal Agencies. The investment manager shall have full discretion as to the selection of the individual fixed income issues. The Committee reserves the right to impose restrictions if the occasion arises (i.e. social investing criteria).
c. Cash reserves should be invested only in the highest quality issues, i.e., U.S. treasury bills, U.S.
government and government agency obligations, certificates of deposit, bankers acceptances and repurchase agreements with major U.S. money center banks, denominated in dollars, commercial paper rated A-1 by Standard and Poor’s’ and P-1 by Moody’s.
d. Consistent with the desire for adequate diversification, the investment policy is based on the
assumption that the volatility of the portfolio will be similar to that of the market. Consequently, it is expected that the volatility of the total portfolio, in aggregate, will be reasonably close to the volatility of a commitment-weighted composite of market indices.
e. There is no requirement for the investment manager to maintain liquid reserves for the payment
of pension benefits. This will be evaluated on an annual basis by the Committee. Interest rate risk: The Town’s policy, which includes the Pension Trust Fund, is to limit its exposure to fair value losses arising from changes in interest rates by structuring the investment portfolio so that securities mature to meet cash requirements for ongoing operations, thereby avoiding the need to sell securities on the open market prior to maturity, and investing operating funds primarily in shorter-term securities, money market mutual funds, or similar investment pools. Concentrations: The Town’s policy is to maintain a diversified portfolio to minimize the risk of loss resulting from over concentration of assets in a specific issuer. Custodial Credit Risk:
Deposits: This is the risk that, in the event of failure of a depository financial institution, a government will not be able to recover its deposits or will not be able to recover collateral securities that are in the possession of an outside party. As of June 30, 2015, approximately $73,982,000 of the Town’s bank balance of approximately $84,297,000 was uninsured and uncollateralized.
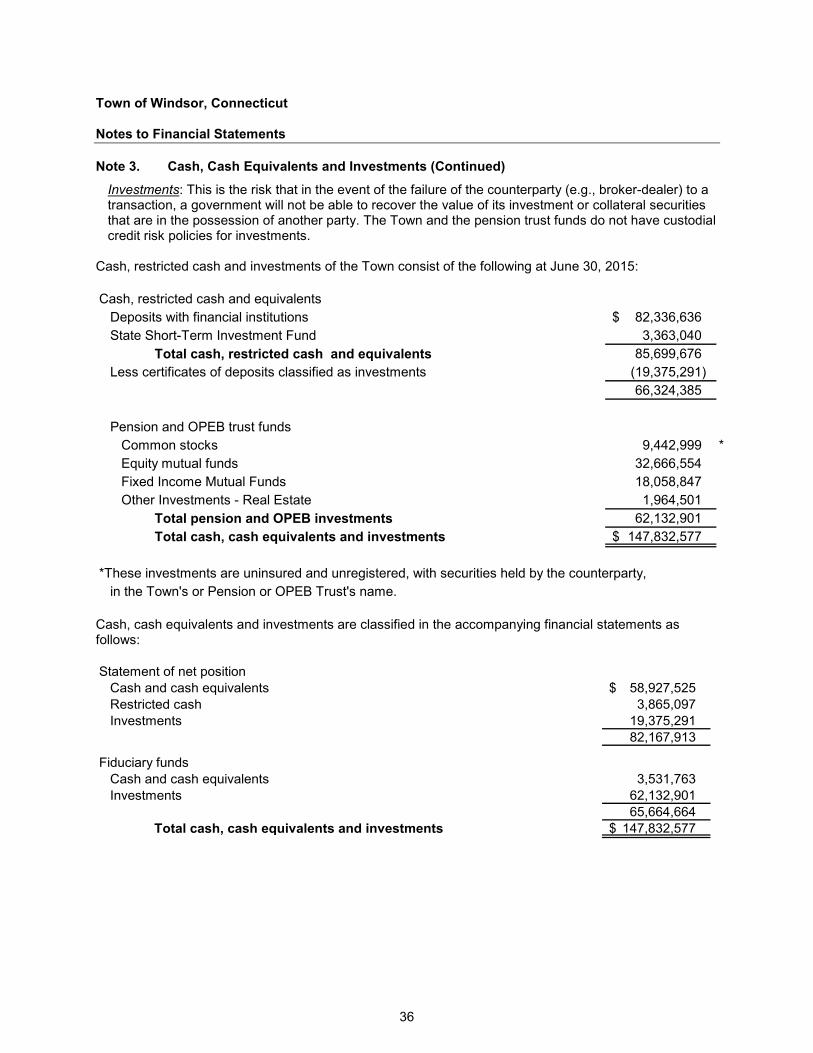
Town of Windsor, Connecticut Notes to Financial Statements
36
Note 3. Cash, Cash Equivalents and Investments (Continued)
Investments: This is the risk that in the event of the failure of the counterparty (e.g., broker-dealer) to a transaction, a government will not be able to recover the value of its investment or collateral securities that are in the possession of another party. The Town and the pension trust funds do not have custodial credit risk policies for investments.
Cash, restricted cash and investments of the Town consist of the following at June 30, 2015: Cash, restricted cash and equivalents
Deposits with financial institutions 82,336,636 $ State Short-Term Investment Fund 3,363,040
Total cash, restricted cash and equivalents 85,699,676 Less certificates of deposits classified as investments (19,375,291)
66,324,385
Pension and OPEB trust fundsCommon stocks 9,442,999 *Equity mutual funds 32,666,554 Fixed Income Mutual Funds 18,058,847 Other Investments - Real Estate 1,964,501
Total pension and OPEB investments 62,132,901 Total cash, cash equivalents and investments 147,832,577 $
*These investments are uninsured and unregistered, with securities held by the counterparty, in the Town's or Pension or OPEB Trust's name.
Cash, cash equivalents and investments are classified in the accompanying financial statements as follows: Statement of net position
Cash and cash equivalents 58,927,525 $ Restricted cash 3,865,097 Investments 19,375,291
82,167,913
Fiduciary fundsCash and cash equivalents 3,531,763 Investments 62,132,901
65,664,664 Total cash, cash equivalents and investments 147,832,577 $
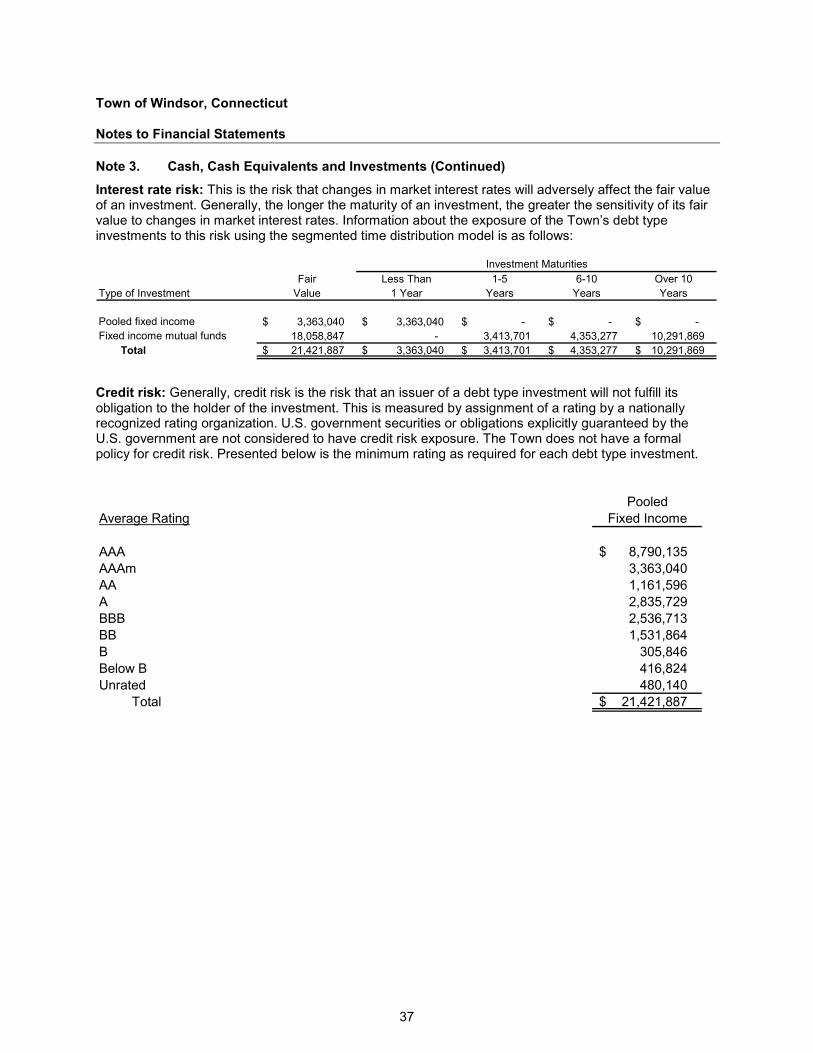
Town of Windsor, Connecticut Notes to Financial Statements
37
Note 3. Cash, Cash Equivalents and Investments (Continued)
Interest rate risk: This is the risk that changes in market interest rates will adversely affect the fair value of an investment. Generally, the longer the maturity of an investment, the greater the sensitivity of its fair value to changes in market interest rates. Information about the exposure of the Town’s debt type investments to this risk using the segmented time distribution model is as follows:
Fair Less Than 1-5 6-10 Over 10Type of Investment Value 1 Year Years Years Years
Pooled fixed income 3,363,040 $ 3,363,040 $ -$ -$ -$ Fixed income mutual funds 18,058,847 - 3,413,701 4,353,277 10,291,869
Total 21,421,887 $ 3,363,040 $ 3,413,701 $ 4,353,277 $ 10,291,869 $
Investment Maturities
Credit risk: Generally, credit risk is the risk that an issuer of a debt type investment will not fulfill its obligation to the holder of the investment. This is measured by assignment of a rating by a nationally recognized rating organization. U.S. government securities or obligations explicitly guaranteed by the U.S. government are not considered to have credit risk exposure. The Town does not have a formal policy for credit risk. Presented below is the minimum rating as required for each debt type investment.
PooledAverage Rating Fixed Income
AAA 8,790,135 $ AAAm 3,363,040 AA 1,161,596 A 2,835,729 BBB 2,536,713 BB 1,531,864 B 305,846 Below B 416,824 Unrated 480,140
Total 21,421,887 $
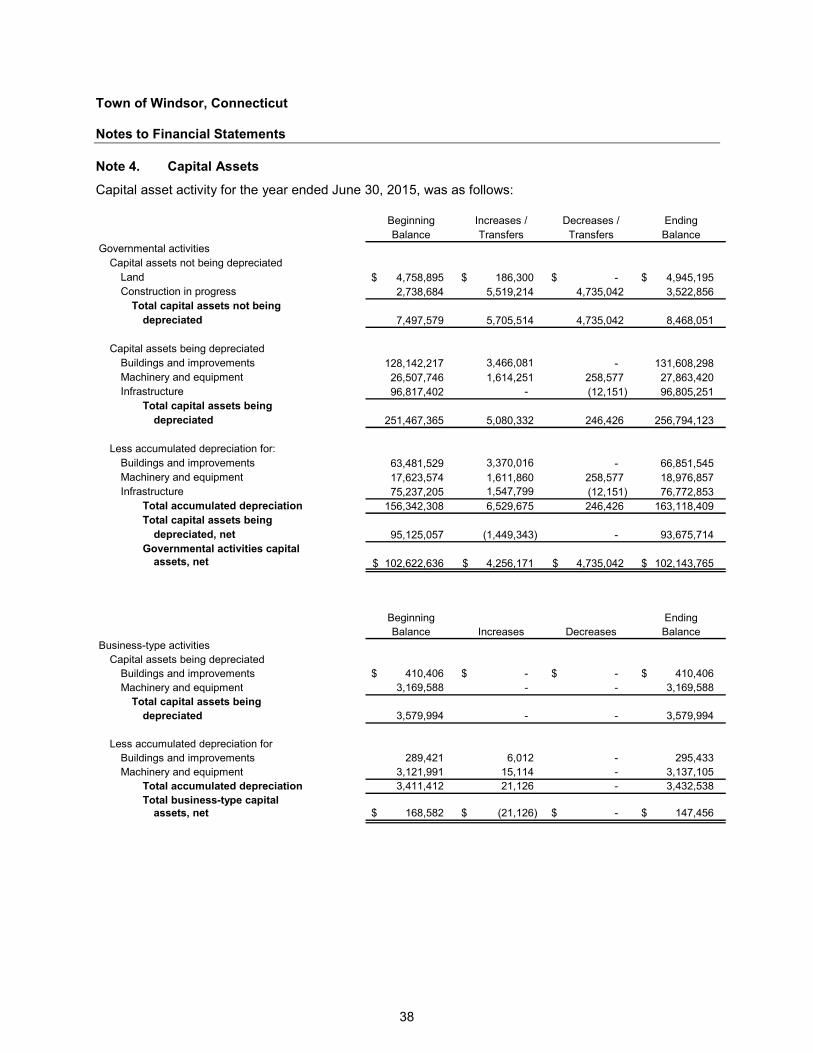
Town of Windsor, Connecticut Notes to Financial Statements
38
Note 4. Capital Assets
Capital asset activity for the year ended June 30, 2015, was as follows:
Beginning Increases / Decreases / EndingBalance Transfers Transfers Balance
Governmental activitiesCapital assets not being depreciated
Land 4,758,895 $ 186,300 $ -$ 4,945,195 $ Construction in progress 2,738,684 5,519,214 4,735,042 3,522,856
Total capital assets not being depreciated 7,497,579 5,705,514 4,735,042 8,468,051
Capital assets being depreciatedBuildings and improvements 128,142,217 3,466,081 - 131,608,298 Machinery and equipment 26,507,746 1,614,251 258,577 27,863,420 Infrastructure 96,817,402 - (12,151) 96,805,251
Total capital assets being depreciated 251,467,365 5,080,332 246,426 256,794,123
Less accumulated depreciation for:Buildings and improvements 63,481,529 3,370,016 - 66,851,545 Machinery and equipment 17,623,574 1,611,860 258,577 18,976,857 Infrastructure 75,237,205 1,547,799 (12,151) 76,772,853
Total accumulated depreciation 156,342,308 6,529,675 246,426 163,118,409 Total capital assets being
depreciated, net 95,125,057 (1,449,343) - 93,675,714 Governmental activities capital
assets, net 102,622,636 $ 4,256,171 $ 4,735,042 $ 102,143,765 $
Beginning EndingBalance Increases Decreases Balance
Business-type activitiesCapital assets being depreciated
Buildings and improvements 410,406 $ -$ -$ 410,406 $ Machinery and equipment 3,169,588 - - 3,169,588
Total capital assets being depreciated 3,579,994 - - 3,579,994
Less accumulated depreciation forBuildings and improvements 289,421 6,012 - 295,433 Machinery and equipment 3,121,991 15,114 - 3,137,105
Total accumulated depreciation 3,411,412 21,126 - 3,432,538 Total business-type capital
assets, net 168,582 $ (21,126) $ -$ 147,456 $
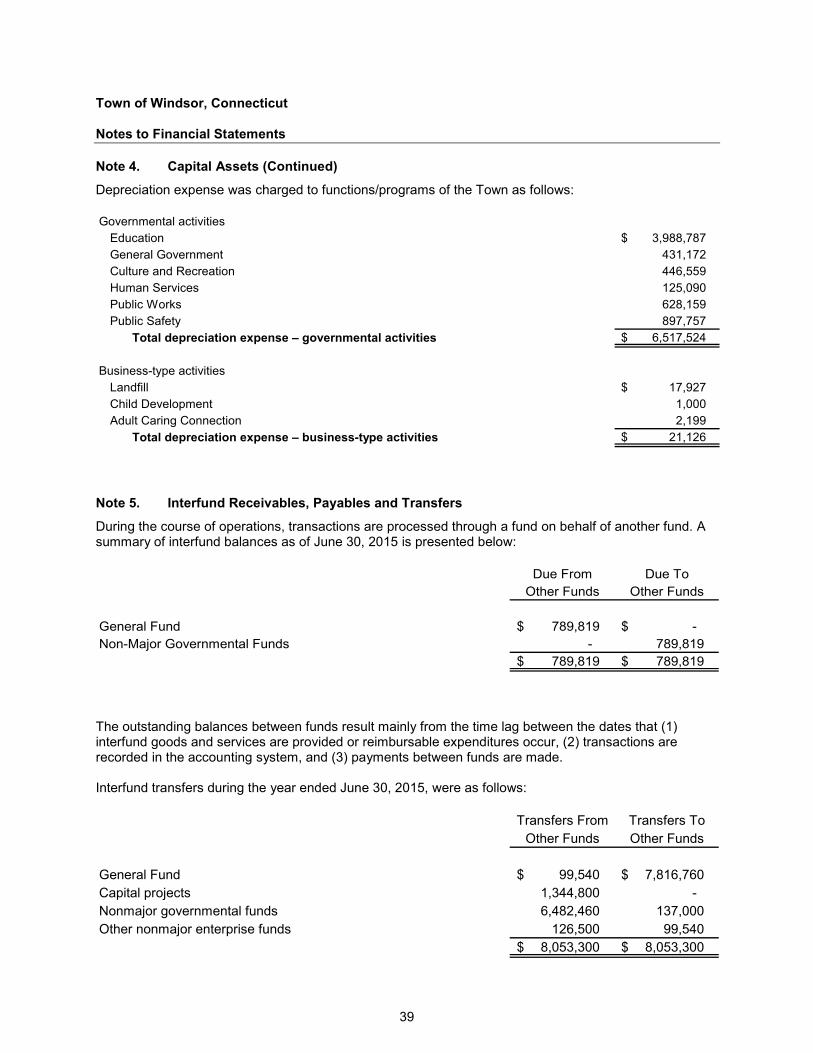
Town of Windsor, Connecticut Notes to Financial Statements
39
Note 4. Capital Assets (Continued)
Depreciation expense was charged to functions/programs of the Town as follows: Governmental activities
Education 3,988,787 $ General Government 431,172 Culture and Recreation 446,559 Human Services 125,090 Public Works 628,159 Public Safety 897,757
Total depreciation expense – governmental activities 6,517,524 $
Business-type activitiesLandfill 17,927 $ Child Development 1,000 Adult Caring Connection 2,199
Total depreciation expense – business-type activities 21,126 $
Note 5. Interfund Receivables, Payables and Transfers
During the course of operations, transactions are processed through a fund on behalf of another fund. A summary of interfund balances as of June 30, 2015 is presented below:
Due From Due ToOther Funds Other Funds
General Fund 789,819 $ -$ Non-Major Governmental Funds - 789,819
789,819 $ 789,819 $
The outstanding balances between funds result mainly from the time lag between the dates that (1) interfund goods and services are provided or reimbursable expenditures occur, (2) transactions are recorded in the accounting system, and (3) payments between funds are made. Interfund transfers during the year ended June 30, 2015, were as follows:
Transfers From Transfers ToOther Funds Other Funds
General Fund 99,540 $ 7,816,760 $ Capital projects 1,344,800 - Nonmajor governmental funds 6,482,460 137,000 Other nonmajor enterprise funds 126,500 99,540
8,053,300 $ 8,053,300 $
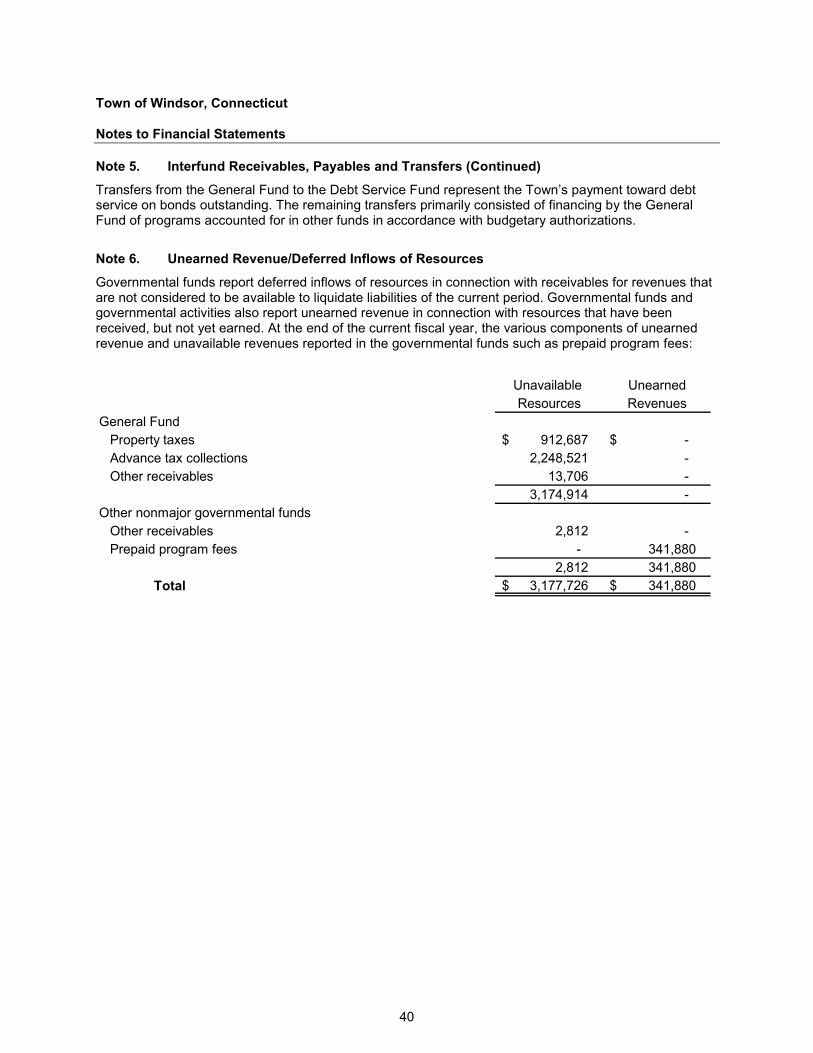
Town of Windsor, Connecticut Notes to Financial Statements
40
Note 5. Interfund Receivables, Payables and Transfers (Continued)
Transfers from the General Fund to the Debt Service Fund represent the Town’s payment toward debt service on bonds outstanding. The remaining transfers primarily consisted of financing by the General Fund of programs accounted for in other funds in accordance with budgetary authorizations.
Note 6. Unearned Revenue/Deferred Inflows of Resources
Governmental funds report deferred inflows of resources in connection with receivables for revenues that are not considered to be available to liquidate liabilities of the current period. Governmental funds and governmental activities also report unearned revenue in connection with resources that have been received, but not yet earned. At the end of the current fiscal year, the various components of unearned revenue and unavailable revenues reported in the governmental funds such as prepaid program fees:
Unavailable UnearnedResources Revenues
General FundProperty taxes 912,687 $ -$ Advance tax collections 2,248,521 - Other receivables 13,706 -
3,174,914 - Other nonmajor governmental funds
Other receivables 2,812 - Prepaid program fees - 341,880
2,812 341,880 Total 3,177,726 $ 341,880 $
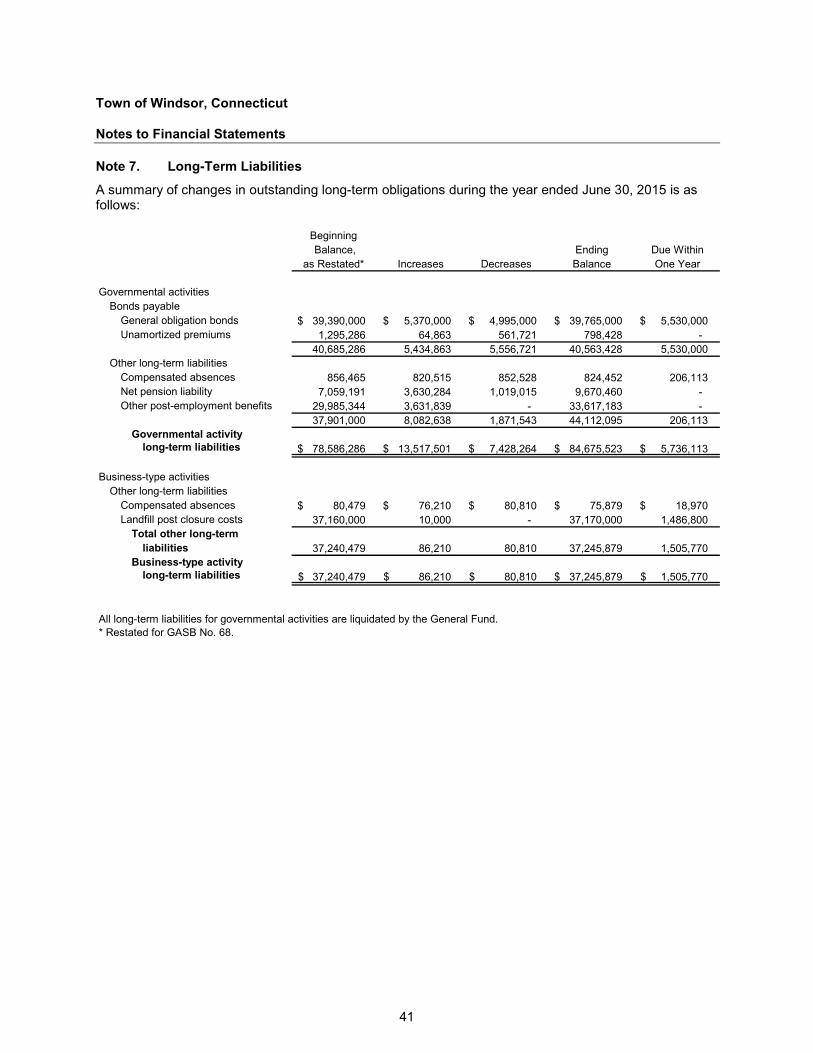
Town of Windsor, Connecticut Notes to Financial Statements
41
Note 7. Long-Term Liabilities
A summary of changes in outstanding long-term obligations during the year ended June 30, 2015 is as follows:
Beginning Balance, Ending Due Within
as Restated* Increases Decreases Balance One Year
Governmental activitiesBonds payable
General obligation bonds 39,390,000 $ 5,370,000 $ 4,995,000 $ 39,765,000 $ 5,530,000 $ Unamortized premiums 1,295,286 64,863 561,721 798,428 -
40,685,286 5,434,863 5,556,721 40,563,428 5,530,000 Other long-term liabilities
Compensated absences 856,465 820,515 852,528 824,452 206,113 Net pension liability 7,059,191 3,630,284 1,019,015 9,670,460 - Other post-employment benefits 29,985,344 3,631,839 - 33,617,183 -
37,901,000 8,082,638 1,871,543 44,112,095 206,113 Governmental activity
long-term liabilities 78,586,286 $ 13,517,501 $ 7,428,264 $ 84,675,523 $ 5,736,113 $
Business-type activitiesOther long-term liabilities
Compensated absences 80,479 $ 76,210 $ 80,810 $ 75,879 $ 18,970 $ Landfill post closure costs 37,160,000 10,000 - 37,170,000 1,486,800
Total other long-termliabilities 37,240,479 86,210 80,810 37,245,879 1,505,770
Business-type activitylong-term liabilities 37,240,479 $ 86,210 $ 80,810 $ 37,245,879 $ 1,505,770 $
All long-term liabilities for governmental activities are liquidated by the General Fund.* Restated for GASB No. 68.
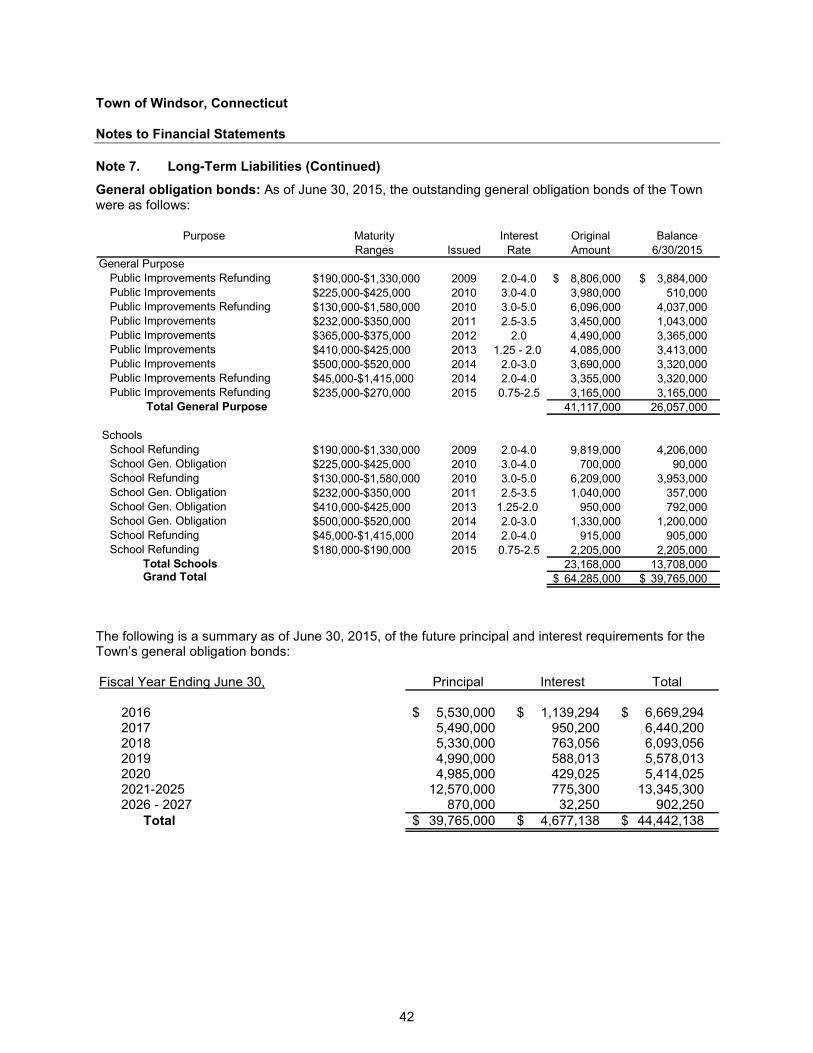
Town of Windsor, Connecticut Notes to Financial Statements
42
Note 7. Long-Term Liabilities (Continued)
General obligation bonds: As of June 30, 2015, the outstanding general obligation bonds of the Town were as follows:
Purpose Maturity Interest Original BalanceRanges Issued Rate Amount 6/30/2015
General PurposePublic Improvements Refunding $190,000-$1,330,000 2009 2.0-4.0 8,806,000 $ 3,884,000 $ Public Improvements $225,000-$425,000 2010 3.0-4.0 3,980,000 510,000 Public Improvements Refunding $130,000-$1,580,000 2010 3.0-5.0 6,096,000 4,037,000 Public Improvements $232,000-$350,000 2011 2.5-3.5 3,450,000 1,043,000 Public Improvements $365,000-$375,000 2012 2.0 4,490,000 3,365,000 Public Improvements $410,000-$425,000 2013 1.25 - 2.0 4,085,000 3,413,000 Public Improvements $500,000-$520,000 2014 2.0-3.0 3,690,000 3,320,000 Public Improvements Refunding $45,000-$1,415,000 2014 2.0-4.0 3,355,000 3,320,000 Public Improvements Refunding $235,000-$270,000 2015 0.75-2.5 3,165,000 3,165,000
Total General Purpose 41,117,000 26,057,000
Schools School Refunding $190,000-$1,330,000 2009 2.0-4.0 9,819,000 4,206,000 School Gen. Obligation $225,000-$425,000 2010 3.0-4.0 700,000 90,000 School Refunding $130,000-$1,580,000 2010 3.0-5.0 6,209,000 3,953,000 School Gen. Obligation $232,000-$350,000 2011 2.5-3.5 1,040,000 357,000 School Gen. Obligation $410,000-$425,000 2013 1.25-2.0 950,000 792,000 School Gen. Obligation $500,000-$520,000 2014 2.0-3.0 1,330,000 1,200,000 School Refunding $45,000-$1,415,000 2014 2.0-4.0 915,000 905,000 School Refunding $180,000-$190,000 2015 0.75-2.5 2,205,000 2,205,000
Total Schools 23,168,000 13,708,000 Grand Total 64,285,000 $ 39,765,000 $
The following is a summary as of June 30, 2015, of the future principal and interest requirements for the Town’s general obligation bonds: Fiscal Year Ending June 30, Principal Interest Total
2016 5,530,000 $ 1,139,294 $ 6,669,294 $ 2017 5,490,000 950,200 6,440,200 2018 5,330,000 763,056 6,093,056 2019 4,990,000 588,013 5,578,013 2020 4,985,000 429,025 5,414,025 2021-2025 12,570,000 775,300 13,345,300 2026 - 2027 870,000 32,250 902,250
Total 39,765,000 $ 4,677,138 $ 44,442,138 $
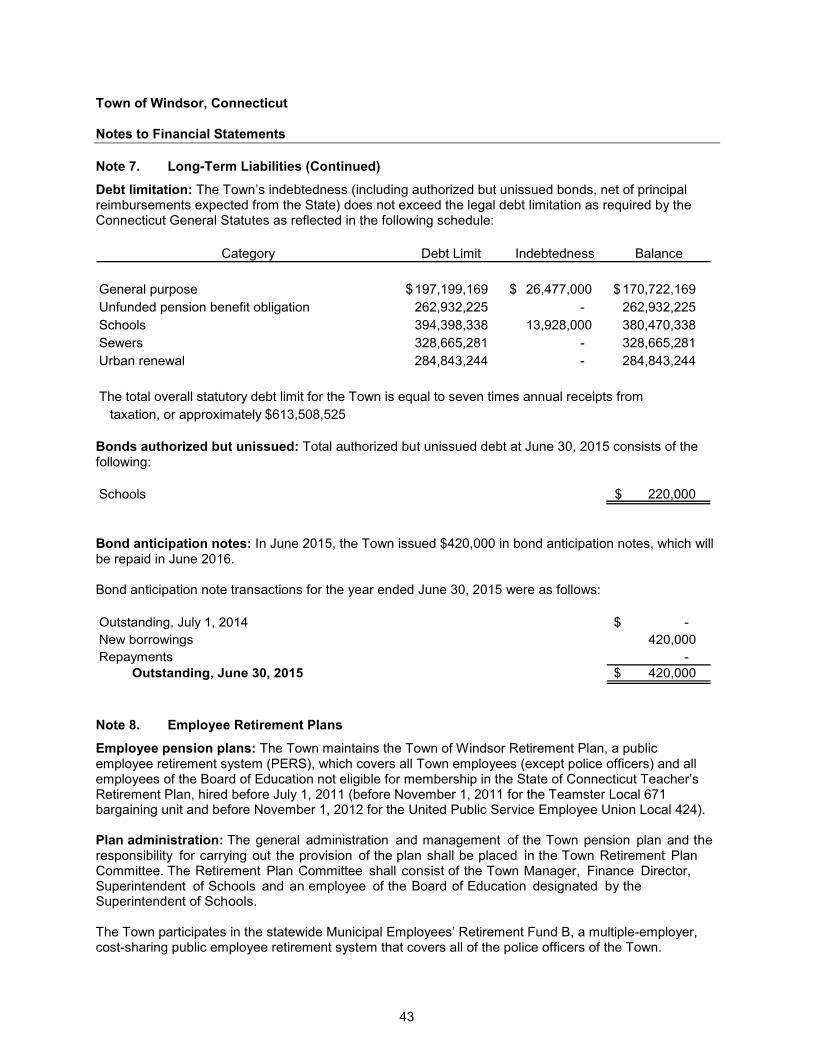
Town of Windsor, Connecticut Notes to Financial Statements
43
Note 7. Long-Term Liabilities (Continued)
Debt limitation: The Town’s indebtedness (including authorized but unissued bonds, net of principal reimbursements expected from the State) does not exceed the legal debt limitation as required by the Connecticut General Statutes as reflected in the following schedule:
Category Debt Limit Indebtedness Balance
General purpose 197,199,169 $ 26,477,000 $ 170,722,169 $ Unfunded pension benefit obligation 262,932,225 - 262,932,225 Schools 394,398,338 13,928,000 380,470,338 Sewers 328,665,281 - 328,665,281 Urban renewal 284,843,244 - 284,843,244
The total overall statutory debt limit for the Town is equal to seven times annual receipts from taxation, or approximately $613,508,525
Bonds authorized but unissued: Total authorized but unissued debt at June 30, 2015 consists of the following: Schools 220,000 $
Bond anticipation notes: In June 2015, the Town issued $420,000 in bond anticipation notes, which will be repaid in June 2016. Bond anticipation note transactions for the year ended June 30, 2015 were as follows: Outstanding, July 1, 2014 -$ New borrowings 420,000 Repayments -
Outstanding, June 30, 2015 420,000 $
Note 8. Employee Retirement Plans
Employee pension plans: The Town maintains the Town of Windsor Retirement Plan, a public employee retirement system (PERS), which covers all Town employees (except police officers) and all employees of the Board of Education not eligible for membership in the State of Connecticut Teacher’s Retirement Plan, hired before July 1, 2011 (before November 1, 2011 for the Teamster Local 671 bargaining unit and before November 1, 2012 for the United Public Service Employee Union Local 424). Plan administration: The general administration and management of the Town pension plan and the responsibility for carrying out the provision of the plan shall be placed in the Town Retirement Plan Committee. The Retirement Plan Committee shall consist of the Town Manager, Finance Director, Superintendent of Schools and an employee of the Board of Education designated by the Superintendent of Schools. The Town participates in the statewide Municipal Employees’ Retirement Fund B, a multiple-employer, cost-sharing public employee retirement system that covers all of the police officers of the Town.
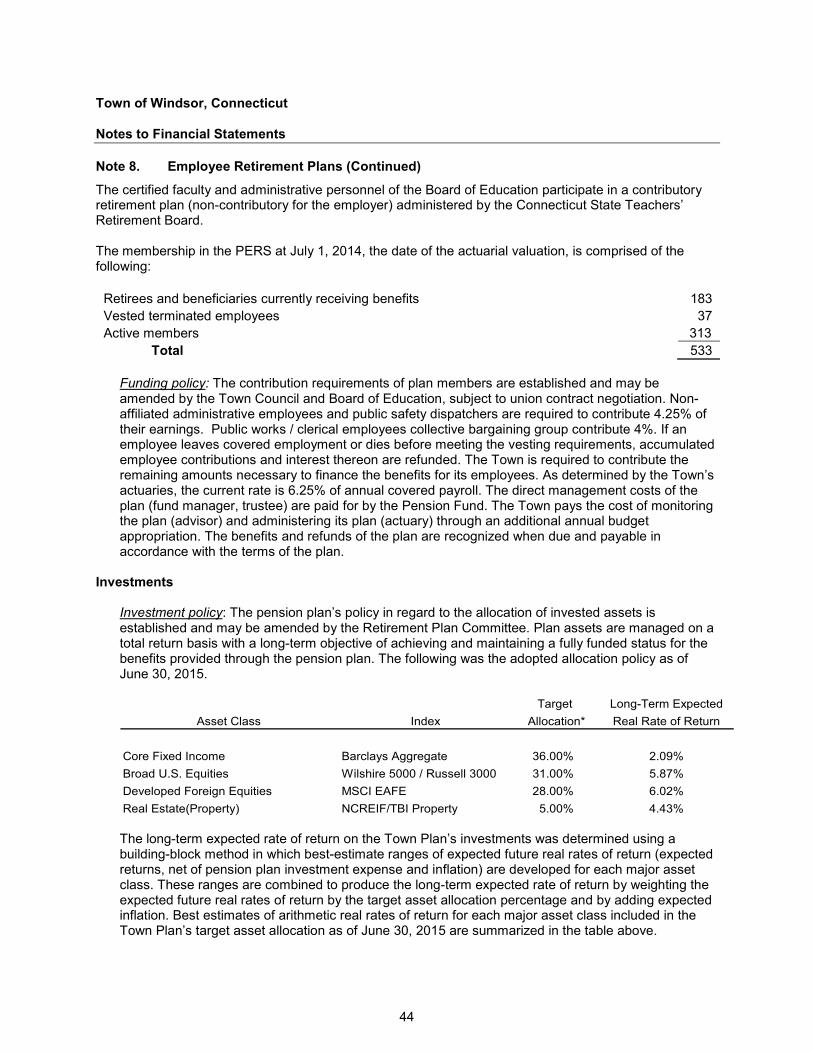
Town of Windsor, Connecticut Notes to Financial Statements
44
Note 8. Employee Retirement Plans (Continued)
The certified faculty and administrative personnel of the Board of Education participate in a contributory retirement plan (non-contributory for the employer) administered by the Connecticut State Teachers’ Retirement Board. The membership in the PERS at July 1, 2014, the date of the actuarial valuation, is comprised of the following:
Retirees and beneficiaries currently receiving benefits 183 Vested terminated employees 37 Active members 313
Total 533 Funding policy: The contribution requirements of plan members are established and may be amended by the Town Council and Board of Education, subject to union contract negotiation. Non-affiliated administrative employees and public safety dispatchers are required to contribute 4.25% of their earnings. Public works / clerical employees collective bargaining group contribute 4%. If an employee leaves covered employment or dies before meeting the vesting requirements, accumulated employee contributions and interest thereon are refunded. The Town is required to contribute the remaining amounts necessary to finance the benefits for its employees. As determined by the Town’s actuaries, the current rate is 6.25% of annual covered payroll. The direct management costs of the plan (fund manager, trustee) are paid for by the Pension Fund. The Town pays the cost of monitoring the plan (advisor) and administering its plan (actuary) through an additional annual budget appropriation. The benefits and refunds of the plan are recognized when due and payable in accordance with the terms of the plan.
Investments
Investment policy: The pension plan’s policy in regard to the allocation of invested assets is established and may be amended by the Retirement Plan Committee. Plan assets are managed on a total return basis with a long-term objective of achieving and maintaining a fully funded status for the benefits provided through the pension plan. The following was the adopted allocation policy as of June 30, 2015.
Target Long-Term ExpectedAsset Class Index Allocation* Real Rate of Return
Core Fixed Income Barclays Aggregate 36.00% 2.09%Broad U.S. Equities Wilshire 5000 / Russell 3000 31.00% 5.87%Developed Foreign Equities MSCI EAFE 28.00% 6.02%Real Estate(Property) NCREIF/TBI Property 5.00% 4.43% The long-term expected rate of return on the Town Plan’s investments was determined using a building-block method in which best-estimate ranges of expected future real rates of return (expected returns, net of pension plan investment expense and inflation) are developed for each major asset class. These ranges are combined to produce the long-term expected rate of return by weighting the expected future real rates of return by the target asset allocation percentage and by adding expected inflation. Best estimates of arithmetic real rates of return for each major asset class included in the Town Plan’s target asset allocation as of June 30, 2015 are summarized in the table above.
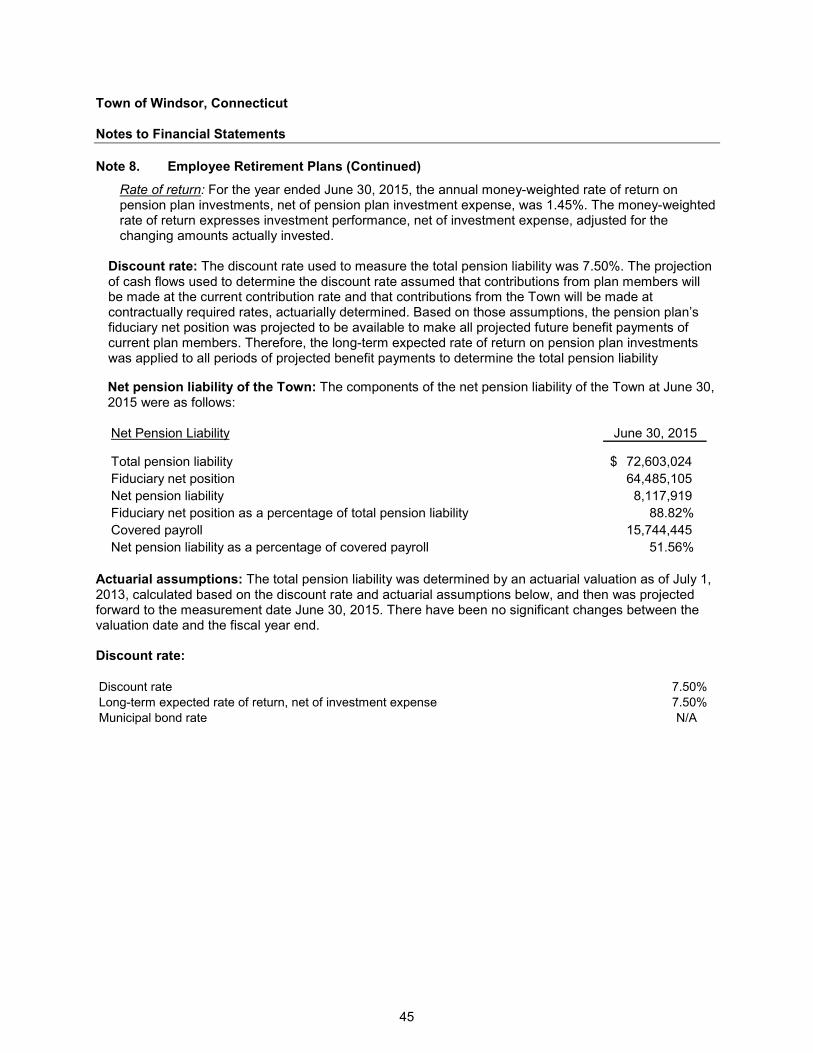
Town of Windsor, Connecticut Notes to Financial Statements
45
Note 8. Employee Retirement Plans (Continued)
Rate of return: For the year ended June 30, 2015, the annual money-weighted rate of return on pension plan investments, net of pension plan investment expense, was 1.45%. The money-weighted rate of return expresses investment performance, net of investment expense, adjusted for the changing amounts actually invested.
Discount rate: The discount rate used to measure the total pension liability was 7.50%. The projection of cash flows used to determine the discount rate assumed that contributions from plan members will be made at the current contribution rate and that contributions from the Town will be made at contractually required rates, actuarially determined. Based on those assumptions, the pension plan’s fiduciary net position was projected to be available to make all projected future benefit payments of current plan members. Therefore, the long-term expected rate of return on pension plan investments was applied to all periods of projected benefit payments to determine the total pension liability Net pension liability of the Town: The components of the net pension liability of the Town at June 30, 2015 were as follows: Net Pension Liability June 30, 2015
Total pension liability 72,603,024 $ Fiduciary net position 64,485,105 Net pension liability 8,117,919 Fiduciary net position as a percentage of total pension liability 88.82%Covered payroll 15,744,445 Net pension liability as a percentage of covered payroll 51.56%
Actuarial assumptions: The total pension liability was determined by an actuarial valuation as of July 1, 2013, calculated based on the discount rate and actuarial assumptions below, and then was projected forward to the measurement date June 30, 2015. There have been no significant changes between the valuation date and the fiscal year end. Discount rate: Discount rate 7.50%Long-term expected rate of return, net of investment expense 7.50%Municipal bond rate N/A
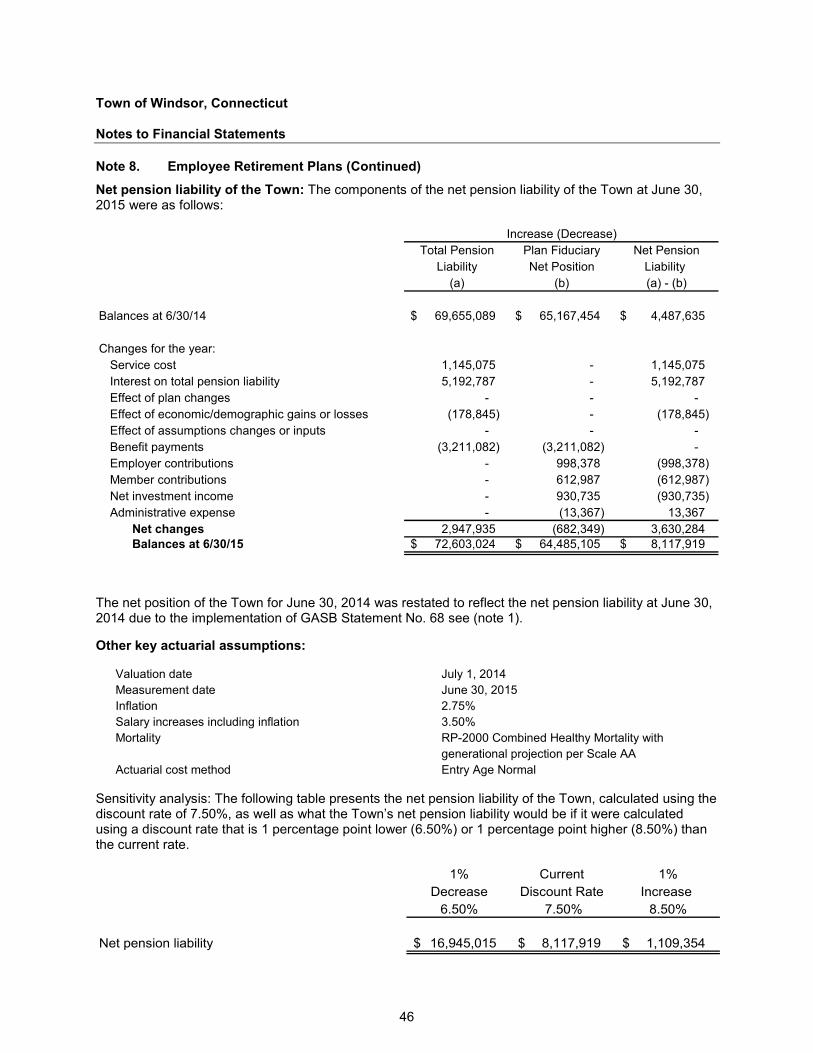
Town of Windsor, Connecticut Notes to Financial Statements
46
Note 8. Employee Retirement Plans (Continued)
Net pension liability of the Town: The components of the net pension liability of the Town at June 30, 2015 were as follows:
Total Pension Plan Fiduciary Net PensionLiability Net Position Liability
(a) (b) (a) - (b)
Balances at 6/30/14 69,655,089 $ 65,167,454 $ 4,487,635 $
Changes for the year:Service cost 1,145,075 - 1,145,075 Interest on total pension liability 5,192,787 - 5,192,787 Effect of plan changes - - - Effect of economic/demographic gains or losses (178,845) - (178,845) Effect of assumptions changes or inputs - - - Benefit payments (3,211,082) (3,211,082) - Employer contributions - 998,378 (998,378) Member contributions - 612,987 (612,987) Net investment income - 930,735 (930,735) Administrative expense - (13,367) 13,367
Net changes 2,947,935 (682,349) 3,630,284 Balances at 6/30/15 72,603,024 $ 64,485,105 $ 8,117,919 $
Increase (Decrease)
The net position of the Town for June 30, 2014 was restated to reflect the net pension liability at June 30, 2014 due to the implementation of GASB Statement No. 68 see (note 1). Other key actuarial assumptions:
Valuation date July 1, 2014 Measurement date June 30, 2015 Inflation 2.75% Salary increases including inflation 3.50% Mortality RP-2000 Combined Healthy Mortality with
generational projection per Scale AA Actuarial cost method Entry Age Normal
Sensitivity analysis: The following table presents the net pension liability of the Town, calculated using the discount rate of 7.50%, as well as what the Town’s net pension liability would be if it were calculated using a discount rate that is 1 percentage point lower (6.50%) or 1 percentage point higher (8.50%) than the current rate.
1% Current 1%Decrease Discount Rate Increase
6.50% 7.50% 8.50%
Net pension liability 16,945,015 $ 8,117,919 $ 1,109,354 $
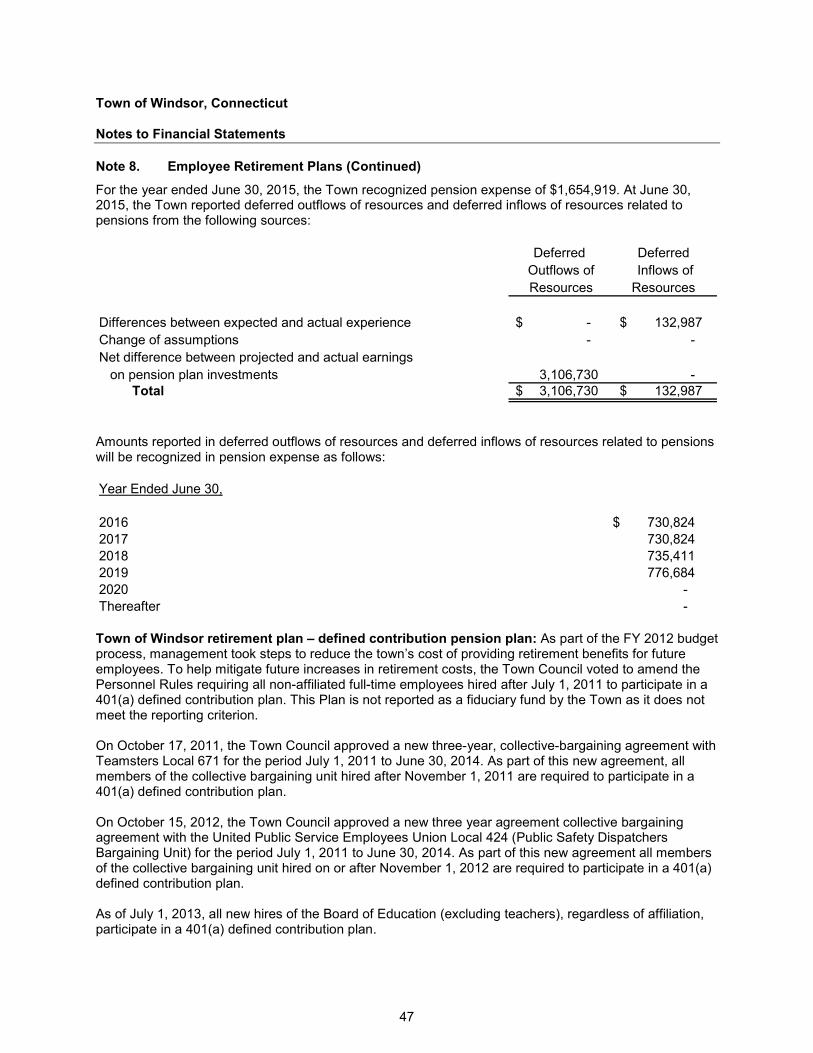
Town of Windsor, Connecticut Notes to Financial Statements
47
Note 8. Employee Retirement Plans (Continued)
For the year ended June 30, 2015, the Town recognized pension expense of $1,654,919. At June 30, 2015, the Town reported deferred outflows of resources and deferred inflows of resources related to pensions from the following sources:
Deferred Deferred Outflows of Inflows ofResources Resources
Differences between expected and actual experience -$ 132,987 $ Change of assumptions - - Net difference between projected and actual earnings
on pension plan investments 3,106,730 - Total 3,106,730 $ 132,987 $
Amounts reported in deferred outflows of resources and deferred inflows of resources related to pensions will be recognized in pension expense as follows: Year Ended June 30,
2016 730,824 $ 2017 730,824 2018 735,411 2019 776,684 2020 - Thereafter - Town of Windsor retirement plan – defined contribution pension plan: As part of the FY 2012 budget process, management took steps to reduce the town’s cost of providing retirement benefits for future employees. To help mitigate future increases in retirement costs, the Town Council voted to amend the Personnel Rules requiring all non-affiliated full-time employees hired after July 1, 2011 to participate in a 401(a) defined contribution plan. This Plan is not reported as a fiduciary fund by the Town as it does not meet the reporting criterion. On October 17, 2011, the Town Council approved a new three-year, collective-bargaining agreement with Teamsters Local 671 for the period July 1, 2011 to June 30, 2014. As part of this new agreement, all members of the collective bargaining unit hired after November 1, 2011 are required to participate in a 401(a) defined contribution plan. On October 15, 2012, the Town Council approved a new three year agreement collective bargaining agreement with the United Public Service Employees Union Local 424 (Public Safety Dispatchers Bargaining Unit) for the period July 1, 2011 to June 30, 2014. As part of this new agreement all members of the collective bargaining unit hired on or after November 1, 2012 are required to participate in a 401(a) defined contribution plan. As of July 1, 2013, all new hires of the Board of Education (excluding teachers), regardless of affiliation, participate in a 401(a) defined contribution plan.
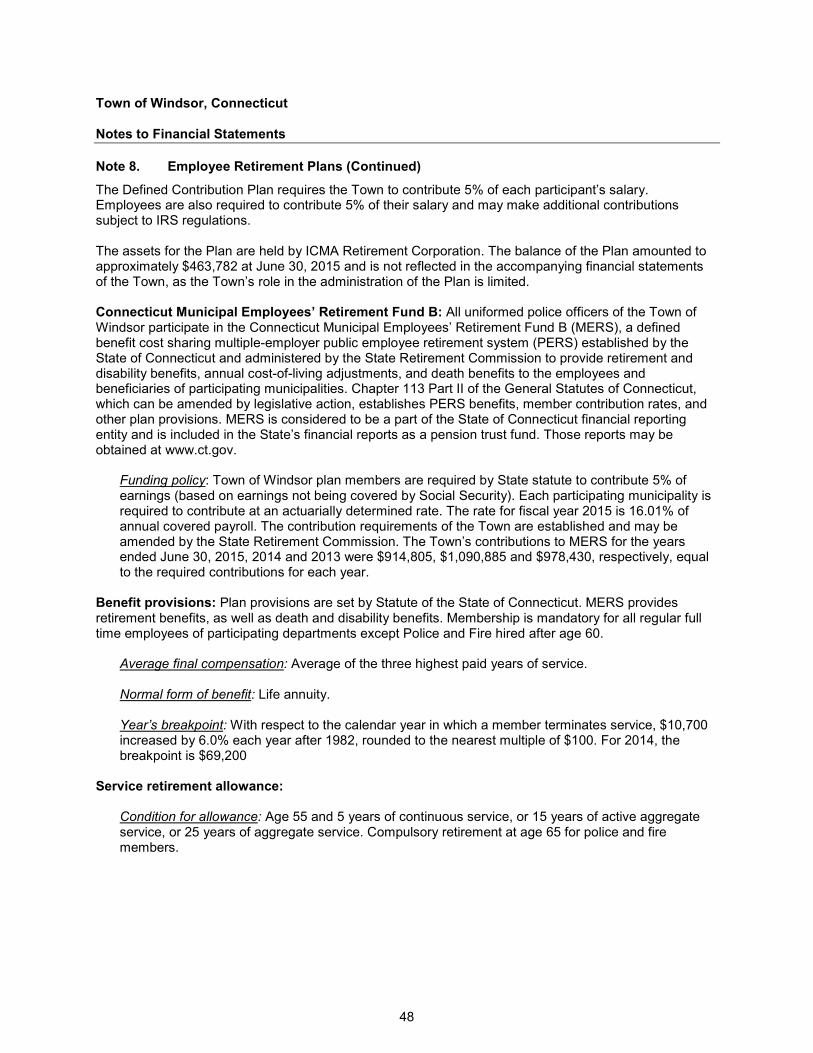
Town of Windsor, Connecticut Notes to Financial Statements
48
Note 8. Employee Retirement Plans (Continued)
The Defined Contribution Plan requires the Town to contribute 5% of each participant’s salary. Employees are also required to contribute 5% of their salary and may make additional contributions subject to IRS regulations. The assets for the Plan are held by ICMA Retirement Corporation. The balance of the Plan amounted to approximately $463,782 at June 30, 2015 and is not reflected in the accompanying financial statements of the Town, as the Town’s role in the administration of the Plan is limited. Connecticut Municipal Employees’ Retirement Fund B: All uniformed police officers of the Town of Windsor participate in the Connecticut Municipal Employees’ Retirement Fund B (MERS), a defined benefit cost sharing multiple-employer public employee retirement system (PERS) established by the State of Connecticut and administered by the State Retirement Commission to provide retirement and disability benefits, annual cost-of-living adjustments, and death benefits to the employees and beneficiaries of participating municipalities. Chapter 113 Part II of the General Statutes of Connecticut, which can be amended by legislative action, establishes PERS benefits, member contribution rates, and other plan provisions. MERS is considered to be a part of the State of Connecticut financial reporting entity and is included in the State’s financial reports as a pension trust fund. Those reports may be obtained at www.ct.gov.
Funding policy: Town of Windsor plan members are required by State statute to contribute 5% of earnings (based on earnings not being covered by Social Security). Each participating municipality is required to contribute at an actuarially determined rate. The rate for fiscal year 2015 is 16.01% of annual covered payroll. The contribution requirements of the Town are established and may be amended by the State Retirement Commission. The Town’s contributions to MERS for the years ended June 30, 2015, 2014 and 2013 were $914,805, $1,090,885 and $978,430, respectively, equal to the required contributions for each year.
Benefit provisions: Plan provisions are set by Statute of the State of Connecticut. MERS provides retirement benefits, as well as death and disability benefits. Membership is mandatory for all regular full time employees of participating departments except Police and Fire hired after age 60.
Average final compensation: Average of the three highest paid years of service. Normal form of benefit: Life annuity. Year’s breakpoint: With respect to the calendar year in which a member terminates service, $10,700 increased by 6.0% each year after 1982, rounded to the nearest multiple of $100. For 2014, the breakpoint is $69,200
Service retirement allowance:
Condition for allowance: Age 55 and 5 years of continuous service, or 15 years of active aggregate service, or 25 years of aggregate service. Compulsory retirement at age 65 for police and fire members.
Town of Windsor, Connecticut Notes to Financial Statements
49
Note 8. Employee Retirement Plans (Continued)
Amount of allowance: For members not covered by Social Security: 2% of average final compensation times years of service. For members covered by Social Security: 1-1/2% of the average final compensation not in excess of the year’s breakpoint plus 2% of average final compensation in excess of the year’s breakpoint, times years of service. The maximum benefit is 100% of average final compensation and the minimum benefit is $1,000 annually. Both the minimum and the maximum include Workers Compensation and Social Security benefits. If any member covered by social Security retires before age 62, his/her benefit until he/she reaches age 62 or receives a Social Security disability award is computed as if he/she were not under Social Security. Disability retirement allowance: Condition for allowance: 10 years of service and permanently and totally disabled from engaging in any gainful employment in the service of the municipality. Amount of allowance: Calculated as a service retirement allowance based on compensation and service to the date of the disability. Service connected disability: Condition for allowance: Totally and permanently disabled from engaging in any gainful employment in the service of the municipality provided such disability has arisen out of and in the course of his/her employment with the municipality. Disability due to hypertension or heart disease, in the case of firemen and policemen, is presumed to have been suffered in the line of duty. Amount of allowance: Calculated as a service retirement allowance based on compensation and service to the date of the disability with a minimum benefit (including Worker’s Compensation benefits) of 50% of compensation at the time of the disability. Vesting retirement allowance: Condition for allowance: 5 years of continuous or 15 years of active aggregate service. Amount of allowance: Calculated as a service retirement allowance on the basis of average final compensation and service to the date of termination. Deferred to normal retirement age, or an actuarially reduced allowance may begin at the time of separation. Death benefit: Condition for benefit: Eligible for service, disability retirement, or vested allowance, and married for at least 12 months preceding death. Amount of benefit: Computed on the basis of the member’s average final compensation and creditable service at date of death, payable to the spouse. Benefit is equal to 50% of the average of the life annuity allowance and the reduced 50% joint and survivor allowance. Return to deductions: Upon the withdrawal of a member, the amount of his accumulated deductions is payable to him/her on demand, with 5% interest from July 1, 1983.
Town of Windsor, Connecticut Notes to Financial Statements
50
Note 8. Employee Retirement Plans (Continued)
Optional benefits: Prior to the retirement, a member may elect to convert his retirement allowance into a benefit of equivalent actuarial value in accordance with one of the options forms described below: 1. A reduced retirement allowance payable during his life with the provision that after his death the beneficiary designed by him at the time of this retirement; or 2. A reduced retirement allowance payable during his life with the provision that after his death, an allowance of one-half of his reduced allowance will be continued for life to the beneficiary designated by him at the time of his retirement; 3. A reduced retirement allowance payable during his life with a guarantee of 120 or 240 monthly payments to the member or his designated beneficiary. Cost-of-living-adjustment: For those retired prior to January 1, 2002: (i) The benefits of disabled retirees, service retirees who have reached age 65, and beneficiaries of deceased retirees who would have reached age 65 are adjusted each July 1. The difference between the actual annual yield of the actuarial value of assets on a calendar year basis to a 6% yield is calculated. This difference is the adjustment applied the following July 1. The minimum adjustment is 3% and the maximum is 5%. (ii) The benefits for all others on the roll are adjusted on January 1, 2002 and on each subsequent July 1. The amount of each adjustment is 2.5%. For those retiring in or after January 1, 2002, benefits are adjusted each July 1. The adjustment is 60% of the annual increase in the CPI up to 6%. The minimum annual COLA is 2.5%; the maximum is 6%.
Assumptions: The total pension liability was determined using the following actuarial assumptions applied to all periods included in the measurement: Valuation date 7/1/2014 Actuarial cost method Entry age normal Amortization method Level dollar, closed Remaining amortization period 27 years Asset valuation method 5-year smoothed market with 20% recognition of
investment gains and losses Investment rate return* 8.00%, net of investment related expense Projected salary increases* 4.25-11.00% Social Security wage base * includes inflation at 3.25%
3.50%
Mortality The RP2000 Mortality Table for Annuitants and
Non-Annuitants (set forward one year for males and set back one year for females).
Town of Windsor, Connecticut Notes to Financial Statements
51
Note 8. Employee Retirement Plans (Continued)
The long-term expected rate of return: the long-term expected rate of return on pension plan investments was determined using a lognormal distribution analysis in which best-estimate ranges of expected future real rates of return (expected returns, net of pension plan investment expense and inflation) are developed for each major asset class. These ranges are combined to produce the long-term expected rate of return by weighting the expected future real rates of return by the target asset allocation percentage and by adding expected inflation. The target asset allocation and most recent best estimates of arithmetic real rates of return for each major asset class are to be provided by the Fiduciary of the Plan.
Long-TermTarget Expected Rate
Asset Class Allocation of Return
Mutual Equity Fund 16.00% 5.80%Developed Market International Stock Fund 14.00% 6.60%Emerging Market International Stock Fund 7.00% 8.30%Core Fixed Income Fund 8.00% 1.30%Inflation Linked Bond Fund 5.00% 1.00%Emerging Market Debt Fund 8.00% 3.70%High Yield Bond Fund 14.00% 3.90%Real Estate Fund 7.00% 5.10%Private Equity 10.00% 7.60%Alternative Investments 8.00% 4.10%Liquidity Fund 3.00% 0.40%
100.00%
Discount rate: the discount rate used to measure the total pension liability was 8.00 percent. The projection of cash flows used to determine the discount rate assumed that plan member contributions will be made at the current contribution rate and that employer contributions will be made at the actuarially determined rates in future years. Based on those assumptions, the pension plan's fiduciary net position was projected to be available to make all projected future benefit payments of current plan members. Therefore, the long-term expected rate of return on pension plan investments was applied to all periods of projected benefit payments to determine the total pension liability.
Town of Windsor, Connecticut Notes to Financial Statements
52
Note 8. Employee Retirement Plans (Continued)
Sensitivity of the net pension liability to changes in the discount rate: The following presents the net pension liability of the System, calculated using the discount rate of 8.00 percent, as well as what the System’s net pension liability would be if it were calculated using a discount rate that is 1-percentage-point lower (7.00 percent) or 1-percentage-point higher (9.00 percent) than the current rate ($ thousands):
1% Current 1%Decrease Discount Rate Increase
7.0% 8.0% 9.0%Town's proportionate share of net
pension liability (asset) 5,126,415 $ 1,552,541 $ (1,413,225) $
Pension liabilities, pension expense, and deferred outflows of resources and deferred inflows of resources: At June 30, 2015, the Town reported a liability of $1,552,541 for its proportionate share of the net pension liability related to its participation in MERS. The net pension liability was measured as of June 30, 2014 and the total pension liability used to calculate the net pension liability was determined by an actuarial valuation as of that date. The Town’s proportion of the net pension liability was based on its share of contributions to the MERS for fiscal year 2014 relative to the total contributions of all participating employers for that fiscal year. At June 30, 2014, the Town’s proportion was 0.7%. For the year ended June 30, 2015, the Town recognized pension expense of $838,246. At June 30, 2015, the Town reported deferred outflows of resources and deferred inflows of resources related to pensions from the following sources: $728,515 reported as deferred outflows of resources related to pensions resulting from the Town’s contributions in fiscal year 2015 subsequent to the measurement date will be recognized as a reduction of the net pension liability for the year ended June 30, 2016. Other amounts reported as deferred outflows of resources and deferred inflows of resources related to pensions will be recognized in pension expense as follows:
Deferred Outflows Deferred Inflowsof Resources of Resources
Contributions subsequent to measurement date 914,805 $ -$ Differences between expected and actual experience - 728,515 Changes of assumptions - - Net difference between projected and actual earnings
on pension plan investments - - Total 914,805 $ 728,515 $
Town of Windsor, Connecticut Notes to Financial Statements
53
Note 8. Employee Retirement Plans (Continued)
Amounts reported in deferred outflows of resources and deferred inflows of resources related to pensions will be recognized in pension expense as follows: Year Ended June 30,
2016 732,676 $ 2017 (182,129) 2018 (182,129) 2019 (182,128) 2020 - Thereafter - Connecticut state teachers’ retirement system: All certified personnel participate in the State of Connecticut Teachers’ Retirement System under Section 10.183 of the General Statutes of the State of Connecticut. A teacher is eligible to receive a normal retirement benefit if he or she has 1) attained age 60 and has accumulated 20 years of credited service in the public schools of Connecticut, or 2) attained any age and has accumulated 35 years of credited service, at least 25 years of which are serviced in the public schools of Connecticut. Description of system: Teachers within the Town’s school system participate in a retirement system administered by the Connecticut State Teachers’ Retirement Board. This Connecticut State Teachers’ Retirement System (the System) is a cost sharing multiple employer defined benefit pension system with a special funding situation. The System is considered a part of the State of Connecticut financial reporting entity and is included in the State’s financial reports as a pension trust fund. Those reports may be obtained at www.ct. gov. The System is administered under the provisions of Chapter 167a of the Connecticut General Statutes (CGS). Participation in the System is restricted to certified staff employed in the public schools of Connecticut and members of the professional staff of the State Department of Education or the board of Governors of Higher Education and their constituent units. Participation in the System is mandatory for certified personnel of local boards of education who are employed for an average of at least one-half of a school day. Members of the professional staff of the State Department of Education or the Board of Governors of Higher Education and their constituent units may elect to participate in this system, the State Employees’ Retirement System, or the Alternate Retirement System (TIAA-CREF). Summary of Significant Accounting Policies: For purposes of measuring the liability, deferred outflows of resources and deferred inflows of resources, and expense associated with the State’s requirement to contribute to the System, information about System’s fiduciary net position and additions to/deductions from the System’s fiduciary net position have been determined on the same basis as they are reported by the System. For this purpose, benefit payments (including refunds of contributions) are recognized when due and payable in accordance with the benefit terms. Investments are reported at fair value. The Town has recorded, in the General Fund, intergovernmental revenue and education expenditures in the amount of $7,074,834 as payments made by the State of Connecticut on-behalf of the Town. The Town does not have any liability for teacher pensions.
Town of Windsor, Connecticut Notes to Financial Statements
54
Note 8. Employee Retirement Plans (Continued)
Benefits provided: The benefits provided to participants by the System are as follows:
Normal benefit: A member at age 60 with 20 years of credited service in Connecticut, or 35 years of credited service including at least 25 years of service in Connecticut is eligible for vested benefits of 2% of average annual salary times years of credited service (maximum benefit is 75% of average annual salary). Prorated benefit: A member who completes 10 years of Connecticut public school service is eligible for a vested benefit commencing at age 60. The benefit is 2% less 0.1% for each year less than 20 years of average annual salary times years of credited service. Minimum benefit: Effective January 1, 1999, Public Act 98-251 provides a minimum monthly retirement benefit of $1,200 to teachers who retire under the Normal Benefit provisions and who have completed at least 25 years of full time Connecticut service at retirement.
Contribution requirements: The pension contributions made by the State to the System are determined on an actuarial reserve basis as described in CGS Sections 10-1831 and 10-183z. Participants are required to contribute 6.0% of their annual salary rate to the System as required by CGS Section 10-183b (7). For the 2014/2015 school year, $2,119,004 mandatory contributions were deducted from the salaries of eligible employees who were participants of the System during that school year. The estimated covered payroll for the town is $29,228,000. The Town has no obligation to contribute to the plan; as such, a schedule of contributions is not presented. Actuarial assumptions: The actuarial assumptions used in the June 30, 2014 valuation were based on the results of an actuarial experience study for the period July 1, 2005 – Jun 30, 2010. The total pension liability was determined by an actuarial valuation as of June 30, 2014, using the following key actuarial assumptions: Inflation 3.00% Salary increases, including inflation 3.75-7.00 percent Long-term investment rate of return, net of pension investment expense, including inflation 8.50 percent
Mortality rates were based on the RP-2000 Combined Mortality Table RP 2000 projected 19 years using scale AA, with a two-year setback for males and females for the period after service retirement and for dependent beneficiaries.
Town of Windsor, Connecticut Notes to Financial Statements
55
Note 8. Employee Retirement Plans (Continued)
The long-term expected rate of return on pension investments was determined using a log-normal distribution analysis in which best-estimate ranges of expected future real rates of return (expected returns, net of pension investment expense and inflation) are developed for each major asset class. These ranges are combined to produce the long-term expected rate of return by weighting the expected future real rates of return by the target asset allocation percentage and by adding expected inflation. The target asset allocation and best estimates of arithmetic real rates of return for each major asset class are summarized in the following table:
Long-Term Expected Rate
Asset Class Target Allocation of Return
Large Cap U.S. Equities 21% 7.3%Developed Non-U.S. Equities 18% 7.5%Emerging Markets (Non-U.S.) 9% 8.6%Core Fixed Income Fund 7% 1.7%Inflation Linked Bond Fund 3% 1.3%Emerging Market Debt Fund 5% 4.8%High Yield Bond Fund 5% 3.7%Real Estate Fund 7% 5.9%Private Equity 11% 10.9%Alternative Investments 8% 0.7%Liquidity Fund 6% 0.4%
100%
Discount rate: The discount rate used to measure the total pension liability was 8.50 percent. The projection of cash flows used to determine the discount rate assumed that member contributions will be made at the current contribution rate and that State contributions will be made at the actuarially determined rates in future years. Based on those assumptions, the pension’s fiduciary net position was projected to be available to make all projected future benefit payments of current members. Therefore, the long-term expected rate of return on pension investments was applied to all periods of projected benefit payments to determine the total pension liability. Sensitivity of the proportionate share of the net pension liability to changes in the discount rate: The following presents the State’s proportionate share of the net pension liability associated with the Town, calculated using the discount rate of 8.50 percent, as well as what the net pension liability would be if it were calculated using a discount rate that is 1-percentage-point lower (7.50 percent) or 1-percentage-point higher (9.50 percent) than the current rate.
1% Current 1%Decrease Discount Rate Increase
7.50% 8.50% 9.50%State's share of net pension liability
associated with the Town 96,529,392 $ 75,641,625 $ 57,886,404 $
Town of Windsor, Connecticut Notes to Financial Statements
56
Note 8. Employee Retirement Plans (Continued)
Pension liabilities, pension expense, and deferred inflows/outflows of resources: The State makes all contributions to the System on behalf of employees of the participating districts. Therefore, participating employers are considered to be in a special funding situation as defined by Governmental Accounting Standards Board No. 68 and the State is treated as a non-employer contributing entity in the System. Since the districts do not contribute directly to the System, there is no net pension liability or deferred inflows or outflows to report in the financial statements of the Town. The portion of the net pension liability that was associated with the Town was $75,641,625 and 100% of the collective net pension liability is allocated to the State. The Town has no proportionate share of net pension liability. June 30, 2014 is the actuarial valuation date upon which the total pension liability is based. There were no changes in assumptions or benefits that affected the measurement of the total pension liability since the prior measurement date. The Town recognized the total pension expense associated with the Town as well as revenue in an amount equal to the non-employer contributing entities’ total proportionate share of the collective pension expense associated with the Town. For the fiscal year ended June 30, 2015, the Town recognized $5,675,284 as the amount expended by the State on behalf of the Town to meet the State’s funding requirements.
Note 9. Other Post-Employment Benefits
In addition to providing pension benefits, the Town instituted a policy providing 50% to 75% of certain health care benefits for retired employees. Substantially all of the Town's employees may become eligible for those benefits, if they retire under a normal retirement or with disability. Post-retirement benefits: From an accrual accounting perspective, the cost of postemployment healthcare benefits, like the cost of pension benefits, generally should be associated with the periods in which the cost occurs, rather than in the future year when it will be paid. In adopting the requirements of GASB Statement No. 45 during the year ended June 30, 2009, the Town recognizes the cost of postemployment healthcare in the year when the employee services are received, disclosed the accumulated liability from prior years, and provides information useful in assessing potential demands on the Town’s future cash flows. Recognition of the liability accumulated from prior years will be phased in over 30 years, commencing with the 2009 liability. Plan description: The Town provides post-employment benefits for certain employees for current and future health and life insurance benefit expenses through a single-employer defined benefit plan. A bi-annual actuarial valuation is made to determine whether the contributions are sufficient to meet the plan obligations. The latest actuarial valuation was made July 1, 2013. The post-retirement plan does not issue stand-alone financial reports. The contribution requirements of plan members and the Town are established and may be amended by the Town. Membership in the plan consisted of the following at July 1, 2013, the date of the last actuarial valuation.
Retirees and beneficiaries receiving benefits 252 Active plan members 677
Total 929
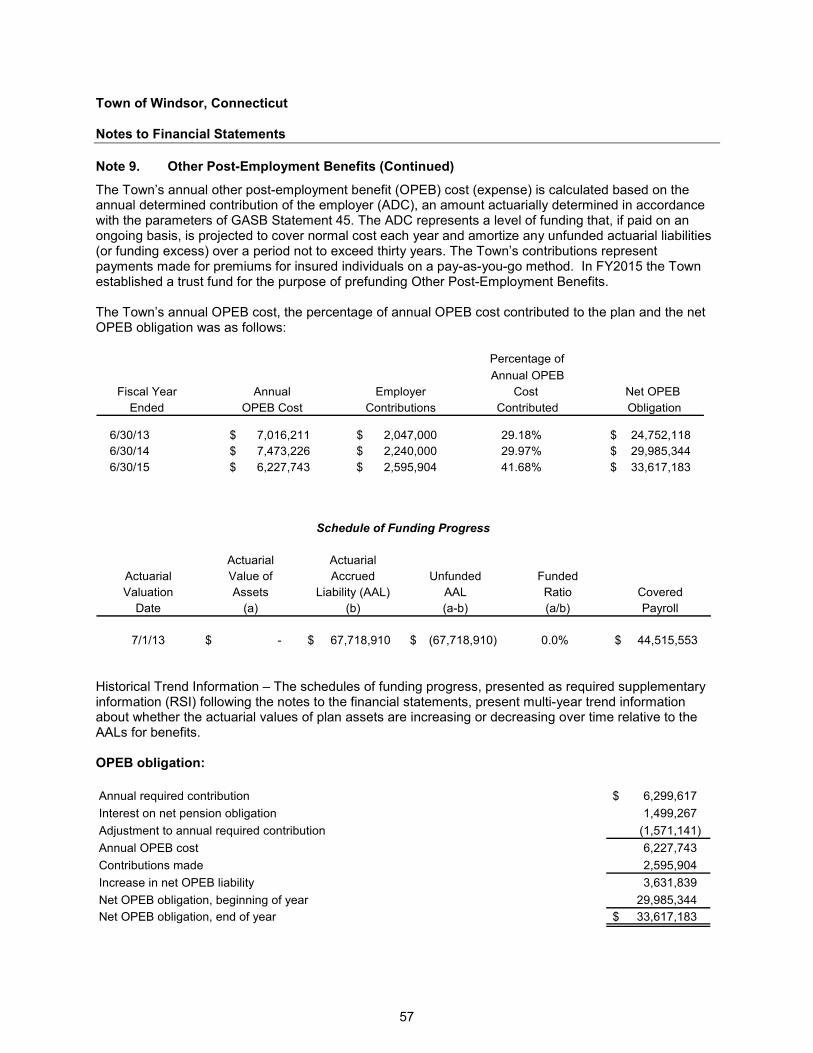
Town of Windsor, Connecticut Notes to Financial Statements
57
Note 9. Other Post-Employment Benefits (Continued)
The Town’s annual other post-employment benefit (OPEB) cost (expense) is calculated based on the annual determined contribution of the employer (ADC), an amount actuarially determined in accordance with the parameters of GASB Statement 45. The ADC represents a level of funding that, if paid on an ongoing basis, is projected to cover normal cost each year and amortize any unfunded actuarial liabilities (or funding excess) over a period not to exceed thirty years. The Town’s contributions represent payments made for premiums for insured individuals on a pay-as-you-go method. In FY2015 the Town established a trust fund for the purpose of prefunding Other Post-Employment Benefits. The Town’s annual OPEB cost, the percentage of annual OPEB cost contributed to the plan and the net OPEB obligation was as follows:
Percentage of Annual OPEB
Fiscal Year Annual Employer Cost Net OPEB Ended OPEB Cost Contributions Contributed Obligation
6/30/13 7,016,211 $ 2,047,000 $ 29.18% 24,752,118 $ 6/30/14 7,473,226 $ 2,240,000 $ 29.97% 29,985,344 $ 6/30/15 6,227,743 $ 2,595,904 $ 41.68% 33,617,183 $
Actuarial ActuarialActuarial Value of Accrued Unfunded FundedValuation Assets Liability (AAL) AAL Ratio Covered
Date (a) (b) (a-b) (a/b) Payroll
7/1/13 -$ 67,718,910 $ (67,718,910) $ 0.0% 44,515,553 $
Schedule of Funding Progress
Historical Trend Information – The schedules of funding progress, presented as required supplementary information (RSI) following the notes to the financial statements, present multi-year trend information about whether the actuarial values of plan assets are increasing or decreasing over time relative to the AALs for benefits. OPEB obligation: Annual required contribution 6,299,617 $ Interest on net pension obligation 1,499,267 Adjustment to annual required contribution (1,571,141) Annual OPEB cost 6,227,743 Contributions made 2,595,904 Increase in net OPEB liability 3,631,839 Net OPEB obligation, beginning of year 29,985,344 Net OPEB obligation, end of year 33,617,183 $
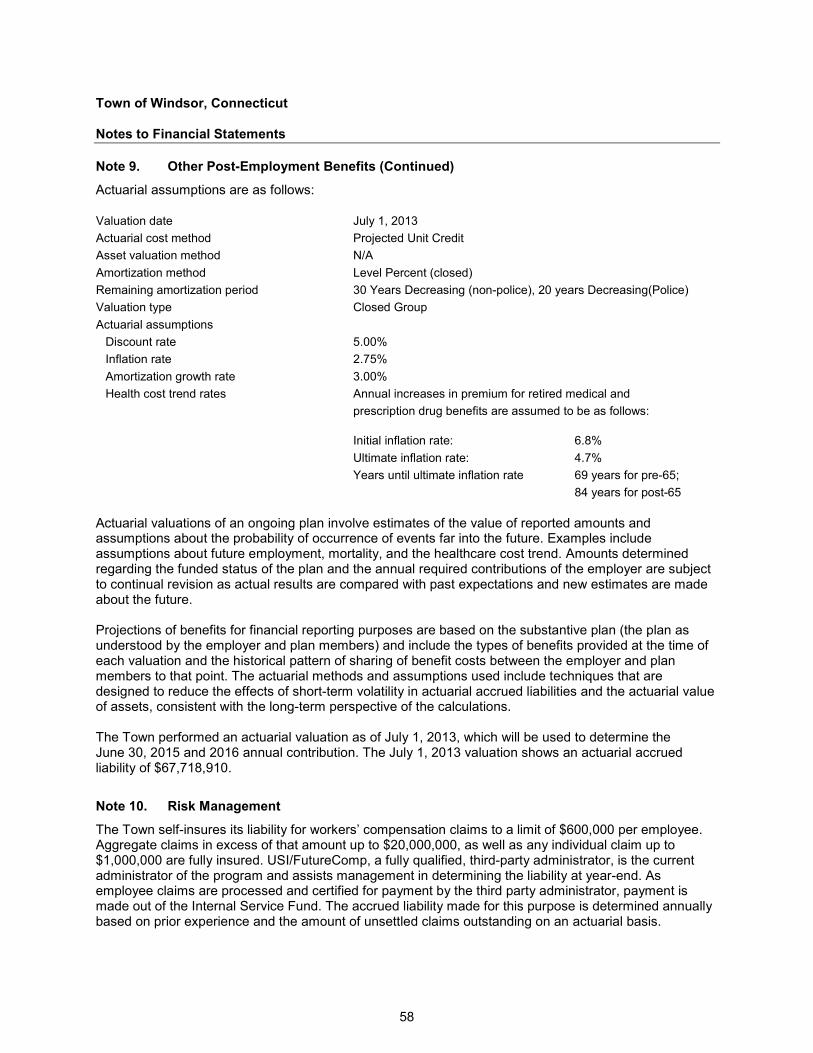
Town of Windsor, Connecticut Notes to Financial Statements
58
Note 9. Other Post-Employment Benefits (Continued)
Actuarial assumptions are as follows: Valuation date July 1, 2013 Actuarial cost method Projected Unit Credit Asset valuation method N/A Amortization method Level Percent (closed) Remaining amortization period 30 Years Decreasing (non-police), 20 years Decreasing(Police) Valuation type Closed Group Actuarial assumptions
Discount rate 5.00% Inflation rate 2.75% Amortization growth rate 3.00% Health cost trend rates Annual increases in premium for retired medical and
prescription drug benefits are assumed to be as follows: Initial inflation rate: 6.8% Ultimate inflation rate: 4.7% Years until ultimate inflation rate 69 years for pre-65;
84 years for post-65 Actuarial valuations of an ongoing plan involve estimates of the value of reported amounts and assumptions about the probability of occurrence of events far into the future. Examples include assumptions about future employment, mortality, and the healthcare cost trend. Amounts determined regarding the funded status of the plan and the annual required contributions of the employer are subject to continual revision as actual results are compared with past expectations and new estimates are made about the future. Projections of benefits for financial reporting purposes are based on the substantive plan (the plan as understood by the employer and plan members) and include the types of benefits provided at the time of each valuation and the historical pattern of sharing of benefit costs between the employer and plan members to that point. The actuarial methods and assumptions used include techniques that are designed to reduce the effects of short-term volatility in actuarial accrued liabilities and the actuarial value of assets, consistent with the long-term perspective of the calculations. The Town performed an actuarial valuation as of July 1, 2013, which will be used to determine the June 30, 2015 and 2016 annual contribution. The July 1, 2013 valuation shows an actuarial accrued liability of $67,718,910.
Note 10. Risk Management
The Town self-insures its liability for workers’ compensation claims to a limit of $600,000 per employee. Aggregate claims in excess of that amount up to $20,000,000, as well as any individual claim up to $1,000,000 are fully insured. USI/FutureComp, a fully qualified, third-party administrator, is the current administrator of the program and assists management in determining the liability at year-end. As employee claims are processed and certified for payment by the third party administrator, payment is made out of the Internal Service Fund. The accrued liability made for this purpose is determined annually based on prior experience and the amount of unsettled claims outstanding on an actuarial basis.
Town of Windsor, Connecticut Notes to Financial Statements
59
Note 10. Risk Management (Continued)
Premiums are paid into the Internal Service Fund by all other funds and are available to pay claims, claim reserves and administrative costs of the program. Employee health/medical claims are self-funded through Anthem Blue Cross/Blue Shield of Connecticut and CIGNA Corporation. Funds are transferred into the Insurance Internal Service Fund from other funds and are available to pay the health/medical premium costs. The Town is self-insured for health benefits. Claim activity and service fees are accounted for in a self-insurance reserve fund. The Town has Individual Stop Loss (ISL) coverage that limits the Town’s liability to $150,000 annually. On an aggregate basis, the Town’s liability is limited to 125% of expected claims ($2,599,232). Claims exceeding the Town’s maximum liability are fully insured through stop loss coverage (Aggregate and ISL). Anthem, the provider, administers the payment of claims and calculates and provides the accrued liability at year-end based on prior claims experience and the amount of unsettled claims outstanding on an actuarial basis. Arthur J. Gallagher & Co., the Town’s consultant, analyzes claims and advises the Town on all health insurance related issues. Conservatively, through the budget process and available reserves, the Town will project to have at a minimum, the Town’s maximum liability available to process expected claims. The BOE records its liability for health benefits in a self-insurance reserve fund and accounts for claim activity and service fees on a self-insured basis. The BOE has Individual Stop Loss (ISL) coverage that limits the BOE’s liability to $150,000 annually. On an aggregate basis, the BOE’s liability is limited to 110% of expected claims ($10,849,874). Claims exceeding the BOE’s maximum liability are fully insured through stop loss coverage (Aggregate and ISL). Anthem, the provider, administers the payment of claims. Lockton Companies, the BOE’s consultant, analyzes claims and advises the BOE on all health insurance related issues as well as calculating and providing the accrued liability at year-end based on prior claims experience and the amount of unsettled claims outstanding on an actuarial basis. Conservatively, through the budget process and available reserves, the BOE will project to have at a minimum, the BOE’s maximum liability available to process expected claims.
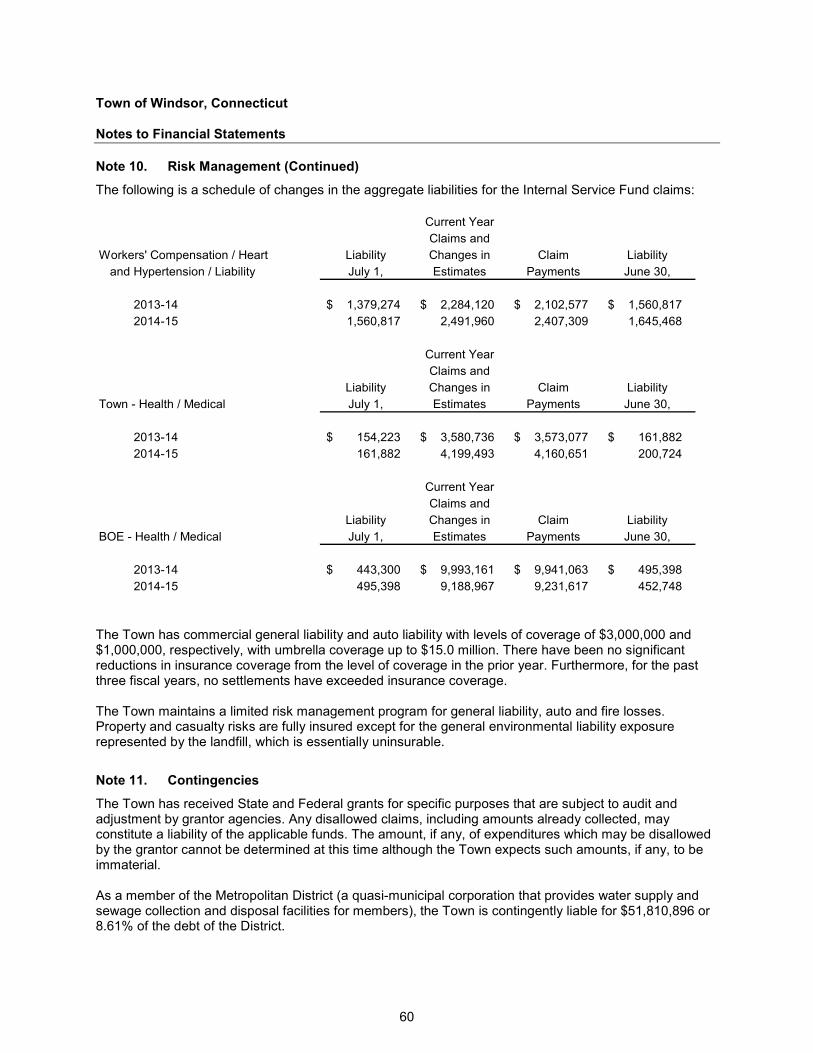
Town of Windsor, Connecticut Notes to Financial Statements
60
Note 10. Risk Management (Continued)
The following is a schedule of changes in the aggregate liabilities for the Internal Service Fund claims:
Current Year Claims and
Workers' Compensation / Heart Liability Changes in Claim Liability and Hypertension / Liability July 1, Estimates Payments June 30,
2013-14 1,379,274 $ 2,284,120 $ 2,102,577 $ 1,560,817 $ 2014-15 1,560,817 2,491,960 2,407,309 1,645,468
Current Year Claims and
Liability Changes in Claim Liability Town - Health / Medical July 1, Estimates Payments June 30,
2013-14 154,223 $ 3,580,736 $ 3,573,077 $ 161,882 $ 2014-15 161,882 4,199,493 4,160,651 200,724
Current Year Claims and
Liability Changes in Claim Liability BOE - Health / Medical July 1, Estimates Payments June 30,
2013-14 443,300 $ 9,993,161 $ 9,941,063 $ 495,398 $ 2014-15 495,398 9,188,967 9,231,617 452,748
The Town has commercial general liability and auto liability with levels of coverage of $3,000,000 and $1,000,000, respectively, with umbrella coverage up to $15.0 million. There have been no significant reductions in insurance coverage from the level of coverage in the prior year. Furthermore, for the past three fiscal years, no settlements have exceeded insurance coverage. The Town maintains a limited risk management program for general liability, auto and fire losses. Property and casualty risks are fully insured except for the general environmental liability exposure represented by the landfill, which is essentially uninsurable.
Note 11. Contingencies
The Town has received State and Federal grants for specific purposes that are subject to audit and adjustment by grantor agencies. Any disallowed claims, including amounts already collected, may constitute a liability of the applicable funds. The amount, if any, of expenditures which may be disallowed by the grantor cannot be determined at this time although the Town expects such amounts, if any, to be immaterial. As a member of the Metropolitan District (a quasi-municipal corporation that provides water supply and sewage collection and disposal facilities for members), the Town is contingently liable for $51,810,896 or 8.61% of the debt of the District.
Town of Windsor, Connecticut Notes to Financial Statements
61
Note 11. Contingencies (Continued)
Lawsuits: Various litigations, principally involving claims for personal injury and contested tax assessment, are pending against the Town. The outcome and eventual liability of the Town, if any, in these cases are not known at this time. The Town's management does not believe any potential claims against the Town would have a material adverse effect on the financial position of the Town.
Note 12. Landfill Closure and Post-closure Care Costs
State and federal laws and regulations require the Town to place a final cover on its 65 acre landfill site when it stops accepting waste and to perform certain maintenance and monitoring functions at the site for at least thirty years after closure. Under these regulations, the landfill has established a horizontal footprint of 55 acres which is now the basis of maximum horizontal expansion without providing a liner system. The results of a July 2014 capacity analysis show that the landfill has reached its overall capacity as of June 30, 2014. The landfill has stopped accepting commercial waste on July 1, 2014, and has converted to a transfer facility for residents. The $37,170,000 reported as landfill closure and post-closure care liability at June 30, 2015, is $10,000 more than the liability reported on June 30, 2014. This increase, or adjustment in estimated closure costs accrued to date, directly decreases the operating income for the Landfill Enterprise Fund in fiscal year 2015. These amounts are based on what it would cost to perform all closure and post-closure care at 2015 prices with a third party performing all closure work. Actual costs may also change based on inflation, compliance with the State of Connecticut stewardship permit, changes in technology, changes in the regulations, or if some or most of the work is performed by staff. The engineering analysis assumes that numerous engineering and construction procedures will be required. The landfill serves the Towns of Bloomfield and Windsor. An agreement (dated November 19, 1993) exists between the two communities. This agreement establishes the terms and conditions of operating the landfill. For closure costs, the agreement states: “the two towns shall contribute equally, on an annual basis, for said purposes and shall be equally responsible for closure, post-closure, and monitoring expenses until all Federal and State requirements are met.” The Town of Windsor is responsible for the funding, accounting and financial reporting for the landfill on behalf of both towns. The post closure cost will be covered by the landfill’s funds. If those funds run out, and only if they do, then the Town of Windsor and the Town of Bloomfield will split the costs. It is anticipated that no additional amount will be required from the Towns for closure of the landfill. The landfill is currently operating under the State of Connecticut stewardship permit issued by the Department of Energy and Environmental Protection (DEEP) that addresses the requirements of the regulations, including the control and monitoring of leachate and landfill generated gases.
Note 13. Fund Deficit
The following fund had a net fund deficit as of June 30, 2015: Landfill Fund $8,286,274
The fund deficit will be funded using the Landfill Fund cash and investments and if needed by the General Fund once the Landfill Fund cash and investments are exhausted.
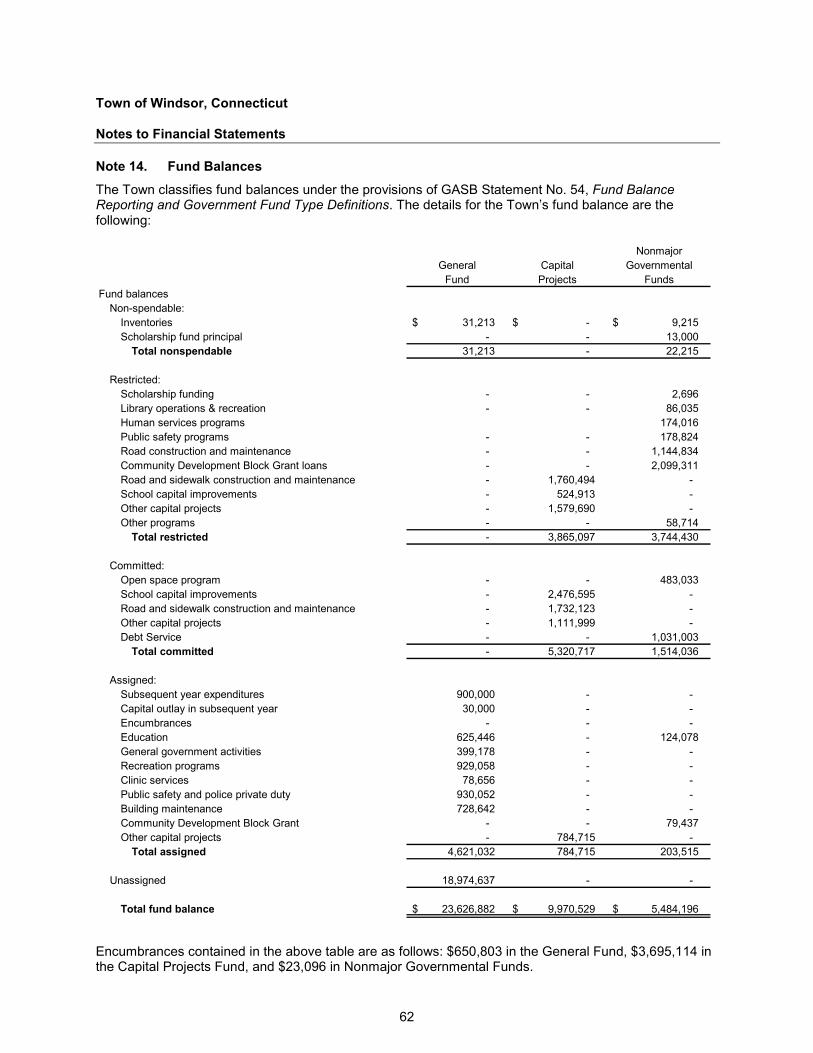
Town of Windsor, Connecticut Notes to Financial Statements
62
Note 14. Fund Balances
The Town classifies fund balances under the provisions of GASB Statement No. 54, Fund Balance Reporting and Government Fund Type Definitions. The details for the Town’s fund balance are the following:
NonmajorGeneral Capital Governmental
Fund Projects FundsFund balances
Non-spendable:Inventories 31,213 $ -$ 9,215 $ Scholarship fund principal - - 13,000
Total nonspendable 31,213 - 22,215
Restricted:Scholarship funding - - 2,696 Library operations & recreation - - 86,035 Human services programs 174,016 Public safety programs - - 178,824 Road construction and maintenance - - 1,144,834 Community Development Block Grant loans - - 2,099,311 Road and sidewalk construction and maintenance - 1,760,494 - School capital improvements - 524,913 - Other capital projects - 1,579,690 - Other programs - - 58,714
Total restricted - 3,865,097 3,744,430
Committed:Open space program - - 483,033 School capital improvements - 2,476,595 - Road and sidewalk construction and maintenance - 1,732,123 - Other capital projects - 1,111,999 - Debt Service - - 1,031,003
Total committed - 5,320,717 1,514,036
Assigned:Subsequent year expenditures 900,000 - - Capital outlay in subsequent year 30,000 - - Encumbrances - - - Education 625,446 - 124,078 General government activities 399,178 - - Recreation programs 929,058 - - Clinic services 78,656 - - Public safety and police private duty 930,052 - - Building maintenance 728,642 - - Community Development Block Grant - - 79,437 Other capital projects - 784,715 -
Total assigned 4,621,032 784,715 203,515
Unassigned 18,974,637 - -
Total fund balance 23,626,882 $ 9,970,529 $ 5,484,196 $
Encumbrances contained in the above table are as follows: $650,803 in the General Fund, $3,695,114 in the Capital Projects Fund, and $23,096 in Nonmajor Governmental Funds.
Town of Windsor, Connecticut Notes to Financial Statements
63
Note 15. Governmental Accounting Standards Board (GASB) Statements
The Governmental Accounting Standards Board (GASB) has issued several pronouncements that have effective dates that may impact future financial presentations.
• GASB Statement No. 72, Fair Value Measurement and Application. This Statement addresses accounting and financial reporting issues related to fair value measurements. The definition of fair value is the price that would be received to sell an asset or paid to transfer a liability in an orderly transaction between market participants at the measurement date. This Statement provides guidance for determining a fair value measurement for financial reporting purposes. This Statement also provides guidance for applying fair value to certain investments and disclosures related to all fair value measurements. The provisions of this Statement are effective for fiscal years beginning after June 15, 2015.
• GASB Statement No. 73, Accounting and Financial Reporting for Pensions and Related Assets That Are Not within the Scope of GASB Statement 68, and Amendments to Certain Provisions of GASB Statements 67 and 68, completes the suite of pension standards. Statement 73 establishes requirements for those pensions and pension plans that are not administered through a trust meeting specified criteria (in other words, those not covered by Statements 67 and 68). The requirements in Statement 73 for reporting pensions generally are the same as in Statement 68. However, the lack of a pension plan that is administered through a trust that meets specified criteria is reflected in the measurements. The provisions of this Statement are effective for fiscal years beginning after June 15, 2015.
• GASB Statement No. 74, Financial Reporting for Postemployment Benefit Plans Other Than Pension Plans, addresses reporting by OPEB plans that administer benefits on behalf of governments. Statement 74 addresses the financial reports of defined benefit OPEB plans that are administered through trusts that meet specified criteria. The Statement follows the framework for financial reporting of defined benefit OPEB plans in Statement 45 by requiring a statement of fiduciary net position and a statement of changes in fiduciary net position. The Statement requires more extensive note disclosures and RSI related to the measurement of the OPEB liabilities for which assets have been accumulated, including information about the annual money-weighted rates of return on plan investments. Statement 74 also sets forth note disclosure requirements for defined contribution OPEB plans. The provisions of this Statement are effective for fiscal years beginning after June 15, 2016.
• GASB Statement No. 75, Accounting and Financial Reporting for Postemployment Benefits Other Than Pensions, addresses reporting by governments that provide OPEB to their employees and for governments that finance OPEB for employees of other governments. Statement 75 requires governments to report a liability on the face of the financial statements for the OPEB that they provide:
− Governments that are responsible only for OPEB liabilities related to their own employees and that provide OPEB through a defined benefit OPEB plan administered through a trust that meets specified criteria will report a net OPEB liability—the difference between the total OPEB liability and assets accumulated in the trust and restricted to making benefit payments.
− Governments that participate in a cost-sharing OPEB plan that is administered through a trust that meets the specified criteria will report a liability equal to their proportionate share of the collective OPEB liability for all entities participating in the cost-sharing plan.
− Governments that do not provide OPEB through a trust that meets specified criteria will report the total OPEB liability related to their employees.
Town of Windsor, Connecticut Notes to Financial Statements
64
Note 16. Governmental Accounting Standards Board (GASB) Statements
Statement 75 carries forward from Statement 45 the option to use a specified alternative measurement method in place of an actuarial valuation for purposes of determining the total OPEB liability for benefits provided through OPEB plans in which there are fewer than 100 plan members (active and inactive). This option was retained in order to reduce costs for smaller governments. The provisions of this Statement are effective for fiscal years beginning after June 15, 2017.
• GASB Statement No. 76, The Hierarchy of Generally Accepted Accounting Principles for
State and Local Governments. The objective of this Statement is to identify—in the context of the current governmental financial reporting environment—the hierarchy of generally accepted accounting principles (GAAP). The “GAAP hierarchy” consists of the sources of accounting principles used to prepare financial statements of state and local governmental entities in conformity with GAAP and the framework for selecting those principles. This Statement reduces the GAAP hierarchy to two categories of authoritative GAAP and addresses the use of authoritative and nonauthoritative literature in the event that the accounting treatment for a transaction or other event is not specified within a source of authoritative GAAP.
This Statement supersedes Statement No. 55, The Hierarchy of Generally Accepted Accounting Principles for State and Local Governments. The requirements of this Statement are effective for financial statements for periods beginning after June 15, 2015, and should be applied retroactively. Earlier application is permitted.
• GASB Statement No. 77, Tax Abatement Disclosures. Financial statements prepared by state
and local governments in conformity with generally accepted accounting principles provide citizens and taxpayers, legislative and oversight bodies, municipal bond analysts, and others with information they need to evaluate the financial health of governments, make decisions, and assess accountability. This information is intended, among other things, to assist these users of financial statements in assessing (1) whether a government’s current-year revenues were sufficient to pay for current-year services (known as interperiod equity), (2) whether a government complied with finance-related legal and contractual obligations, (3) where a government’s financial resources come from and how it uses them, and (4) a government’s financial position and economic condition and how they have changed over time. This Statement requires governments that enter into tax abatement agreements to disclose the following information about the agreements:
− Brief descriptive information, such as the tax being abated, the authority under which tax abatements are provided, eligibility criteria, the mechanism by which taxes are abated, provisions for recapturing abated taxes, and the types of commitments made by tax abatement recipients
− The gross dollar amount of taxes abated during the period
− Commitments made by a government, other than to abate taxes, as part of a tax abatement agreement.
Governments should organize those disclosures by major tax abatement program and may disclose information for individual tax abatement agreements within those programs.
Town of Windsor, Connecticut Notes to Financial Statements
65
Note 15. Governmental Accounting Standards Board (GASB) Statements (Continued)
Tax abatement agreements of other governments should be organized by the government that entered into the tax abatement agreement and the specific tax being abated. Governments may disclose information for individual tax abatement agreements of other governments within the specific tax being abated. For those tax abatement agreements, a reporting government should disclose: − The names of the governments that entered into the agreements − The specific taxes being abated − The gross dollar amount of taxes abated during the period.
The requirements of this Statement are effective for financial statements for periods beginning after December 15, 2015. Earlier application is encouraged.
Management has not yet determined the effect that the above GASB statements will have on the financial statements, but GASB Statement No. 75 will have a material impact.

66
This page intentionally left blank.

Required Supplementary Information - Unaudited

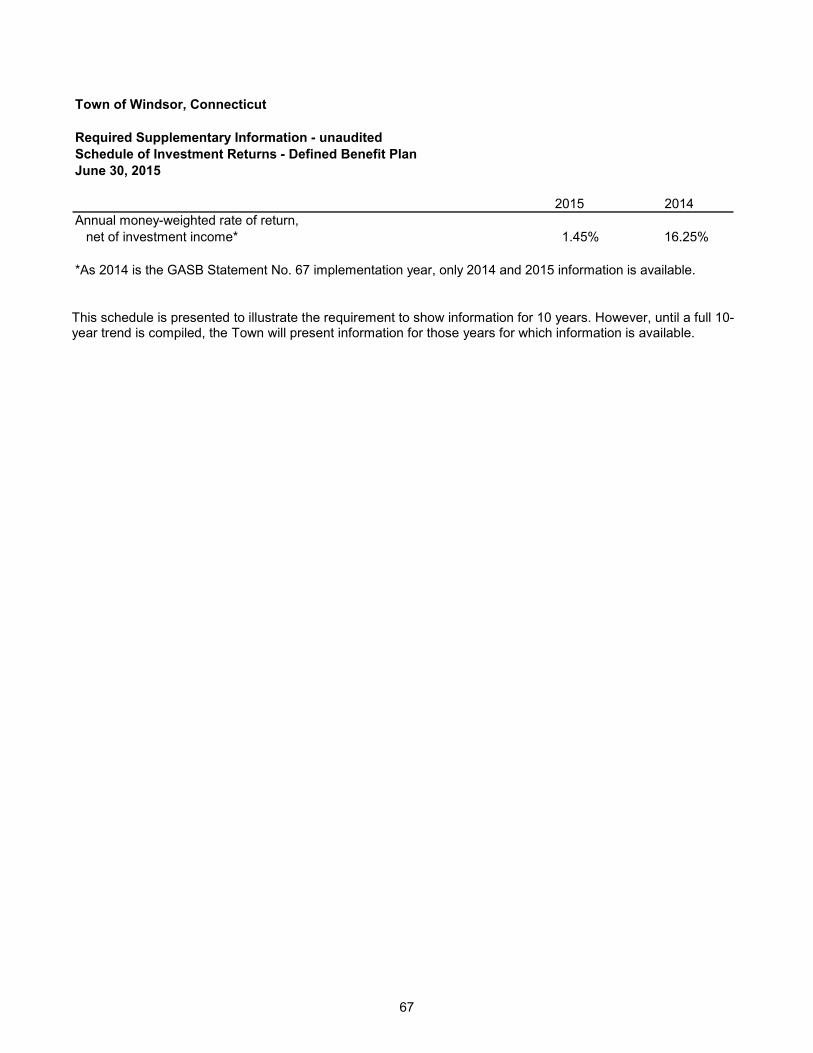
67
Town of Windsor, Connecticut
Required Supplementary Information - unauditedSchedule of Investment Returns - Defined Benefit PlanJune 30, 2015
2015 2014Annual money-weighted rate of return,
net of investment income* 1.45% 16.25%
*As 2014 is the GASB Statement No. 67 implementation year, only 2014 and 2015 information is available. This schedule is presented to illustrate the requirement to show information for 10 years. However, until a full 10-year trend is compiled, the Town will present information for those years for which information is available.
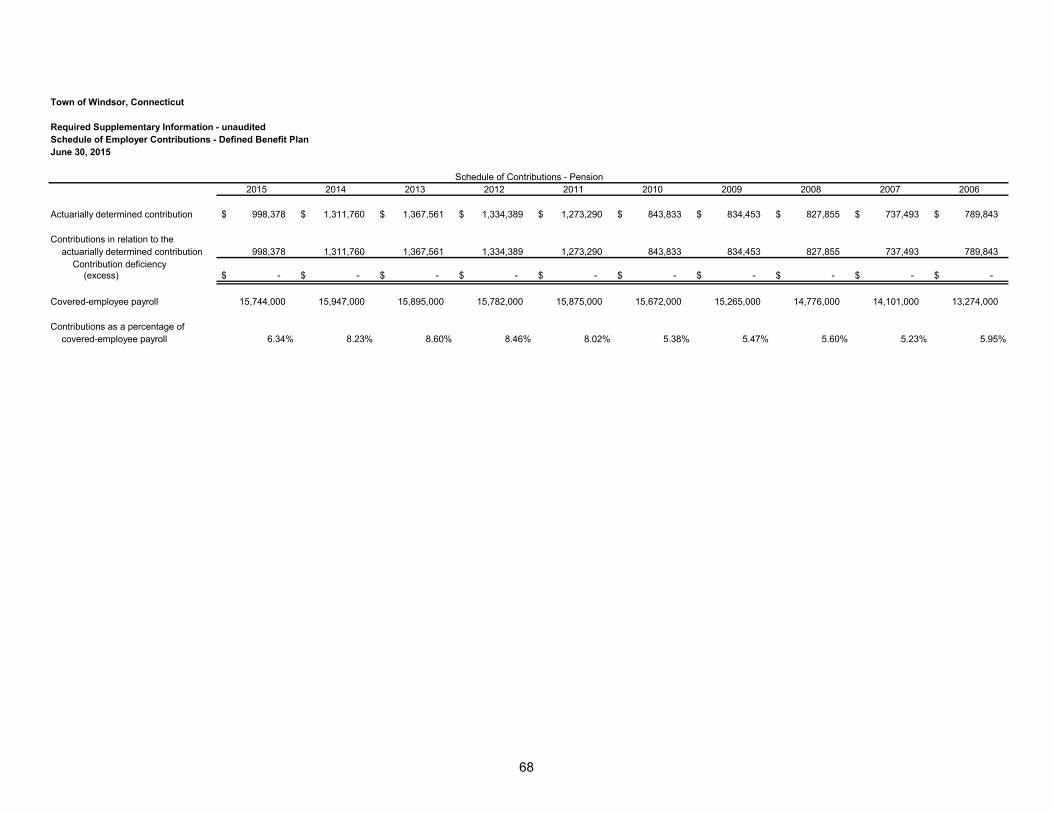
68
Town of Windsor, Connecticut
Required Supplementary Information - unauditedSchedule of Employer Contributions - Defined Benefit PlanJune 30, 2015
2015 2014 2013 2012 2011 2010 2009 2008 2007 2006
Actuarially determined contribution 998,378 $ 1,311,760 $ 1,367,561 $ 1,334,389 $ 1,273,290 $ 843,833 $ 834,453 $ 827,855 $ 737,493 $ 789,843 $
Contributions in relation to theactuarially determined contribution 998,378 1,311,760 1,367,561 1,334,389 1,273,290 843,833 834,453 827,855 737,493 789,843
Contribution deficiency (excess) -$ -$ -$ -$ -$ -$ -$ -$ -$ -$
Covered-employee payroll 15,744,000 15,947,000 15,895,000 15,782,000 15,875,000 15,672,000 15,265,000 14,776,000 14,101,000 13,274,000
Contributions as a percentage ofcovered-employee payroll 6.34% 8.23% 8.60% 8.46% 8.02% 5.38% 5.47% 5.60% 5.23% 5.95%
Schedule of Contributions - Pension
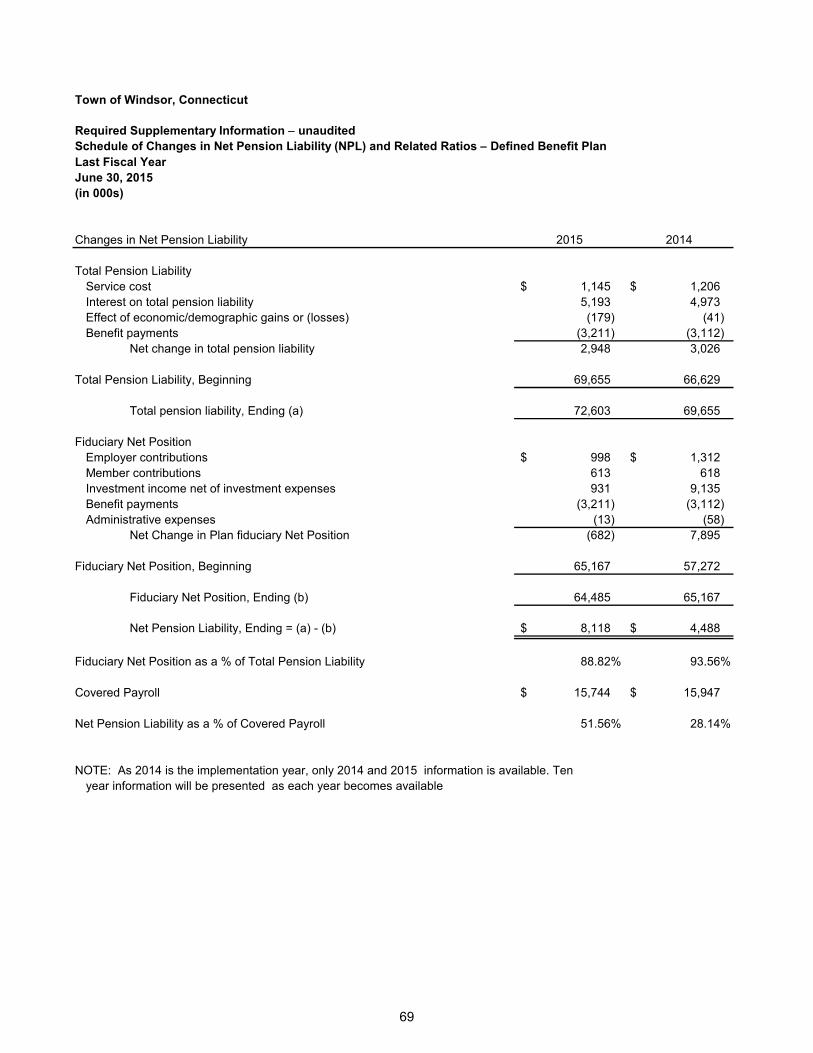
69
Town of Windsor, Connecticut
Required Supplementary Information − unauditedSchedule of Changes in Net Pension Liability (NPL) and Related Ratios − Defined Benefit PlanLast Fiscal YearJune 30, 2015(in 000s)
Changes in Net Pension Liability 2015 2014
Total Pension LiabilityService cost 1,145 $ 1,206 $ Interest on total pension liability 5,193 4,973 Effect of economic/demographic gains or (losses) (179) (41) Benefit payments (3,211) (3,112)
Net change in total pension liability 2,948 3,026
Total Pension Liability, Beginning 69,655 66,629
Total pension liability, Ending (a) 72,603 69,655
Fiduciary Net PositionEmployer contributions 998 $ 1,312 $ Member contributions 613 618 Investment income net of investment expenses 931 9,135 Benefit payments (3,211) (3,112) Administrative expenses (13) (58)
Net Change in Plan fiduciary Net Position (682) 7,895
Fiduciary Net Position, Beginning 65,167 57,272
Fiduciary Net Position, Ending (b) 64,485 65,167
Net Pension Liability, Ending = (a) - (b) 8,118 $ 4,488 $
Fiduciary Net Position as a % of Total Pension Liability 88.82% 93.56%
Covered Payroll 15,744 $ 15,947 $
Net Pension Liability as a % of Covered Payroll 51.56% 28.14%
year information will be presented as each year becomes availableNOTE: As 2014 is the implementation year, only 2014 and 2015 information is available. Ten
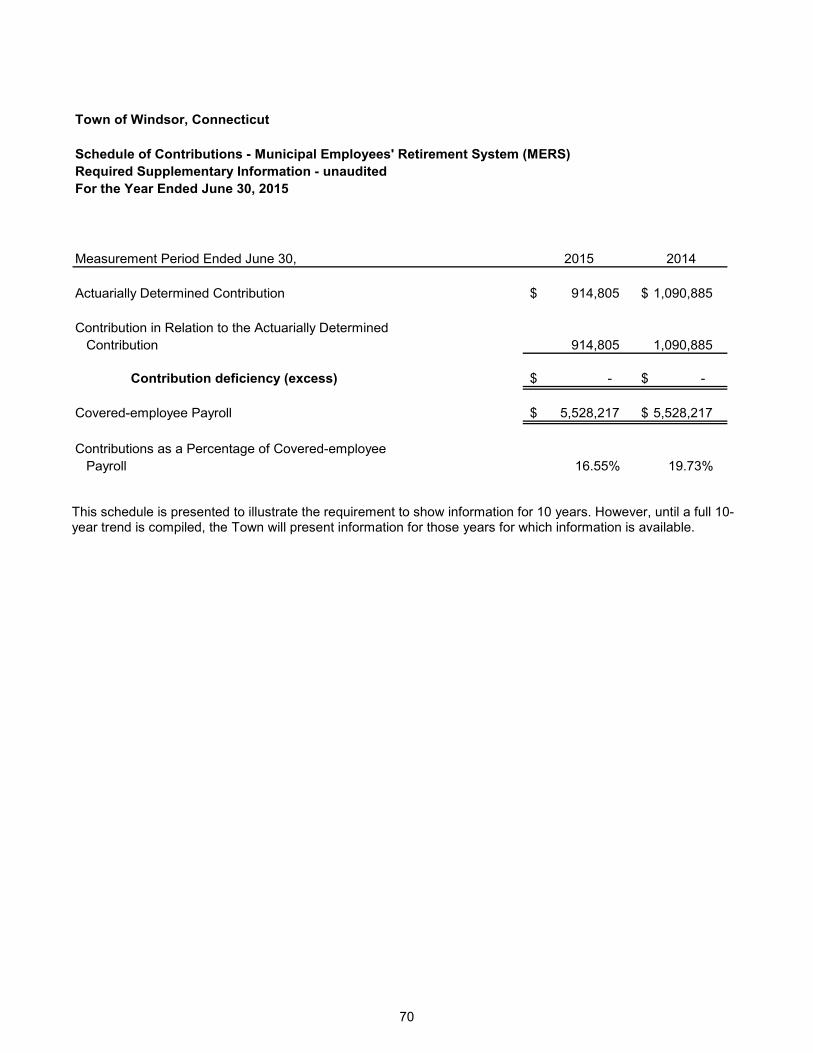
70
Town of Windsor, Connecticut
Schedule of Contributions - Municipal Employees' Retirement System (MERS)Required Supplementary Information - unauditedFor the Year Ended June 30, 2015
Measurement Period Ended June 30, 2015 2014
Actuarially Determined Contribution 914,805 $ 1,090,885 $
Contribution in Relation to the Actuarially DeterminedContribution 914,805 1,090,885
Contribution deficiency (excess) -$ -$
Covered-employee Payroll 5,528,217 $ 5,528,217 $
Contributions as a Percentage of Covered-employeePayroll 16.55% 19.73%
This schedule is presented to illustrate the requirement to show information for 10 years. However, until a full 10-year trend is compiled, the Town will present information for those years for which information is available.
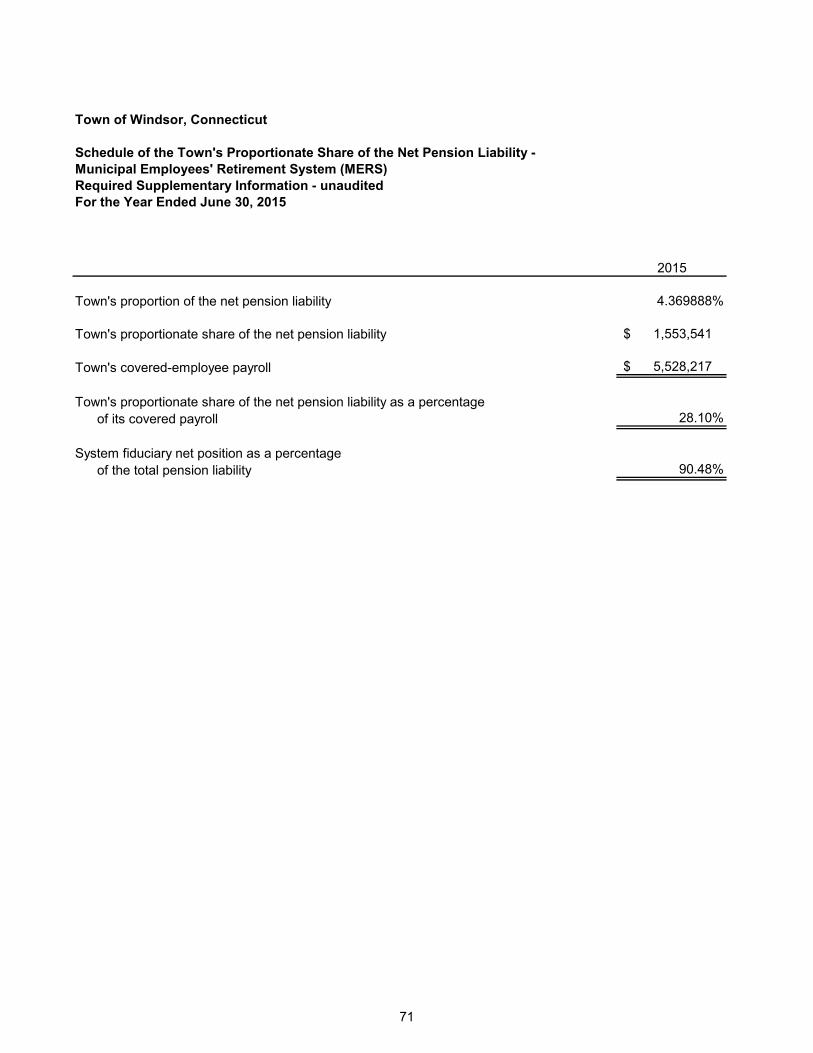
71
Town of Windsor, Connecticut
Schedule of the Town's Proportionate Share of the Net Pension Liability - Municipal Employees' Retirement System (MERS)Required Supplementary Information - unauditedFor the Year Ended June 30, 2015
2015
Town's proportion of the net pension liability 4.369888%
Town's proportionate share of the net pension liability 1,553,541 $
Town's covered-employee payroll 5,528,217 $
Town's proportionate share of the net pension liability as a percentageof its covered payroll 28.10%
System fiduciary net position as a percentageof the total pension liability 90.48%
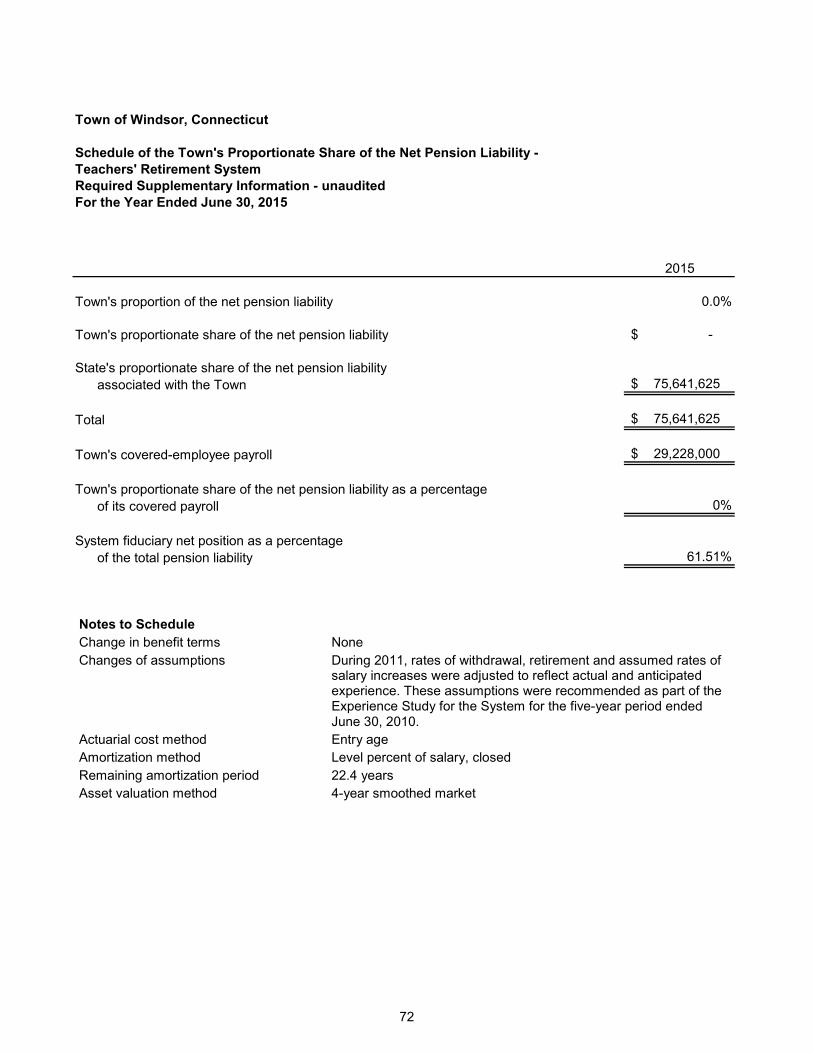
72
Town of Windsor, Connecticut
Schedule of the Town's Proportionate Share of the Net Pension Liability - Teachers' Retirement SystemRequired Supplementary Information - unauditedFor the Year Ended June 30, 2015
2015
Town's proportion of the net pension liability 0.0%
Town's proportionate share of the net pension liability -$
State's proportionate share of the net pension liabilityassociated with the Town 75,641,625 $
Total 75,641,625 $
Town's covered-employee payroll 29,228,000 $
Town's proportionate share of the net pension liability as a percentageof its covered payroll 0%
System fiduciary net position as a percentageof the total pension liability 61.51%
Notes to Schedule Change in benefit terms None Changes of assumptions During 2011, rates of withdrawal, retirement and assumed rates of
salary increases were adjusted to reflect actual and anticipated experience. These assumptions were recommended as part of the Experience Study for the System for the five-year period ended June 30, 2010.
Actuarial cost method Entry age Amortization method Level percent of salary, closed Remaining amortization period 22.4 years Asset valuation method 4-year smoothed market
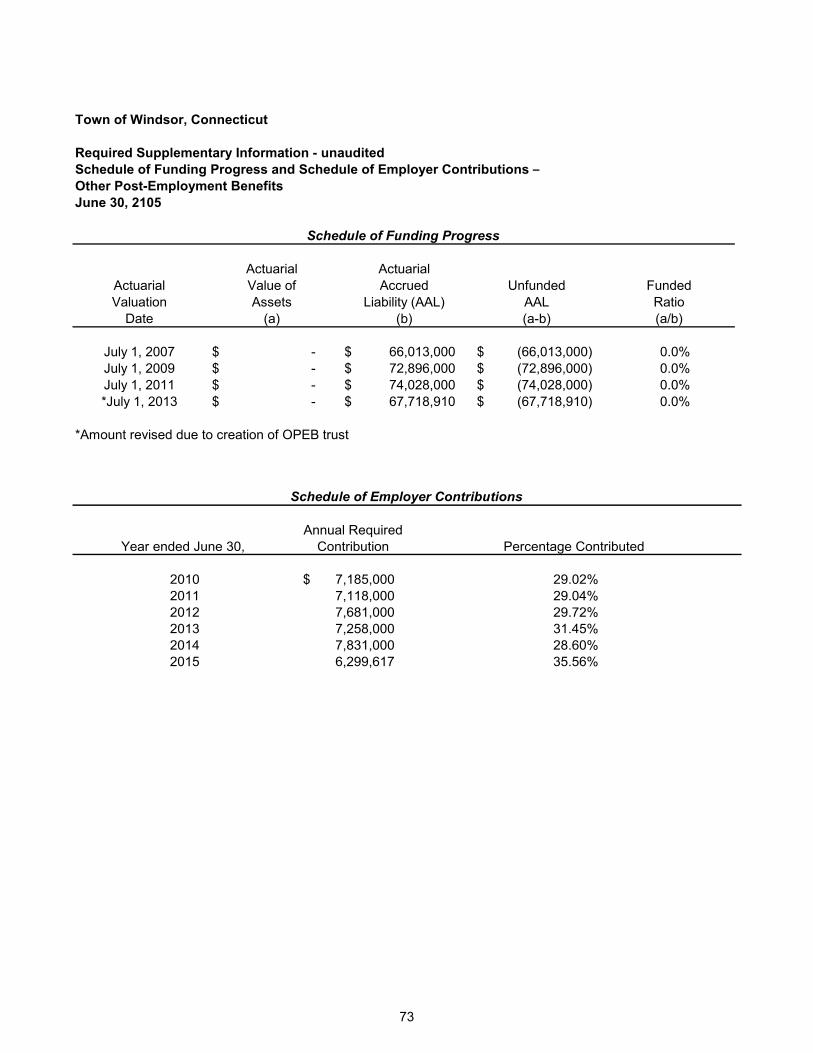
73
Town of Windsor, Connecticut
Required Supplementary Information - unauditedSchedule of Funding Progress and Schedule of Employer Contributions – Other Post-Employment BenefitsJune 30, 2105
Actuarial ActuarialActuarial Value of Accrued Unfunded FundedValuation Assets Liability (AAL) AAL Ratio
Date (a) (b) (a-b) (a/b)
July 1, 2007 -$ 66,013,000 $ (66,013,000) $ 0.0%July 1, 2009 -$ 72,896,000 $ (72,896,000) $ 0.0%July 1, 2011 -$ 74,028,000 $ (74,028,000) $ 0.0%*July 1, 2013 -$ 67,718,910 $ (67,718,910) $ 0.0%
*Amount revised due to creation of OPEB trust
Schedule of Funding Progress
Annual RequiredYear ended June 30, Contribution Percentage Contributed
2010 7,185,000 $ 29.02%2011 7,118,000 29.04%2012 7,681,000 29.72%2013 7,258,000 31.45%2014 7,831,000 28.60%2015 6,299,617 35.56%
Schedule of Employer Contributions
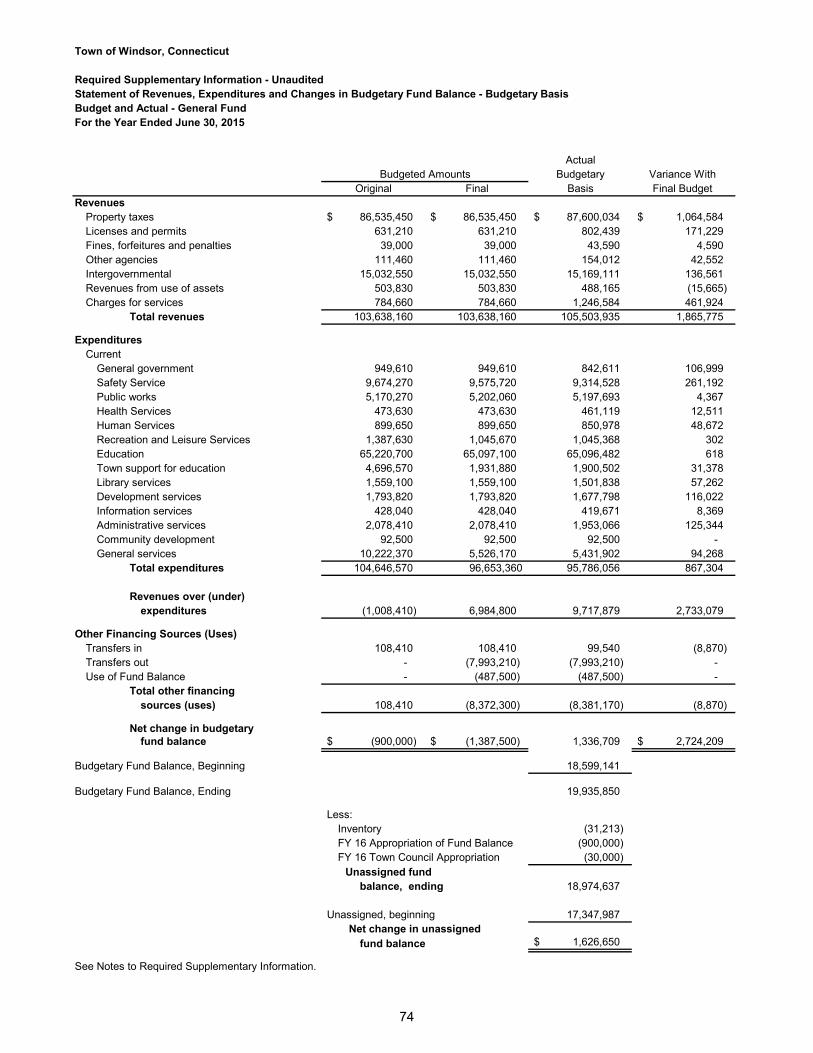
74
Town of Windsor, Connecticut
Required Supplementary Information - UnauditedStatement of Revenues, Expenditures and Changes in Budgetary Fund Balance - Budgetary BasisBudget and Actual - General FundFor the Year Ended June 30, 2015
ActualBudgetary Variance With
Original Final Basis Final Budget Revenues
Property taxes 86,535,450 $ 86,535,450 $ 87,600,034 $ 1,064,584 $ Licenses and permits 631,210 631,210 802,439 171,229 Fines, forfeitures and penalties 39,000 39,000 43,590 4,590 Other agencies 111,460 111,460 154,012 42,552 Intergovernmental 15,032,550 15,032,550 15,169,111 136,561 Revenues from use of assets 503,830 503,830 488,165 (15,665) Charges for services 784,660 784,660 1,246,584 461,924
Total revenues 103,638,160 103,638,160 105,503,935 1,865,775
Expenditures Current
General government 949,610 949,610 842,611 106,999 Safety Service 9,674,270 9,575,720 9,314,528 261,192 Public works 5,170,270 5,202,060 5,197,693 4,367 Health Services 473,630 473,630 461,119 12,511 Human Services 899,650 899,650 850,978 48,672 Recreation and Leisure Services 1,387,630 1,045,670 1,045,368 302 Education 65,220,700 65,097,100 65,096,482 618 Town support for education 4,696,570 1,931,880 1,900,502 31,378 Library services 1,559,100 1,559,100 1,501,838 57,262 Development services 1,793,820 1,793,820 1,677,798 116,022 Information services 428,040 428,040 419,671 8,369 Administrative services 2,078,410 2,078,410 1,953,066 125,344 Community development 92,500 92,500 92,500 - General services 10,222,370 5,526,170 5,431,902 94,268
Total expenditures 104,646,570 96,653,360 95,786,056 867,304
Revenues over (under) expenditures (1,008,410) 6,984,800 9,717,879 2,733,079
Other Financing Sources (Uses) Transfers in 108,410 108,410 99,540 (8,870) Transfers out - (7,993,210) (7,993,210) - Use of Fund Balance - (487,500) (487,500) -
Total other financingsources (uses) 108,410 (8,372,300) (8,381,170) (8,870)
Net change in budgetaryfund balance (900,000) $ (1,387,500) $ 1,336,709 2,724,209 $
Budgetary Fund Balance, Beginning 18,599,141
Budgetary Fund Balance, Ending 19,935,850
Less:Inventory (31,213) FY 16 Appropriation of Fund Balance (900,000) FY 16 Town Council Appropriation (30,000)
Unassigned fund balance, ending 18,974,637
Unassigned, beginning 17,347,987 Net change in unassigned
fund balance 1,626,650 $
See Notes to Required Supplementary Information.
Budgeted Amounts
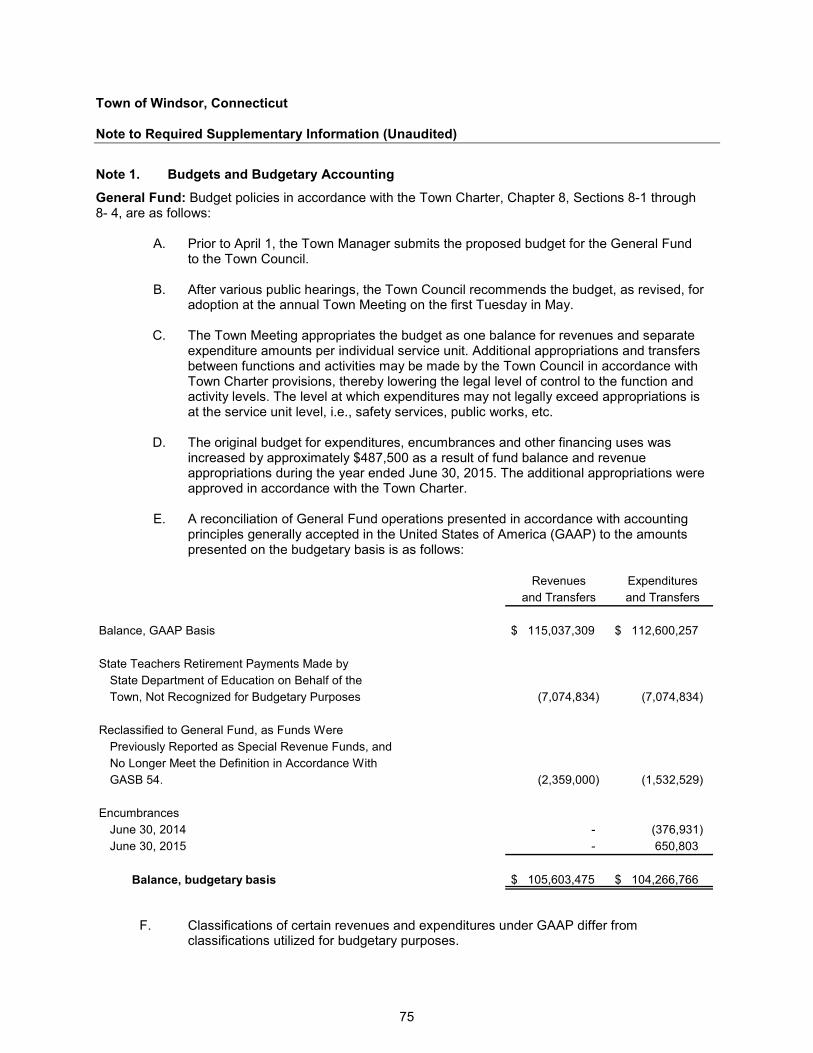
Town of Windsor, Connecticut Note to Required Supplementary Information (Unaudited)
75
Note 1. Budgets and Budgetary Accounting
General Fund: Budget policies in accordance with the Town Charter, Chapter 8, Sections 8-1 through 8- 4, are as follows:
A. Prior to April 1, the Town Manager submits the proposed budget for the General Fund to the Town Council.
B. After various public hearings, the Town Council recommends the budget, as revised, for
adoption at the annual Town Meeting on the first Tuesday in May. C. The Town Meeting appropriates the budget as one balance for revenues and separate
expenditure amounts per individual service unit. Additional appropriations and transfers between functions and activities may be made by the Town Council in accordance with Town Charter provisions, thereby lowering the legal level of control to the function and activity levels. The level at which expenditures may not legally exceed appropriations is at the service unit level, i.e., safety services, public works, etc.
D. The original budget for expenditures, encumbrances and other financing uses was
increased by approximately $487,500 as a result of fund balance and revenue appropriations during the year ended June 30, 2015. The additional appropriations were approved in accordance with the Town Charter.
E. A reconciliation of General Fund operations presented in accordance with accounting
principles generally accepted in the United States of America (GAAP) to the amounts presented on the budgetary basis is as follows:
Revenues Expenditures
and Transfers and Transfers
Balance, GAAP Basis $ 115,037,309 $ 112,600,257
State Teachers Retirement Payments Made byState Department of Education on Behalf of theTown, Not Recognized for Budgetary Purposes (7,074,834) (7,074,834)
Reclassified to General Fund, as Funds Were Previously Reported as Special Revenue Funds, andNo Longer Meet the Definition in Accordance WithGASB 54. (2,359,000) (1,532,529)
EncumbrancesJune 30, 2014 - (376,931) June 30, 2015 - 650,803
Balance, budgetary basis $ 105,603,475 $ 104,266,766
F. Classifications of certain revenues and expenditures under GAAP differ from
classifications utilized for budgetary purposes.
Town of Windsor, Connecticut Note to Required Supplementary Information (Unaudited)
76
Note 1. Budgets and Budgetary Accounting (Continued)
Special Revenue Funds: The town includes special revenue funds within the adopted annual operating budget. Budgets for the various special revenue funds that are utilized to account for specific grant programs are established in accordance with the requirements of the State or other grantor agencies. Such budgets are non-lapsing and may comprise more than one fiscal year. Capital Projects Funds: Legal authorization for expenditures of the capital projects funds is provided by the related bond ordinances and/or intergovernmental grant agreements or Connecticut General Statutes. Capital appropriations do not lapse until completion of the applicable projects.

Combining and Individual Fund Financial Statements and Other Schedules


Nonmajor Governmental Funds
NONMAJOR GOVERNMENTAL FUNDS Special Revenue Funds Special revenue funds are used to account for and report specific revenue sources that are restricted or committed to expenditure for specific purposes other than debt service or capital projects. Educational Grant Programs: Cover all specially financed education programs under grants received from the Federal or State government. Cafeteria: Accounts for revenue and expenditures of the food service operations in the Windsor Public Schools Community Rehabilitation Program: Accounts for block grants received from the United States Department of Housing and Urban Development. J. Bartash Expendable Trust Fund: is used to account for a bequest made to the Town by a former resident. Treehouse Fund: Accounts for revenue and expenditures for before and after school childcare provided by the school system. Other Special Revenue Funds: Account for intergovernmental and private grants for various special projects administered by the Town. Capital Project - Open Space: Accounts for funds received through donations and appropriations from the General Fund for the acquisition and improvement of open space. Debt Service Funds Debt Service Fund: Accounts for all debt service transactions.

77
This page intentionally left blank.
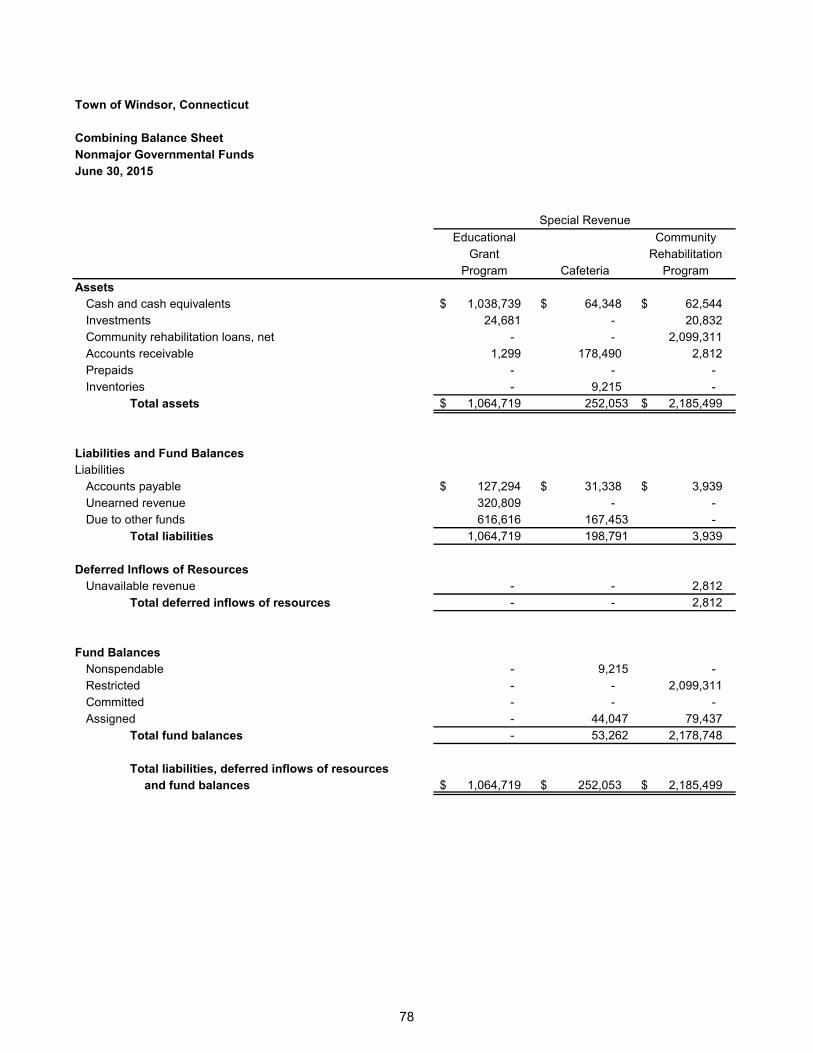
78
Town of Windsor, Connecticut
Combining Balance SheetNonmajor Governmental FundsJune 30, 2015
Educational CommunityGrant Rehabilitation
Program Cafeteria ProgramAssets
Cash and cash equivalents 1,038,739 $ 64,348 $ 62,544 $ Investments 24,681 - 20,832 Community rehabilitation loans, net - - 2,099,311 Accounts receivable 1,299 178,490 2,812 Prepaids - - - Inventories - 9,215 -
Total assets 1,064,719 $ 252,053 2,185,499 $
Liabilities and Fund BalancesLiabilities
Accounts payable 127,294 $ 31,338 $ 3,939 $ Unearned revenue 320,809 - - Due to other funds 616,616 167,453 -
Total liabilities 1,064,719 198,791 3,939
Deferred Inflows of ResourcesUnavailable revenue - - 2,812
Total deferred inflows of resources - - 2,812
Fund Balances Nonspendable - 9,215 - Restricted - - 2,099,311 Committed - - - Assigned - 44,047 79,437
Total fund balances - 53,262 2,178,748
Total liabilities, deferred inflows of resources and fund balances 1,064,719 $ 252,053 $ 2,185,499 $
Special Revenue
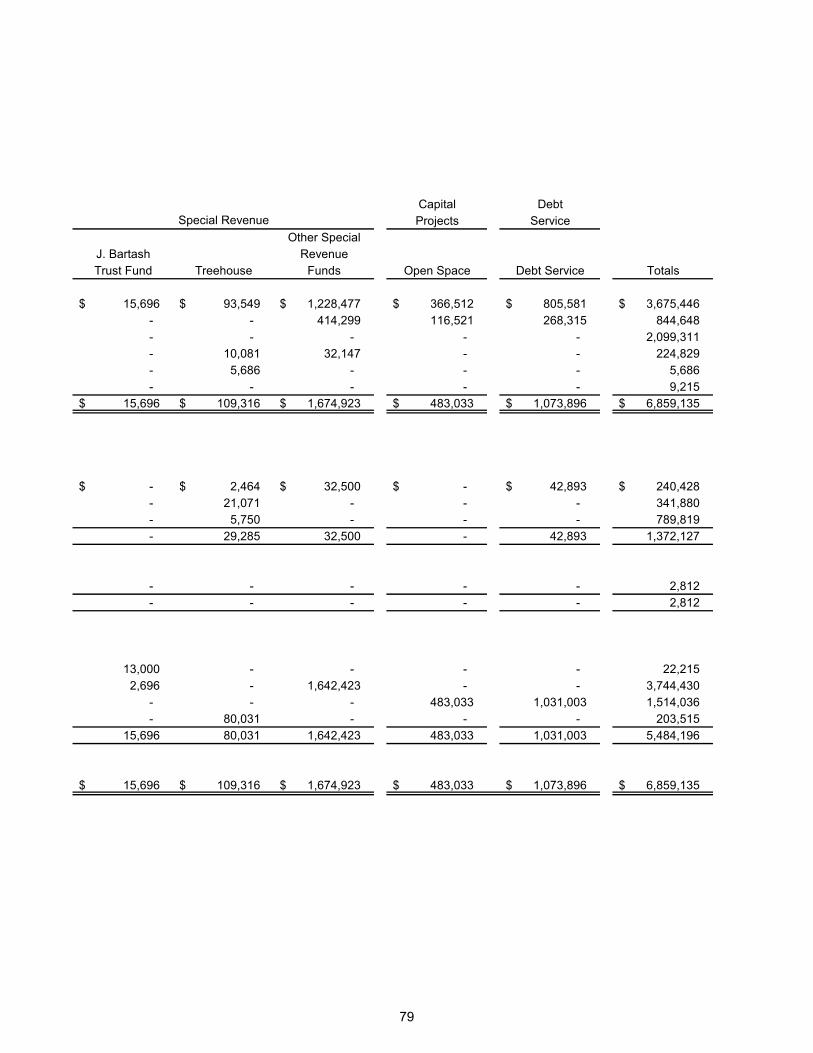
79
Capital DebtProjects Service
Other SpecialJ. Bartash RevenueTrust Fund Treehouse Funds Open Space Debt Service Totals
15,696 $ 93,549 $ 1,228,477 $ 366,512 $ 805,581 $ 3,675,446 $ - - 414,299 116,521 268,315 844,648 - - - - - 2,099,311 - 10,081 32,147 - - 224,829 - 5,686 - - - 5,686 - - - - - 9,215
15,696 $ 109,316 $ 1,674,923 $ 483,033 $ 1,073,896 $ 6,859,135 $
-$ 2,464 $ 32,500 $ -$ 42,893 $ 240,428 $ - 21,071 - - - 341,880 - 5,750 - - - 789,819 - 29,285 32,500 - 42,893 1,372,127
- - - - - 2,812 - - - - - 2,812
13,000 - - - - 22,215 2,696 - 1,642,423 - - 3,744,430
- - - 483,033 1,031,003 1,514,036 - 80,031 - - - 203,515
15,696 80,031 1,642,423 483,033 1,031,003 5,484,196
15,696 $ 109,316 $ 1,674,923 $ 483,033 $ 1,073,896 $ 6,859,135 $
Special Revenue
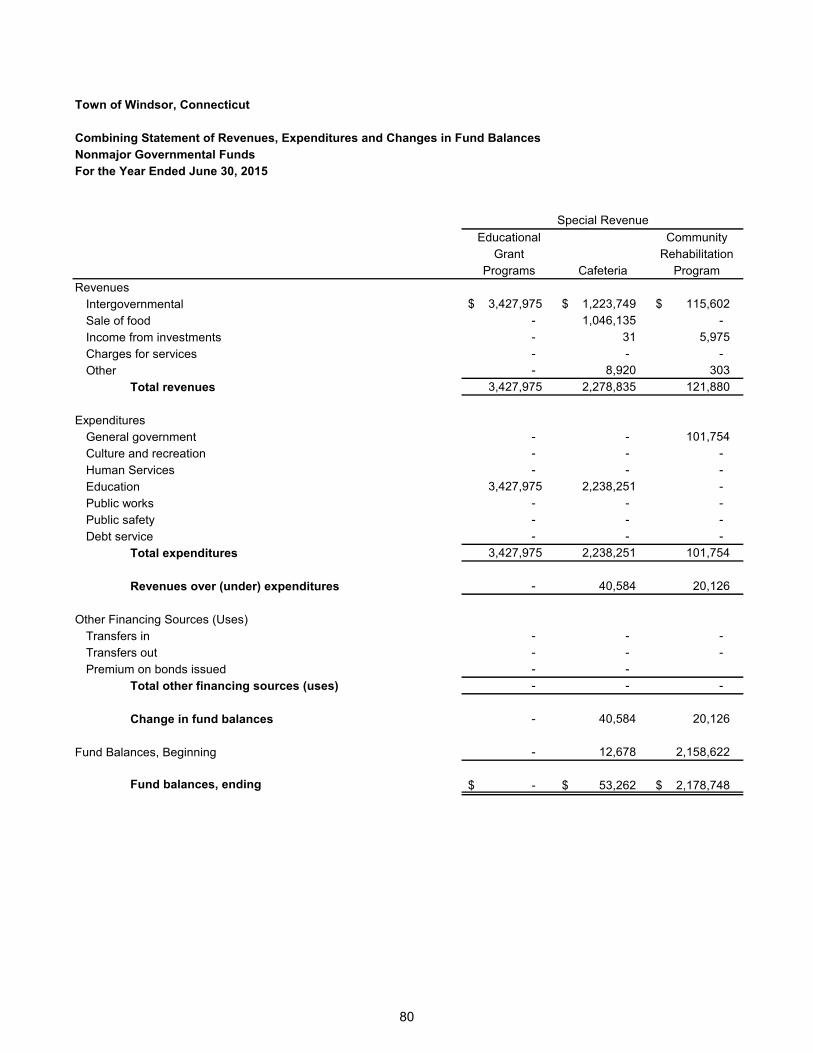
80
Town of Windsor, Connecticut
Combining Statement of Revenues, Expenditures and Changes in Fund BalancesNonmajor Governmental FundsFor the Year Ended June 30, 2015
Educational CommunityGrant Rehabilitation
Programs Cafeteria ProgramRevenues
Intergovernmental 3,427,975 $ 1,223,749 $ 115,602 $ Sale of food - 1,046,135 - Income from investments - 31 5,975 Charges for services - - - Other - 8,920 303
Total revenues 3,427,975 2,278,835 121,880
ExpendituresGeneral government - - 101,754 Culture and recreation - - - Human Services - - - Education 3,427,975 2,238,251 - Public works - - - Public safety - - - Debt service - - -
Total expenditures 3,427,975 2,238,251 101,754
Revenues over (under) expenditures - 40,584 20,126
Other Financing Sources (Uses)Transfers in - - - Transfers out - - - Premium on bonds issued - -
Total other financing sources (uses) - - -
Change in fund balances - 40,584 20,126
Fund Balances, Beginning - 12,678 2,158,622
Fund balances, ending -$ 53,262 $ 2,178,748 $
Special Revenue
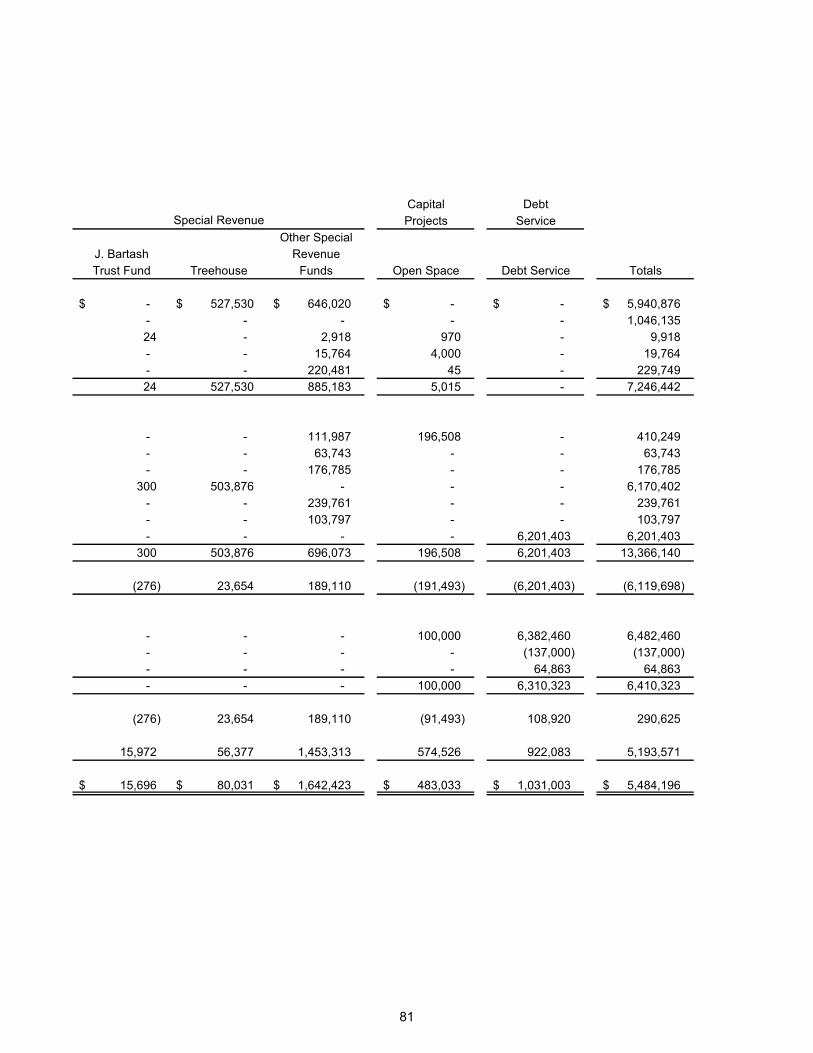
81
Capital DebtProjects Service
Other SpecialJ. Bartash RevenueTrust Fund Treehouse Funds Open Space Debt Service Totals
-$ 527,530 $ 646,020 $ -$ -$ 5,940,876 $ - - - - - 1,046,135 24 - 2,918 970 - 9,918 - - 15,764 4,000 - 19,764 - - 220,481 45 - 229,749 24 527,530 885,183 5,015 - 7,246,442
- - 111,987 196,508 - 410,249 - - 63,743 - - 63,743 - - 176,785 - - 176,785
300 503,876 - - - 6,170,402 - - 239,761 - - 239,761 - - 103,797 - - 103,797 - - - - 6,201,403 6,201,403
300 503,876 696,073 196,508 6,201,403 13,366,140
(276) 23,654 189,110 (191,493) (6,201,403) (6,119,698)
- - - 100,000 6,382,460 6,482,460 - - - - (137,000) (137,000) - - - - 64,863 64,863 - - - 100,000 6,310,323 6,410,323
(276) 23,654 189,110 (91,493) 108,920 290,625
15,972 56,377 1,453,313 574,526 922,083 5,193,571
15,696 $ 80,031 $ 1,642,423 $ 483,033 $ 1,031,003 $ 5,484,196 $
Special Revenue

82
This page intentionally left blank.

Nonmajor Enterprise Funds
Nonmajor Enterprise Funds Enterprise funds are maintained to account for the Town’s ongoing organizations and activities that are similar to those found in the private sector. The Town’s three nonmajor enterprise funds are: Child Development – Accounts for the operations of the Windsor Child Development Center which provides day care services to Town residents and to employees of businesses located in Windsor. Adult Caring Connection – Accounts for the operations of the Windsor Adult Caring Center which provides for the needs of the elderly and handicapped adults of the Town. Resident Transfer Station – Accounts for the operations of the Resident Transfer Station on Huckleberry Road, adjacent to the Landfill. This facility is for residents who choose to bring their solid waste and recyclables to this site versus putting it at the curb for removal.
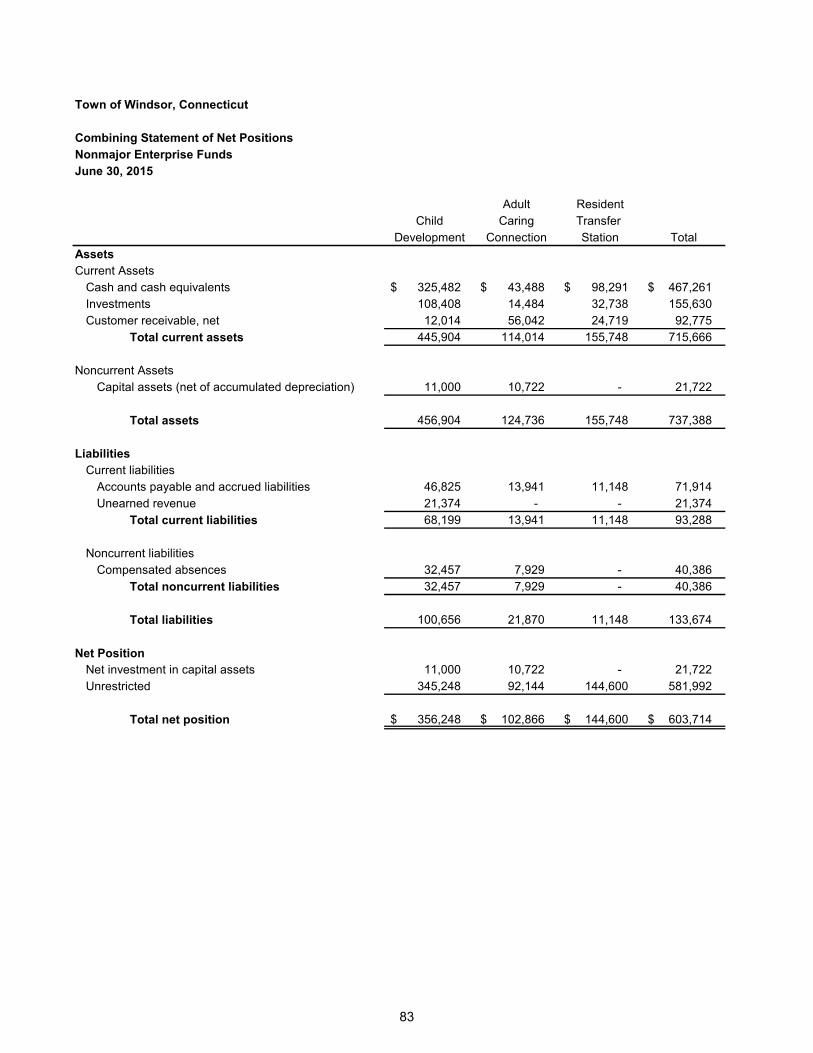
83
Town of Windsor, Connecticut
Combining Statement of Net PositionsNonmajor Enterprise FundsJune 30, 2015
Adult ResidentChild Caring Transfer
Development Connection Station TotalAssetsCurrent Assets
Cash and cash equivalents 325,482 $ 43,488 $ 98,291 $ 467,261 $ Investments 108,408 14,484 32,738 155,630 Customer receivable, net 12,014 56,042 24,719 92,775
Total current assets 445,904 114,014 155,748 715,666
Noncurrent AssetsCapital assets (net of accumulated depreciation) 11,000 10,722 - 21,722
Total assets 456,904 124,736 155,748 737,388
LiabilitiesCurrent liabilities
Accounts payable and accrued liabilities 46,825 13,941 11,148 71,914 Unearned revenue 21,374 - - 21,374
Total current liabilities 68,199 13,941 11,148 93,288
Noncurrent liabilitiesCompensated absences 32,457 7,929 - 40,386
Total noncurrent liabilities 32,457 7,929 - 40,386
Total liabilities 100,656 21,870 11,148 133,674
Net PositionNet investment in capital assets 11,000 10,722 - 21,722 Unrestricted 345,248 92,144 144,600 581,992
Total net position 356,248 $ 102,866 $ 144,600 $ 603,714 $
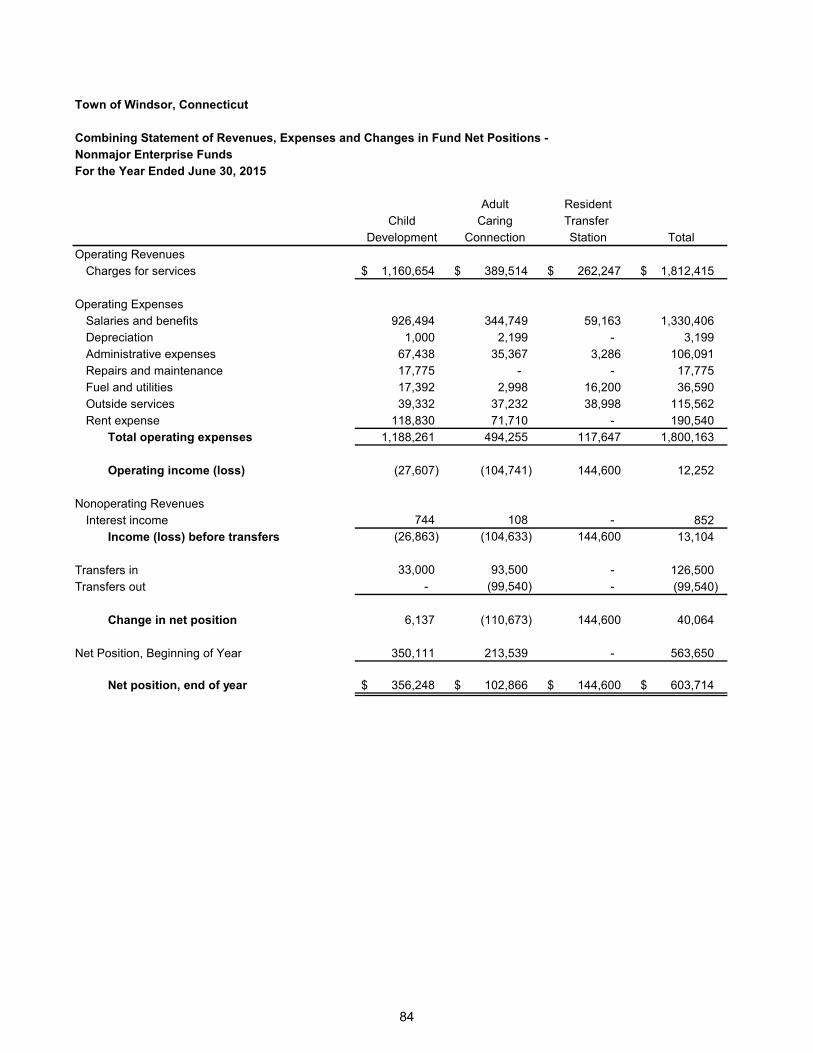
84
Town of Windsor, Connecticut
Combining Statement of Revenues, Expenses and Changes in Fund Net Positions - Nonmajor Enterprise FundsFor the Year Ended June 30, 2015
Adult ResidentChild Caring Transfer
Development Connection Station TotalOperating Revenues
Charges for services 1,160,654 $ 389,514 $ 262,247 $ 1,812,415 $
Operating ExpensesSalaries and benefits 926,494 344,749 59,163 1,330,406 Depreciation 1,000 2,199 - 3,199 Administrative expenses 67,438 35,367 3,286 106,091 Repairs and maintenance 17,775 - - 17,775 Fuel and utilities 17,392 2,998 16,200 36,590 Outside services 39,332 37,232 38,998 115,562 Rent expense 118,830 71,710 - 190,540
Total operating expenses 1,188,261 494,255 117,647 1,800,163
Operating income (loss) (27,607) (104,741) 144,600 12,252
Nonoperating Revenues Interest income 744 108 - 852
Income (loss) before transfers (26,863) (104,633) 144,600 13,104
Transfers in 33,000 93,500 - 126,500 Transfers out - (99,540) - (99,540)
Change in net position 6,137 (110,673) 144,600 40,064
Net Position, Beginning of Year 350,111 213,539 - 563,650
Net position, end of year 356,248 $ 102,866 $ 144,600 $ 603,714 $
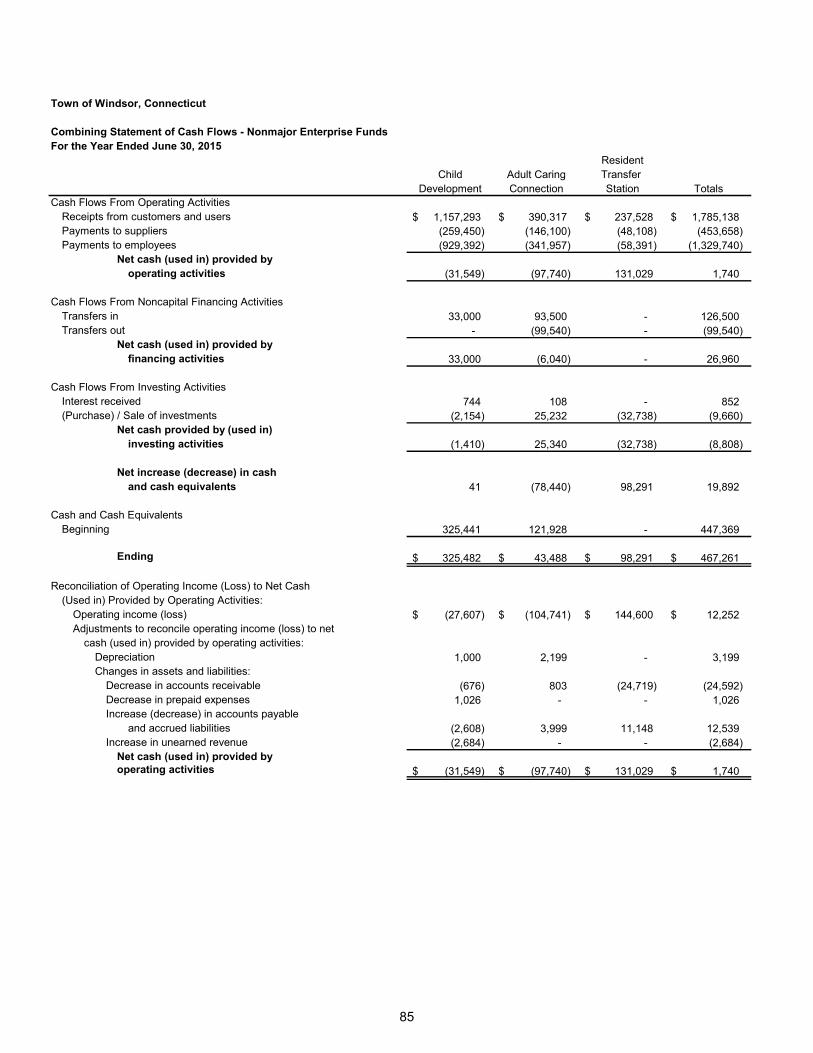
85
Town of Windsor, Connecticut
Combining Statement of Cash Flows - Nonmajor Enterprise FundsFor the Year Ended June 30, 2015
ResidentChild Adult Caring Transfer
Development Connection Station TotalsCash Flows From Operating Activities
Receipts from customers and users 1,157,293 $ 390,317 $ 237,528 $ 1,785,138 $ Payments to suppliers (259,450) (146,100) (48,108) (453,658) Payments to employees (929,392) (341,957) (58,391) (1,329,740)
Net cash (used in) provided byoperating activities (31,549) (97,740) 131,029 1,740
Cash Flows From Noncapital Financing ActivitiesTransfers in 33,000 93,500 - 126,500 Transfers out - (99,540) - (99,540)
Net cash (used in) provided byfinancing activities 33,000 (6,040) - 26,960
Cash Flows From Investing ActivitiesInterest received 744 108 - 852 (Purchase) / Sale of investments (2,154) 25,232 (32,738) (9,660)
Net cash provided by (used in)investing activities (1,410) 25,340 (32,738) (8,808)
Net increase (decrease) in cashand cash equivalents 41 (78,440) 98,291 19,892
Cash and Cash EquivalentsBeginning 325,441 121,928 - 447,369
Ending 325,482 $ 43,488 $ 98,291 $ 467,261 $
Reconciliation of Operating Income (Loss) to Net Cash(Used in) Provided by Operating Activities:
Operating income (loss) (27,607) $ (104,741) $ 144,600 $ 12,252 $ Adjustments to reconcile operating income (loss) to net
cash (used in) provided by operating activities:Depreciation 1,000 2,199 - 3,199 Changes in assets and liabilities:
Decrease in accounts receivable (676) 803 (24,719) (24,592) Decrease in prepaid expenses 1,026 - - 1,026 Increase (decrease) in accounts payable
and accrued liabilities (2,608) 3,999 11,148 12,539 Increase in unearned revenue (2,684) - - (2,684)
Net cash (used in) provided byoperating activities (31,549) $ (97,740) $ 131,029 $ 1,740 $

86
This page intentionally left blank.

Fiduciary Funds
Fiduciary Funds Fiduciary Funds are used to account for assets held in a trustee capacity for others and include Agency Funds. Agency Funds are used to account for various Board of Education and Town activities. They are custodial in nature (assets equal liabilities) and are as follows:
Student Activity Fund Adult Education Performance Bonds Town Escrow Scholarship Fund
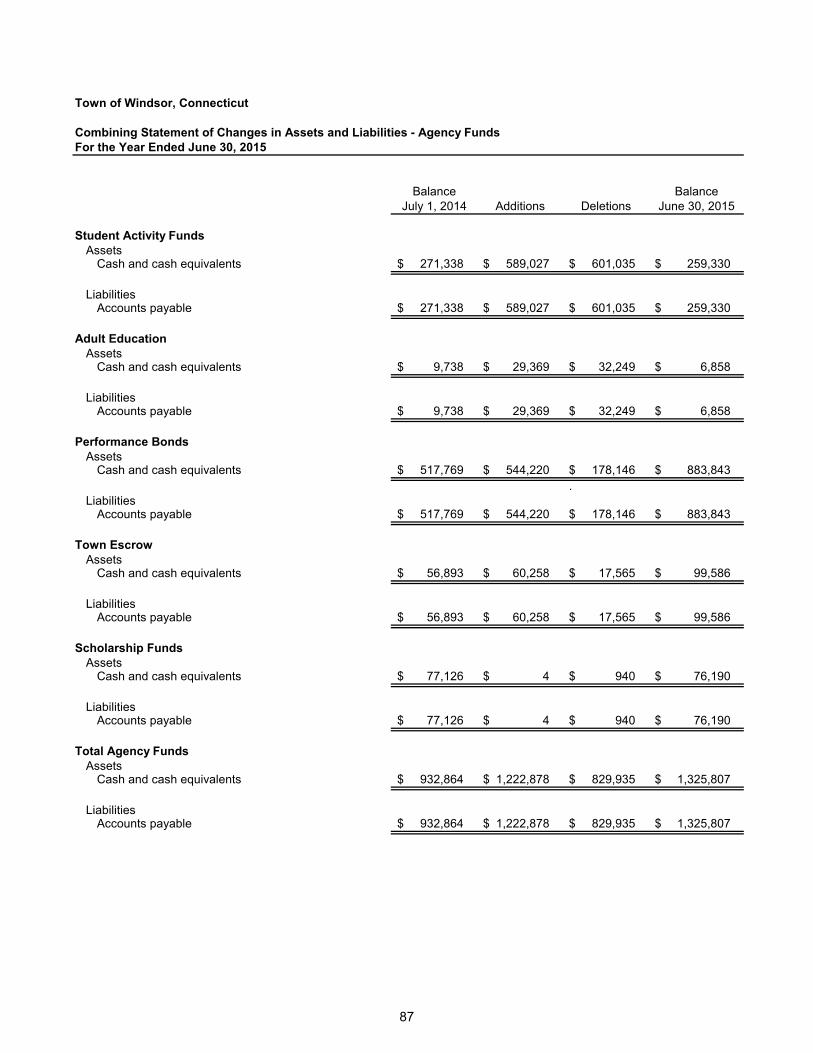
87
Town of Windsor, Connecticut
Balance BalanceJuly 1, 2014 Additions Deletions June 30, 2015
Student Activity FundsAssets
Cash and cash equivalents 271,338 $ 589,027 $ 601,035 $ 259,330 $
LiabilitiesAccounts payable 271,338 $ 589,027 $ 601,035 $ 259,330 $
Adult EducationAssets
Cash and cash equivalents 9,738 $ 29,369 $ 32,249 $ 6,858 $
LiabilitiesAccounts payable 9,738 $ 29,369 $ 32,249 $ 6,858 $
Performance BondsAssets
Cash and cash equivalents 517,769 $ 544,220 $ 178,146 $ 883,843 $ .
LiabilitiesAccounts payable 517,769 $ 544,220 $ 178,146 $ 883,843 $
Town EscrowAssets
Cash and cash equivalents 56,893 $ 60,258 $ 17,565 $ 99,586 $
LiabilitiesAccounts payable 56,893 $ 60,258 $ 17,565 $ 99,586 $
Scholarship FundsAssets
Cash and cash equivalents 77,126 $ 4 $ 940 $ 76,190 $
LiabilitiesAccounts payable 77,126 $ 4 $ 940 $ 76,190 $
Total Agency FundsAssets
Cash and cash equivalents 932,864 $ 1,222,878 $ 829,935 $ 1,325,807 $
LiabilitiesAccounts payable 932,864 $ 1,222,878 $ 829,935 $ 1,325,807 $
Combining Statement of Changes in Assets and Liabilities - Agency FundsFor the Year Ended June 30, 2015

88
This page intentionally left blank.

Capital Asset Schedule

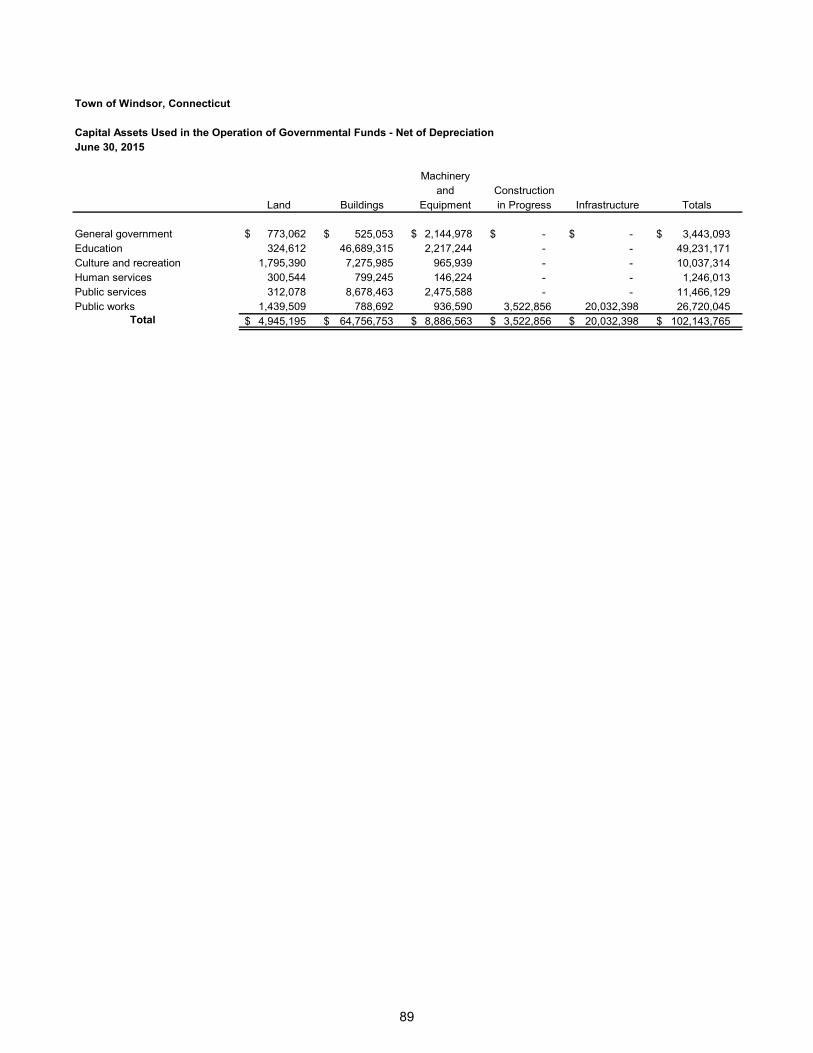
89
Town of Windsor, Connecticut
Capital Assets Used in the Operation of Governmental Funds - Net of DepreciationJune 30, 2015
Machineryand Construction
Land Buildings Equipment in Progress Infrastructure Totals
General government 773,062 $ 525,053 $ 2,144,978 $ -$ -$ 3,443,093 $ Education 324,612 46,689,315 2,217,244 - - 49,231,171 Culture and recreation 1,795,390 7,275,985 965,939 - - 10,037,314 Human services 300,544 799,245 146,224 - - 1,246,013 Public services 312,078 8,678,463 2,475,588 - - 11,466,129 Public works 1,439,509 788,692 936,590 3,522,856 20,032,398 26,720,045
Total 4,945,195 $ 64,756,753 $ 8,886,563 $ 3,522,856 $ 20,032,398 $ 102,143,765 $

90
This page intentionally left blank.

Other Schedules

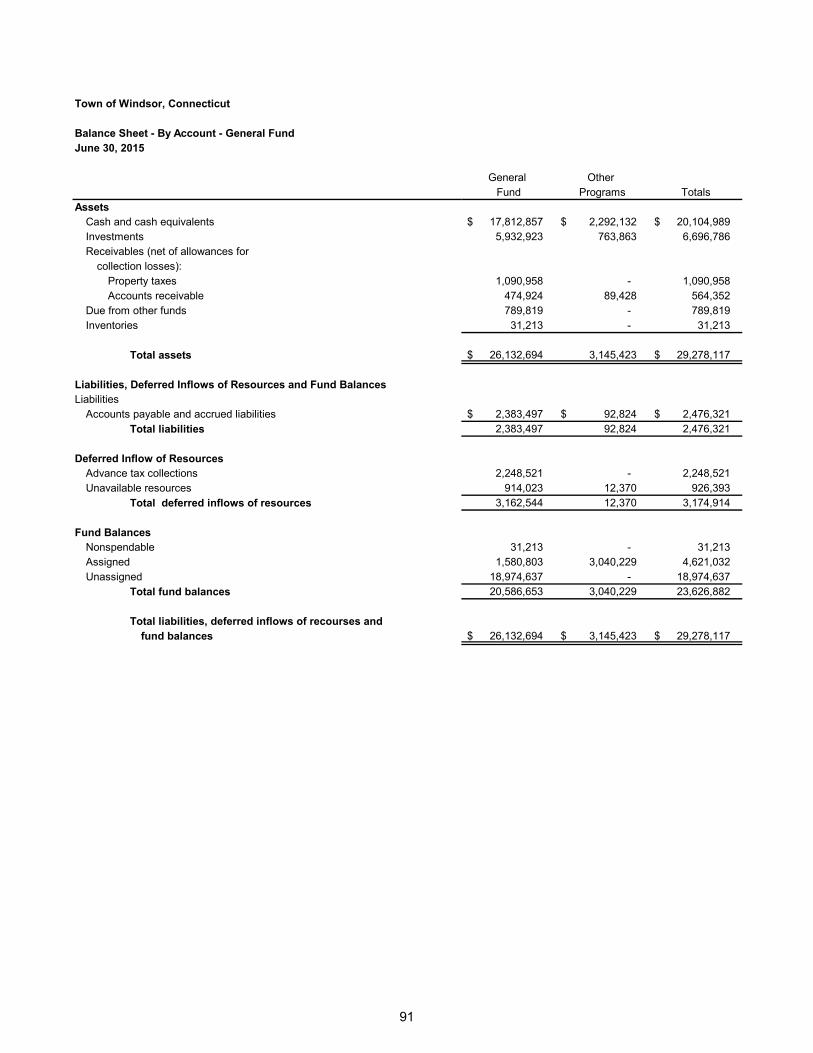
91
Town of Windsor, Connecticut
Balance Sheet - By Account - General FundJune 30, 2015
General Other Fund Programs Totals
AssetsCash and cash equivalents 17,812,857 $ 2,292,132 $ 20,104,989 $ Investments 5,932,923 763,863 6,696,786 Receivables (net of allowances for
collection losses):Property taxes 1,090,958 - 1,090,958 Accounts receivable 474,924 89,428 564,352
Due from other funds 789,819 - 789,819 Inventories 31,213 - 31,213
Total assets 26,132,694 $ 3,145,423 29,278,117 $
Liabilities, Deferred Inflows of Resources and Fund BalancesLiabilities
Accounts payable and accrued liabilities 2,383,497 $ 92,824 $ 2,476,321 $ Total liabilities 2,383,497 92,824 2,476,321
Deferred Inflow of ResourcesAdvance tax collections 2,248,521 - 2,248,521 Unavailable resources 914,023 12,370 926,393
Total deferred inflows of resources 3,162,544 12,370 3,174,914
Fund BalancesNonspendable 31,213 - 31,213 Assigned 1,580,803 3,040,229 4,621,032 Unassigned 18,974,637 - 18,974,637
Total fund balances 20,586,653 3,040,229 23,626,882
Total liabilities, deferred inflows of recourses and fund balances 26,132,694 $ 3,145,423 $ 29,278,117 $
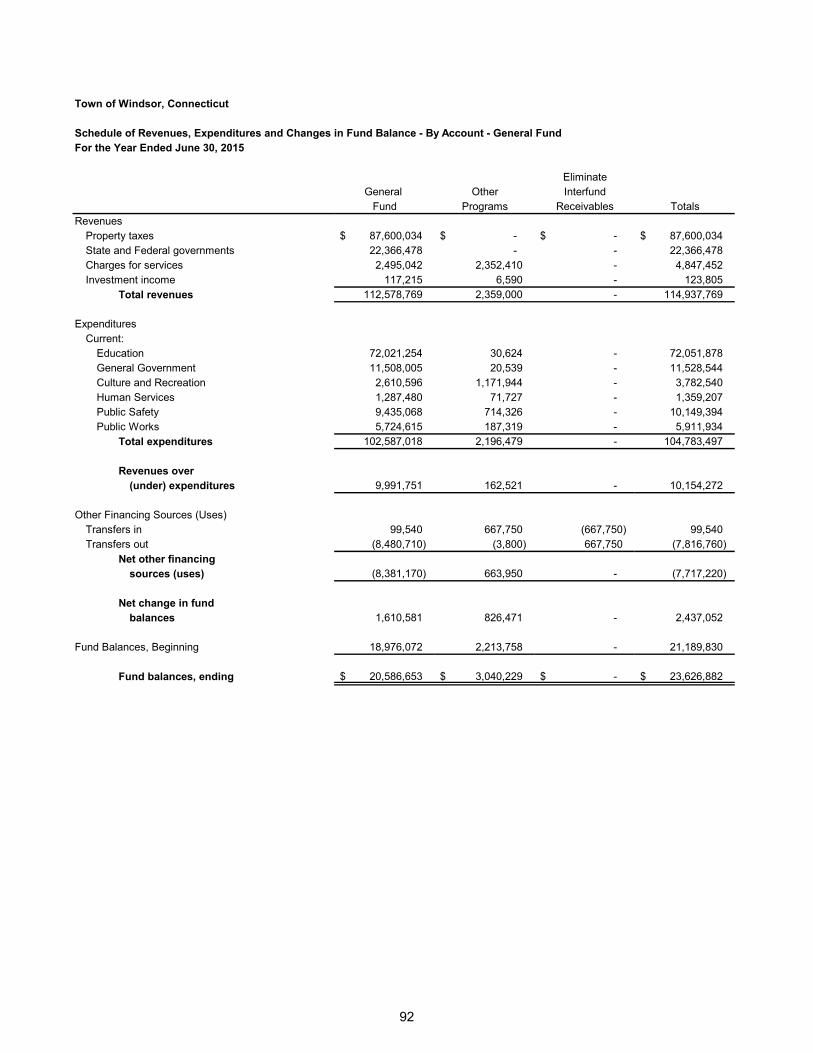
92
Town of Windsor, Connecticut
Schedule of Revenues, Expenditures and Changes in Fund Balance - By Account - General FundFor the Year Ended June 30, 2015
EliminateGeneral Other Interfund
Fund Programs Receivables TotalsRevenues
Property taxes 87,600,034 $ -$ -$ 87,600,034 $ State and Federal governments 22,366,478 - - 22,366,478 Charges for services 2,495,042 2,352,410 - 4,847,452 Investment income 117,215 6,590 - 123,805
Total revenues 112,578,769 2,359,000 - 114,937,769
ExpendituresCurrent:
Education 72,021,254 30,624 - 72,051,878 General Government 11,508,005 20,539 - 11,528,544 Culture and Recreation 2,610,596 1,171,944 - 3,782,540 Human Services 1,287,480 71,727 - 1,359,207 Public Safety 9,435,068 714,326 - 10,149,394 Public Works 5,724,615 187,319 - 5,911,934
Total expenditures 102,587,018 2,196,479 - 104,783,497
Revenues over (under) expenditures 9,991,751 162,521 - 10,154,272
Other Financing Sources (Uses)Transfers in 99,540 667,750 (667,750) 99,540 Transfers out (8,480,710) (3,800) 667,750 (7,816,760)
Net other financing sources (uses) (8,381,170) 663,950 - (7,717,220)
Net change in fund balances 1,610,581 826,471 - 2,437,052
Fund Balances, Beginning 18,976,072 2,213,758 - 21,189,830
Fund balances, ending 20,586,653 $ 3,040,229 $ -$ 23,626,882 $

93
This page intentionally left blank.
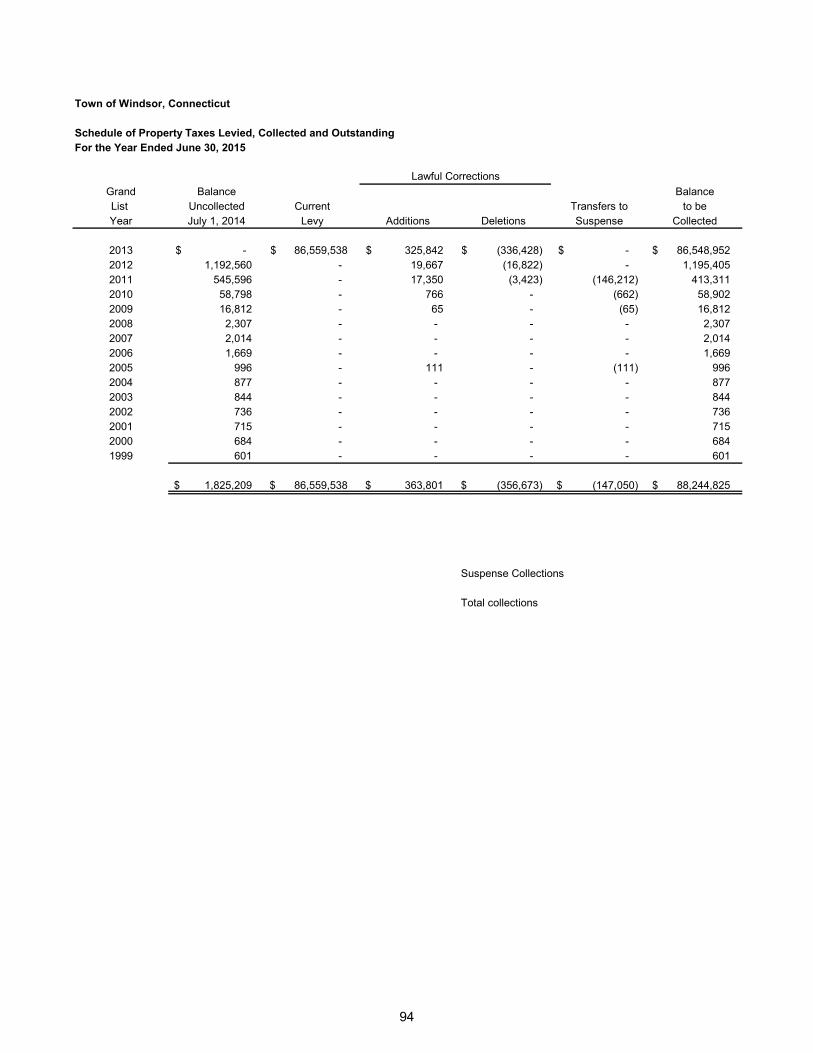
94
Town of Windsor, Connecticut
Schedule of Property Taxes Levied, Collected and OutstandingFor the Year Ended June 30, 2015
Grand Balance BalanceList Uncollected Current Transfers to to beYear July 1, 2014 Levy Additions Deletions Suspense Collected
2013 -$ 86,559,538 $ 325,842 $ (336,428) $ -$ 86,548,952 $ 2012 1,192,560 - 19,667 (16,822) - 1,195,405 2011 545,596 - 17,350 (3,423) (146,212) 413,311 2010 58,798 - 766 - (662) 58,902 2009 16,812 - 65 - (65) 16,812 2008 2,307 - - - - 2,307 2007 2,014 - - - - 2,014 2006 1,669 - - - - 1,669 2005 996 - 111 - (111) 996 2004 877 - - - - 877 2003 844 - - - - 844 2002 736 - - - - 736 2001 715 - - - - 715 2000 684 - - - - 684 1999 601 - - - - 601
1,825,209 $ 86,559,538 $ 363,801 $ (356,673) $ (147,050) $ 88,244,825 $
Suspense Collections
Total collections
Lawful Corrections
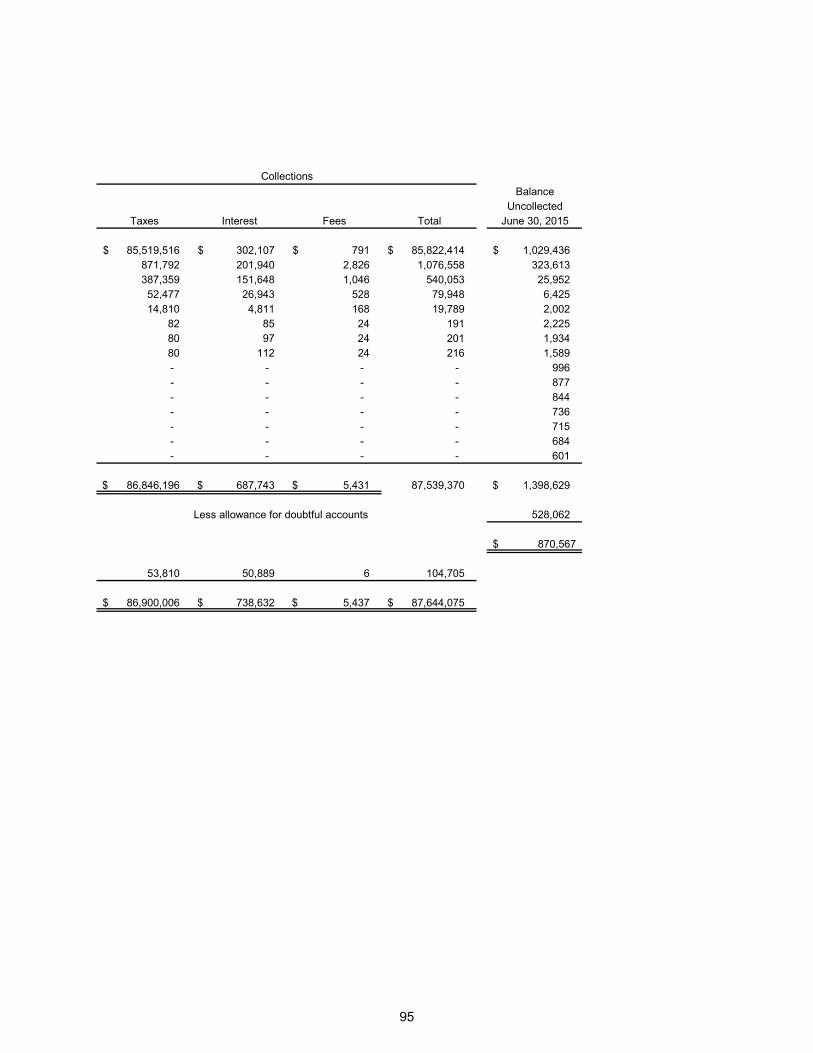
95
BalanceUncollected
Taxes Interest Fees Total June 30, 2015
85,519,516 $ 302,107 $ 791 $ 85,822,414 $ 1,029,436 $ 871,792 201,940 2,826 1,076,558 323,613 387,359 151,648 1,046 540,053 25,952 52,477 26,943 528 79,948 6,425 14,810 4,811 168 19,789 2,002
82 85 24 191 2,225 80 97 24 201 1,934 80 112 24 216 1,589 - - - - 996 - - - - 877 - - - - 844 - - - - 736 - - - - 715 - - - - 684 - - - - 601
86,846,196 $ 687,743 $ 5,431 $ 87,539,370 1,398,629 $
Less allowance for doubtful accounts 528,062
870,567$
53,810 50,889 6 104,705
86,900,006 $ 738,632 $ 5,437 $ 87,644,075 $
Collections
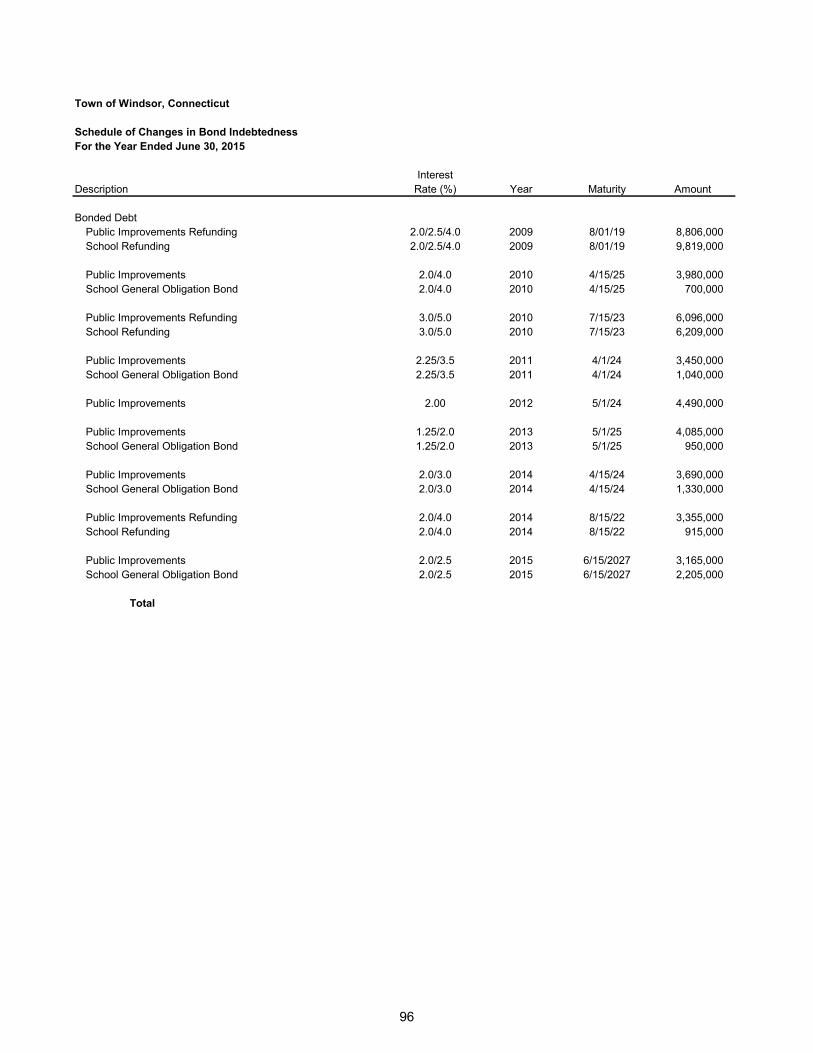
96
Town of Windsor, Connecticut
Schedule of Changes in Bond IndebtednessFor the Year Ended June 30, 2015
InterestDescription Rate (%) Year Maturity Amount
Bonded DebtPublic Improvements Refunding 2.0/2.5/4.0 2009 8/01/19 8,806,000 School Refunding 2.0/2.5/4.0 2009 8/01/19 9,819,000
Public Improvements 2.0/4.0 2010 4/15/25 3,980,000 School General Obligation Bond 2.0/4.0 2010 4/15/25 700,000
Public Improvements Refunding 3.0/5.0 2010 7/15/23 6,096,000 School Refunding 3.0/5.0 2010 7/15/23 6,209,000
Public Improvements 2.25/3.5 2011 4/1/24 3,450,000 School General Obligation Bond 2.25/3.5 2011 4/1/24 1,040,000
Public Improvements 2.00 2012 5/1/24 4,490,000
Public Improvements 1.25/2.0 2013 5/1/25 4,085,000 School General Obligation Bond 1.25/2.0 2013 5/1/25 950,000
Public Improvements 2.0/3.0 2014 4/15/24 3,690,000 School General Obligation Bond 2.0/3.0 2014 4/15/24 1,330,000
Public Improvements Refunding 2.0/4.0 2014 8/15/22 3,355,000 School Refunding 2.0/4.0 2014 8/15/22 915,000
Public Improvements 2.0/2.5 2015 6/15/2027 3,165,000 School General Obligation Bond 2.0/2.5 2015 6/15/2027 2,205,000
Total
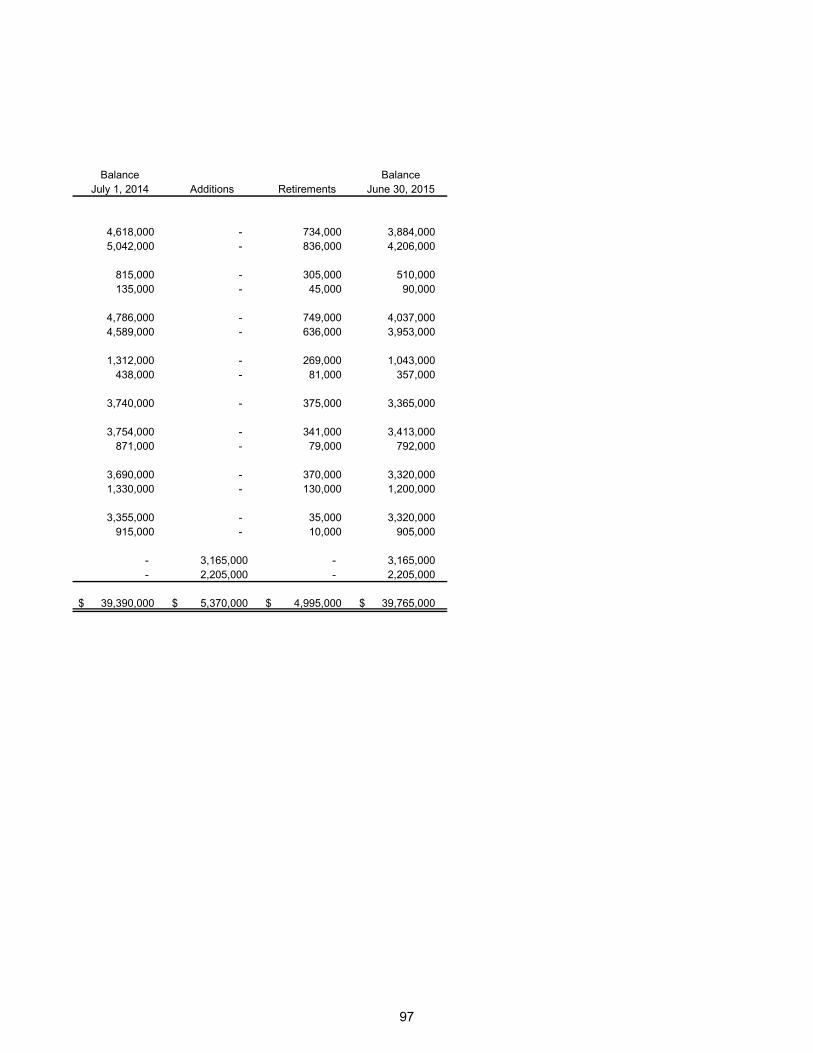
97
Balance BalanceJuly 1, 2014 Additions Retirements June 30, 2015
4,618,000 - 734,000 3,884,000 5,042,000 - 836,000 4,206,000
815,000 - 305,000 510,000 135,000 - 45,000 90,000
4,786,000 - 749,000 4,037,000 4,589,000 - 636,000 3,953,000
1,312,000 - 269,000 1,043,000 438,000 - 81,000 357,000
3,740,000 - 375,000 3,365,000
3,754,000 - 341,000 3,413,000 871,000 - 79,000 792,000
3,690,000 - 370,000 3,320,000 1,330,000 - 130,000 1,200,000
3,355,000 - 35,000 3,320,000 915,000 - 10,000 905,000
- 3,165,000 - 3,165,000 - 2,205,000 - 2,205,000
39,390,000 $ 5,370,000 $ 4,995,000 $ 39,765,000 $

98
This page intentionally left blank

Statistical Section
Statistical Section - unaudited
This part of the Town of Windsor, Connecticut’s comprehensive annual financial report presents detailed information as a context for understanding what the information in the financial statements, note disclosures, and required supplementary information says about the government’s overall financial health. Contents Financial Trends
These schedules contain trend information to help the reader understand how the government’s financial performance and well-being have changed over time.
Revenue Capacity
These schedules contain information to help the reader assess the government’s most significant local revenue source, the property tax.
Debt Capacity
These schedules present information to help the reader assess the affordability of the government’s current levels of outstanding debt and the government’s ability to issue additional debt in the future.
Demographic and Economic Information
These schedules offer demographic and economic indicators to help the reader understand the environment within which the government’s financial activities take place.
Operating Information
These schedules contain service and infrastructure data to help the reader understand how the information in the government’s financial report relates to the services the government provides and the activities it performs.
The accompanying tables are presented in the above order. Refer to the Table of Contents for applicable page number locations.

99
This page intentionally left blank.
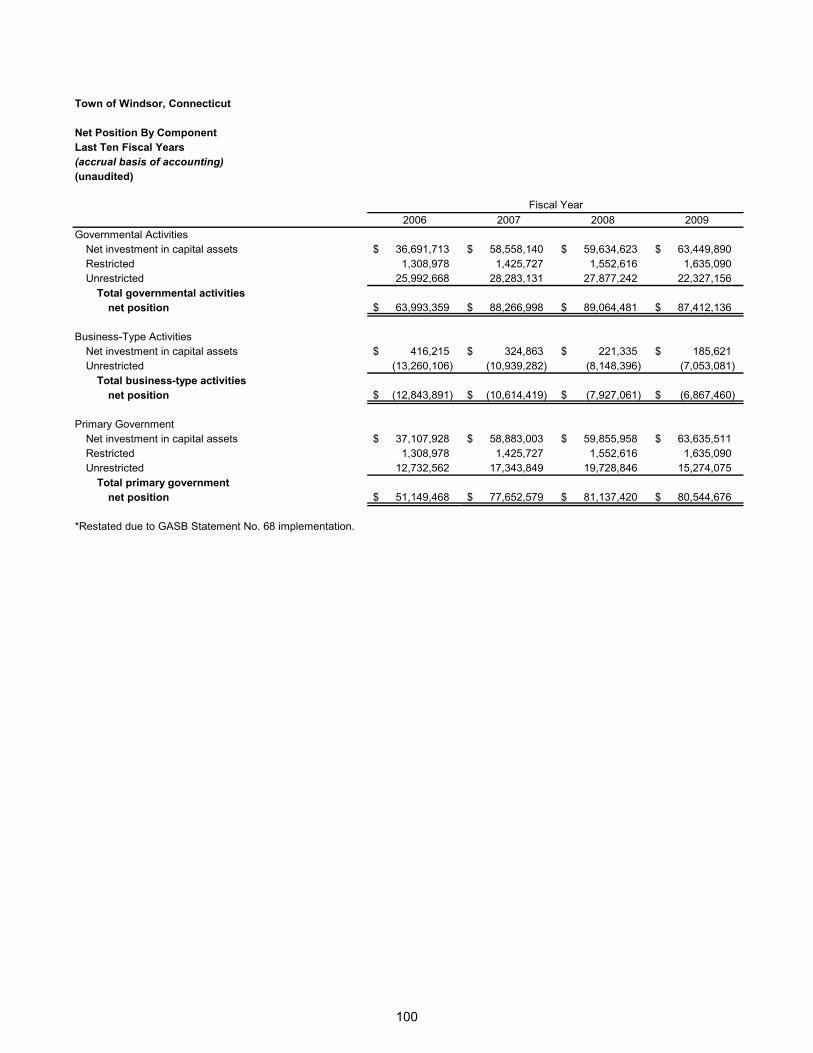
100
Town of Windsor, Connecticut
Net Position By ComponentLast Ten Fiscal Years(accrual basis of accounting)(unaudited)
2006 2007 2008 2009Governmental Activities
Net investment in capital assets 36,691,713 $ 58,558,140 $ 59,634,623 $ 63,449,890 $ Restricted 1,308,978 1,425,727 1,552,616 1,635,090 Unrestricted 25,992,668 28,283,131 27,877,242 22,327,156
Total governmental activities net position 63,993,359 $ 88,266,998 $ 89,064,481 $ 87,412,136 $
Business-Type ActivitiesNet investment in capital assets 416,215 $ 324,863 $ 221,335 $ 185,621 $ Unrestricted (13,260,106) (10,939,282) (8,148,396) (7,053,081)
Total business-type activities net position (12,843,891) $ (10,614,419) $ (7,927,061) $ (6,867,460) $
Primary GovernmentNet investment in capital assets 37,107,928 $ 58,883,003 $ 59,855,958 $ 63,635,511 $ Restricted 1,308,978 1,425,727 1,552,616 1,635,090 Unrestricted 12,732,562 17,343,849 19,728,846 15,274,075
Total primary government net position 51,149,468 $ 77,652,579 $ 81,137,420 $ 80,544,676 $
*Restated due to GASB Statement No. 68 implementation.
Fiscal Year
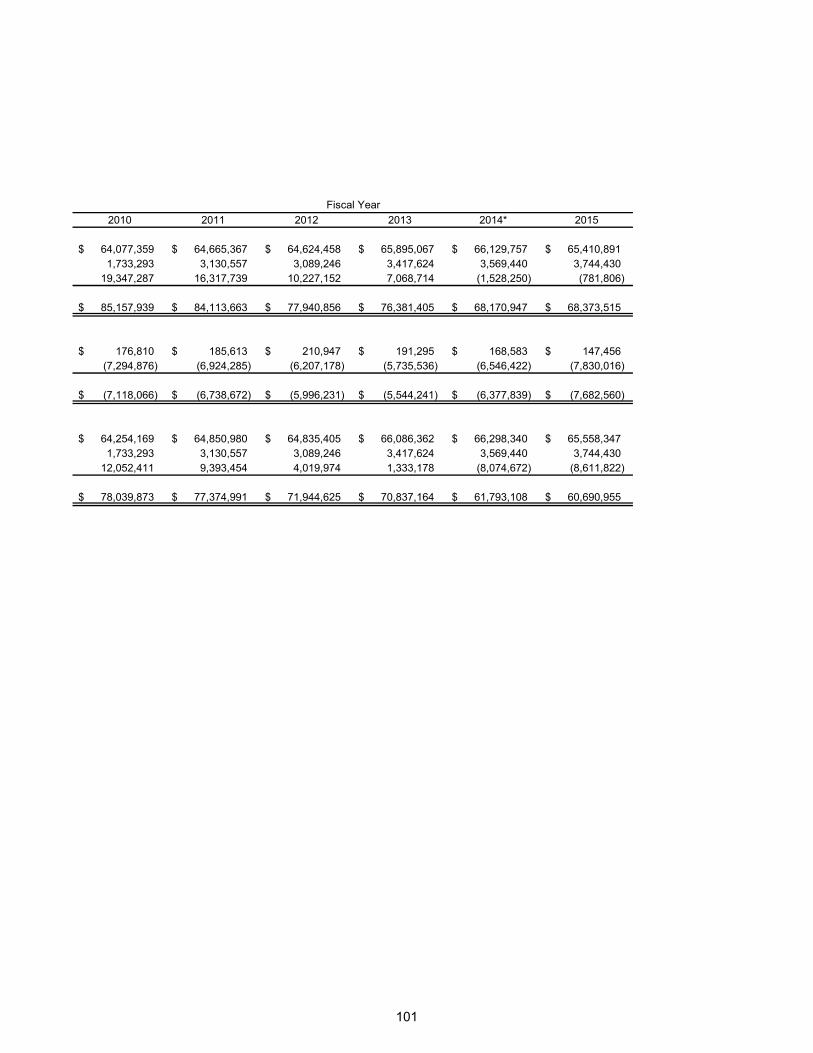
101
2010 2011 2012 2013 2014* 2015
64,077,359 $ 64,665,367 $ 64,624,458 $ 65,895,067 $ 66,129,757 $ 65,410,891 $ 1,733,293 3,130,557 3,089,246 3,417,624 3,569,440 3,744,430
19,347,287 16,317,739 10,227,152 7,068,714 (1,528,250) (781,806)
85,157,939 $ 84,113,663 $ 77,940,856 $ 76,381,405 $ 68,170,947 $ 68,373,515 $
176,810 $ 185,613 $ 210,947 $ 191,295 $ 168,583 $ 147,456 $ (7,294,876) (6,924,285) (6,207,178) (5,735,536) (6,546,422) (7,830,016)
(7,118,066) $ (6,738,672) $ (5,996,231) $ (5,544,241) $ (6,377,839) $ (7,682,560) $
64,254,169 $ 64,850,980 $ 64,835,405 $ 66,086,362 $ 66,298,340 $ 65,558,347 $ 1,733,293 3,130,557 3,089,246 3,417,624 3,569,440 3,744,430
12,052,411 9,393,454 4,019,974 1,333,178 (8,074,672) (8,611,822)
78,039,873 $ 77,374,991 $ 71,944,625 $ 70,837,164 $ 61,793,108 $ 60,690,955 $
Fiscal Year
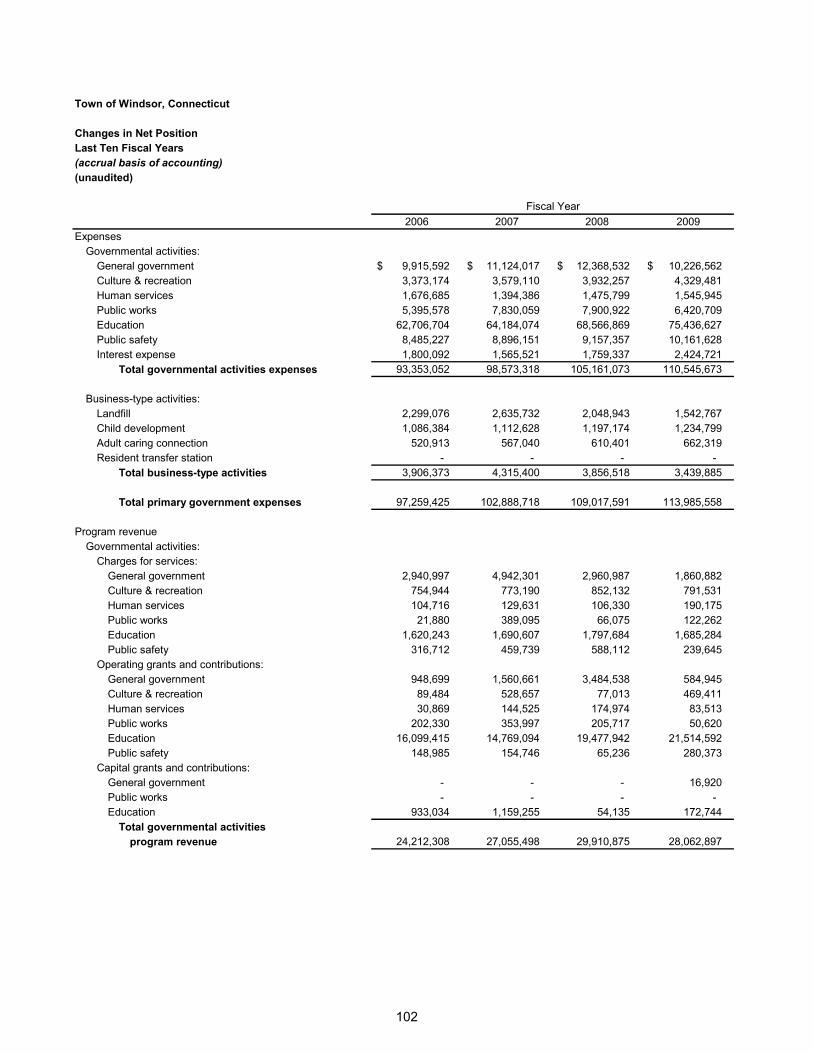
102
Town of Windsor, Connecticut
Changes in Net PositionLast Ten Fiscal Years(accrual basis of accounting)(unaudited)
2006 2007 2008 2009Expenses
Governmental activities:General government 9,915,592 $ 11,124,017 $ 12,368,532 $ 10,226,562 $ Culture & recreation 3,373,174 3,579,110 3,932,257 4,329,481 Human services 1,676,685 1,394,386 1,475,799 1,545,945 Public works 5,395,578 7,830,059 7,900,922 6,420,709 Education 62,706,704 64,184,074 68,566,869 75,436,627 Public safety 8,485,227 8,896,151 9,157,357 10,161,628 Interest expense 1,800,092 1,565,521 1,759,337 2,424,721
Total governmental activities expenses 93,353,052 98,573,318 105,161,073 110,545,673
Business-type activities:Landfill 2,299,076 2,635,732 2,048,943 1,542,767 Child development 1,086,384 1,112,628 1,197,174 1,234,799 Adult caring connection 520,913 567,040 610,401 662,319 Resident transfer station - - - -
Total business-type activities 3,906,373 4,315,400 3,856,518 3,439,885
Total primary government expenses 97,259,425 102,888,718 109,017,591 113,985,558
Program revenueGovernmental activities:
Charges for services:General government 2,940,997 4,942,301 2,960,987 1,860,882 Culture & recreation 754,944 773,190 852,132 791,531 Human services 104,716 129,631 106,330 190,175 Public works 21,880 389,095 66,075 122,262 Education 1,620,243 1,690,607 1,797,684 1,685,284 Public safety 316,712 459,739 588,112 239,645
Operating grants and contributions:General government 948,699 1,560,661 3,484,538 584,945 Culture & recreation 89,484 528,657 77,013 469,411 Human services 30,869 144,525 174,974 83,513 Public works 202,330 353,997 205,717 50,620 Education 16,099,415 14,769,094 19,477,942 21,514,592 Public safety 148,985 154,746 65,236 280,373
Capital grants and contributions:General government - - - 16,920 Public works - - - - Education 933,034 1,159,255 54,135 172,744
Total governmental activitiesprogram revenue 24,212,308 27,055,498 29,910,875 28,062,897
Fiscal Year
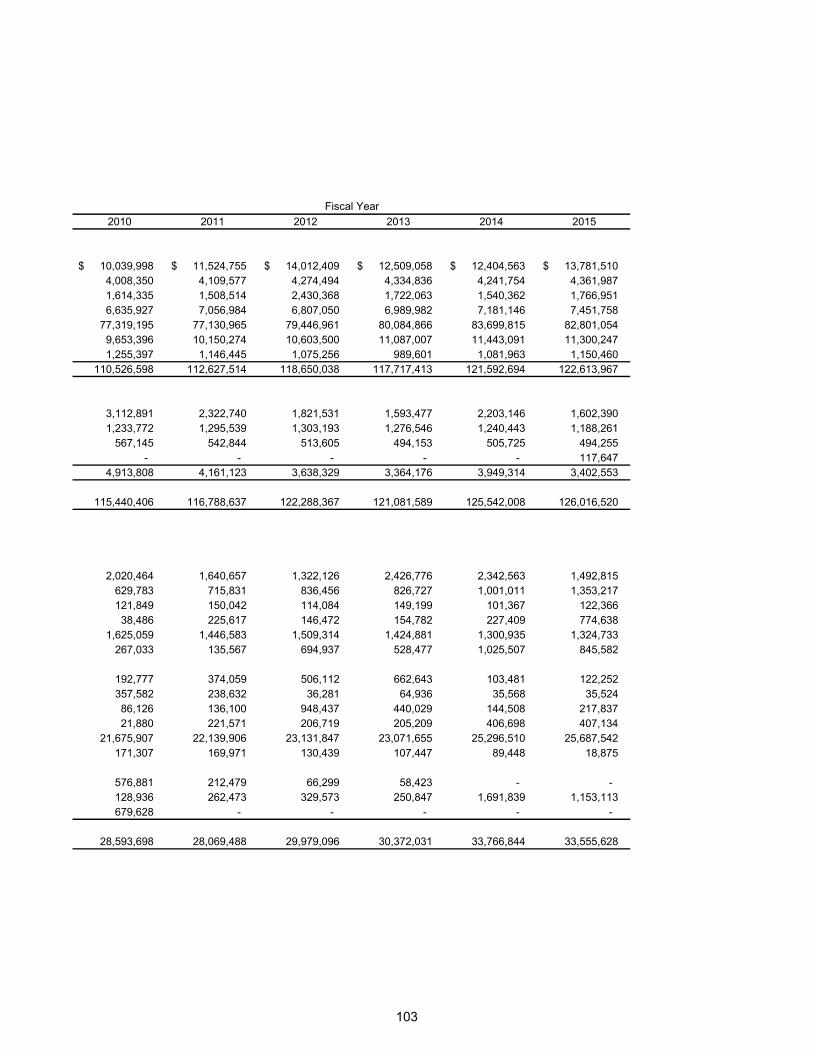
103
2010 2011 2012 2013 2014 2015
10,039,998 $ 11,524,755 $ 14,012,409 $ 12,509,058 $ 12,404,563 $ 13,781,510 $ 4,008,350 4,109,577 4,274,494 4,334,836 4,241,754 4,361,987 1,614,335 1,508,514 2,430,368 1,722,063 1,540,362 1,766,951 6,635,927 7,056,984 6,807,050 6,989,982 7,181,146 7,451,758
77,319,195 77,130,965 79,446,961 80,084,866 83,699,815 82,801,054 9,653,396 10,150,274 10,603,500 11,087,007 11,443,091 11,300,247 1,255,397 1,146,445 1,075,256 989,601 1,081,963 1,150,460
110,526,598 112,627,514 118,650,038 117,717,413 121,592,694 122,613,967
3,112,891 2,322,740 1,821,531 1,593,477 2,203,146 1,602,390 1,233,772 1,295,539 1,303,193 1,276,546 1,240,443 1,188,261
567,145 542,844 513,605 494,153 505,725 494,255 - - - - - 117,647
4,913,808 4,161,123 3,638,329 3,364,176 3,949,314 3,402,553
115,440,406 116,788,637 122,288,367 121,081,589 125,542,008 126,016,520
2,020,464 1,640,657 1,322,126 2,426,776 2,342,563 1,492,815 629,783 715,831 836,456 826,727 1,001,011 1,353,217 121,849 150,042 114,084 149,199 101,367 122,366 38,486 225,617 146,472 154,782 227,409 774,638
1,625,059 1,446,583 1,509,314 1,424,881 1,300,935 1,324,733 267,033 135,567 694,937 528,477 1,025,507 845,582
192,777 374,059 506,112 662,643 103,481 122,252 357,582 238,632 36,281 64,936 35,568 35,524 86,126 136,100 948,437 440,029 144,508 217,837 21,880 221,571 206,719 205,209 406,698 407,134
21,675,907 22,139,906 23,131,847 23,071,655 25,296,510 25,687,542 171,307 169,971 130,439 107,447 89,448 18,875
576,881 212,479 66,299 58,423 - - 128,936 262,473 329,573 250,847 1,691,839 1,153,113 679,628 - - - - -
28,593,698 28,069,488 29,979,096 30,372,031 33,766,844 33,555,628
Fiscal Year
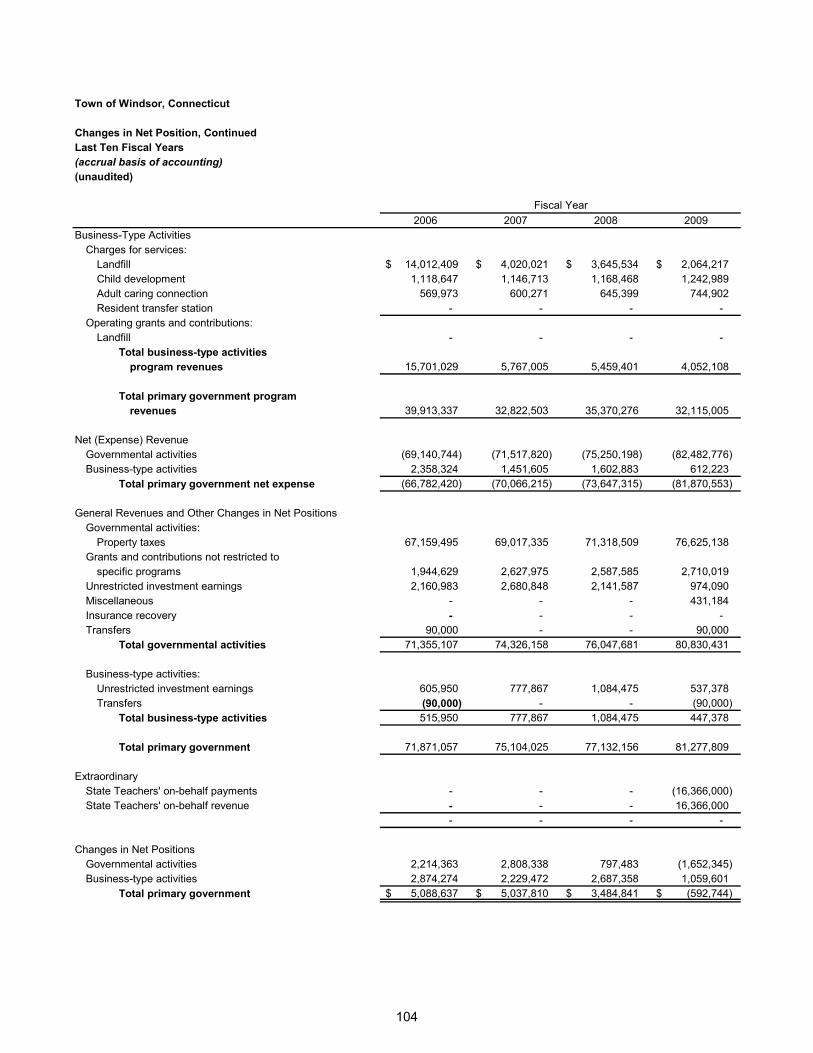
104
Town of Windsor, Connecticut
Changes in Net Position, ContinuedLast Ten Fiscal Years(accrual basis of accounting)(unaudited)
2006 2007 2008 2009Business-Type Activities
Charges for services:Landfill 14,012,409 $ 4,020,021 $ 3,645,534 $ 2,064,217 $ Child development 1,118,647 1,146,713 1,168,468 1,242,989 Adult caring connection 569,973 600,271 645,399 744,902 Resident transfer station - - - -
Operating grants and contributions:Landfill - - - -
Total business-type activitiesprogram revenues 15,701,029 5,767,005 5,459,401 4,052,108
Total primary government programrevenues 39,913,337 32,822,503 35,370,276 32,115,005
Net (Expense) RevenueGovernmental activities (69,140,744) (71,517,820) (75,250,198) (82,482,776) Business-type activities 2,358,324 1,451,605 1,602,883 612,223
Total primary government net expense (66,782,420) (70,066,215) (73,647,315) (81,870,553)
General Revenues and Other Changes in Net PositionsGovernmental activities:
Property taxes 67,159,495 69,017,335 71,318,509 76,625,138 Grants and contributions not restricted to
specific programs 1,944,629 2,627,975 2,587,585 2,710,019 Unrestricted investment earnings 2,160,983 2,680,848 2,141,587 974,090 Miscellaneous - - - 431,184 Insurance recovery - - - - Transfers 90,000 - - 90,000
Total governmental activities 71,355,107 74,326,158 76,047,681 80,830,431
Business-type activities:Unrestricted investment earnings 605,950 777,867 1,084,475 537,378 Transfers (90,000) - - (90,000)
Total business-type activities 515,950 777,867 1,084,475 447,378
Total primary government 71,871,057 75,104,025 77,132,156 81,277,809
ExtraordinaryState Teachers' on-behalf payments - - - (16,366,000) State Teachers' on-behalf revenue - - - 16,366,000
- - - -
Changes in Net PositionsGovernmental activities 2,214,363 2,808,338 797,483 (1,652,345) Business-type activities 2,874,274 2,229,472 2,687,358 1,059,601
Total primary government 5,088,637 $ 5,037,810 $ 3,484,841 $ (592,744) $
Fiscal Year
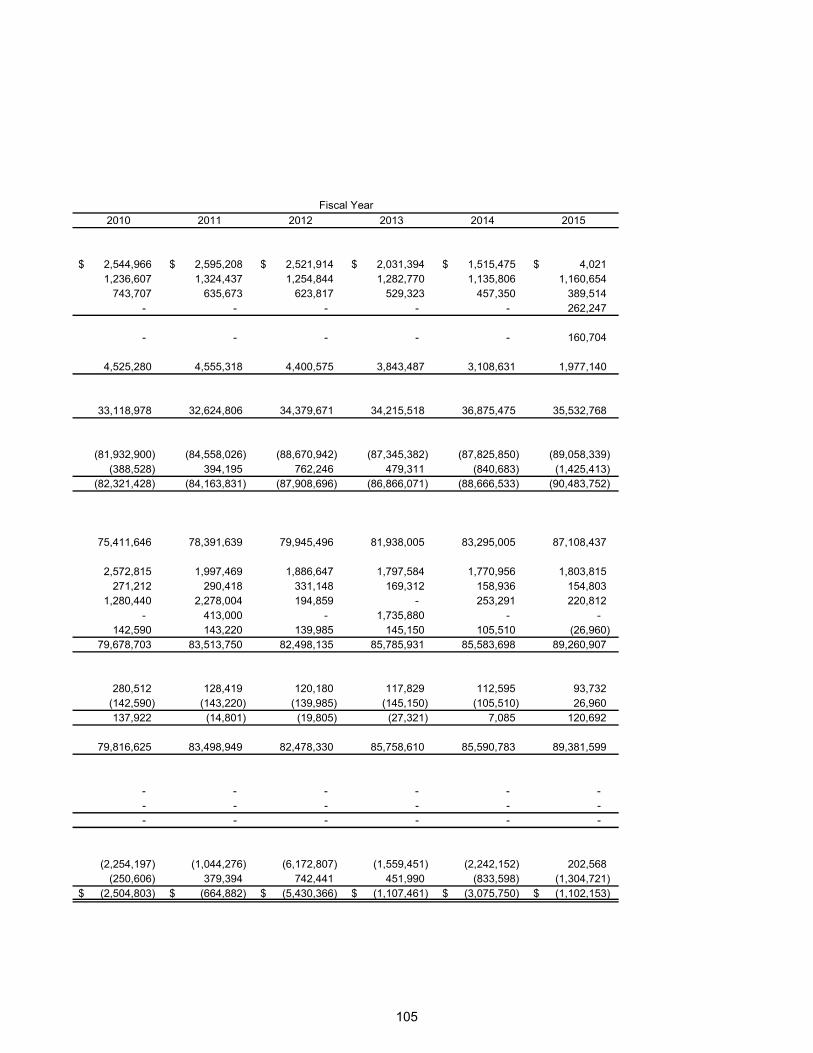
105
2010 2011 2012 2013 2014 2015
2,544,966 $ 2,595,208 $ 2,521,914 $ 2,031,394 $ 1,515,475 $ 4,021 $ 1,236,607 1,324,437 1,254,844 1,282,770 1,135,806 1,160,654
743,707 635,673 623,817 529,323 457,350 389,514 - - - - - 262,247
- - - - - 160,704
4,525,280 4,555,318 4,400,575 3,843,487 3,108,631 1,977,140
33,118,978 32,624,806 34,379,671 34,215,518 36,875,475 35,532,768
(81,932,900) (84,558,026) (88,670,942) (87,345,382) (87,825,850) (89,058,339) (388,528) 394,195 762,246 479,311 (840,683) (1,425,413)
(82,321,428) (84,163,831) (87,908,696) (86,866,071) (88,666,533) (90,483,752)
75,411,646 78,391,639 79,945,496 81,938,005 83,295,005 87,108,437
2,572,815 1,997,469 1,886,647 1,797,584 1,770,956 1,803,815 271,212 290,418 331,148 169,312 158,936 154,803
1,280,440 2,278,004 194,859 - 253,291 220,812 - 413,000 - 1,735,880 - -
142,590 143,220 139,985 145,150 105,510 (26,960) 79,678,703 83,513,750 82,498,135 85,785,931 85,583,698 89,260,907
280,512 128,419 120,180 117,829 112,595 93,732 (142,590) (143,220) (139,985) (145,150) (105,510) 26,960 137,922 (14,801) (19,805) (27,321) 7,085 120,692
79,816,625 83,498,949 82,478,330 85,758,610 85,590,783 89,381,599
- - - - - - - - - - - - - - - - - -
(2,254,197) (1,044,276) (6,172,807) (1,559,451) (2,242,152) 202,568 (250,606) 379,394 742,441 451,990 (833,598) (1,304,721)
(2,504,803) $ (664,882) $ (5,430,366) $ (1,107,461) $ (3,075,750) $ (1,102,153) $
Fiscal Year
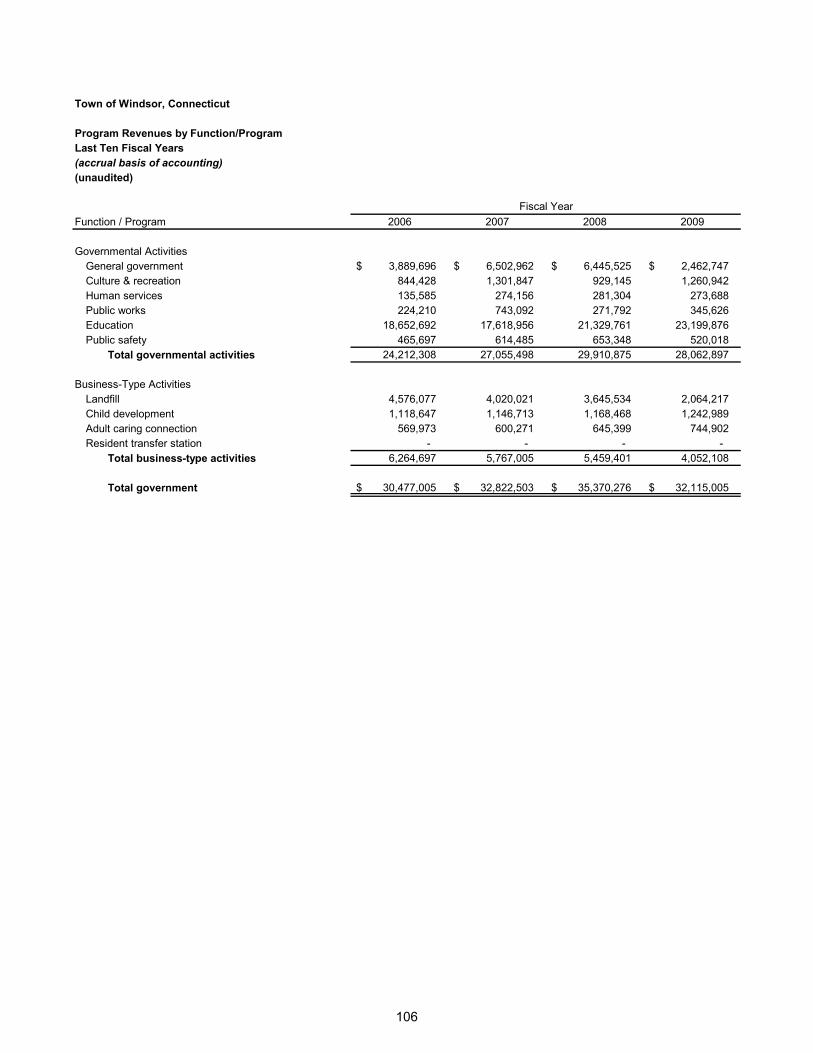
106
Town of Windsor, Connecticut
Program Revenues by Function/ProgramLast Ten Fiscal Years(accrual basis of accounting)(unaudited)
Function / Program 2006 2007 2008 2009
Governmental ActivitiesGeneral government 3,889,696 $ 6,502,962 $ 6,445,525 $ 2,462,747 $ Culture & recreation 844,428 1,301,847 929,145 1,260,942 Human services 135,585 274,156 281,304 273,688 Public works 224,210 743,092 271,792 345,626 Education 18,652,692 17,618,956 21,329,761 23,199,876 Public safety 465,697 614,485 653,348 520,018
Total governmental activities 24,212,308 27,055,498 29,910,875 28,062,897
Business-Type ActivitiesLandfill 4,576,077 4,020,021 3,645,534 2,064,217 Child development 1,118,647 1,146,713 1,168,468 1,242,989 Adult caring connection 569,973 600,271 645,399 744,902 Resident transfer station - - - -
Total business-type activities 6,264,697 5,767,005 5,459,401 4,052,108
Total government 30,477,005 $ 32,822,503 $ 35,370,276 $ 32,115,005 $
Fiscal Year
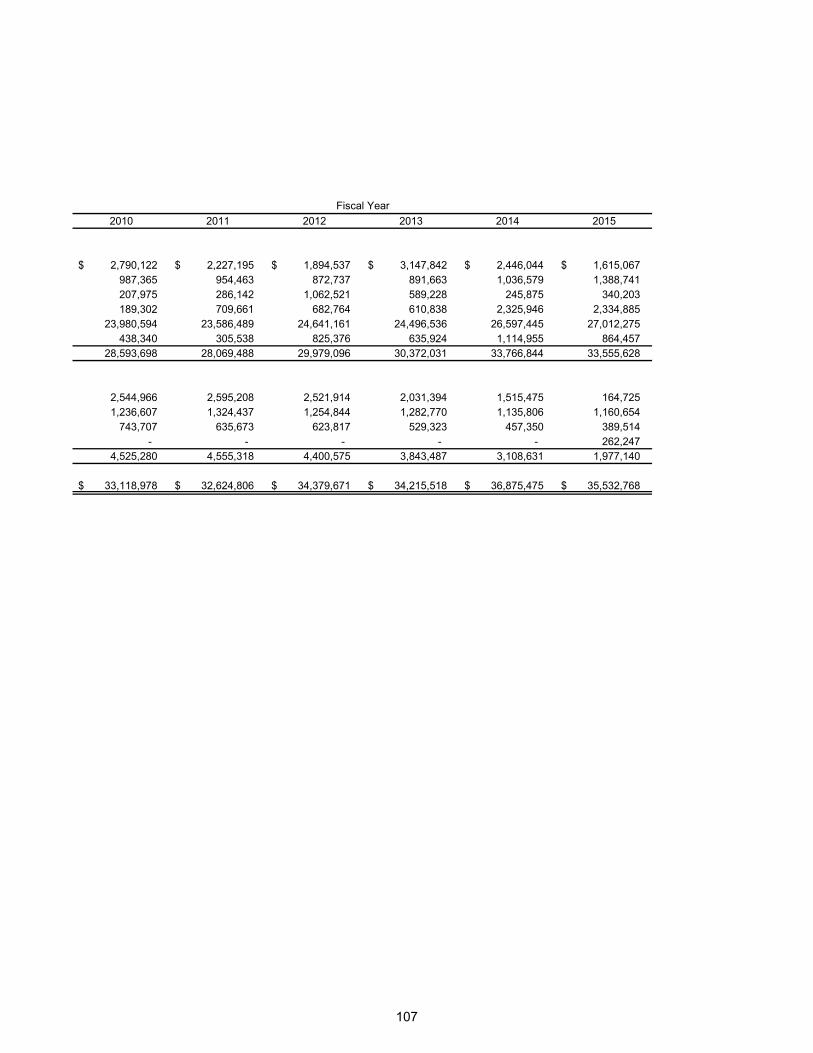
107
2010 2011 2012 2013 2014 2015
2,790,122 $ 2,227,195 $ 1,894,537 $ 3,147,842 $ 2,446,044 $ 1,615,067 $ 987,365 954,463 872,737 891,663 1,036,579 1,388,741 207,975 286,142 1,062,521 589,228 245,875 340,203 189,302 709,661 682,764 610,838 2,325,946 2,334,885
23,980,594 23,586,489 24,641,161 24,496,536 26,597,445 27,012,275 438,340 305,538 825,376 635,924 1,114,955 864,457
28,593,698 28,069,488 29,979,096 30,372,031 33,766,844 33,555,628
2,544,966 2,595,208 2,521,914 2,031,394 1,515,475 164,725 1,236,607 1,324,437 1,254,844 1,282,770 1,135,806 1,160,654
743,707 635,673 623,817 529,323 457,350 389,514 - - - - - 262,247
4,525,280 4,555,318 4,400,575 3,843,487 3,108,631 1,977,140
33,118,978 $ 32,624,806 $ 34,379,671 $ 34,215,518 $ 36,875,475 $ 35,532,768 $
Fiscal Year
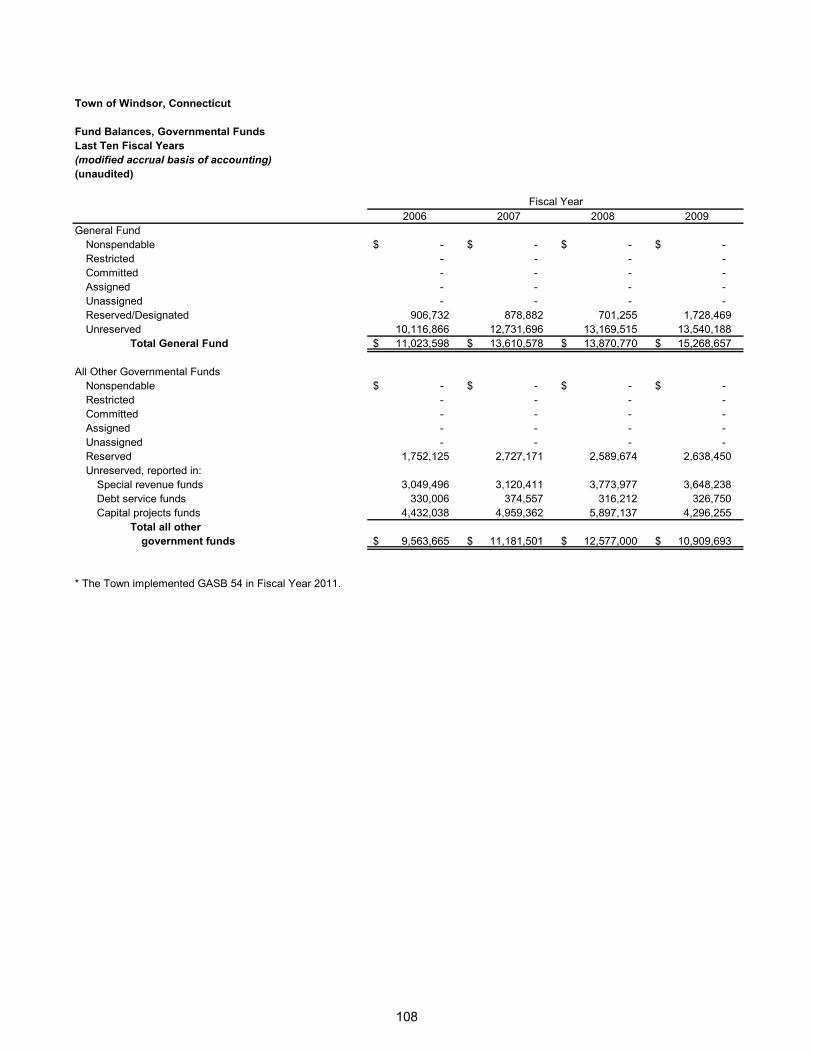
108
Town of Windsor, Connecticut
Fund Balances, Governmental FundsLast Ten Fiscal Years(modified accrual basis of accounting)(unaudited)
2006 2007 2008 2009General Fund
Nonspendable -$ -$ -$ -$ Restricted - - - - Committed - - - - Assigned - - - - Unassigned - - - - Reserved/Designated 906,732 878,882 701,255 1,728,469 Unreserved 10,116,866 12,731,696 13,169,515 13,540,188
Total General Fund 11,023,598 $ 13,610,578 $ 13,870,770 $ 15,268,657 $
All Other Governmental FundsNonspendable -$ -$ -$ -$ Restricted - - - - Committed - - - - Assigned - - - - Unassigned - - - - Reserved 1,752,125 2,727,171 2,589,674 2,638,450 Unreserved, reported in:
Special revenue funds 3,049,496 3,120,411 3,773,977 3,648,238 Debt service funds 330,006 374,557 316,212 326,750 Capital projects funds 4,432,038 4,959,362 5,897,137 4,296,255
Total all other government funds 9,563,665 $ 11,181,501 $ 12,577,000 $ 10,909,693 $
* The Town implemented GASB 54 in Fiscal Year 2011.
Fiscal Year
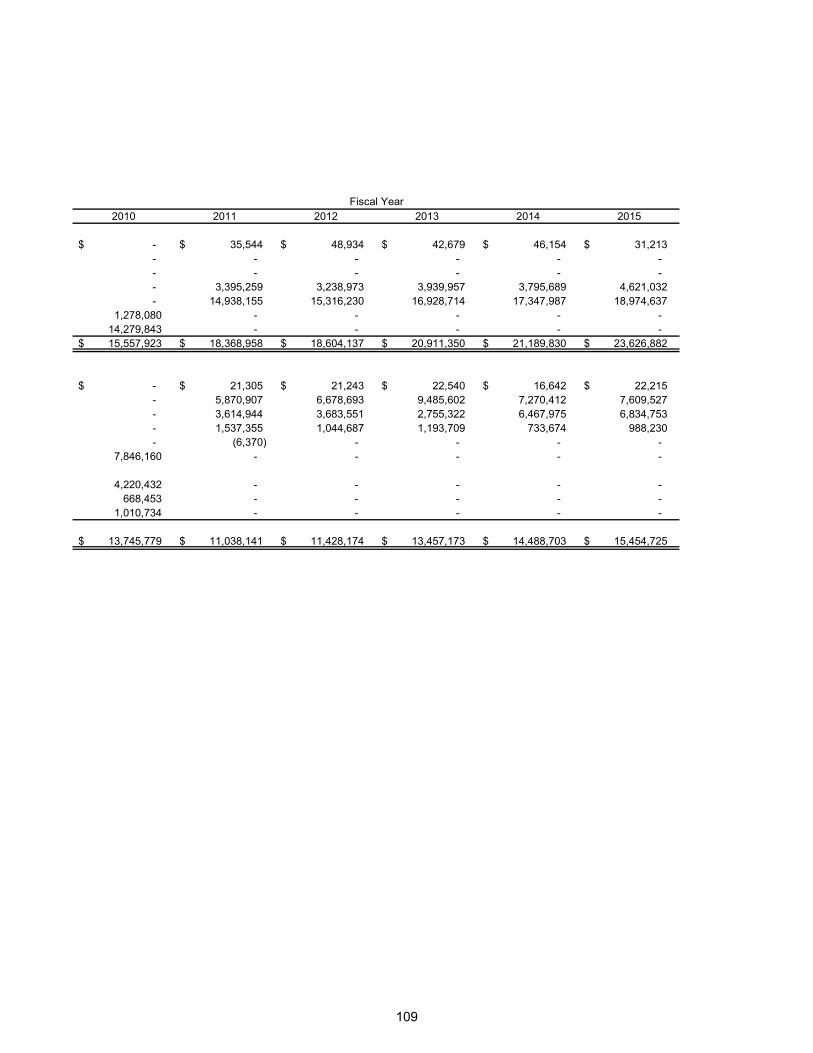
109
2010 2011 2012 2013 2014 2015
-$ 35,544 $ 48,934 $ 42,679 $ 46,154 $ 31,213 $ - - - - - - - - - - - - - 3,395,259 3,238,973 3,939,957 3,795,689 4,621,032 - 14,938,155 15,316,230 16,928,714 17,347,987 18,974,637
1,278,080 - - - - - 14,279,843 - - - - - 15,557,923 $ 18,368,958 $ 18,604,137 $ 20,911,350 $ 21,189,830 $ 23,626,882 $
-$ 21,305 $ 21,243 $ 22,540 $ 16,642 $ 22,215 $ - 5,870,907 6,678,693 9,485,602 7,270,412 7,609,527 - 3,614,944 3,683,551 2,755,322 6,467,975 6,834,753 - 1,537,355 1,044,687 1,193,709 733,674 988,230 - (6,370) - - - -
7,846,160 - - - - -
4,220,432 - - - - - 668,453 - - - - -
1,010,734 - - - - -
13,745,779 $ 11,038,141 $ 11,428,174 $ 13,457,173 $ 14,488,703 $ 15,454,725 $
Fiscal Year
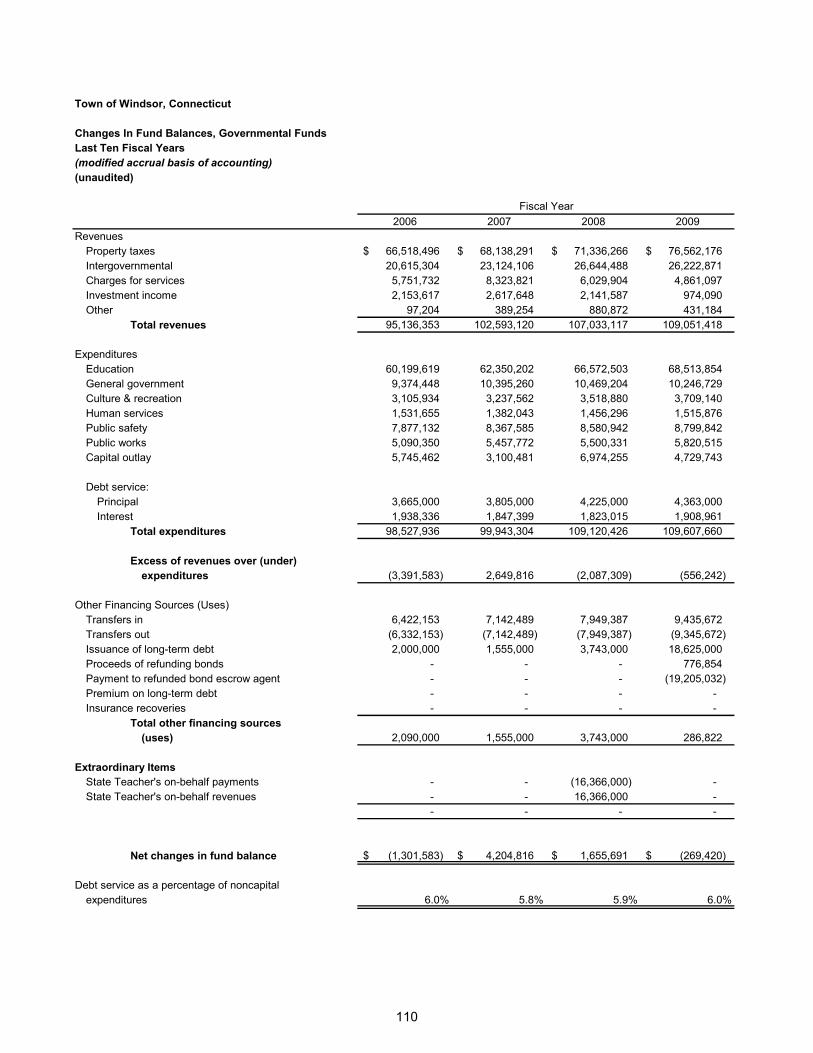
110
Town of Windsor, Connecticut
Changes In Fund Balances, Governmental FundsLast Ten Fiscal Years(modified accrual basis of accounting)(unaudited)
2006 2007 2008 2009Revenues
Property taxes 66,518,496 $ 68,138,291 $ 71,336,266 $ 76,562,176 $ Intergovernmental 20,615,304 23,124,106 26,644,488 26,222,871 Charges for services 5,751,732 8,323,821 6,029,904 4,861,097 Investment income 2,153,617 2,617,648 2,141,587 974,090 Other 97,204 389,254 880,872 431,184
Total revenues 95,136,353 102,593,120 107,033,117 109,051,418
ExpendituresEducation 60,199,619 62,350,202 66,572,503 68,513,854 General government 9,374,448 10,395,260 10,469,204 10,246,729 Culture & recreation 3,105,934 3,237,562 3,518,880 3,709,140 Human services 1,531,655 1,382,043 1,456,296 1,515,876 Public safety 7,877,132 8,367,585 8,580,942 8,799,842 Public works 5,090,350 5,457,772 5,500,331 5,820,515 Capital outlay 5,745,462 3,100,481 6,974,255 4,729,743
Debt service:Principal 3,665,000 3,805,000 4,225,000 4,363,000 Interest 1,938,336 1,847,399 1,823,015 1,908,961
Total expenditures 98,527,936 99,943,304 109,120,426 109,607,660
Excess of revenues over (under) expenditures (3,391,583) 2,649,816 (2,087,309) (556,242)
Other Financing Sources (Uses)Transfers in 6,422,153 7,142,489 7,949,387 9,435,672 Transfers out (6,332,153) (7,142,489) (7,949,387) (9,345,672) Issuance of long-term debt 2,000,000 1,555,000 3,743,000 18,625,000 Proceeds of refunding bonds - - - 776,854 Payment to refunded bond escrow agent - - - (19,205,032) Premium on long-term debt - - - - Insurance recoveries - - - -
Total other financing sources (uses) 2,090,000 1,555,000 3,743,000 286,822
Extraordinary ItemsState Teacher's on-behalf payments - - (16,366,000) - State Teacher's on-behalf revenues - - 16,366,000 -
- - - -
Net changes in fund balance (1,301,583) $ 4,204,816 $ 1,655,691 $ (269,420) $
Debt service as a percentage of noncapital expenditures 6.0% 5.8% 5.9% 6.0%
Fiscal Year
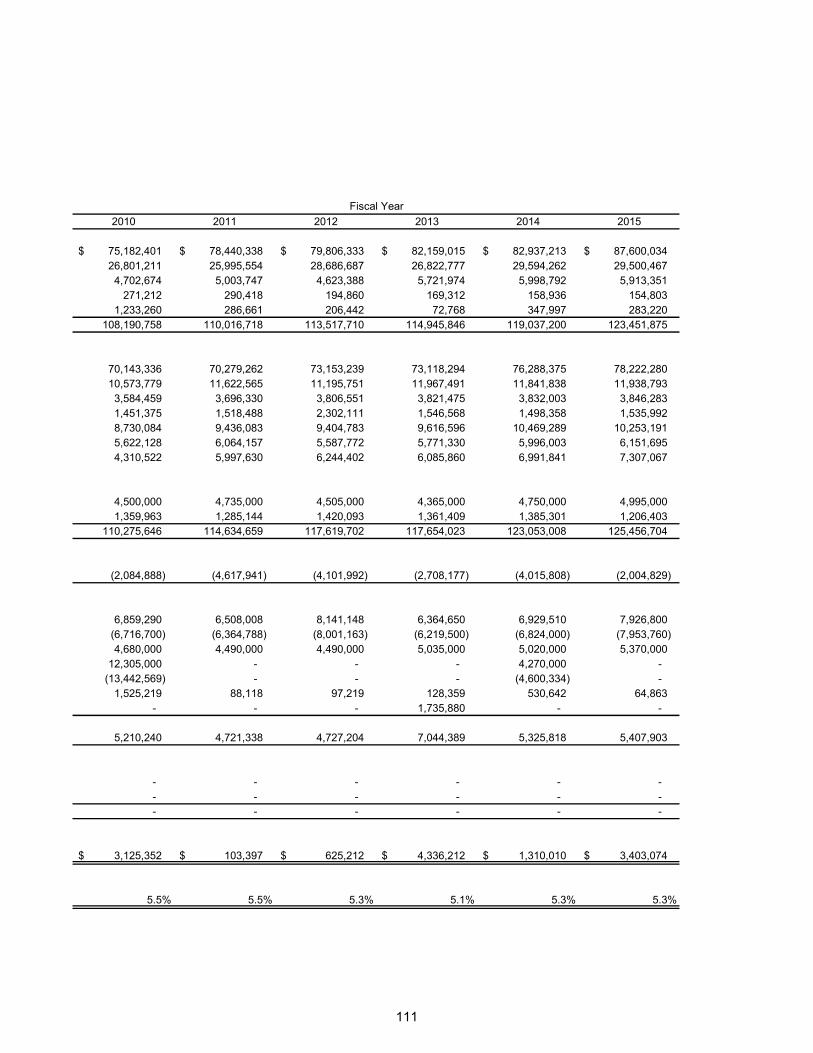
111
2010 2011 2012 2013 2014 2015
75,182,401 $ 78,440,338 $ 79,806,333 $ 82,159,015 $ 82,937,213 $ 87,600,034 $ 26,801,211 25,995,554 28,686,687 26,822,777 29,594,262 29,500,467 4,702,674 5,003,747 4,623,388 5,721,974 5,998,792 5,913,351
271,212 290,418 194,860 169,312 158,936 154,803 1,233,260 286,661 206,442 72,768 347,997 283,220
108,190,758 110,016,718 113,517,710 114,945,846 119,037,200 123,451,875
70,143,336 70,279,262 73,153,239 73,118,294 76,288,375 78,222,280 10,573,779 11,622,565 11,195,751 11,967,491 11,841,838 11,938,793 3,584,459 3,696,330 3,806,551 3,821,475 3,832,003 3,846,283 1,451,375 1,518,488 2,302,111 1,546,568 1,498,358 1,535,992 8,730,084 9,436,083 9,404,783 9,616,596 10,469,289 10,253,191 5,622,128 6,064,157 5,587,772 5,771,330 5,996,003 6,151,695 4,310,522 5,997,630 6,244,402 6,085,860 6,991,841 7,307,067
4,500,000 4,735,000 4,505,000 4,365,000 4,750,000 4,995,000 1,359,963 1,285,144 1,420,093 1,361,409 1,385,301 1,206,403
110,275,646 114,634,659 117,619,702 117,654,023 123,053,008 125,456,704
(2,084,888) (4,617,941) (4,101,992) (2,708,177) (4,015,808) (2,004,829)
6,859,290 6,508,008 8,141,148 6,364,650 6,929,510 7,926,800 (6,716,700) (6,364,788) (8,001,163) (6,219,500) (6,824,000) (7,953,760) 4,680,000 4,490,000 4,490,000 5,035,000 5,020,000 5,370,000
12,305,000 - - - 4,270,000 - (13,442,569) - - - (4,600,334) -
1,525,219 88,118 97,219 128,359 530,642 64,863 - - - 1,735,880 - -
5,210,240 4,721,338 4,727,204 7,044,389 5,325,818 5,407,903
- - - - - - - - - - - - - - - - - -
3,125,352 $ 103,397 $ 625,212 $ 4,336,212 $ 1,310,010 $ 3,403,074 $
5.5% 5.5% 5.3% 5.1% 5.3% 5.3%
Fiscal Year
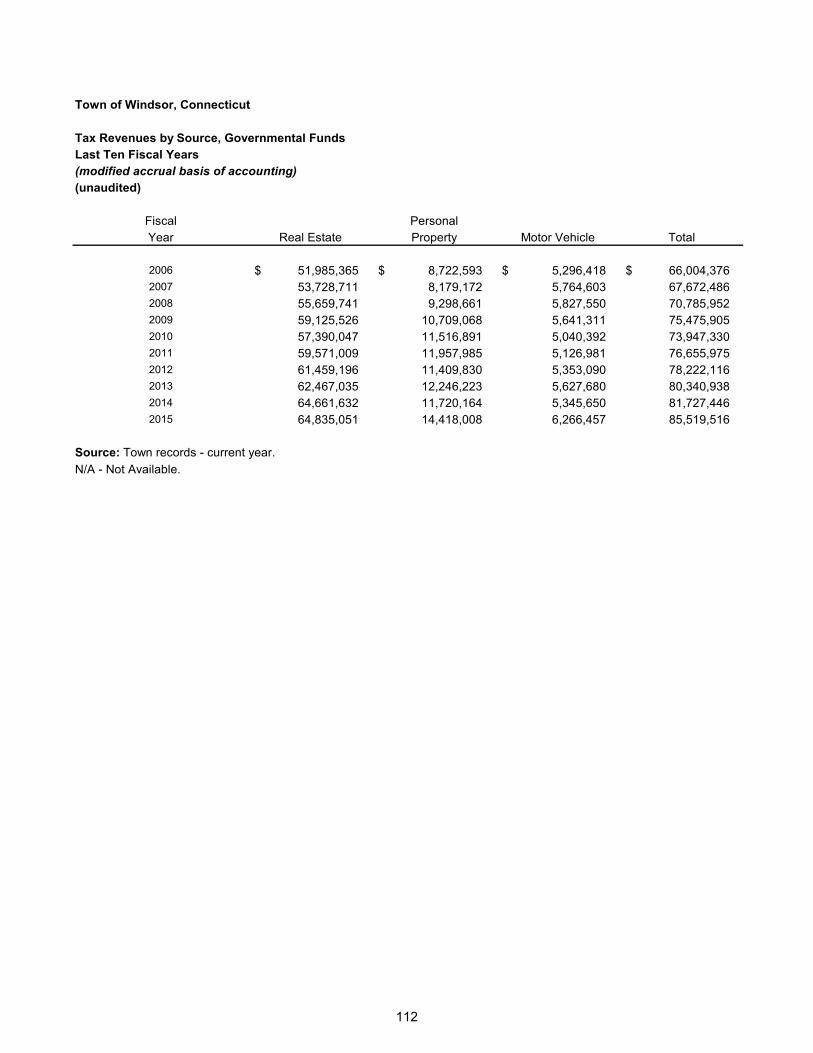
112
Town of Windsor, Connecticut
Tax Revenues by Source, Governmental FundsLast Ten Fiscal Years(modified accrual basis of accounting)(unaudited)
Fiscal PersonalYear Real Estate Property Motor Vehicle Total
2006 51,985,365 $ 8,722,593 $ 5,296,418 $ 66,004,376 $ 2007 53,728,711 8,179,172 5,764,603 67,672,486 2008 55,659,741 9,298,661 5,827,550 70,785,952 2009 59,125,526 10,709,068 5,641,311 75,475,905 2010 57,390,047 11,516,891 5,040,392 73,947,330 2011 59,571,009 11,957,985 5,126,981 76,655,975 2012 61,459,196 11,409,830 5,353,090 78,222,116 2013 62,467,035 12,246,223 5,627,680 80,340,938 2014 64,661,632 11,720,164 5,345,650 81,727,446 2015 64,835,051 14,418,008 6,266,457 85,519,516
Source: Town records - current year.N/A - Not Available.

113
This page intentionally left blank.
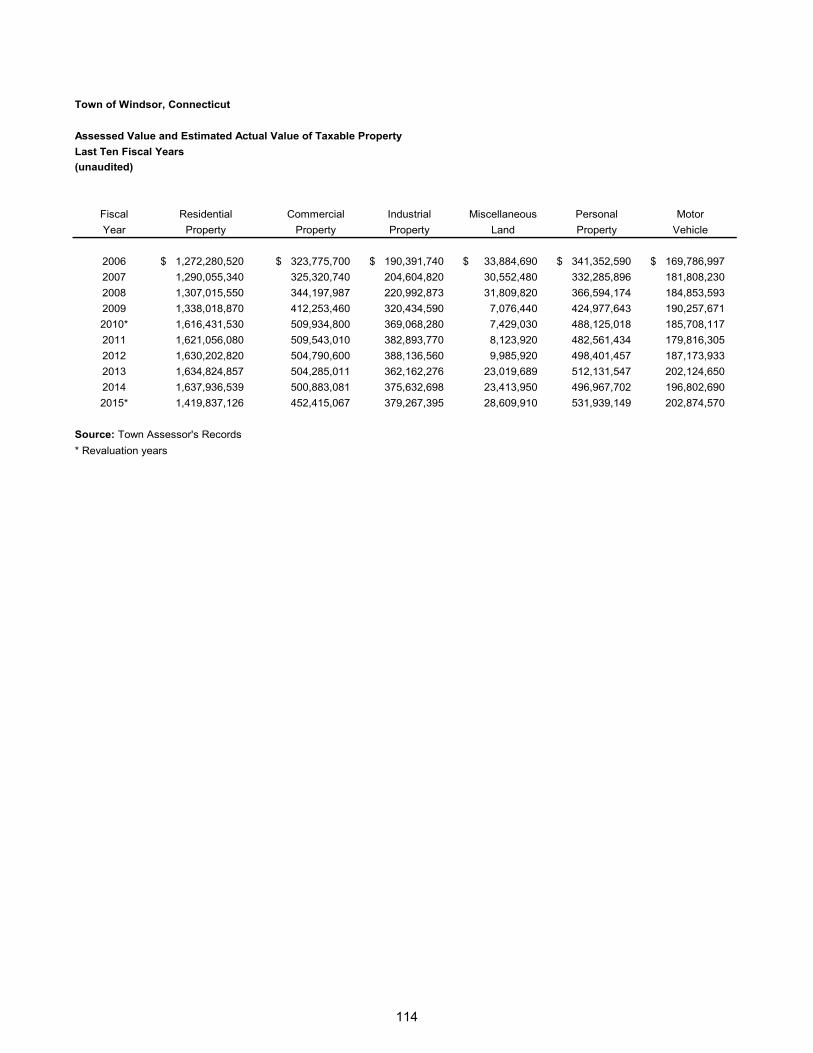
114
Town of Windsor, Connecticut
Assessed Value and Estimated Actual Value of Taxable PropertyLast Ten Fiscal Years(unaudited)
Fiscal Residential Commercial Industrial Miscellaneous Personal MotorYear Property Property Property Land Property Vehicle
2006 1,272,280,520 $ 323,775,700 $ 190,391,740 $ 33,884,690 $ 341,352,590 $ 169,786,997 $ 2007 1,290,055,340 325,320,740 204,604,820 30,552,480 332,285,896 181,808,230 2008 1,307,015,550 344,197,987 220,992,873 31,809,820 366,594,174 184,853,593 2009 1,338,018,870 412,253,460 320,434,590 7,076,440 424,977,643 190,257,671 2010* 1,616,431,530 509,934,800 369,068,280 7,429,030 488,125,018 185,708,117 2011 1,621,056,080 509,543,010 382,893,770 8,123,920 482,561,434 179,816,305 2012 1,630,202,820 504,790,600 388,136,560 9,985,920 498,401,457 187,173,933 2013 1,634,824,857 504,285,011 362,162,276 23,019,689 512,131,547 202,124,650 2014 1,637,936,539 500,883,081 375,632,698 23,413,950 496,967,702 196,802,690 2015* 1,419,837,126 452,415,067 379,267,395 28,609,910 531,939,149 202,874,570
Source: Town Assessor's Records* Revaluation years
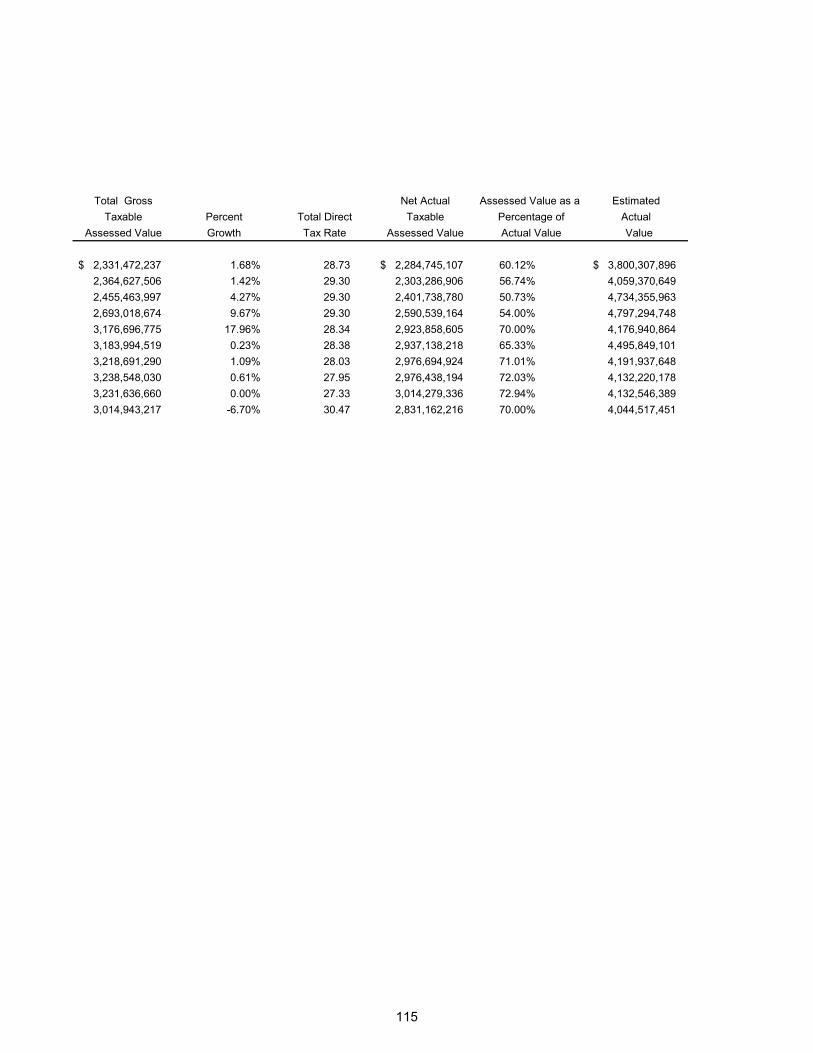
115
Total Gross Net Actual Assessed Value as a Estimated Taxable Percent Total Direct Taxable Percentage of Actual
Assessed Value Growth Tax Rate Assessed Value Actual Value Value
2,331,472,237 $ 1.68% 28.73 2,284,745,107 $ 60.12% 3,800,307,896 $ 2,364,627,506 1.42% 29.30 2,303,286,906 56.74% 4,059,370,649 2,455,463,997 4.27% 29.30 2,401,738,780 50.73% 4,734,355,963 2,693,018,674 9.67% 29.30 2,590,539,164 54.00% 4,797,294,748
3,176,696,775 17.96% 28.34 2,923,858,605 70.00% 4,176,940,864 3,183,994,519 0.23% 28.38 2,937,138,218 65.33% 4,495,849,101 3,218,691,290 1.09% 28.03 2,976,694,924 71.01% 4,191,937,648 3,238,548,030 0.61% 27.95 2,976,438,194 72.03% 4,132,220,178 3,231,636,660 0.00% 27.33 3,014,279,336 72.94% 4,132,546,389 3,014,943,217 -6.70% 30.47 2,831,162,216 70.00% 4,044,517,451
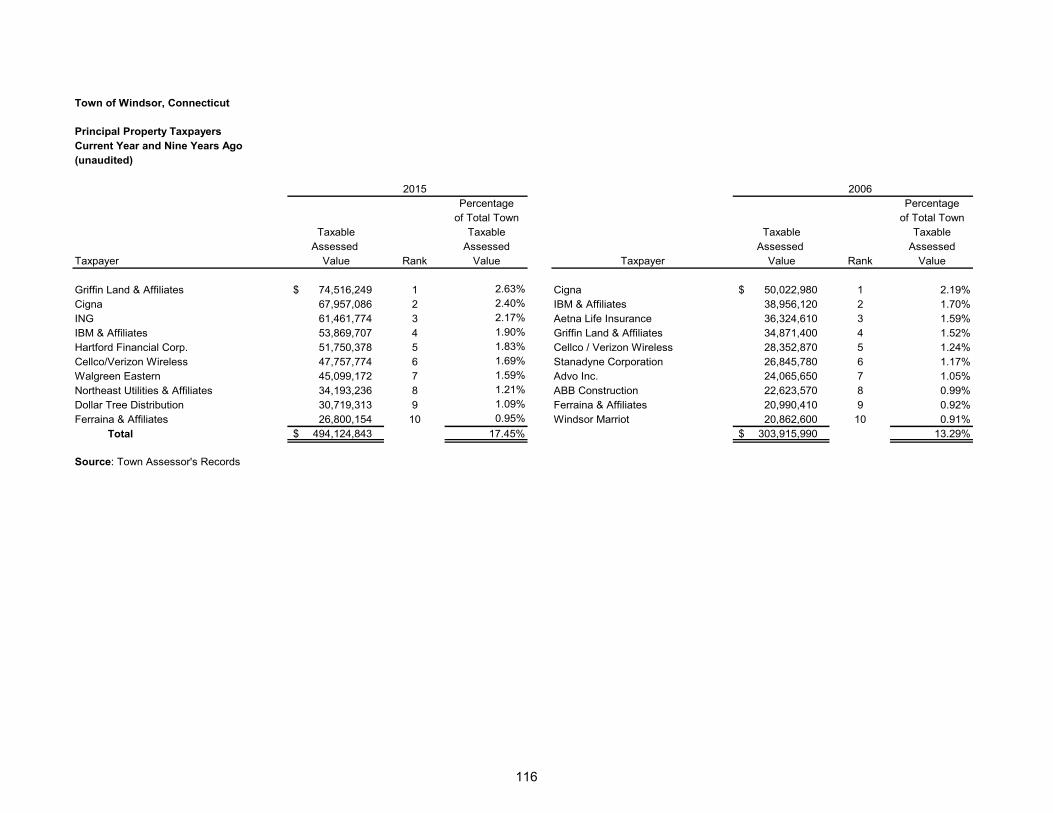
116
Town of Windsor, Connecticut
Principal Property TaxpayersCurrent Year and Nine Years Ago(unaudited)
2015 2006Percentage Percentage
of Total Town of Total TownTaxable Taxable Taxable Taxable
Assessed Assessed Assessed AssessedTaxpayer Value Rank Value Taxpayer Value Rank Value
Griffin Land & Affiliates 74,516,249 $ 1 2.63% Cigna 50,022,980 $ 1 2.19%Cigna 67,957,086 2 2.40% IBM & Affiliates 38,956,120 2 1.70%ING 61,461,774 3 2.17% Aetna Life Insurance 36,324,610 3 1.59%IBM & Affiliates 53,869,707 4 1.90% Griffin Land & Affiliates 34,871,400 4 1.52%Hartford Financial Corp. 51,750,378 5 1.83% Cellco / Verizon Wireless 28,352,870 5 1.24%Cellco/Verizon Wireless 47,757,774 6 1.69% Stanadyne Corporation 26,845,780 6 1.17%Walgreen Eastern 45,099,172 7 1.59% Advo Inc. 24,065,650 7 1.05%Northeast Utilities & Affiliates 34,193,236 8 1.21% ABB Construction 22,623,570 8 0.99%Dollar Tree Distribution 30,719,313 9 1.09% Ferraina & Affiliates 20,990,410 9 0.92%Ferraina & Affiliates 26,800,154 10 0.95% Windsor Marriot 20,862,600 10 0.91%
Total 494,124,843 $ 17.45% 303,915,990 $ 13.29%
Source: Town Assessor's Records

117
This page intentionally left blank.
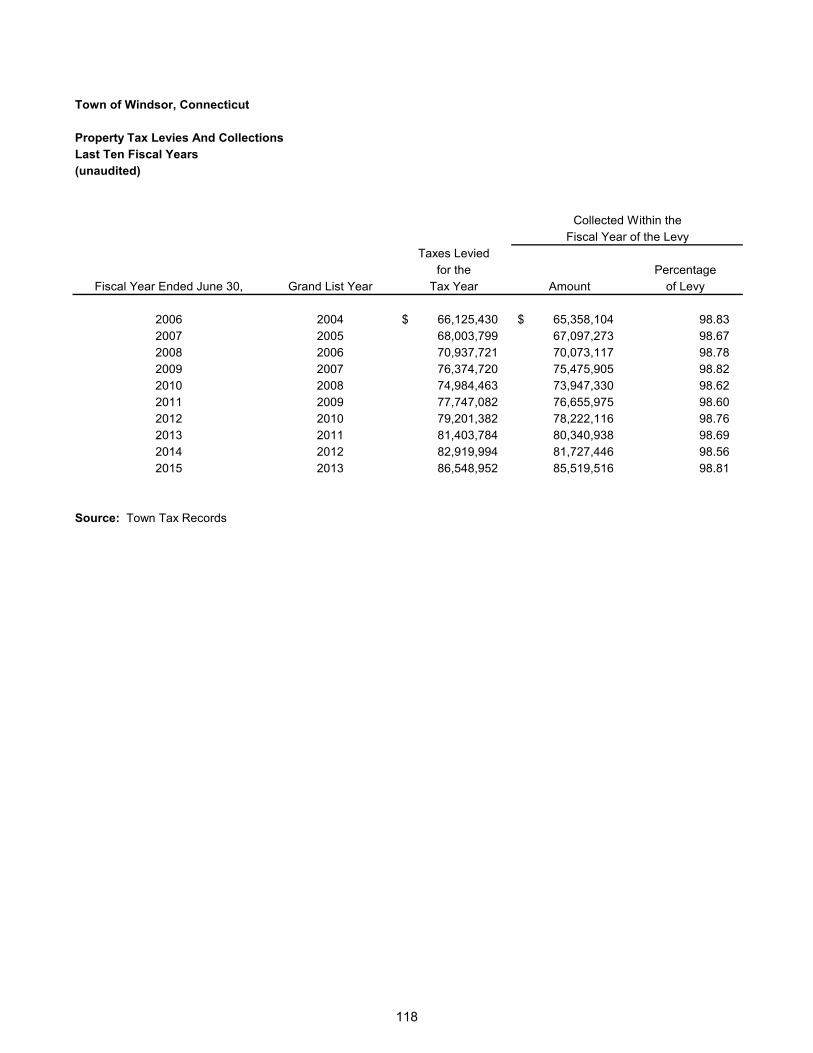
118
Town of Windsor, Connecticut
Property Tax Levies And CollectionsLast Ten Fiscal Years(unaudited)
Collected Within theFiscal Year of the Levy
Taxes Leviedfor the Percentage
Fiscal Year Ended June 30, Grand List Year Tax Year Amount of Levy
2006 2004 66,125,430 $ 65,358,104 $ 98.83 2007 2005 68,003,799 67,097,273 98.67 2008 2006 70,937,721 70,073,117 98.78 2009 2007 76,374,720 75,475,905 98.82 2010 2008 74,984,463 73,947,330 98.62 2011 2009 77,747,082 76,655,975 98.60 2012 2010 79,201,382 78,222,116 98.76 2013 2011 81,403,784 80,340,938 98.69 2014 2012 82,919,994 81,727,446 98.56 2015 2013 86,548,952 85,519,516 98.81
Source: Town Tax Records
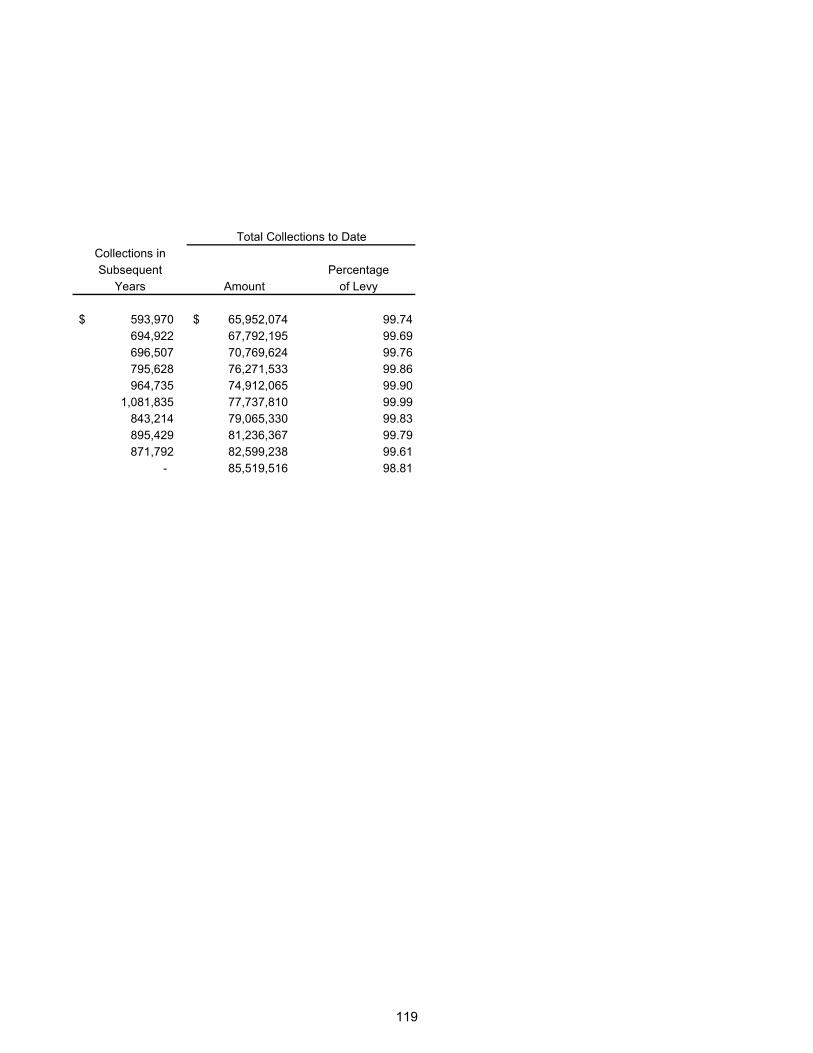
119
Total Collections to DateCollections inSubsequent Percentage
Years Amount of Levy
593,970 $ 65,952,074 $ 99.74 694,922 67,792,195 99.69 696,507 70,769,624 99.76795,628 76,271,533 99.86
964,735 74,912,065 99.90 1,081,835 77,737,810 99.99
843,214 79,065,330 99.83 895,429 81,236,367 99.79 871,792 82,599,238 99.61
- 85,519,516 98.81
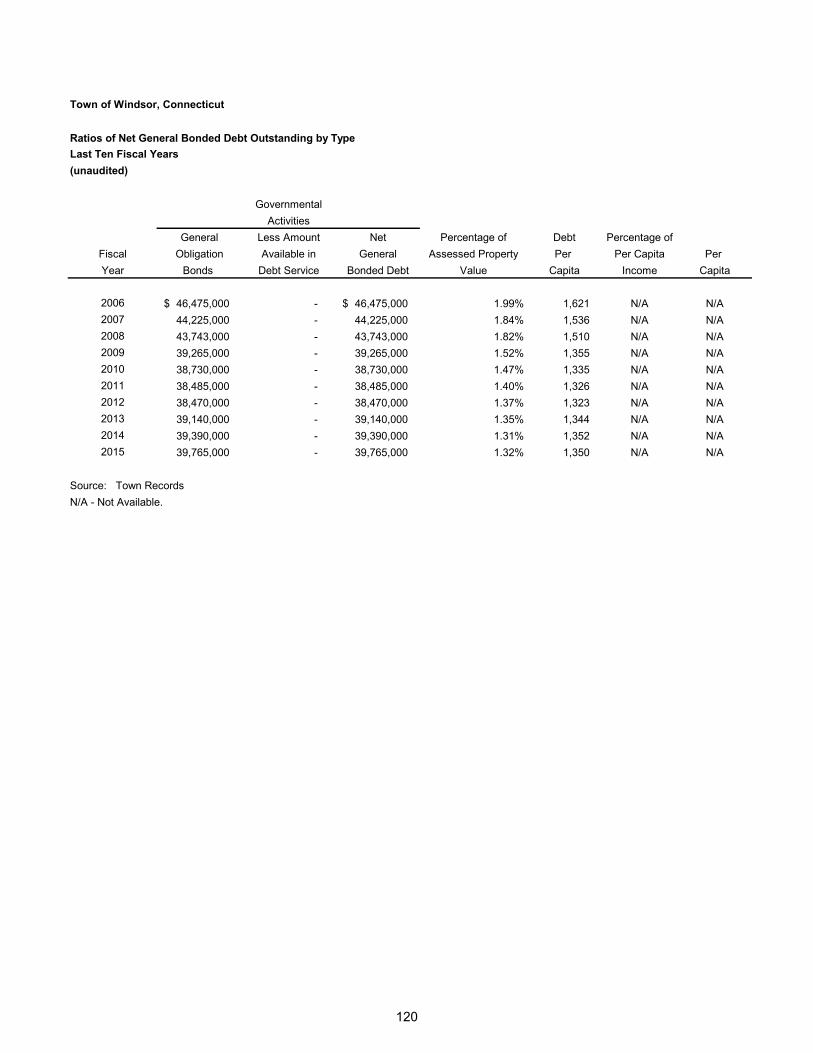
120
Town of Windsor, Connecticut
Ratios of Net General Bonded Debt Outstanding by TypeLast Ten Fiscal Years(unaudited)
GovernmentalActivities
General Less Amount Net Percentage of Debt Percentage ofFiscal Obligation Available in General Assessed Property Per Per Capita Per Year Bonds Debt Service Bonded Debt Value Capita Income Capita
2006 46,475,000 $ - 46,475,000 $ 1.99% 1,621 N/A N/A2007 44,225,000 - 44,225,000 1.84% 1,536 N/A N/A2008 43,743,000 - 43,743,000 1.82% 1,510 N/A N/A2009 39,265,000 - 39,265,000 1.52% 1,355 N/A N/A2010 38,730,000 - 38,730,000 1.47% 1,335 N/A N/A2011 38,485,000 - 38,485,000 1.40% 1,326 N/A N/A2012 38,470,000 - 38,470,000 1.37% 1,323 N/A N/A2013 39,140,000 - 39,140,000 1.35% 1,344 N/A N/A2014 39,390,000 - 39,390,000 1.31% 1,352 N/A N/A2015 39,765,000 - 39,765,000 1.32% 1,350 N/A N/A
Source: Town RecordsN/A - Not Available.
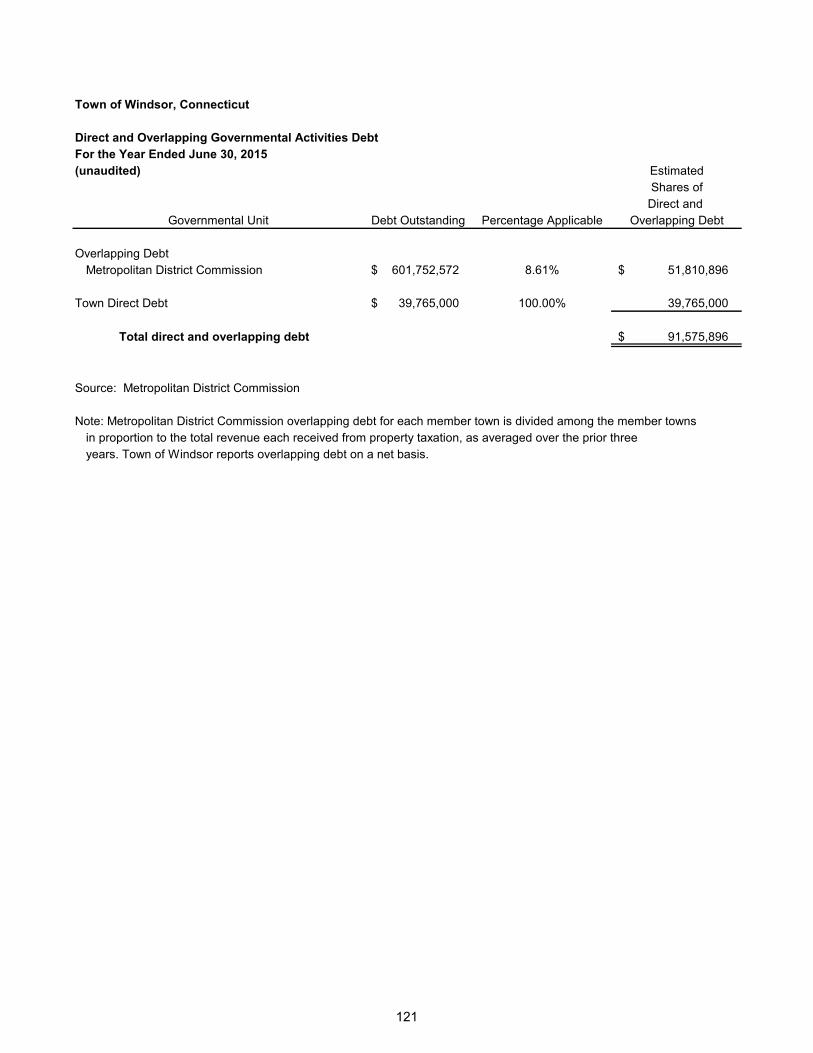
121
Town of Windsor, Connecticut
Direct and Overlapping Governmental Activities DebtFor the Year Ended June 30, 2015(unaudited) Estimated
Shares ofDirect and
Governmental Unit Debt Outstanding Percentage Applicable Overlapping Debt
Overlapping DebtMetropolitan District Commission 601,752,572 $ 8.61% 51,810,896 $
Town Direct Debt 39,765,000 $ 100.00% 39,765,000
Total direct and overlapping debt 91,575,896 $
Source: Metropolitan District Commission
Note: Metropolitan District Commission overlapping debt for each member town is divided among the member townsin proportion to the total revenue each received from property taxation, as averaged over the prior threeyears. Town of Windsor reports overlapping debt on a net basis.
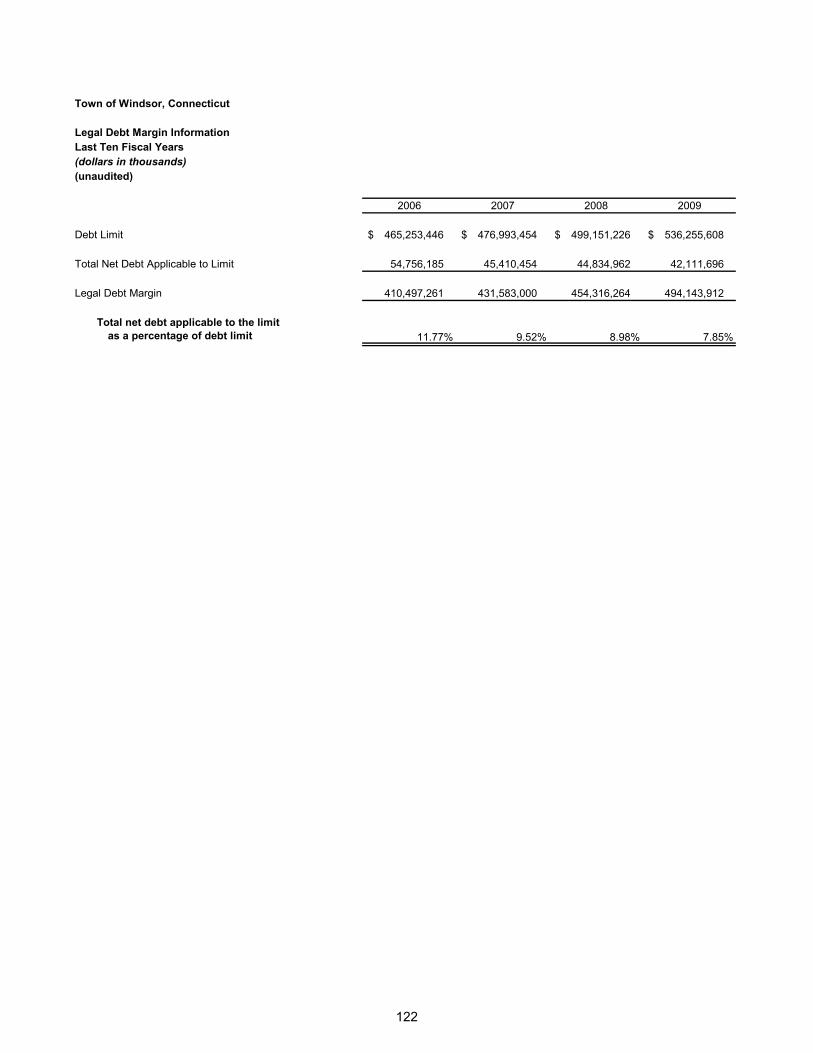
122
Town of Windsor, Connecticut
Legal Debt Margin InformationLast Ten Fiscal Years(dollars in thousands)(unaudited)
2006 2007 2008 2009
Debt Limit 465,253,446 $ 476,993,454 $ 499,151,226 $ 536,255,608 $
Total Net Debt Applicable to Limit 54,756,185 45,410,454 44,834,962 42,111,696
Legal Debt Margin 410,497,261 431,583,000 454,316,264 494,143,912
Total net debt applicable to the limitas a percentage of debt limit 11.77% 9.52% 8.98% 7.85%
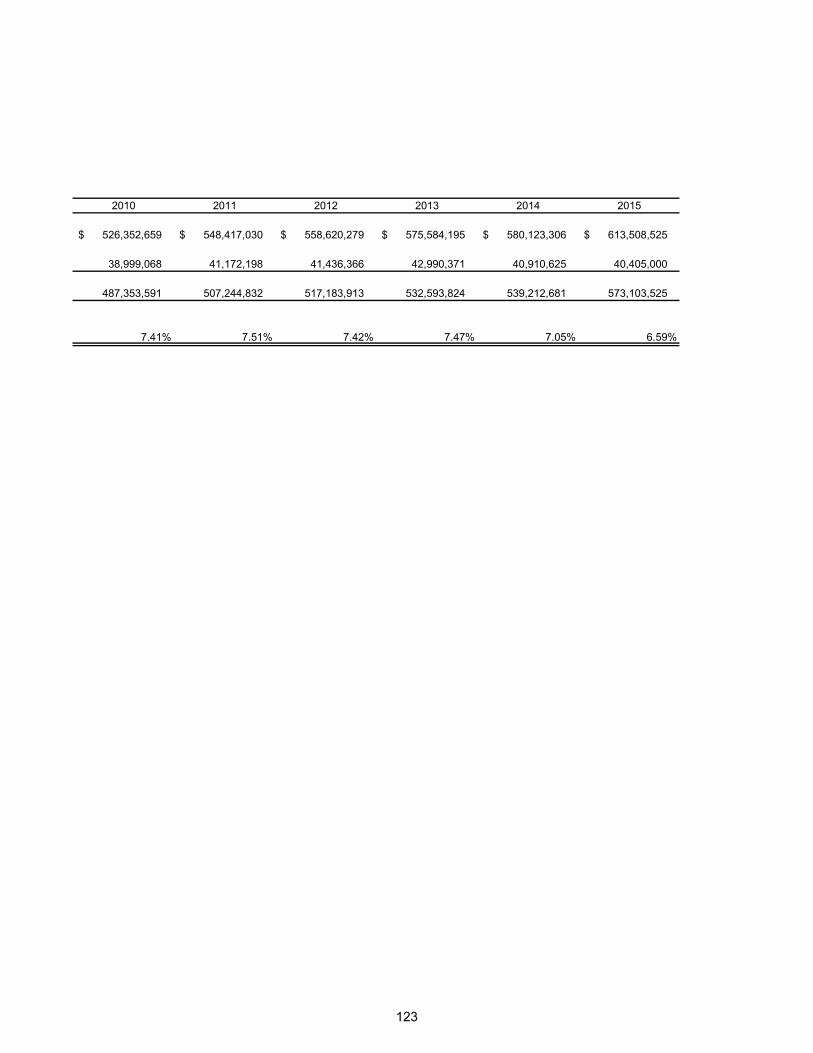
123
2010 2011 2012 2013 2014 2015
526,352,659 $ 548,417,030 $ 558,620,279 $ 575,584,195 $ 580,123,306 $ 613,508,525 $
38,999,068 41,172,198 41,436,366 42,990,371 40,910,625 40,405,000
487,353,591 507,244,832 517,183,913 532,593,824 539,212,681 573,103,525
7.41% 7.51% 7.42% 7.47% 7.05% 6.59%
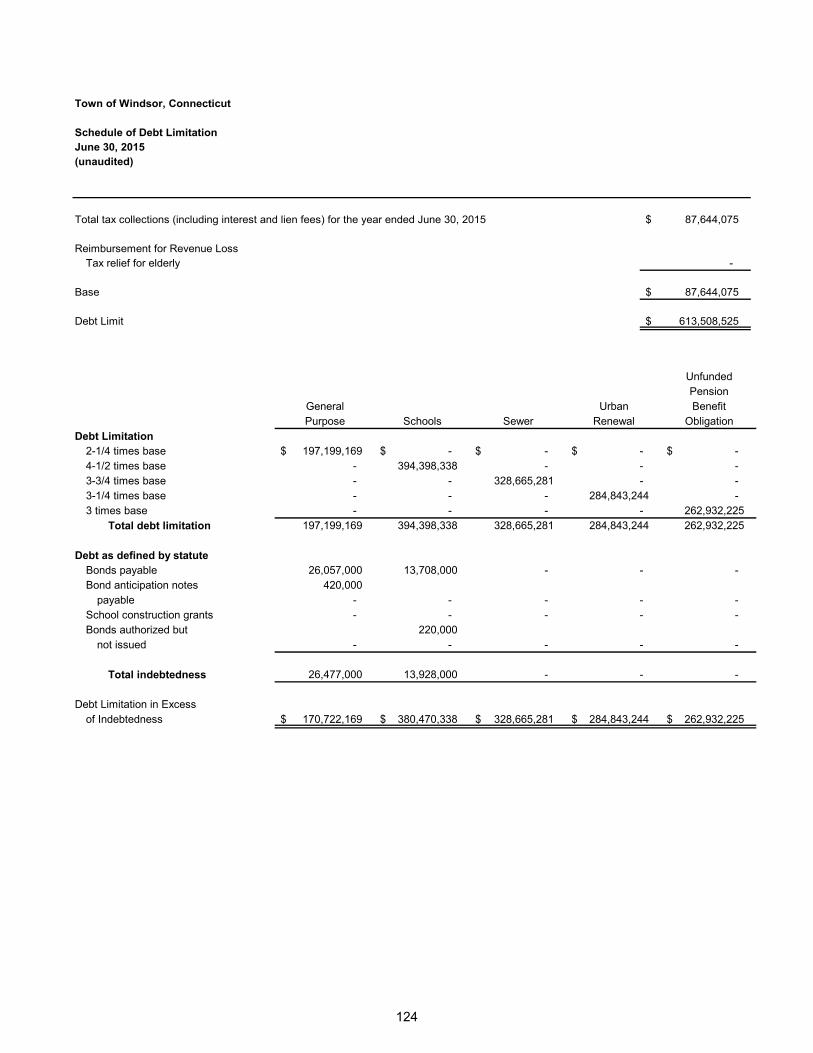
124
Town of Windsor, Connecticut
Schedule of Debt LimitationJune 30, 2015(unaudited)
Total tax collections (including interest and lien fees) for the year ended June 30, 2015 87,644,075 $
Reimbursement for Revenue LossTax relief for elderly -
Base 87,644,075 $
Debt Limit 613,508,525 $
UnfundedPension
General Urban BenefitPurpose Schools Sewer Renewal Obligation
Debt Limitation2-1/4 times base 197,199,169 $ -$ -$ -$ -$ 4-1/2 times base - 394,398,338 - - - 3-3/4 times base - - 328,665,281 - - 3-1/4 times base - - - 284,843,244 - 3 times base - - - - 262,932,225
Total debt limitation 197,199,169 394,398,338 328,665,281 284,843,244 262,932,225
Debt as defined by statuteBonds payable 26,057,000 13,708,000 - - - Bond anticipation notes 420,000
payable - - - - - School construction grants - - - - - Bonds authorized but 220,000
not issued - - - - -
Total indebtedness 26,477,000 13,928,000 - - -
Debt Limitation in Excessof Indebtedness 170,722,169 $ 380,470,338 $ 328,665,281 $ 284,843,244 $ 262,932,225 $
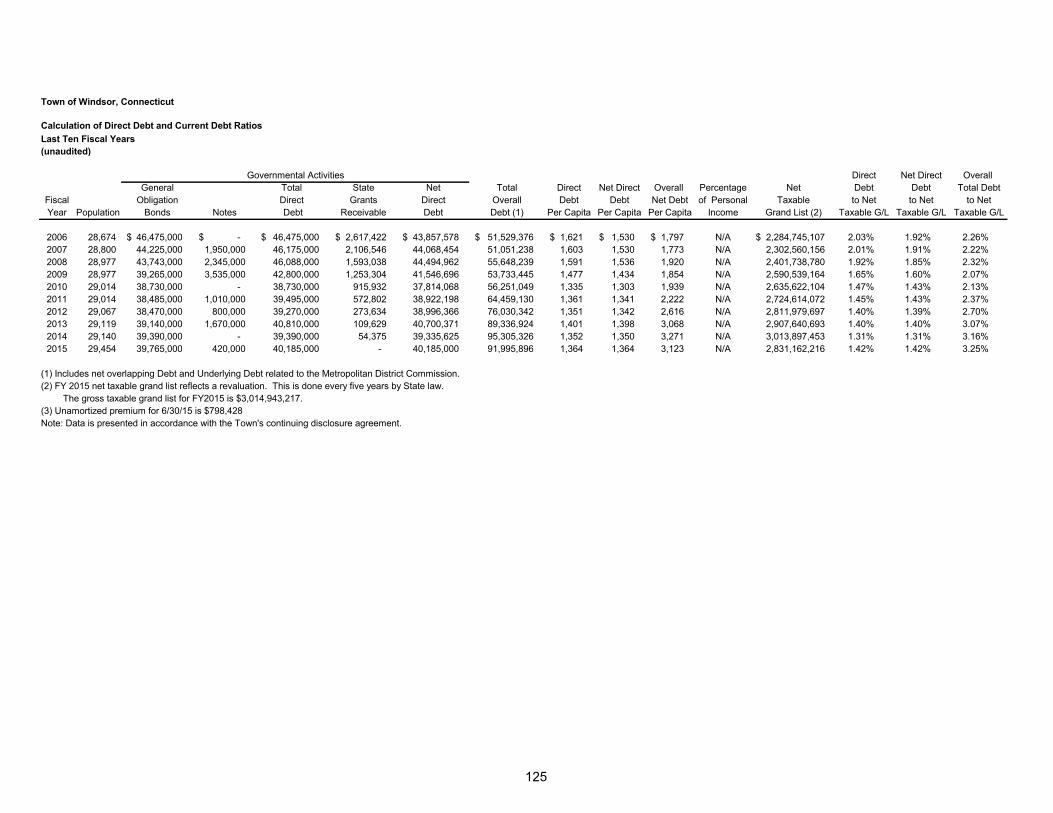
125
Town of Windsor, Connecticut
Calculation of Direct Debt and Current Debt Ratios Last Ten Fiscal Years(unaudited)
Direct Net Direct Overall General Total State Net Total Direct Net Direct Overall Percentage Net Debt Debt Total Debt
Fiscal Obligation Direct Grants Direct Overall Debt Debt Net Debt of Personal Taxable to Net to Net to NetYear Population Bonds Notes Debt Receivable Debt Debt (1) Per Capita Per Capita Per Capita Income Grand List (2) Taxable G/L Taxable G/L Taxable G/L
2006 28,674 46,475,000 $ -$ 46,475,000 $ 2,617,422 $ 43,857,578 $ 51,529,376 $ 1,621 $ 1,530 $ 1,797 $ N/A 2,284,745,107 $ 2.03% 1.92% 2.26%2007 28,800 44,225,000 1,950,000 46,175,000 2,106,546 44,068,454 51,051,238 1,603 1,530 1,773 N/A 2,302,560,156 2.01% 1.91% 2.22%2008 28,977 43,743,000 2,345,000 46,088,000 1,593,038 44,494,962 55,648,239 1,591 1,536 1,920 N/A 2,401,738,780 1.92% 1.85% 2.32%2009 28,977 39,265,000 3,535,000 42,800,000 1,253,304 41,546,696 53,733,445 1,477 1,434 1,854 N/A 2,590,539,164 1.65% 1.60% 2.07%2010 29,014 38,730,000 - 38,730,000 915,932 37,814,068 56,251,049 1,335 1,303 1,939 N/A 2,635,622,104 1.47% 1.43% 2.13%2011 29,014 38,485,000 1,010,000 39,495,000 572,802 38,922,198 64,459,130 1,361 1,341 2,222 N/A 2,724,614,072 1.45% 1.43% 2.37%2012 29,067 38,470,000 800,000 39,270,000 273,634 38,996,366 76,030,342 1,351 1,342 2,616 N/A 2,811,979,697 1.40% 1.39% 2.70%2013 29,119 39,140,000 1,670,000 40,810,000 109,629 40,700,371 89,336,924 1,401 1,398 3,068 N/A 2,907,640,693 1.40% 1.40% 3.07%2014 29,140 39,390,000 - 39,390,000 54,375 39,335,625 95,305,326 1,352 1,350 3,271 N/A 3,013,897,453 1.31% 1.31% 3.16%2015 29,454 39,765,000 420,000 40,185,000 - 40,185,000 91,995,896 1,364 1,364 3,123 N/A 2,831,162,216 1.42% 1.42% 3.25%
(1) Includes net overlapping Debt and Underlying Debt related to the Metropolitan District Commission.
The gross taxable grand list for FY2015 is $3,014,943,217.(3) Unamortized premium for 6/30/15 is $798,428
Governmental Activities
(2) FY 2015 net taxable grand list reflects a revaluation. This is done every five years by State law.
Note: Data is presented in accordance with the Town's continuing disclosure agreement.
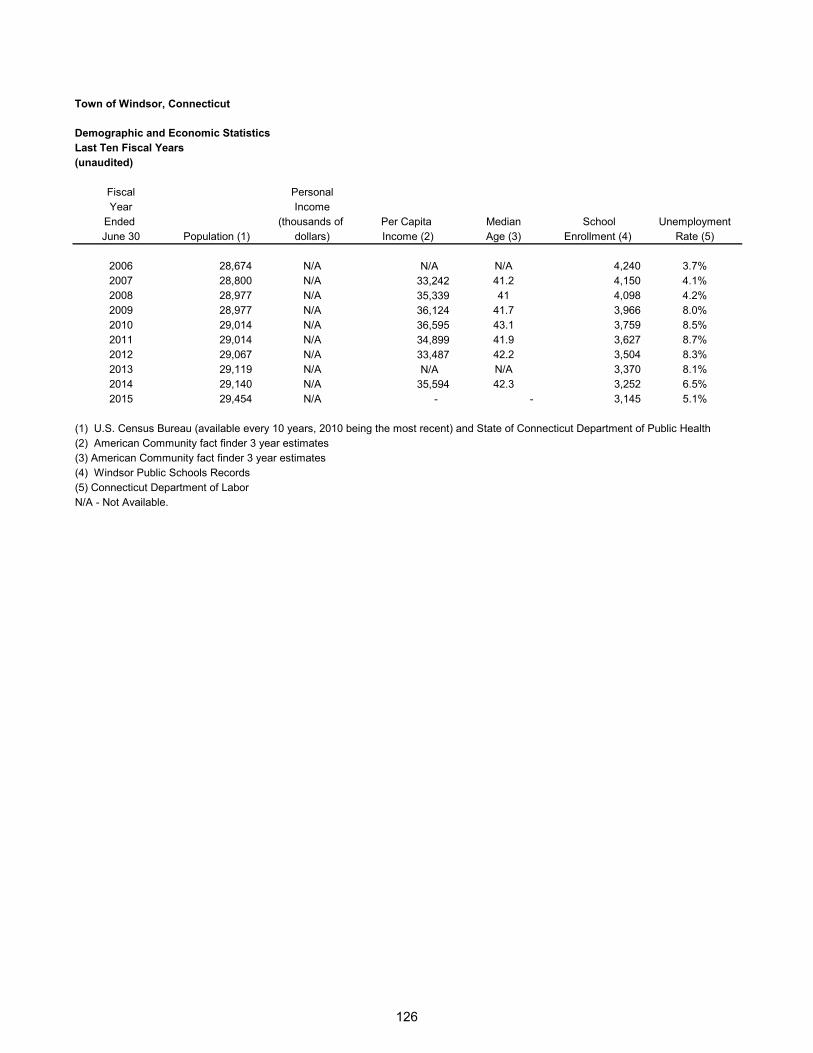
126
Town of Windsor, Connecticut
Demographic and Economic StatisticsLast Ten Fiscal Years(unaudited)
Fiscal PersonalYear Income
Ended (thousands of Per Capita Median School UnemploymentJune 30 Population (1) dollars) Income (2) Age (3) Enrollment (4) Rate (5)
2006 28,674 N/A N/A N/A 4,240 3.7%2007 28,800 N/A 33,242 41.2 4,150 4.1%2008 28,977 N/A 35,339 41 4,098 4.2%2009 28,977 N/A 36,124 41.7 3,966 8.0%2010 29,014 N/A 36,595 43.1 3,759 8.5%2011 29,014 N/A 34,899 41.9 3,627 8.7%2012 29,067 N/A 33,487 42.2 3,504 8.3%2013 29,119 N/A N/A N/A 3,370 8.1%2014 29,140 N/A 35,594 42.3 3,252 6.5%2015 29,454 N/A - - 3,145 5.1%
(1) U.S. Census Bureau (available every 10 years, 2010 being the most recent) and State of Connecticut Department of Public Health(2) American Community fact finder 3 year estimates(3) American Community fact finder 3 year estimates(4) Windsor Public Schools Records(5) Connecticut Department of LaborN/A - Not Available.
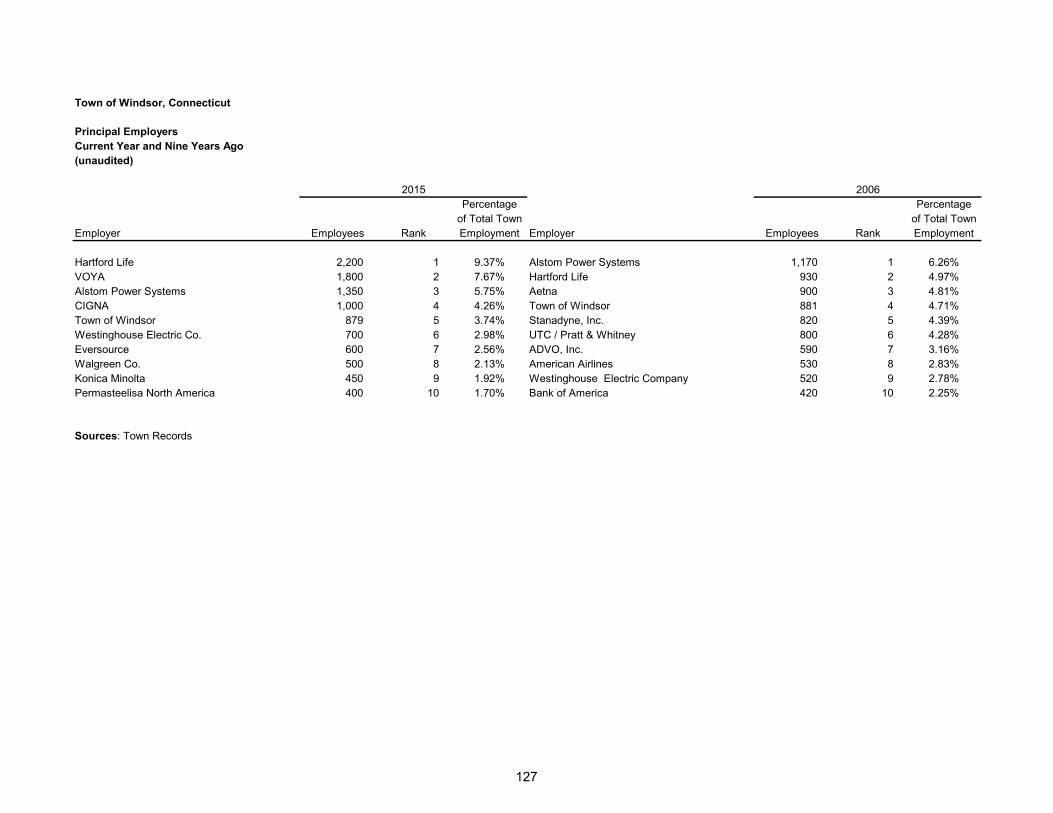
127
Town of Windsor, Connecticut
Principal EmployersCurrent Year and Nine Years Ago(unaudited)
2015 2006Percentage Percentage
of Total Town of Total TownEmployer Employees Rank Employment Employer Employees Rank Employment
Hartford Life 2,200 1 9.37% Alstom Power Systems 1,170 1 6.26%VOYA 1,800 2 7.67% Hartford Life 930 2 4.97%Alstom Power Systems 1,350 3 5.75% Aetna 900 3 4.81%CIGNA 1,000 4 4.26% Town of Windsor 881 4 4.71%Town of Windsor 879 5 3.74% Stanadyne, Inc. 820 5 4.39%Westinghouse Electric Co. 700 6 2.98% UTC / Pratt & Whitney 800 6 4.28%Eversource 600 7 2.56% ADVO, Inc. 590 7 3.16%Walgreen Co. 500 8 2.13% American Airlines 530 8 2.83%Konica Minolta 450 9 1.92% Westinghouse Electric Company 520 9 2.78%Permasteelisa North America 400 10 1.70% Bank of America 420 10 2.25%
Sources: Town Records
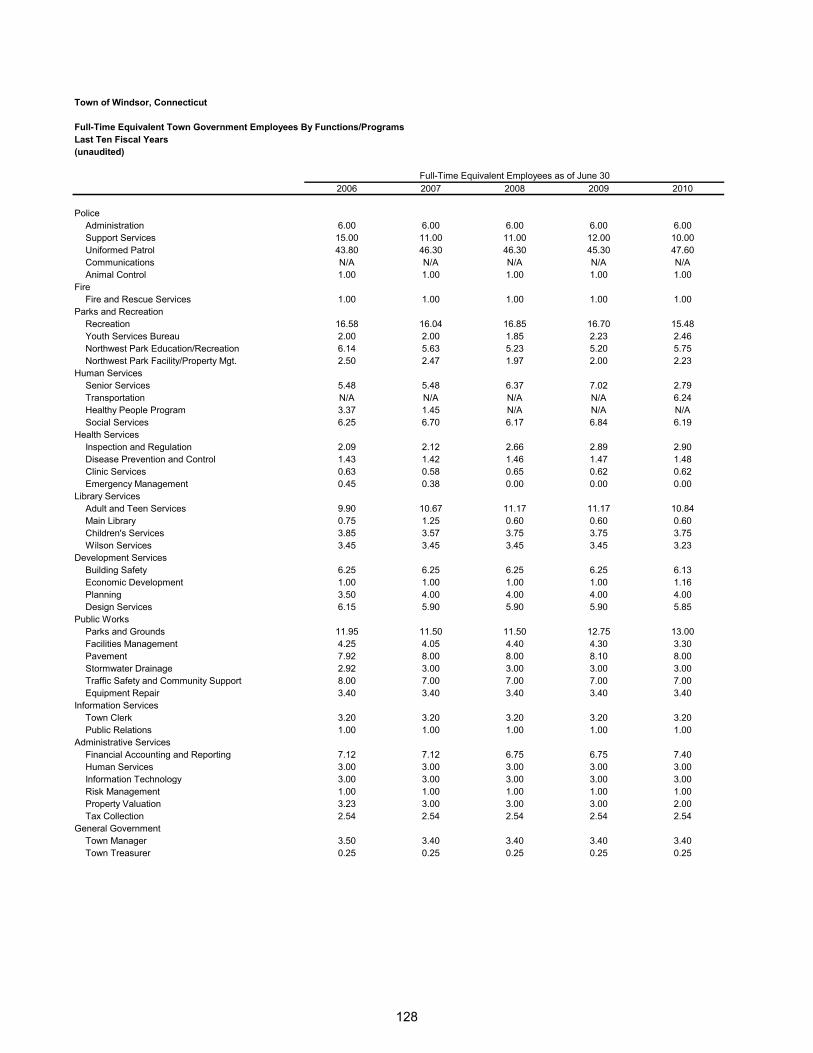
128
Town of Windsor, Connecticut
Full-Time Equivalent Town Government Employees By Functions/ProgramsLast Ten Fiscal Years(unaudited)
2006 2007 2008 2009 2010
PoliceAdministration 6.00 6.00 6.00 6.00 6.00Support Services 15.00 11.00 11.00 12.00 10.00Uniformed Patrol 43.80 46.30 46.30 45.30 47.60Communications N/A N/A N/A N/A N/AAnimal Control 1.00 1.00 1.00 1.00 1.00
FireFire and Rescue Services 1.00 1.00 1.00 1.00 1.00
Parks and RecreationRecreation 16.58 16.04 16.85 16.70 15.48Youth Services Bureau 2.00 2.00 1.85 2.23 2.46Northwest Park Education/Recreation 6.14 5.63 5.23 5.20 5.75Northwest Park Facility/Property Mgt. 2.50 2.47 1.97 2.00 2.23
Human ServicesSenior Services 5.48 5.48 6.37 7.02 2.79Transportation N/A N/A N/A N/A 6.24Healthy People Program 3.37 1.45 N/A N/A N/ASocial Services 6.25 6.70 6.17 6.84 6.19
Health ServicesInspection and Regulation 2.09 2.12 2.66 2.89 2.90Disease Prevention and Control 1.43 1.42 1.46 1.47 1.48Clinic Services 0.63 0.58 0.65 0.62 0.62Emergency Management 0.45 0.38 0.00 0.00 0.00
Library ServicesAdult and Teen Services 9.90 10.67 11.17 11.17 10.84Main Library 0.75 1.25 0.60 0.60 0.60Children's Services 3.85 3.57 3.75 3.75 3.75Wilson Services 3.45 3.45 3.45 3.45 3.23
Development ServicesBuilding Safety 6.25 6.25 6.25 6.25 6.13Economic Development 1.00 1.00 1.00 1.00 1.16Planning 3.50 4.00 4.00 4.00 4.00Design Services 6.15 5.90 5.90 5.90 5.85
Public WorksParks and Grounds 11.95 11.50 11.50 12.75 13.00Facilities Management 4.25 4.05 4.40 4.30 3.30Pavement 7.92 8.00 8.00 8.10 8.00Stormwater Drainage 2.92 3.00 3.00 3.00 3.00Traffic Safety and Community Support 8.00 7.00 7.00 7.00 7.00Equipment Repair 3.40 3.40 3.40 3.40 3.40
Information ServicesTown Clerk 3.20 3.20 3.20 3.20 3.20Public Relations 1.00 1.00 1.00 1.00 1.00
Administrative ServicesFinancial Accounting and Reporting 7.12 7.12 6.75 6.75 7.40Human Services 3.00 3.00 3.00 3.00 3.00Information Technology 3.00 3.00 3.00 3.00 3.00Risk Management 1.00 1.00 1.00 1.00 1.00Property Valuation 3.23 3.00 3.00 3.00 2.00Tax Collection 2.54 2.54 2.54 2.54 2.54
General GovernmentTown Manager 3.50 3.40 3.40 3.40 3.40Town Treasurer 0.25 0.25 0.25 0.25 0.25
Full-Time Equivalent Employees as of June 30
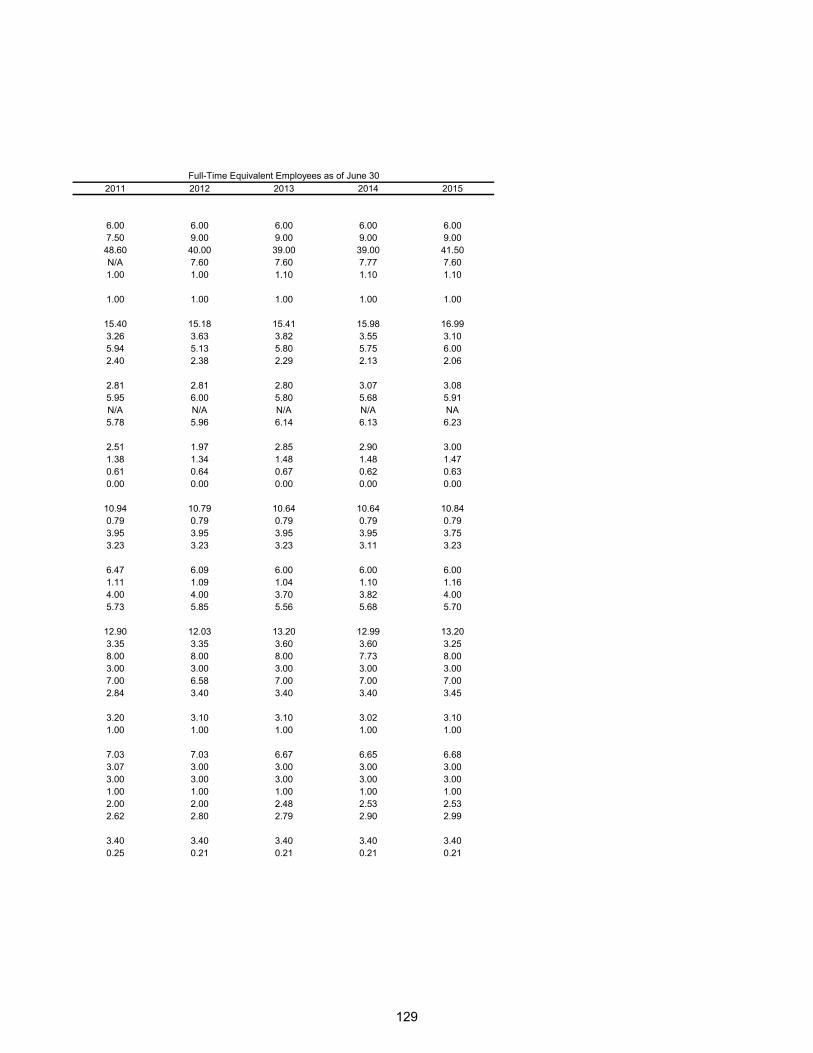
129
2011 2012 2013 2014 2015
6.00 6.00 6.00 6.00 6.007.50 9.00 9.00 9.00 9.0048.60 40.00 39.00 39.00 41.50N/A 7.60 7.60 7.77 7.601.00 1.00 1.10 1.10 1.10
1.00 1.00 1.00 1.00 1.00
15.40 15.18 15.41 15.98 16.993.26 3.63 3.82 3.55 3.105.94 5.13 5.80 5.75 6.002.40 2.38 2.29 2.13 2.06
2.81 2.81 2.80 3.07 3.085.95 6.00 5.80 5.68 5.91N/A N/A N/A N/A NA5.78 5.96 6.14 6.13 6.23
2.51 1.97 2.85 2.90 3.001.38 1.34 1.48 1.48 1.470.61 0.64 0.67 0.62 0.630.00 0.00 0.00 0.00 0.00
10.94 10.79 10.64 10.64 10.840.79 0.79 0.79 0.79 0.793.95 3.95 3.95 3.95 3.753.23 3.23 3.23 3.11 3.23
6.47 6.09 6.00 6.00 6.001.11 1.09 1.04 1.10 1.164.00 4.00 3.70 3.82 4.005.73 5.85 5.56 5.68 5.70
12.90 12.03 13.20 12.99 13.203.35 3.35 3.60 3.60 3.258.00 8.00 8.00 7.73 8.003.00 3.00 3.00 3.00 3.007.00 6.58 7.00 7.00 7.002.84 3.40 3.40 3.40 3.45
3.20 3.10 3.10 3.02 3.101.00 1.00 1.00 1.00 1.00
7.03 7.03 6.67 6.65 6.683.07 3.00 3.00 3.00 3.003.00 3.00 3.00 3.00 3.001.00 1.00 1.00 1.00 1.002.00 2.00 2.48 2.53 2.532.62 2.80 2.79 2.90 2.99
3.40 3.40 3.40 3.40 3.400.25 0.21 0.21 0.21 0.21
Full-Time Equivalent Employees as of June 30
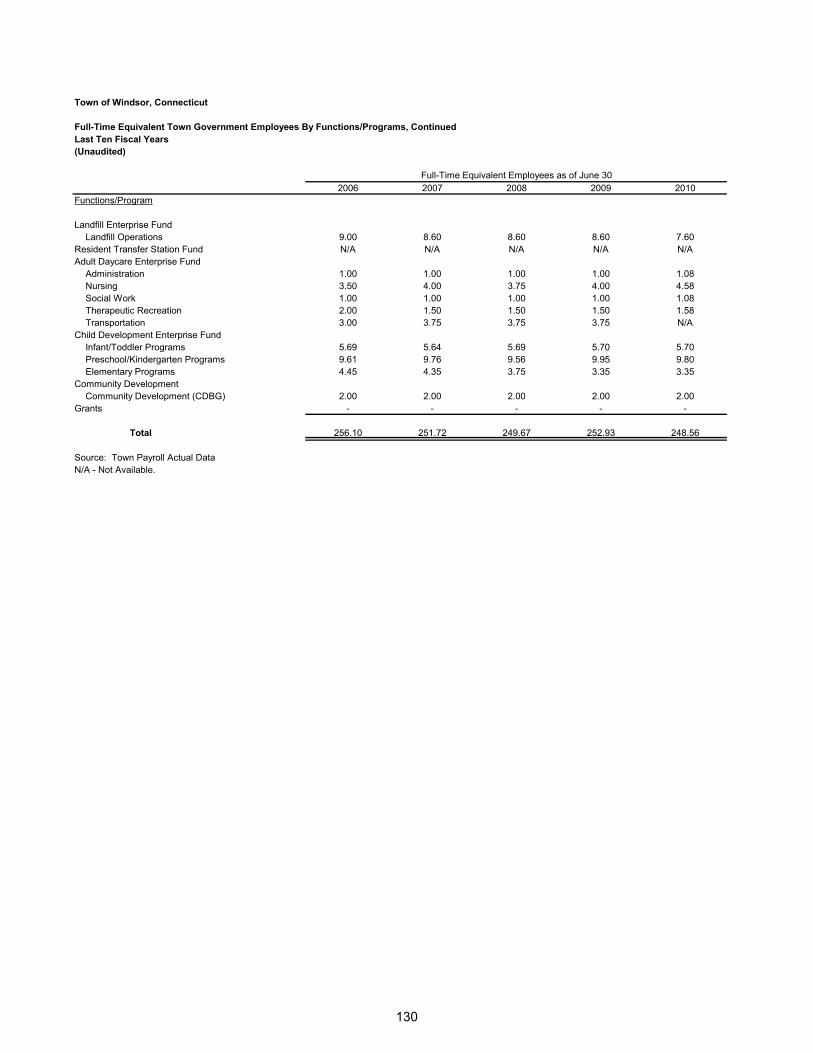
130
Town of Windsor, Connecticut
Full-Time Equivalent Town Government Employees By Functions/Programs, ContinuedLast Ten Fiscal Years(Unaudited)
2006 2007 2008 2009 2010Functions/Program
Landfill Enterprise FundLandfill Operations 9.00 8.60 8.60 8.60 7.60
Resident Transfer Station Fund N/A N/A N/A N/A N/AAdult Daycare Enterprise Fund
Administration 1.00 1.00 1.00 1.00 1.08Nursing 3.50 4.00 3.75 4.00 4.58Social Work 1.00 1.00 1.00 1.00 1.08Therapeutic Recreation 2.00 1.50 1.50 1.50 1.58Transportation 3.00 3.75 3.75 3.75 N/A
Child Development Enterprise FundInfant/Toddler Programs 5.69 5.64 5.69 5.70 5.70Preschool/Kindergarten Programs 9.61 9.76 9.56 9.95 9.80Elementary Programs 4.45 4.35 3.75 3.35 3.35
Community DevelopmentCommunity Development (CDBG) 2.00 2.00 2.00 2.00 2.00
Grants - - - - -
Total 256.10 251.72 249.67 252.93 248.56
Source: Town Payroll Actual DataN/A - Not Available.
Full-Time Equivalent Employees as of June 30
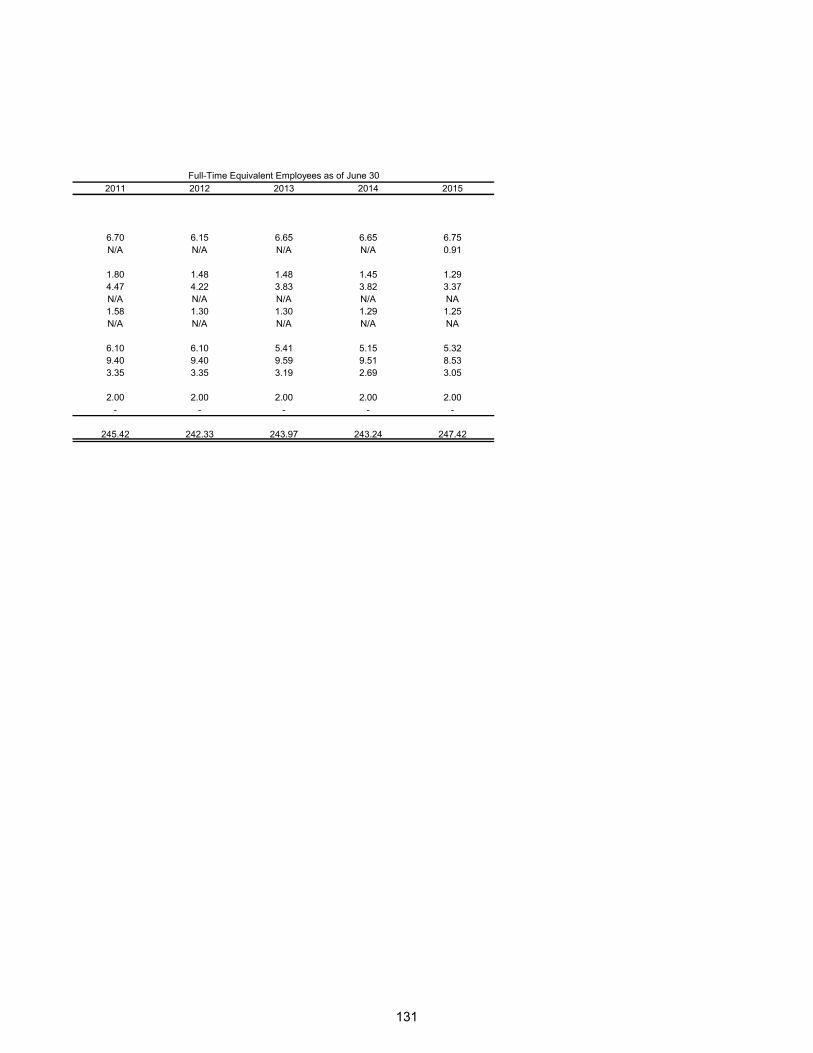
131
2011 2012 2013 2014 2015
6.70 6.15 6.65 6.65 6.75N/A N/A N/A N/A 0.91
1.80 1.48 1.48 1.45 1.294.47 4.22 3.83 3.82 3.37N/A N/A N/A N/A NA1.58 1.30 1.30 1.29 1.25N/A N/A N/A N/A NA
6.10 6.10 5.41 5.15 5.329.40 9.40 9.59 9.51 8.533.35 3.35 3.19 2.69 3.05
2.00 2.00 2.00 2.00 2.00- - - - -
245.42 242.33 243.97 243.24 247.42
Full-Time Equivalent Employees as of June 30
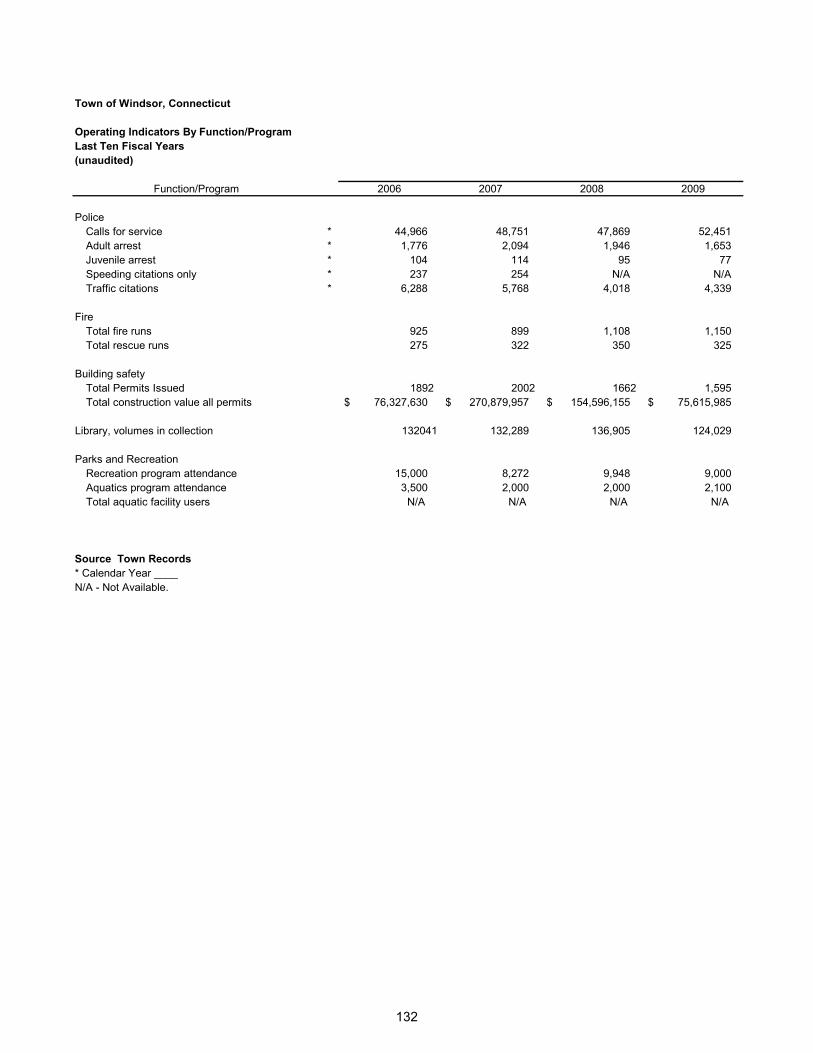
132
Town of Windsor, Connecticut
Operating Indicators By Function/ProgramLast Ten Fiscal Years(unaudited)
Function/Program 2006 2007 2008 2009
PoliceCalls for service * 44,966 48,751 47,869 52,451 Adult arrest * 1,776 2,094 1,946 1,653 Juvenile arrest * 104 114 95 77 Speeding citations only * 237 254 N/A N/A Traffic citations * 6,288 5,768 4,018 4,339
FireTotal fire runs 925 899 1,108 1,150 Total rescue runs 275 322 350 325
Building safetyTotal Permits Issued 1892 2002 1662 1,595 Total construction value all permits 76,327,630 $ 270,879,957 $ 154,596,155 $ 75,615,985 $
Library, volumes in collection 132041 132,289 136,905 124,029
Parks and RecreationRecreation program attendance 15,000 8,272 9,948 9,000 Aquatics program attendance 3,500 2,000 2,000 2,100 Total aquatic facility users N/A N/A N/A N/A
Source Town Records* Calendar Year ____N/A - Not Available.
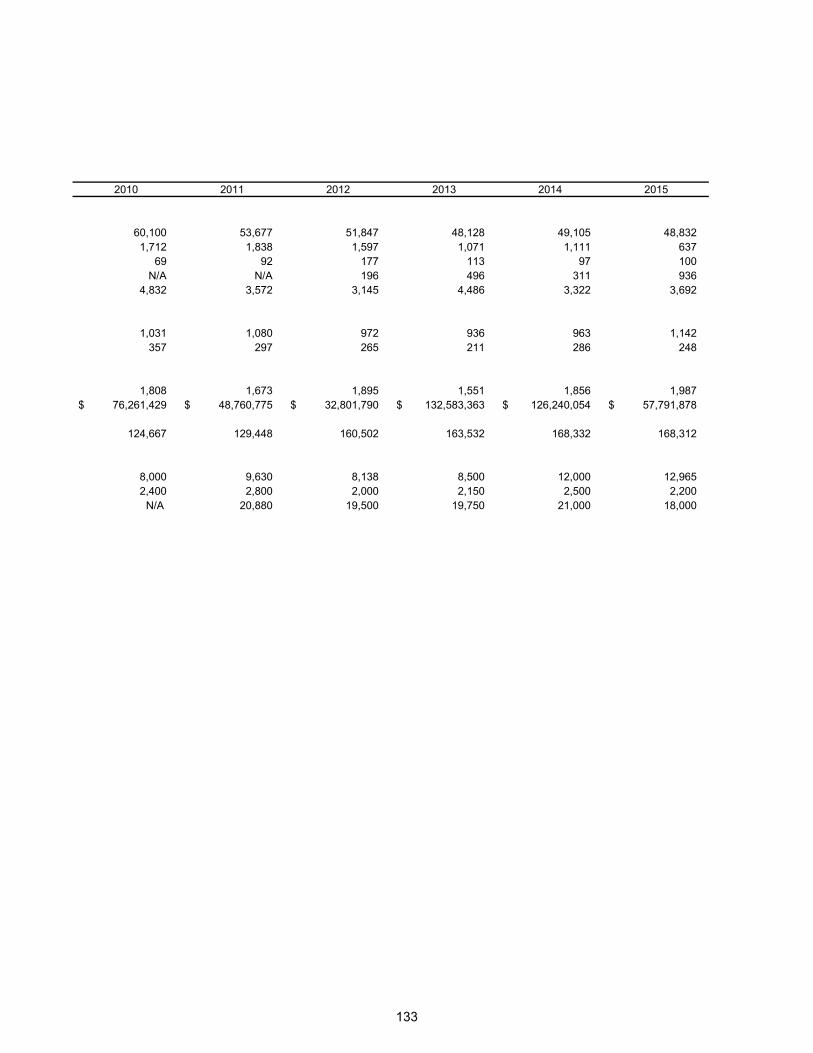
133
2010 2011 2012 2013 2014 2015
60,100 53,677 51,847 48,128 49,105 48,832 1,712 1,838 1,597 1,071 1,111 637
69 92 177 113 97 100 N/A N/A 196 496 311 936
4,832 3,572 3,145 4,486 3,322 3,692
1,031 1,080 972 936 963 1,142 357 297 265 211 286 248
1,808 1,673 1,895 1,551 1,856 1,987 76,261,429 $ 48,760,775 $ 32,801,790 $ 132,583,363 $ 126,240,054 $ 57,791,878 $
124,667 129,448 160,502 163,532 168,332 168,312
8,000 9,630 8,138 8,500 12,000 12,965 2,400 2,800 2,000 2,150 2,500 2,200
N/A 20,880 19,500 19,750 21,000 18,000
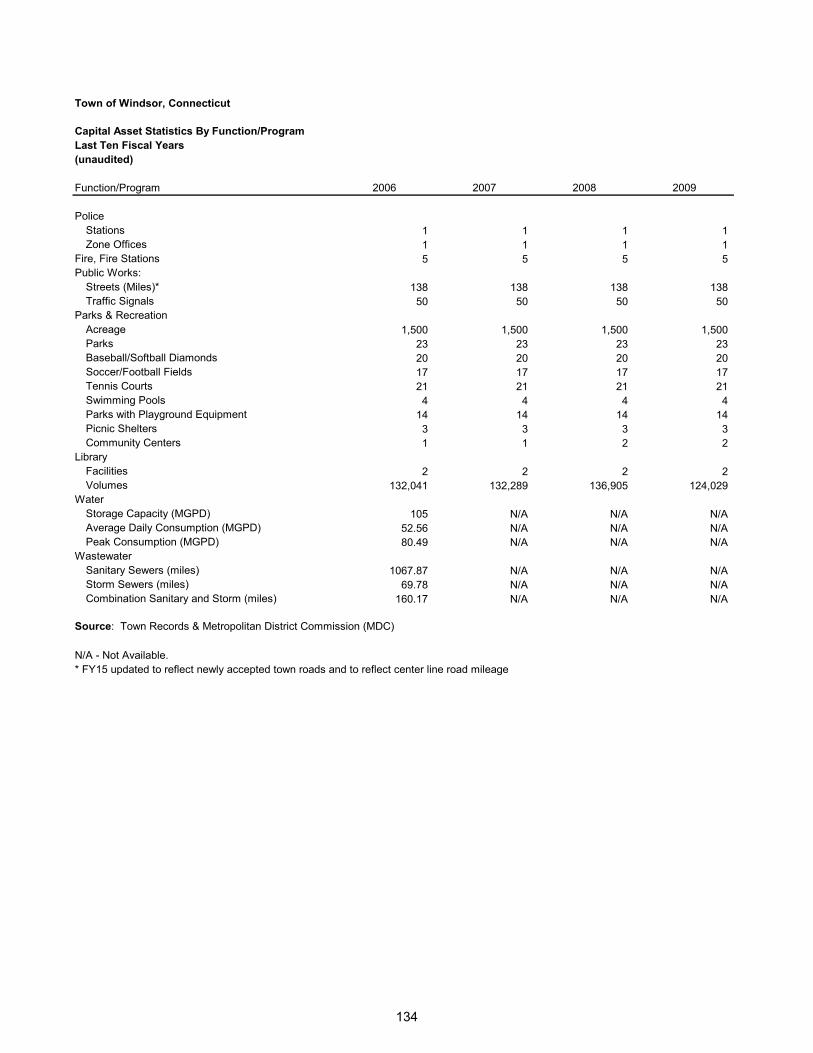
134
Town of Windsor, Connecticut
Capital Asset Statistics By Function/ProgramLast Ten Fiscal Years(unaudited)
Function/Program 2006 2007 2008 2009
PoliceStations 1 1 1 1 Zone Offices 1 1 1 1
Fire, Fire Stations 5 5 5 5 Public Works:
Streets (Miles)* 138 138 138 138 Traffic Signals 50 50 50 50
Parks & RecreationAcreage 1,500 1,500 1,500 1,500 Parks 23 23 23 23 Baseball/Softball Diamonds 20 20 20 20 Soccer/Football Fields 17 17 17 17 Tennis Courts 21 21 21 21 Swimming Pools 4 4 4 4 Parks with Playground Equipment 14 14 14 14 Picnic Shelters 3 3 3 3 Community Centers 1 1 2 2
LibraryFacilities 2 2 2 2 Volumes 132,041 132,289 136,905 124,029
WaterStorage Capacity (MGPD) 105 N/A N/A N/AAverage Daily Consumption (MGPD) 52.56 N/A N/A N/APeak Consumption (MGPD) 80.49 N/A N/A N/A
WastewaterSanitary Sewers (miles) 1067.87 N/A N/A N/AStorm Sewers (miles) 69.78 N/A N/A N/ACombination Sanitary and Storm (miles) 160.17 N/A N/A N/A
Source: Town Records & Metropolitan District Commission (MDC)
N/A - Not Available.* FY15 updated to reflect newly accepted town roads and to reflect center line road mileage
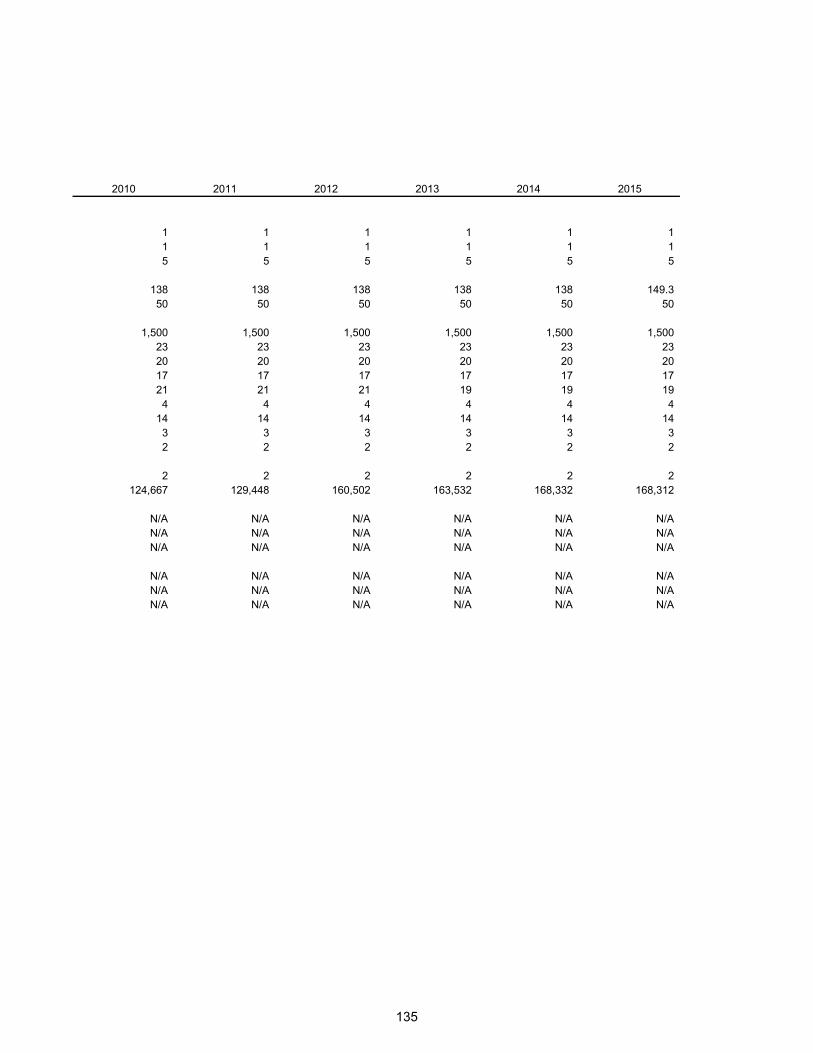
135
2010 2011 2012 2013 2014 2015
1 1 1 1 1 1 1 1 1 1 1 1 5 5 5 5 5 5
138 138 138 138 138 149.3 50 50 50 50 50 50
1,500 1,500 1,500 1,500 1,500 1,500 23 23 23 23 23 23 20 20 20 20 20 20 17 17 17 17 17 17 21 21 21 19 19 19 4 4 4 4 4 4
14 14 14 14 14 14 3 3 3 3 3 3 2 2 2 2 2 2
2 2 2 2 2 2 124,667 129,448 160,502 163,532 168,332 168,312
N/A N/A N/A N/A N/A N/AN/A N/A N/A N/A N/A N/AN/A N/A N/A N/A N/A N/A
N/A N/A N/A N/A N/A N/AN/A N/A N/A N/A N/A N/AN/A N/A N/A N/A N/A N/A

136
This page intentionally left blank.