Embed Size (px)
Citation preview

Comprehensive Annual Financial ReportFor the Year Ended June 30, 2020
A component unit of the State of South Carolina


Prepared by the Controller's Office
Comprehensive Annual Financial Report
For the Year Ended June 30, 2020
A component unit of the State of South Carolina


~ 3 ~
TABLE OF CONTENTS
TITLE PAGE
Introductory Section: Clemson Forward Strategic Plan ............................................................................................................. 7 President's Letter ..................................................................................................................................... 9 Letter of Transmittal ................................................................................................................................ 10 CertificateofAchievement ...................................................................................................................... 14 ClemsonUniversityBoardofTrustees ................................................................................................... 15 ClemsonUniversityOrganizationChart ................................................................................................. 16
Financial Section: IndependentAuditor'sReport .................................................................................................................. 19 Management'sDiscussionandAnalysis ................................................................................................. 22 BasicFinancialStatements: ClemsonUniversity-StatementofNetPosition ................................................................................ 30 ClemsonUniversity-StatementofRevenues,ExpensesandChangesinNetPosition ..................... 31 ClemsonUniversity-StatementofCashFlows .................................................................................. 32 ClemsonUniversityFoundation-StatementofFinancialPosition ................................................... 33 ClemsonUniversityFoundation-StatementofActivities ................................................................. 34 ClemsonUniversityLandStewardshipFoundation-StatementofFinancialPosition ..................... 35 ClemsonUniversityLandStewardshipFoundation-StatementofActivities ................................... 36 IPTAY-StatementofFinancialPosition............................................................................................. 37 IPTAY-StatementofActivities .......................................................................................................... 38 NotestoFinancialStatements: Note 1 - SummaryofSignificantAccountingPolicies ................................................................ 39 Note 2 -CashandCashEquivalents,DepositsandInvestments ................................................. 44 Note 3- Receivables .................................................................................................................... 45 Note 4 -CapitalAssets ................................................................................................................. 47 Note 5 -UnearnedRevenues,DepositsandFundsHeldforOthers ............................................ 47 Note 6-BondsPayable ................................................................................................................ 48 Note 7 - LeaseObligations ........................................................................................................... 51 Note 8 - PensionPlans ................................................................................................................. 53 Note 9 -Post-EmploymentBenefitsOtherthanPensions ........................................................... 59 Note10 -DeferredCompensationPlans ........................................................................................ 63 Note11 -Long-TermLiabilities .................................................................................................... 64 Note12 -ConstructionCostsandCommitments........................................................................... 65 Note13 -RelatedParties ............................................................................................................... 66 Note14 -TransactionswithStateEntities ..................................................................................... 67 Note15 -RiskManagement .......................................................................................................... 68 Note16 -ContingenciesandLitigation ......................................................................................... 69 Note17 -OperatingExpensesbyFunction ................................................................................... 69 Note18 -Donor-RestrictedEndowments ...................................................................................... 70 Note19 -DetailsofRestrictedAssets ........................................................................................... 70 Note20 -ComponentUnits ........................................................................................................... 70 Note21 - SubsequentEvents ......................................................................................................... 72

~ 4 ~
TABLE OF CONTENTS (continued)
TITLE PAGE Financial Section (continued): RequiredSupplementaryInformation: ScheduleofUniversity'sProportionateShareoftheNetPensionLiability ........................................ 73 ScheduleofUniversityContributionstoPensionPlans ...................................................................... 74 ScheduleofUniversity'sProportionateShareoftheNetRetireeHealthBenefitsLiability ............... 75 ScheduleofUniversityContributionstoRetireeHealthBenefitsPlan ............................................... 76
Statistical Section: ScheduleofRevenuesbySource ............................................................................................................ 80 ScheduleofExpensesbyUse ................................................................................................................ 82 ScheduleofExpensesbyFunction ......................................................................................................... 83 ScheduleofNetPositionandChangesinNetPosition .......................................................................... 84 ScheduleofRatiosofOutstandingDebt ................................................................................................. 85 ScheduleofBondCoverage .................................................................................................................... 86 Admissions,EnrollmentandDegreeStatistics ....................................................................................... 88 UndergraduateAverageAnnualTuitionandFees ................................................................................... 90 FacultyandStaffStatistics ...................................................................................................................... 92 ScheduleofCapitalAssetInformation ................................................................................................... 93 DemographicStatistics............................................................................................................................ 94 TenLargestEmployers ............................................................................................................................ 95
Supplementary Information to the Financial Statements: ScheduleofPledgedNetRevenues-AuxiliaryRevenueBonds(Series2005,2015and2015B) ................... 98 ScheduleofPledgedNetRevenues-AthleticFacilitiesRevenueBonds (Series2012,2014A,2014B,2014C,2015,2015Band2018A) ............................................................................ 99 ClemsonUniversityReportingEntity-CombinedStatementofNet/FinancialPosition ....................... 100 ClemsonUniversityReportingEntity-CombinedStatementofRevenues,Expenses, ActivitiesandChangesinNetPosition ............................................................................................... 102

Introductory Section(unaudited)


~ 7 ~
ClemsonForward Strategic Plan
ClemsonForward is built on four key foundations: Research, Engagement, the Academic Core and Living, which spells the acronym REAL. Specific goals and tactics will guide each of those four areas.
RESEARCHClemsonForwardsetsanewbarforresearchfundingandscholarlywork.Clemson’sgoalistocontinuouslyimprove its research quality, quantity and impact; to foster a rich, curiosity-driven intellectualenvironment; to solve real problems; and to create more opportunities for graduates and alumni.This includes continuing unique public/private partnerships driven by the University’s InnovationCampuses, building a culture of innovation and entrepreneurship, and focusing on six strategicinnovationareas—advancedmaterials;cyberinfrastructureandbigdatascience;energy,transportationand advanced manufacturing; human resilience; health innovation; and the sustainable environment.
ENGAGEMENTEngagementwas a cornerstone of the 2020RoadMap and is at the heart of the land-grantmission.ClemsonForwardcapitalizesonexistingstrengthsandopportunitiestoemphasizehigh-impact,evidence-basedacademicandglobalengagement.Italsoemphasizesrigorousassessmentsothatwearebetterabletounderstandandmeasurethelinksbetweentheseengagementexperiencesandstudentlearningandsuccess.
ACADEMIC COREWewillcreateanoptimalpathforacademicprograms—bothundergraduateandgraduate—toachievenational prominence.ClemsonForward enhances the undergraduate academic corewith initiatives ininterdisciplinarycurricula,anewapproachtogeneraleducation,andenhancedadvising.ClemsonForwardalsoextendsthefocusonqualitytothearenaofgraduateeducationandcontainsagreatercommitmenttograduateeducationandthegraduatestudentexperienceatboththemaincampusandtheinnovationcampuses.
LIVINGClemsonForwardwillstrengthenthecherishedsenseofcommunityandconnectednessthatdefinestheClemsonFamilybycreatinganenvironmentthatisdiverse,respectfulandinclusive,furtherenhancingthequalityofstudentlifeanddevelopingpolicies,facilitiesandsupportsystemsthatwillmakeClemsonagreatplacetowork,studyandlive.
KEY ENABLERSTogetherthesepieceswillsupporttherealimpact,realexperience,realintellect,andrealfamilythatmakeuptheheartoftoday’sClemson.Theresearch,engagement,academicandlivinggoalsofClemsonForwardplanrestonfourcriticalenablers:
• Strategic Revenue Growth—Manageenrollment,entrepreneurialactivities,developmentpriorities,operationalefficienciesandrevenueallocationtosupportClemsonForwardinitiatives.
• College reorganization —Enhancethelearningandworkingenvironmentinthesevenacademiccolleges.
• Building Futures —Buildstate-of-the-artnewfacilities,renovateagingstructuresandcreatemulti-functionspacesthatprovideavibrantacademicenvironment.
• Accountability and Leadership —Prudentlymanageexistingresources.Concentratemetricsonmeasuringimpactratherthanactivity.


~ 9 ~
DearFriendsofClemson:
ThesecondhalfofFiscalYear2020wasunlikeanythingIhaveseeninmy31yearsinhighereducation–unlikeanythinganyofushaveseen.ButClemsonUniversitywasverystrongbeforetheCOVID-19pandemichit,andwearewell-positionedtocomeoutstrongontheotherside.
WeareblessedwithincredibleleadershipfromourBoardofTrustees,andIamthankfulformyleadershipteamandourvolunteerboards.Allhavedoneanoutstandingjobthroughoutthecrisis.
Infaceofmanyoperationalchallenges,Clemsoncontinuedtoexcel.Thispastyearwasanotherrecord-settingyearforClemsoninadmissions,enrollment,research,diversity,graduationandretentionrates.WewereonceagainrankedamongthetoppublicuniversitiesbyU.S.News&World,andwerereaffirmedasaResearch1UniversitybyCarnegieClassificationforInstitutionsofHigherEducation.WearealsorankedintheTop10nationallybyPrincetonReviewinarecord-settingninecategories—careerservices,town-gownrelations,studentspackthestadium,studentsplayintramuralsports,happieststudents,bestschoolsforinternships,bestalumninetwork,studentslovetheircollege,andbestforfutureRotariansandmembersoftheDAR.
TheClemsoncampuscontinuestoevolveandgrow.Constructioniswellunderwayforournewchilddevelopmentcenterandsocceroperationscomplex.Weopenedthesoftballstadium,andtheAndyQuattlebaumOutdoorEducationCenter.WehavecompletedconstructiononthenewCollegeofBusinessbuildingandlookforwardtoitsopeningintheFall.
PrivategiftstoClemsonUniversityandIPTAYthisfiscalyearonceagainexceededourintialgoal.Infact,thisistheninthconsecutiveyearthatannualfundraisingatClemsonhasexceeded$100millionandfourthstraightyearittopped$150million.Themoneyraisedwillbenefitstudents,faculty,andstaffforgenerationstocome,andIamthankfulforallofourgenerousdonorsandpartners.
WiththeemergenceofCOVID-19,ClemsonquicklyactivatedourEmergencyOperationsCenter,facilitatedthereturnofourstudyabroadandexchangestudents,andexecutedacademiccontinuityplansalreadyinplaceandtested.ThisallowedClemsontoquicklymoveonline.Fortheseefforts,ClemsonUniversitywasmentionedinTheChronicleofHigherEducationasaleaderinthisarea.
ClemsonUniversityendedFY2020strongandfocusedonreturningtoon-campuslearningandlivingintheFallwhileprioritizingthehealthandsafetyofourstudents,employeesandsurroundingcommunities.Thiscomplexundertakingisbeingcarriedoutinathoughtfulanddata-drivenmannerbyClemson’sfaculty,staffandadministrativeleadership.
ThankyouforsupportingClemsonUniversityaswecontinueworktogetherduringuncertaintermsasthenewfiscalyearbegins.
Sincerely,
JamesP.Clements,Ph.D.President
President’s Letter2020

~ 10 ~
LETTER OF TRANSMITTAL
September28,2020
ToPresidentClements,MembersoftheBoardofTrustees,andCitizensofSouthCarolina
WearepleasedtopresenttoyoutheComprehensiveAnnualFinancialReportofClemsonUniversityfor theyear ended June30, 2020. The report providesfinancial information about theUniversity’soperationsduringtheyearanddescribesitsfinancialpositionattheendoftheyear. Management assumes full responsibility for the completeness and reliability of the informationcontainedinthisreport,baseduponacomprehensiveframeworkofinternalcontrolsthatwasestablishedforthispurpose.Becausethecostofinternalcontrolsshouldnotexceedtheanticipatedbenefits,theobjectiveistoprovidereasonable,ratherthanabsolute,assurancethatthefinancialstatementsarefreeof material misstatements. Statelaw,federalguidelines,andcertainbondcovenantsrequirethattheUniversity’saccountingandfinancialrecordsbeauditedeachyear.ForthefiscalyearendedJune30,2020,theUniversitycontractedwiththeindependentcertifiedpublicaccountingfirmofElliottDavis,LLC,toperformtheUniversity’sannualaudit.Theauditorshaveissuedanunmodifiedopinion,themostfavorableoutcomeoftheauditprocess.Theindependentauditor’sreportislocatedatthefrontofthefinancialsection. Management’sdiscussionandanalysis(MD&A)immediatelyfollowstheindependentauditor’sreportandprovidesanarrativeintroduction,overview,andanalysisofthebasicfinancialstatements.MD&Acomplementsthisletteroftransmittalandshouldbereadinconjunctionwithit.
Profile of the University ClemsonUniversitywas founded in1889, a legacyofThomasGreenClemson,whowilledhisFortHillplantationhome,itssurroundingfarmlandsandforest,andotherpropertytothestateofSouthCarolinatoestablishatechnicalandscientificinstitutionforSouthCarolina.Clemsonopeneditsdoorsto446studentsasamilitarycollegein1893. Today,ClemsonisclassifiedbytheCarnegieFoundationasaResearch/HighUniversity,acategoryattainedbyapproximately4percentofalluniversitiesinAmerica.Studentscanchoosefrommorethan80undergraduateandover110graduatedegreeprogramsinsevencolleges.Asthestate’sland-grantuniversity,Clemsonreachesouttocitizens,communities,andbusinessesalloverSouthCarolinathroughcounty-basedCooperativeExtensionoffices,fiveoff-campusResearchandEducationCenters,andcriticalregulatoryresponsibilitiesforplantandanimalhealth. ClemsonUniversityisgovernedbyaboardofthirteenmembers,includingsevensuccessormembersandsixmemberselectedbytheStateGeneralAssembly.ClemsonUniversityoperatesasaunitoftheStateofSouthCarolina(theprimarygovernment)asastateassistedinstitutionofhighereducation. TheStaterequirestheUniversitytosubmitanannualbalancedbudgetforbothitsEducationalandGeneralandExtensionandPublicServicecomponents.EachrecognizedcollegeorbudgetcenteroftheUniversityisprovidedwithalevelofappropriation.Thisappropriationlimitstotalannualexpenditures.BudgetarycontrolsareincorporatedintoboththeUniversity’saccountingsystemandtheState’sfinancialmanagementsystem toensure that imposedexpenditureconstraintsareobserved. PeriodicfinancialreportscomparingactualresultswithbudgetedamountsareprovidedatboththeUniversityandStatelevel.

~ 11 ~
GovernmentalAccounting StandardsBoard (GASB)CodificationSection2100:Defining the Financial Reporting Entity,andSection2600:Reporting Entity and Component Unit Presentation and Disclosure,providescriteriaforwhethercertainorganizationsshouldbereportedascomponentunitsbased on the nature and significance of their relationshipto the related entity. Basedon this criteria, theUniversitydetermined that theClemsonUniversity Foundation, theClemsonUniversityLandStewardshipFoundationandIPTAYareindeedcomponentunitsoftheUniversity.Consequently,thefinancial statements include theaccountsof these threeentitiesasdiscretelypresentedcomponentunits.
Local Economy SouthCarolina’s unemployment ratewas 8.7% at theendofJune2020–lowerthanthenationalaverageof11.1%at that time and 5.2%higher than June 2019.The SouthCarolinaEconomicOutlook,publishedbytheSouthCarolinaDepartment ofCommerce, reports a 126,100 decrease ofnonfarmjobs,withthemostdeclineinleisureandhospitality,professionalandbusinessservices,government,andeducationandhealthservices.TheEconomicOutlookalsoreportsa0.8%increaseinstatepersonalincomeanda0.3%decreaseintheSouthCarolinastockindex. TheSouthCarolinarealestatemarketreflectedageneralupwardtrend.Increasedmediansalespriceof7.6%,residentialbuildingpermitsof30.6%andvaluationofresidentialbuildingpermitsof34.8%fromJune2019topresentcontributedtotheupswingwhileforeclosuresandclosingsdecreasedby80.9%and1.1%,respectively,inthesameperiod.Theseresultsarefactorsofconsumertrends,legislativechangesandeconomicgrowth. One economic challenge that SouthCarolina faces isworkforce availability.While the SC unemployment ratehas increased in the last year, SouthCarolinaSecretaryofCommerce,BobbyHittstatesthat“toensurewehaveareadyworkforceforbothexistingandfutureindustry,wehavetothinkcreativelyaboutourapproachtoworkforcesolutions.” SouthCarolinaisranked11thamongallstatesinexportsales,reporting$41.5billionfor2019witha19.7%increaseover the 2018 total.The increased use of SouthCarolinaportsplaysabigpartintheeconomicimpactonexportsales.“S.C.Portsisatremendousassetforthestate,”SCPABoardChairmanBillSternsaid.“ItsroleofmovingcargobetweenSouthCarolinaandglobalmarketsleadstojobcreationandindustryrecruitment.Manyofourstate’sbiggesteconomicdevelopmentwinswouldnothavecometofruitionwithoutthePort.WearedeeplyproudofthegrowthSCPAbringstothestateandtheimpactitmakesonSouthCarolinians.”
COVID-19 InMarch2020,inresponsetotheExecutiveOrdersofGovernorHenryMcMasterandinanefforttominimizetherisk ofCOVID-19, theUniversity transitioned to remotelearning,closedresidencehallsandothercampusfacilities,andcancelledallactivities. Despitethepandemic,enrollmentforthefall2020semestergrewbyapproximatelythreepercentovertheprioryear.TheUniversitybeganthefall2020semesterwithremoteinstructionand implemented a staggeredmove-in approachwith itsfirststudentsmovingintocampusresidencehallsbeginningSeptember11th. In-person learningbeganSeptember21standincludesahybridofonlineandin-personclassesforthedurationofthefallsemester.TheUniversityhasimplementedcontingencyplanswhichincludepreparationofon-campusandoff-campusspacetobeusedforquarantinepurposes,arobusttestingstrategy,andexpandedhealthcareservicecapacity.TheUniversityhasalsoworkedwithvariousvendors,suchasfoodserviceproviders,toalteroperationstofacilitatesocialdistancingandothersafetyprotocols. TheUniversity instituted a variety of cost reductionmeasuresasaresultofthepandemicandispoisedtoenactadditional cost reductionmeasures as necessary during theupcomingfiscal year. Thedegreeof future impacts to theUniversity’soperationsandfinancesareextremelydifficulttopredictduetothedynamicnatureoftheCOVID-19outbreak,includinguncertaintiesrelatingtoitsduration,severity,ultimategeographicspread,aswellasactionsbyothergovernmentalauthorities including limitations on public assemblies andgatherings.TheUniversitycontinuestocloselymonitorandrespondtoCOVID-19.Foradditionalinformation,seeNote21inthenotestothefinancialstatements.

~ 12 ~
Major Initiatives The 2019-20 academic and fiscal yearwas anotherproductiveyear forClemsondespite the fact that itwasanunusual year due to the challenges presented by a globalpandemic. Clemson once again raised the bar in admissions,enrollment,research,diversity,graduationandretentionratesandcontinuestomakesignificantinvestmentsinitsfacilities. TheUniversitywas reaffirmedaResearch1universityby theCarnegieClassification for Institutions ofHigherEducation.Clemsoncontinuestoberecognizedasoneofthetopnationalpublicuniversities,rankednumber29,asrecentlyannouncedbyU.S. News & World Report. PresidentClementswelcomedDr.NicholasVazsonyiasDeanoftheCollegeofArchitecture,ArtsandHumanities,andRickPetilloastheUniversity’snewChiefFinancialOfficer. PrivategiftstoClemsonUniversityandIPTAYthisfiscalyearonceagainexceededthegoalsetfortheFY.Infact,thiswas the ninth consecutive year that annual fundraising atClemsonexceeded$100million,andthefourthstraightyearittopped$150million–raisingmorethan$158millionthisyear.Unfortunately,wedidnotholdourfourthannualGiveDayduetooperationalconcernsrelatedtoCOVID-19.However,theuniversitydidformtheCommitteeonPhilanthropyandgreatworkhasalreadybeenaccomplishedbymanyinpreparingforournextcapitalcampaign. ClemsonUniversityandtheCityofClemson,together,revampedtheJointCity/UniversityAdvisoryBoardandsharedinformation,accomplishmentsandprioritesattheannualStateofClemsonluncheon.
Highlights, news and major milestones of the year in-clude:• RibboncuttingswereheldfortheMcBrideAquaticGarden
attheSCBotanicalGardenandthemuchanticipatednewsoftballfacility.Wealsocelebratedtheopeningofthenewroboticmilking system at theLaMasterDairyCenter,andhostedthegrandopeningoftheAndyQuattlebaumOutdoorEducationCenter.
• Clemsonwelcomed several notable visitors includingIndian industrialist and philanthropist, RatanTata;Convocationkeynotespeaker,JoeErwin,entrepreneurandAcademicCornerstonePartner;andthekeynotespeakerforthePresident’sForumforInclusiveExcellence,FrankMatthews, publisher and editor ofDiverse: Issues in Higher Educationmagazine.
• ClemsonhostedthefourthNationalMenofColorSummit.The two-day event designed to close the achievementgapforAfrican-AmericanandHispanicmalesfromthecradletotheircareerswasattendedby2,000highschoolandcollegestudents,businessprofessionals,educators,governmentofficialsandcommunityleadersfromaroundthe country.Notable speakerswereAlbertoGonzales,
82ndU.S.AttorneyGeneral;AkbarGbaja-Biamila,TVhostandformerNFLplayer;JimMurren,ChairmanofMGMResorts International; andNBA legend,Earvin“Magic”Johnson.
• Clemson received theHigherEducationExcellence inDiversityAwardforthethirdyearinarow.TheSchoolofArchitecturewas named one of “America’s BestArchitectureandDesignSchools”byDesignIntelligence. AndtheCollegeofEducation’sMasterofEducationinTeachingandLearningProgramwasnamedthe#1onlinegraduateeducationprograminthenationbyU.S. News & World Reportforthethirdconsecutiveyear.
• MaryBethKurzwas awarded theClass of ’39Awardfor Excellence, and the university awarded theClemson Medallion– the highest honor bestowedbytheBoard ofTrustees – to two distinguished alumni:ProfessorEmeritusBeverly“Ben”SkardonandTrusteeEmeritusAllenPriceWood.
Statewide Initiatives• In a partnership with the Medical University of
SouthCarolina, andwith state financial support viaappropriations,Clemson introduced theHealthyMe–HealthySCprogramtoincreasehealthcareaccessandfighthealthcaredisparitiesstatewide.
• ClemsonUniversity andDukeEnergy partnered in aprogramtotakeamobileengineeringlabtomiddleschoolstudentsacrossSouthCarolina.TheExploreMobileLabprovidedan innovativeapproach toeducatingstudentsaboutthecriticalandgrowingfieldofengineering.
• Clemson established theCollege ofBusiness PhyferInnovationHubtobringinnovationtotheworkplaceandconnectentrepreneurswithbusinessmentors.
• InFebruary,ClemsonDayattheStateHousewasheldinColumbia.Theeventservedasawaytosay“thankyou”tothemembersoftheGeneralAssemblyfortheirsupport,butalsoallowedthecontingentfromClemsontohighlightbudgetprioritiesforClemson.
• A team fromClemson’s Baruch Institute is leadingresearchinthestatetoevaluatecost-effectiveinfrastructureinterventionsformitigatingfloodrisksincoastallocalesthankstocollaborationwithandfundingfromtheNationalOceanicandAtmosphericAdministrationandtheS.C.SeaGrantConsortium.

~ 13 ~
• TwoClemsonfreshmendesignedadevicetobelocatedatsupermarketcheckoutlanestodisinfectitemsthroughexposuretoUVClight.
• Clemson researchers from theCollegeofEngineering,ComputingandAppliedSciencesvolunteeredtheirtimeand resources as part of a statewide effort to developserologicteststodetectCOVID-19antibodies.
• ClemsonfacultyandstafffromtheCollegeofBehavioral,Social, andHealth Sciences, in coordinationwith theUnitedWayandTenat theTop, createdan interactivemapthatprovidesinformationondifferentfoodresourcesacrosstheUpstate.
• TheClemsonUniversityArchitecture+CommunityBuildprogram inCharleston provided concepts of portable,accessible, and safewalk-up testing facilities for theMedicalUniversityofSouthCarolina.
Awards and Acknowledgements TheGovernment FinanceOfficersAssociation of theUnited States andCanada (GFOA) awarded aCertificateofAchievement forExcellence in FinancialReporting toClemsonUniversity for its comprehensive annualfinancialreportforthefiscalyearendedJune30,2019.TheCertificateofAchievementisaprestigiousnationalawardrecognizingconformancewiththehigheststandardsforpreparationofstateandlocalgovernmentfinancialreports. InordertobeawardedaCertificateofAchievement,agovernmentunitmustpublishaneasilyreadableandefficientlyorganized comprehensive annual financial report (CAFR),whosecontentsconformtoprogramstandards.SuchaCAFRmustsatisfybothgenerallyacceptedaccountingprinciplesandapplicablelegalrequirements. A Certificate ofAchievement is valid for a periodof one year only. ClemsonUniversity has received theCertificate ofAchievement annually since the fiscal yearendedJune30,1993.Webelieveourcurrentreportcontinuesto conform to the Certificate ofAchievement programrequirements,andwearesubmittingittotheGFOA. ThepreparationoftheComprehensiveAnnualFinancialReport in a timelymannerwould not have been possiblewithoutthecoordinatedeffortsoftheController’sOfficeandotherUniversityfinancialstaff.Eachmemberhasoursincereappreciationfortheircontributionsinthepreparationofthereport.
AnthonyE.WagnerExecutive Vice President for Finance and Operations
Campus Operations and COVID-19 Response ClemsonUniversity remained focused on providingworld-classeducation,researchandserviceeveninthefaceof the unprecedented public health challenge presented byCOVID-19.
• Clemson’sEmergencyOperationsCenter(EOC)beganplanningandinformation-gatheringinJanuary2020andactivatedtheEOCinlateFebruary.
• ClemsonthenbegantheprocessofbringinginternationalstudyabroadandexchangestudentsbacktotheU.S.
• TheUniversity executed continuity plans already inplaceandtested.ThisallowedClemsontoquicklymoveonlineandlaterbementionedinThe Chronicle of Higher Educationasaleaderinthisarea.
• Clemsonmoved more than 5,800 course sectionscompletelyonline.Additionally,900Zoomclassesand500WebExclasseswerehelddaily.
• ClemsonComputing&InformationTechnology(CCIT)distributednearly400wi-fihotspotsand115laptopstohelpgetusersonline.
• CommencementceremoniesscheduledinMayandAugust2020werepostponedandallsummercoursesweremovedonline.RegistrationandorientationfortheFallwerealsomovedonline.
• Allsummercampsandprogramswerecancelled.
ClemsonUniversityendedFY2020focusedonreturningtoon-campuslearningandlivingintheFallwhileprioritizingthehealthandsafetyofourstudents,employeesandsurroundingcommunities.Thiscomplexundertakinghasbeencarriedoutinathoughtfulanddata-drivenmannerbyClemson’sfaculty,staffandadministrativeleadership.
COVID-related Research The challenges brought on by COVID-19 providedstudents and faculty a unique opportunity to innovate andadvancetheirstudiesandexperiences.• Agroupof researchprofessors, graduate students and
2020graduatesfromtheCollegeofArchitecture,ArtsandHumanitiesrepurposed183DprintersinLeeHalltomakefaceshields.UndergraduatesintheClemsonUniversity’sMakerspacewithin theWattFamily InnovationCenteralsocontributedfaceshields.
• A student-led group in the College of Engineering,Computing andApplied Sciences designed and builtprototypes of a “negative pressure” device to fit overpatients’headstokeepthevirusfromspreadingtoothersintheroom.
~ 14 ~

~ 15 ~
CLEMSON UNIVERSITYBOARD OF TRUSTEES
TRUSTEES
E.SmythMcKissick,III,ChairmanCEO,AliceManufacturingCompany,Inc.
Ronald(Ronnie)D.Lee,Vice ChairmanRonaldD.Lee,DMD,P.C.
DavidE.DukesPartner,NelsonMullinsRiley&ScarboroughLLP
LouisB.LynnPresident,ENVIROAgScience,Inc.
Patricia(Patti)H.McAbeeConsultant
JohnN.(Nicky)McCarter,Jr.President,DefenderServices,Inc.
Robert(Bob)L.PeelerManager,CommunityandMunicipalRelationsWaste Management Inc. CheriM.PhyferPresident,FortuneBrandsGlobalPlumbingGroup
MarkS.RichardsonOwner,MARRealEstate,LLC
William(Bill)C.Smith,Jr.CEO,RedRockDevelopments
Joseph(Joe)D.SwannPresident,RetiredRockwellAutomationPowerSystems
KimWilkersonPresident,SouthCarolinaBankofAmerica
DavidH.WilkinsPartner,NelsonMullinsRiley&ScarboroughLLP
TRUSTEE EMERITI
J.J.BrittonSumterFamilyHealthCenter
Leon(Bill)J.Hendrix,Jr.Chairman,RetiredRemingtonArmsCompany
HaroldD.(Doug)KingsmoreRetired
Thomas(Tom)B.McTeer,Jr.President,McTeerRealEstate,Inc.
AllenWoodRetired
(asofJune30,2020)

~ 16 ~
CLEMSON UNIVERSITY BOARD OF TRUSTEES
EXECUTIVE SECRETARYTO THE BOARD
Chip Hood
PRESIDENTJames P. Clements, Ph.D.
EXECUTIVE VICE PRESIDENTOF ACADEMIC AFFAIRS AND PROVOST
Robert Jones, Ph.D.
CLEMSON UNIVERSITYORGANIZATION CHART
ATHLETIC DIRECTORDaniel Radakovich
EXECUTIVE VICE PRESIDENTFOR FINANCE AND OPERATIONS
Anthony E. Wagner
DIRECTORINTERNAL
AUDITCathy Howe
CHIEF FINANCIAL
OFFICERRichard Petillo
INTERIM CHIEF HUMAN RESOURCES OFFICER
Alejandra Kennedy Ph.D
VICE PRESIDENTUNIVERSITY RELATIONS
Mark Land
VICE PRESIDENT FOREXTERNAL AFFAIRS AND SENIOR ADVISOR
TO THE BOARD OF TRUSTEESAngie Leidinger
VICE PRESIDENT FOR PUBLIC SERVICE AND AGRICULTURE
George Askew, Ph.D.
VICE PRESIDENT AND CIOCLEMSON COMPUTING AND
INFORMATION TECHNOLOGYRussell Kaurloto
VICE PRESIDENTFOR RESEARCH
Tanju Karanfil, Ph.D.
INTERIM VICE PRESIDENTFOR STUDENT AFFAIRS
Chris Miller, Ph.D.
VICE PRESIDENTDEVELOPMENT AND ALUMNI RELATIONS
Brian O’Rourke
CHIEF DIVERSITY OFFICER AND SPECIAL ASSISTANT TO THE PRESIDENT
FOR INCLUSIVE EXCELLENCELee A. Gill
ASSISTANT VICE PRESIDENTACCESS AND EQUITY
Lewis Knighton, Jr.
VICE PRESIDENT AND CHIEF OF STAFFMax Allen
GENERAL COUNSELAND EXECUTIVE SECRETARY TO THE BOARD OF TRUSTEES
Chip Hood
Financial Section


~ 19 ~
elliottdavis.com
Independent Auditor’s Report Members of the Board of Trustees Clemson University Clemson, South Carolina Report on the Financial Statements We have audited the accompanying financial statements of the business‐type activities and the aggregate discretely presented component units of Clemson University (the University), a component unit of the State of South Carolina, as of and for the year ended June 30, 2020, and the related notes to the financial statements, which collectively comprise the University's basic financial statements as listed in the table of contents. Management's Responsibility for the Financial Statements Management is responsible for the preparation and fair presentation of these financial statements in accordance with accounting principles generally accepted in the United States of America; this includes the design, implementation, and maintenance of internal control relevant to the preparation and fair presentation of financial statements that are free from material misstatement, whether due to fraud or error. Auditor's Responsibility Our responsibility is to express opinions on these financial statements based on our audit. We did not audit the financial statements of the Clemson University Foundation (a discretely presented component unit), the Clemson University Land Stewardship Foundation (a discretely presented component unit), and IPTAY (a discretely presented component unit). The Clemson University Foundation, the Clemson University Land Stewardship Foundation, and IPTAY represent 100% of total assets, 100% of net assets or position, and 100% of total revenues of the discretely presented component units. Those statements were audited by other auditors whose reports have been furnished to us, and our opinions, insofar as they relate to the amounts included for these discretely presented components units, are based solely on the reports of the other auditors. We conducted our audit in accordance with auditing standards generally accepted in the United States of America and the standards applicable to financial audits contained in Government Auditing Standards, issued by the Comptroller General of the United States. Those standards require that we plan and perform the audit to obtain reasonable assurance about whether the financial statements are free from material misstatement. The financial statements of the Clemson University Foundation, the Clemson University Land Stewardship Foundation and IPTAY were not audited in accordance with Government Auditing Standards, issued by the Comptroller General of the United States.

~ 20 ~
Auditor's Responsibility An audit involves performing procedures to obtain audit evidence about the amounts and disclosures in the financial statements. The procedures selected depend on the auditor's judgment, including the assessment of the risks of material misstatement of the financial statements, whether due to fraud or error. In making those risk assessments, the auditor considers internal control relevant to the entity's preparation and fair presentation of the financial statements in order to design audit procedures that are appropriate in the circumstances, but not for the purpose of expressing an opinion on the effectiveness of the entity's internal control. Accordingly, we express no such opinion. An audit also includes evaluating the appropriateness of accounting policies used and the reasonableness of significant accounting estimates made by management, as well as evaluating the overall presentation of the financial statements. We believe that the audit evidence we have obtained is sufficient and appropriate to provide a basis for our audit opinions. Opinions In our opinion, based on our audit and the reports of other auditors, the financial statements referred to above present fairly, in all material respects, the respective financial position of the business‐type activities and the aggregate discretely presented component units of the University as of June 30, 2020, and the respective changes in financial position and, where applicable, cash flows thereof for the year then ended in accordance with accounting principles generally accepted in the United States of America. Required Supplementary Information Accounting principles generally accepted in the United States of America require that Management’s Discussion and Analysis on pages 22‐29, Schedule of University’s Proportionate Share of Net Pension Liability on page 73, Schedule of University Contributions to Pension Plans on page 74, Schedule of University’s Proportionate Share of Net Retiree Health Benefits Liability on page 75, and Schedule of University Contributions to Retiree Health Benefits Plan on page 76 be presented to supplement the basic financial statements. Such information, although not a part of the basic financial statements, is required by the Governmental Accounting Standards Board who considers it to be an essential part of financial reporting for placing the basic financial statements in an appropriate operational, economic, or historical context. We have applied certain limited procedures to the required supplementary information in accordance with auditing standards generally accepted in the United States of America, which consisted of inquiries of management about the methods of preparing the information and comparing the information for consistency with management’s response to our inquiries, the basic financial statements and other knowledge we obtained during our audit of the basic financial statements. We do not express an opinion or provide any assurance on the information because the limited procedures do not provide us with sufficient audit evidence to express an opinion or provide any assurance.

~ 21 ~
Other Information Our audit was conducted for the purpose of forming opinions on the financial statements that collectively comprise the University’s basic financial statements. The Introductory Section, Statistical Section, Schedule of Pledged Net Revenues – Auxiliary Revenue Bonds (Series 2005, 2015 and 2015B), Schedule of Pledged Net Revenues – Athletic Facilities Revenue Bonds (Series 2012, 2014A, 2014B, 2014C, 2015, 2015B and 2018A), Clemson University Reporting Entity – Combined Statement of Net/Financial Position, and Clemson University Reporting Entity – Combined Statement of Revenues, Expenses, Activities and Changes in Net Position, as listed in the accompanying table of contents are presented for purposes of additional analysis and are not a required part of the financial statements. Such information has not been subjected to the auditing procedures applied in the audit of the basic financial statements, and accordingly, we do not express an opinion or provide any assurance on it. Other Reporting Required by Government Auditing Standards In accordance with Government Auditing Standards, we have also issued our report dated September 28, 2020 on our consideration of the University's internal control over financial reporting and on our tests of its compliance with certain provisions of laws, regulations, contracts, and grant agreements and other matters. The purpose of that report is to describe the scope of our testing of internal control over financial reporting and compliance and the results of that testing, and not to provide an opinion on internal control over financial reporting or on compliance. That report is an integral part of an audit performed in accordance with Government Auditing Standards in considering the University's internal control over financial reporting and compliance. Greenville, South Carolina September 28, 2020

UNAUDITED
~ 22 ~
MANAGEMENT’S DISCUSSION AND ANALYSIS
Overview of the Financial Statements and Financial Analysis ClemsonUniversity is pleased to present its financialstatements for fiscal year 2020. While audited financialstatements forfiscal year 2019 are not presentedwith thisreport,condensedoperationsandfinancialpositiondatawillbepresentedinthissectioninordertoillustratecertainincreasesanddecreases.However,theemphasisofdiscussionsaboutthesestatementswillbeoncurrentyeardata. There are three financial statements presented: theStatement of Net Position; the Statement of Revenues,ExpensesandChangesinNetPosition;and,theStatementofCashFlows.Thesestatementspresentfinancialinformationinaformatsimilartothatusedbyprivatecorporations. ThisdiscussionandanalysisoftheUniversity’sfinancialstatementsprovidesanoverviewofitsfinancialactivitiesfortheyear.
Statement of Revenues, Expenses and Changes in Net Position TheStatementofRevenues,ExpensesandChangesinNetPositionpresentstherevenuesearnedandexpensesincurredduringtheyear.Activitiesarereportedaseitheroperatingornonoperating. All thingsbeingequal,apublicuniversity’sdependency on state aid and giftswill result in operatingdeficits. TheGASBrequires stateappropriationsandgiftstobeclassifiedasnonoperatingrevenues.Theutilizationoflong-livedassets,referredtoascapitalassets,isreflectedinthefinancialstatementsasdepreciation,whichamortizesthecostofanassetoveritsexpectedusefullife. ChangesintotalnetpositionaspresentedontheStatementofNet Position is based on the activity presented in theStatementofRevenues,Expenses,andChangesinNetPosition.Thepurposeofthestatementistopresenttherevenuesreceivedbytheinstitution,bothoperatingandnonoperating,andtheexpensespaidbytheinstitution,operatingandnonoperating,andanyotherrevenues,expenses,gainsandlossesreceivedorspentbytheinstitution. Generallyspeaking,operatingrevenuesarereceivedforprovidinggoodsand services to thevariouscustomersandconstituenciesoftheinstitution.Operatingexpensesarethoseexpensespaidtoacquireorproducethegoodsandservicesprovided in return for theoperating revenues, and to carryout themission of the institution. Nonoperating revenuesarerevenuesreceivedforwhichgoodsandservicesarenotprovided. State capital appropriations and capital grantsandgiftsareconsideredneitheroperatingnornonoperatingrevenuesandarereportedafter“Incomebeforeotherrevenues,expenses,gainsorlosses.” TheCondensedStatement ofRevenues,Expenses andChangesinNetPositionreflectsapositiveyearwithanincreaseinNetPositionattheendoftheyear.SomehighlightsoftheinformationpresentedonthisStatementareasfollows:
Total Revenues – increase of $40.8 millionl Operatingrevenuesincreased$37.8million,basedonthefollowing:Student tuition and fees increased$41.6million as aresultofBoard-approvedmandatoryfeeincreasesandgrowth in enrollment.Undergraduate fees increasedby1% for in-state students and3.8% for out-of-statestudents.Therewas also a 3% increase for certaingraduateprograms.Overallenrollmentincreasedby4%overtheprioryear.
Salesandservicesrevenuedecreasedby$13.3million.Salesandservicesofpledgedauxiliariesdecreasedby$11.3millionduetohousinganddiningrefundsissuedtostudentsasaresultoftheCOVID-19pandemicandreduced bookstore and vending sales. Informationsystemsdevelopmentcreatedanupswinginnon-pledgedauxiliariesrevenueof$2.3million.Salesandservicesofeducationalactivitiesdecreasedby$4.3million,mostlyduetotheYouthLearningInstitutecampsbeingcanceledasaresultoftheCOVID-19pandemic.
Grantsandcontractsrevenuesincreasedby$11.6million.Federalgrantsandcontractsincreased$5.3million,astheUniversityreceivedlargersponsoredresearchawardsfromtheDepartmentofHealthandHumanServicesandNationalScienceFoundation.Stategrantsandcontractsincreasedby$6.7milliondue to contributions to theCenter forAdvancedManufacturing andCUHealthInnovation-ExtensionProgramming aswell as lotteryfunded Palmetto Fellows scholarships. Local grantsand contracts increased by $188,000 due to privateuniversitiesandresearchfoundationsdonationsoffsetbyadecreaseincountyprogramfunds.Nongovernmentalgrantsandcontractsdecreasedby$556,000primarilyduetothereductioninprivateawardsfromcorporationsandfirms.
Other operating revenues decreased by $2.2million.StudyabroadandregistrationfeesforvariousUniversityprogramswereimpactedbytheCOVID-19pandemic,causingadeclineinrevenue.
l Nonoperatingrevenuesincreased$3.0million,basedonthefollowing:Stateappropriationsincreasedby$7.8million.Education&General(E&G)andPublicService(PSA)activitiesfrombaseappropriationsincreased$3.8millionand$4million,respectively.
Federalappropriationsincreasedby$2million.FundingfortheUniversity’sland-grantSmithLever,Hatch,andMcIntireStennisincreasedby$1.6million,whilefoodandnutritioneducation,renewableresources,andanimalhealthincreasedby$400,000.
GiftsandGrantsrevenueincreasedby$7.8million.TheUniversityreceived$13.5millioninfederalCARESActfunding,whichwaspassedbyCongressforCOVID-19relief.Thisrevenuewasoffsetbythereductioningiftsfrom various county programs,ClemsonUniversityFoundationandIPTAYtotaling$5.7million.
UNAUDITED
~ 23 ~
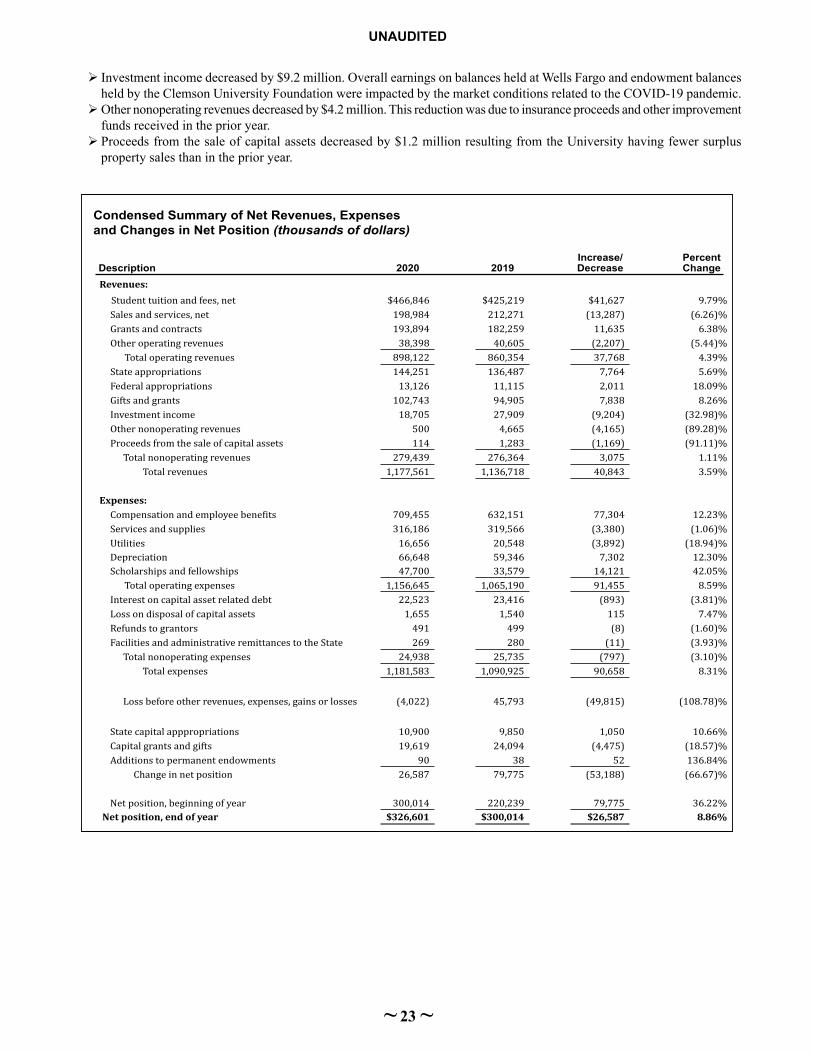
Condensed Summary of Net Revenues, Expensesand Changes in Net Position (thousands of dollars)
Description 2020 2019Increase/Decrease
Percent Change
Revenues:Student tuition and fees, net $466,846 $425,219 $41,627 9.79%Sales and services, net 198,984 212,271 (13,287) (6.26)%Grants and contracts 193,894 182,259 11,635 6.38%Other operating revenues 38,398 40,605 (2,207) (5.44)% Total operating revenues 898,122 860,354 37,768 4.39%State appropriations 144,251 136,487 7,764 5.69%Federal appropriations 13,126 11,115 2,011 18.09%Gifts and grants 102,743 94,905 7,838 8.26%Investment income 18,705 27,909 (9,204) (32.98)%Other nonoperating revenues 500 4,665 (4,165) (89.28)%Proceeds from the sale of capital assets 114 1,283 (1,169) (91.11)%
Total nonoperating revenues 279,439 276,364 3,075 1.11%Total revenues 1,177,561 1,136,718 40,843 3.59%
Expenses:Compensation and employee benefits 709,455 632,151 77,304 12.23%Services and supplies 316,186 319,566 (3,380) (1.06)%Utilities 16,656 20,548 (3,892) (18.94)%Depreciation 66,648 59,346 7,302 12.30%Scholarships and fellowships 47,700 33,579 14,121 42.05% Total operating expenses 1,156,645 1,065,190 91,455 8.59%Interest on capital asset related debt 22,523 23,416 (893) (3.81)%Loss on disposal of capital assets 1,655 1,540 115 7.47%Refunds to grantors 491 499 (8) (1.60)%Facilities and administrative remittances to the State 269 280 (11) (3.93)%
Total nonoperating expenses 24,938 25,735 (797) (3.10)%Total expenses 1,181,583 1,090,925 90,658 8.31%
Loss before other revenues, expenses, gains or losses (4,022) 45,793 (49,815) (108.78)%
State capital apppropriations 10,900 9,850 1,050 10.66%Capital grants and gifts 19,619 24,094 (4,475) (18.57)%Additions to permanent endowments 90 38 52 136.84%
Change in net position 26,587 79,775 (53,188) (66.67)%
Net position, beginning of year 300,014 220,239 79,775 36.22%Net position, end of year $326,601 $300,014 $26,587 8.86%
Investmentincomedecreasedby$9.2million.OverallearningsonbalancesheldatWellsFargoandendowmentbalancesheldbytheClemsonUniversityFoundationwereimpactedbythemarketconditionsrelatedtotheCOVID-19pandemic.
Othernonoperatingrevenuesdecreasedby$4.2million.Thisreductionwasduetoinsuranceproceedsandotherimprovementfundsreceivedintheprioryear.
Proceedsfromthesaleofcapitalassetsdecreasedby$1.2millionresultingfromtheUniversityhavingfewersurpluspropertysalesthanintheprioryear.

UNAUDITED
~ 24 ~
servicecostsdecreased$1.6millionrelatedtobeefanddairyfarmcostsandtransportationtraining.Academicsupportcostsincreased$5.3million,primarilyduetothereorganization of telecommunications as an academicsupportfunctioninsteadofanauxiliaryservice.Theoffsetofthisreorganizationisreflectedasadecreaseinauxiliaryservices expenses.Student service expenses decreased$1.7millionduetoreducedcampusrecreation,studentorganization, and orientation costs.The institutionalsupportincreaseof$2.2millionistheresultofstrategicplanningandadvisoryexpenses,costsassociatedwiththeCOVID-19pandemic,andadditionalliabilityinsurance.Operationandmaintenanceofplantcosts increasedby$6.7million,resultingfromnon-capitalizedrepairsandrenovationswhich included projects related toDanielHall,SirrineHall, andenhancements to the safetyandsecurity infrastructure.Auxiliary services expensesdecreased $8.7million due to the closure of campushousinganddiningfacilitiesaswellasthereorganizationoftelecommunications.
Utility expenses decreased $3.9million as a resultof decreased telephone expenses and recoveries oftelecommunicationsexpensesforcapitalprojects.
Depreciation expense increased $7.3million,mostlydueto thecapitalizationofmajorconstructionprojectsincludingtheSnowFamilyOutdoorFitnessandWellnessComplex,thesoftballstadiumandIPTAYoffice.
Scholarship and fellowship expenses increased $14.1millionduetoCARESActfundedemergencystudentaidgrantdisbursementsandState-fundedPalmettoFellowsscholarships.
Total Expenses – increase of $90.7 millionl Operatingexpensesincreased$91.5million,basedonthefollowing:Compensationandemployeebenefitsincreasedby$77.3million, ofwhich $24.6millionwas related to State-mandated one-time bonuses for eligible employees, aBoard-approvedperformancerecognitioncompensationplan, and State-mandated two percent cost of livingadjustment. Fringe benefit expenses increased $22.4million.Graduate assistant and other student-relatedcompensationincreased$5.5million.Pensionandretireehealth benefit expenses related to the amortization oftheUniversity’s proportionate share of the state’s netpension liability andnet retiree health benefit liabilityincreased by $20.8million. The pension and retireehealthexpensesincludeacashandnon-cashcomponent.The cash component is comprised of contributionssubmitted to PEBA.The cash impact of the pensionand retiree health expense totaled $49.1million and$24.9million, respectively.The non-cash componentreflectstheUniversity’sproportionateshareoftheplan’sexpenses.Thenon-cashimpactofthepensionandretireehealth expense totaled $41million and $18.2million,respectively.
Servicesandsuppliesexpensesdecreased$3.4million.Instruction costs decreased by $4.2million across allareas,withthelargestdeclinesinstudyabroadfees,theSchool ofArchitecture, online anddistance education,andParksRecreation&TourismManagement.Researchcosts decreased $1.4million related to federal awardswith theNationalScienceFoundation andDepartmentofAgriculture offset by an increasewith awards fromtheDepartmentofHealthandHumanServices.Public
Total Revenues$1,177,561 (thousands of dollars)
Student Tuition and Fees $446,846
Federal Grantsand Contracts
$95,749
State Grants and Contracts $85,256
Local and Nongovernmental Grants and Contracts
$12,888
Sales and Services of Educational and Other Activities - $18,317
Sales and Services of Auxiliary Enterprises
$180,667
Other OperatingRevenues$38,398
State Appropriations $144,251
Federal Appropriations $13,126
Gifts and Grants$102,743
Interest Income and Endowment Income
$18,705Non Operating Revenues and Sale
of Capital Assets - $614
NONOPERATING$279,439

UNAUDITED
~ 25 ~
l Nonoperatingexpensesdecreased$797,000basedonthefollowing:Interestexpensedecreased$893,000,as theUniversitycontinuedtomakedebtservicepaymentsandhadsmalleroutstandingprincipalbalancesonbonds.
Lossesondisposalofcapitalassetsincreased$115,000duetodemolitionoftheIPTAYbuilding.
Refunds to grantors decreased $8,000 due to fixedpayment amounts that had to be returned to sponsorswhenthecostofworkperformedwaslessthanamountspreviouslyreceived.
FacilitiesandadministrativecostsremittedtotheStatedecreased$11,000.TheStaterequiressuchcostscollectedfornon-researchsponsoredprojectsinexcessof$200,000toberemitted.
l State capital appropriations increased by $1.1million,resulting from theWaterResearch facility renovationsof $5million and theSafety andSecurity infrastructureimprovementsof$5.9million.Thisamountwasoffsetbyprioryearreceiptsof$6.8millioninlotteryfundsreceivedfortheGarrisonArenaconstructionand$3millionincapitalreserve funding for infrastructure and renovation of theResearchEducationCenter.
l Capital grants and gifts decreased $4.5million. PrioryearprivatecontributionsfundingtheconstructionoftheSamuelJ.CaddenChapel,theReevesFootballOpsCenterRenovations,andfederalequipmentpurchaseswereoffsetbynewgiftsfortheCollegeofBusiness.
l A$52,000increaseinadditionstopermanentendowmentswastheresultofindividualdonorgifts.
Compensation and Employee Benefits
$648,704
Utilities$16,656
Depreciation $66,648 Scholarships and
Fellowships$47,700
Services and Supplies$316,186
Interest on Capital Asset Related Debt
$22,523
Loss on Disposal of Capital Assets$1,655
Refunds to Grantors$491
Facilities and Administrative Remittances to the State - $269
Pension and OPEB
$60,751
NONOPERATING EXPENSES$24,938
Total Expenses by Natural Classification$1,181,583 (thousands of dollars)
Total Expenses by Function$1,181,583 (thousands of dollars)
Instruction$282,039
Research$188,154
Public Service$71,456
AcademicSupport$73,424
Student Services$47,265
Institutional Support$59,972
Operation and Maintenance of Plant
$78,212
Scholarships and Fellowships$45,950
Auxiliary Enterprises$ 182,774
Depreciation$66,648
Interest on Capital Asset
Related Debt…
Loss on Disposal of Capital Assets
$1,655
Refunds to Grantors$491
Facilities and Administrative Remittances to the State - $269
Pension and OPEB$60,751
NONOPERATINGEXPENSES$24,938

UNAUDITED
~ 26 ~
Condensed Summary of Net Position (thousands of dollars)
Description 2020 2019 Increase/(Decrease)
PercentChange
Assets Current assets $ 631,841 $ 643,989 $ (12,148) (1.89)% Capital assets, net 1,461,475 1,401,595 59,880 4.27% Other noncurrent assets 213,549 223,022 (9,473) (4.25)%Total assets 2,306,865 2,268,606 38,259 1.69%
Deferred outflows of resources 198,212 145,750 52,462 35.99%
Total assets and deferred outflows of resources 2,505,077 2,414,356 90,721 3.76%
Liabilities Current liabilities 140,894 162,886 (21,992) (13.50)% Noncurrent liabilities 1,970,624 1,899,152 71,472 3.76%Total liabilities 2,111,518 2,062,038 49,480 2.40%
Deferred inflows of resources 66,958 52,304 14,654 28.02%
Total liabilities and deferred inflows of resources 2,178,476 2,114,342 64,134 3.03%
Net Position Net investment in capital assets 836,774 814,368 22,406 2.75% Restricted - nonexpendable 58,967 58,979 (12) (0.02)% Restricted - expendable 209,643 183,297 26,346 15.13% Unrestricted (778,783) (756,630) (22,153) 2.93%Total net position $ 326,601 $ 300,014 $ 26,587 8.86%
Statement of Net Position The Statement of Net Position presents the assets,deferredoutflowsof resources, liabilities, deferred inflowsofresources,andnetpositionoftheUniversityasoftheendofthefiscalyear.TheStatementofNetPositionisapointoftimefinancialstatement.ThepurposeoftheStatementofNetPositionistopresenttothereadersofthefinancialstatementsafiscalsnapshotofClemsonUniversity.TheStatementofNetPositionpresentsend-of-yeardataconcerningAssets(propertythatwe own andwhatwe are owed by others),DeferredOutflowsofResources(consumptionofnetpositionbytheUniversity that is applicable to a future reporting period),Liabilities(whatweowetoothersandhavecollectedfromothersbeforewehaveprovidedtheservice),DeferredInflowsofResources(acquisitionofnetpositionbytheUniversitythatisapplicabletoafuturereportingperiod),andNetPosition(AssetsandDeferredOutflowsofResources,minusLiabilitiesandDeferredInflowsofResources).Itispreparedundertheaccrualbasisof accounting,where revenues andassets arerecognizedwhen the service is provided and expenses andliabilitiesarerecognizedwhenothersprovidetheservicetous,regardlessofwhencashisexchanged. From the data presented, readers of the Statement ofNet Position are able to determine the assets available tocontinue the operations of the institution. They are alsoable to determinehowmuch the institutionowes vendors,investors,andlendinginstitutions.Finally,theStatementofNetPositionprovidesapictureofthenetposition(assetsanddeferredoutflowsofresourcesminusliabilitiesanddeferredinflowsofresources)andtheiravailabilityforexpenditurebytheinstitution.
Netpositionisdividedintothreemajorcategories.Thefirstcategory,net investment incapitalassets,provides theinstitution’sequityinproperty,plant,andequipmentownedbytheinstitution.Thenextcategoryisrestrictednetposition,which is divided into two categories, nonexpendable andexpendable.RestrictednonexpendablenetpositionconsistssolelyoftheUniversity’spermanentendowmentfundsandisonlyavailableforinvestmentpurposes.Expendablerestrictednetpositionisavailableforexpenditurebytheinstitutionbutmustbespentforpurposesasdeterminedbydonorsand/orexternalentitiesthathaveplacedtimeorpurposerestrictionsontheuseoftheassets.Thefinalcategoryisunrestrictednetposition.Unrestrictednetpositionisavailabletotheinstitutionforanylawfulpurposeoftheinstitution.Althoughunrestrictednetpositionisnotsubjecttoexternallyimposedstipulations,substantiallyalloftheUniversity’sunrestrictednetpositionhasbeendesignatedforvariousacademicandresearchprogramsandinitiatives.
Assets and Deferred Outflows of Resources– increase of $90.7 millionl Current assets decreased $12.1million. Unrestrictedcashbalancesincreased$29.6millionandrestrictedcashdecreased$47million.Theunrestrictedcashincreasewasdrivenbyanincreaseinstudentfeecollections,maintenance,repairs,andrenovationfunding,andStateappropriations.RestrictedcashdecreasedasbondproceedswerespentontheCollege ofBusiness construction and theElectricalDistributionUpgrade.Accountsreceivableincreased$13.8millionduetothetimingoffederalCARESActfundingand funding for thewater research facility. Grants and
UNAUDITED
~ 27 ~
contractsreceivabledecreased$2millionduetoreducedreceivablesforgrantsandcontractsonsponsoredprojects.Contributions receivable decreased$157,000due to thepaymentofexistingpledges.InterestincomereceivableoncashbalancesheldbytheStateTreasurer’sOfficeincreased$103,000.Inventoriesdecreased$647,000primarilyduetodecreasedcomputerstoreinventoryoffsetbyincreasesintelecommunicationsupplies.Prepaiditemsdecreased$3.3millionasaresultofITlicenseandmaintenanceagreements.Othercurrentassetsdecreased$2.8millionasaresultofanunder-recoveryofpooledfringesforthefiscalyearendedJune30,2019thatwillbeabsorbedthroughtheapprovedpooledfringerateestablishedforthefiscalyearendingJune30,2021.
l Netcapitalassetsincreased$59.9million.Non-depreciableassetsincreased$61.2millionasconstructioncontinuedonmajorcampusprojectsincludingtheCollegeofBusiness,Soccer Complex, Child Care facility and the campuselectricaldistributionupgrade.Depreciablecapitalassetsdecreased$1.3million.Buildings increased$1.5milliondue to capitalizations, offset by depreciation expense ofcurrent operational buildings. Depreciation expense ofexisting utilities and other non-structural improvementscontributedtothedecreaseof$194,000.Thedecreaseof$11,500insoftwarewasprimarilyduetothecardaccesssystembeingfullydepreciated.Equipmentdecreased$2.7millionwith depreciation offsetting new additions. Theincreaseinvehiclesof$82,000wasaresultofcurrentyearpurchasesofdepartmentalvehicles.
l Other noncurrent assets decreased $9.5million. Thebalance on loan to theClemsonUniversity Foundation(CUF) decreased $6.4million. Transfers fromCUFwere offset by appreciation, income, and realizedgains.Noncurrent contributions receivable decreased $428,000duetopaymentsonexistingpledges.Investmentsincreased$969,000 due to the increased value of split dollar lifeinsurance policies. Restricted noncurrent cash balancesdecreased$393,000duetodecliningPerkinsfederalstudentloans.Studentloansreceivabledecreased$1.2millionduetocollectionsofPerkinsFederalstudentloans.Otherassetsdecreased$1.9millionduetotheunder-recoveryofpooledfringebenefitcoststhatwillbeabsorbed/adjustedthroughtheapprovedpooledfringerateestablishedfor thefiscalyearendingJune30,2022.
l Deferred outflows of resources increased $52.5million.Deferredlossesonbondrefundingdecreased$451,000duetoamortizationofexistinglosses.Deferredoutflowsrelatedto theUniversity’s proportionate share of the state’s netpensionliabilitydecreased$3.8million.DeferredoutflowsrelatedtotheUniversity’sproportionateshareofthestate’sretireehealthbenefitsliabilityincreased$56.8million.
Liabilities and Deferred Inflows of Resources – increase of $64.1 millionl Currentliabilitiesdecreased$22million.TheUniversity’seffortstocurtailnonessentialspendingduetotheCOVID-19pandemicreflectedadecreaseinaccountspayableof$10.1million.Accruedpayrollandrelatedliabilitiesincreasedby$1.1millionastheresultofincreasedsalariesandfringebenefitsappliedtothefinalpayrollofthefiscalyear.Currentcompensated absences increased$926,000 as a result ofincreased salaries. Accrued interest payable decreased$165,000duetothepaydownofexistingdebt.Unearnedrevenues decreased by $13million due to a reductionin athletic ticket sales for the upcoming football seasonandgrants and contracts funding received in advanceofexpenditures.Currentdepositsdecreasedby$258,000duetoadecreaseinamountsheldforawaygamefootballticketsalesatyear-endandstudyabroaddeposits.Thecurrentportionoffundsheldforothersdecreased$386,000duetoadecreaseinagencyfundbalances.
l Noncurrent liabilities increased by $71.5million. TheUniversity’sproportionateshareoftheState'snetpensionliability increased by $33.5million. TheUniversity’sproportionateshareoftheState’sliabilityforretireehealthbenefitsincreasedby$58.2million.Netinvestmentincomeand plan contributionswere not substantial enough tooffsettheplans'benefitpaymentsandadministrativecosts,resulting inan increase to theplans’overallnet liability.Long-termdebtdecreased$24.7millionduetopayingdownexistingdebtandnotissuinganynewbondsinthefiscalyear.Thelong-termliabilityforcompensatedabsencesandrelatedliabilitiesincreased$2.2million.Thenoncurrentportionofdepositsincreasedby$4.1millionduetoover-recoveryofpooledfringebenefits.ThenoncurrentportionoffundsheldforothersrelatedtoPerkinsloansdecreased$1.8million.
l Deferred inflows of resources increased $14.6million.Deferred inflowsof resources related to theUniversity’sproportionate share of the State's net pension liabilityincreasedby$735,000andtheUniversity'sproportionateshare of the State's net retiree health benefit liabilityincreasedby$13.9million.Deferredinflowsofresourcesinclude the calculated difference between actual andprojected investmentearningson the state’spensionandretireehealthbenefitplans.
Net Position – increase of $26.6 millionl Net investmentofcapitalassets increased$22.4million.Thisincreaseresultedfromanincreaseincapitalassetsof$59.9million,adecreaseincapitaldebtof$24.7million,adecreaseinunspentbondproceedsof$62.7million,anda$451,000 increase indeferredoutflowsof resourcesasdiscussedabove.
l Restricted–nonexpendablenetpositionforscholarshipsandfellowshipsdecreased$12,000astheresultofinvestmentlossesonendowmentbalancesheldbyWellsFargo,offsetbysmallincreasesinvariousscholarshipendowmentfunds.

UNAUDITED
~ 28 ~
Statement of Cash Flows ThefinalstatementpresentedistheStatementofCashFlows.TheStatementofCashFlowspresentsdetailedinformationaboutthecashactivityoftheinstitutionduringtheyear.Thestatementisdividedintofiveparts.Thefirstpartdealswithoperatingcashflowsandshowsthenetcashusedbytheoperatingactivitiesoftheinstitution.Thesecondsectionreflectscashflowsfromnoncapitalfinancingactivities.Thissectionreflectsthecashreceivedandspentfornonoperating,noninvesting,andnoncapitalfinancingpurposes.Thethirdsectiondealswithcashflowsfromcapitalandrelatedfinancingactivities.Thissectiondealswiththecashusedfortheacquisitionandconstructionofcapitalandrelateditems.Thefourthsectionreflectsthecashflowsfrominvestingactivitiesandshowsthepurchases,proceeds,andinterestreceivedfrominvestingactivities.ThefifthsectionreconcilesthenetcashusedtotheoperatingincomeorlossreflectedontheStatementofRevenues,ExpensesandChangesinNetPosition.
Capital Assets Capitalassets,netofaccumulateddepreciation,atJune30,2020andJune30,2019wereasfollows:
l Restrictedforexpendablenetpositionincreased$26.3million,basedonthefollowing: Restricted–expendablenetpositionforscholarshipsandfellowshipsincreased$382,000duetoanincreaseingiftsand
pledgedscholarshipfunding. Restricted–expendablenetpositionforresearchincreased$93,000,primarilybecauseofsponsoredprogramresearch
activity. Restricted–expendablenetpositionforinstructional/departmentaluseincreased$2.8millionduetoStatefundingfor
theCenterofAdvancedManufacturing,offsetbydecreasesincontributions. Restricted–expendablenetpositionforstudentloansincreased$84,000astheresultofaslightincreaseininvestment
incomeearnings. Restricted–expendablenetpositionforcapitalprojectsincreased$21.7millionresulting,inlargepart,fromanincrease
infundingforrenovationstothewaterresearchfacilityandmaintenanceandstewardshipfunds.Theseincreaseswereoffsetbydecreasesinoperatingtransferstothehousing,dining,parkingandathleticimprovementfunds.
Restricted–expendablenetpositionfordebtserviceincreased$1.2millionastheresultofdebtservicereservefundrequirementsforbonddebt.
l Unrestrictednetpositiondecreased$22.2million,basedonthefollowing: TheUniversity’s proportionate share of the state’s net pension liability and net retiree health benefit liability and
accompanyingdeferredinflowsandoutflowsofresourcesresultedina$53.4millionreductionofunrestrictednetposition. Unrestricted-educationalandgeneralincreased$41.6millionastheresultofincreasedstudentfeerevenuesandstate
appropriations. Unrestricted – unexpended plant decreased $7.4million as the result of decreased transfers for the PSAbuilding
improvementfund,offsetbyanincreaseintransfersforfacilitiesplannedmaintenanceprojects. Unrestricted–boarddesignatedendowmentsdecreased$5.9millionastheresultofmarketconditionsandadecreasein
endowmentgifts. Unrestricted–publicservicesnetpositionincreased$1.1million. Unrestricted–auxiliariesnetpositionincreased$1.8million,primarilyduetoinvestmentearningsonfundsheldbythe
StateTreasurer’sOffice.
Capital Assets (net of accumulated depreciation)
Description 2020 2019Increase/Decrease
PercentChange
Capital Assets:Land and improvements $ 34,362,728 $ 34,372,728 $ (10,000) (0.03)%Construction in progress 170,298,218 109,126,867 61,171,351 56.06%Utilities systems and other non-structural
improvements 67,502,632 67,696,972 (194,340) (0.29)%Buildings and improvements 1,059,553,093 1,058,023,659 1,529,434 0.14%Computer software — 11,514 (11,514) (100.00)%Equipment 124,114,220 126,800,853 (2,686,633) (2.12)%Vehicles 5,644,536 5,562,510 82,026 1.47%
Total Capital Assets $ 1,461,475,427 $ 1,401,595,103 $ 59,880,324 4.27%

UNAUDITED
~ 29 ~
Landdecreasedby$10,000.TheUniversityexchanged4.5acresoflandinOconeeCountyonLakeHartwellfor20acresinAndersonCountynearFantsGroveandtheClemsonExperimentalForest Construction in Progress increased $61.2million, asconstruction began and/or continued onmajorUniversityprojects,includingtheCollegeofBusiness,SoccerComplex,ChildcareFacility, and an update to the campus electricaldistributionsystem.. UtilitiesSystemsandOtherNon-StructuralImprovementsdecreased approximately $194,000, due to depreciationexpenseonnewandexistingassets. Buildingsincreased$1.5millionduetocapitalizationsinthecurrentfiscalyearthatwereoffsetofbydepreciationoncurrentoperationalbuildings. CapitalizedComputerSoftwaredecreased$11,500,astheUniversity’scardaccesssystemwasfullydepreciatedinthecurrentfiscalyear. Equipmentdecreased$2.7million.Netadditionstotalingapproximately$22.5millionwereoffsetbydepreciationanddisposals. Vehicles increased$82,000asa resultofdepartmentalvehiclepurchases,offsetbydepreciationexpense. Formoredetailedinformationoncapitalassetactivity,please refer toNote4–CapitalAssets in themotes to thefinancialstatements.
Debt Administration The University’s financial statements indicate$640,560,899 in bondspayable and$11,142,469 in capitalleasespayableatJune30,2020. TheUniversity’s bonded indebtedness consisted of:GeneralObligationBondsof$220,540,942,AthleticFacilitiesRevenueBond issues totaling $134,342,791, andRevenueBonds of $285,677,166. GeneralObligationBonds areobligationsoftheStateofSouthCarolinaandaresecuredastoprincipalandinterestbyapledgeofthefullfaith,credit,andtaxingpoweroftheStateandarepaidwithtuitionandmatriculation fees. Athletic FacilitiesRevenueBonds arepayable solely from the net revenues of theUniversity’sAthleticDepartmentandgrossreceiptsfromtheimpositionofanyadmissionsfeeandanyspecialstudentfee.RevenuebondsarepayablesolelyfromandsecuredbyapledgeofrevenuesoftheUniversity’shousingfacilities,bookstore,diningservices,parking,vendingandfromadditionalfundsfromtheacademic“Universityfee”imposedbytheBoardofTrustees. Capitalleasestotaling$11,142,469includeacapitalleasewiththeClemsonUniversityLandStewardshipFoundation(CULSF),itscomponentunit,forspaceintheGreenvilleOneBuildingindowntownGreenville,SCandmultipleequipmentleases for printers and copiers. The outstanding liabilityon the capital lease for theGreenvilleOne building as ofJune30,2020was$10,139,235.Theoutstandingliabilityonequipmentleaseswas$1,003,234asofJune30,2020. Foradditionalinformation,seeNotes6and7inthenotestothefinancialstatements.
Economic Outlook As a state-supported higher education institution, theUniversity’seconomicpositioniscloselytiedtotheStateofSouthCarolina.TheStateendedfiscalyear2020witha$672millionbudgetarysurplus.Inhisyear-endpressrelease,StateComptrollerGeneralRichardEckstromstated,“Thisyearhasbeenlikearollercoasterrideforstategovernment.TheyeartookoffsmoothlybutthenbegancareeningandlurchingoncetheCOVIDvirushitwithoutwarning.Itfeltlikethegroundhadfallenfromunderusandeveryonedidwhattheycouldtosurvivewhilehopingforaquickendtothewildride.”Thestatehad$152millioninreserveswhichwasbeingheldforcapitalprojects.Statetaxrevenuegrewinthefirst8monthsoftheyearbutslowedconsiderablyinMarchduetotheCOVIDimpact on businesses.The growth rate for the total of allgeneralfundrevenuessourceshadbeen8.5percentbutwascutinhalfbyyearend.Whilethegovernment’srevenuestreamshavebeengreatlyaffected,oneofthe“silentdamages”istheimpactontheStateRetirementSystem.Beforetheonsetofthecoronavirus,thestateplanwasstrugglingata$23billionfundingshortfall.TheGeneralAssemblyplannedtopayoffthisshortfall.However,thoseeffortshavebeensuspendedduetotheaffectsofCOVID-19. State appropriations to fundUniversity operationsincreased$7.8millionforfiscalyear2020,anincreaseof7.5percentoverthepreviousyear.AppropriationsforEducationalandGeneral activities accounted for $3.8million of thisincreaseandPublicServiceactivities increased$4million.Appropriations for cost of living adjustments increasedby$2.3millionandnon-recurringbonusesincreasedby$568,000.Appropriation allocations for the education oversightcommitteeincreasedby$500,000. Statescholarshipprogramsfundedwithlotteryproceedsincreased$63.2millionfor2020.Inaddition,theUniversityreceived$6.2millionfromtheStateTreasurer’sOfficefortheCenterforAdvancedManufacturingandCUHealthInnovationExtensionProgramming.Statecapitalappropriationsincreased$1.1millionasa resultofadditional fundingfor theWaterResearchFacilityandSafetyandSecurityInfrastructure.

~ 30 ~
CLEMSON UNIVERSITYSTATEMENT OF NET POSITION
Description Amount ASSETS AND DEFERRED OUTFLOWS OF RESOURCES Current Assets: Cash and cash equivalents .............................................................................................................................................................................................................. $ 328,767,289 Restricted Assets - Current: Cash and cash equivalents ......................................................................................................................................................................................................... 219,616,650 Accounts receivable (net of provision for doubtful accounts of $538,983) .............................................................................................................. 41,601,588 Grants and contracts receivable ................................................................................................................................................................................................... 24,820,370 Contributions receivable, net ........................................................................................................................................................................................................ 854,003 Interest and income receivable .................................................................................................................................................................................................... 2,939,129 Student loans receivable ................................................................................................................................................................................................................. 3,382 Inventories ............................................................................................................................................................................................................................................ 2,417,897 Prepaid items ....................................................................................................................................................................................................................................... 8,833,862 Other current assets .......................................................................................................................................................................................................................... 1,986,705 Total current assets ................................................................................................................................................................................................................. 631,840,875 Noncurrent Assets: Notes receivable .................................................................................................................................................................................................................................. 201,271,023 Contributions receivable, net ........................................................................................................................................................................................................ 732,484 Investments .......................................................................................................................................................................................................................................... 4,417,338 Restricted Assets - Noncurrent: Cash and cash equivalents ......................................................................................................................................................................................................... 2,169,412 Student loans receivable ............................................................................................................................................................................................................ 4,958,056 Capital assets, not being depreciated ........................................................................................................................................................................................ 204,660,946 Capital assets, net of accumulated depreciation ................................................................................................................................................................... 1,256,814,481 Total noncurrent assets .............................................................................................................................................................................................................. 1,675,023,740 Total assets ................................................................................................................................................................................................................................. 2,306,864,615 Deferred Outflows of Resources: Deferred losses on bond refunding ............................................................................................................................................................................................ 4,133,947 Deferred outflows on net pension liability.............................................................................................................................................................................. 98,703,456 Deferred outflows on net retiree health benefits liability ................................................................................................................................................ 95,374,753 Total deferred outflows of resources .............................................................................................................................................................................. 198,212,156 Total assets and deferred outflows of resources ............................................................................................................................... $ 2,505,076,771
LIABILITIES AND DEFERRED INFLOWS OF RESOURCES Current Liabilities: Accounts and retainages payable ................................................................................................................................................................................................ $ 25,568,575 Accrued payroll and related liabilities ...................................................................................................................................................................................... 25,171,902 Accrued compensated absences and related liabilities ..................................................................................................................................................... 15,487,250 Accrued interest payable ................................................................................................................................................................................................................ 4,381,104 Unearned revenues............................................................................................................................................................................................................................ 43,762,380 Bonds payable ...................................................................................................................................................................................................................................... 24,054,543 Capital leases payable ...................................................................................................................................................................................................................... 933,481 Deposits .................................................................................................................................................................................................................................................. 761,682 Funds held for others ....................................................................................................................................................................................................................... 773,260 Total current liabilities .......................................................................................................................................................................................................... 140,894,177 Noncurrent Liabilities: Accrued compensated absences and related liabilities ..................................................................................................................................................... 15,955,750 Deposits .................................................................................................................................................................................................................................................. 4,129,185 Funds held for others ....................................................................................................................................................................................................................... 5,184,375 Net pension liability .......................................................................................................................................................................................................................... 672,314,429 Net retiree health benefits liability............................................................................................................................................................................................. 646,324,692 Bonds payable ...................................................................................................................................................................................................................................... 616,506,356 Capital leases payable ...................................................................................................................................................................................................................... 10,208,988 Total noncurrent liabilities ........................................................................................................................................................................................................ 1,970,623,775 Total liabilities ........................................................................................................................................................................................................................... 2,111,517,952 Deferred Inflows of Resources: Deferred inflows on net pension liability ................................................................................................................................................................................ 4,924,649 Deferred inflows on net retiree health benefits liability ................................................................................................................................................... 62,033,143 Total deferred inflows of resources ................................................................................................................................................................................. 66,957,792 Total liabilities and deferred inflows of resources ........................................................................................................................... $ 2,178,475,744
NET POSITION Invested in capital assets, net of related debt ............................................................................................................................................................................. $ 836,774,410 Restricted for nonexpendable purposes: Scholarships and fellowships ........................................................................................................................................................................................................ 58,967,333 Restricted for expendable purposes: Scholarships and fellowships ........................................................................................................................................................................................................ 22,973,576 Research ................................................................................................................................................................................................................................................. 585,505 Instructional/departmental use .................................................................................................................................................................................................. 15,527,461 Loans ..................................................................................................................................................................................................................................................... 2,269,567 Capital projects.................................................................................................................................................................................................................................... 155,337,633 Debt service .......................................................................................................................................................................................................................................... 12,948,982 Unrestricted ............................................................................................................................................................................................................................................... (778,783,440) Total net position .......................................................................................................................................................................................... $ 326,601,027
June30,2020
See accompanying notes to basic financial statements.

~ 31 ~
CLEMSON UNIVERSITY FortheyearendedJune30,2020STATEMENT OF REVENUES, EXPENSES AND CHANGES IN NET POSITION
See accompanying notes to basic financial statements.
Description Amount REVENUES Operating Revenues: Student tuition and fees (net of scholarship allowances of $106,573,415) .......................................................................... $ 466,846,134 Federal grants and contracts ...................................................................................................................................................................... 95,748,885 State grants and contracts ........................................................................................................................................................................... 85,256,061 Local grants and contracts .......................................................................................................................................................................... 1,155,889 Nongovernmental grants and contracts ................................................................................................................................................ 11,733,331 Sales and services of educational and other activities .................................................................................................................... 18,316,984 Sales and services of auxiliary enterprises - pledged for revenue bonds (net of scholarship allowances of $13,846,768) ........................................................................................................................... 142,137,170 Sales and services of auxiliary enterprises - not pledged.............................................................................................................. 38,529,894 Other operating revenues ............................................................................................................................................................................ 38,397,174 Total operating revenues .................................................................................................................................................................... 898,121,522
EXPENSES: Operating Expenses: Compensation and employee benefits ................................................................................................................................................... 709,455,173 Services and supplies .................................................................................................................................................................................... 316,185,889 Utilities ................................................................................................................................................................................................................ 16,656,045 Depreciation .................................................................................................................................................................................................... 66,648,011 Scholarships and fellowships ..................................................................................................................................................................... 47,700,153 Total operating expenses .................................................................................................................................................................... 1,156,645,271 Operating (loss) ........................................................................................................................................................................................... (258,523,749)
NONOPERATING REVENUES (EXPENSES) State appropriations .......................................................................................................................................................................................... 144,250,934 Federal appropriations ..................................................................................................................................................................................... 13,126,453 Gifts and grants .................................................................................................................................................................................................... 102,743,269 Interest income .................................................................................................................................................................................................... 16,804,815 Endowment income ........................................................................................................................................................................................... 1,900,361 Interest on capital asset related debt ......................................................................................................................................................... (22,522,572) Other nonoperating revenues ........................................................................................................................................................................ 499,791 Loss on disposal of capital assets ................................................................................................................................................................. (1,540,595) Refunds to grantors ............................................................................................................................................................................................ (491,460) Facilities and administrative remittances to the State ........................................................................................................................ (269,279) Net nonoperating revenues ............................................................................................................................................................... 254,501,717
Loss before other revenues, expenses, gains or losses ............................................................................................................... (4,022,032)
State capital appropriations ........................................................................................................................................................................... 10,900,272 Capital grants and gifts ..................................................................................................................................................................................... 19,618,843 Additions to permanent endowments ....................................................................................................................................................... 90,344 Increase in net position ............................................................................................................................................................................ 26,587,427
NET POSITION Net position, beginning of year ..................................................................................................................................................................... 300,013,600 Net position, end of year ............................................................................................................................................... $ 326,601,027

~ 32 ~See accompanying notes to basic financial statements.
DESCRIPTION AMOUNT CASH FLOWS FROM OPERATING ACTIVITIES Payments from customers ................................................................................................................................................................................................................ $ 630,943,994 Grants and contracts ........................................................................................................................................................................................................................... 185,201,174 Payments to suppliers ........................................................................................................................................................................................................................ (306,378,691) Payments to employees ..................................................................................................................................................................................................................... (498,156,433) Payments for benefits ......................................................................................................................................................................................................................... (141,070,183) Payments to students ......................................................................................................................................................................................................................... (65,665,511) Inflows from Stafford loans.............................................................................................................................................................................................................. 70,518,286 Outflows from Stafford loans .......................................................................................................................................................................................................... (9,096,501) Loans to students ................................................................................................................................................................................................................................. (25,652) Collection of loans ................................................................................................................................................................................................................................ 1,232,399 Net cash provided (used) by operating activities ...................................................................................................................................................... (132,497,118)
CASH FLOW FROM NONCAPITAL FINANCING ACTIVITIES State appropriations ........................................................................................................................................................................................................................... 144,250,934 Federal appropriations ...................................................................................................................................................................................................................... 12,623,848 Gifts and grants ..................................................................................................................................................................................................................................... 93,883,716 Net cash flow provided (used) by noncapital financing activities ...................................................................................................................... 250,758,498
CASH FLOW FROM CAPITAL AND RELATED FINANCING ACTIVITIES State capital appropriations ............................................................................................................................................................................................................ 5,900,272 Capital grants and gifts received .................................................................................................................................................................................................... 16,299,922 Proceeds from sale of property ...................................................................................................................................................................................................... 114,497 Purchases of capital assets ............................................................................................................................................................................................................... (137,703,347) Capital lease payments ...................................................................................................................................................................................................................... (915,204) Principal payments and redemption premiums on long term debt ............................................................................................................................... (21,485,000) Interest and fees .................................................................................................................................................................................................................................. . (24,792,879) Net cash provided (used) by capital activities ............................................................................................................................................................ (162,581,739)
CASH FLOWS FROM INVESTING ACTIVITIES Interest on investments ..................................................................................................................................................................................................................... 16,716,462 Proceeds from notes receivable with Clemson University Foundation ........................................................................................................................ 10,000,000 Proceeds from stock sales ................................................................................................................................................................................................................ 61,616 Net cash flows provided (used) by investing activities ........................................................................................................................................... 26,778,078
Net change in cash ............................................................................................................................................................................................................................... (17,542,281) Cash beginning of year ....................................................................................................................................................................................................................... 568,095,632 Cash end of year ............................................................................................................................................................................................ $ 550,553,351
RECONCILIATION OF NET OPERATING INCOME (LOSS) TO NET CASH PROVIDED (USED) BY OPERATING ACTIVITIES: Operating income (loss) .................................................................................................................................................................................................................... $ (258,523,749) Adjustments to reconcile operating income (loss) to net cash provided (used) by operating activities: Depreciation expense ................................................................................................................................................................................................................... 66,648,011 Amortization of net pension liability ..................................................................................................................................................................................... 38,062,630 Amortization of net retiree health benefit liability ......................................................................................................................................................... 19,728,020
Change in asset and liabiliites: Receivables, net ............................................................................................................................................................................................................................... 7,297,502 Grants and contracts receivable .............................................................................................................................................................................................. (4,094,877) Student loans receivable ............................................................................................................................................................................................................. 1,213,440 Prepaid items ................................................................................................................................................................................................................................... 3,312,683 Inventories ........................................................................................................................................................................................................................................ 647,228 Pooled fringe adjustment ........................................................................................................................................................................................................... 4,768,681 Accounts and retainages payable ............................................................................................................................................................................................ (4,297,606) Accrued payroll and related liabilities .................................................................................................................................................................................. (361,952) Accrued compensated absences and related liabilities ................................................................................................................................................. 3,087,000 Unearned revenue ......................................................................................................................................................................................................................... (11,583,276) Deposits held for others .............................................................................................................................................................................................................. 1,599,147 Net cash provided (used) by operating activities .............................................................................................................................. $ (132,497,118)
NON-CASH TRANSACTIONS Increase in fair value of investments and notes receivable ................................................................................................................................................ $ 14,444,478 Assets acquired through gifts.......................................................................................................................................................................................................... 3,318,922 State capital appropriations receivable ..................................................................................................................................................................................... 7,857,501 Collection of capital gift receivable ............................................................................................................................................................................................... 1,324,326 Loss on disposal of capital assets .................................................................................................................................................................................................. 1,655,092 Assets acquired through capital lease ......................................................................................................................................................................................... 369,768
RECONCILIATION OF CASH AND CASH EQUIVALENT BALANCES Current assets: Cash and cash equivalents .......................................................................................................................................................................................................... $ 328,767,289 Restricted cash and cash equivalents .................................................................................................................................................................................... 219,616,650 Noncurrent assets ................................................................................................................................................................................................................................ 2,169,412 Total cash and cash equivalent balances $ 550,553,351
CLEMSON UNIVERSITY
FortheyearendedJune30,2020STATEMENT OF CASH FLOWS

~ 33 ~
CLEMSON UNIVERSITY FOUNDATION NON-GOVERNMENTAL DISCRETELY PRESENTED COMPONENT UNITSTATEMENT OF FINANCIAL POSITIONJune30,2020
See accompanying notes to basic financial statements.
DESCRIPTION AMOUNTASSETS Cash and cash equivalents................................................................................................................................................................................. $67,700,806 Contributions receivable, net ........................................................................................................................................................................... 37,237,188 Trusts held by others ........................................................................................................................................................................................... 5,465,572 Due from related organizations ...................................................................................................................................................................... 1,646,130 Investments ............................................................................................................................................................................................................. 534,423,609 Investments held for Clemson University .................................................................................................................................................. 201,601,857 Cash surrender value of life insurance ........................................................................................................................................................ 2,264,151 Land held for resale ............................................................................................................................................................................................. 11,900 Land, buildings and equipment, net ............................................................................................................................................................. 9,216,723 Funds held in trust for affiliates: Non-pooled assets, net ................................................................................................................................................................................... 9,800,923 Pooled investments .......................................................................................................................................................................................... 47,880,641 Contributions receivable, net ...................................................................................................................................................................... 26,678,653 Other assets ............................................................................................................................................................................................................. 420,084 Total Assets ............................................................................................................................................................................................... $ 944,348,237
LIABILITIES AND NET ASSETS Liabilities: Accounts payable and accrued liabilities ............................................................................................................................................... $ 257,421 Due to related organizations ........................................................................................................................................................................ 638,295 Accrued liability to Clemson University due to net investment appreciation ........................................................................ 54,924,202 Note payable to Clemson University ......................................................................................................................................................... 146,677,655 Deferred revenue .............................................................................................................................................................................................. 4,000,000 Actuarial liability of annuities payable .................................................................................................................................................... 3,538,601 Funds administered for affiliates ............................................................................................................................................................... 84,360,217 Total Liabilities ....................................................................................................................................................................................... 294,396,391
Net Assets: Without donor restrictions ...................................................................................................................................................................... 40,154,813 With donor restricitons ............................................................................................................................................................................. 609,797,033 Total Net Assets ......................................................................................................................................................................................... 649,951,846 Total Liabilities and Net Assets ..................................................................................................................................................... $944,348,237

~ 34 ~
CLEMSON UNIVERSITY FOUNDATION NON-GOVERNMENTAL DISCRETELY PRESENTED COMPONENT UNITSTATEMENT OF ACTIVITIESFortheyearendedJune30,2020
See accompanying notes to basic financial statements.
DESCRIPTION
WITHOUTDONOR
RESTRICTIONS
WITHDONOR
RESTRICTIONS TOTALRevenues, Gains, and Other Support: Gifts and bequests................................................................................................................ $ 2,925,799 $ 42,393,152 $ 45,318,951 Investment return, net....................................................................................................... 6,976,273 3,790,624 10,766,897 Program income.................................................................................................................... 1,864,760 418,655 2,283,415 Other income.......................................................................................................................... 2,006,707 (311,892) 1,694,815 Change in value of split-interest agreements........................................................... 46,679 (789,961) (743,282) Reclassification of donor intent..................................................................................... 311,967 (311,967) — Total........................................................................................................................... 14,132,185 45,188,611 59,320,796
Net assets released from restrictions.......................................................................... 29,412,256 (29,412,256) — Total Revenues, Gains and Other Support................................................. 43,544,441 15,776,355 59,320,796
Expenses: Program expenses in support of Clemson University........................................... 31,271,664 — 31,271,664 Administrative and investment support.................................................................... 4,478,123 — 4,478,123 Fundraising............................................................................................................................. 4,622,969 — 4,622,969 Total Expenses....................................................................................................... 40,372,756 — 40,372,756
Change in net assets before other changes..................................................................... 3,171,685 15,776,355 18,948,040 Other Changes: Transfers to related entities............................................................................................. (1,794) (324,221) (326,015)
Total Other Changes............................................................................................ (1,794) (324,221) (326,015)
Change in net assets............................................................................................................ 3,169,891 15,452,134 18,622,025 Net assets, beginning of year............................................................................................ 36,984,922 594,344,899 631,329,821 Net assets, end of year......................................................................................................... $ 40,154,813 $ 609,797,033 $ 649,951,846

~ 35 ~
DESCRIPTION AMOUNTASSETS Cash and cash equivalents ........................................................................................................... $ 3,886,829 Receivables ......................................................................................................................................... 75,960 Prepaid expense ............................................................................................................................... 130,000 Real estate investments ................................................................................................................. 46,659,274 Real estate and equipment, net .................................................................................................. 11,926,595 Direct financing lease .................................................................................................................... 10,169,491 Development costs .......................................................................................................................... 635,270 Total Assets .............................................................................................................................. $ 73,483,419
LIABILITIES AND NET ASSETS Accounts payable ............................................................................................................................. $ 60,449 Accrued interest payable .............................................................................................................. 27,363 Deposits held for others ................................................................................................................ 28,495 Unearned revenue ........................................................................................................................... 277,289 Deferred rent revenue.................................................................................................................... 1,719,579 Due to Clemson University Foundation .................................................................................. 20,932,472 Notes payable, net ............................................................................................................................ 21,090,538 Total Liabilities ....................................................................................................................... 44,136,185
Net Assets Without Donor Restrictions ...................................................................................... 29,347,234 Total Net Assets ..................................................................................................................... 29,347,234 Total Liabilities and Net Assets ....................................................................................... $ 73,483,419
See accompanying notes to basic financial statements.
CLEMSON UNIVERSITY LAND STEWARDSHIP FOUNDATIONNON-GOVERNMENTAL DISCRETELY PRESENTED COMPONENT UNITSTATEMENT OF FINANCIAL POSITIONJune30,2020

~ 36 ~
See accompanying notes to basic financial statements.
CLEMSON UNIVERSITY LAND STEWARDSHIP FOUNDATION NON-GOVERNMENTAL DISCRETELY PRESENTED COMPONENT UNITSTATEMENT OF ACTIVITIESFortheyearendedJune30,2020
DESCRIPTION AMOUNTRevenues, Gains, and Other Support: Gifts and contributions .................................................................................................................. $ 150,000 Rental revenues ................................................................................................................................ 3,621,403 Direct financing................................................................................................................................. 3,492 Common area and management fees ...................................................................................... 342,090 Income on short-term investments.......................................................................................... 29,660 Investment return, net ................................................................................................................... (700,182) Total Revenues and Gains .................................................................................................. 3,446,463
Program expenses: CU-ICAR campus............................................................................................................................... 1,575,789 Greenville One ................................................................................................................................... 330,371 Administrative and other ............................................................................................................. 387,852 Total Program Expenses .................................................................................................... 2,294,012
Interest expense ............................................................................................................................... 906,529 Total expenses ........................................................................................................................ 3,200,541
Change in net assets without donor restrictions before other changes................... 245,922
Other changes: Contributions to a related entity, net ................................................................................. —
Change in net assets without donor restrictions ............................................................... 245,922 Net assets without donor restrictions, beginning of year .............................................. 29,101,312 Net assets without donor restrictions, end of year ........................................................... $ 29,347,234

~ 37 ~
DESCRIPTION AMOUNTASSETS Cash and cash equivalents ........................................................................................................... $ 9,608,778 Due from related organizations ................................................................................................. 20,341 Annual fund receivable, net ......................................................................................................... 847,074 Investments ........................................................................................................................................ 24,706,707 Funds held in trust by an affiliate: Non-pooled assets ...................................................................................................................... 9,093,044 Pooled investments ................................................................................................................... 33,882,690 Contributions receivable, net ................................................................................................ 26,610,282 Total Assets .............................................................................................................................. $ 104,768,916
LIABILITIES AND NET ASSETS Accounts payable and accrued expenses ............................................................................... $ 81,214 Refund liability .................................................................................................................................. 4,677,091 Due to related organizations ....................................................................................................... 1,440,832 Total Liabilities ....................................................................................................................... 6,199,137
Net assets Without Donor Restrictions Undesignated................................................................................................................................ 30,806,197 Quasi-endowment ...................................................................................................................... 30,824,362 Total Without Donor Restrictions .................................................................................. 61,630,559 With Donor Restrictions ............................................................................................................... 36,939,220 Total Net Assets ..................................................................................................................... 98,569,779 Total Liabilities and Net Assets ....................................................................................... $104,768,916
See accompanying notes to basic financial statements.
IPTAY NON-GOVERNMENTAL DISCRETELY PRESENTED COMPONENT UNITSTATEMENT OF FINANCIAL POSITIONJune30,2020

~ 38 ~
See accompanying notes to basic financial statements.
IPTAY NON-GOVERNMENTAL DISCRETELY PRESENTED COMPONENT UNITSTATEMENT OF ACTIVITIESFortheyearendedJune30,2020
DESCRIPTION
WITHOUTDONOR
RESTRICTIONS
WITH DONOR
RESTRICTIONS TOTALRevenues, Gains, and Other Support: Contributions from the public ................................................................. $ 41,679,394 $ 14,325,749 $ 56,005,143 Investment return, net ................................................................................ 1,197,254 73,482 1,270,736 Interest income .............................................................................................. 86,692 — 86,692
42,963,340 14,399,231 57,362,571
Net assets released from restrictions: Satisfaction of tine restriction ............................................................ 5,533,685 (5,533,685) — Satisfaction of purpose restrictions ................................................ 727,088 (727,088) — Total Revenues, Gains, and Other Support .............................. 49,224,113 8,138,458 57,362,571
Expenses: Program services: Support of Clemson University:
Athletic operations ............................................................................ 35,002,423 — 35,002,423 Football operations building ......................................................... 68,940 — 68,940 Debt service .......................................................................................... 7,294,723 — 7,294,723 Other construction costs ................................................................. 10,780,000 — 10,780,000 Other athletic support...................................................................... 2,005,950 — 2,005,950 Management and general ..................................................................... 664,497 — 664,497
Total Expenses ..................................................................................... 55,816,533 — 55,816,533
Excess of revenues over expenses .............................................................. (6,592,420) 8,138,458 1,546,038
Contributions of net assets from a related party (Note 7) ............. 796 29,924 30,720
Change in net assets..................................................................................... (6,591,624) 8,168,382 1,576,758 Net assets, beginning of year ................................................................... 68,222,183 28,770,838 96,993,021 Net assets, end of year ................................................................................ $ 61,630,559 $ 36,939,220 $ 98,569,779

NOTES TO FINANCIAL STATEMENTS
~ 39 ~
NOTE 1.SUMMARY OF SIGNIFICANT ACCOUNTING POLICIES
Nature of Organization ClemsonUniversityisaState-supported,coeducationalinstitutionofhighereducation.TheUniversityisgrantedanannualappropriationforoperatingpurposesasauthorizedbytheSouthCarolinaGeneralAssembly.Theappropriationasenactedbecomesthelegaloperatingbudgetfortheinstitution.TheAppropriationAct authorizes expenditures from fundsappropriatedfromtheGeneralFundoftheStateandauthorizesexpendituresoftotaloperatingfunds.ThelawsoftheStateandthepoliciesandproceduresspecifiedbytheStateforStateagenciesandinstitutionsareapplicabletotheactivitiesoftheUniversity.TheUniversitywasestablishedasaninstitutionofhighereducationbySection59-119-20oftheCodeofLawsofSouthCarolinainaccordancewiththewillofThomasGreenClemsonandtheActofAcceptanceoftheGeneralAssemblyofSouthCarolina.TheUniversityisacomponentunitoftheStateofSouthCarolinaanditsfinancialstatementsareincludedintheComprehensiveAnnualFinancialReportoftheStateofSouthCarolina.TheUniversityisgovernedbyaboardofthirteenmembers,includingsixelectedbytheStateLegislatureand seven self-perpetuating lifemembers. Accordingly, assuchitadministers,hasjurisdictionover,andisresponsibleforthemanagementoftheUniversity.
Reporting Entity Thefinancialreportingentity,asdefinedbyGovernmentalAccountingStandardsBoard (GASB)CodificationSection2100,Defining the Financial Reporting Entity, consists oftheprimarygovernment,organizationsforwhichtheprimarygovernmentisfinanciallyaccountableandotherorganizationsforwhichthenatureandsignificanceoftheirrelationshipwiththeprimarygovernmentaresuchthatexclusioncouldcausethefinancialstatementstobemisleadingorincomplete.GASBCodificationSection2600,Reporting Entity and Component Unit Presentation and Disclosure, provides criteria fordeterminingwhethercertainorganizationsshouldbereportedascomponentunitsbasedonthenatureandsignificanceoftheirrelationshipwithaprimarygovernmentandclassifiesreportingrequirementsforthoseorganizations.Basedonthesecriteria,thefinancialstatementsincludetheUniversityanditsblendedcomponentunitastheprimarygovernment,andotherrelatedentitiesasdiscretelypresentedcomponentunits. TheClemsonResearchFacilitiesCorporation(CRFC)isaseparatelycharterednot-for-profitcorporationestablishedtoconstructcertainfacilitiesfortheUniversity.CRFCisafully blended component unit of theUniversity. AlthoughlegallyseparatefromtheUniversity,CRFC’sactivitiesaresointertwinedwiththeUniversity’sthattheyare,insubstance,thesameastheprimaryentity.CRFC’sactivitiesaregovernedbyitsBoardofDirectorswhichiswhollycomprisedofUniversityrepresentatives.ItsbalancesandtransactionsareblendedwiththoseoftheUniversityandreportedasiftheywerebalancesandtransactionsoftheUniversity.
TheClemsonUniversityFoundation(CUF)isaseparatelychartered corporation organized exclusively to promotethe development andwelfare ofClemsonUniversity in itseducational and scientific purposes. CUF’s activities aregoverned by itsBoard ofDirectors. CUF is considered acomponentunit,and isdiscretelypresented in thefinancialstatements, because the nature and significance of itsrelationshipwiththeUniversityissuchthatexclusionfromthe reporting entitywould render the financial statementsincomplete.CUFisconsideredanongovernmentalcomponentunitsinceitdoesnotmeetthedefinitionofagovernmentalentity.NoneofthefollowingcharacteristicsofagovernmentalentityapplytoCUF:a)Organizationisapubliccorporation;b)Organizationisabodycorporateandpolitic;c)Acontrollingmajorityof themembersof theorganizationareelectedorappointed by governmental officials; d)There is potentialforunilateraldissolutionbyagovernmentwiththenetassetsreverting to the government; and e)The organization hasthepowertoenactandenforceataxlevy.BecauseCUFisdeemednottobeagovernmentalentityandusesadifferentreportingmodel,itsbalancesandtransactionsarereportedonseparatefinancialstatements.Copiesoftheseparatelyissuedfinancial statements of theClemsonUniversityFoundationcanbeobtainedbysendingarequesttothefollowingaddress:ClemsonUniversityFoundation,110DanielDrive,Clemson,SC,29634. TheClemsonUniversityLandStewardshipFoundation(CULSF)isaseparatelycharteredcorporation,establishedtoservetheneedsofClemsonUniversityinthemanagement,development, and investment of real property and related assets. CULSF’s activities are governed by itsBoard ofDirectors. CULSF is considered a component unit, and isdiscretelypresentedinthefinancialstatements,becausethenatureandsignificanceofitsrelationshipwiththeUniversityissuchthatexclusionfromthereportingentitywouldrenderthefinancial statements incomplete. CULSF is considereda nongovernmental component unit since it does notmeetthedefinitionofagovernmentalentity(asdescribedabove).Copies of the separately issuedfinancial statements of theClemsonUniversityLandStewardship Foundation can beobtained by sending a request to the following address:ClemsonUniversityLandStewardshipFoundation,P.O.Box1889,Clemson,SC29633. IPTAYisaseparatelycharteredcorporationestablishedexclusively to support University athletics. IPTAY’sactivitiesaregovernedbyitsBoardofDirectors.IPTAYisconsideredacomponentunit,andisdiscretelypresentedinthefinancialstatements,becausethenatureandsignificanceofitsrelationshipwiththeUniversityissuchthatexclusionfromthereportingentitywouldrenderthefinancialstatementsincomplete. IPTAY is considered a nongovernmentalcomponent unit since it does notmeet the definition of agovernmental entity (as described above). Copies of theseparately issued financial statements of IPTAY can beobtainedbysendingarequesttothefollowingaddress:IPTAY,P.O.Box1529,Clemson,SC29633.

NOTES TO FINANCIAL STATEMENTS
~ 40 ~
Financial Statement Presentation Thefinancial statementpresentation for theUniversitymeetstherequirementsofGASBCodificationSections2100-2900,Financial Reporting Entity, andCo5,Colleges and Universities.Thefinancialstatementpresentationprovidesacomprehensive, entity-wide perspective of theUniversity’sassets, liabilities,netposition, revenues, expenses, changesinnetposition,andcashflows.
Use of Estimates The preparation of financial statements in conformitywith generally accepted accounting principles requiresmanagement tomakeestimatesandassumptions thataffectthereportedamountsofassets, liabilities,deferred inflows,deferredoutflows,revenuesandexpenses,andaffectdisclosureofcontingentassetsandliabilitiesatthedateofthefinancialstatements. Significant estimates include separation ofaccrued compensated absences between current and non-current,depreciationexpense,accountsreceivableallowances,scholarshipallowances,andfunctionalexpenseclassifications.Actualresultscoulddifferfromthoseestimates.
Basis of Accounting Forfinancialreportingpurposes,theUniversity,alongwithClemsonResearchFacilitiesCorporation, its fully blendedcomponentunit,isconsideredaspecial-purposegovernmentengagedonly in business-type activities. Accordingly, theUniversity’s financial statements are presented using theeconomicresourcesmeasurementfocusandtheaccrualbasisofaccounting.Undertheaccrualbasis,revenuesarerecognizedwhenearned,andexpensesarerecordedwhenanobligationhasbeenincurred.Studenttuitionandauxiliaryenterprisefeesarepresentednetofscholarshipsandfellowshipsappliedtostudentaccounts,whilepaymentsmadedirectlyarepresentedasscholarshipandfellowshipexpenses.Allsignificantintra-agencytransactionshavebeeneliminated. TheClemsonUniversityFoundation(CUF),theClemsonUniversity Land Stewardship Foundation (CULSF), andIPTAYareprivatenonprofitorganizationsthatreportunderFinancialAccountingStandardsBoard (FASB) standards,includingAccounting StandardsCodificationTopic 958,Not-for-Profit Entities.Assuch,certainrevenuerecognitioncriteria and presentation features are different fromGASBrevenue recognition criteria andpresentation features. NomodificationshavebeenmadetoCUF,CULSF,orIPTAY’sfinancial information in theUniversity’sfinancial reportingentityforthesedifferences.
Cash and Cash Equivalents The amounts shown in the financial statements inUniversityfundsas“cashandcashequivalents”representpettycash,cashondepositinbanks,cashondepositwiththeStateTreasurer,cashinvestedinvariousinstrumentsbytheStateTreasureraspartoftheState’sinternalcashmanagementpool,cashinvestedinvariousshort-terminstrumentsbytheStateTreasurerandheldinseparateagencyaccounts,andcertainfundsinvestedwithWellsFargo.
MostStateagencies,includingtheUniversity,participatein the State’s internal cashmanagement pool. Becausethe cashmanagement pool operates as a demand depositaccount,amountsinvestedinthepoolareclassifiedascashand cash equivalents. TheStateTreasurer administers thecashmanagementpool. Thepoolincludessomelong-terminvestmentssuchasobligationsoftheUnitedStatesandcertainagenciesoftheUnitedStates,obligationsoftheStateofSouthCarolinaandcertainofitspoliticalsubdivisions,certificatesofdeposit,collateralizedrepurchaseagreements,andcertaincorporatebonds.Forcreditriskinformationpertainingtothecashmanagementpool,seethedepositsdisclosuresinNote2. TheState’sinternalcashmanagementpoolconsistsofageneraldepositaccountandseveralspecialdepositaccounts.TheStaterecordseachfund’sequity interest in thegeneraldeposit account; however, all earningson that account arecredited to theGeneralFundof theState. TheUniversityrecordsandreportsitsdepositsinthegeneraldepositaccountatcost.Itrecordsandreportsitsspecialdepositaccountatfairvalue.Investmentsheldbythepoolarerecordedatfairvalue.InterestearnedbytheUniversity’sspecialdepositaccountsispostedtoitsaccountattheendofeachmonthandisretained.Interest earnings are allocated based on the percentage oftheUniversity’saccumulateddailyincomereceivabletothetotalincomereceivableofthepool.Reportedinterestincomeincludes interest earnings at the stated rate, realizedgains/losses,andunrealizedgains/lossesarisingfromchangesinthefairvalueofinvestmentsheldbythepool.Realizedgainsandlossesareallocateddailyandareincludedintheaccumulatedincomereceivable.Unrealizedgainsandlossesareallocatedatyearendbasedonthepercentageofownershipinthepool. SomeStateTreasurer accounts are not included in theState’sinternalcashmanagementpoolbecauseofrestrictionsontheuseofthefunds.Forthoseaccounts,cashequivalentsinclude investments in short-term, highly liquid securitieshaving an internalmaturity of threemonths or less at thetimeofacquisition.ForpurposesoftheStatementofCashFlows,theUniversityconsidersallhighlyliquidinvestmentswithanoriginalmaturityofthreemonthsorlesstobecashequivalents.FundsinvestedthroughtheStateTreasurer’sCashManagementProgramareconsideredtobecashequivalents.
Receivables Accountsreceivableconsistsoftuitionandfeechargestostudentsandauxiliaryenterpriseservicesprovidedtostudents,facultyandstaff, themajorityofeach residing in theStateofSouthCarolina.Accountsreceivablearerecordednetofestimateduncollectibleamounts. Grants and contracts receivable include amounts duefromtheFederalgovernment,stateandlocalgovernments,orprivatesources,inconnectionwithreimbursementofallowableexpendituresmade pursuant to theUniversity’s grant andcontracts. Also includedareamountsdue forFederal loanandscholarshipsprogramsand reimbursements forFederalland-grantexpenditures.

NOTES TO FINANCIAL STATEMENTS
~ 41 ~
Contributions receivable are accounted for at theirestimatednetrealizablevalue.Theestimatednetrealizablevalue comprehends the present value of long-termpledgesandreductionsforanyallowanceforuncollectiblepledges.PledgesvaryfromonetotenyearsandareusedtosupportspecificallyidentifiedUniversityprogramsandinitiatives. AmountsduefromtheClemsonUniversityFoundationarepursuanttoaMemorandumofUnderstandingbetweentheUniversityandthatentitypromptedbya1999changeintheSouthCarolinaCodeofLaws that allowed state-supporteduniversitiestolendendowmentbalancestoseparatelycharterednot-for-profitentitieswhoseexistenceisprimarilyprovidingfinancialassistanceandothersupporttotheinstitutionanditseducationalprograms.Foradditionalinformationregardingthisloan,seeNote3. Student loansreceivableconsistsofamountsduefromthe Federal PerkinsLoan Program, and from other loansadministeredbytheUniversity. Interestandincomereceivableconsistsofamountsduefrom theStateTreasurer relating to holdings in theState’sinternalcashmanagementpoolandcashinvestedinvariousshort-terminvestmentsbythatagency.
Inventories Inventoriesforinternalusearevaluedatcost.Inventoriesforresalearecarriedat thelowerofcostormarket. Itemsaccounted for asUniversity inventories using themovingweighted averagemethod include:maintenance supplies,housing supplies, janitorial and auto supplies, printingand graphic supplies, office supplies, computer parts andaccessories,telecommunicationssupplies,medicalsupplies,andClemsonbluecheeseproduction.
Prepaid Items Expendituresforinsuranceandsimilarservicespaidforinthecurrentorpriorfiscalyearsandbenefitingmorethanoneaccountingperiodareallocatedamongaccountingperiods.FortheUniversity,amountsreportedinthisassetaccountconsistprimarilyofprepaidinsurance,prepaidpostage,prepaidairlinetickets,andadvancepaymentsformaintenanceandserviceagreements.
Investments TheUniversityaccountsforitsinvestmentsatfairvalueinaccordancewithGASBStatementNo.31,AccountingandFinancialReportingforCertainInvestmentsandforExternalInvestmentPools.Changesinunrealizedgain(loss)onthecarryingvalueofinvestmentsarereportedasacomponentofinvestmentincomeintheStatementofRevenues,ExpensesandChangesinNetPosition.
Noncurrent Cash and Investments Noncurrent cash and investments primarily consist ofpermanentlyendowedfundsandfederalstudentloanfunds.These funds are externally restricted and are classified asnoncurrentassetsintheStatementofNetPosition.
Other Assets TheUniversity submits a pooled fringe benefit rateproposaltoitscognizantagency,theU.S.DepartmentofHealth&HumanServicestwoyearsinadvanceofactualcharges.Under-recoveriesofactualcostsarerecognizedasanOtherAsset.Theseunder-recoverieswillbeconsideredintherateproposalforthenextreviewperiod.
Capital Assets Capitalassetsarerecordedatcostatthedateofacquisitionorfairmarketvalueatthedateofdonationinthecaseofgifts.TheUniversityfollowscapitalizationguidelinesestablishedbytheStateofSouthCarolina.Alllandiscapitalized,regardlessofcost.Qualifyingimprovementsthatrestinoronthelanditselfarerecordedasdepreciablelandimprovements.Majoradditionsandrenovationsandotherimprovementsthataddtotheusablespace,prepareexistingbuildingsfornewuses,orextendtheusefullifeofanexistingbuildingarecapitalized.TheUniversitycapitalizesmovablepersonalpropertywithaunitvalueinexcessof$5,000andausefullifeinexcessofoneyearanddepreciablelandimprovements,buildingsandimprovements, and intangible assets, including internallydevelopedsoftware,costinginexcessof$100,000.Routinerepairs andmaintenance and library materials, exceptindividual items costing in excess of $5,000, are chargedtooperatingexpensesintheyearinwhichtheexpensewasincurred.Donatedcapitalassetsordonatedworksofartandsimilaritemsarereportedatacquisitionvalue.Capitalassetsreceivedinaserviceconcessionarrangementarealsoreportedatacquisitionvalue. Depreciationiscomputedusingthestraight-linemethodovertheestimatedusefullivesoftheassets,generally15to40yearsforbuildingsandimprovementsandlandimprovementsand5 to 20years formachinery, equipment, andvehicles.Internallydevelopedsoftwareisdepreciatedusingthestraight-linemethodoverathreeyearperiod.Depreciationexpenseischargedmonthly,withamid-monthconventionutilizedfortheinitialmonththattheassetisplacedinservice.
Unearned Revenues Unearnedrevenuesincludeamountsreceivedfortuitionandfeesandcertainauxiliaryactivitiespriortotheendofthefiscalyearbut related to thesubsequentaccountingperiod.Unearnedrevenuesalsoincludeamountsreceivedfromgrantandcontractsponsorsthathavenotyetbeenearned.
Deposits Deposits represent football-related guarantees andconference settlement amounts, andvarious student-relatedamountsincluding:dormitoryroomdeposits,securitydepositsforpossibleroomdamageandkeyloss,otherdeposits,andstudentfeerefunds.Studentdepositsarerecognizedasrevenueduringthesemesterforwhichthefeeisapplicableandearnedwhen thedeposit isnonrefundable to thestudentunder theforfeittermsoftheagreement.
NOTES TO FINANCIAL STATEMENTS
~ 42 ~
Funds Held for Others CurrentbalancesinFundsHeldforOthersresultprimarilyfromtheUniversityactingasanagent,orfiduciary,foranotherentity.Theseincludeamountsduetootherentitiesandamountsdueforvariousstudyabroadprograms.NoncurrentbalancesrepresenttheFederalliabilityforthePerkinsLoanProgram.
Internal Service and Auxiliary Enterprise Activities Both revenue and expenses relating to internal service(including information technology costs) and auxiliaryenterprise activities includingprint shop, office equipment,maintenance, transportation services, telecommunications,institutionalcomputing,bookstores,andcafeteriashavebeeneliminated.
Compensated Absences Generally all permanent full-time State employees,andcertainpart-timeemployeesscheduled toworkat leastone-half of the agency’sworkweek, are entitled to accrueand carry forward at calendar year-endmaximumsof 180days sick leave and45days annual vacation leave, exceptthat facultymembers do not accrue annual leave. UponterminationofStateemployment,employeesareentitledtobepaidforaccumulatedunusedannualvacationleaveuptothemaximum,butarenotentitledtoanypaymentforunusedsickleave.Thecompensatedabsencesliabilityincludesaccruedannual leave and compensatory overtime leave earned forwhichtheemployeesareentitledtopaidtimeofforpaymentat termination. TheUniversity calculates the compensatedabsencesliabilitybasedonrecordedbalancesofunusedleaveforwhich the employer expects to compensate employeesthroughpaidtimeofforcashpaymentsattermination.Thatliabilityisinventoriedatfiscalyear-endcurrentsalarycostsand the cost of the net change in the liability for salary-relatedbenefitpaymentsisrecordedinthecurrentyearintheapplicablefunctionalexpenditurecategories.
Noncurrent Liabilities Noncurrent liabilities include (1) principal amounts ofbondspayableandcapitalleaseobligationswithcontractualmaturitiesgreater thanoneyear; (2)estimatedamounts foraccruedcompensatedabsencesandotherliabilitiesthatwillnotbepaidwithinthenextfiscalyear;and(3)otherliabilitiesthat,althoughpayablewithinoneyear,aretobepaidfromfundsthatareclassifiedasnoncurrentassets.
Net Pension Liability For purposes ofmeasuring the net pension liability,deferred outflows of resources and deferred inflowsof resources related to pensions, and pension expense,information about the fiduciary net position of the SouthCarolinaRetirementSystem(SCRS)andtheSouthCarolinaPoliceOfficersRetirementSystem(PORS)andadditionsto/deductions fromSCRS’s andPORS’fiduciarynet positionhavebeendeterminedonthesamebasisastheyarereportedby
SCRSorPORS.Forthispurpose,benefitpayments(includingrefundsofemployeecontributions)arerecognizedwhendueandpayableinaccordancewiththebenefitterms.Investmentsarereportedatfairvalue.
Other Postemployment Benefits Liability Forpurposesofmeasuringthenetpostemploymentbenefitliability,deferredoutflowsofresourcesanddeferredinflowsofresourcesrelatedtopostemploymentbenefits,andbenefitexpense,informationaboutthefiduciarynetpositionoftheSouthCarolinaPublicEmployeeBenefitAuthority’sRetireeHealthCare Plan andLong-TermDisability IncomePlanand additions to/deductions from thefiduciary net positionoftheplanshavebeendeterminedonthesamebasisastheyarereportedbytheSouthCarolinaPublicEmployeeBenefitAuthority. For this purpose, benefit payments (includingrefundsofemployeecontributions)arerecognizedwhendueandpayableinaccordancewiththebenefitterms.Investmentsarereportedatfairvalue.
Deferred Outflows of Resources and Deferred Inflows of Resources Deferredoutflowsof resources represent consumptionofnetpositionthatisapplicabletoafutureperiod.Deferredinflowsofresourcesrepresentacquisitionofnetpositionthatisapplicabletoafutureperiod.FortheUniversity,refundsrelatedtodebtdefeasanceareincludedindeferredoutflowsofresources.Thedeferredamountwillbeamortizedovertheremaininglifeofthedebtrefunded.Changesinnetpensionliabilityandnetpostemploymentbenefitliabilitynotincludedin expense are reported as deferred outflows of resourcesor deferred inflows of resources. Employer contributionssubsequenttothemeasurementdateofthenetpensionliabilityand net postemployment benefit liability are reported asdeferredoutflowsofresources.
Net Position TheUniversity’scomponentsofnetpositionareclassifiedasfollows:
Net Investment in Capital Assets: This represents theUniversity’s total investment in capital assets, net ofoutstandingdebtobligationsrelatedtothosecapitalassets.Totheextentdebthasbeenincurredbutnotyetexpendedforcapitalassets,suchamountsarenotincludedasacomponentofnetinvestmentincapitalassets.
Restricted Net Position - Nonexpendable: Nonexpendablerestrictednetpositionconsistsofendowmentandsimilartypefundsinwhichdonorsorotheroutsidesourceshavestipulated, as a conditionof thegift instrument, that theprincipal is tobemaintained inviolate and inperpetuity,andinvestedforthepurposeofproducingpresentandfutureincome,whichmayeitherbeexpendedoraddedtoprincipal.

NOTES TO FINANCIAL STATEMENTS
~ 43 ~
Restricted Net Position - Expendable:RestrictedexpendablenetpositionincludesresourcesinwhichtheUniversityislegally or contractually obligated to spend resources inaccordancewith restrictions imposed by external thirdparties.
Unrestricted Net Position: Unrestrictednetpositionrepresentsresourcesderivedfromstudent tuition and fees, state appropriations, and salesand services of educational departments and auxiliaryenterprises.These resources are used for transactionsrelating to the educational and general operations oftheUniversity andmaybe used at the discretion of thegoverningboardtomeetcurrentexpensesforanypurpose.Theseresourcesalsoincludeauxiliaryenterprises,whicharesubstantiallyself-supportingactivitiesthatprovideservicesforstudents,facultyandstaff.
Whenanexpenseisincurredthatcanbepaidusingeitherrestrictedorunrestrictedresources,theUniversity’spolicyistofirstapplytheexpensetowardsrestrictedresourcesandthentowardsunrestrictedresources.
Income Taxes TheUniversity is a political subdivision of the StateofSouthCarolinaandisconsequentlyexemptfromfederalincometaxesunderSection115(1)of theInternalRevenueCode,asamended. The InternalRevenueService has determined that theClemsonUniversity Foundation, theClemsonUniversityResearch Foundation, the Clemson University LandStewardship Foundation, and IPTAY qualify as exemptorganizationsunderInternalRevenueCodeSection501(c)(3)andassuchareexemptfromtaxationonrelatedincome.
Classification of Revenues and Expenses TheUniversityhasclassifieditsrevenuesandexpensesaseitheroperatingornonoperatingaccordingtothefollowingcriteria:Operating revenues and expenses:Operatingrevenuesincludeactivitiesthathavethecharacteristicsofexchangetransactions,suchas(1)studenttuitionandfees,netofscholarshipdiscountsandallowances,(2)salesandservicesofauxiliaryenterprises,netofscholarshipdiscountsandallowances,(3)mostFederal,state and local grants and contracts, and (4) interest oninstitutional loans. Operatingexpenses includeallexpensetransactionsincurredotherthanthoserelatedtoinvesting,capitalornoncapitalfinancingactivities.
Nonoperating revenues and expenses: Nonoperatingrevenuesincludeactivitiesthathavethecharacteristicsofnonexchangetransactions,suchasgiftsandcontributions,andotherrevenuesourcesthataredefinedasnonoperatingrevenues byGASB StatementNo. 9,Reporting Cash Flows of Proprietary and Nonexpendable Trust Funds and Governmental Entities That Use Proprietary Fund Accounting, andGASBStatementNo. 34, such as stateand federal appropriations and investment income.
Nonoperating expenses include interest paid on capitalassetrelateddebt,lossesonthedisposalofcapitalassets,andfacilitiesandadministrativeremittancestotheState.
Educational Activities Revenue Revenuesfromsalesandservicesofeducationalactivitiesgenerally consist of amounts received from instructional,laboratory, research, and public service activities thatincidentallycreategoodsandserviceswhichmaybesoldtostudents,faculty,staff,andthegeneralpublic.TheUniversityreceives such revenues primarily from various activitiesrelatedtotheUniversity’sagriculturalpublicservicemission,includingpesticideregistrationandlicensingfees,livestock,poultry and health test fees, extension service fees, forestproduct sales, and youth camp fees. These unrestrictedrevenues are collectively labeled “Sales and Services ofEducationalandOtherActivities”.
Scholarship Discounts and Allowances Student tuition and fee revenues, and certain otherrevenues from students, are reported net of scholarshipdiscounts and allowances in the Statement ofRevenues,ExpensesandChangesinNetPosition.ScholarshipdiscountsandallowancesarethedifferencebetweenthestatedchargeforgoodsandservicesprovidedbytheUniversity,andtheamountthatispaidbystudentsand/orthirdpartiesmakingpaymentson thestudents’behalf. Certaingovernmentalgrants, suchasPellgrants,andotherFederal, stateornongovernmentalprograms are recorded as either operating or nonoperatingrevenuesintheUniversity’sfinancialstatements.Totheextentthatrevenuesfromsuchprogramsareusedtosatisfytuitionandfeesandotherstudentcharges,theUniversityhasrecordedascholarshipdiscountandallowance.
Adoption of New Accounting Standards Effective for thefiscal year ended June 30, 2020, theUniversityadoptedGASBStatementNo.95,Postponement of the Effective Dates of Certain Authoritative Guidance.Thisstatementprovidestemporaryrelieftogovernmentsandotherstakeholders, inlightoftheCOVID-19pandemic,bypostponingtheeffectivedatesofthefollowingpronouncements:
• StatementNo.83,Certain Asset Retirement Obligations
• StatementNo.84,Fiduciary Activities • StatementNo.87,Leases
• StatementNo. 88,Certain Disclosures Related to Debt, including Direct Borrowings and Direct Placements
• StatementNo. 89,Accounting for Interest Cost Incurred before the End of a Construction Period
• StatementNo.90,Majority Equity Interests • StatementNo.91,Conduit Debt Obligations • StatementNo.92,Omnibus 2020
• StatementNo.93,Replacement of Interbank Offered Rates
TheadoptionofthisstandardhadnoeffectontheUniversity’sfinancialstatementsinthecurrentfiscalyear.

NOTES TO FINANCIAL STATEMENTS
~ 44 ~
NOTE 2.CASH AND CASH EQUIVALENTS, DEPOSITS AND INVESTMENTS AlldepositsandinvestmentsoftheUniversityareunderthecontroloftheStateTreasurerwho,bylaw,hassoleauthorityforinvestingStatefunds.Certainmoniesaredepositedorinvestedwithormanagedbyfinancialinstitutionsandbrokers. ThefollowingschedulereconcilesdepositsandinvestmentswithinthefootnotestotheStatementofNetPositionamounts:
Deposits Held by State Treasurer StatelawrequiresfullcollateralizationofallStateTreasurerbankbalances.TheStateTreasurermustcorrectanydeficienciesincollateralwithinsevendays. WithrespecttoinvestmentsintheState'sinternalcashmanagementpool,alloftheStateTreasurer'sinvestmentsareinsuredorregisteredorareinvestmentsforwhichthesecuritiesareheldbytheStateoritsagentintheState'sname.Informationpertainingto thereportedamounts, fairvalues,andcreditriskof theStateTreasurer's investments isdisclosedin theComprehensiveAnnualFinancialReportoftheStateofSouthCarolina.ForthefiscalyearendedJune30,2020,anunrealizedappreciationof$13,692,993isincludedinthe$550,245,231identifiedaboveas“DepositsheldbyStateTreasurer.”
Other Deposits TheUniversity'sotherdepositsatyear-endwereentirelycoveredbyfederaldepositoryinsuranceorcollateralheldbycustodialbanks.
Investments Held by State Treasurer InvestmentsheldbyStateTreasurercompriseinvestmentsheldfortheUniversityandtheStateofSouthCarolinawhicharelegallyrestricted,andearningsthereonbecomerevenueofthespecificfundfromwhichtheinvestmentwasmade.Theseinvestmentsarespecific,identifiableinvestmentsecurities.InvestmentsconsistofAgriculturalCollegestockwithacarryingamountof$95,900andPerpetualstockwithacarryingamountof$58,539heldbytheStateTreasurerasTrusteeinPerpetuityonwhichtheyarerequiredtopaytheUniversitysixpercentperyear.Sincethereisnoreadilydeterminablefairvaluefortheseinvestments,theyhavebeenassignedafairvalueequaltotheirhistoricalcostvalue.
Other Investments TheUniversityhasinvestmentsinmutualfundsasauthorizedbyasingledonor.Themutualfundswithafairvalueof$2,362,873areheldandinvestedbyWellsFargo,astrusteeinaccordancewiththeendowmentagreementspecifiedbythedonor.Theseinvestmentsarestatedatfairvalueandincludeunrealizedappreciationof$1,688,569.Purchasesandsalesareaccountedforonthetradedate.Bothunrealizedandrealizedgainsandlossesoninvestmentshavebeenrecorded.Earningsarerecordedonanaccrualbasis. TheUniversityhassplitdollarlifeinsurancepolicieswithtwoathleticscoach.TheUniversityhasrecordedinvestmentswithafairvalueof$1,900,026relatedtothesepolicies.TheUniversityhasadoptedapplicableaccountingstandardsforitsfinancialassetsandliabilitieswhichclarifythatfairvalueisanexitprice,representingthepricethatwouldbereceivedtosellanassetorpaidtotransferaliabilityinanorderlytransactionbetweenmarketparticipantsatthemeasurementdate.TheUniversityutilizesmarketdataorassumptionsthatmarketparticipantswoulduseinpricingtheassetorliability.Thestandardsestablishathreetierfairvaluehierarchy,whichprioritizestheinputsusedinmeasuringfairvalue.Thesetiersinclude:Level1,definedasobservableinputssuchasquotedpricesinactivemarkets;Level2,definedasinputsotherthanquotedpricesinactivemarketsthatareeitherdirectlyorindirectlyobservable;andLevel3,definedasunobservableinputsaboutwhichlittleornomarketdataexists,thereforerequiringanentitytodevelopitsownassumptions.TheUniversity'sinvestmentsheldbytheStateTreasurerarecategorizedasLevel3.TheUniversity'sotherinvestmentsconsistentirelyofmutualfundsandotherinvestmentswithreadilydeterminablefairvaluesinanactivemarket.TheseinvestmentshavebeencategorizedasLevel1.
Reconciliation of Deposits and Investments
Statement of Net Position AmountCash and cash equivalents: Current - unrestricted $ 328,767,289 Current - restricted 219,616,650 Noncurrent - restricted 2,169,412Investments 4,417,338 Total $ 554,970,689
Footnotes AmountCash on hand $ 230,161Deposits held by State Treasurer 550,245,231Other deposits 77,959Investments held by State Treasurer 154,439Other investments 4,262,899 Total $ 554,970,689

NOTES TO FINANCIAL STATEMENTS
~ 45 ~
Accounts ReceivableDescription AmountStudents/scholarships $ 8,024,319State capital appropriations 7,857,501Auxiliaries 11,920,803Fees 4,586,957Computer services 508,177Educational programs 1,088,592Other 844,539CARES Act 6,770,700
Total accounts receivable $ 41,601,588
University Receivables
Description Current Noncurrent Total Accounts receivable $ 41,601,588 $ — $ 41,601,588Grants and contracts receivable 24,820,370 — 24,820,370Notes receivable — 201,271,023 201,271,023Contributions receivable, net 854,003 732,484 1,586,487Interest and income receivable 2,939,129 — 2,939,129Student loans receivable 3,382 4,958,056 4,961,438 Total university receivables $ 70,218,472 $ 206,961,563 $ 277,180,035
NOTE 3.RECEIVABLES UniversityreceivablesreportedintheStatementNetPositionasofJune30,2020,wereasfollows:
Accountsreceivablearereportednetofallowancesfordoubtfulaccountsof$538,983basedoncreditlossesexperiencedinprioryearsandevaluationofcurrentportfolios.Studentpaymentallowancesof$336,000,parkingservicesallowancesof$179,011,emergencymedical serviceallowancesof$18,972,and telecommunicationsallowancesof$5,000comprise thisamount.Contributionsreceivablearereportednetofallowancesforcurrentuncollectiblepledgesof$159,030andallowancesfornoncurrentuncollectiblepledgesof$129,262. AccountsreceivablefortheyearendedJune30,2020,werecomprisedofthefollowingbalances:
Other Investments
Description Effective Fair Value
Maturity (Years)
Credit Rating
Domestic bond fund $ 688,819 6.4 N/AInternational bond fund 148,348 18.3 N/AEquity funds 1,525,706 N/A N/ASplit dollar life insurance 1,900,026 N/A AA- Total other investments $ 4,262,899
TheUniversitydoesnothaveaformalinvestmentpolicythat limitsinvestmentmaturitiesasameansofmanagingitsexposuretofairvaluelossesarisingfromincreasinginterestrates. OtherinvestmentsasofJune30,2020wereasfollows:

NOTES TO FINANCIAL STATEMENTS
~ 46 ~
Contributions Receivable
Description Current Noncurrent Total University programs $ 854,003 $ 732,484 $ 1,586,487 Total contributions receivable $ 854,003 $ 732,484 $ 1,586,487
Grants and Contracts Receivable
Description Federal State Local Nongovernmental TotalSponsored research $ 17,401,357 $ 756,553 $453,452 $ 2,781,996 $ 21,393,358Land-grant appropriations 1,927,688 — — — 1,927,688Scholarship programs 1,499,324 — — — 1,499,324 Total grants and contracts receivable $ 20,828,369 $ 756,553 $ 453,452 $ 2,781,996 $ 24,820,370
Grants and contracts receivable are comprised of amounts due for sponsored research projects, federal land-grantappropriations,andfederalscholarshipprograms. Grantsandcontracts receivable for theyearendedJune30,2020,werecomprisedofthefollowingbalances:
ContributionsreceivablearecomprisedofpledgesforgiftstosupportspecificallyidentifiedUniversityprogramsandtoprovideathleticscholarships.Contributionsreceivableareaccountedforattheirestimatednetrealizablevalue,orthepresentvalueoflong-termpledgesandreductionsforallowancesforuncollectiblepledges.Pledgesvaryfromonetotenyears.
PartII,Section9ofthe1998-99StateAppropriationsActamendedtheSouthCarolinaCodeofLawsbyaddingSection59-101-410.Thisamendmentallowedthegoverningboardsofstate-supporteduniversities tolendtheirendowmentandauxiliaryenterprisefundsondepositwiththeStateTreasurer’sOfficetoseparatelycharterednot-for-profitlegalentitieswhoseexistenceisprimarilyprovidingfinancialassistanceandothersupporttotheinstitutionanditseducationalprogram. Accordingly, as of June 30, 2020, theUniversity hadnotesreceivablefromtheClemsonUniversityFoundation,arelatedparty, totaling$201,271,023. Thisamount includestheoriginalloanof$35,358,188,additionalnetcontributionstotaling$37,913,092sincethefiscalyear1999originalloan,plus related incomeandappreciation. Funds loaned to theClemsonUniversity Foundationwill be paid back to theUniversitywithinterestatarateequaltothatwhichisnecessarytoproduceasumwhichisequaltothetotalreturn(consistingofappreciationandincome),provided,however,suchratewillnotbelessthanzero.TheMemorandumofUnderstandingbetweenClemsonUniversity and theClemsonUniversity
Foundationisforaten-yearperiod.Itisreviewedannuallybyboth parties andmaybe extended automatically for anadditionaltwelve-monthperiodunlesseitherpartyprovideswrittennoticeofobjection to theextension, inwhichcase,theMemorandumofUnderstandingwill not automaticallyextendforanadditionaltwelve-monthperiod.Theabovenot-withstanding,eitherpartymayterminatetheMemorandumofUnderstandingatanytimewithoutcauseupononehundredeightydayswrittennoticetotheotherparty. Withminorexceptions,lossesforloanstostudentsarenot estimated or recorded in allowances for uncollectibleaccounts.Atthetimealoanisconsidereduncollectibleitischargedtoprincipal.Anyaccountsreceivablewrittenoffisrecognizedintheperiodinwhichthereceivableisconsidereduncollectible.Basedonpastexperience,potentiallossesarenotdeemedmaterial. Interest and income receivableconsistof amountsduefrom theStateTreasurer relating to holdings in theState’sinternalcashmanagementpoolandcashinvestedinvariousshort-terminvestmentsbythatagency.

NOTES TO FINANCIAL STATEMENTS
~ 47 ~
Unearned Revenues Description Amount Athletic event receipts $ 16,539,905 Sponsored research programs 7,334,688 Academic and other fees 19,273,092 Educational programs 292,695 Public service programs 99,022 Other 222,978 Total unearned revenues $ 43,762,380
NOTE 5.UNEARNED REVENUES, DEPOSITS AND FUNDS HELD FOR OTHERS Unearnedrevenuesconsistprimarilyofathleticticketsalesandrelatedfeesandunearnedstudentrevenuesforsummersession and fall semester. Thesemonieswere collected inadvanceandwerenotearnedatJune30,2020. Athleticsalesandrelatedeventreceiptsincludeadvancesales of football tickets and program advertising fees.Unearnedstudentrevenuesconsistmainlyofstudenttuitionandfees,roomandboard,andotherfeesrelatedtothelongsummersessionandfallsemester.Alsoincludedareamountsreceivedinadvanceforsponsoredresearchprograms. Feescollectedinadvanceformunicipalservices,contractcreditcourses,andvariousdepartmentalaccountscomprisetheremainingbalanceofunearnedrevenues. Asummarylistingofunearnedrevenuefollows:
Depositsconsistofacurrentandnoncurrentcomponent.Currentdepositsarecomprisedoffootballgameguarantees,amountsduetotheAtlanticCoastConference,studentcampuscard balances, andmiscellaneous departmental amounts.Pooledfringebenefitover-recoveriesrepresentthenoncurrentdeposits.TheUniversitysubmitsapooledfringebenefitrateproposaltoitscognizantagency,theU.S.DepartmentofHealth&HumanServices(DHHS),twoyearsinadvanceforactualcharges.
NOTE 4.CAPITAL ASSETS CapitalassetactivityfortheyearendedJune30,2020,issummarizedasfollows:
Capital Assets
Description
BeginningBalance
July 1, 2019 Increases Decreases Transfers
EndingBalance
June 30, 2020
Capital assets not being depreciated: Land and improvements $ 34,372,728 $ 370,000 $ 380,000 $ — $ 34,362,728 Construction in progress* 109,126,867 104,580,509 898,164 (42,510,994) 170,298,218 Total capital assets not being depreciated 143,499,595 104,950,509 1,278,164 (42,510,994) 204,660,946
Depreciable capital assets: Utilities systems and other non-structural
improvements 107,768,485 116,945 — 3,916,446 111,801,876 Buildings and improvements 1,521,385,691 — 851,396 38,594,548 1,559,128,843 Computer software 24,283,309 — — — 24,283,309 Equipment 348,678,304 22,545,968 9,803,000 — 361,421,272 Vehicles 19,763,303 1,848,170 876,285 — 20,735,188 Total depreciable capital assets at
historical cost 2,021,879,092 24,511,083 11,530,681 42,510,994 2,077,370,488
Less accumulated depreciation for: Utilities systems and other non-structural
improvements 40,071,513 4,227,731 — — 44,299,244 Buildings and improvements 463,362,032 36,873,366 659,648 — 499,575,750 Computer software 24,271,795 11,514 — — 24,283,309 Equipment 221,877,451 23,768,474 8,338,873 — 237,307,052 Vehicles 14,200,793 1,766,926 877,067 — 15,090,652 Total accumulated depreciation 763,783,584 66,648,011 9,875,589 — 820,556,007
Depreciable capital assets, net 1,258,095,508 (42,136,929) 1,655,092 — 1,256,814,481
Capital assets, net $ 1,401,595,103 $ 62,813,580 $ 2,933,256 $ — $ 1,461,475,427
*Includescurrentfiscalyearcapitalizedinterestof$5,451,957 NOTE:TheUniversityreceived$114,496inproceedsfromthesaleofcapitalassets

NOTES TO FINANCIAL STATEMENTS
~ 48 ~
NOTE 6. BONDS PAYABLE AtJune30,2020,bondspayableconsistedofthefollowing:
BONDS PAYABLE
DescriptionOriginal
DebtInterest Rate(outstanding)
MaturityDates
June 30, 2020Balance
Debt Retired inFiscal Year 2020
General Obligation Bonds Bonds dated 4/01/07 (Series 2007B) $ 14,000,000 2.50% 6/1/2021 $ 1,240,000 $ 1,180,000 Bonds dated 3/01/11 (Series 2011B) 62,370,000 4.125-5.00% 3/1/2031 5,000,000 5,000,000 Bonds dated 6/1/14 (Series 2014B) 33,030,000 3.00-5.00% 4/1/2034 25,790,000 1,310,000 Bonds dated 10/01/16 (Series 2016F) 52,395,000 2.00-5.00% 6/1/2036 46,545,000 2,045,000 Bonds dated 8/24/17 (Series 2017A) 120,885,000 2.25-5.00% 4/1/2037 115,355,000 500,000 Bonds dated 5/23/19 (Series 2019A) 5,635,000 3.00-5.00% 4/1/2039 5,430,000 205,000
199,360,000Revenue Bonds Bonds dated 12/1/05 (Series 2005) 22,130,000 0.00% 5/1/2020 — 705,000 Bonds dated 5/1/15 (Series 2015) 90,285,000 4.00-5.00% 5/1/2045 85,180,000 1,785,000 Bonds dated 12/1/15 (Series 2015B) 191,000,000 2.75-5.00% 5/1/2046 182,390,000 4,410,000
267,570,000Athletic Facilities Revenue Bonds Bonds dated 2/1/12 (Series 2012) 12,335,000 2.00-3.00% 5/1/2023 2,945,000 910,000 Bonds dated 12/1/14 (Series 2014A) 30,695,000 3.00-5.00% 5/1/2045 30,695,000 — Bonds dated 12/1/14 (Series 2014B) 9,240,000 2.40-4.00% 5/1/2027 5,095,000 890,000 Bonds dated 12/1/14 (Series 2014C) 10,545,000 2.00-5.00% 5/1/2025 7,190,000 845,000 Bonds dated 5/1/15 (Series 2015) 60,695,000 4.00-5.00% 5/1/2045 55,185,000 1,185,000 Bonds dated 12/1/15 (Series 2015B) 18,875,000 3.00-5.00% 5/1/2046 16,975,000 515,000 Bonds dated 1/1/18 (Series 2018A) 11,300,000 3.00-5.00% 5/1/2047 11,300,000 —
129,385,000 Subtotal bonds payable 596,315,000 21,485,000Plus unamortized bond premium 44,245,899 2,650,558Total Bonds Payable $ 640,560,899 $ 24,135,558
DHHShasapprovedtheUniversity’spooledfringebenefitratesthroughthefiscalyearendingJune30,2021.Actualunder-recoveryorover-recoveryofcostsarereflectedinfuturerateproposalsandapprovals.The$4,129,185balanceinnoncurrentdepositsrepresentsanover-recoveryforthefiscalyearendingJune30,2020,andwillbeabsorbed/adjustedthroughthepooledfringerateestablishedforthefiscalyearendingJune30,2022.ForthefiscalyearendingJune30,2019,theUniversityrecognizedanunder-recoveryofcosts.Theunder-recoverytotaling$1,986,705isclassifiedasOtherAssets.Thisunder-recoverywillbeabsorbed/adjustedthroughthepooledfringerateestablishedforthefiscalyearendingJune30,2021.
Deposits
Description Current Amount
Noncurrent Amount
Athletics $ 441,067 $ — Student Campus Card Balances 255,378 —Miscellaneous Departmental 65,237 —Pooled fringe benefits over-recoveries — 4,129,185 Total deposits $ 761,682 $ 4,129,185
Funds Held for Others
Description Current Amount
Noncurrent Amount
Federal Perkins Loans $ — $5,184,375 Amounts held in trust 773,260 — Total funds held for others $773,260 $5,184,375
Fundsheldforothersconsistsofcurrentandnoncurrentcomponents.Currentfundsheldforothersiscomprisedofagencyfundsheldintrustforothers.ThefederalPerkinsloanliabilitybalancerepresentsthenoncurrentfundsheldforothers.

NOTES TO FINANCIAL STATEMENTS
~ 49 ~
BondsissuedbytheUniversityincludecertainrestrictivecovenants.GeneralObligationBondsoftheStatearebackedbythefullfaith,creditandtaxingpoweroftheState.Tuitionandmatriculation fees paid to theUniversity are pledgedfor the payment of principal and interest on these bonds.AuxiliaryRevenueBondsarepayablesolelyfromandsecuredbyapledgeofrevenuesoftheUniversity’shousingfacilities,bookstores,diningservices,parkingandvending,andfromadditionalfundsfromtheacademic“University”feeimposedbytheBoardofTrustees.AthleticFacilitiesRevenueBondsarepayablesolelyfromthenetrevenuesoftheUniversity’sAthleticDepartmentandthegrossreceiptsfromtheimpositionofanyadmissionsfeeandanyspecialstudentfee. TheUniversitypurchasedabondinsurancepolicypayabletothebondtrusteefortheRevenueBondsSeries2005.Theinsuranceguaranteespaymentofprincipalandinterestuntilalldebthasbeenretired. TuitionfeesforthefiscalyearendedJune30,2019were$43,154,545,whichresultsinalegalannualdebtservicelimitatJune30,2020of$38,839,091.Thisamountisequalto90%oftuitionfeescollectedforthepriorfiscalyear. TheSeries2007BGeneralObligationBondsmaturingonandafterJune1,2018,aresubjecttoredemption,inwholeorinpart,atanytimeinanyorderofmaturitytobedeterminedbytheState,onandafterJune1,2017,atparplusaccruedinteresttothedatefixedforredemption. TheSeries 2011BGeneralObligationState InstitutionBondsmaturingonandafterMarch1,2022,aresubject toredemption,inwholeorinpart,atanytimeinanyorderofmaturitytobedeterminedbytheState,onandafterMarch1, 2021 at par plus accrued interest to the date fixed forredemption. TheSeries2012AthleticFacilitiesRefundingRevenueBondsmatureasserialbondsonMay1ofeachoftheyears2012through2023andarenotsubjecttoredemptionpriortomaturity. TheSeries 2014BGeneralObligationState InstitutionBondsmatureonApril1ineachoftheyears2015through2034andarenotsubjecttoredemptionpriortomaturity. The Series 2014AAthletic FacilitiesRevenueBondsmatureonMay1ineachoftheyears2015through2045andaresubjecttoredemptionpriortomaturity. TheSeries 2014BTaxableAthleticFacilitiesRevenueBondsmatureonMay1ineachof theyears2015through2027andaresubjecttoredemptionpriortomaturity. TheSeries2014CAthleticFacilitiesRevenueRefundingBondsmatureonMay1ineachof theyears2015through2025andaresubjecttoredemptionpriortomaturity.
TheSeries2015AthleticFacilitiesRevenueBondsmatureonMay1 in eachof theyears2016 through2045andaresubjecttoredemptionpriortomaturity. TheSeries2015HigherEducationRevenueBondsmatureonMay1 in eachof theyears2016 through2045andaresubjecttoredemptionpriortomaturity. The Series 2015BAthletic FacilitiesRevenueBondsmatureonMay1ineachoftheyears2016through2046andaresubjecttoredemptionpriortomaturity. The Series 2015BHigher EducationRevenueBondsmatureonMay1ineachoftheyears2016through2046andaresubjecttoredemptionpriortomaturity. TheSeries 2016FGeneralObligationState InstitutionBondsmatureonJune1ineachof theyears2018through2036andaresubjecttoredemptionpriortomaturity. TheSeries 2017AGeneralObligationState InstitutionBondsmatureonApril1ineachoftheyears2018through2037andaresubjecttoredemptionpriortomaturity. The Series 2018AAthletic FacilitiesRevenueBondsmatureonMay1ineachoftheyears2022through2047andaresubjecttoredemptionpriortomaturity. TheSeries 2019AGeneralObligationState InstitutionBondsmatureonApril1ineachoftheyears2020through2039andaresubjecttoredemptionpriortomaturity.

NOTES TO FINANCIAL STATEMENTS
~ 50 ~
AmountsincludinginterestrequiredtocompletepaymentoftheGeneralObligationBondsasofJune30,2020,areasfollows:
Revenue Bonds
Description Principal Interest Total Year Ending June 30 2021 $ 6,505,000 $ 10,892,451 $ 17,397,451 2022 6,825,000 10,567,201 17,392,201 2023 7,170,000 10,225,951 17,395,951 2024 7,530,000 9,867,452 17,397,452 2025 7,900,000 9,490,952 17,390,952 2026 through 2030 42,425,000 41,526,456 83,951,456 2031 through 2035 49,180,000 32,764,206 81,944,206 2036 through 2040 58,505,000 23,443,231 81,948,231 2041 through 2045 71,105,000 10,840,000 81,945,000 2046 10,425,000 417,000 10,842,000 Total Revenue Bonds $ 267,570,000 $ 160,034,900 $ 427,604,900
Athletic Facilities Revenue Bonds
Description Principal Interest Total Year Ending June 30 2021 $ 4,535,000 $ 5,063,554 $ 9,598,554 2022 4,850,000 4,879,984 9,729,984 2023 5,040,000 4,718,784 9,758,784 2024 5,350,000 4,517,271 9,867,271 2025 5,600,000 4,269,772 9,869,772 2026 through 2030 18,725,000 18,499,147 37,224,147 2031 through 2035 22,830,000 14,386,831 37,216,831 2036 through 2040 27,330,000 9,892,075 37,222,075 2041 through 2045 32,910,000 4,297,287 37,207,287 2046 through 2047 2,215,000 97,862 2,312,862 Total Athletic Facilities Revenue Bonds $ 129,385,000 $ 70,622,567 $ 200,007,567
General Obligation Bonds
Description Principal Interest Total Year Ending June 30 2021 $ 10,450,000 $ 7,840,712 $ 18,290,712 2022 10,770,000 7,349,212 18,119,212 2023 11,310,000 6,810,712 18,120,712 2024 11,875,000 6,245,213 18,120,213 2025 12,470,000 5,651,462 18,121,462 2026 through 2030 70,995,000 19,308,776 90,303,776 2031 through 2035 56,410,000 7,066,488 63,476,488 2036 through 2039 15,080,000 672,300 15,752,300 Total General Obligation Bonds $ 199,360,000 $ 60,944,875 $ 260,304,875
TheRevenueandAthleticFacilitiesbondsarepayableinsemiannualinstallmentsplusinterest.TheGeneralObligationbondsarepaidperiodicallythroughoutthefiscalyear.AmountsincludinginterestrequiredtocompletepaymentoftheRevenueandAthleticFacilitiesRevenuebondobligationsasofJune30,2020,areasfollows:

NOTES TO FINANCIAL STATEMENTS
~ 51 ~
TheUniversityreportednetprincipalretirementsandinterestexpendituresrelatedtothebondsasfollowsfortheyearendedJune30,2020:
Principal Retirements and Interest Expenses
Bond Type Net Principal Interest General obligation bonds $ 10,240,000 $ 6,749,733 Revenue bonds 6,900,000 10,402,474 Athletic facilities revenue bonds 4,345,000 4,825,595 Total Net Principal Retirements and Interest Expenses $ 21,485,000 $ 21,977,802
NOTE 7.LEASE OBLIGATIONS TheUniversityisobligatedundervariousoperatingleasesfortheuseofrealproperty(land,buildings,officespace)andequipmentandalsoisobligatedundercapitalleasesandinstallmentpurchaseagreementsfortheacquisitionofrealproperty.AllcapitalandoperatingleasesarewithpartiesoutsideStategovernment. Futurecommitmentsforcapitalleases(whichhereandontheStatementofNetPositionincludeotherinstallmentpurchaseagreements)andfornon-cancellableoperatingleaseshavingremainingtermsinexcessofoneyearasofJune30,2020,wereasfollows:
Capital Leases Thecapitalleasesarepayableinmonthlyinstallmentsandwillexpirein2038.Expendituresforfiscalyear2020were$1,008,914,ofwhich$915,204wasprincipaland$93,710wasinterest.ThefollowingisasummaryofthecarryingvaluesoftheassetsheldundercapitalleasesatJune30,2020:
Assets Held Under Capital Lease
Description Value at Lease Inception
Accumulated Depreciation Net
Buildings $ 14,300,000 $ (4,027,834) $ 10,272,166 Equipment 1,761,027 (619,658) 1,141,369 Total assets held under capital lease $ 16,061,027 $ (4,647,492) $ 11,413,535
Capital and Operating Lease Commitments
Description Capital Leases
Operating Leases
Year Ending June 30: 2021 $ 1,004,171 $ 3,634,768 2022 988,219 2,186,452 2023 780,714 1,404,274 2024 662,525 649,583 2025 574,408 193,612 2026 through 2030 2,872,040 — 2031 through 2035 2,872,040 — 2036 through 2038 1,553,372 — Total minimum lease payments 11,307,489 $ 8,068,689 Less: Interest 165,020 Principal outstanding - Clemson University $ 11,142,469
NOTES TO FINANCIAL STATEMENTS
~ 52 ~
Certaincapitalleasesprovideforrenewaland/orpurchaseoptions.Generally,purchaseoptionsatbargainpricesofonedollarareexercisableattheexpirationoftheleaseterms. InOctober 2012, theUniversity entered into a capitalleaseof$14,300,000atlessthan.1percentinterestwherebytheUniversity leasesspace in theGreenvilleOneBuildingfor a twenty-five year periodwhich began inMarch 2013andextendstoMarch2038.TheGreenvilleOneBuildingislocatedindowntownGreenville,SCandthespaceconsistsoffourfloorsandspaceonthegroundfloorandexclusiveuseofanexteriorgreenroof.TheUniversityenteredintotheleasewithClemsonUniversityLandStewardshipFoundation,Inc.(CULSF),acomponentunit.TheoutstandingliabilityasofJune30,2020is$10,139,235. Between 2018 and 2020 theUniversity entered intomultipleequipmentleaseswithPresidioTechnologyCapital.TheoutstandingliabilityontheseleasesasofJune30,2020is$1,003,234.
Operating Leases TheUniversity'snon-cancelableoperatingleaseshavingremainingtermsofmorethanoneyearexpireinvariousfiscalyears from 2020 through 2025. Certain operating leasesprovideforrenewaloptionsforperiodsfromonetofiveyearsatthefairrentalvalueatthetimeofrenewal.AllagreementsarecancelableiftheStateofSouthCarolinadoesnotprovideadequatefundingbutthatisconsideredaremotepossibility.Inthenormalcourseofbusiness,operatingleasesaregenerallyrenewed or replaced by other leases.Operating leases aregenerallypayableonamonthlybasis. InJanuary2012,ClemsonUniversityoriginallyenteredintoarealpropertyoperatingleasewithCULSF,acomponentunit, forspace located in thebuildingat3ResearchDrive,Greenville,SC,attheCU-ICARCampus.ThisagreementtoestablishacomponenttestinglaboratoryhasbeenextendedthroughApril 2022. Under this lease, theUniversity paidCULSF$152,190.inthecurrentfiscalyear. In September 2011, the University entered into anagreementwithCULSF,acomponentunit,forspaceinthebuildinglocatedat3ResearchDrive,Greenville,SC,attheCU-ICARCampus.Thisagreementisonamonth-to-monthbasisandextendsindefinitely.Underthislease,theUniversitypaid$12,000inthecurrentfiscalyear. InJune2014,theUniversityenteredintoarealpropertyoperatingleasewithCUF,acomponentunit,forspaceinthebuildinglocatedat110DanielDrive,Clemson,SC.ThisleaseextendsthroughJune2022.Underthislease,theUniversitypaidCUF$97,665thisfiscalyear. InJune2014,theUniversityenteredintoarealproperty
operatingleasewithCUFforspaceinthebuildinglocatedat114DanielDrive,Clemson,SC.ThisleaseextendsthroughJune2022.Underthislease,theUniversitypaidCUF$42,500thisfiscalyear. InDecember 2015, theUniversity entered into a realpropertyoperatingleasewithCULSFforspaceinthebuildinglocated at 1ResearchDr.,Greenville, SC. This leasewasextended until September 30, 2019. Under this lease, theUniversitypaidCULSF$103,347thiscurrentfiscalyear.. InOctober 2017, theUniversity entered into a realpropertyoperatingleasewithCULSFforspaceinthebuildinglocatedat1ResearchDr.,Greenville,SC.ThisleaseextendsthroughFebruary2021.Underthislease,theUniversitypaidCULSF$280,432thiscurrentfiscalyear. InJune2018,theUniversityenteredintoarealpropertyoperatingleasewithCULFforpropertylocatedinSunset,SC.ThisleaseextendsthroughJune2025.Underthislease,theUniversitypaidCULSF$116,700thiscurrentfiscalyear. InJune2019,theUniversityenteredintoarealpropertyoperatingleasewithCULSFforspaceinthebuildinglocatedat3ResearchDrive,Greenville,SC.ThisleaseextendsthroughSeptember2022.UnderthisleaseCUFpaidCULSF$22,667thiscurrentfiscalyear. InOctober 2019, theUniversity entered into a realpropertyoperatingleasewithCULSFforspaceinthebuildinglocatedat1ResearchDrive,Greenville,SC.ThisleaseextendsthroughSeptember2022.Underthislease,theUniversitypaidCULSF$211,436thiscurrentfiscalyear. In thecurrentfiscalyear,ClemsonUniversity incurredexpensesof$25,762forofficecopiercontingentrentalsonacost-per-copybasis.

NOTES TO FINANCIAL STATEMENTS
~ 53 ~
NOTE 8. PENSION PLANS TheSouthCarolinaPublicEmployeeBenefitAuthority(PEBA), created July 1, 2012, administers the variousretirement systems and retirement programsmanaged byitsRetirementDivision.PEBAhasan11-memberBoardofDirectors,appointedbytheGovernorandGeneralAssemblyleadership,which serves as co-trustee and co-fiduciary ofthe systems and the trust funds. By law, theState FiscalAccountabilityAuthority (SFAA),which consists of fiveelectedofficials,alsoreviewscertainPEBABoarddecisionsregarding the funding of the SouthCarolinaRetirementSystems(Systems)andservesasaco-trusteeoftheSystemsinconductingthatreview.EffectiveJuly1,2017,theRetirementSystemFundingandAdministrationActof2017assignedthePEBABoardofDirectorsastheCustodianoftheRetirementTrust Funds and assigned SC PEBA and theRetirementSystemsInvestmentCommission(RSIC)asco-trusteesoftheRetirementTrustFunds. For purposes ofmeasuring the net pension liability,deferredoutflowsandinflowsofresourcesrelatedtopensions,and pension expense, information about the fiduciary netpositionoftheSystemsandadditionsto/deductionsfromtheSystemsfiduciarynetpositionhavebeendeterminedontheaccrualbasisofaccountingastheyarereportedbytheSystemsinaccordancewithgenerallyacceptedaccountingprinciples(GAAP). For this purpose, revenues are recognizedwhenearnedandexpensesarerecognizedwhenincurred.Benefitandrefundexpensesarerecognizedwhendueandpayableinaccordancewiththetermsoftheplan.Investmentsarereportedatfairvalue. PEBA issues a ComprehensiveAnnual FinancialReport(CAFR)containingfinancialstatementsandrequiredsupplementaryinformationfortheSouthCarolinaRetirementSystems’PensionTrustFunds.TheCAFRispubliclyavailablethroughtheRetirementBenefits’linkonPEBA’swebsiteatwww.peba.sc.gov ,oracopymaybeobtainedbysubmittingarequesttoPEBA,202ArborLakeDrive,Columbia,SC29223.PEBAisconsideredadivisionoftheprimarygovernmentofthestateofSouthCarolinaandtherefore,retirementtrustfundfinancial informationisalsoincludedinthecomprehensiveannualfinancialreportofthestate.
Plan Descriptions TheSouthCarolinaRetirementSystem(SCRS),acost-sharingmultiple-employerdefinedbenefitpensionplan,wasestablishedeffectiveJuly1,1945,pursuanttotheprovisionsofSection9-1-20of theSouthCarolinaCodeofLaws forthe purpose of providing retirement allowances and otherbenefitsforemployeesofthestate,itspublicschooldistricts,andpoliticalsubdivisions.SCRScoversemployeesofstateagencies,publicschooldistricts,highereducationinstitutions,other participating local subdivisions of government andindividuals newly elected to the SouthCarolinaGeneralAssemblyatorafterthe2012generalelection.
TheStateOptionalRetirementProgram(StateORP)isadefinedcontributionplan that isofferedas analternativetoSCRStocertainnewlyhiredemployeesofstateagencies,institutionsof higher education, public school districts andindividualsfirstelectedto theS.C.GeneralAssemblyatorafter the general election inNovember 2012. StateORPparticipantsdirecttheinvestmentoftheirfundsintoanaccountadministered by one of four third party service providers.PEBAassumesno liability forStateORPbenefits.Rather,the benefits are the liability of the four third party serviceproviders.For thisreason,StateORPassetsarenotpartofthe retirement system’s trust funds for financial statementpurposes. TheSouthCarolinaPoliceOfficersRetirementSystem(PORS), a cost-sharingmultiple-employer defined benefitpensionplan,wasestablishedeffectiveJuly1,1962,pursuanttotheprovisionsofSection9-11-20oftheSouthCarolinaCodeofLaws for thepurposeof providing retirement andotherbenefitstopoliceofficersandfirefighters.PORSalsocoverspeaceofficers,coroners,probatejudges,andmagistrates.
Membership Membership requirements are prescribed inTitle 9 oftheSouthCarolinaCodeofLaws.Abriefsummaryoftherequirementsundereachsystemispresentedbelow. SCRS–Generally,allemployeesofcoveredemployersarerequiredtoparticipateinandcontributetothesystemasaconditionofemployment.Thisplancoversgeneralemployeesand teachers and individuals newly elected to the SouthCarolinaGeneralAssembly beginningwith theNovember2012generalelection.AnemployeememberofthesystemwithaneffectivedateofmembershippriortoJuly1,2012isaClassTwomember.AnemployeememberofthesystemwithaneffectivedateofmembershiponorafterJuly1,2012isaClassThreemember. State ORP –As an alternative tomembership in theSCRS,newlyhiredstate,publicschool,andhighereducationemployees and individuals newly elected to the SouthCarolinaGeneralAssembly beginningwith theNovember2012general electionhave the option to participate in theStateOptionalRetirementProgram(StateORP),whichisadefinedcontributionplan.StateORPparticipantsdirecttheinvestmentoftheirfundsintoaplanadministeredbyoneoffour investment providers. PEBAassumesno liability fortheStateORPbenefits.Rather,thebenefitsaretheliabilityof the investment providers. For this reason, StateORPprogramsarenotconsideredpartof the retirementsystemsforfinancial statementpurposes. Employee andEmployercontributionstotheStateORPareatthesameratesasSCRS.A direct remittance is required from the employers to themember’saccountwithinvestmentprovidersfortheemployeecontribution and a portionof the employer contribution (5percent). Adirect remittance is also required toSCRS forthe remainingportionof the employer contribution and anincidentaldeathbenefitcontribution,ifapplicable,whichisretainedbySCRS.

NOTES TO FINANCIAL STATEMENTS
~ 54 ~
PORS –To be eligible for PORSmembership, anemployeemustberequiredbythetermsofhisemployment,byelectionorappointment,topreservepublicorder,protectlifeandproperty,anddetectcrimes in thestate; topreventand control property destruction by fire; or to serve as apeaceofficeremployedbytheDepartmentofCorrections,theDepartmentofJuvenileJustice,ortheDepartmentofMentalHealth.ProbatejudgesandcoronersmayelectmembershipinPORS.MagistratesarerequiredtoparticipateinPORSforserviceasamagistrate.PORSmembers,otherthanmagistratesandprobate judges,mustalsoearnat least$2,000peryearanddevoteatleast1,600hoursperyeartothiswork,unlessexemptedby statute. An employeemember of the systemwithaneffectivedateofmembershippriortoJuly1,2012,isaClassTwomember.AnemployeememberofthesystemwithaneffectivedateofmembershiponorafterJuly1,2012isaClassThreemember.
Benefits Benefit terms are prescribed inTitle 9 of the SouthCarolinaCodeofLaws.PEBAdoesnothavetheauthoritytoestablishoramendbenefittermswithoutalegislativechangeinthecodeoflaws.Keyelementsofthebenefitcalculationincludethebenefitmultiplier,yearsofservice,andaveragefinalcompensation.Abriefsummaryofbenefittermsforeachsystemispresentedbelow.
SCRS–AClassTwomemberwhohasseparatedfromservicewithatleastfiveormoreyearsofearnedserviceiseligibleforamonthlypensionatage65orwith28yearscreditedserviceregardlessofage.Amembermayelectearlyretirementwithreducedpensionbenefitspayableatage55with25yearsofservicecredit.AClassThreememberwhohasseparatedfromservicewithatleasteightormoreyearsofearnedserviceiseligible for amonthlypensionupon satisfying theRule of90 requirement that the total of themember’s age and themember’screditableserviceequalsat least90years. BothClassTwoandClassThreemembersareeligibletoreceiveareduceddeferredannuityatage60iftheysatisfythefive-or eight-year earned service requirement, respectively. Anincidentaldeathbenefit is alsoavailable tobeneficiariesofactiveandretiredmembersofemployerswhoparticipateinthedeathbenefitprogram. Theannual retirementallowanceofeligible retireesortheir surviving annuitants is increasedby the lesser of onepercent or five hundred dollars every July 1. Only thoseannuitantsinreceiptofabenefitonJuly1oftheprecedingyearareeligibletoreceivetheincrease.Memberswhoretireundertheearlyretirementprovisionsatage55with25yearsofservicearenoteligibleforthebenefitadjustmentuntilthesecondJuly1afterreachingage60orthesecondJuly1afterthedatetheywouldhavehad28yearsofservicecredithadtheynotretired.
PORS –AClassTwomemberwhohasseparatedfromservicewithatleastfiveormoreyearsofearnedserviceiseligibleforamonthlypensionatage55orwith25yearsofserviceregardlessofage.AClassThreememberwhohasseparatedfromservicewithatleasteightormoreyearsofearnedserviceiseligibleforamonthlypensionatage55orwith27yearsofserviceregardlessofage.BothClassTwoandClassThreemembersareeligibletoreceiveadeferredannuityatage55withfiveoreightyearsofearnedservice,respectively.Anincidentaldeathbenefitisalsoavailable tobeneficiariesofactiveandretiredmembersof employerswhoparticipate in the death benefit program.Accidentaldeathbenefitsarealsoprovideduponthedeathofanactivememberworkingforacoveredemployerwhosedeathwasanaturalandproximateresultofaninjuryincurredwhileintheperformanceofduty.
The retirement allowance of eligible retirees or theirsurvivingannuitantsisincreasedbythelesserofonepercentoffivehundreddollarseveryJuly1.OnlythoseannuitantsinreceiptofabenefitonJuly1oftheprecedingyearareeligibletoreceivetheincrease.
Contributions ActuarialvaluationsareperformedannuallybyanexternalconsultingactuarytoensureapplicablecontributionratessatisfythefundingparametersspecifiedinTitle9oftheSouthCarolinaCode of Laws.Under these provisions, SCRS and PORScontribution requirementsmust be sufficient tomaintain anamortizationperiodforthefinancingoftheunfundedactuarialaccruedliability(UAAL)overaperiodthatdoesnotexceedthenumberofyearsscheduledinstatestatute.Legislationin2017 increased,butalsoestablishedaceiling forSCRSandPORS employee contribution rates.Effective July 1, 2017,employeerateswereincreasedtoacappedrateof9.00percentfor SCRS and 9.75 percent for PORS.The legislation alsoincreasedemployercontributionratesbeginningJuly1,2017forbothSCRSandPORSbytwopercentagepointsandfurtherscheduledemployercontributionratestoincreasebyaminimumofonepercentagepointeachyearthroughJuly1,2022.Ifthescheduledcontributionsarenotsufficienttomeetthefundingperiodssetinstatestatute,theboardshallincreasetheemployercontributionratesasnecessarytomeetthefundingperiodssetfortheapplicableyear.ThemaximumfundingperiodofSCRSandPORSisscheduledtobereducedoveraten-yearschedulefrom30yearsbeginningfiscalyear2018to20yearsbyfiscalyear2028. Additionally,theBoardisprohibitedfromdecreasingtheSCRSandPORScontributionratesuntilthefundedratioisatleast85percent.IfthemostrecentannualactuarialvaluationoftheSystemsforfundingpurposesshowsaratiooftheactuarialvalueofsystemassetstotheactuarialaccruedliabilityofthesystem (the funded ratio) that is equal toor greater than85percent, then theboard,effectiveon thefollowingJulyfirst,maydecreasethethencurrentcontributionratesuponmakingafindingthatthedecreasewillnotresultinafundedratioofless

NOTES TO FINANCIAL STATEMENTS
~ 55 ~
Fiscal Year 2020 Fiscal Year 2019SCRS EmployeeClassTwo 9.00% 9.00% EmployeeClassThree 9.00% 9.00%State ORP Employee 9.00% 9.00%PORS EmployeeClassTwo 9.75% 9.75% EmployeeClassThree 9.75% 9.75%
(1) CalculatedonearnablecompensationasdefinedinTitle9oftheSouthCarolinaCodeofLaws.(2) Ofthisemployercontribution,5%ofearnablecompensationmustberemittedbytheemployerdirectlytotheORPvendortobe
allocatedtothemember’saccountwiththeremainderoftheemployercontributionremittedtotheSCRS.
Fiscal Year 2020 Fiscal Year 2019SCRS EmployerClassTwo 15.41% 14.41% EmployerClassThree 15.41% 14.41% EmployerIncidentalDeathBenefit 0.15% 0.15%State ORP EmployerContribution(2) 15.41% 14.41% EmployerIncidentalDeathBenefit 0.15% 0.15%PORS EmployerClassTwo 17.84% 16.84% EmployerClassThree 17.84% 16.84% EmployerIncidentalDeathBenefit 0.20% 0.20% EmployerAccidentalDeathProgram 0.20% 0.20%
than85percent.Ifcontributionratesaredecreasedpursuanttothisprovision,andthemostrecentannualactuarialvaluationofthesystemshowsafundedratiooflessthaneighty-fivepercent,theneffectiveonthefollowingJulyfirst,andannuallythereafterasnecessary,theboardshallincreasethethencurrentcontributionratesuntilasubsequentannualactuarialvaluationofthesystemshowsafundedratiothatisequaltoorgreaterthan85percent. TheRetirementSystemFundingandAdministrationActincreasedemployercontributionratesto15.41percentforSCRSand17.84percentforPORS,effectiveJuly1,2017.Italsoremovedthe2.9percentand5percentdifferentialandincreasesandestablishesaceilingonemployeecontributionratesat9percentand9.75percentforSCRSandPORS,respectively.Theemployercontributionrateswillcontinuetoincreaseannuallyby1percentthroughJuly1,2022.Thelegislation’sultimatescheduledemployerrateis18.56percentforSCRSand21.24percentforPORS.Theamortizationperiodisscheduledtobereducedoneyearforeachofthenext10yearstoatwenty-yearamortizationperiod.
For theyearendedJune30,2020, theUniversity’sSCRScontributions totaled$27,679,831. TheUniversity’sPORScontributionstotaled$982,682.TotalcontributionsdirectlytotheORPswereapproximately$9,712,062(excludingthesurcharge)fromClemsonUniversityasemployerandapproximately$17,481,711fromitsemployeesasplanmembers.TheremainingemployercontributionamountssenttoSCRS(excludingthesurcharge)were$20,511,564.
Net Pension Liability AtJune30,2020,theUniversityreportedliabilitiesof$662,757,449and$9,556,980foritsproportionatesharesoftheSCRSandPORSnetpensionliabilities,respectively.ThenetpensionliabilitiesweremeasuredasofJune30,2019,andthetotalpensionliabilitiesusedtocalculatethenetpensionliabilitiesweredeterminedbyanactuarialvaluationasofJuly1,2018projectedforwardtoJune30,2019.TheUniversity’sproportionatesharesofthenetpensionliabilitieswerebasedonaprojectionoftheUniversity’slong-termshareofcontributionstothepensionplansrelativetotheprojectedcontributionsofallparticipatingemployers,actuariallydetermined.TheUniversity’sproportionateshareoftheSCRSplanincreasedby0.088080%overtheprioryear.TheUniversity’sproportionateshareofthePORSplanincreasedby0.043139%fromtheprioryear.AtJune30,2020,theUniversity’sproportionatesharesoftheSCRSandPORSplanswere2.902484%and0.333467%respectively.
Requiredemployercontributionrates(1)areasfollows:
Requiredemployeecontributionrates(1)areasfollows:

NOTES TO FINANCIAL STATEMENTS
~ 56 ~
ThetotalpensionliabilityiscalculatedbytheSystems’actuary,andeachplan’sfiduciarynetpositionisreportedintheSystems’financialstatements.ThenetpositionliabilityisdisclosedinaccordancewiththerequirementsofGASB67intheSystems’notestothefinancialstatementsandrequiredsupplementaryinformation.LiabilitycalculationsperformedbytheSystems’actuaryforthepurposeofsatisfyingtherequirementsofGASBNos.67and68arenotapplicableforotherpurposes,suchasdeterminingtheplans’fundingrequirements. Employer’sproportionateshareswerecalculatedonthebasisofemployercontributionsremittedtotheplanbyemployersandnon-employercontributionsappropriatedintheState’sbudget.Inanefforttooffsetaportionoftheburdenoftheincreasedcontributionrequirementforemployers,theGeneralAssemblyfunded1percentoftheSCRSandPORScontributionincreasesforfiscalyear2019.TheStatebudgetappropriatedthesefundsdirectlytoPEBAandacreditwasissuedforeachemployertousewhensubmittingtheirquarterlyremittancestoPEBA.FortheyearendedJune30,2019measurementperiod,PEBAprovidednon-employercontributionstotheUniversityintheamountof$2,932,589and$37,431fortheSCRSandPORSplans,respectively,whichisshownasareductiontonetpensionliabilityandothergrantrevenueintheyearendedJune30,2020.
Deferred Outflows of Resources and Deferred Inflows of Resources related to Pensions AtJune30,2020,theUniversityreporteddeferredoutflowsofresourcesanddeferredinflowsofresourcesrelatedtopensionsfromthefollowingsources:
Police Officers Retirement System
DescriptionDeferred Outflows
of ResourcesDeferred Inflows
of ResourcesUniversitycontributionssubsequenttothemeasurementdate $982,682 $—Differencesbetweenexpectedandactualexperience 196,511 70,633Assumpitoncharges 378,982 —Netdifferencebetweenprojectedandactualearningsonpensionplaninvestments 121,176 51,360Differenceduetochangesinproportionateshareofcontributions 948,619 — Totaloutflowsandinflowsofresources $ 2,627,970 $ 121,993
South Carolina Retirement System
DescriptionDeferred Outflows
of ResourcesDeferred Inflows
of ResourcesUniversitycontributionssubsequenttothemeasurementdate $48,191,395 $—Differencesbetweenexpectedandactualexperience 455,581 4,761,131Assumptionchanges 13,355,521 —Netdifferencebetweenprojectedandactualearningsonpensionplaninvestments 5,867,616 41,525Differencesduetochangesinproportionateshareofcontributions 28,205,373 — Totaloutflowsandinflowsofresources $ 96,075,486 $ 4,802,656
FortheyearendedJune30,2020,theUniversityrecognizedpensionexpenseof$88,426,781and$1,779,946forSCRSandPORS,respectively. Thenetpensionliability(NPL)iscalculatedseparatelyforeachsystemandrepresentsthatparticularsystem’stotalpensionliabilitydeterminedinaccordancewithGASBNo.67lessthatSystem’sfiduciarynetposition.NPLtotals,asofJune30,2019,forSCRSandPORSarepresentedbelow.
System
TotalPensionLiability
Plan Fiduciary Net
Position
Employers’Net Pension
Liability (Asset)
Plan FiduciaryNet Position as a Percentageof the Total Pension Liability
SCRS $ 50,073,060,256 $ 27,238,916,138 $ 22,834,144,118 54.4%PORS 7,681,749,768 4,815,808,554 2,865,941,214 62.7%

NOTES TO FINANCIAL STATEMENTS
~ 57 ~
Actuarial Assumptions and Methods Actuarialvaluationsinvolveestimatesofthereportedamountsandassumptionsabouttheprobabilityofoccurrenceofeventsfarintothefuture.Examplesincludeassumptionsaboutfutureemployment,mortality,andfuturesalaryincreases.Actuarialassumptionsandmethodsusedduringtheannualvaluationprocessaresubjecttoperiodicrevision,typicallywithanexperiencestudy,asactualresultsoveranextendedperiodoftimearecomparedwithpastexpectationsandnewestimatesaremadeaboutthefuture.SouthCarolinastatestatuterequiresthatanactuarialexperiencestudybecompletedatleastonceineachfive-yearperiod.AnexperiencereportontheSystemswasmostrecentlyissuedfortheperiodendedJune30,2015. TheJune30,2019totalpensionliability,netpensionliability,andsensitivityinformationweredeterminedbytheSystems’consultingactuary,Gabriel,Roeder,SmithandCompany(GRS)andarebasedontheactuarialvaluationperformedasofJuly1,2018.Thetotalpensionliabilitywasrolled-forwardfromthevaluationdatetotheSystems’fiscalyearendedJune30,2019,usinggenerallyacceptedactuarialprinciples. ThefollowingtableprovidesasummaryoftheactuarialassumptionsandmethodsusedtocalculatethetotalpensionliabilityasofJune30,2019.
Year ended June 30: SCRS PORS 2021 $ 30,621,484 $ 776,907 2022 4,550,888 368,719 2023 5,536,511 282,692 2024 2,372,552 94,977
Actuarial cost method SCRS PORSActuarialassumptions: Actuarialcostmethod Entryagenormal Entryagenormal Investmentrateofreturn(1) 7.25% 7.25% Projectedsalaryincreases 3.0%to12.5%(variesbyservice)(1) 3.5%to9.5%(variesbyservice)(1)
Benefitadjustments lesserof1%or$500annually lesserof1%or$500annually (1) includesinflationat2.25%
The$48,191,395and$982,682reportedasdeferredoutflowsofresourcesrelatedtopensionsresultingfromUniversitycontributionspaidsubsequenttothemeasurementdatefortheSCRSandPORSplans,respectively,duringtheyearendedJune30,2020willberecognizedasareductionofthenetpensionliabilitiesintheyearendingJune30,2021.Thecontributionsmadeafterthemeasurementdateofthenetpensionliabilitybutbeforetheendofemployer’sorgovernmentalnon-employercontributingentity’sreportingperiodwillberecognizedasareductionofthenetpensionliabilityinthesubsequentfiscalperiodratherthaninthecurrentfiscalperiod. OtheramountsreportedasdeferredoutflowsofresourcesanddeferredinflowsofresourcesrelatedtopensionswillbeamortizedasfollowsfortheSCRSandPORSplans,respectively:
Thepost-retireemortality assumption is dependent upon themember’s job category andgender. Thebasemortalityassumptions, the2016PublicRetireesofSouthCarolinaMortality table (2016PRSC),wasdevelopedusing theSystems’mortalityexperience.ThesebaseratesareadjustedforfutureimprovementinmortalityusingpublishedScaleAAprojectedfromtheyear2016.AssumptionsusedindeterminationoftheJune30,2019totalpensionliabilityareasfollows:
Former Job Class Males FemalesEducators 2016-PRSC-Malesmultipliedby92% 2016-PRSC-Femalesmultipliedby98%
GeneralEmployeesandMembersof theGeneralAssembly 2016-PRSC-Malesmultipliedby100% 2016-PRSC-Femalesmultipliedby111%
PublicSafetyandFirefighters 2016-PRSC-Malesmultipliedby125% 2016-PRSC-Femalesmultipliedby111%

NOTES TO FINANCIAL STATEMENTS
~ 58 ~
Sensitivity of the Net Pension Liability to Changes in the Discount Rate
System 1.00% Decrease (6.25%) Current Discount Rate (7.25%) 1.00% Increase (8.25%)SCRS $834,935,697 $662,757,450 $519,064,725PORS 12,951,974 9,556,980 6,775,623
Allocation/ExposurePolicyTarget
ExpectedArithmetic RealRate of Return
Long TermExpected
Portfolio RealRate of Return
Global Equity 51.0% GlobalPublicEquity 35.0% 7.29% 2.55% PrivateEquity 9.0% 7.67% 0.69% EquityOptionsStrategies 7.0% 5.23% 0.37%Real Assets 12.0% RealEstate(Private) 8.0% 5.59% 0.45% RealEstate(REITs) 1.0% 8.16% 0.08% Infrastructure(Private) 2.0% 5.03% 0.10% Infrastructures(Public 1.0% 6.12% 0.06%Opportunistic 8.0% GlobalTacticalAssetAlooction 7.0% 3.09% 0.22% OtherOpportunisticStrategies 1.0% 3.82% 0.04%Credit 15.0% HighYieldBonds/BankLoans 4.0% 3.14% 0.13% EmergingMarketsDebt 4.0% 3.31% 0.13% PrivateDebt 7.0% 5.49% 0.38%Rate Sensitive 14.0% CoreFixedIncome 13.0% 1.62% 0.21% CashandShortDuration(Net) 1.0% 0.31% 0.00% TotalExpectedRealReturn 100.0% 5.41% InflationforActuarialPurposes 2.25% TotalExpectedNominalReturn 7.66%
Long Term Expected Rate of Return Thelong-termexpectedrateofreturnonpensionplaninvestmentsisbasedupon20-yearcapitalmarketassumptions.Thelong-termexpectedratesofreturnrepresentassumptionsdevelopedusinganarithmeticbuildingblockapproachprimarilybasedonconsensusexpectationsandmarket-basedinputs.Expectedreturnsarenetofinvestmentfees. Theexpectedreturns,alongwiththeexpectedinflationrate,formthebasisfortherevisedtargetassetallocationadoptedatthebeginningofthe2019fiscalyear.Thelong-termexpectedrateofreturnisproducedbyweightingtheexpectedfuturerealratesofreturnbythetargetallocationpercentageandaddingexpectedinflationandissummarizedinthetablebelow.Foractuarialpurposes,the7.25percentassumedannualinvestmentrateofreturnsetinstatuteandusedinthecalculationofthetotalpensionliabilityincludesa5.00percentrealrateofreturnanda2.25percentinflationcomponent.
Discount Rate Thediscountrateusedtomeasurethetotalpensionliabilitywas7.25percent.TheprojectionofcashflowsusedtodeterminethediscountrateassumedthatcontributionsfromparticipatingemployersinSCRSandPORSwillbemadebasedontheactuariallydeterminedratesbasedonprovisionsintheSouthCarolinaCodeofLaws.Basedonthoseassumptions,theSystem’sfiduciarynetpositionwasprojectedtobeavailabletomakeallprojectedfuturebenefitpaymentsofcurrentplanmembers.Therefore,thelong-termexpectedrateofreturnonpensionplaninvestmentswasappliedtoallperiodsofprojectedbenefitpaymentstodeterminethetotalpensionliability.
Sensitivity Analysis ThefollowingtablepresentstheUniversity’sproportionateshareofthenetpensionliabilitycalculatedusingthediscountrateof7.25percent,aswellaswhattheUniversity’sproportionateshareofthenetpensionliabilitywouldbeifitwerecalculatedusingadiscountratethatis1percentagepointlower(6.25percent)or1percentagepointhigher(8.25percent)thanthecurrentrate:
Additional Financial and Actuarial Information DetailedinformationregardingthefiduciarynetpositionoftheplansadministeredbyPEBAisavailableintheSystems’auditedfinancialstatementsforthefiscalyearendedJune30,2019(includingtheunmodifiedauditopiniononthefinancialstatements).AdditionalactuarialinformationisavailableintheaccountingandfinancialreportingactuarialvaluationasofJune30,2019.

NOTES TO FINANCIAL STATEMENTS
~ 59 ~
Benefits TheSCRHITF is a healthcare plan that covers retiredemployees of the State of SouthCarolina, including allagencies,and districts. TheSCRHITFprovideshealthanddental insurance benefits to eligible retirees. Generally,retireesareeligibleforthehealthanddentalbenefitsiftheyhaveestablishedatleasttenyearsofretirementservicecredit.FornewhiresbeginningemploymentMay2,2008andafter,retireesareeligible forbenefits if theyhaveestablished25yearsofservicefor100%employerfundingand15-24yearsofservicefor50%employerfunding. TheSCLTDITFisalong-termdisabilityplanthatcoversemployees of the State of SouthCarolina, including allagenciesandpublicschooldistrictsandallparticipatinglocalgovernmental entities. TheSCLTDITFprovides disabilitypaymentstoeligibleemployeesthathavebeenapprovedfordisability.
Contributions and Funding Policies Section1-11-710of theSouthCarolinaCodeofLawsof 1976, as amended, requires these postemployment andlong-term disability benefits to be funded through annualappropriationsbytheGeneralAssemblyforactiveemployeesto thePEBA, InsuranceBenefits andparticipating retireestoPEBA,exceptfortheportionfundedthroughthepensionsurchargeandprovidedfromtheotherapplicablesourcesofthePEBA,InsuranceBenefits.ForactiveemployeeswhoarenotfundedbyStateGeneralFundappropriations,participatingemployers aremandatedbyState statute to contribute at arateassessedeachyearbytheDepartmentofAdministrationExecutiveBudgetOffice.ThecoveredpayrollsurchargefortheyearendedJune30,2020was6.05percent.TheSouthCarolinaRetirementSystemcollectsthemonthlysurchargefor all participating employers and remits it directly to theSCRHITF. Other sources of funding for the SCRHITFincludemandatorytransfersofaccumulatedPEBA,InsuranceBenefits’ reserves and incomegenerated from investments.Employer contributions also include the implicit subsidy,or age-related subsidy inherent in thehealthcarepremiumsstructure. The implicit subsidy represents a portionof thehealth care expenditures paid on behalf of the employer’sactiveemployees.ForpurposesofGASBStatementNo.75,thisexpenditureonbehalfoftheactiveemployeeisreclassifiedas a retiree health care expenditure so that the employer’scontributions towards the plan reflect the underlying age-adjusted,retireebenefitcosts. Basiclong-termdisabilitybenefitsarefundedthroughaperson’s premiumcharged toState agencies, public schooldistricts and other participating local governments.Themonthlypremiumperactiveemployeewas$3.22forthefiscalyearendedJune30,2020.TheSCLTDITFpremiumisbilledmonthlybyPEBA,InsuranceBenefitsandtransferredmonthlytotheSCLTDITF.Itisalsofundedthroughinvestmentincome.
NOTE 9. POST-EMPLOYMENT BENEFITS OTHER THAN PENSIONS TheSouthCarolinaPublicEmployeeBenefitAuthority(PEBA)wascreatedbytheSouthCarolinaGeneralAssemblyaspartofActNo.278effectiveJuly1,2012.PEBAisastateagency responsible for theadministrationandmanagementof the state’s employee insurance programs, other post-employmentbenefitstrustsandretirementsystemsandispartoftheStateofSouthCarolinaprimarygovernment. ThegoverningboardofPEBAisaboardof11members.Themembership composition is threemembers appointedby theGovernor, twomembers appointedby thePresidentProTemporeof theSenate, twomembersappointedbytheChairmanof theSenateFinanceCommittee, twomembersappointedby theSpeaker of theHouse ofRepresentativesandtwomembersappointedbytheChairmanoftheHouseWaysandMeansCommittee. Individualsappointed to thePEBAboardmustpossesscertainqualifications.MembersofthePEBAboardservefortermsoftwoyearsanduntiltheirsuccessorsareappointedandqualify. TermscommenceonJulyfirstofevennumberedyears.ThePEBAboardappointstheExecutiveDirector.ThelawsoftheStateandthepoliciesandproceduresspecifiedbytheStateforStateagenciesareapplicabletoallactivitiesofPEBA.Bylaw,theStateFiscalAccountabilityAuthority (SFFA),which consists of fiveelectedofficials,alsoreviewscertainPEBABoarddecisionsinadministeringtheStateHealthPlanandotherpost-employmentbenefits(OPEB).
Plan Descriptions TheOtherPost-EmploymentBenefitsTrustFunds(OPEBTrusts),collectivelyreferstotheSouthCarolinaRetireeHealthInsuranceTrust Fund (SCRHITF) and theSouthCarolinaLong-TermDisability InsuranceTrust Fund (SCLTDITF),wereestablishedbytheStateofSouthCarolinaasAct195,whichbecameeffectiveonMay2008. TheSCRHITFwascreatedtofundandaccountfortheemployercostsoftheState’sretireehealthanddentalplans.TheSCLTDITFwascreatedtofundandaccountfortheemployercostsoftheState’sBasicLong-TermDisabilityIncomeBenefitPlan. In accordance withAct 195, the OPEBTrusts areadministeredbythePEBA,InsuranceBenefitsandtheStateTreasureristhecustodianofthefundsheldintrust.TheBoardofDirectorsofPEBAhasbeendesignatedastheTrustee. TheOPEBTrusts are cost-sharingmultiple-employerdefinedbenefitplans. Article5of theStateCodeofLawsdefines the twoplans and authorizes theTrustee to at anytimeadjusttheplans,includingitsbenefitsandcontributions,as necessary to insure thefiscal stability of the plans. Inaccordancewith the South Carolina Code of Laws andthe annualAppropriationsAct, the State provides post-employmenthealthanddentalandlong-termdisabilitybenefitstoretiredStateandschooldistrictemployeesandtheircovereddependents.
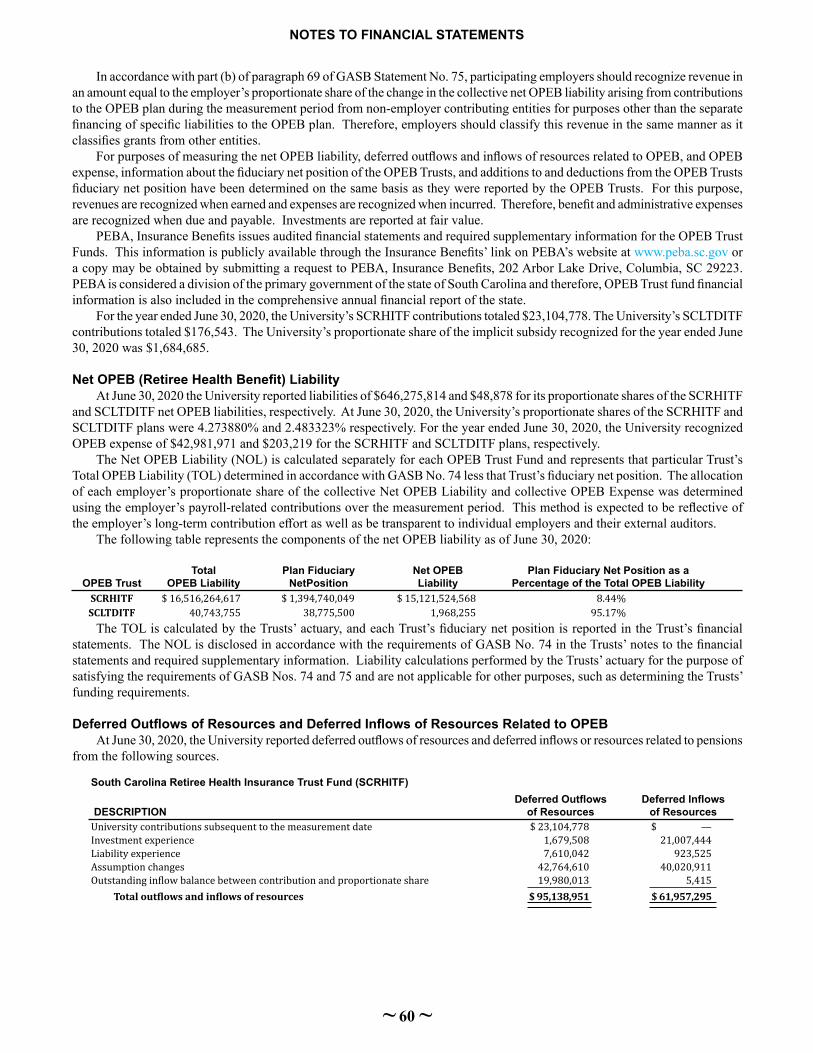
NOTES TO FINANCIAL STATEMENTS
~ 60 ~
Inaccordancewithpart(b)ofparagraph69ofGASBStatementNo.75,participatingemployersshouldrecognizerevenueinanamountequaltotheemployer’sproportionateshareofthechangeinthecollectivenetOPEBliabilityarisingfromcontributionstotheOPEBplanduringthemeasurementperiodfromnon-employercontributingentitiesforpurposesotherthantheseparatefinancingofspecificliabilitiestotheOPEBplan.Therefore,employersshouldclassifythisrevenueinthesamemannerasitclassifiesgrantsfromotherentities. ForpurposesofmeasuringthenetOPEBliability,deferredoutflowsandinflowsofresourcesrelatedtoOPEB,andOPEBexpense,informationaboutthefiduciarynetpositionoftheOPEBTrusts,andadditionstoanddeductionsfromtheOPEBTrustsfiduciarynetpositionhavebeendeterminedonthesamebasisastheywerereportedbytheOPEBTrusts.Forthispurpose,revenuesarerecognizedwhenearnedandexpensesarerecognizedwhenincurred.Therefore,benefitandadministrativeexpensesarerecognizedwhendueandpayable.Investmentsarereportedatfairvalue. PEBA,InsuranceBenefitsissuesauditedfinancialstatementsandrequiredsupplementaryinformationfortheOPEBTrustFunds.ThisinformationispubliclyavailablethroughtheInsuranceBenefits’linkonPEBA’swebsiteatwww.peba.sc.gov or acopymaybeobtainedbysubmittingarequesttoPEBA,InsuranceBenefits,202ArborLakeDrive,Columbia,SC29223.PEBAisconsideredadivisionoftheprimarygovernmentofthestateofSouthCarolinaandtherefore,OPEBTrustfundfinancialinformationisalsoincludedinthecomprehensiveannualfinancialreportofthestate. FortheyearendedJune30,2020,theUniversity’sSCRHITFcontributionstotaled$23,104,778.TheUniversity’sSCLTDITFcontributionstotaled$176,543.TheUniversity’sproportionateshareoftheimplicitsubsidyrecognizedfortheyearendedJune30,2020was$1,684,685.
Net OPEB (Retiree Health Benefit) Liability AtJune30,2020theUniversityreportedliabilitiesof$646,275,814and$48,878foritsproportionatesharesoftheSCRHITFandSCLTDITFnetOPEBliabilities,respectively.AtJune30,2020,theUniversity’sproportionatesharesoftheSCRHITFandSCLTDITFplanswere4.273880%and2.483323%respectively.FortheyearendedJune30,2020,theUniversityrecognizedOPEBexpenseof$42,981,971and$203,219fortheSCRHITFandSCLTDITFplans,respectively. TheNetOPEBLiability(NOL)iscalculatedseparatelyforeachOPEBTrustFundandrepresentsthatparticularTrust’sTotalOPEBLiability(TOL)determinedinaccordancewithGASBNo.74lessthatTrust’sfiduciarynetposition.Theallocationofeachemployer’sproportionateshareofthecollectiveNetOPEBLiabilityandcollectiveOPEBExpensewasdeterminedusingtheemployer’spayroll-relatedcontributionsoverthemeasurementperiod.Thismethodisexpectedtobereflectiveoftheemployer’slong-termcontributioneffortaswellasbetransparenttoindividualemployersandtheirexternalauditors. ThefollowingtablerepresentsthecomponentsofthenetOPEBliabilityasofJune30,2020:
TheTOLiscalculatedbytheTrusts’actuary,andeachTrust’sfiduciarynetpositionisreportedintheTrust’sfinancialstatements.TheNOLisdisclosedinaccordancewiththerequirementsofGASBNo.74intheTrusts’notestothefinancialstatementsandrequiredsupplementaryinformation.LiabilitycalculationsperformedbytheTrusts’actuaryforthepurposeofsatisfyingtherequirementsofGASBNos.74and75andarenotapplicableforotherpurposes,suchasdeterminingtheTrusts’fundingrequirements.
Deferred Outflows of Resources and Deferred Inflows of Resources Related to OPEB AtJune30,2020,theUniversityreporteddeferredoutflowsofresourcesanddeferredinflowsorresourcesrelatedtopensionsfromthefollowingsources.
OPEB TrustTotal
OPEB LiabilityPlan Fiduciary
NetPositionNet OPEBLiability
Plan Fiduciary Net Position as a Percentage of the Total OPEB Liability
SCRHITF $ 16,516,264,617 $ 1,394,740,049 $ 15,121,524,568 8.44%SCLTDITF 40,743,755 38,775,500 1,968,255 95.17%
South Carolina Retiree Health Insurance Trust Fund (SCRHITF)
DESCRIPTION Deferred Outflows
of ResourcesDeferred Inflows
of ResourcesUniversity contributions subsequent to the measurement date $ 23,104,778 $ —Investment experience 1,679,508 21,007,444Liability experience 7,610,042 923,525Assumption changes 42,764,610 40,020,911Outstanding inflow balance between contribution and proportionate share 19,980,013 5,415 Total outflows and inflows of resources $ 95,138,951 $ 61,957,295

NOTES TO FINANCIAL STATEMENTS
~ 61 ~
ThenetamountofdeferredoutflowsofresourcesanddeferredinflowsofresourcesrelatedtoretireehealthbenefitswillbeamortizedasfollowsfortheSCRHITFandSCLTDITFplans,respectively:
South Carolina Long-Term Disability Insurance Trust Fund (SCLTDITF)
DESCRIPTION Deferred Outflows
of ResourcesDeferred Inflows
of ResourcesUniversity contributions subsequent to the measurement date $ 176,543 $ —Investment experience 31,765 34,013Liability experience — 30,453Assumption changes 27,494 4,356Outstanding inflow balance between contribution and proportionate share — 7,026 Total outflows and inflows of resources $ 235,802 $ 75,848
Year ended June 30: SCRHITF SCLTDITF 2021 $ (514,603) $ 2,618 2022 (514,603) 2,618 2023 (763,227) (2,805) 2024 (1,157,330) (9,777)
2025 and thereafter 13,026,691 (9,243)
Actuarial Assumptions SCRHIFTValuationdate: June30,2018
Actuarialcostmethod: Entryagenormal
Inflation: 2.25%
Investmentrateofreturn: 2.75%netofOPEBPlaninvestmentexpense,includinginflation
Singlediscountrate: 3.13%asofJune30,2019
Demographicassumptions: BasedontheexperiencestudyperformedfortheSouthCarolinaRetirementSystemsforthe5-yearperiodendingJune30,2015
Mortality:
Forhealthyretirees,the2016PublicRetireesofSouthCarolinaMortalityTableforMalesandthe2016RublicRetireesofSouthCarolinaMortalityTableforFemalesareusedwithfullygenerationalmortalityprojectionsbasedonScaleAAfromtheyear2016.Multipliersareappliedtothebasetablesbasedongenderandemploymenttype.
Healthcaretrendrate: Initialtrendstartingat6.40%andgraduallydecreasingtoanultimatetrendrateof4.15%overaperiodof14years
Retireeparticipation79%forretireeswhoareeligibleforfundedpremiums59%participationforretireeswhoareeligibleforPartialFundedPremiums20%participationforretireeswhoareeligibleforNon-FundedPremiums
Notes:
Therewerenobenefitchangesduringtheyear;thediscountratechangedfrom3.62%asofJune20,2018to3.13%asofJune30,2019;minorupdatesweremadetothehealthcaretrendrateassumption.
Actuarial Assumptions and Methods Actuarialvaluationsofanongoingplaninvolveestimatesofthevalueofreportedamountsandassumptionsabouttheprobabilityofoccurrenceofeventsfarintothefuture.Examplesincludeassumptionsaboutfutureemployment,mortality,andthehealthcarecosttrend.Actuariallydeterminedamountsaresubjecttocontinualrevisionasactualresultsarecomparedwithpastexpectationsandnewestimatesaremadeaboutthefuture.Theschedulesoffundingprogress,presentedasrequiredsupplementaryinformationfollowingthenotestothefinancialstatements,presentmulti-yeartrendinformationaboutwhethertheactuarialvaluesofplanassetsareincreasingordecreasingovertimerelativetotheactuarialaccruedliabilitiesforbenefits. Projectionsofbenefitsforfinancialreportingpurposesarebasedonthesubstantiveplans(asunderstoodbytheemployerandplanparticipants)andincludethetypesofbenefitsprovidedatthetimethevaluationandthehistoricalpatternofsharingofbenefitcostsbetweentheemployerandplanmemberstothatpoint.Theactuarialmethodsandassumptionsusedincludetechniquesthataredesignedtoreducetheeffectsofshort-termvolatilityinactuarialaccruedliabilitiesandtheactuarialvalueofassets,consistentwiththelong-termperspectiveofthecalculations. AdditionalinformationasofthelatestactuarialvaluationforSCRHITF:

NOTES TO FINANCIAL STATEMENTS
~ 62 ~
Asset ClassTarget AssetAllocation
Long-Term ExpectedRealRateofReturn
AllocationWeightedLong-TermExpectedRealRateofReturn
U.S.DomesticFixedIncome 80.00% 0.60% 0.48%Cash 20.00% 0.10% 0.02% Total 100.00% 0.50%ExpectedInflation 2.25% TotalReturn 2.75%
InvestmentReturnAssumption 2.75%
AdditionalinformationasofthelatestactuarialvaluationforSCLTDITF:Actuarial Assumptions SCLTDITF
Valuationdate: June30,2018
Actuarialcostmethod: Entryagenormal
Inflation: 2.25%
Investmentrateofreturn: 3.00,netofPlaninvestmentexpense,includinginflation
Singlediscountrate: 3.04%asofJune30,2019
Salary, Termination, and RetirementRates:
BasedontheexperiencestudyperformedfortheSouthCarolinaRetirementSystemsforthe5-yearperiodendingJune30,2015
DisabilityIncidence: TheratesusedinthevaluationarebasedontheratesdevelopedfortheSouthCarolinaRetirementSystems pension plans
DisabilityRecovery: Forparticipantsinpayments,1987CGDTGroupDisability,foractiveemployees,60%wereassumedtorecoverafterthefirstyearand92%wereassumedtorecoverafterthefirsttwoyears
Offsets: 40%areassumedtobeeligibleforSocialSecuritybenefits;assumedpercentagewhowillbeeligibleforapensionplanoffsetvariesbasedonemployeegroup
Expenses: Thirdpartyadministrativeexpensesareincludedinthebenefitprojections
Notes: Thediscountratechangedfrom3.91%asofJune30,2018to3.04%asofJune30,2019 TheactuarialvaluationwasperformedasofJune30,2018.UpdateprocedureswereusedtorollforwardthetotalOPEBliabilitytoJune30,2019.
Long Term Expected Rate of Return Thelong-termexpectedrateofreturnsrepresentassumptionsdevelopedusinganarithmeticbuildingblockapproachprimarilybasedonconsensusexpectationsandmarketbasedinputs.Theexpectedreturns,alongwiththeexpectedinflationrate,formthebasisforthetargetassetallocationadoptedatthebeginningofthe2018fiscalyear.Thelong-termexpectedrateofreturnisproducedbyweightingtheexpectedfuturerealratesofreturnbythetargetallocationpercentageandaddingexpectedinflation.Thisinformationissummarizedinthefollowingtable:
Discount Rate TheSingleDiscountRateof3.13%wasusedtomeasurethetotalOPEBliabilityfortheSCRHITF.TheaccountingpolicyforthisplanistosettheSingleDiscountRateequaltotheprevailingmunicipalbondrate.Duetotheplan’sinvestmentandfundingpolicies,thedifferencebetweenablendeddiscountrateandthemunicipalbondratewouldbelessthanseveralbasispoints(severalhundredthsofonepercent). ASingleDiscountRateof3.04%wasusedtomeasurethetotalOPEBliabilityfortheSCLTDITF.ThisSingleDiscountRatewasbasedonanexpectedrateofreturnonplaninvestmentsof3.00%andamunicipalbondrate3.13%.TheprojectionofcashflowstodeterminethisSingleDiscountRateassumedthatemployercontributionswillremain$38.64peryearforeachcoveredactiveemployee.Basedontheseassumptions,theplan’sFiduciaryNetPositionandfuturecontributionsweresufficienttofinancethebenefitpaymentsthroughtheyear2039.Asaresult,thelong-termexpectedrateofreturnonplaninvestmentswasappliedtoprojectbenefitpaymentsthroughtheyear2039,andthemunicipalbondratewasappliedtoallbenefitpaymentsafterthatdate.

NOTES TO FINANCIAL STATEMENTS
~ 63 ~
1.00% DecreaseCurrent Healthcare Cost
Trend Rate 1.00% Increase$527,430,105 $646,275,814 $801,048,036
Sensitivity of the SCRHITF Net OPEB Liability to Changes in the Discount Rate1.00% Decrease (2.13%) Current Discount Rate (3.13%) 1.00% Increase (4.13%)
$766,152,067 $646,275,814 $550,070,149
Sensitivity of the SCLTDITF Net OPEB Liability to Changes in the Discount Rate1.00% Decrease (2.04%) Current Discount Rate (3.04%) 1.00% Increase (4.04%)
$84,076 $48,878 $13,962
NOTE 10.DEFERRED COMPENSATION PLANS SeveraloptionaldeferredcompensationplansareavailabletoStateemployeesandemployersofitspoliticalsubdivisions.AllClemsonUniversityemployeesmayparticipateinthedeferredcompensationplans,exceptthoseinstudentemploymentpositions.CertainemployeesoftheUniversityhaveelectedtoparticipate.Themultiple-employerplans,createdunderInternalRevenueCodeSections457,401(k),and403(b),areadministeredbythirdpartiesandarenotincludedintheComprehensiveAnnualFinancialReportoftheStateofSouthCarolina.CompensationdeferredundertheSection401(k),457and403(b)plansisplacedintrustforthecontributingemployee.TheStatehasnoliabilityforlossesundertheplans.EmployeesmaywithdrawthecurrentvalueoftheircontributionswhentheyterminateStateemploymentifpermittedbytheplan.Eligibilityrulesandpenaltiesmayapply.Employeesmayalsowithdrawcontributionspriortoterminationiftheymeetrequirementsspecifiedbytheapplicableplan.InaccordancewithIRSregulationseffectiveJanuary1,2009,ClemsonUniversityadopteda403bplandocument.Undertheplan,loansandfinancialhardshipdistributionsarepermitted.Fifteenyearsofservicecatch-upcontributionsarenotpermitted.
RegardingthesensitivityoftheSCRHITF’snetOPEBliabilitytochangesinthehealthcarecosttrendrates,thefollowingtablepresentstheUniversity’sproportionateshareoftheSCRHITF’snetOPEBliability,calculatedusingtheassumedtrendratesaswellaswhattheUniversity’sproportionateshareoftheSCRHITF’snetOPEBliabilitywouldbeifwerecalculatedusingatrendratethatisonepercentloweroronepercenthigher.
ThefollowingtablepresentstheUniversity’sproportionateshareoftheSCLTDITFnetOPEBliabilitycalculatedusingthediscountrateof3.04percent,aswellaswhattheUniversity’sproportionateshareofthenetOPEBliabilitywouldbeifitwerecalculatedusingadiscountratethatis1percentagepointlower(2.04percent)or1percentagepointhigher(4.04percent)thanthecurrentrate:
Additional Financial and Actuarial Information InformationcontainedintheseNotestotheSchedulesofEmployerAllocationoftheNetOPEBLiability,ContributionsfromNon-employerContributingEntities,andImplicitSubsidyandtheSchedulesofEmployerAllocationoftheOPEBExpenseandDeferredOutflowsandInflowsofResourcesRelatedtoOPEB(theSchedules)werecompiledfromtheOPEBTrustFundsauditedfinancialstatementsforthefiscalyearendedJune30,2019,andtheaccountingandfinancialreportingactuarialvaluationasofJune30,2019.AdditionalfinancialinformationsupportingthepreparationoftheSchedules(includingtheunmodifiedauditopiniononthefinancialstatementsandrequiredsupplementaryinformation)isavailableintheOPEBTrustFundsauditedfinancialstatements.EmployersareencouragedtoreviewIllustrationIIinAppendixCofGASBStatementNo.75,whichprovidesasamplefootnotedisclosureandrequiredsupplementaryinformationforacost-sharingmultiple-employerdefinedbenefitplan.
Sensitivity Analysis ThefollowingtablepresentstheUniversity’sproportionateshareoftheSCRHITFnetotherpostemploymentbenefits(OPEB)liabilitycalculatedusingthediscountrateof3.13percent,aswellaswhattheUniversity’sproportionateshareofthenetOPEBliabilitywouldbeifitwerecalculatedusingadiscountratethatis1percentagepointlower(2.13percent)or1percentagepointhigher(4.13percent)thanthecurrentrate:

NOTES TO FINANCIAL STATEMENTS
~ 64 ~
NOTE 11.LONG-TERM LIABILITIES Long-termliabilityactivityfortheyearendedJune30,2020wasasfollows:
Long-Term Liabilities
Description July 1, 2019 Additions Reductions June 30, 2020Due WithinOne Year
Bonds payable and capital lease obligations: General obligation bonds $ 209,600,000 — $ 10,240,000 $ 199,360,000 $ 10,450,000 Revenue bonds 274,470,000 — 6,900,000 267,570,000 6,505,000 Athletic facilities revenue bonds 133,730,000 — 4,345,000 129,385,000 4,535,000 Subtotal bonds payable 617,800,000 — 21,485,000 596,315,000 21,490,000 Unamortized revenue bond premium 46,896,457 — 2,650,558 44,245,899 2,564,543 Total bonds payable 664,696,457 — 24,135,558 640,560,899 24,054,543 Capital leases payable 11,687,904 369,769 915,204 11,142,469 933,481 Total bonds and capital leases payable 676,384,361 369,769 25,050,762 651,703,368 24,988,024
Other liabilities: Accrued compensated absences 28,356,000 14,669,929 11,582,929 31,443,000 15,487,250 Funds held for others 6,951,851 — 1,767,476 5,184,375 — Net pension liability 638,844,885 118,709,960 85,240,416 672,314,429 — Net postemployment benefit liability 588,163,078 99,459,115 41,297,501 646,324,692 — Total other liabilities 1,262,315,814 232,839,004 139,888,322 1,355,266,496 15,487,250 Total long-term liabilities $1,938,700,175 $233,208,773 $164,939,084 $ 2,006,969,864 $ 40,475,274
AdditionalinformationregardingBondsPayableisincludedinNote6.AdditionalinformationregardingCapitalLeaseObligationsisincludedinNote7.Thebalanceinthelong-termliabilityaccount“Fundsheldforothers”representstheFederalliabilityforthePerkinsLoanprogramandlongevityincentivesforathleticcoaches.

NOTES TO FINANCIAL STATEMENTS
~ 65 ~
NOTE 12.CONSTRUCTION COSTS AND COMMITMENTS
Capitalized TheUniversityhasobtainedorhasplanstoobtainthenecessaryfundingfortheacquisition,construction,renovation,andequippingofcertainfacilitieswhichwillbecapitalizedintheapplicablecapitalassetcategoriesuponcompletion.ManagementestimatesthattheUniversityhassufficientresourcesavailableand/orfutureresourcesidentifiedtosatisfactorilycompletetheconstructionofsuchprojectswhichareexpectedtobecompletedinvaryingphasesoverthenext2or3yearsatanestimatedcostof$313,372,557.The$313,372,557includesestimatedcostsof$264,115,391forcapitalprojectscurrentlyinprogressplus$49,257,167estimatedcostsforothercapitalprojectsalreadyinservice.Ofthetotalestimatedcost,$111,851,202wasunexpendedatJune30,2020.OfthetotalexpendedthroughJune30,2020,theUniversityhascapitalizedsubstantiallycompleteandinuseprojectsintheamountof$42,627,940.OftheunexpendedbalancetheUniversityhasremainingcommitmentbalancesof$41,524,845withcertainpropertyowners,engineeringfirms,constructioncontractors,andvendorsrelatedtotheseprojects.RetainagespayableonthesecapitalizedprojectsasofJune30,2020,was$2,710,151.CapitalprojectsatJune30,2020whichconstituteconstructioninprogressthataretobecapitalizedwhencompletedarelistedbelow.
TheamountexpendedincludesonlycapitalizedprojectexpensesandcapitalizedinterestonconstructiondebtforprojectslessthansubstantiallycompleteandnotinserviceatJune30,2020.Nononcapitalizedexpendituresareincludedinthesetotals.
Non-Capitalized AtJune30,2020theUniversityhadinprogressothercapitalprojectswhichwillnotbecapitalizedwhencomplete.Theseprojectsareforreplacements,repairs,and/orrenovationstoexistingfacilities.Estimatedcostsonthesenon-capitalizedprojectstotal$76,387,152.Thisamountincludescostsincurredtodateof$39,648,555.andestimatedcoststocompleteof$36,738,597.TheUniversityhasremainingcommitmentbalanceswithcertainpartiesrelatedto theseprojectsof$6,850,398Retainagespayableonthenon-capitalizedprojectsasofJune30,2020,was$148,180.TheUniversityanticipatesfundingtheseprojectsoutofcurrentresources,currentandfuturebondissues,statecapitalimprovementbondproceeds,privategiftsandstudentfees.
Construction Costs and Commitments
Project Approximate Cost
Amount Expended
College of Business School construction $ 87,500,000 $ 91,098,022Campus Wide Mail Lockers 1,232,500 94,965Chapel construction 5,000,000 1,876,278Chapel Fire Access Jersey Lane 400,000 34,000Child care facility construction 5,000,000 3,955,024Core Campus Safety and Revitalization 420,000 13,435Daniel renovation and expansion 59,730,000 3,055,597Douthit Hills Parking Lot E27 518,900 51,254Douthit Hills R10 Parking Lot 916,400 107,858Duke Innovation Building upfit 169,985 39,902Electrical distribution upgrade 78,276,673 57,673,106Electrical infrastructure maintenance and improvements 1,118,674 1,118,674Garrison Arena Construction 7,800,000 159,233Hardscramble road new bathroom facility 500,000 49,085Manufacturing Innovation Building 4,000,000 2,591,582Memorial Stadium Renovations 1,030,000 856,441Recycle operations 500,000 74,444Roadway pedestrian safety improvements 315,000 52SCDOT Bike Trail cost share 750,000 750,000Soccer Operations Complex construction 8,000,000 4,491,385WEP Tower and Chiller addition 1,470,000 1,375,824West Energy Plant Chiller #4 A 998,000 832,057 Total construction costs and commitments $ 265,646,132 $ 170,298,218

NOTES TO FINANCIAL STATEMENTS
~ 66 ~
NOTE 13.RELATED PARTIES CertainseparatelycharteredlegalentitieswhoseactivitiesarerelatedtothoseoftheUniversityexistprimarilytoprovidefinancialassistanceandothersupporttotheUniversityanditseducationalprogram. The activities of these entities are not included in theUniversity’sfinancialstatements.However,theUniversity’sstatementsincludetransactionsbetweentheUniversityanditsrelatedparties. In accordancewithGovernmentalAccountingStandardsBoard (GASB)Codification Sections 2100,Defining theFinancialReportingEntity,andSection2600,ReportingEntityandComponentUnitPresentationandDisclosure,managementannually reviews its relationshipswith the related partiesdescribedinthisnote.TheUniversityexcludedtheserelatedpartiesfromthereportingentitybecauseitisnotfinanciallyaccountableforthem. Followingisamoredetaileddiscussionofeachoftheseentities and a summary of significant transactions (if any)betweentheseentitiesandClemsonUniversity.
Clemson University Research Foundation TheClemsonUniversityResearchFoundation(CURF)is separate 501(c)(3) corporation founded exclusively forcharitable,educationalandscientificpurposes.CURFsupportsthegenerationandcommercializationofintellectualpropertycreated from research conducted at ClemsonUniversitythroughsponsoredresearchbusinessdevelopmentoutreach,technology transfer,marketing, and licensing activities.Collectively, these activities are integrated to achieve theoverallmission ofCURF,which is “To generate researchfunding opportunities forClemsonUniversity to supportresearch initiatives that advanceUniversity discoveries tocreatenewproductsandservicesforpublicuseandbenefit”.CURF’soperationsandactivitiesaregovernedbyaBoardofDirectors. TheUniversityperformsresearchanddevelopmentunderperformanceagreementsforCURFandreceivespaymentforalldirectandindirectcostswhichareincurredinaccordancewiththetermsoftheperformanceagreements.TheUniversityrecordednorevenuefromCURFthisfiscalyear,asallfederalawards have been closed out. Therewere no outstandingreceivablesfromCURFatJune30,2020. TheUniversity remitted $290,654 toCURF per theoperating agreement between the two entities. CURFreimbursedtheUniversity$35,260forsalariesfortimedevotedbyUniversityemployeestoCURF.
Clemson Alumni Association TheClemsonAlumniAssociationisaseparatelycharteredcorporationestablishedtoserveClemsonUniversityalumniand promote thewelfare and future development of theUniversity in its educational, scientific, and programmaticpurposes.
TheAlumniAssociation contributed $1,091,263 totheUniversity, recognized as nonoperating gifts, to fundadministration, engagement,marketing, and events relatedto theAlumniAssociation. TheAlumniAssociation alsoreimbursed theUniversity $16,381 for salaries for timedevotedbyUniversityemployees.TheUniversityadministerscontractsforlicensingofclassringsandsportsapparel.TheUniversity remitted $359,668 to theAlumniAssociation,primarilyconsistingoflicensingroyalties,forthefiscalyearendedJune30,2020. Clemson University Continuing Education and Conference Complex Corporation The ClemsonUniversity Continuing Education andConferenceComplexCorporation(FinanceCorporation),isaseparatelycharteredcorporationestablishedinSeptember1993,toconstruct,operateandmanagethegolfcourseandhotelcomponentsoftheClemsonUniversityContinuingEducationandConferenceComplex.TheFinanceCorporation’sactionsaregovernedbyitsBoardofDirectors.TheUniversitybilledtheFinanceCorporation$18,489forsalariesfortimedevotedbyUniversityemployeestotheFinanceCorporation.
Clemson Architectural Foundation The ClemsonArchitectural Foundation (CAF) is aseparately chartered nonprofit corporation established toprovidesupplementalfinancialsupportandotherassistanceto the architecture, construction science andmanagement,planningandlandscapearchitectureandvisualartsprogramsin theCollegeofArts andHumanities. CAF’s actions aregovernedbyitsBoardofTrustees. TheUniversity’s financial statements reflect $749,486inexpensesprimarilytoreimburseCAFforadministrative,educational, and facilities expenses incurred at theCharlesE.DanielCenterforBuildingResearchandUrbanStudiesinGenoa,Italy,whichisownedbyCAF.
Clemson University Real Estate Foundation TheClemsonUniversityRealEstateFoundation,Inc.,isaseparatelycharteredentityorganizedtoserveastheefficientconduit throughwhichgiftsof real estate andproperty arereceivedandliquidated.TheRealEstateFoundation’sactionsaregovernedbyitsBoardofDirectors. Thisentityhadnotransactionswith theUniversity and did not significantlyrequirethetimeorserviceofanyUniversityemployees.

NOTES TO FINANCIAL STATEMENTS
~ 67 ~
TheUniversityreceivedsubstantialfundingfromtheCommissiononHigherEducation(“CHE”)forscholarshipsonbehalfofstudentsthatareaccountedforasoperatingstategrantsandcontracts.AdditionalamountsreceivedfromCHEareaccountedforasbothoperatingandnonoperatingrevenues,dependingupontherequirementofdeliverableswithacurrentorpotentialfutureeconomicvalue.TheUniversityalsoreceivesStatefundsfromvariousotherStateagenciesforsponsoredresearchandpublicserviceprojects.FollowingisasummaryofamountsreceivedfromStateagenciesforscholarships,sponsoredresearch,capitalandpublicserviceprojectsforthefiscalyearendedJune30,2020:
TheUniversityprovidednosignificantservicesfreeofchargetoanyStateagencyduringthefiscalyear;however,theUniversitydidprovidecomputerservicesandinformationsystemsdevelopmentforafeetootherStateagenciesduringthefiscalyear.Totalfeesreceivedwere$35,156,865comprisedof$295,695infeesforcomputerservicesclassifiedasotheroperatingrevenues,and$34,861,170ininformationandsystemsdevelopmentfeesclassifiedassalesandservicesofauxiliaryenterprises.
NOTE 14.TRANSACTIONS WITH STATE ENTITIES TheUniversityisgrantedanannualappropriationforoperatingpurposesasauthorizedbytheGeneralAssemblyoftheStateofSouthCarolina.Stateappropriationsarerecognizedasrevenuewhenreceivedandavailable.Amountsthatarenotexpendedbyfiscalyear-endlapseandarerequiredtobereturnedtotheGeneralFundoftheStateunlesstheUniversityreceivesauthorizationfromtheGeneralAssemblytocarrythefundsovertothenextyear. TheoriginalappropriationistheUniversity'sbasebudgetamountpresentedintheGeneralFundscolumnofSections14and45ofPartIAofthe2019-20AppropriationAct.ThefollowingisareconciliationoftheoriginalappropriationasenactedbytheGeneralAssemblytostateappropriationsrevenuereportedinthefinancialstatementsforthefiscalyearendedJune30,2020:
Other Amounts Recognized from State Agencies
Description Operating Revenues
Nonoperating Revenues
Capital and Endowment
Proceeds TotalReceived from the Commission on Higher Education (CHE): LIFE Scholarships $ 28,902,831 $ — $ — $ 28,902,831 Palmetto Scholarships 31,880,831 — — 31,880,831 Need-Based Grants 2,369,407 — — 2,369,407 HOPE Scholarships 22,400 — — 22,400Received from the Department of Education - STEM 1,750,000 — — 1,750,000Received from the Department of Education - Other 766,407 — — 766,407Received from various other state agencies 5,256,766 — — 5,256,766Received from agencies outside South Carolina 827,674 — — 827,674Received from PEBA (nonemployer contributions for retiree
health care and LTD plans) 7,379,745 — — 7,379,745Nonrecurring funding from State Treasurer's Office for Center
for Advanced Manufacturing 4,000,000 — — 4,000,000Nonrecurring funding from State Treasurer's Office for CU
Health Innovation 2,100,000 — — 2,100,000Capital reserve funding for Safety and Security Infrastructure
and Enhancement — — 5,900,000 5,900,000Capital reserve funding for Water Research Facility Renovation — — 5,000,000 5,000,000State appropriated funds for CURI Grid Simulator — — 272 272 Total other amounts recognized from state agencies $ 85,256,061 $ — $10,900,272 $ 96,156,333
State Appropriations
Description Educational and General
Public Service Total
Original appropriation $ 92,350,353 $ 45,521,749 $ 137,872,102Allocation for health and dental plan contributions 614,747 254,508 869,255Allocation for SCRS and POS retirement contributions 653,437 266,792 920,229Allocation for Recurring Adjustment - Salary & Frings (COLA) 1,663,635 679,244 2,342,879Allocation for Nonrecurring Adjustment - BONUS 403,627 164,802 568,429Appropriation allocations from the State Commission onf Higher Education: For Academic Endowment Match 33,684 — 33,684 Education Oversight Committee for Harscrable Property Upgrades — 500,000 500,000 For Clemson Agriculture Education Teachers - teacher recruitment — 1,144,356 1,144,356 Total state appropriations $ 95,719,483 $ 48,531,451 $ 144,250,934

NOTES TO FINANCIAL STATEMENTS
~ 68 ~
NOTE 15.RISK MANAGEMENT TheUniversity is exposed tovarious risksof loss andmaintainsStateorcommercialinsurancecoverageforeachofthoserisks.Managementbelievessuchcoverageissufficienttoprecludeanysignificantuninsuredlossesforthecoveredrisks.Therewerenosignificant reductions in insurancecoveragefromcoverageintheprioryear.Thecostsofsettledclaimshavenotexceededthiscoverageinanyofthepastthreeyears.TheUniversitypaysinsurancepremiumstocertainotherStateagenciesandcommercialinsurerstocoverrisksthatmayoccurinnormaloperations.Theinsurerspromisetopaytooronbehalfoftheinsuredforcoveredeconomiclossessustainedduringthepolicyperiodinaccordwithinsurancepolicyandbenefitprogramlimits. Statemanagement believes it ismore economical tomanagecertainrisksinternallyandsetasideassetsforclaimsettlement.SeveralStatefundsaccumulateassetsandtheStateitselfassumessubstantiallyallrisksforthefollowing:
(1) Claims of State employees for unemploymentcompensation benefits (Employment SecurityCommission);
(2) Claims of covered employees for workers’compensation benefits for job-related illnesses orinjuries(StateAccidentFund);
(3) Claims of covered public employees for healthand dental insurance benefits (Officeof InsuranceServices);and
(4) Claimsofcoveredpublicemployees for long-termdisability andgroup-life insurance benefits (OfficeofInsuranceServices).
EmployeeselecthealthcoveragethrougheitherahealthmaintenanceorganizationorthroughtheState’sself-insuredplan. All of the other coverages listed above are throughtheapplicableStateself-insuredplanexceptdependentandoptionallifepremiumsareremittedtocommercialcarriers. TheUniversityandotherentitiespaypremiums to theState’sInsuranceReserveFund(IRF)whichissuespolicies,accumulatesassetstocovertherisksofloss,andpaysclaimsincurredforcoveredlossesrelatedtothefollowingUniversityassets,activities,and/orevents:
(1) Theftof,damageto,ordestructionofassets;(2) Realproperty,itscontents,andotherequipment;(3) Motor vehicles, aircraft, andwatercraft (inland
marine);(4) Torts;(5) Businessinterruptions;(6) Naturaldisasters;and(7) Medicalmalpracticeclaimsagainstcoveredinfirmaries
andemployees.
The IRF is a self-insurer andpurchases reinsurance toobtaincertainservicesandspecializedcoverageandtolimitlossesintheareasofproperty,boilerandmachinery,automobileliability,andmedicalprofessionalliabilityinsurance.Also,theIRFpurchasesreinsuranceforcatastrophicpropertyandmedicalprofessionalliabilityinsurance.Reinsurancepermitspartialrecoveryoflossesfromreinsurers,buttheIRFremainsprimarily liable. The IRFpurchases insurance for aircraftandoceanmarinecoverage.TheIRF’sratesaredeterminedactuarially. State agencies and other entities are the primaryparticipantsintheState’sHealthandDisabilityInsuranceFundandintheIRF. TheUniversity obtains coverage through commercialinsurersforemployeefidelitybondinsurance.Allemployeesare covered for $1,000,000 forCommercialCrime. Thiscoverageincludesthefollowing:
(1) Blanketemployeedishonesty;(2) Forgery/alterations;(3) Theft,disappearanceofmoneyandsecurity;(4) Computerfraud;and(5)FaithfulPerformanceofduty
Inaddition,theCUExecutiveVicePresidentandChiefFinancialOfficeriscoveredfor$250,000underaspecificpublicofficialbond. CUManagerCash&TreasuryServices,CUDirectorofAccountingforRelatedOrganizations,PresidentandCEOforClemsonUniversityFoundation,ChiefFinancialOfficer andTreasurer forClemsonUniversityFoundation,SeniorFinancialAnalystandProjectManagerforClemsonUniversity Foundation,CUDirector of Student Financial
Also,theUniversitycollectedandremitted$11,307inpesticidepenaltiesandotherfeestotheStateGeneralFund. ServicesreceivedatnocostfromStateagenciesincludemaintenanceofcertainaccountingrecordsbytheComptrollerGeneral;banking,bondtrusteeandinvestmentservicesfromtheStateTreasurer;legalservicesfromtheAttorneyGeneral;andgrantsservicesfromtheGovernor'sOffice. OtherservicesreceivedatnocostfromthevariousofficesoftheStateBudgetandControlBoardincludepensionplanadministration,insuranceplansadministration,auditservices,personnelmanagement,assistanceinthepreparationoftheStateBudget,reviewandapprovalofcertainbudgetamendments,procurementservices,andothercentralizedfunctions. TheUniversityhadfinancialtransactionswithvariousStateagenciesduringthefiscalyear.SignificantpaymentsweremadetodivisionsoftheStateBudgetandControlBoardforpensionandinsuranceplansemployeeandemployercontributions,insurancecoverage,officesupplies,andinteragencymail.SignificantpaymentswerealsomadeforunemploymentandworkerscompensationcoverageforemployeestotheEmploymentSecurityCommissionandStateAccidentFund.Theamountsofexpendituresapplicabletorelatedtransactionswithstateentitiesarenotreadilyavailable.

NOTES TO FINANCIAL STATEMENTS
~ 69 ~
Operating Expenses by Function
Description
Compensation and Employee
Benefits
Servicesand
Supplies Utilities Depreciation
Scholarshipsand
Fellowships
Pensionand
OPEB TotalInstruction $ 248,187,665 $ 33,126,557 $ 573, 158 $ — $ 151,866 $ — $ 282,039,246Research 127,917,988 55,986,204 2,621,879 — 1,628,127 — 188,154,198Public Service 52,755,057 17,781,449 834,503 — 85,000 — 71,456,009Academic Support 52,221,256 20,481,449 720,791 — 758 — 73,424,254Student Services 32,268,610 14,868,339 70,548 — 57,055 — 47,264,552Institutional Support 44,603,315 15,280,616 88,352 — — — 59,972,283Operation and
Maintenance of Plant 22,491,103 51,539,214 4,180,655 — — — 78,210,972
Scholarships and Fellowships — 172,415 — — 45,777,347 — 45,949,762Auxiliary Enterprises 68,258,614 106,949,646 7,566,159 — — — 182,774,419Pension and OPEB — — — — — 60,751,565 60,751,565Depreciation — — — 66,648,011 — — 66,648,011
Total Operating Expenses by Function $648,703,608 $316,185,889 $16,656,045 $ 66,648,011 $47,700,153 $60,751,565 $1,156,645,271
NOTE 17.OPERATING EXPENSES BY FUNCTION OperatingexpensesbyfunctionalclassificationfortheyearendedJune30,2020aresummarizedasfollows:
Services,BusinessOfficer forFinance andAdministrationforCUFoundationandCUExecutiveVicePresident&ChiefFinancialOfficerareeachcoveredundera$2,000,000bond. TheUniversityhasrecordedinsurancepremiumexpensesandexpensesfordeductiblesinapplicablefunctionalexpensecategories. TheUniversityhasnottransferredtheportionoftheriskof loss related to insurance policy deductibles, and policylimitsforallcoveragetoaStateorcommercialinsurer. TheUniversityhasnotreportedanestimatedclaimslossexpenditureorarelatedliabilityatJune30,2020,basedontherequirementsofGASBStatement’sNo.10andNo.30,whichstatethataliabilityforclaimsmustbereportedonlyif informationprior to issuanceof thefinancial statementsindicatesthatitisprobablethatanassethasbeenimpairedoraliabilityhasbeenincurredonorbeforeJune30,2020,andtheamountofthelossisreasonablyestimable. Inmanagement’s opinion, claims losses in excess ofinsurance coverage are unlikely and, if incurred,wouldbe insignificant to the University’s financial position.
Furthermore,thereisnoevidenceofassetimpairmentorotherinformation to indicate thata lossexpenditureand liabilityshouldberecordedatyear-end.Thereforenolossaccrualhasbeenrecorded.Enterprise Risk Management Initiative ClemsonUniversity engages in an Enterprise RiskManagement(ERM)programdefinedbyTheCommitteeofSponsoringOrganizations(COSO)asa“process,effectedbyanentity’sboardofdirectors,managementandotherpersonnel,appliedinstrategy-settingandacrosstheenterprise,designedto identify potential events thatmay affect the entity, andmanagerisktobewithinitsriskappetite,toprovidereasonableassurance regarding the achievement of entity objectives”.TheBoardofTrusteesensuresappropriateERMframeworkis in place and functional to appropriatelymanage risks atanenterpriselevel.ThePresidentandExecutiveLeadershipTeamestablishesandmanagestheframeworkforasustainableenterpriseriskmanagementprocess.TheUniversity’sERMprocessincorporatesthefundamentalsofriskidentification,riskassessment,risktreatment,riskmonitoringandriskreview.
NOTE 16.CONTINGENCIES AND LITIGATION TheUniversityisinvolvedinanumberoflegalproceedingsandclaimswithvariouspartieswhicharoseinthenormalcourseofbusinessandcoverawiderangeofmatters.Because,intheopinionofmanagementandcounsel,theriskofmateriallossinexcessofinsurancecoveragefortheseitemsisremote,theoutcomeofthelegalproceedingsandclaimsisnotexpectedtohaveamaterialeffectonthefinancialpositionoftheUniversity.Therefore,anestimatedliabilityhasnotbeenrecorded. ThevariousfederalprogramsadministeredbytheUniversityforfiscalyear2020andprioryearsaresubjecttoexaminationbythefederalgrantoragencies.Atthepresenttime,amounts,ifany,whichmaybeduefederalgrantorshavenotbeendeterminedbuttheUniversitybelievesthatanysuchamountsintheaggregatewouldnothaveamaterialadverseeffectonthefinancialpositionoftheUniversity.Therefore,anestimatedlosshasnotbeenrecorded.

NOTES TO FINANCIAL STATEMENTS
~ 70 ~
NOTE 19.DETAILS OF RESTRICTED ASSETS ThepurposesandamountsofRestrictedAssetsareasfollows:
NOTE 20. COMPONENT UNITS
Clemson University Foundation TheClemsonUniversityFoundation(CUF)isaseparatelycharteredcorporationorganizedexclusivelytopromotethedevelopmentandwelfareofClemsonUniversityinitseducationalandscientificpurposes. AsdiscussedinNote1,CUFhasbeenincludedinthereportingentityasacomponentunit.BecauseCUFisdeemednottobeagovernmentalentityandusesadifferentreportingmodel,itsbalancesandtransactionsarereportedonseparatefinancialstatements. CUFtransfersfundsearmarkedfromprivatecontributionstotheUniversitytosupportUniversityscholarship,fellowship,professorship,andresearchprogramsandtoreimbursetheUniversityforpurchasesmadebyCUFthroughtheUniversity’sprocurementsystem.Thesetransfersforfiscalyear2020wererecordedbytheUniversityasnonoperatinggiftrevenuestotaling$24,023,169.CUFalsoreimbursedtheUniversity$946,903forsalariesfortimedevotedbyUniversityemployeestoCUFandtofundotherUniversityinitiativesasoutlinedintheaffiliationagreementbetweenthetwoentities. CUFhastwooperatingleaseswiththeUniversityandpaidatotalof$162,832forofficespaceduringfiscalyear2020. EquipmentdonatedbyCUFtotheUniversitytotaled$165,412andwasrecordedascapitalgrantsandgiftsintheStatementofRevenues,ExpensesandChangesinNetPosition.AlsorecordedascapitalgrantsandgiftsuponreceiptwereCUFdonationstotaling$4,200,246forUniversitybuildingprojects. AsofJune30,2020,unexpendedfundsheldbyCUFdesignatedforUniversitybuildingprojectstotaled$4,241,940
NOTE 18.DONOR-RESTRICTED ENDOWMENTS Ifadonorhasnotprovidedspecificinstructions,statelawpermitstheBoardofTrusteestoauthorizeforexpensethenetappreciation(realizedandunrealized)oftheinvestmentsofendowmentfunds.Anynetappreciationthatisspentisrequiredtobespentforthepurposesforwhichtheendowmentwasestablished. ClemsonUniversity delegated responsibility for endowmentmanagement, including spendingpolicy to theClemsonUniversityFoundationBoardofTrustees.InaccordancewiththespendingpolicywhichisestablishedbytheClemsonUniversityFoundationBoard,endowment-derivedprogramexpensesarebasedonapercentageofanendowment’s rolling12quarteraverage.Forfiscalyear2020,thisratewas4.0%.AtJune30,2020,netappreciationgainsof$3,578,179wererecordedandreportedintheStatementofNetPositionasunrestricted.
Details of Restricted Assets
Description AmountCurrent: Cash and cash equivalents: As specified by sponsors/donors $ 18,879,241 University administered loans 362,558 Payment of maturing debt 16,950,595 Unspent bond proceeds 22,839,077 Amounts restricted for capital projects 160,312,599 Funds held for others 272,580 Total current restricted assets $ 219,616,650
Noncurrent: Cash and cash equivalents: Endowments $ 97,955 Federal Perkins Loan Program 2,071,457 Total noncurrent restricted cash and cash equivalents $ 2,169,412
Student Loans Receivable: Total Federal Perkins Loan Program $ 4,958,056
NOTES TO FINANCIAL STATEMENTS
~ 71 ~
Investments
Description AmountMoney market funds $ 7,391,167Treasury/agency 40,423,415Mortgage backed securities 21,992,179Corporate bonds 17,087,875International bonds 626,771U.S. Equities 337,941,303Global equities 105,916,285Commodities 12,666,665Public real assets 323,614Hedge funds 117,774,615Private equity 80,198,240Private real assets 18,075,039Other 1,298,123 Subtotal - marketable investments 761,715,291Subordinated note receivable from Clemson University Real Estate Foundation, Inc. 20,000,000
Total Investments $ 781,715,291
AsreferencedinNote3,a1999amendmenttotheSouthCarolinaCodeofLawsallowedstate-supporteduniversitiestolendendowmentbalancesondepositwiththeStateTreasurertoentities(likeCUF)whoseexistenceisprimarilyprovidingfinancialassistanceandothersupporttotheinstitutionanditseducationalprogram.Atfiscalyearend,theamountloaned,including income and appreciation, totaled $201,271,023.Current year income, gains, and appreciation on the loantotaled$3,578,179. CUFchargesanannualfeeformanagingtheUniversity’sownedendowments.ForthefiscalyearendingJune30,2020,this feewas1.25%of the12quartermarketvalueaverageof theseUniversity owned funds or $1,960,563. Atfiscalyear-end,$490,141wasduetoCUFandrecordedinaccountspayable.Themanagementfeeisincludedinthecurrentyearincome,gainsandappreciationrecordedontheCUFloan. Endowment funds, including those owned by theUniversity, are investedas apartof theoverall investmentportfoliomanaged byCUF. A unitized approach is takenin allocating pooled investment income and realized andunrealized gains and losses, net of externalmanagementandother fees, to individualendowment funds.Realestateinvestmentsarestatedprimarilyatthecurrentappraisedvalue. CUF investment income, net of external and internalmanagementexpensesandfees,andgainsandlossesarisingfromthesaleorotherdispositionof investmentsandothernoncashassetsisdistributedtothevariousendowmentsusingapooledincomeapproach.Thisapproachdistributesincomefollowingthemarketvalueunitmethod,whichisbasedonthenumberofunitseachfundownsinthemanagedinvestmentpool. CUFEndowmentandboard-designatedfundsareinvestedonthebasisofatotalreturnpolicytoprovideincomeandtorealizeappreciationininvestmentvalues.Underthispolicy,earnings,nottoexceedaspecifiedpercentage,couldbeusedtosupporttheintendedpurposes.Anysuchearningsusedtosupporttheintendedpurposesareallocatedonlyfromthosefundswhichhaveamarketvalueinexcessofhistoricalvalue. AsummaryofinvestmentsatfairvalueatJune30,2020follows:
Clemson University Land Stewardship Foundation TheClemsonUniversityLandStewardshipFoundation(CULSF)isaseparatelycharteredcorporationestablishedtoservetheneedsofClemsonUniversityinthemanagement,development, and investment of real property and related assets. CULSF’s activities are governed by itsBoard ofDirectors. As discussed inNote 1,CULSFhas been included inthereportingentityasacomponentunit.BecauseCULSFisdeemednottobeagovernmentalentityandusesadifferentreportingmodel,itsbalancesandtransactionsarereportedonseparatefinancialstatements. TheUniversityleasesandutilizesseveralfacilitiesownedandoperatedbyCULSF.TheUniversityenteredintoacapitalleasewithCULSFforspaceintheGreenvilleOneBuildingindowntownGreenville.ForthefiscalyearendingJune30,2020, $234,622was paid by theUniversity toCULSF forcommonareamaintenancecostsand$878,539foroperatingleasesattheCU-ICARcampus.Capitallease-relatedprincipal,interest,andoperatingexpensepaymentstotaling$940,593werepaidtoCULSFfortheGreenvilleOnebuilding. CULSFreimbursedtheUniversity$223,698forsalariesfor time devoted by University employees to CULSF,managementservices,andotheroperatingexpenses.
IPTAY IPTAYisaseparatelycharteredcorporationestablishedexclusivelytosupportUniversityathletics.IPTAY’sactivitiesaregovernedbyitsBoardofDirectors. As discussed inNote 1, IPTAYhas been included inthereportingentityasacomponentunit.BecauseIPTAYisdeemednottobeagovernmentalentityandusesadifferentreportingmodel,itsbalancesandtransactionsarereportedonseparatefinancialstatements. InthefiscalyearbeginningJuly1,2014,IPTAYbeganoperating as an independent entity. Previously, althoughrecognized as a tax-exempt organization by the InternalRevenueService,allIPTAYreceiptsweredepositedthroughtheUniversityintoStateTreasurerbankaccountsandrelateddisbursementswerealsomadefromtheseaccounts.Duringthe fiscal year ended June 30, 2020, IPTAY contributed$55,152,035 to the University for qualifying athleticscholarships, operating expenses, capital project funding,anddebt serviceobligations. Asof June30,2020, IPTAYhadremainingcommitmentsofapproximately$103,636forUniversitybuildingprojects. AtJune30,2020,theStatementofNetPositionincludesaccounts receivable from IPTAYof $35,784 and accountspayableof$1,405,049duetoIPTAY.

~ 72 ~
NOTE 21.SUBSEQUENT EVENTS The2019NovelCoronavirus(or“COVID-19”)hasadverselyaffected,andmaycontinuetoadverselyaffect,economicactivityglobally,nationallyandlocally. InMarch2020,theWorldHealthOrganizationdeclaredtheoutbreakofCOVID-19apandemic.TheextentoftheimpactoftheoutbreakontheUniversity’soperationalandfinancialperformancewilldependoncertaindevelopments,includingthedurationandspreadoftheoutbreak,impactontheUniversity’sdonors,employees,andvendors,andgovernmental,regulatory,andprivatesectorresponses.ThefullextentoftheeconomicuncertaintycausedbyCOVID-19ontheUniversity’sconsolidatedfinancialstatementsinfutureperiodsisnotyetdeterminable. InMarch2020,inresponsetotheExecutiveOrdersofGovernorHenryMcMasterandinanefforttominimizetheriskofCOVID-19,theUniversitytransitionedtoremotelearning,closedresidencehallsandothercampusfacilities,andcancelledallactivities.TheUniversityincurredcoststotalingapproximately$20.5millioninthefiscalyearendedJune30,2020,comprisedprimarilyofrefundstostudentsforhousing,dining,andcertainotherfeesforthespringsemester.Inaddition,earningsoninvestmentsandendowmentbalanceswereimpactedbymarketconditionsrelatedtothepandemic.TheUniversityinstitutedavarietyofcostreductionmeasuresasaresultofthepandemicandispoisedtoenactadditionalcostreductionmeasuresasnecessaryduringtheupcomingfiscalyear. Priortofiscalyear-end,theUniversityreceivedfederalCARESActfundstotaling$13,579,995.PartAoffederalCARESAct funds,$6,789,998,wasdistributeddirectly tostudentsasemergencyfinancialaidgrantsas requiredunder the federalprogram.PartB,totaling$6,789,997,wasusedtocoverthecostofhousing,dining,andotherrefundsissuedtostudents. TheUniversityimplementedafreezeoftuitionandmandatoryfeesforthe2020-2021academicyearforallin-stateandout-of-statestudents.Despitethepandemic,earlyindicatorsreflectenrollmentgrowthofapproximatelythreepercentforthefall2020semester.TheUniversitybeganthesemesterwithremoteinstructionandimplementedastaggeredmove-inapproachwithitsfirststudentsmovingintocampusresidencehallsbeginningSeptember11th.Asofthereportdate,theUniversityhasissuedcreditsforhousing,dining,andcertainotherfeestotalingapproximately$11millionrelatedtothedelayedre-openingofcampusresidencehallsanddiningfacilities.In-personlearningbeganSeptember21standincludesahybridofonlineandin-personclasses.TheUniversityhasimplementedcontingencyplanswhichincludepreparationofon-campusandoff-campusspacetobeusedforquarantinepurposes,arobusttestingstrategy,andexpandedhealthcareservicecapacity.TheUniversityhasalsoworkedwithvariousvendors,suchasfoodserviceproviders,toalteroperationstofacilitatesocialdistancingandothersafetyprotocols. Thefallathleticseasonalsoexperiencedmodificationstooperationswithathleticfacilitiesexperiencingreducedcapacitytofacilitatesocialdistancing.Atthestartofthefootballseason,stadiumcapacityhasbeenlimitedto23%.Asofthereportdate,IPTAY,theUniversity’sathleticsupportorganization,isworkingwithseasonticketholderstoprovideoptionsforrefunds,deferralofticketpurchasestothe2021-2022athleticseason,orconsiderationofticketsalesasacontributiontoIPTAY.Theimpactofticketrefundscannotbeestimatedatthistimeandmayhaveamaterialimpactonathleticoperations. ThedegreeoffutureimpactstotheUniversity’soperationsandfinancesareextremelydifficulttopredictduetothedynamicnatureoftheCOVID-19outbreak,includinguncertaintiesrelatingtoitsduration,severity,ultimategeographicspread,aswellasactionsbyothergovernmentalauthoritiesincludinglimitationsonpublicassembliesandgatherings.TheUniversitycontinuestocloselymonitorandrespondtoCOVID-19.

~ 73 ~
REQUIRED SUPPLEMENTARY INFORMATION SCHEDULE OF THE UNIVERSITY'S PROPORTIONATE SHARE OF THE NET PENSION LIABILITY
South Carolina Retirement System (SCRS)
For theYear
University’s Proportionate
Share of the NetPension Liabillity
University’s Proportionate
Share of the NetPension Liability
University’s Covered Payroll
During the Measurement
Period
University’s Proportionate Share of the Net PensionLiabillity as a Percentage
of its Covered Payroll
Plan Fiduciary NetPosition as a
Percentage of the Total Pension
Liability2020 2.902484% $ 662,757,449 $ 392,634,667 168.80% 54.40%2019 2.814404% 630,618,329 377,798,791 166.92% 54.10%2018 2.706197% 609,208,463 359,507,113 169.46% 53.30%2017 2.649480% 565,925,017 336,425,269 168.22% 52.90%2016 2.657194% 503,949,653 326,390,137 154.40% 56.99%2015 2.601067% 447,817,506 308,864,854 144.99% 59.92%
Police Officers Retirement System (PORS)
For theYear
University’s Proportionate
Share of the NetPension Liabillity
University’s Proportionate
Share of the NetPension Liability
University’s Covered Payroll
During the Measurement
Period
University’s Proportionate Share of the Net PensionLiabillity as a Percentage
of its Covered Payroll
Plan Fiduciary NetPosition as a
Percentage of the Total Pension
Liability2020 0.33347% $ 9,556,980 $ 4,852,489 196.95% 62.70%2019 0.29033% 8,226,555 4,095,825 200.85% 61.70%2018 0.29435% 8,063,788 3,991,757 202.01% 60.90%2017 0.28558% 7,243,538 3,716,102 194.92% 60.40%2016 0.26576% 5,792,207 3,358,977 172.44% 64.57%2015 0.26743% 5,119,734 3,238,913 158.07% 67.55%

~ 74 ~
REQUIRED SUPPLEMENTARY INFORMATION SCHEDULE OF UNIVERSITY CONTRIBUTIONS TO PENSION PLANS
South Carolina Retirement System (SCRS)
For the YearStatutorily Required
Contribution
Contributions Recognized by the
PlanContribution
Deficiency (excess)University’s Covered
Payroll
Contributions as a Percentage of Covered
Payroll2020 $ 48,191,395 $ 48,191,395 $ — $ 401,911,279 11.99%2019 41,685,052 41,685,052 — 392,634,667 10.62%2018 36,234,136 36,234,136 — 377,798,791 9.59%2017 31,566,642 31,566,642 — 359,507,113 8.78%2016 28,386,836 28,376,288 10,548 336,425,269 8.44%2015 27,147,096 27,156,699 (9,603) 326,390,137 8.32%2014 25,031,158 25,031,158 — 308,864,854 8.10%2013 24,089,283 24,089,283 — 292,367,473 8.24%2012 19,221,300 19,221,300 — 263,508,916 7.29%2011 18,869,713 18,869,713 — 258,961,093 7.29%
Police Officers Retirement System (PORS)
For the YearStatutorily Required
Contribution
Contributions Recognized by the
PlanContribution
Deficiency (excess)University’s Covered
Payroll
Contributions as a Percentage of Covered
Payroll2020 $ 982,682 $ 982,682 $ — $ 5,447,042 18.04%2019 1,087,404 1,087,404 — 4,852,489 22.41%2018 614,762 614,762 — 4,095,825 15.01%2017 564,457 564,457 — 3,991,757 14.14%2016 500,233 500,233 — 3,716,102 13.46%2015 441,480 441,508 (28) 3,358,977 13.14%2014 412,997 412,997 — 3,238,913 12.75%2013 364,346 364,346 — 2,973,675 12.25%2012 275,212 275,212 — 2,343,277 11.74%2011 247,568 247,568 — 2,143,665 11.55%

~ 75 ~
REQUIRED SUPPLEMENTARY INFORMATION SCHEDULE OF THE UNIVERSITY'S PROPORTIONATE SHARE OF THE NET RETIREE HEALTHBENEFITS LIABILITY
South Carolina Retiree Health Care Plan
For theYear
University’s Proportionate
Share of the NetRetiree Health
BenefitsLiabillity
University’sProportionate
Share of the NetRetiree Health
BenefitsLiability
University’sCovered Payroll
During the Measurement
Period
University’s Proportionate Share of the Net Retiree
Health BenefitsLiabillity as a Percentage
of its Covered Payroll
Plan Fiduciary NetPosition as a
Percentage of the Total Retiree Health Benefit
Liability2020 4.273880% $ 646,275,814 $ 397,487,156 162.59% 8.44%2019 4.150069% 588,089,053 381,894,616 153.99% 7.91%2018 4.113249% 557,132,840 363,498,870 153.27% 7.60%
South Carolina Basic Long-Term Disability Plan
For theYear
University’s Proportionate
Share of the NetRetiree Health
Benefits Liabillity
University’sProportionate
Share of the NetRetiree Health
BenefitsLiability
University’sCovered Payroll
During the Measurement
Period*
University’s Proportionate Share of the Net Retiree
Health BenefitsLiabillity as a Percentage of its Covered Payroll*
Plan Fiduciary NetPosition as a
Percentage of the Total Retiree Health Benefit
Liability2020 2.48332% $ 48,878 N/A N/A 95.17%2019 2.41815% 74,025 N/A N/A 92.20%2018 2.37784% 43,110 N/A N/A 95.29%
*Because contributions to the LTD plan are not based on a measure of pay, no measure of payroll should be presented (see paragraph 13 of GASB 85).

~ 76 ~
REQUIRED SUPPLEMENTARY INFORMATION
SCHEDULE OF UNIVERSITY CONTRIBUTIONS TO RETIREE HEALTH BENEFIT PLANS
South Carolina Retiree Health Care Plan
For the YearStatutorily Required
Contribution
Contributions Recognized by the
PlanContribution
Deficiency (excess)University’s Covered
Payroll
Contributions as a Percentage of Covered
Payroll2020 $ 24,789,464 $ 24,789,464 $ — $ 401,911,279 6.17%2019 22,614,074 22,614,074 — 397,487,156 5.69%2018 19,241,272 19,241,272 — 381,894,616 5.15%2017 16,929,079 16,929,079 — 363,498,870 5.09%2016 16,371,391 16,371,391 — 340,141,371 4.81%2015 15,850,629 15,850,629 — 329,749,114 4.81%2014 14,783,300 14,783,300 — 312,103,767 4.74%2013 12,988,807 12,988,807 — 295,341,148 4.40%2012 11,039,467 11,039,467 — 265,852,193 4.15%2011 9,955,435 9,955,435 — 261,104,758 3.81%
South Carolina Basic Long-Term Disability Plan
For the YearStatutorily Required
Contribution
Contributions Recognized by the
PlanContribution
Deficiency (excess)University’s Covered
Payroll*
Contributions as a Percentage of Covered
Payroll*2020 $ 176,543 $ 176,543 $ — N/A N/A2019 178,729 178,729 — N/A N/A2018 169,114 169,114 — N/A N/A2017 167,768 172,122 (4,354) N/A N/A2016 164,606 164,606 — N/A N/A2015 171,980 171,980 — N/A N/A2014 166,203 166,203 — N/A N/A2013 145,840 145,840 — N/A N/A2012 142,137 142,137 — N/A N/A2011 133,365 133,365 — N/A N/A
*Because contributions to the LTD plan are not based on a measure of pay, no measure of payroll should be presented (see paragraph 13 of GASB 85).

Statistical Section(unaudited)


~ 79 ~
Statistical Section This section of the Comprehensive Annual Financial Report provides additional information as a context for understanding what the information in the financial statements and note disclosures says about the University’s and the State of South Carolina’s overall financial health.
Contents Page
Financial Trends 78 These schedules contain trend information to help the reader understand how the University’s financial
performance and well-being have changed over time.
Debt Capacity 83 These schedules present information to help the reader assess the affordability of the University’s current
levels of outstanding debt and the University’s ability to issue additional debt in the future.
Operating Information 86 These schedules contain service and capital asset data to help the reader understand how the information in
the University’s financial report relates to the services the University provides and the activities it performs.
Demographic and Economic Information 92 These schedules offer demographic and economic indicators to help the reader understand the environment
within which the University’s and the State’s financial activities take place.
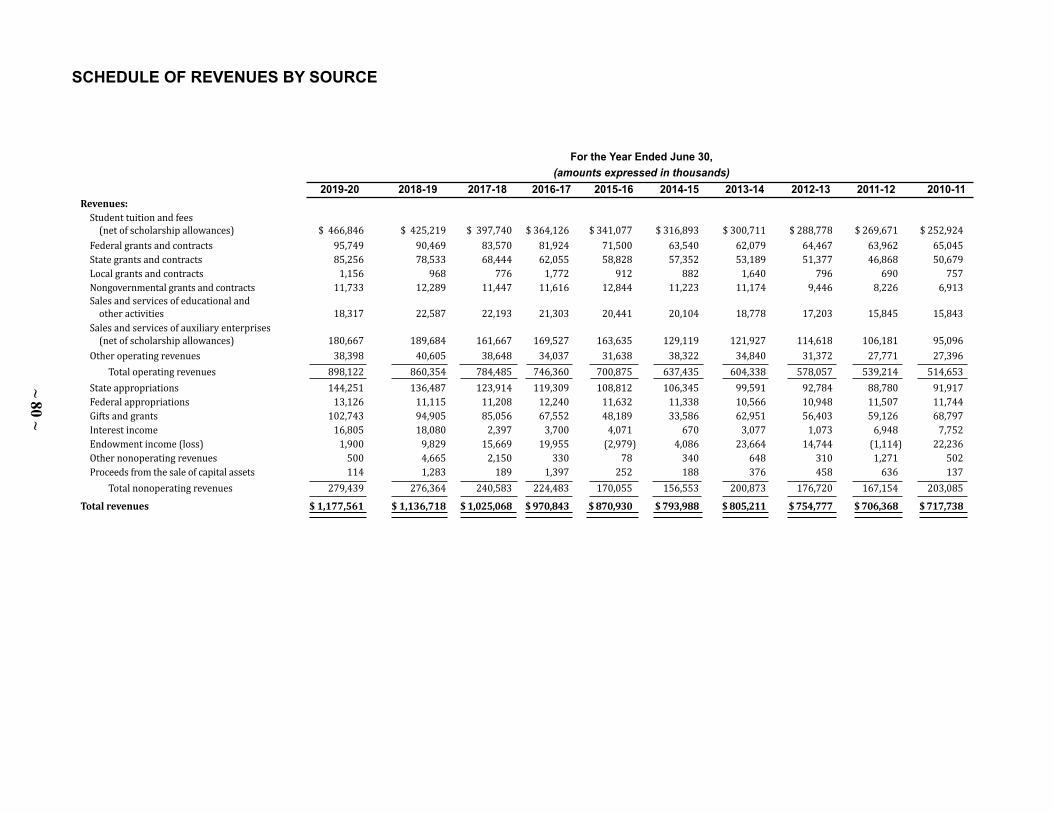
~ 80 ~
SCHEDULE OF REVENUES BY SOURCE
For the Year Ended June 30,(amounts expressed in thousands)
2019-20 2018-19 2017-18 2016-17 2015-16 2014-15 2013-14 2012-13 2011-12 2010-11Revenues:
Student tuition and fees (net of scholarship allowances) $ 466,846 $ 425,219 $ 397,740 $ 364,126 $ 341,077 $ 316,893 $ 300,711 $ 288,778 $ 269,671 $ 252,924
Federal grants and contracts 95,749 90,469 83,570 81,924 71,500 63,540 62,079 64,467 63,962 65,045 State grants and contracts 85,256 78,533 68,444 62,055 58,828 57,352 53,189 51,377 46,868 50,679 Local grants and contracts 1,156 968 776 1,772 912 882 1,640 796 690 757 Nongovernmental grants and contracts 11,733 12,289 11,447 11,616 12,844 11,223 11,174 9,446 8,226 6,913
Sales and services of educational and other activities 18,317 22,587 22,193 21,303 20,441 20,104 18,778 17,203 15,845 15,843
Sales and services of auxiliary enterprises (net of scholarship allowances) 180,667 189,684 161,667 169,527 163,635 129,119 121,927 114,618 106,181 95,096 Other operating revenues 38,398 40,605 38,648 34,037 31,638 38,322 34,840 31,372 27,771 27,396 Total operating revenues 898,122 860,354 784,485 746,360 700,875 637,435 604,338 578,057 539,214 514,653 State appropriations 144,251 136,487 123,914 119,309 108,812 106,345 99,591 92,784 88,780 91,917 Federal appropriations 13,126 11,115 11,208 12,240 11,632 11,338 10,566 10,948 11,507 11,744 Gifts and grants 102,743 94,905 85,056 67,552 48,189 33,586 62,951 56,403 59,126 68,797 Interest income 16,805 18,080 2,397 3,700 4,071 670 3,077 1,073 6,948 7,752 Endowment income (loss) 1,900 9,829 15,669 19,955 (2,979) 4,086 23,664 14,744 (1,114) 22,236 Other nonoperating revenues 500 4,665 2,150 330 78 340 648 310 1,271 502 Proceeds from the sale of capital assets 114 1,283 189 1,397 252 188 376 458 636 137 Total nonoperating revenues 279,439 276,364 240,583 224,483 170,055 156,553 200,873 176,720 167,154 203,085
Total revenues $ 1,177,561 $ 1,136,718 $ 1,025,068 $ 970,843 $ 870,930 $ 793,988 $ 805,211 $ 754,777 $ 706,368 $ 717,738

~ 81 ~
Source: Clemson University Comprehensive Annual Financial Reports.
For the Year Ended June 30,(percent of total revenues)
2019-20 2018-19 2017-18 2016-17 2015-16 2014-15 2013-14 2012-13 2011-12 2010-11Revenues: Student tuition and fees (net of scholarship allowances) 39.6% 37.3% 38.7% 37.4% 39.3% 40.0% 37.4% 38.2% 38.2% 35.2% Federal grants and contracts 8.1% 8.0% 8.2% 8.4% 8.2% 8.0% 7.7% 8.5% 9.1% 9.1% State grants and contracts 7.2% 6.9% 6.7% 6.4% 6.8% 7.2% 6.6% 6.8% 6.6% 7.1% Local grants and contracts 0.1% 0.1% 0.1% 0.2% 0.1% 0.1% 0.2% 0.1% 0.1% 0.1% Nongovernmental grants and contracts 1.0% 1.1% 1.1% 1.2% 1.5% 1.4% 1.4% 1.3% 1.2% 1.0% Sales and services of educational and other activities 1.6% 2.0% 2.2% 2.2% 2.3% 2.5% 2.3% 2.3% 2.2% 2.2% Sales and services of auxiliary enterprises (net of scholarship allowances) 15.3% 16.7% 15.8% 17.5% 18.8% 16.3% 15.1% 15.2% 15.0% 13.2% Other operating revenues 3.5% 3.6% 3.8% 3.5% 3.6% 4.8% 4.3% 4.2% 3.9% 3.8% Total operating revenues 76.4% 75.7% 76.6% 76.8% 80.6% 80.3% 75.0% 76.6% 76.3% 71.7% State appropriations 12.2% 12.0% 12.1% 12.3% 12.5% 13.5% 12.5% 12.3% 12.6% 12.8% Federal appropriations 1.1% 1.0% 1.1% 1.3% 1.3% 1.4% 1.3% 1.5% 1.6% 1.6% Gifts and grants 8.7% 8.3% 8.3% 7.0% 5.5% 4.2% 7.8% 7.4% 8.4% 9.6% Interest income 1.4% 1.6% 0.2% 0.4% 0.4% 0.1% 0.4% 0.1% 1.0% 1.1% Endowment income (loss) 0.2% 0.9% 1.5% 2.1% (0.3)% 0.5% 2.9% 2.0% (0.2)% 3.1% Other nonoperating revenues 0.0% 0.4% 0.2% 0.0% 0.0% 0.0% 0.1% 0.0% 0.2% 0.1% Proceeds from the sale capital assets 0.0% 0.1% 0.0% 0.1% 0.0% 0.0% 0.0% 0.1% 0.1% 0.0% Total nonoperating revenues 23.6% 24.3% 23.4% 23.2% 19.4% 19.7% 25.0% 23.4% 23.7% 28.3% Total revenues 100.0% 100.0% 100.0% 100.0% 100.0% 100.0% 100.0% 100.0% 100.0% 100.0%

~ 82 ~ For the Year Ended June 30,(percent of total expenses)
2019-20 2018-19 2017-18 2016-17 2015-16 2014-15 2013-14 2012-13 2011-12 2010-11Expenses: Compensationandemployeebenefits 54.9% 58.1% 60.1% 58.9% 57.3% 56.5% 57.0% 58.0% 57.6% 59.2% Services and supplies 26.8% 29.3% 27.1% 28.1% 29.9% 31.0% 31.2% 30.4% 29.8% 28.1% Utilities 1.4% 1.9% 2.0% 2.1% 2.1% 2.3% 2.6% 2.5% 2.5% 2.6% Depreciation 5.7% 5.4% 5.6% 5.5% 5.6% 5.8% 5.5% 4.5% 5.6% 5.4% Scholarships and fellowships 4.0% 3.1% 3.0% 2.9% 3.1% 3.0% 3.1% 3.7% 3.1% 3.6% Pension and OPEB 5.2% Total operating expenses 98.0% 97.8% 97.8% 97.5% 98.0% 98.6% 99.4% 99.1% 98.6% 98.9% Interest on capital asset related debt 1.9% 2.1% 2.1% 2.3% 1.9% 0.9% 0.7% 0.8% 0.9% 0.9% (Gain) loss on disposal of capital assets 0.1% 0.1% 0.1% 0.2% 0.0% 0.5% (0.2)% 0.0% 0.3% 0.1% Refunds to grantors 0.0% 0.0% 0.0% 0.0% 0.0% 0.0% 0.0% 0.1% 0.1% 0.0% Facilities and administrative remittances to the State 0.0% 0.0% 0.0% 0.0% 0.1% 0.0% 0.1% 0.0% 0.1% 0.1% Total nonoperating expenses 2.0% 2.2% 2.2% 2.5% 2.0% 1.4% 0.6% 0.9% 1.4% 1.1%Total expenses 100.0% 100.0% 100.0% 100.0% 100.0% 100.0% 100.0% 100.0% 100.0% 100.0%
For the Year ended June 30,(amounts expressed in thousands)
2019-20 2018-19 2017-18 2016-17 2015-16 2014-15 2013-14 2012-13 2011-12 2010-11Expenses: Compensationandemployeebenefits $ 648,704 $ 632,151 $ 617,355 $ 556,537 $ 513,401 $ 478,991 $ 444,913 $ 419,665 $ 384,703 $ 382,789 Services and supplies 316,186 319,566 278,228 265,758 267,423 262,955 243,893 219,962 198,747 182,049 Utilities 16,656 20,548 20,593 19,730 18,910 19,783 20,344 17,961 16,946 17,013 Depreciation 66,648 59,346 57,491 51,759 49,872 49,316 42,974 32,715 37,162 35,009 Scholarships and fellowships 47,700 33,579 30,668 27,269 27,726 25,411 23,846 26,380 20,942 23,402 Pension and OPEB 60,751 Total operating expenses 1,156,645 1,065,190 1,004,335 921,053 877,332 836,456 775,970 716,683 658,500 640,262 Interest on capital asset related debt 22,523 23,416 22,056 21,471 17,091 7,341 5,512 5,875 5,799 6,034 (Gain) loss on disposal of capital assets 1,655 1,540 826 1,965 340 4,343 (1,200) 254 2,255 791 Refunds to grantors 491 499 90 120 71 137 178 515 381 296 Facilities and administrative remittances to the State 269 280 252 317 450 375 413 339 386 450 Total nonoperating expenses 24,938 25,735 23,224 23,873 17,952 12,196 4,903 6,983 8,821 7,571Total expenses $ 1,181,583 $ 1,090,925 $ 1,027,559 $ 944,926 $ 895,284 $ 848,652 $ 780,873 $ 723,666 $ 667,321 $ 647,833
SCHEDULE OF EXPENSES BY USE
Source: Clemson University Comprehensive Annual Financial Reports.

~ 83 ~ For the Year Ended June 30,(percent of total expenses)
2019-20 2018-19 2017-18 2016-17 2015-16 2014-15 2013-14 2012-13 2011-12 2010-11Expenses: Instruction 23.9% 26.2% 26.1% 26.1% 26.0% 26.8% 27.8% 27.8% 27.1% 27.7% Research 15.9% 16.9% 16.7% 16.7% 16.4% 16.4% 17.1% 18.1% 18.5% 19.3% Public service 6.0% 6.8% 7.1% 7.3% 7.3% 7.8% 8.1% 8.3% 8.7% 9.1% Academic support 6.2% 6.2% 6.2% 5.7% 5.1% 5.6% 5.4% 5.4% 5.5% 5.5% Student services 4.0% 4.5% 4.4% 4.3% 4.1% 4.4% 4.6% 3.7% 3.7% 4.2% Institutional support 5.1% 4.8% 4.8% 4.4% 4.4% 5.0% 4.9% 4.8% 4.3% 3.9% Operation and maintenance of plant 6.6% 6.5% 7.3% 7.2% 7.9% 9.1% 8.2% 8.7% 7.1% 6.6% Scholarships and fellowships 3.9% 2.9% 2.8% 2.7% 2.9% 2.8% 2.8% 3.5% 2.9% 3.4% Auxiliary enterprises 15.5% 17.6% 16.8% 17.6% 18.3% 14.9% 15.0% 14.3% 15.2% 13.8% Depreciation 5.7% 5.4% 5.6% 5.5% 5.6% 5.8% 5.5% 4.5% 5.6% 5.4% Pension and OPEB 5.2% Interest on capital debt 1.9% 2.1% 2.1% 2.3% 1.9% 0.9% 0.7% 0.8% 0.9% 0.9% (Gain) loss on disposal of capital assets 0.1% 0.1% 0.1% 0.2% 0.0% 0.5% (0.2)% 0.0% 0.3% 0.1% Refunds to grantors 0.0% 0.0% 0.0% 0.0% 0.0% 0.0% 0.0% 0.1% 0.1% 0.0% Facilities and administrative remittances to State 0.0% 0.0% 0.0% 0.0% 0.1% 0.0% 0.1% 0.0% 0.1% 0.1%Total Expenses 100.0% 100.0% 100.0% 100.0% 100.0% 100.0% 100.0% 100.0% 100.0% 100.0%
For the Year Ended June 30,(amounts expressed in thousands)
2019-20 2018-19 2017-18 2016-17 2015-16 2014-15 2013-14 2012-13 2011-12 2010-11Expenses: Instruction $ 282,039 $ 283,898 $ 268,188 $ 246,756 $ 233,589 $ 227,482 $ 216,977 $ 201,731 $ 181,146 $ 178,644 Research 188,154 184,301 171,718 157,485 146,516 139,399 133,562 130,787 123,594 124,837 Public service 71,456 73,932 72,480 68,763 65,362 65,814 63,542 59,837 57,890 59,083 Academic support 73,424 67,447 63,197 53,723 46,018 47,633 42,231 38,926 36,715 35,321 Student services 47,265 48,969 45,581 40,678 36,540 37,345 35,578 26,694 24,685 27,282 Institutional support 59,972 52,493 49,605 41,381 39,267 42,388 38,019 34,640 28,925 25,490 Operation and maintenance of plant 78,212 71,087 75,139 68,442 70,664 77,156 64,116 62,754 47,505 42,905 Scholarships and fellowships 45,950 31,306 28,461 25,467 26,006 23,773 22,115 25,179 19,503 22,143 Auxiliary enterprises 182,774 192,410 172,475 166,599 163,498 126,150 116,856 103,420 101,375 89,548 Depreciation 66,648 59,346 57,491 51,759 49,872 49,316 42,974 32,715 37,162 35,009 Pension and OPEB 60,751 Interest on capital debt 22,523 23,417 22,056 21,471 17,091 7,341 5,512 5,875 5,799 6,034 (Gain) loss on disposal of capital assets 1,655 1,540 826 1,965 340 4,343 (1,200) 254 2,255 791 Refunds to grantors 491 499 90 120 71 137 178 515 381 296 Facilities and administrative remittances to the State 269 280 252 317 450 375 413 339 386 450Total expenses $ 1,181,583 $ 1,090,925 $ 1,027,559 $ 944,926 $ 895,284 $ 848,652 $ 780,873 $ 723,666 $ 667,321 $ 647,833
Source: Clemson University Comprehensive Annual Financial Reports.
SCHEDULE OF EXPENSES BY FUNCTION

~ 84 ~
SCHEDULE OF NET POSITION AND CHANGES IN NET POSITION
Source: Clemson University Comprehensive Annual Financial Reports.
For the Fiscal Year(amounts expressed in thousands)
2019-20 2018-19 2017-18 2016-17 2015-16 2014-15 2013-14 2012-13 2011-12 2010-11Total revenues (from schedule of revenues by source) $ 1,177,561 $ 1,136,718 $ 1,025,068 $ 970,843 $ 870,930 $ 793,988 $ 805,211 $ 754,777 $ 706,368 $ 717,738Total expenses (from schedule of expenses by use and function) (1,181,583) (1,090,925) (1,027,559) (944,926) (895,284) (848,652) (1,227,496) (723,666) (667,321) (647,833) Income (loss) before other revenues, expenses, gains or losses (4,022) 45,793 (2,491) 25,917 (24,354) (54,664) (422,285) 31,111 39,047 69,905State capital appropriations 10,900 9,850 — 5,240 15,886 4,457 9,397 9,612 9,468 6,643Capital grants and gifts 19,619 24,094 17,561 56,006 37,580 6,448 6,198 21,945 28,350 38,376Additions to permanent endowments 90 38 101 20 567 209 123 2,710 4,259 2,765 Total changes in net position 26,587 79,775 15,171 87,183 29,679 (43,550) (406,567) 65,378 81,124 117,689Net position, beginning 300,014 220,239 205,068 695,931 666,252 709,802 1,116,369 1,050,991 969,867 852,178 Net position, ending $ 326,601 $ 300,014 $ 220,239 $ 783,114 $ 695,931 $ 666,252 $ 709,802 $ 1,116,369 $ 1,050,991 $ 969,867
Net investment in capital assets $ 836,774 $ 814,368 $ 789,141 $ 770,325 $ 759,323 $ 680,331 $ 639,236 $ 604,854 $ 535,281 $ 462,861Restricted - expendable 209,643 183,297 150,070 144,460 99,062 126,834 184,828 192,765 201,484 221,593Restricted - nonexpendable 58,967 58,979 59,002 58,867 58,698 58,323 58,241 57,880 55,045 50,959Unrestricted (778,783) (756,630) (777,974) (190,538) (221,152) (199,236) (172,503) 260,870 259,181 234,454 Total $ 326,601 $ 300,014 $ 220,239 $ 783,114 $ 695,931 $ 666,252 $ 709,802 $ 1,116,369 $ 1,050,991 $ 969,867

~ 85 ~
SCHEDULE OF RATIOS OF OUTSTANDING DEBT
Note: Outstanding debt per student calculated using fall semester full-time equivalent student enrollment data for the last ten academic years (page 86). Source: Clemson University Comprehensive Annual Financial Reports, Clemson University Office of Institutional Research
For the Fiscal Year(amounts expressed in thousands except for outstanding debt per student)
2019-20 2018-19 2017-18 2016-17 2015-16 2014-15 2013-14 2012-13 2011-12 2010-11General Obligation Bonds $ 199,360 $ 209,600 $ 213,380 $ 150,350 $ 104,435 $ 110,615 $ 116,770 $ 88,420 $ 93,075 $ 99,610Plant Improvement Bonds — — — — — — — — — —Revenue Bonds 267,570 274,470 281,050 289,205 295,600 110,860 26,585 32,350 37,620 42,090Athletic Facilities Revenue Bonds 129,385 133,730 137,900 130,605 134,450 118,875 22,680 24,150 25,600 30,045 Subtotal bonds payable 596,315 617,800 632,330 570,160 534,485 340,350 166,035 144,920 156,295 171,745Unamortized bond premiums 44,246 46,896 48,761 36,097 33,984 20,425 9,387 7,145 8,078 4,954 Total bonds payable 640,561 664,696 681,091 606,257 568,469 360,775 175,422 152,065 164,373 176,699Notes Payable — — — — — — — 150 475 964Capital Lease Obligations 11,142 11,688 11,991 11,990 12,967 13,993 14,963 15,911 — — Total outstanding debt $ 651,703 $ 676,384 $ 693,082 $ 618,247 $ 581,436 $ 374,768 $ 190,385 $ 168,126 $ 164,848 $ 177,663
Full-time equivalent students 24,324 23,663 23,215 22,307 21,654 20,823 20,202 19,800 18,980 18,417
Outstanding debt per student $ 26,793 $ 28,584 $ 29,855 $ 27,715 $ 26,851 $ 17,998 $ 9,424 $ 8,491 $ 8,685 $ 9,647

~ 86 ~
Athletic Facilities Revenue Bonds
Fiscal YearEnded June 30
AthleticRevenues
AthleticOperatingExpenses
Net AthleticRevenues
AdmissionsFee
Total RevenueAvailable forDebt Service
Debt Service Requirements Principal Interest Total
Coverage Ratio
2020 $140,679 $121,802 $18,877 $2,208 $21,085 $4,345 $4,826 $9,171 2.302019 145,167 121,902 23,265 2,252 25,517 4,170 5,002 9,172 2.782018 128,631 109,270 19,361 2,179 21,540 4,005 4,970 8,975 2.402017 117,150 101,322 15,828 2,214 18,042 3,845 4,946 8,791 2.052016 112,996 92,274 20,722 1,927 22,649 3,300 4,752 8,052 2.812015 85,185 77,052 8,133 2,046 10,179 1,380 1,616 2,996 3.402014 82,087 72,762 9,325 667 9,992 1,470 802 2,272 4.402013 76,099 65,588 10,511 2,031 12,542 1,450 953 2,403 5.222012 73,151 66,988 6,163 2,015 8,178 975 1,054 2,029 4.032011 56,551 54,441 2,110 1,980 4,090 1,725 1,392 3,117 1.31
SCHEDULE OF BOND COVERAGELast Ten Fiscal Years(amounts in thousands)
General Obligation Bonds
Fiscal Year Ended June 30
Tuition andMatriculation
Fees
Total RevenueAvailable forDebt Service
Debt Service Requirements Principal Interest Total
Coverage Ratio
2020 $ 48,324 $48,324 $10,240 $6,750 $16,990 2.84 2019 43,244 43,244 9,415 7,035 16,450 2.63 2018 42,066 42,066 6,950 5,553 12,503 3.36 2017 35,823 35,823 6,480 5,058 11,538 3.10 2016 33,740 33,740 6,180 4,217 10,397 3.25 2015 29,579 29,579 6,155 4,544 10,699 2.76 2014 27,487 27,487 4,680 3,484 8,164 3.37 2013 24,703 24,703 4,655 3,823 8,478 2.91 2012 22,440 22,440 4,690 3,438 8,128 2.76 2011 21,028 21,028 4,310 2,746 7,056 2.98

~ 87 ~
Note: The revenue bonds are secured by revenues from five sources: dining services, vending operations, the university bookstore, student housing and parking.Source: Clemson University Comprehensive Annual Financial Reports
Revenue Bonds
Fiscal YearEnded June 30 Revenues
Operating Expenses
DefinedNet RevenueAvailable forDebt Service
Debt Service Requirements Principal Interest Total
Coverage Ratio
2020 $ 77,834 $46,189 $31,645 $6,900 $10,402 $17,302 1.832019 90,776 52,687 38,089 6,580 10,729 17,309 2.202018 70,107 45,143 24,964 8,155 10,819 18,974 1.322017 68,185 42,855 25,330 6,395 10,970 17,365 1.462016 62,317 39,103 23,214 6,260 7,917 14,177 1.642015 58,653 38,667 19,986 6,010 890 6,900 2.902014 56,749 36,310 20 439 5,765 691 6,456 3.172013 55,452 35,233 20,219 5,270 1,137 6,407 3.16 2012 50,466 31,636 18,830 5,320 1,968 7,288 2.582011 49,363 32,057 17,306 4,810 1,875 6,685 2.59

~ 88 ~
ADMISSIONS, ENROLLMENT AND DEGREE STATISTICSLast Ten Academic Years
Admissions — Freshman Applied,
Accepted and Enrolled
NOTES: Applications Applied, Accepted and Enrolled for 2015 and before include transfer students. Applications for 2016 and forward include only Freshman entering Clemson. The National College Board changed the scoring for 2017 SAT's from Verbal and Math to Reading/Writing and Math from a 1600 scale to a 2400 scale which increases the total scores.
2019 2018 2017 2016 2015 2014 2013 2012 2011 2010Admissions-Freshman Accepted as a percentage of applications 51.0% 47.0% 47.0% 51.0% 51.0% 52.0% 57.0% 58.0% 60.0% 58.0% Enrolled as a percentage of accepted 26.0% 28.0% 29.0% 31.0% 30.0% 33.0% 31.0% 32.0% 29.0% 31.0% SAT scores-total 1318 1,307 1,302 1,242 1,251 1,252 1,246 1,246 1,229 1,231 Verbal 654 649 650 611 613 611 609 610 599 599 Math 664 658 652 631 638 641 637 636 630 632 South Carolina average SAT score-total 1030 1,070 1,064 987 978 978 971 969 972 979
2019 2018 2017 2016 2015 2014 2013 2012 2011 2010Enrollment Undergraduate and graduate FTE 24,324 23,663 23,215 22,307 21,654 20,823 20,202 19,800 18,980 18,417 Undergraduate and graduate headcount 25,822 24,932 24,387 23,406 22,698 21,857 21,303 20,768 19,914 19,453 Percentage of men 50.2% 50.9% 51.3% 52.1% 52.9% 53.5% 54.3% 53.9% 54.3% 54.3% Percentage of women 49.8% 49.1% 48.7% 47.9% 47.1% 46.5% 45.7% 46.1% 45.7% 45.7% Percentage of black 6.1% 6.3% 6.3% 6.6% 6.3% 6.2% 6.0% 6.1% 6.1% 6.1% Percentage of white 76.1% 77.2% 78.5% 77.8% 77.6% 77.2% 76.6% 78.1% 78.2% 78.3% Percentage of other 17.8% 16.5% 15.2% 15.7% 16.1% 16.6% 17.4% 15.8% 15.7% 15.6%
29,0
70
28,8
45
26,2
43
23,5
06
22,3
96
20,7
57
18,6
04
18,5
00
17,0
16
16,8
65
14,9
00
13,6
13
12,3
81
11,8
90
11,4
82
10,6
92
10,6
45
10,7
06
10,2
15
9,72
43,93
2
3,78
9
3,64
9
3,68
4
3,44
7
3,47
5
3,28
9
3,46
3
2,93
3
3,01
6
0
5,000
10,000
15,000
20,000
25,000
30,000
35,000
2019 2018 2017 2016 2015 2014 2013 2012 2011 2010
Applications Accepted Enrolled
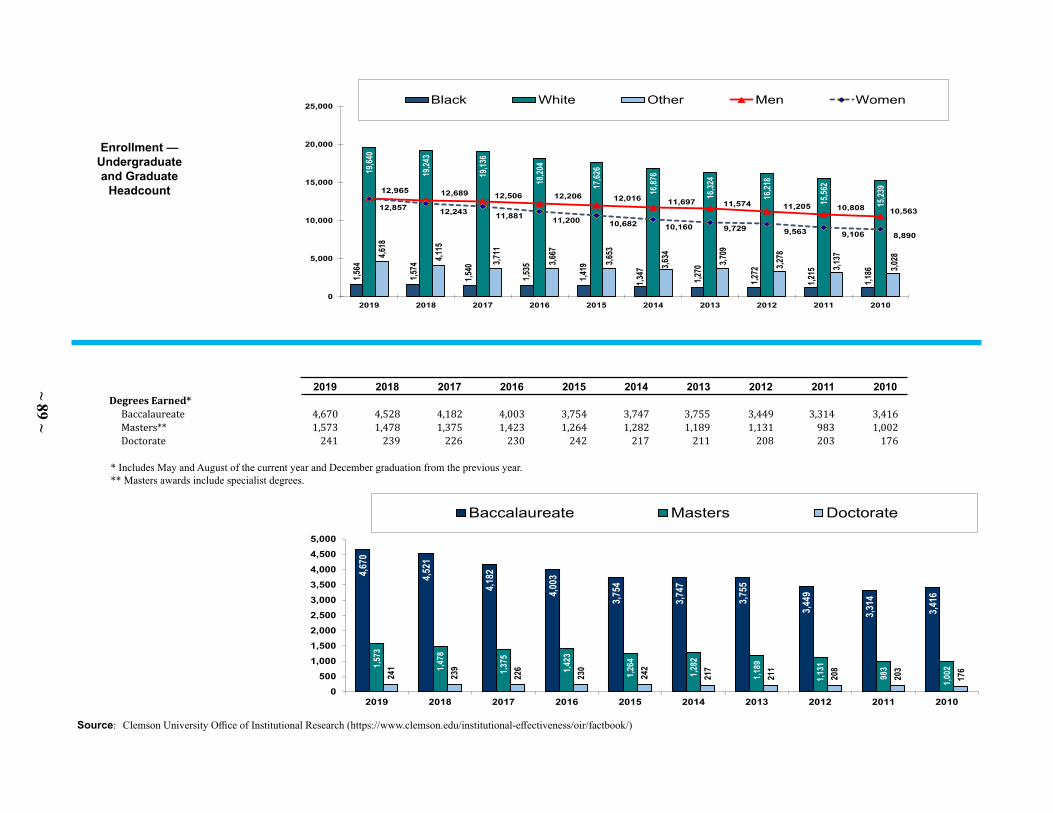
~ 89 ~
Enrollment —Undergraduate and Graduate
Headcount
Source: Clemson University Office of Institutional Research (https://www.clemson.edu/institutional-effectiveness/oir/factbook/)
2019 2018 2017 2016 2015 2014 2013 2012 2011 2010 Degrees Earned* Baccalaureate 4,670 4,528 4,182 4,003 3,754 3,747 3,755 3,449 3,314 3,416 Masters** 1,573 1,478 1,375 1,423 1,264 1,282 1,189 1,131 983 1,002 Doctorate 241 239 226 230 242 217 211 208 203 176
* Includes May and August of the current year and December graduation from the previous year. ** Masters awards include specialist degrees.
1,564
1,574
1,540
1,535
1,419
1,347
1,270
1,272
1,215
1,186
19,64
0
19,24
3
19,13
6
18,20
4
17,62
6
16,87
6
16,32
4
16,21
8
15,56
2
15,23
9
4,618
4,115
3,711
3,667
3,653
3,634 3,709
3,278
3,137
3,028
12,965 12,689 12,506 12,206 12,016 11,697 11,574 11,205 10,808 10,563 12,857 12,243 11,881 11,200 10,682 10,160 9,729 9,563 9,106 8,890
0
5,000
10,000
15,000
20,000
25,000
2019 2018 2017 2016 2015 2014 2013 2012 2011 2010
Black White Other Men Women
4,670
4,521
4,182
4,003
3,754
3,747
3,755
3,449
3,314
3,416
1,573
1,478
1,375
1,423
1,264
1,282
1,189
1,131
983
1,002241
239
226
230
242
217
211
208
203
176
0500
1,0001,5002,0002,5003,0003,5004,0004,5005,000
2019 2018 2017 2016 2015 2014 2013 2012 2011 2010
Baccalaureate Masters Doctorate

~ 90 ~
UNDERGRADUATE AVERAGE ANNUAL TUITION AND FEESClemson University in Comparison to Ten Peer Land-Grant InstitutionsLast ten fiscal years
Undergraduate Tuition and Fees - Resident — FY 2019-2020
For the Fiscal Year2019-20 2018-19 2017-18 2016-17 2015-16 2014-15 2013-14 2012-13 2011-12 2010-11
Institution - Resident Auburn University $11,492 $ 11,279 $ 10,968 $ 10,696 $ 10,424 $ 10,200 $ 9,852 $ 9,446 $ 8,698 $ 7,900 Clemson University 15,558 14,970 14,712 14,318 13,882 13,446 13,054 12,774 12,404 11,908 Georgia Institute of Technology 12,682 12,424 12,418 12,212 12,204 11,394 10,650 10,098 9,652 8,716 Iowa State University 9,320 8,988 8,636 8,219 7,736 7,731 7,726 7,726 7,486 6,997 Michigan State University 14,460 14,521 14,460 14,063 13,560 13,200 12,863 12,623 12,203 11,153 Mississippi State University 8,910 8,650 8,318 7,780 7,502 7,140 6,772 6,264 5,805 5,461 North Carolina State University 9,101 9,101 9,058 8,880 8,581 8,296 8,206 7,788 7,018 6,529 Purdue University 9,992 9,992 9,992 10,002 10,002 10,002 9,992 9,900 9,478 9,070 Texas A & M University - Main Campus 12,153 10,968 10,403 10,030 9,428 9,179 8,506 8,506 8,421 8,387 University of California - Davis 14,490 14,462 14,419 14,047 13,952 13,896 13,896 15,257 15,123 13,080 Virginia Tech 13,691 13,620 13,230 12,852 12,485 12,017 11,455 10,923 10,509 9,459
Aubu
rn U
nive
rsity
$11,
492
Clem
son
Unive
rsity
$15,
558
Geor
gia In
stitu
te o
f Tec
hnol
ogy
$12,
682
Iow
a Sta
te U
nive
rsity
$9,3
20
Mich
igan
Stat
e Un
ivers
ity$1
4,46
0
Miss
issip
pi St
ate
Unive
rsity
$8,9
10
North
Car
olin
a Sta
te
Unive
rsity
$9,1
01
Purd
ue U
nive
rsity
$9,9
92
Texa
s A &
M U
nive
rsity
-M
ain
Cam
pus
$12,
153
Unive
rsity
of C
alifo
rnia
-Da
vis$1
4,49
0
Virg
inia
Tech
$13,
691
$0
$2,000
$4,000
$6,000
$8,000
$10,000
$12,000
$14,000
$16,000
$18,000

~ 91 ~
For the Fiscal Year2019-20 2018-19 2017-18 2016-17 2015-16 2014-15 2013-14 2012-13 2011-12 2010-11
Institution - Non Resident Auburn University $ 31,124 $ 30,524 $ 29,640 $ 28,840 $ 28,040 $ 27,384 $ 26,364 $ 22,977 $ 23,290 $ 21,916 Clemson University 38,550 36,724 35,654 34,200 32,800 31,462 30,488 29,700 28,562 27,420 Georgia Institute of Technology 33,794 33,020 33,014 32,404 32,396 30,698 29,954 29,402 27,862 26,926 Iowa State University 24,508 23,392 22,472 21,583 20,856 20,617 20,278 19,838 19,358 18,563 Michigan State University 39,766 39,826 39,405 37,890 36,360 34,965 33,750 32,580 31,148 29,108 Mississippi State University 23,950 23,250 22,358 20,900 20,142 18,478 16,960 15,828 14,670 13,801 North Carolina State Univeristy 29,220 28,444 27,406 26,399 24,932 23,551 21,661 20,953 19,853 19,064 Purdue University 30,794 28,794 28,794 28,804 28,804 28,804 28,794 28,702 27,646 26,622 Texas A & M University - Main Campus 38,602 36,636 37,154 30,208 28,021 26,356 25,126 25,036 23,811 22,817 University of California - Davis 44,244 43,454 42,433 40,729 38,660 36,774 36,774 38,135 38,001 35,959 Virginia Tech 32,835 31,908 31,014 29,975 29,129 28,048 27,211 25,915 24,480 23,217
Source: CollegeCalc (https://www.collegecalc.org/colleges) and College Tuition Compare (https://www.collegetuitioncompare.com)These figures are for undergraduate first-time, full-time students with an academic year of 24 semester hours or 30 quarter hours.
Undergraduate Tuition and Fees - Non Resident — FY 2019-2020Au
burn
Univ
ersit
y$3
1,124
Clems
on U
niver
sity
$38,5
50
Geor
gia In
stitu
te of
Tech
nolog
y$3
3,794
Iowa S
tate
Univ
ersit
y$2
4,508
Mich
igan S
tate
Univ
ersit
y$3
9,766
Miss
issipp
i Sta
te U
niver
sity
$23,9
50
North
Caro
lina S
tate
Univ
ersit
y$2
9,220
Purd
ue U
niver
sity
$30,7
94
Texa
s A &
M U
niver
sity -
Main
Camp
us$3
8,602
Unive
rsity
of Ca
liforn
ia -D
avis
$44,2
44
Virg
inia T
ech
$32,8
35
$0
$5,000
$10,000
$15,000
$20,000
$25,000
$30,000
$35,000
$40,000
$45,000
$50,000

~ 92 ~
FACULTY AND STAFF STATISTICSLast Ten Fiscal Years
*Full-time, permanent, instructional in Academic departments (AAUP definition)
Source: Clemson University Office of Institutional Research (https://www.clemson.edu/institutional-effectiveness/oir/factbook/) Note: Full-time includes all regular full-time employees, and part-time includes all part-time and all temporary employees.
Numbers are Based on the October 1st Freeze Date from the Clemson University Business SystemFor the Fiscal Year
2019 2018 2017 2016 2015 2014 2013 2012 2011 2010 Faculty Part-time 125 122 132 287 244 217 172 196 215 248 Full-time 1,516 1,468 1,415 1,199 1,187 1,171 1,157 1,111 1,110 1,150 Percentage tenured 44.5% 43.5% 41.6% 43.5% 43.4% 45.3% 46.7% 46.7% 43.8% 42.3%
Staff and administrators with faculty rank Part-time 260 245 282 1,085 982 921 856 783 682 668 Full-time 3,663 3,557 3,439 2,651 2,650 2,591 2,542 2,475 2,388 2,486
Total employees Part-time 385 367 414 1,372 1,226 1,138 1,028 979 897 916 Full-time 5,179 5,025 4,854 3,850 3,837 3,762 3,699 3,586 3,498 3,636
Students per full-time Faculty 17.0 17.0 17.2 19.5 19.1 18.7 18.4 18.7 17.9 16.9 Staff 7.0 7.0 7.1 8.8 8.6 8.4 8.4 8.4 8.3 7.8
Average annual faculty salary* $ 104,678 $ 99,157 $ 95,413 $ 94,510 $ 92,110 $ 91,984 $ 89,788 $ 89,474 $ 80,200 $ 78,257

~ 93 ~
For the Fiscal Year2019-20 2018-19 2017-18 2016-17 2015-16 2014-15 2013-14 2012-13 2011-12 2010-11
Academic buildings: Net assignable square feet (in thousands) 1,477,334 1,362,528 1,347,951 1,347,951 1,326,740 1,370,476 1,427,870 1,391,955 1,292,391 1,286,350Administrative and support buildings: Net assignable square feet (in thousands) 587,995 762,523 589,243 589,243 579,205 534,617 533,047 570,867 529,590 615,539Laboratories: Net assignable square feet (in thousands) 588,478 605,671 604,448 604,448 597,556 597,540 674,059 604,045 644,171 598,763Auxiliary and independent operations buildings: Net assignable square feet (in thousands) 2,424,461 1,954,624 1,692,580 1,692,580 1,644,622 1,644,622 1,719,202 1,726,207 1,618,671 1,527,397Student housing: Residence halls 22 22 20 20 23 23 23 23 23 23 Suites 5 5 5 5 3 3 3 3 3 3 Apartments 8 8 4 4 4 4 4 4 4 4 Units available 7,598 7,579 6,473 6,469 6,236 6,275 6,248 6,162 6,080 6,074 Units in use 7,516 7,401 6,325 6,469 6,122 6,140 6,113 6,303 5,724 5,845 Percent occupancy 98.9% 97.7% 97.7% 100.0% 98.2% 97.8% 97.8% 102.3% 94.1% 96.2%Dining facilities: Locations 22 22 19 19 17 17 17 17 17 17 Average daily customers 21,216 21,120 19,456 18,701 18,316 18,020 17,746 17,667 17,200 16,277Parking facilities: Parking spaces available 14,403 14,290 14,404 12,784 12,125 12,457 12,303 12,159 12,533 11,939 Parking permits issued to students 15,241 15,934 15,834 15,812 15,625 17,188 16,007 15,547 16,294 15,379 Parking permits issued to faculty/staff 5,013 4,912 4,976 5,106 5,001 5,093 5,069 4,973 4,814 4,983
SCHEDULE OF CAPITAL ASSET INFORMATION
Sources: Building square footage Clemson University Office of Institutional Research Student housing Clemson University Housing Dining facilities Clemson University Business Services Parking facilities Clemson University Parking Services
Last Ten Fiscal Years

~ 94 ~
DEMOGRAPHIC STATISTICSState of South Carolina
(a) Source: U.S. Board of Economic Analysis(b) Source: U.S. Board of Economic Analysis(c) Source: U.S Board of Economic Analysis(d) Source: U.S. Department of Labor
Year
Personal Incomeas of
June 30 (a)
Populationat
July 1 (b)
PerCapita
Income (c)
Average Annual Unemployment Rate (d)
2019 233,308,826,196 5,148,714 $45,314 2.8%
2018 217,275,251,000 5,084,127 42,736 3.4%
2017 203,087,627,000 5,024,369 40,421 4.3%
2016 198,762,651,000 4,987,575 39,852 4.8%
2015 186,285,746,000 4,869,991 38,252 6.0%
2014 178,485,001,000 4,832,482 36,934 6.6%
2013 169,282,713,000 4,774,839 35,453 7.6%
2012 161,595,079,000 4,723,723 35,056 9.1%
2011 159,747,330,000 4,673,348 34,183 10.3%
2010 151,536,772,000 4,635,835 32,688 11.2%

~ 95 ~
TEN LARGEST EMPLOYERSState of South CarolinaLatest Completed Calendar Year and Ten Years Prior(Listed Alphabetically)
Source: South Carolina Department of Employment and Workforce for 2009 and 2019Note: Due to confidentiality issues, the number of employees for each company is not available, and the employers are listed alphabetically rather than in order of size.
2019 2009 BMW Manufacturing Corp. Bi-Lo, Inc.
Department of Defense Blue Cross Blue Shield of South Carolina
Medical University of SC Hospital Authroity Department of Defense
Michelin North America, Inc Greenville Helath System.
PRISMA Health Midlands Michelin North America, Inc.
School District of Greenville County. Palmetto Health
Spartanburg Regional Medical Center School District of Greenville County
University of South Carolina University of South Carolina
UpstateAffiliateOrganization U.S. Postal Service
Wal-Mart Associates, Inc. Wal-Mart Associates, Inc.


Supplementary Informationto the Financial Statements
(unaudited)

~ 98 ~
CLEMSON UNIVERSITYSCHEDULE OF PLEDGED NET REVENUES AUXILIARY REVENUE BONDS (SERIES 2005 , 2015 and 2015B)For the year ended June 30, 2020
Dining Vending Parking Description Services Operations Bookstore Services Housing Total Revenues: Student meal plans $ 22,689,748 $ — $ — $ — $ — $ 22,689,748 Other 1,860,968 6,058 — 17,936 35,237 1,920,199 Residence halls — — — — 45,953,403 45,953,403 Campus vending machines — 165,039 — — — 165,039 ATM rental — 141,088 — 9,963 — 151,051 Contract revenue 87,320 — 1,000,928 188,176 — 1,276,424 Parking permits — — — 2,583,275 — 2,583,275 Transit fees — — — 1,904,026 — 1,904,026 Parking citations — — — 415,636 — 415,636 Meter revenue — — — 514,314 — 514,314 Investment income 57,858 1,885 9,054 17,221 175,276 261,294 Total revenues 24,695,894 314,070 1,009,982 5,650,547 46,163,916 77,834,409
Expenses: Salaries 430,813 — 82,156 1,287,441 7,349,182 9,149,592 Fringebenefits 189,336 — 36,113 554,326 2,661,255 3,441,030 Travel 514 — — 12,173 128,104 140,791 Contractual services 16,842,911 — 1,800 2,321,539 1,192,302 20,358,552 Repairs 411,890 44 — 110,563 1,220,627 1,743,124 Telecommunications — — — 10,629 113,951 124,580 Heat, light, and power 1,394,923 — 25,265 68,383 3,434,076 4,922,647 Water, sewer and garbage 199,402 — 2,325 48,079 674,764 924,570 Rents 29,347 — — 37,213 25,363 91,923 Supplies and materials 254,270 — — 118,621 991,812 1,364,703 Insurance 22,641 417 — 30,469 508,196 561,723 Other operating expenses 551,561 1,130 9,214 513,376 2,063,380 3,138,661 Capital outlay 93,381 — — — 133,717 227,098 Total expenses 20,420,989 1,591 156,873 5,112,812 20,496,729 46,188,994 Net revenues $ 4,274,905 $ 312,479 $ 853,109 $ 537,735 $ 25,667,187 $ 31,645,415

~ 99 ~
CLEMSON UNIVERSITYSCHEDULE OF PLEDGED NET REVENUESATHLETIC FACILITIES REVENUE BONDS (SERIES 2012, 2014A, 2014B, 2014C, 2015, 2015B and 2018A)For the year ended June 30, 2020
Description Football BasketballOtherSports
Non ProgramSpecific Total
Revenues: Ticket sales $ 27,653,946 $ 1,521,974 $ 691,127 $ — $ 29,867,047 Direct institutional support 1,947,627 666,824 3,312,186 — 5,926,637 Guarantees and away game sales — — 13,000 — 13,000 Contributions 5,700,576 1,573,931 5,425,892 41,434,383 54,134,782 In kind car leases 64,388 22,851 14,500 39,850 141,589 Media rights - broadcast, television, radio and internet 13,402,632 4,467,544 — — 17,870,176 NCAA distributions including all tournament revenues 993,010 331,003 — — 1,324,013 Conference distributions including all tournament revenues 7,804,265 1,586,523 171,949 859,448 10,422,185 Program sales, concessions, novelty sales and parking 978,434 87,374 68,591 307,136 1,441,535 Royalties, advertisements and sponsorships 960,000 343,000 1,017,000 10,239,474 12,559,474 Sports camp revenues (615) — — — (615) Endowment and investment income 28,709 27,005 14,476 173,253 243,443 Other revenue — — 63,750 242,492 306,242 Bowl revenues 6,429,482 — — — 6,429,482 Total revenues 65,962,454 10,628,029 10,792,471 53,296,036 140,678,990
Operating Expenditures: Athletic student aid 6,254,276 1,958,307 8,752,554 1,180,651 18,145,788 Guarantees 1,360,000 614,500 48,943 — 2,023,443 Coachingsalaries,benefitsandbonusespaidbytheinstitutionandrelatedentities 14,793,036 4,535,390 5,583,017 — 24,911,443 Supportstaff/administrativesalaries,benefitsandbonusespaidbytheinstitutionand
related entities 7,174,025 1,214,209 1,053,345 16,711,452 26,153,031 Recruiting 1,553,788 293,988 502,996 — 2,350,772 Team travel 2,442,808 1,171,248 1,455,384 — 5,069,440 Equipment, uniforms and supplies 1,797,584 375,323 1,320,289 393,123 3,886,319 Game expenses 4,270,842 684,429 578,178 16,063 5,549,512 Fund raising, marketing and promotion 275,908 307,107 134,628 5,110,628 5,828,271 Sports camp expenses 3,128 — — — 3,128 Spirit group expenses — — — 148,390 148,390 Direct facilities, maintenance and rental 2,187,400 762,646 766,181 2,580,145 6,296,372 Medical and insurance expenses 90,441 33,372 232,950 494,545 851,308 Dues and membership expenses 7,100 3,047 8,958 63,441 82,546 Student-Athlete meals (non-travel) 1,781,975 150,120 187,035 258,986 2,378,116 Other operating expenses 5,100,575 711,229 672,549 4,143,346 10,627,699 Bowl expenses 5,466,758 — — — 5,466,758 Bowl bonuses 2,030,092 — — — 2,030,092 Total operating expenditures 56,589,736 12,814,915 21,297,007 31,100,770 121,802,428
Net Revenues $ 9,372,718 $ (2,186,886) $ (10,504,536) $ 22,195,266 $ 18,876,562

~ 100 ~
DescriptionClemson
University
ClemsonUniversity
Foundation
ClemsonUniversity
LandStewardshipFoundation IPTAY Subtotal Eliminations
FY20Total
FY19Total
Assets:: Current Assets: Cash and cash equivalents $ 328,767,289 $ 67,700,806 $ 3,886,829 $ 9,608,778 $ 409,963,702 $ — $ 409,963,702 $ 382,536,610 Restricted Assets - Current: Cash and cash equivalents 219,616,650 — — — 219,616,650 — 219,616,650 266,200,289 Accounts receivable 41,601,588 7,111,702 75,960 20,341 48,809,591 (2,863,445) 45,946,146 32,048,585 Grants and contracts receivable 24,820,370 — — 24,820,370 — 24,820,370 26,865,858 Contributions receivable, net 854,003 — 25,553,781 26,407,784 — 26,407,784 50,476,224 Interest and income receivable 2,939,129 — — — 2,939,129 — 2,939,129 2,836,579 Student loans receivable 3,382 — — — 3,382 — 3,382 3,382 Notes receivable — — — — — — — — Inventories 2,417,897 — — — 2,417,897 — 2,417,897 3,065,126 Prepaid items 8,833,862 — 130,000 — 8,963,862 — 8,963,862 12,139,640 Other current assets 1,986,705 — — — 1,986,705 — 1,986,705 4,768,681 Total current assets 631,840,875 74,812,508 4,092,789 35,182,900 745,929,072 (2,863,445) 743,065,627 780,940,974
Noncurrent Assets: Notes receivable 201,271,023 201,601,857 — — 402,872,880 (201,601,857) 201,271,023 207,692,844 Lease obligation receivable — — 10,169,491 — 10,169,491 (10,743,899) (574,408) — Contributions receivable, net 732,484 37,237,188 — — 37,969,672 (84,360,217) (46,390,545) 1,160,076 Investments 4,417,338 618,783,826 46,659,274 69,586,016 739,446,456 (20,000,000) 719,446,454 617,687,320 Cash surrender value of life insurance — 2,264,151 — — 2,264,151 — 2,264,151 2,058,456 Restricted Assets - Noncurrent Cash and cash equivalents 2,169,412 — — — 2,169,412 — 2,169,412 2,562,769 Student loans receivable 4,958,056 — — — 4,958,056 — 4,958,056 6,171,497 Other assets — 420,084 635,270 — 1,055,354 — 1,055,354 3,747,055 Real estate held for resale — 11,900 11,926,595 — 11,938,494 — 11,938,495 11,980,036 Capital assets, not being depreciated 204,660,946 — — — 204,660,946 — 204,660,946 143,499,595 Capital assets, net of accumulated depreciation 1,256,814,481 9,216,723 — — 1,266,031,204 — 1,266,031,204 1,267,349,103 Total noncurrent assets 1,675,023,740 869,535,729 69,390,630 69,586,016 2,683,536,116 (316,705,973) 2,366,830,142 2,263,908,751 Total assets 2,306,864,615 944,348,237 73,483,419 104,768,916 3,429,465,188 (319,569,418) 3,109,895,769 3,044,849,725
Deferred outflows of resources: Deferred losses on bond refunding 4,133,947 — — — 4,133,947 — 4,133,947 4,585,005 Deferredoutflowsonnetpensionliability 98,703,456 — — — 98,703,456 — 98,703,456 102,552,455 Deferredoutflowsonnetretireehealthbenefitsliability 95,374,753 — — — 95,374,753 — 95,374,753 38,612,311
Totaldeferredoutflowsofresources 198,212,156 — — — 198,212,156 — 198,212,156 145,749,771
Total assets and deferred outflows of resources $ 2,505,076,771 $ 944,348,237 $ 73,483,419 $ 104,768,916 $ 3,627,677,343 $ (319,569,418) $ 3,308,107,925 $ 3,190,599,496
CLEMSON UNIVERSITY REPORTING ENTITYCOMBINED STATEMENT OF NET/FINANCIAL POSITIONJune 30, 2020

~ 101 ~
DescriptionClemson
University
ClemsonUniversity
Foundation
ClemsonUniversity
LandStewardshipFoundation IPTAY Subtotal Eliminations
FY20Total
FY19Total
Liabilities: Current Liabilities Accounts and retainages payable $ 25,568,575 $ 895,716 $ 60,449 $ 6,199,137 $ 32,723,877 $ (1,930,973) $ 30,792,904 $ 37,421,244 Accrued payroll and related liabilities 25,171,902 — — — 25,171,902 — 25,171,902 24,085,043 Accrued compensated absences and related liabilities 15,487,250 — — — 15,487,250 — 15,487,250 14,561,607 Accrued interest payable 4,381,104 — 27,363 — 4,408,467 — 4,408,467 4,574,377 Unearned revenues 43,762,380 4,000,000 1,996,868 — 49,759,248 — 49,759,248 59,008,528 Bonds payable 24,054,543 — — — 24,054,543 — 24,054,543 24,135,558 Capital leases payable 933,481 — — — 933,481 (574,408) 359,073 275,835 Deposits 761,682 — — — 761,682 — 761,682 1,047,747 Funds held for others 773,260 — 28,495 — 801,755 — 801,755 1,159,172 Total current liabilties 140,894,177 4,895,716 2,113,175 6,199,137 154,102,205 (2,505,381) 151,596,824 166,269,111
Noncurrent Liabilities: Accrued compensated absences and related liabilities 15,955,750 — — — 15,955,750 — 15,955,750 13,794,393 Due to the University — 201,601,857 — — 201,601,857 (201,601,857) — — Deposits 4,129,185 — — — 4,129,185 — 4,129,185 — Funds held for others 5,184,375 84,360,217 20,932,472 — 110,477,064 (105,292,689) 5,184,375 6,951,851 Net pension liability 672,314,429 — — — 672,314,429 — 672,314,429 638,844,884 Netretireehealthbenefitsliability 646,324,692 — — — 646,324,692 — 646,324,692 588,163,078 Bonds payable 616,506,356 — — — 616,506,356 — 616,506,356 640,560,899 Capital leases payable 10,208,988 — — — 10,208,988 (10,169,491) 39,497 668,171 Notes payable — — 21,090,538 — 21,090,538 — 21,090,538 21,723,980 Annuities payable — 3,538,601 — — 3,538,601 — 3,538,601 3,881,688 Total noncurrent liabilities 1,970,623,775 289,500,675 42,023,010 — 2,302,147,460 (317,064,037) 1,985,083,423 1,914,588,944 Total liabilities 2,111,517,952 294,396,391 44,136,185 6,199,137 2,456,249,665 (319,569,418) 2,136,680,247 2,080,858,055
Deferred inflows of resources: Deferredinflowsonnetpensionliability 4,924,649 — — — 4,924,649 — 4,924,649 4,189,669 Deferredinflowsonnetretireehealthbenefitsliability 62,033,143 — — — 62,033,143 — 62,033,143 48,114,018
Totaldeferredinflowsofresources 66,957,792 — — — 66,957,792 — 66,957,792 52,303,687
Total liabilities and deferred inflows of resources $ 2,178,475,744 $ 294,396,391 $ 44,136,185 $ 6,199,137 $2,523,207,457 $ (319,569,418) $ 2,203,638,039 $ 2,133,161,742
Net Position Net investment in capital assets $ 836,774,410 $ 9,216,723 $ — $ — $ 845,991,133 $ — $ 845,991,133 823,621,219 Restricted for non expendable purposes: Scholarships and fellowships 58,967,333 — — — 58,967,333 — 58,967,333 58,978,506 Restricted for expendable purposes: Scholarships and fellowships 22,973,576 609,797,033 — — 632,770,609 — 632,770,609 616,936,520 Research 585,505 — — — 585,505 — 585,505 491,893 Instructional/departmental use 15,527,461 — — — 15,527,461 — 15,527,461 12,659,930 Loans 2,269,567 — — — 2,269,567 — 2,269,567 2,185,987 Capital projects 155,337,633 — — — 155,337,633 — 155,337,633 133,638,729 Debt service 12,948,982 — — — 12,948,982 — 12,948,982 11,729,406 Unrestricted (778,783,440) 30,938,090 29,347,234 98,569,779 (619,928,337) — (619,928,337) (602,804,436)
Total net position $ 326,601,027 $ 649,951,846 $ 29,347,234 $ 98,569,779 $ 1,104,469,886 $ — $ 1,104,469,886 $ 1,057,437,754

~ 102 ~
CLEMSON UNIVERSITY REPORTING ENTITYCOMBINED STATEMENT OF REVENUES, EXPENSES, ACTIVITIES AND CHANGES IN NET POSITIONFor the year ended June 30, 2020
DescriptionClemson
University
ClemsonUniversity
Foundation
ClemsonUniversity
LandStewardshipFoundation IPTAY Subtotal Eliminations
FY20Total
FY19Total
Revenues: Operating Revenues:
Student tuition and fees (net of scholarship allowances of $106,681,831) $ 466,846,134 $ — $ — $ — $ 466,846,134 $ — $ 466,846,134 $ 425,218,585
Federal grants and contracts 95,748,885 — — — 95,748,885 — 95,748,885 90,469,102 State grants and contracts 85,256,061 — — — 85,256,061 — 85,256,061 78,533,200 Local grants and contracts 1,155,889 — — — 1,155,889 — 1,155,889 967,895 Nongovernmental grants and contracts 11,733,331 — — — 11,733,331 — 11,733,331 12,289,778 Sales and services of educational and other activities 18,316,984, — — — 18,316,984 — 18,316,984 22,586,900 Sales and services of auxiliary enterprises - pledged
for revenue bonds (net of scholarship allowances of $15,930,413) 142,137,170 — — — 142,137,170 — 142,137,170 153,447,756
Sales and services of auxiliary enterprises - not pledged 38,529,894 — — — 38,529,894 — 38,529,894 36,236,294 Other operating revenues 38,397,174 9,422,072 3,966,985 — 51,786,231 (1,275,993) 50,510,238 49,432,076 Total operating revenues 898,121,522 9,422,072 3,966,985 — 911,510,579 (1,275,993) 910,234,586 869,181,586
Expenses: Operating Expenses: Compensationandemployeebenefits 709,455,173 — — — 709,455,173 1,170,601 710,625,774 633,321,554 Services and supplies 316,185,889 40,372,756 2,294,012 55,816,533 414,669,190 (85,987,456) 328,681,734 332,255,838 Utilities 16,656,045 — — 16,656,045 — 16,656,045 20,547,574 Depreciation 66,648,011 — — 66,648,011 — 66,648,011 59,346,439 Scholarships and fellowships 47,700,153 — — 47,700,153 — 47,700,153 33,578,665 Total operating liabilities 1,156,645,271 40,372,756 2,294,012 55,816,533 1,255,128,572 (84,816,855) 1,170,311,717 1,079,050,070
Operating income/(loss) (258,523,749) (30,950,684) 1,672,973 (55,816,533) (343,617,993) 83,540,862 (260,077,131) (209,868,484)

~ 103 ~
DescriptionClemson
University
ClemsonUniversity
Foundation
ClemsonUniversity
LandStewardshipFoundation IPTAY Subtotal Eliminations
FY20Total
FY19Total
Nonoperating Revenues (Expenses): State appropriations 144,250,934 — — — 144,250,934 — 144,250,934 136,487,314 Federal appropriations 13,126,453 — — — 13,126,453 — 13,126,453 11,115,310 Gifts and grants 102,743,269 45,318,951 150,000 56,005,143 204,217,363 (68,659,878) 135,557,485 117,650,849 Interest income 16,804,815 — 29,660 86,692 16,921,167 — 16,921,167 25,847,828 Endowment income 1,900,361 4,579,773 (700,182) 1,270,736 7,050,688 — 7,050,688 42,970,389 Interest on capital asset related debt (22,522,572) — (906,529) — (23,429,101) — (23,429,101) (24,321,809) Other nonoperating revenues 499,791 — — — 499,791 — 499,791 4,665,185 Gain/loss on disposal of capital assets (1,540,595) — — — (1,540,595) — (1,540,595) (257,972) Refunds to grantorss (491,460) — — — (491,460) — (491,460) (499,029) Facilities and administrative remittances to the State (269,279) — — — (269,279) — (269,279) (279,601) Net nonoperating revenues 254,501,717 49,898,724 (1,427,051) 57,362,571 360,335,961 (68,659,878) 291,676,083 313,378,464
Income before other revenues, expenses, gains or losses (4,022,032) 18,948,040 245,922 1,546,038 16,717,968 14,880,984 31,598,952 103,509,980
State capital appropriations 10,900,272 — — — 10,900,272 — 10,900,272 9,849,574 Capital grants and gifts 19,618,843 — — — 19,618,843 (15,206,999) 4,411,844 7,792,758 Intra-entity contributions 90,344 (326,015) — 30,720 (204,951) 326,015 121,064 (89,233) Additions to permanent endowments — — — — — — — 38,230 Increase in net position 26,587,427 18,622,025 245,922 1,576,758 47,032,132 — 47,032,132 121,101,309
Net Position: Net position, beginning of year as originally stated 300,013,600 631,329,821 29,101,312 96,993,021 1,057,437,754 — 1,057,437,754 936,336,445 Restatement — — — — — — — — Net position, beginning of year as restated 300,013,600 631,329,821 29,101,312 96,993,021 1,057,437,754 — 1,057,437,754 936,336,445
Net position, end of year $ 326,601,027 $ 649,951,846 $ 29,347,234 $ 98,569,779 $ 1,104,469,886 $ — $ 1,104,469,886 $ 1,057,437,754


This Comprehensive Annual Financial Report is also available on the Clemson University Comptroller Office website located at
http://www.clemson.edu/finance/controller/cafr
Sherri RowlandAssociate Vice President and Controller
Prepared by:Controller’s Office391 College Avenue, Suite 302Clemson, SC 29634Tel: (864) 656-0586 FAX: (864) 656-5600