Embed Size (px)
Citation preview


City of Vancouver | Comprehensive Annual Financial Report | Fiscal Year Ended December 31, 2015
FINANCIAL & MANAGEMENT SERVICES
Lloyd Tyler, CFO
Report Prepared By:
Accounting Staff ACCOUNTING MANAGER
Christine Smith, CPA, MBA
Monie Holmes Georgiana McNees
LaVonne Steiner-Weigel
Support Staff TREASURY MANAGER
Carrie Lewellen
City of Vancouver | Comprehensive Annual Financial Report | Fiscal Year Ended December 31, 2015
i
INTRODUCTORY SECTION Page Letter of Transmittal ............................................................................................................................................................1 Certificate of Achievement ..................................................................................................................................................5 Organization Chart ..............................................................................................................................................................6 City of Vancouver Elected Officials .....................................................................................................................................7 FINANCIAL SECTION Independent Auditor’s Report .............................................................................................................................................9 Management’s Discussion and Analysis ........................................................................................................................... 13 Basic Financial Statements Government-Wide Financial Statements: ..................................................................................................................... 23 Statement of Net Position........................................................................................................................................ 24 Statement of Activities ............................................................................................................................................. 25 Fund Financial Statements: ......................................................................................................................................... 27 Balance Sheet – Governmental Funds .................................................................................................................... 28 Reconciliation of the Balance Sheet of Governmental Fund to the Government Wide Statements of Net Position .. 29 Statement of Revenues, Expenditures, and Changes in Fund Balances – Governmental Funds ............................. 30 Reconciliation of the Statement of Revenues, Expenditures, and Changes in Fund Balance of Governmental Funds to the Statement of Activities ........................................................................................ 31 Statement of Revenues, Expenditures, and Changes in Fund Balances – Budget and Actual General Fund ..................................................................................................................................................... 32 Statement of Revenues, Expenditures, and Changes in Fund Balances – Budget and Actual Consolidated Fire Fund ...................................................................................................................................... 33 Statement of Revenues, Expenditures, and Changes in Fund Balances – Budget and Actual Street Fund ........................................................................................................................................................ 34 Statement of Net Position – Proprietary Funds ........................................................................................................ 35 Statement of Revenues, Expenses, and Changes in Fund Net Position – Proprietary Funds .................................. 36 Statement of Cash Flows – Proprietary Funds ........................................................................................................ 37 Statement of Net Position – Fiduciary Funds ........................................................................................................... 39 Statement of Changes in Fiduciary Net Position – Fiduciary Funds ......................................................................... 40 Notes to the Basic Financial Statements ...................................................................................................................... 41 Required Supplementary Information Police and Fire Pension Funds - Schedule of Funding Progress .................................................................................. 87 State Sponsored PERS Plans - Schedule of Proportionate Share of the Net Pension Liability ..................................... 88 State Sponsored LEOFF Plans - Schedule of Proportionate Share of the Net Pension Liability ................................... 89 State Sponsored PERS Plans - Schedule of Employer Contributions ........................................................................... 91 State Sponsored LEOFF Plans - Schedule of Employer Contributions ......................................................................... 92 Notes to Required Supplementary Information – State Sponsored Plans ..................................................................... 93 Single Employer Police and Fire Pension Funds - Schedule of Changes in Net Pension Liability and Related Ratios .. 94 Single Employer Police and Fire Pension Funds - Schedule of Employer Contributions ............................................... 96 Single Employer Police and Fire Pension Funds - Schedule of Investment Returns ..................................................... 97 Notes to Required Supplementary Information – Single Employer Police and Fire Pension Funds .............................. 98 Combining and Individual Fund Statements and Schedules: ............................................................................................. 99 Combining Balance Sheet – Nonmajor Governmental Funds ..................................................................................... 100 Combining Statement of Revenues, Expenditures and Changes in Fund Balances Nonmajor Governmental Funds ........................................................................................................................... 101 Combining Balance Sheet – Nonmajor Special Revenue Funds ................................................................................ 104 Combining Statement of Revenues, Expenditures, and Changes in Fund Balances – Nonmajor Special Revenue Funds ........................................................................................................................ 108 Combining Balance Sheet – Nonmajor Debt Service Funds ....................................................................................... 114 Combining Statement of Revenues, Expenditures, and Changes in Fund Balances – Nonmajor Debt Service Funds .............................................................................................................................. 115 Combining Balance Sheet – Nonmajor Capital Project Funds .................................................................................... 118 Combining Statement of Revenues, Expenditures, and Changes in Fund Balances – Nonmajor Capital Project Funds ............................................................................................................................ 120 Schedules of Revenues, Expenditures and Changes in Fund Balances—
Compared to Budget (GAAP Basis) and Actual Investigative Fund ................................................................................................................................................ 124 Drug Enforcement Fund ....................................................................................................................................... 125 Small Cities Fund ................................................................................................................................................. 126 Tourism Fund ....................................................................................................................................................... 127 VNHR Properties Fund ........................................................................................................................................ 128 Criminal Justice Fund .......................................................................................................................................... 129 Transportation Special Revenue Fund ................................................................................................................. 130 Senior Messenger Fund ....................................................................................................................................... 131 Parks & Recreation Fund ..................................................................................................................................... 132
City of Vancouver | Comprehensive Annual Financial Report | Fiscal Year Ended December 31, 2015
ii
Parks Construction Fund ...................................................................................................................................... 133 Parkhill Cemetery Fund ........................................................................................................................................ 134 REET 2002 Fund ................................................................................................................................................. 135 Downtown Initiatives Fund ................................................................................................................................... 136 City/County Cable TV Fund.................................................................................................................................. 137 GO Debt Service Fund ......................................................................................................................................... 138 L.I.D. Debt Service Fund ...................................................................................................................................... 139 L.I.D. Debt Service Guaranty Fund ...................................................................................................................... 140 Parks Construction ............................................................................................................................................... 141 Transportation Impact Fee Fund ......................................................................................................................... 142 Park Impact Fee Fund ......................................................................................................................................... 143 Capital Improvements Fund ................................................................................................................................. 144 2011 Bond Capital Fund ...................................................................................................................................... 145 2015 Bond Capital Fund ...................................................................................................................................... 146 Transportation Capital Fund ................................................................................................................................. 147
Combining Statement of Net Position – Nonmajor Enterprise Funds .......................................................................... 150 Combining Statement of Revenues, Expenses, and Changes in Fund Net Position – Nonmajor Enterprise Funds .................................................................................................................................. 151 Combining Statement of Cash Flows – Nonmajor Enterprise Funds .......................................................................... 152 Combining Statement of Net Position – Internal Service Funds .................................................................................. 154 Combining Statement of Revenues, Expenses, and Changes in Fund Net Position – Internal Service Funds .......................................................................................................................................... 156 Combining Statement of Cash Flows – Internal Service Funds .................................................................................. 158 Combining Statement of Net Position Fiduciary Funds—Pension Trust Funds ........................................................... 162 Combining Statement of Assets & Liabilities Fiduciary Funds—Agency Funds .......................................................... 163 Combining Statement of Changes in Fiduciary Net Position – Pension Trust Funds .................................................. 164 Combining Statement of Changes in Assets and Liabilities – Agency Funds .............................................................. 165 STATISTICAL SECTION
Table Financial Trends ............................................................................................................................................................. 169
1. Net Position by Component .............................................................................................................................. 170 2. Changes in Expenses, Revenues, and Net Position
a. Changes in Expenses by Function .................................................................................................. 171 b. Changes in Revenues by Function .................................................................................................. 172 c. Changes in Net Position .................................................................................................................. 173
3. General Governmental Tax Revenues by Source ............................................................................................. 174 4. General Governmental Revenues by Source .................................................................................................... 175 5. General Governmental Expenditures by Function and Changes in Fund Balance ............................................. 176 6. Fund Balances Governmental Funds ................................................................................................................ 177
Revenue Capacity .......................................................................................................................................................... 178 7. Assessed and Estimated Actual Value of Taxable Property .............................................................................. 179 8. Property Tax Rates - Direct and Overlapping Governments .............................................................................. 180 9. Property Tax Levies and Collections ................................................................................................................. 181 10. Principal Property Tax Payers ........................................................................................................................... 182
Debt Capacity ................................................................................................................................................................. 183 11. Ratio of Outstanding Debt by Type ................................................................................................................... 184 12. Direct and Overlapping Governmental Activities Debt ....................................................................................... 185 13. Legal Debt Margin Information .......................................................................................................................... 186 14. Pledged – Revenue Coverage .......................................................................................................................... 187
Demographic and Economic Information ........................................................................................................................ 188 15. Demographic and Economic Statistics .............................................................................................................. 189 16. Principal Employers .......................................................................................................................................... 190
Operating Information ..................................................................................................................................................... 191 17. Full-Time Equivalent City Governmental Positions by Function ......................................................................... 192 18. Operating Indicators by Function ...................................................................................................................... 193 19. Capital Assets Statistics by Function ................................................................................................................. 195
Schedule of Federal Awards ........................................................................................................................................... 197 20. Schedule of Expenditures of Federal Awards .................................................................................................... 198

City of Vancouver | Comprehensive Annual Financial Report | Fiscal Year Ended December 31, 2015
iii
INDEX FOR NOTES TO THE BASIC FINANCIAL STATEMENTS
Note Page I. Summary of Significant Accounting Policies
A. Reporting Entity ........................................................................................................................................... 41 B. Government-wide and Fund Financial Statements ....................................................................................... 41 C. Measurement Focus, Basis of Accounting, and Financial Statement Presentation ....................................... 42 D. Assets, Liabilities, and Net Position or Equity .............................................................................................. 43
1. Cash and Cash Equivalents ................................................................................................................ 43 2. Internal Balance and Receivables ...................................................................................................... 43 3. Inventories and prepaid items ............................................................................................................. 44 4. Restricted assets ................................................................................................................................. 44 5. Capital assets ..................................................................................................................................... 44 6. Compensated absences ...................................................................................................................... 45 7. Other Accrued Liabilities ..................................................................................................................... 45 8. Long-term obligations .......................................................................................................................... 45 9. Pensions 10. Unearned revenues ............................................................................................................................ 45 11. Use of estimates ................................................................................................................................ 45 12. Net position and fund balances .......................................................................................................... 45
E. Adoption of New GASB Pronouncements .................................................................................................... 46 F. Future Adoption of GASB Pronouncements ................................................................................................. 47
II. Stewardship, Compliance, and Accountability
A. Budgetary Information ................................................................................................................................. 48 B. Excess of Expenditures Over Appropriations ............................................................................................... 49 C. Deficit Net Position/Net Fund Balance ......................................................................................................... 49
III. Detailed Notes on All Funds A. Deposits and Investments ............................................................................................................................ 50 B. Capital Assets .............................................................................................................................................. 52 C. Interfund Receivables, Payables, and Transfers .......................................................................................... 55 D. Lease Agreements ...................................................................................................................................... 56 E. Long-Term Debt .......................................................................................................................................... 57
1. Bonds and Debt ................................................................................................................................... 57 2. Compensated Absences and Impact Fee Credits ................................................................................. 60 3. Changes in Long Term Liabilities ......................................................................................................... 61 4. Component Unit Debt ........................................................................................................................... 61
F. Fund Balance Reporting .............................................................................................................................. 64
IV. Other Disclosures A. Related Party Transactions .......................................................................................................................... 66 B. Contingencies and Commitments ................................................................................................................ 66 C. Joint Ventures and Jointly Governed Organizations ..................................................................................... 67 D. Risk Management........................................................................................................................................ 68 E. Property Taxes ............................................................................................................................................ 69 F. Employee Retirement Systems and Pension Plans ...................................................................................... 69 G. Postemployment Benefits Other Than Pension Benefits .............................................................................. 82 H. Pollution Remediation Obligation ................................................................................................................. 84 I. Special Items .............................................................................................................................................. 84 J. Prior Period Adjustments ............................................................................................................................. 84 K. Subsequent Events ..................................................................................................................................... 85

Vancouver Marathon…The Starting Line

June 17, 2016 To the Honorable Timothy D. Leavitt, Mayor Members of the City Council Mr. Eric Holmes, City Manager Citizens of the City of Vancouver I am pleased to submit to you the 2015 Comprehensive Annual Financial Report (CAFR) of the City of Vancouver, Washington. The report consists of management’s representations concerning the finances of the City of Vancouver (City). Consequently, management assumes full responsibility for the completeness and reliability of all of the information presented in this report. To provide a reasonable basis for making these representations, management has established a comprehensive internal control framework that is designed both to protect the government’s assets from loss, theft, or misuse and to compile sufficient and reliable information for the preparation of the City’s financial statements in conformity with generally accepted accounting principles (GAAP). Because the cost of internal controls should not outweigh their benefits, the City’s comprehensive framework of internal controls has been designed to provide reasonable rather than absolute assurance that the financial statements will be free from material misstatement. As management, we assert that, to the best of our knowledge and belief, this financial report is complete and reliable in all material respects. The City’s financial statements have been audited by the Washington State Auditor’s Office in accordance with generally accepted governmental auditing standards. The goal of the independent audit was to provide reasonable assurance that the financial statements of the City for the fiscal year ended December 31, 2015, are free of material misstatement. The independent audit involved examining on a test basis, evidence supporting the amounts and disclosures in the financial statements; assessing the accounting principles used and significant estimates made by management; and evaluating the overall financial statement presentation. The independent auditor concluded, based upon the audit, that there was a reasonable basis for rendering an unmodified opinion that the City’s financial statements for the fiscal year ended December 31, 2015, are fairly presented in conformity with GAAP. The independent auditor’s report is included in the financial section of this report. The independent audit of the financial statements of the City was part of a broader, federally mandated “Single Audit” designed to meet the special needs of federal grantor agencies. The standards governing Single Audit engagements require the independent auditor to report not only on the fair presentation of the financial statements, but also the audited government’s internal controls and compliance with legal requirements, with special emphasis on internal controls and legal requirements involving the administration of federal awards. The City’s Single Audit Report is issued separately and is available upon request. Another state mandate requires the Washington State Auditor’s Office to perform control testing and additional tests of compliance with state laws and regulations as detailed in Revised Code of Washington (RCW) 43.09.260. This statute requires the State Auditor to inquire as to whether the City complied with the laws and the
1

Constitution of the State of Washington, its own ordinances and orders, and the requirements of the State Auditor's Office. The City’s Accountability report is also available separately upon request. GAAP requires that management provide a narrative introduction, overview and analysis to accompany the basic financial statements in the form of Management’s Discussion and Analysis (MD&A). This letter of transmittal is designed to complement MD&A and should be read in conjunction with that document. The City’s MD&A can be found immediately following the report of the independent auditor. Profile of the Government The City was incorporated on January 23, 1857. The City sits on the north bank of the Columbia River directly across from Portland, Oregon. The Pacific coast is less than 90 miles to the west. The Cascade Mountain Range rises on the east. Mount St. Helens National Volcanic Monument and Mt. Hood are less than two hours away. The spectacular Columbia River Gorge National Scenic Area lies 30 minutes to the east. Vancouver combines the excitement of a major metropolitan area with small-town charm and abundant recreational opportunities. The City serves a population of over 165,000 and occupies a land area of 49.86 square miles. The City has operated under the Council-Manager form of government and provides services per its charter adopted February 20, 1952, and last amended by a vote of the people, November 3, 2015. This system empowers the citizens of Vancouver and provides responsive, progressive leadership and a vision for the community. City Council is presided over by the Mayor, who is elected every four years. The six Council Members are elected every four years via City-wide vote. Among its primary duties, the City Council makes laws, sets policies, adopts budgets and oversees a wide-ranging agenda for the community. The City Manager, who is appointed by City Council, heads the administrative branch of City government and directs all City operations, projects and programs. The City of Vancouver provides a balanced array of services, including the City's vital infrastructure and urban services. The City builds and repairs roads, maintains water and sewer services, provides fire and police protection, administers land use policy and takes an active role in Vancouver's commercial and industrial development. The City designs and oversees Vancouver's many parks and green spaces. In addition, the City provides park services to its residents. The City coordinates recreation activities, fosters neighborhood livability and works to preserve the City's environmental quality and historic legacy. The City is also the fiscal agent for two development authorities, which are reported discretely in the City’s financial report. Additional information on separate legal entities can be found in Note I. A. in the notes to the financial statements. Accounting and Budgeting Procedures under State Law Cities and counties of the State of Washington must comply with the Budgeting, Accounting, and Reporting System (BARS) prescribed by the Office of the State Auditor as authorized under RCW 43.09.200 and RCW 43.09.230. State law also provides for annual independent audits by the Office of the State Auditor and requires timely submission of annual financial reports to the state for review. The financial system of the City incorporates a system of financial and administrative controls that ensure the safeguarding of assets and the reliability of financial reports. Consequently, controls are designed to provide reasonable assurance that transactions are executed in accordance with management authorization and recorded in conformity with GAAP. In addition, these controls ensure that accountability over assets and obligations exists, and that sufficient reporting and review exist to provide adequate information for analysis and comparability of data. Internal control is an area of audit by the State Auditor as well, and City management receives and takes action based on their recommendations. The City prepares budgets in accordance with RCW 35.33. To provide directional guidance to the process, the City prepares a multi-year financial forecast of its revenues and expenditures. Biennial budgets (in which calendar year allocations lapse at year-end) are adopted by the City council for all city funds. All increases in total budgeted appropriations of funds are authorized by the City Council through the budget process. Transfers of appropriations within a fund may be authorized by the City Manager. All budgets, for management purposes, are accounted for on a line-item basis with control at the object level. Estimated purchase order amounts are encumbered prior to the release of the order to the vendor. Such encumbrances also serve to provide budgetary control. Open encumbrances lapse at year-end and must be re-appropriated or absorbed in the next year’s operating budget.
2

Information Useful in Assessing the Government’s Economic Condition The information presented in the financial statements is perhaps best understood when it is considered from the broader perspective of the specific environment within which the City operates. Local economy Vancouver is located in a metropolitan area that has a diverse economy with a broad base of manufacturing, high technology, retail, plus governmental and business services. Relatively low development costs and a strong labor force have attracted investments to the City. High technology companies, such as Hewlett-Packard, SEH America, and Kyocera have located in the City over the past twenty years. The role of manufacturing jobs in the economy has been decreasing over time. Recently, large employers in the healthcare business and software development have located within the City, including Peace Health, Banfield and a number of smaller startup companies in the tech sector. Retail trade in the City is hampered by the sales tax in Washington and the lack of sales tax in Oregon. It is estimated that almost 30% of the City’s retail expenditures occur in Portland, Oregon. As a result, the City is losing an estimated $10 million per year in uncollected sales taxes. The region has also been severely impacted by the recession and the effects of high unemployment, although gradual economic improvement is occurring. Many people and businesses are relocating to this region for its natural beauty and many opportunities. Vancouver combines the excitement of a major metropolitan area with small-town charm and abundant recreational opportunities. As the economy recovers from the recession, modest in-migration may contribute to employment growth and help spur new construction. Long-term financial planning The City’s 2015-16 Biennial Budget was created at a time when the economy was recovering from the deepest recession since the 1930s. While the City anticipated some relative stability from these moderate economic improvements, the City continues to prioritize how scarce resources are allocated and hold back increases in workforce.
City residents have indicated in the last Community Services Survey that they remain generally satisfied with the quality of life in the City. To maintain this high level of satisfaction, City staff and City Council will continue to focus on service prioritization in light of community priorities while continuing to evaluate expense reductions and explore additional revenue sources in order to put in place a permanent structural solution. The City Manager, under the direction of City Council and pursuant to legal requirements, has maintained a consistent strategy of restraining on-going costs within existing on-going revenues. Relevant Financial Policies In addition to following all laws related to budgeting as outlined by RCW 35, the City has internal financial management policies that are adopted by City Council and reviewed every two years during the budget development process. The policies ensure that the City maintains a healthy financial foundation into the future. The goal of these policies is to promote:
• An extended financial planning horizon to increase awareness of future potential challenges and
opportunities. • Setting aside reserves for contingencies, replacement of capital equipment and facilities, and other
similar needs. • Maintaining the effective buying power of fees and charges and increasing cost recovery where
directed to do so. • Accountability for meeting standards for financial management and efficiency in providing services. • Planning for the capital needs of the community. • Maintaining manageable levels of debt while maintaining quality bond ratings. • Communication to residents and customers on how the community goals are being addressed.
3

CITY OF VANCOUVER Major Initiatives The City of Vancouver has dealt with structural deficit in its General, Street and Fire funds, addressing shortfalls by cutting staff and service levels, improving efficiency, and increasing fees and taxes since the early 2000s. Going into the 2015-2016 biennium the City was in a more stable financial situation than it has been in previous years. The City continues to actively seek a structural solution to its on-going financial structural problem. The structural solution is premised on maintaining a balanced set of services, balanced workforce and balanced financial forecast through the end of the decade. The City has an unprecedented opportunity to set a course for fiscal health and stability by the end of the decade. Though there is much work to do in the coming year, leadership is optimistic about the possibilities for the City’s future. Awards and Acknowledgements The Government Finance Officers Association of the United States and Canada (GFOA) awarded a Certificate of Achievement for Excellence in Financial Reporting to the City of Vancouver for its Comprehensive Annual Financial Report for the fiscal year ended December 31, 2014. The Certificate of Achievement is a prestigious national award recognizing conformance with the highest standards for preparation of a state and local government financial report. In order to be awarded a Certificate of Achievement, a government unit must publish an easily readable and efficiently organized comprehensive annual financial report, whose contents conform to program standards. The CAFR must satisfy both generally accepted accounting principles and applicable legal requirements. A Certificate of Achievement is valid for a period of one year only. The City of Vancouver has received a Certificate of Achievement for the last 30 years. We believe our current report continues to conform to the Certificate of Achievement program requirements, and we are submitting it to GFOA. The report includes, where applicable, the implementation of GASB statements through number 72, as well as statement number 79. The preparation of this report could not have been accomplished without the efficient and dedicated staff of the Financial & Management Services Team. I would also like to express my thanks to the administrators and employees of the City, and the citizens of Vancouver whose continued cooperation, support, and assistance have contributed greatly to the financial stability of the City of Vancouver. Finally, I want to point out that the pictures included in this year’s CAFR illustrate the vision of “engaging community”. In the prior year, the Vancouver City Council started the process of creating a new strategic vision and plan for the City. Work on development of the new strategic plan continued throughout 2015, and included outreach and engagement with the community. The plan was completed just subsequent to year-end. One of the goals was to create new programs that engage people of all ages, cultures, family configurations, educational backgrounds, trades and professions. I believe these photos illustrate the efforts of this goal.
4

5

6
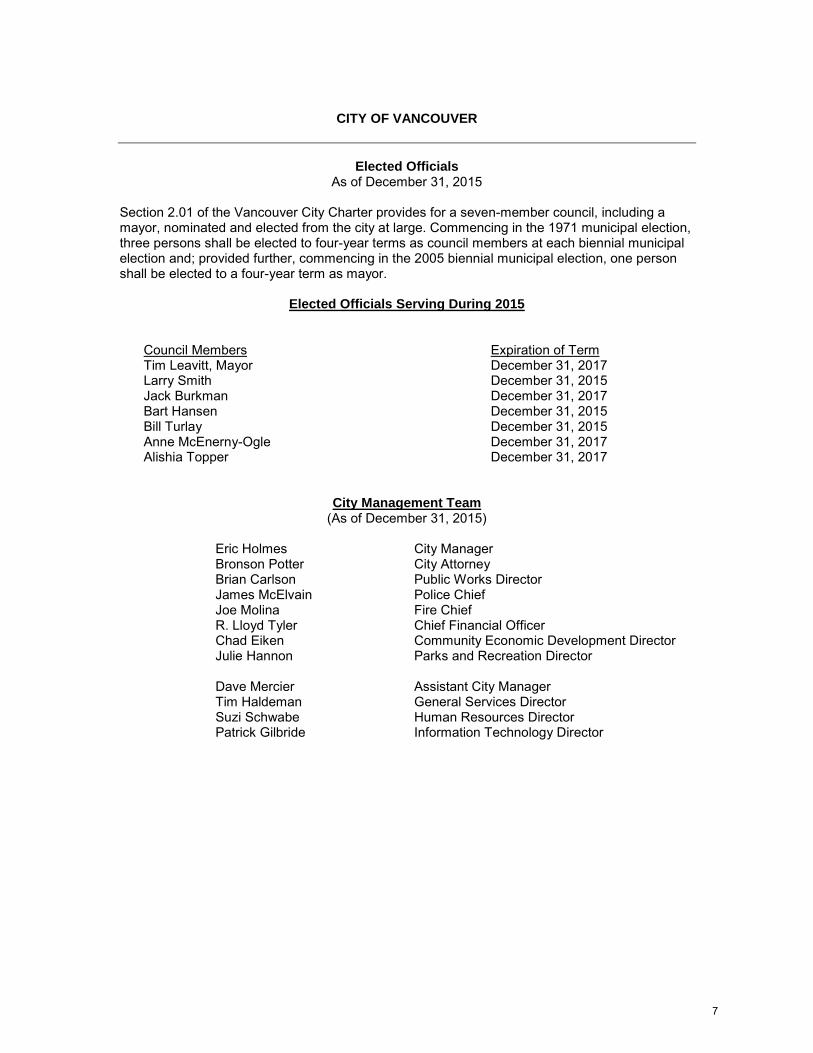
CITY OF VANCOUVER
Elected Officials As of December 31, 2015
Section 2.01 of the Vancouver City Charter provides for a seven-member council, including a mayor, nominated and elected from the city at large. Commencing in the 1971 municipal election, three persons shall be elected to four-year terms as council members at each biennial municipal election and; provided further, commencing in the 2005 biennial municipal election, one person shall be elected to a four-year term as mayor.
Elected Officials Serving During 2015
Council Members Tim Leavitt, Mayor Larry Smith Jack Burkman Bart Hansen Bill Turlay Anne McEnerny-Ogle Alishia Topper
Expiration of Term December 31, 2017 December 31, 2015 December 31, 2017 December 31, 2015 December 31, 2015 December 31, 2017 December 31, 2017
City Management Team (As of December 31, 2015)
Eric Holmes Bronson Potter Brian Carlson James McElvain Joe Molina R. Lloyd Tyler Chad Eiken Julie Hannon Dave Mercier Tim Haldeman Suzi Schwabe Patrick Gilbride
City Manager City Attorney Public Works Director Police Chief Fire Chief Chief Financial Officer Community Economic Development Director Parks and Recreation Director Assistant City Manager General Services Director Human Resources Director Information Technology Director
7
Heritage Bike Trail
5
INDEPENDENT AUDITOR’S REPORT ON FINANCIAL STATEMENTS
June 17, 2016
Mayor and City Council City of Vancouver Vancouver, Washington
REPORT ON THE FINANCIAL STATEMENTS We have audited the accompanying financial statements of the governmental activities, the business-type activities, the aggregate discretely presented component units, each major fund and the aggregate remaining fund information of the City of Vancouver, Clark County, Washington, as of and for the year ended December 31, 2015, and the related notes to the financial statements, which collectively comprise the City’s basic financial statements as listed in the table of contents.
Management’s Responsibility for the Financial Statements
Management is responsible for the preparation and fair presentation of these financial statements in accordance with accounting principles generally accepted in the United States of America; this includes the design, implementation, and maintenance of internal control relevant to the preparation and fair presentation of financial statements that are free from material misstatement, whether due to fraud or error.
Auditor’s Responsibility
Our responsibility is to express opinions on these financial statements based on our audit. We did not audit the financial statements of the Vancouver Hotel and Convention Center Project, which is included in the City’s financial information as part of the Downtown Redevelopment Authority component unit and which represents 1.9 percent, 2.6 percent, 100 percent and 87 percent respectively, of the assets and deferred outflows, net position, operating revenues and operating expenses of the aggregate discretely presented component units. Those financial statements were audited by other auditors whose report thereon has been furnished to us, and our opinion, insofar as it relates to the amounts included for the Vancouver Hotel and Convention Center Project, is based solely on the report of other auditors. We conducted our audit in accordance with auditing standards generally accepted in the United States of America and the standards applicable to financial audits contained in Government Auditing Standards, issued by the Comptroller General of the United States. Those standards require that we plan and perform the audit to obtain reasonable assurance about whether the financial statements are free from material misstatement. The financial statements of the Vancouver Hotel and Convention Center Project were not audited in accordance with Government Auditing Standards.
Washington State Auditor’s Office
9

An audit involves performing procedures to obtain audit evidence about the amounts and disclosures in the financial statements. The procedures selected depend on the auditor’s judgment, including the assessment of the risks of material misstatement of the financial statements, whether due to fraud or error. In making those risk assessments, the auditor considers internal control relevant to the City’s preparation and fair presentation of the financial statements in order to design audit procedures that are appropriate in the circumstances, but not for the purpose of expressing an opinion on the effectiveness of the City’s internal control. Accordingly, we express no such opinion. An audit also includes evaluating the appropriateness of accounting policies used and the reasonableness of significant accounting estimates made by management, as well as evaluating the overall presentation of the financial statements.
We believe that the audit evidence we have obtained is sufficient and appropriate to provide a basis for our audit opinions.
Opinion
In our opinion, based on our audit and the report of the other auditors, the financial statements referred to above present fairly, in all material respects, the respective financial position of the governmental activities, the business-type activities, the aggregate discretely presented component units, each major fund and the aggregate remaining fund information of the City of Vancouver, Clark County, Washington, as of December 31, 2015, and the respective changes in financial position and, where applicable, cash flows thereof, and the respective budgetary comparison for the General, Consolidated Fire and Street funds for the year then ended in accordance with accounting principles generally accepted in the United States of America.
Matters of Emphasis
As described in Note I, during the year ended December 31, 2015, the City has implemented the Governmental Accounting Standards Board Statement No. 68, Accounting and Financial Reporting for Pensions – an amendment of GASB Statement No. 27 and Statement No. 71, Pension Transition for Contributions Made Subsequent to the Measurement Date - an amendment of GASB Statement No. 68. Our opinion is not modified with respect to this matter.
Other Matters
Required Supplementary Information
Accounting principles generally accepted in the United States of America require that the management’s discussion and analysis on pages 13 through 21, information on police and fire pension funds on page 87, state sponsored plans on pages 88 through 93 and single employer police and fire pension funds on pages 94 through 98 be presented to supplement the basic financial statements. Such information, although not a part of the basic financial statements, is required by the Governmental Accounting Standards Board who considers it to be an essential part of financial reporting for placing the basic financial statements in an appropriate operational, economic or historical context. We have applied certain limited procedures to the required supplementary information in accordance with auditing standards generally accepted in the United States of America, which consisted of inquiries of management about the methods of preparing the information and comparing the information for consistency with management’s responses to our inquiries, the basic financial statements, and other knowledge we obtained during our audit of the basic financial statements. We do not express an opinion or provide any assurance on the information because
10

the limited procedures do not provide us with sufficient evidence to express an opinion or provide any assurance.
Supplementary and Other Information
Our audit was conducted for the purpose of forming opinions on the financial statements that collectively comprise the City’s basic financial statements. The accompanying information listed as combining and individual fund statements and schedules on pages 99 through 165 is presented for purposes of additional analysis and is not a required part of the basic financial statements. Such information is the responsibility of management and was derived from and relates directly to the underlying accounting and other records used to prepare the financial statements. This information has been subjected to auditing procedures applied in the audit of the basic financial statements and certain additional procedures, including comparing and reconciling such information directly to the underlying accounting and other records used to prepare the financial statements or to the financial statements themselves, and other additional procedures in accordance with auditing standards generally accepted in the United States of America. In our opinion, the information is fairly stated, in all material respects, in relation to the basic financial statements taken as a whole.
The information identified in the table of contents as the introductory and statistical sections is presented for purposes of additional analysis and is not a required part of the basic financial statements of the City. Such information has not been subjected to the auditing procedures applied in the audit of the basic financial statements and, accordingly, we do not express an opinion or provide any assurance on it.
OTHER REPORTING REQUIRED BY GOVERNMENT AUDITING STANDARDS
In accordance with Government Auditing Standards, we will also issue our report dated June 17, 2016, on our consideration of the City’s internal control over financial reporting and on our tests of its compliance with certain provisions of laws, regulations, contracts and grant agreements and other matters. That report will be issued under separate cover in the City’s Single Audit Report. The purpose of that report is to describe the scope of our testing of internal control over financial reporting and compliance and the results of that testing, and not to provide an opinion on internal control over financial reporting or on compliance. That report is an integral part of an audit performed in accordance with Government Auditing Standards in considering the City’s internal control over financial reporting and compliance.
Sincerely,
TROY KELLEY
STATE AUDITOR
OLYMPIA, WA
11

12

MANAGEMENT’S DISCUSSION AND ANALYSIS This discussion and analysis is a narrative overview of the City of Vancouver's (the City’s) financial activities for the fiscal year ended December 31, 2015. The information presented here should be read in conjunction with the letter of transmittal, the financial statements, and the related notes to the financial statements. FINANCIAL HIGHLIGHTS • City of Vancouver assets and deferred outflows of resources exceeded its liabilities and deferred inflows of resources at
December 31, 2015 by over $1 billion. • Net investment in capital assets accounts for over 76.2% of the total net position, with a value of $830 million. • Of the remaining net position, $197.3 million may be used to meet the government's ongoing obligations to citizens and
creditors, without legal restriction. • The City’s total net position showed an increase of $22.3 million from current operations in 2015. This includes a $58.1 change
in net position less prior period adjustments of $4.6 million, which is further explained in detail in Note IV, and a change in accounting principles of $31.2 million related to the implementation of GASB 68.
• Total program revenues were $179.2 million in 2015, up $27.5 million from 2014, due to an increase in Charges for Services, Fees, and Fines and Forfeitures and in Capital Grants and Contributions revenues. Program expenses were $251.1 million, up $14.9 million from 2014. General revenues and transfers were $130.1 million, up by $4.2 million from last year.
• As of December 31, 2015, the City of Vancouver’s governmental funds reported combined ending fund balances of $149.7 million, which was $12.2 million more than the prior year. Approximately 61.6% of this total amount, or $92.2 million, is available for spending at the government's discretion. The unassigned fund balance for the General Fund was $7.9 million at December 31, 2015.
• The City of Vancouver’s total bonded debt at December 31, 2015 was $129.8 million. OVERVIEW OF THE FINANCIAL STATEMENTS This discussion and analysis provides an introduction and overview to the City‘s basic financial statements. This information will assist users in interpreting the basic statements. We will also provide other financial discussion and analysis of certain plans, projects and trends necessary for understanding the full context of the financial condition of the City. Basic Financial Statements The basic financial statements are comprised of three components: 1) government-wide financial statements, 2) fund financial statements, and, 3) notes to the financial statements. The financial section of this report also contains required supplementary information, in addition to the basic financial statements. Government-wide Financial Statements Government-wide financial statements provide readers with a broad overview of the City of Vancouver’s finances in a manner similar to a private-sector business. Functions of the City of Vancouver that are principally supported by taxes and intergovernmental revenues (referred to as "governmental activities") are distinguished from functions that are intended to recover all or a significant portion of their costs through user fees and charges (referred to as "business-type activities"). The governmental activities of the City of Vancouver provide a full range of local government services to the public. Programs include law enforcement and public safety; fire protection; road construction and maintenance; community economic development; parks and recreation; and the issuance of permits and licenses. In addition, other general government activities include neighborhood support, a senior newsletter, and the revitalization of the downtown core area to name a few. The business-type activities of the City of Vancouver include water, sewer, drainage management and control, downtown parking, an airpark, solid waste, building inspection, and a tennis center. The Statement of Net Position presents information on all City of Vancouver’s assets, deferred inflows, liabilities and deferred outflows, with the difference being reported as net position. This statement serves a purpose similar to that of the balance sheet of a private-sector business. Over time, increases or decreases in net position may serve as one indicator of whether the financial position of the City is improving or deteriorating. Some other indicators include the condition of the City's infrastructure systems (roads, drainage systems, bridges, etc.), changes in property tax base, and general economic conditions within the City. The Statement of Activities presents information showing how the government's revenues and expenses impacted net position during 2015. This statement separates program revenue (revenue generated by specific programs through charges for services, grants, and contributions) from general revenue (revenue provided by taxes and other sources not tied to a particular program). This shows the extent to which each program relies on general revenue for funding. All changes in net position are reported using the accrual basis of accounting which requires that revenues are reported when they are earned and expenses are reported as soon as liabilities are incurred. The City has identified certain entities as component units in the government-wide financial statements. These entities are the Vancouver Downtown Redevelopment Authority (DRA) and the Vancouver Public Facilities District (PFD). These two entities are shown in the government-wide financial statements as discretely presented component unit funds. For additional information, see note IV.A. The City has also reported its investment in one governmental joint venture: Clark Regional Emergency Services Agency (CRESA); see note IV.C.
13

Fund Financial Statements A fund is a self-balancing grouping of related accounts that is used to maintain control over resources that are segregated for specific activities or objectives. The City of Vancouver, like other state and local governments, uses fund accounting for compliance with finance-related legal requirements. All of the funds of the City of Vancouver fall into one of three categories: governmental funds, proprietary funds, or fiduciary funds. Governmental funds account for most, if not all, of a government's tax-supported activities. Proprietary funds account for a government's business-type activities where all or part of the costs of activities are supported by fees and charges paid directly by those who benefit from the activities. Fiduciary funds account for resources that are held by the government as a trustee or agent for parties outside of the government. The resources of fiduciary funds cannot be used to support the government's own programs. Governmental Funds The Governmental Funds Balance Sheet and the Governmental Funds Statement of Revenues, Expenditures, and Changes in Fund Balances present separate columns of financial data for the General Fund, the Consolidated Fire Fund, and Street Fund. These are considered major funds. Data from the remaining governmental funds are combined into a single, aggregated presentation. Governmental funds are used to account for essentially the same functions reported as governmental activities in the government-wide financial statements. Governmental funds financial statements focus on near-term inflows and outflows of spendable resources and on balances of spendable resources available at the end of the fiscal year. Such information is useful in evaluating a government's near-term financing requirements in comparison to near-term resources available. To get a longer term perspective of financial balances and results of operations, the City presents full accrual information in the government wide financial statements. This gives readers a better understanding of the long-term impact of the government's near-term financing decisions. The Governmental Funds Balance Sheet and the Governmental Funds Statement of Revenues, Expenditures, and Changes in Fund Balances provide a reconciliation to facilitate the comparison between governmental funds and governmental activities. The City maintains budgetary controls over all city funds. Budgetary controls ensure compliance with legal provisions embodied in the biennial appropriated budget. Governmental fund budgets are established in accordance with state law, and most are adopted on a fund level. The General Fund budget is adopted on a fund level. Personnel services are budgeted by full-time positions. Budgetary variances are discussed later in this section. Proprietary Funds The City has two types of proprietary funds: enterprise funds and internal service funds. Enterprise funds are used to report the same functions presented as business-type activities in the government-wide financial statements. The City uses enterprise funds to account for its water/sewer/drainage utility, solid waste, airpark, building inspection, parking, and tennis center operations. Internal service funds accumulate and allocate costs among the City’s various functions. The City uses internal service funds to account for its computer repair and replacement, rolling stock repair and replacement, self-insurance, mailroom services, facilities replacement and insurance benefits. Those revenues and expenses of internal service funds that are duplicated in other funds are eliminated in the government-wide statements. The remaining balances are allocated and included in the governmental type activities columns. Proprietary fund statements provide the same type of information as the government-wide financial statements, only in more detail, since both apply the accrual basis of accounting. In comparing the Proprietary Fund Statement of Net Position to the business-type column on the government-wide Statement of Net Position, the total net position amounts agree, needing no reconciliation. In comparing the total assets and total liabilities between the same two statements, you will notice slightly different amounts. This is because the "Internal balances" line on the government-wide statement combines the "Due from other funds" (assets) and the "Due to other funds" (liabilities) from the proprietary fund statement in a single line in the asset section of the government-wide statement. The proprietary fund financial statements provide separate information for the Water/Sewer Fund and Parking Services as these are considered major funds. All other enterprise funds are aggregated into a single presentation. Internal Service Funds are also aggregated into a single presentation, but are not included in the totals. Fiduciary Funds Fiduciary funds are used to account for resources held for the benefit of parties outside the government. Fiduciary funds are not reflected in the government-wide financial statement because the resources of those funds are not available to support the City of Vancouver’s own programs. The accounting used for fiduciary funds is much like that used for proprietary funds. Notes to the Financial Statements The notes provide additional information that is essential to a full understanding of the data provided, and are an integral part of the government-wide and fund financial statements.
14

Other Information In addition to the basic financial statements and accompanying notes, this report also presents certain required supplementary information concerning the City of Vancouver’s progress in funding its obligations to the citizenry and its employees. Required supplementary information can be found beginning on page 87 of this report. The aggregated statements for nonmajor governmental and proprietary funds are presented immediately following the required supplementary information. Combining and individual fund statements and schedules can be found on pages 99-165 of this report. GOVERNMENT-WIDE FINANCIAL ANALYSIS Analysis of Net Position As noted earlier, changes in net position may serve as a useful indicator of a government's financial position. The City of Vancouver's net position totals $1,089,127,828 at December 31, 2015. The following is a condensed and comparative version of the Government-Wide Statement of Net Position.
2014 2015 2014 2015 2014 2015$ 204,151,971 $ 233,683,060 $ 100,061,323 $ 109,349,125 $ 304,213,294 $ 343,032,185
599,509,374 608,605,005 358,944,646 361,067,813 958,454,020 969,672,818 803,661,345 842,288,065 459,005,969 470,416,938 1,262,667,314 1,312,705,003
2,383,987 7,921,208 2,005,428 3,196,305 4,389,415 11,117,513
128,124,869 149,976,672 56,776,956 58,859,452 184,901,825 208,836,12411,629,538 10,501,636 3,744,127 5,858,002 15,373,664 16,359,638
139,754,407 160,478,308 60,521,082 64,717,454 200,275,489 225,195,762
- 7,482,064 - 2,016,863 - 9,498,927
500,547,745 510,481,006 302,611,189 319,491,178 803,158,934 829,972,18443,879,793 47,881,854 7,554,474 9,208,424 51,434,267 57,090,278
121,863,388 123,886,041 90,324,652 78,179,324 212,188,040 202,065,366$ 666,290,926 $ 682,248,901 $ 400,490,315 $ 406,878,926 $ 1,066,781,241 $ 1,089,127,827
NET POSITION
Net investment in capital assetsRestricted Unrestricted
TOTAL NET POSITION
DEFERRED OUTFLOWS OF RESOURCES
DEFERRED INFLOWS OF RESOURCES
TOTAL LIABILITIES
City of Vancouver's Net Position
Governmental Activities Business-type Activities Total Activities
Current and other assetsCapital assets (net of accumulated depreciation)
TOTAL ASSETS
Long-term liabilitiesOther liabilities
During 2015, the City’s total assets increased $50 million and deferred outflows of resources increased $6.7 million, while total liabilities increased $24.9 million and deferred inflows of resources increased $9.5 million, primarily related to the implementation of GASB 68. The net result is an increase in total net position of $22.3 million, or 2.1%. Of the City’s total assets, cash balances and restricted cash balances increased by $27.7 million and $1.8 million respectively; receivables decreased $837,371, capital assets increased $11.2 million, and other assets increased $10.2 million from 2014. The largest portion of the City’s net position, 76.2%, reflects its investment in capital, less any related debt still outstanding that was used to acquire those assets. The City's capital assets are used to provide services to citizens; consequently, these assets are not available for future spending. Net position representing resources that are subject to external restrictions on how they may be used is 5.2% of the total, and net position that is unrestricted represents the remaining 18.6%. At December 31, 2015, the City of Vancouver reports positive balances in all three categories of net position, for the government as a whole. Analysis of Changes in Net Position The change in total net position increased in 2015 by $22.3 million, inclusive of the impact of Prior Period Adjustments and Changes in Accounting Principles related to GASB 68. This is split between governmental increase of $15.9 million and business-type activities increase of $6.4 million. A condensed version of the Statement of Activities for the past two years is shown in the following table. The full statement is a tabular depiction of the relationship of revenues and expenses for the City’s governmental activities and proprietary funds. The graphs that follow illustrate the sources of revenue and the balance of governmental vs. business type expenses for 2015.
15
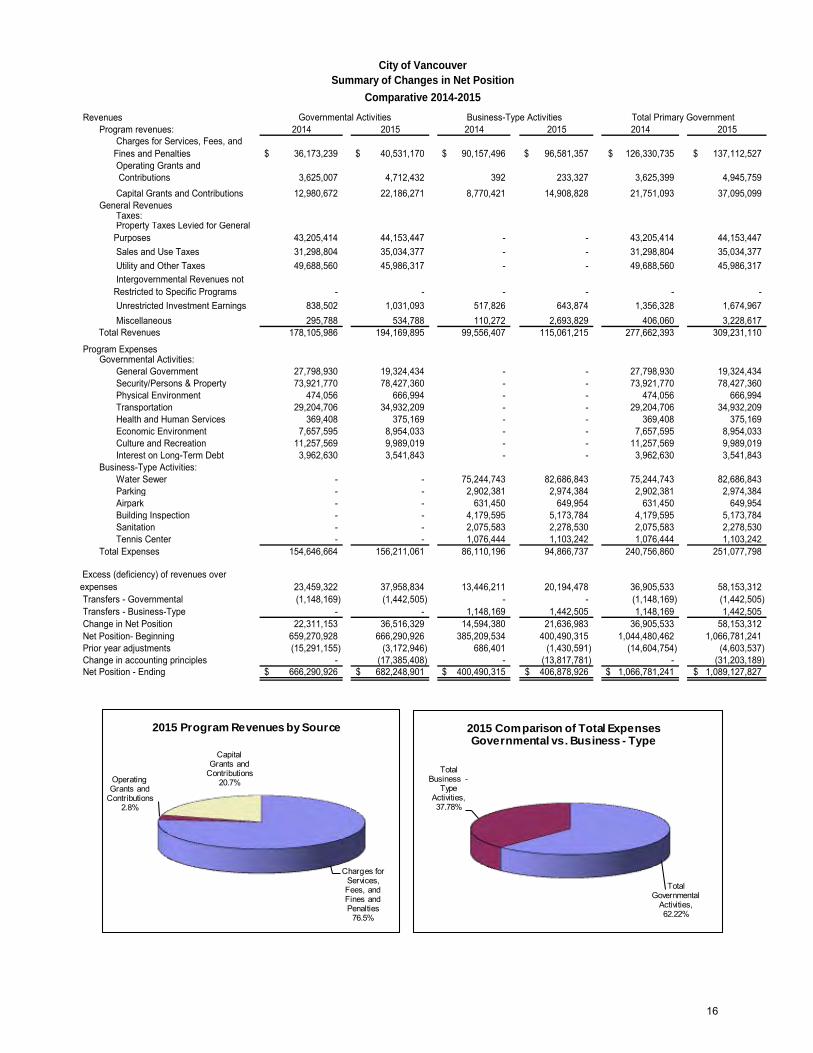
City of VancouverSummary of Changes in Net Position
Comparative 2014-2015Revenues
Program revenues: 2014 2015 2014 2015 2014 2015 Charges for Services, Fees, and Fines and Penalties 36,173,239$ 40,531,170$ 90,157,496$ 96,581,357$ 126,330,735$ 137,112,527$ Operating Grants and Contributions 3,625,007 4,712,432 392 233,327 3,625,399 4,945,759 Capital Grants and Contributions 12,980,672 22,186,271 8,770,421 14,908,828 21,751,093 37,095,099
General Revenues Taxes: Property Taxes Levied for General Purposes 43,205,414 44,153,447 - - 43,205,414 44,153,447 Sales and Use Taxes 31,298,804 35,034,377 - - 31,298,804 35,034,377 Utility and Other Taxes 49,688,560 45,986,317 - - 49,688,560 45,986,317 Intergovernmental Revenues not Restricted to Specific Programs - - - - - - Unrestricted Investment Earnings 838,502 1,031,093 517,826 643,874 1,356,328 1,674,967 Miscellaneous 295,788 534,788 110,272 2,693,829 406,060 3,228,617
178,105,986 194,169,895 99,556,407 115,061,215 277,662,393 309,231,110
Program ExpensesGovernmental Activities:
General Government 27,798,930 19,324,434 - - 27,798,930 19,324,434 Security/Persons & Property 73,921,770 78,427,360 - - 73,921,770 78,427,360 Physical Environment 474,056 666,994 - - 474,056 666,994 Transportation 29,204,706 34,932,209 - - 29,204,706 34,932,209 Health and Human Services 369,408 375,169 - - 369,408 375,169 Economic Environment 7,657,595 8,954,033 - - 7,657,595 8,954,033 Culture and Recreation 11,257,569 9,989,019 - - 11,257,569 9,989,019 Interest on Long-Term Debt 3,962,630 3,541,843 - - 3,962,630 3,541,843
Business-Type Activities: Water Sewer - - 75,244,743 82,686,843 75,244,743 82,686,843 Parking - - 2,902,381 2,974,384 2,902,381 2,974,384 Airpark - - 631,450 649,954 631,450 649,954 Building Inspection - - 4,179,595 5,173,784 4,179,595 5,173,784 Sanitation - - 2,075,583 2,278,530 2,075,583 2,278,530 Tennis Center - - 1,076,444 1,103,242 1,076,444 1,103,242
Total Expenses 154,646,664 156,211,061 86,110,196 94,866,737 240,756,860 251,077,798
23,459,322 37,958,834 13,446,211 20,194,478 36,905,533 58,153,312 Transfers - Governmental (1,148,169) (1,442,505) - - (1,148,169) (1,442,505) Transfers - Business-Type - - 1,148,169 1,442,505 1,148,169 1,442,505 Change in Net Position 22,311,153 36,516,329 14,594,380 21,636,983 36,905,533 58,153,312 Net Position- Beginning 659,270,928 666,290,926 385,209,534 400,490,315 1,044,480,462 1,066,781,241 Prior year adjustments (15,291,155) (3,172,946) 686,401 (1,430,591) (14,604,754) (4,603,537) Change in accounting principles - (17,385,408) - (13,817,781) - (31,203,189) Net Position - Ending 666,290,926$ 682,248,901$ 400,490,315$ 406,878,926$ 1,066,781,241$ 1,089,127,827$
Governmental Activities Business-Type Activities Total Primary Government
Excess (deficiency) of revenues over expenses
Total Revenues
Charges for Services, Fees, and Fines and Penalties
76.5%
Operating Grants and
Contributions2.8%
Capital Grants and
Contributions20.7%
2015 Program Revenues by Source
Total Governmental
Activities, 62.22%
Total Business -
Type Activities, 37.78%
2015 Comparison of Total Expenses Governmental vs. Business - Type
16

Governmental Activity Analysis Governmental net position increased by $36.5 million in 2015 from operations. This was offset by a decrease related to prior year adjustments of $3.2 million and Change in accounting principles related to GASB 68 of $17.4 million. Governmental activities revenue increased from 2014 by $16.1 million, or 9.0%. An improving local economy is the driving force behind this increase. The major increase in governmental activities revenue is due to increases from Charges for Services, Fees, and Fines and Penalties of 12.0%, Grants and Contributions of 62.0% and Unrestricted Investment Earnings of 23.0%. The increase in revenue from property and sales and use taxes of 6.3% is offset by a decrease in revenue from Utility and Other Taxes of 7.5%. The Washington State Constitution limits the total regular property taxes to 1% of assessed valuation plus new constructions. Governmental activities expenses increased in total by $1.6 million, or 1.0%. In 2015, a reorganization of the administrative costs, consisting of finance, human resources, and information technology, took place as a new internal service fund for administrative function was created. In previous years, these departments were part of the general fund and costs were allocated through an indirect cost allocation plan and reflected in the General Government function. This change in methodology to directly bill to each function for technology and administrative costs caused the General Government function expenses to decrease by $8.5 million, with a correlated increase in expenses in other functions such as Security/Persons and Property, Transportation and Economic Environment functions. Further, Security/Persons and Property expense increased due to personnel costs, specifically the addition of six new positions in the police department, along with an increase in overtime costs and the settlement of union contract negotiations for both police and fire which cause retroactive salary payments. The Transportation increase was partially due to an increase in depreciation expense from the addition of capital assets along with increased spending on pavement management.
General Government
12.4%
Security/persons & property
50.2%Physical
Environment0.4%
Transportation22.4%
Health and Human Services
0.2%
Economic Environment
5.7%
Culture and Recreation
6.4%
Interest on Long-Term
Debt2.3%
2015 Governmental Expenses by Program
General Government
19.4%
Security/persons & property
22.2%
Physical Environment
0.2%
Transportation38.9%
Economic Environment
10.5%
Culture and Recreation
8.8%
2015 Governmental Revenues by Program
Business-Type Activities Analysis Business-type net position increased by $21.6 million in 2015 from operations that was offset by decrease from prior year adjustments of $1.4 million and change in accounting principles of $13.8 million. The Business-Type Activity revenue increased by $15.5 million, or 15.6%; and expenses increased by $8.8 million, or 10.2%. The major increase in Business-Type Activity revenue was from Charges for Services, Fees, and Fines and Forfeitures of $6.4 million, Grants and Contributions $6.4 million, and Miscellaneous revenue $2.6 million. Changes in Charges for Services and Fees are due to water/storm water and sewer rate increases of 5% and 2.5%, respectively; however, pumping statistics show a decrease in water pumped of 1.4% in 2015. The increase in Capital Grants and Contributions were mainly due to an improvement in residential development activity in the City in 2015. The increase in miscellaneous revenue was primarily due to the gain on the sale of the Operations Center. The City’s General Fund purchases a proportionate share of this facility and pursuant to State Accounting the purchase was based on fair-market value just as it would have been with any external party. As depicted in the graphs that follow, the Water/Sewer activity is the largest business-type activity in the City. As a result, the financial position of the City’s business-type activities is strongly influenced by the Water/Sewer activity. This year, Water/Sewer had a $5.9 million increase in Charges for Services, Fees, Fines and Penalties, a $6.4 million increase in Grants and Contributions and a $7.4 million increase in operating expenses. The other business-type activities had moderate gains and losses. Solid Waste activity had a $560,914 net operating loss; parking activity had a $574,707 net operating loss, while the General Fund support of the Parking activity remained at $1.2 million; and the Building Inspection activity had an overall loss of $607,722.
17

Water Sew er87.2%
All Other 12.8%
2015 Business - Type Activity Program Expenses
Water Sew er91.2%
All Other 8.8%
2015 Business - Type Activities Program Revenues
Parking, 20.5%
Airpark, 7.0%
Building Inspection,
46.6%
Solid Waste, 17.5%
Tennis Center, 8.4%
2015 Business - Type Activity Program Revenues excluding Water-Sewer
Parking24.4%
Airpark5.3%
Building Inspection
42.5%
Solid Waste18.7%
Tennis Center9.1%
2015 Business - Type Activity Program Expenses excluding Water-Sewer
FINANCIAL ANALYSIS OF THE CITY'S FUNDS Governmental Funds Analysis The City’s governmental funds are categorized into four types consisting of General, Special Revenue, Debt Service, and Capital Project Funds. Each fund type has a unique purpose. General Fund, Consolidated Fire Fund, and Street Fund are classified as major funds for the purposes of this report, based on criteria set forth by the Government Accounting Standards Board (GASB).
The General Fund is the primary governmental fund. General Fund revenues were up 1.7% over 2014 due primarily to an increase in Property taxes of $886,107 and Sales and Use taxes of $3.7 million, which is primarily due to new construction, auto sales and the general improvement of the economy. The Washington State Constitution limits the total regular property taxes to 1% of assessed valuation plus new constructions. Charges for services decreased $4.0 million, primarily due to the reorganization of the administrative functions to a new Internal Service fund. General Fund expenditures accounted for 48.1% of total governmental fund expenditures for 2015, and increased by only $305,233, or 0.4%, mainly due to an indirect charges for information technology and administrative costs that are now charged by the internal service fund. The General Fund’s fund balance decreased $4.5 million inclusive of $276,433 prior period adjustment. The Consolidated Fire Fund is a special revenue fund that encompasses both the operations and the equipment for the City’s and Fire District 5’s fire department. Services provided by this fund include not only firefighting, but emergency medical services, rescue, and public safety education. As reported in the Statement of Revenues, Expenditures and Statement of Changes in Fund Balances, major funding for the Consolidated Fire Fund is Charges for Services and a transfer from the City’s General Fund. The Consolidated Fire Fund in 2015 accounted for 20.7% of the governmental funds expenditures; an increase of $3.3 million from 2014 due to increased personnel costs, operating supplies, protective clothing, and purchase of minor tools. The Consolidated Fire Fund’s fund balance increased by $638,572. The Street Fund is a special revenue fund established in accordance with State RCW 35A.37.010 for the administration of street-oriented maintenance and construction. Revenues are derived from tax contributions distributed from the General Fund, state shared gasoline tax, an excise tax of ¼ of 1% of property value of transferred property and rents and royalties. The total of 10.8% of governmental fund expenditures were attributable to the Street fund in 2015, an increase of $2.5 million from 2014 due to increase personnel costs, contracted services, and Capital outlay for pavement management program which has been funded to 100% of policy level to ensure existing infrastructure is maintained to constrain future maintenance costs. In 2015, the Street Fund’s fund balance increased by $68,829.
All other non-major governmental operating, debt service and capital construction funds comprise the remaining governmental expenditures.
18

Business-Type Funds Analysis Proprietary, or business-type, funds are those funds that account for government operations where the intent is for the costs to be primarily paid by user charges. Enterprise funds are those funds that provide services primarily to external users, and the internal service funds provide their services primarily within the City. The City has fourteen business-type funds: six are enterprise funds, and eight are internal service funds. The Water/Sewer Fund (Utility) is the largest business-type fund in the City, accounting for 95.6% of net position for the enterprise funds at $388.9 million. This fund encompasses three legally consolidated utilities: water, sewer, and storm water operations. The Utility fund net position increased by $22.4 million in 2015, which was offset by a $1.4 million prior period adjustment and $11.1 million change in accounting principle related to GASB 68 implementation. The net increase of $9.9 million was primarily due to the increase in utility Charges for Services, increased Capital Contributions and the Gain on Sale of Assets to the General Fund. The Utility reported operating income of $5.8 million in 2015; its operating revenue increase of 7.3% over 2014 is primarily due to water/storm water and sewer rate increases of 5% and 2%, respectively. Utility operating expenses increased by $7.9 million or 10.8% from 2014, mainly related to increased costs across all categories. Interfund services increased $2.6 million, or 35.0%, and supplies and contractual services increased $3.2 million or 17.7%. Additionally, capital assets increased by $3.5 million and its bonded indebtedness decreased by $10.1 million in 2015. The Utility recognized $10.5 million in Net Pension Liability from the implementation of GASB 68, resulting in an $11.1 million change in accounting principles. The Parking Services Fund reported an operating loss of $574,707 in 2015. Operating revenues increased by $234,079 due to lower vacancies caused by the recovering economy. Operating expenses increased by $81,812 from 2014 due to an increase in Intergovernmental Payments and Interfund Services. The General Fund support of the Parking Services Fund remained at the $1.2 million level in 2015. Over time, the fund is anticipated to become self-supporting. Parking Services change in net position decreased by $119,850, after considering the change in accounting principles related to recognizing the fund’s share of pension activity. The non-major business funds present an operating loss of $1.4 million, and the Building Inspection Fund and Solid Waste accounting for the majority of the decrease in total net position. The Building Inspection Fund reported a $607,722 operating loss. Revenues increased $912,336, or 25.0% due to the recovering housing market; however, operating expenses increased at about the same rate, specifically in the Personnel and Interfund Services category. The Solid Waste fund presented an operating loss of $560,914 due to the 24.5% decrease in operating revenues, which resulted from lower market values for recyclable commodities. The non-major business funds represent $2.2 million of the Net Pension Liability in 2015. Internal Service funds operate like the enterprise funds, but perform services primarily for other funds within the City. Because of the nature of these funds, they are charged with operating as close as possible to a breakeven point. City Internal Service funds net position increased by $7.2 million from 2014, before considering the change in accounting principles and prior period adjustments. Two new funds were created in 2015, the Self Insured Health Insurance and the Internal Administrative Services Funds. Operating income of all City Internal Service funds totaled $4.1 million resulting mainly from the accumulation of reserves for future replacement of equipment and computers. The internal service funds proportionate share of the Pension Liability is $5.4 million at the end of 2015. Implementation of this standard resulted in a $5.7 million change in accounting principle. GENERAL FUND BUDGETARY HIGHLIGHTS Between 2001 and 2010, the City has addressed an ongoing structural deficit each biennium that is a result of growth in expenditures outpacing growth in revenues. Contributing factors to this deficit include the voters’ passage of Initiative 695, which eliminated the motor vehicle excise tax in 2000; Initiative 747, which beginning in 2002 limited increases in property taxes to the lower of 1 percent or the implicit price deflator; the phase out and elimination of the city’s Business and Occupation Tax beginning in 1993, and significantly greater City reliance on revenues that fluctuate with the economy. During the “great recession” the City undertook numerous measures to operate within the constraints of a weakened global, national and local economy. The City has had relative financial stability between 2011 through 2015-2016 Budget. There were no service level or staffing reductions taken during this period of time. The City was also able to absorb positions in Fire and Police that were funded with grant dollars. A total of 13 FTEs in Fire and 19 FTEs in Police were retained with the General Fund dollars on a permanent basis over the last three years. Effective in January of 2016, six additional police officer positions were approved. Five additional positions were approved for Street/right of way maintenance and one position was approved for parks maintenance to start up irrigation systems in a number of city parks. The City undertook a thorough analysis and review of sound financial policies and in 2012 financial policies were adopted by City Council. These polices are reviewed every two years during the budget development process. The policies ensure that the City maintains a healthy financial foundation into the future. These policies address such items as debt, future capital needs, and adequate reserves to build a stable and sustainable future and guide creation of City budgets. The final 2015-2016 biennial budget totals $1.027 billion in operating and capital expenditures, including 975 positions. The budget was balanced without the implementation of new taxes or tax increases other than the annual 1% authorized increase to property taxes and inflationary adjustments of utility rates and select fees on city services.
19

CAPITAL ASSETS AND DEBT ADMINISTRATION Capital Assets The City of Vancouver’s investment in capital assets, including construction in progress, for its governmental and business type activities as of December 31, 2015, amounts to $969.7 million (net of accumulated depreciation). The table that follows is a comparison of the summary information for year-end 2014 and 2015 capital assets. The 2014 capital asset balances have been restated in the table below as well as the notes to the financial statement, but were reported as prior period adjustments on the government wide statement of activities. These restatements are not reported in the comparative statement of Net Position shown earlier in this analysis. The 2014 total governmental and business-type capital assets that were reported in 2014 at $599,509,374 and $358,944,646 respectively are still currently shown in the comparative statement of net position.
2014 Restated 2015 2014 Restated 2015 2014 Restated 2015
Land $ 69,203,013 $ 82,548,079 $ 33,026,876 $ 33,775,092 $ 102,229,889 $ 116,323,171Intangible - Easements 8,089,930 8,126,333 4,676,838 5,651,804 12,766,768 13,778,137Buildings and systems 82,643,324 82,083,830 16,749,597 15,233,294 99,392,921 97,317,124Machinery and equipment 16,944,982 15,687,104 2,350,974 2,372,855 19,295,956 18,059,959Infrastructure 398,184,876 402,139,424 296,455,246 292,236,807 694,640,122 694,376,231Intangible assets 1,178,908 936,389 814,022 545,000 1,992,930 1,481,389Construction in progress 19,412,355 17,083,846 3,660,405 11,252,961 23,072,760 28,336,807
Total $ 595,657,388 $ 608,605,005 $ 357,733,958 $ 361,067,813 $ 953,391,346 $ 969,672,818
Governmental Activities Business-Type Activities Total Activities
City of VancouverCapital Assets, Net of Depreciation
Comparative 2014-2015
The major changes for assets were in Infrastructure and Construction in progress (CIP) for both Governmental and Business-Type Activities categories, and Land for Governmental Activities. The increase in Infrastructure for Governmental Activities is related to the completion and capitalization of the Waterfront Renaissance Trail and city sidewalks; while the overall decrease in Business-Type Activities relates to depreciation. The decrease in CIP for Governmental Activities relates to finishing and capitalized ongoing projects, and the increase in CIP for Business-type Activities relates to addition of new unfinished projects. Land in the Governmental Activities increased due to purchase of Fire Station 1 property, the donation of land for Columbia Waterfront and the purchase of land right of ways. Additional information on City of Vancouver’s capital assets can be found in note III.B of this report. Long-Term Debt At December 31, 2015, the City of Vancouver had total bonded debt outstanding of $129.8 million. Of this amount, $91.7 million is General Obligation debt, which is backed by the full faith and credit of the government. The remainder of the City’s debt of $31.3 million represents bonds secured solely by specific revenue sources (i.e., revenue bonds). The below table is a comparison of the summary information for year-end 2014 and 2015 bonded debt. The City of Vancouver’s total bonded debt decreased by $13.8 million, the result of scheduled principal payments made throughout 2015. In 2015, the City issued two new General obligation bonds. The 2015A LTGO Bonds (Mini Bonds) were issued to provide funding for remodeling the West Barracks in the Vancouver National Historic Reserve. The City also issued 2015B LTGO and Refunding Bonds, which included additional funding for the West Barracks, and also partially refunded three LTGO bond issues issued in 2005, 2006, and 2008. The City's remaining capacity for non-voted debt is approximately $221.3 million.
2014 2015 2014 2015 2014 2015
General obligation bonds $ 85,929 $ 81,538 $ 11,266 $ 10,133 $ 97,195 $ 91,671Revenue bonds - - 40,895 31,345 40,895 31,345Net Amounts for:
Issuance premiums (discounts) 3,492 5,349 1,994 1,418 5,486 6,767Total $ 89,421 $ 86,887 $ 54,155 $ 42,896 $ 143,576 $ 129,783
Governmental Activities Business-Type Activities Total Activities
City of Vancouver Outstanding Bonded Debt(in thousands)
The City of Vancouver maintains an “Aa2”/”AA+” issuer rating from Moody’s/Standard and Poor’s (S & P) rating services, respectively. The City’s LTGO bonds are rated Aa3/AA+. Additional information on the City’s long-term debt can be found in Note III.E of this report.
20

ECONOMIC FACTORS AND NEXT YEAR'S BUDGETS AND RATES Revenue projections for 2016 indicate that revenues are anticipated to continue increasing over the projected time period, driven mostly by the economic stabilization. Some tempering in the rate of growth of sales tax is anticipated in 2016. The City has enjoyed several years of stability and was able to set aside funding for several high priority capital projects, such as the Waterfront Park and two replacement Fire Stations. The City’s management continues its commitment to seeking out and implementing new cost containment and service delivery options to ensure the most efficient and effective way of service delivery and savings over the long run. The City agencies have embarked on a process of developing their business plans and priorities at the same time as City Council is developing the vision and strategic plan for the City of Vancouver over the long term. The City has had a very successful year in finding a long-term solution to the street infrastructure funding. An intensive community engagement process took place during 2015 resulting in a recommendation to Council on the desired service level in city street maintenance and a new revenue package to fund the enhancements in the service level. As the result of the process, a number of new funding sources and revenue increases was approved that would ultimately improve the City’s roads from “fair” to “good” over the next 20-year period. A similar process is anticipated to take place in 2016 in relation to the service and staffing levels in Police. Requests for Information This financial report is designed to provide a general overview of City of Vancouver’s finances for all those with an interest in the government's finances. Questions concerning any of the information provided in this report, or requests for additional financial information, should be addressed to Financial and Management Services, City of Vancouver, P.O. Box 1995, Vancouver, WA, 98668-1995.
21
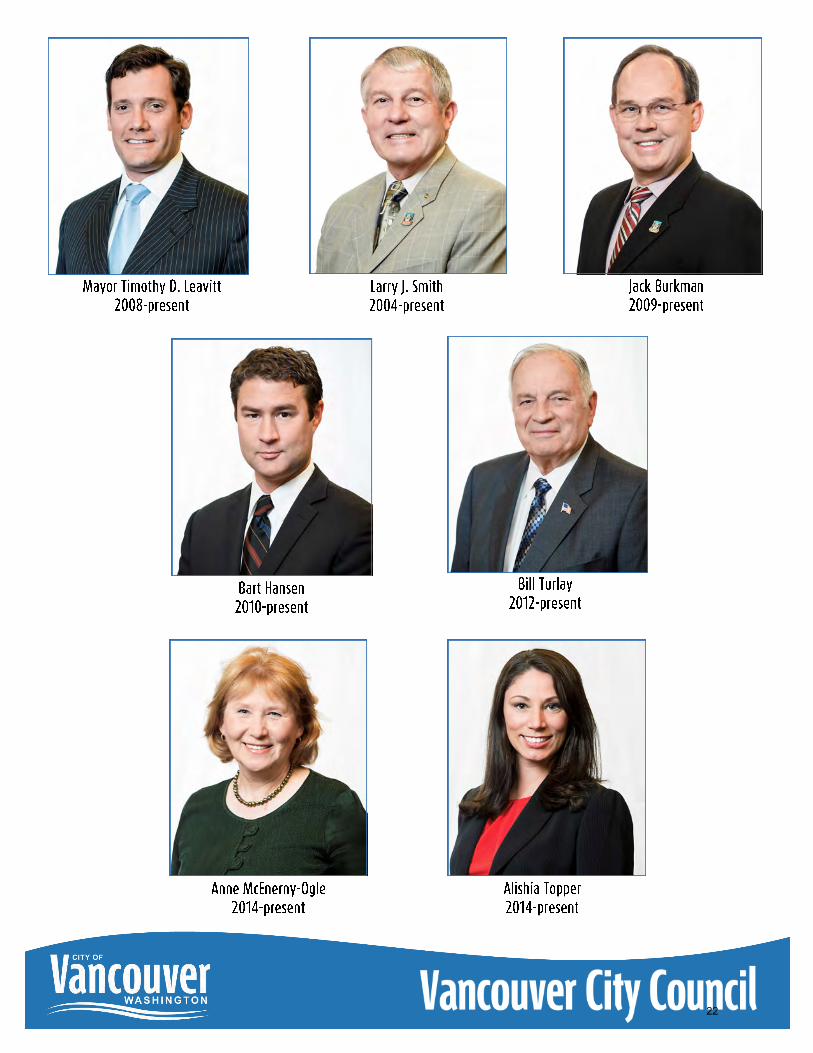
22

Government-Wide Financial Statements
23

The notes to the basic financial statments are an integral part of this statement
CITY OF VANCOUVERSTATEMENT OF NET POSITIONDecember 31, 2015
ASSETS Governmental
Activities Business-type
Activities Total Primary Government
Vancouver Downtown
Redevelopment Authority
Vancouver Public Facilities District
Cash and cash equivalents $ 191,446,940 $ 85,821,741 $ 277,268,681 $ 94,656 $ 117,204 Cash with fiscal/escrow agent - - - 7,773,566 - Restricted assets
Cash - 9,298,639 9,298,639 - - Accrued interest receivable - 8,960 8,960 - -
Receivables (net of allowance for uncollectible accounts) 20,158,830 9,633,429 29,792,259 1,549,940 228,590 Inventories 477,684 964,704 1,442,388 35,441 - Capital assets held for resale 272,400 272,400 - - Prepaid Items 195,940 - 195,940 141,016 - Internal balances (3,621,652) 3,621,652 - - - Investment in joint venture 6,158,680 - 6,158,680 - - Due from other governmental units 1,356,062 1,356,062 - 257,849 Net pension asset 17,238,176 - 17,238,176 - - Capital assets (net of accumulated depreciation)
Land 82,548,079 33,775,092 116,323,171 - 3,603,691 Easements 8,126,333 5,651,804 13,778,137 - - Buildings 82,083,830 15,233,294 97,317,124 34,087,018 - Machinery and equipment 15,687,104 2,372,855 18,059,959 2,571,785 - Infrastructure 402,139,424 292,236,807 694,376,231 - - Intangible assets 936,389 545,000 1,481,389 - - Construction work in progress 17,083,846 11,252,961 28,336,807 5,320,263 -
Total Assets 842,288,065 470,416,938 1,312,705,003 51,573,685 4,207,334
DEFERRED OUTFLOWS OF RESOURCESUnamortized loss on refunding 2,972,955 1,492,754 4,465,709 1,251,761 - Amounts related to pension 4,948,253 1,703,551 6,651,804 - -
Total deferred outflows of resources 7,921,208 3,196,305 11,117,513 1,251,761 -
LIABILITIES Accounts payable and other current liabilities 9,552,370 5,249,739 14,802,109 1,270,629 589,938 Accrued interest payable 301,611 163,137 464,748 1,297,431 - Unearned revenue 319,284 168,886 488,170 184,765 - Custodial accounts 328,371 276,240 604,611 - - Noncurrent liabilities:
Environmental remediation - 399,000 399,000 - -
45,000 - 45,000 - -
125,000 - 125,000 - - Net pension liability 19,091,441 13,150,390 32,241,831 - - Due within one year 21,563,391 13,906,752 35,470,143 900,000 - Due in more than one year 109,151,840 31,403,310 140,555,150 68,514,071 -
Total Liabilities 160,478,308 64,717,454 225,195,762 72,166,896 589,938
DEFERRED INFLOWS OF RESOURCESAmounts related to pension 7,482,064 2,016,863 9,498,927 - -
Total deferred inflows of resources 7,482,064 2,016,863 9,498,927 - -
NET POSITIONNet investment in capital assets 510,481,006 319,491,178 829,972,184 (17,965,661) 3,603,691 Restricted for:
Capital purposes 18,539,373 5,483,216 24,022,589 - - Debt service 2,110,820 3,725,208 5,836,028 2,970,030 - Grant purposes 5,266,449 - 5,266,449 - - Security purposes 18,905,380 - 18,905,380 - - Economic purposes 3,012,156 3,012,156 Parks & Recreation purposes 47,676 47,676 - -
Unrestricted 123,886,041 78,179,324 202,065,365 (4,345,819) 13,705 Total Net Position $ 682,248,901 $ 406,878,926 $ 1,089,127,827 $ (19,341,450) $ 3,617,396
Special assessment debt with governmental commitments due within one yearSpecial assessment debt with governmental commitments due in more than one year
Component UnitsPrimary Government
24
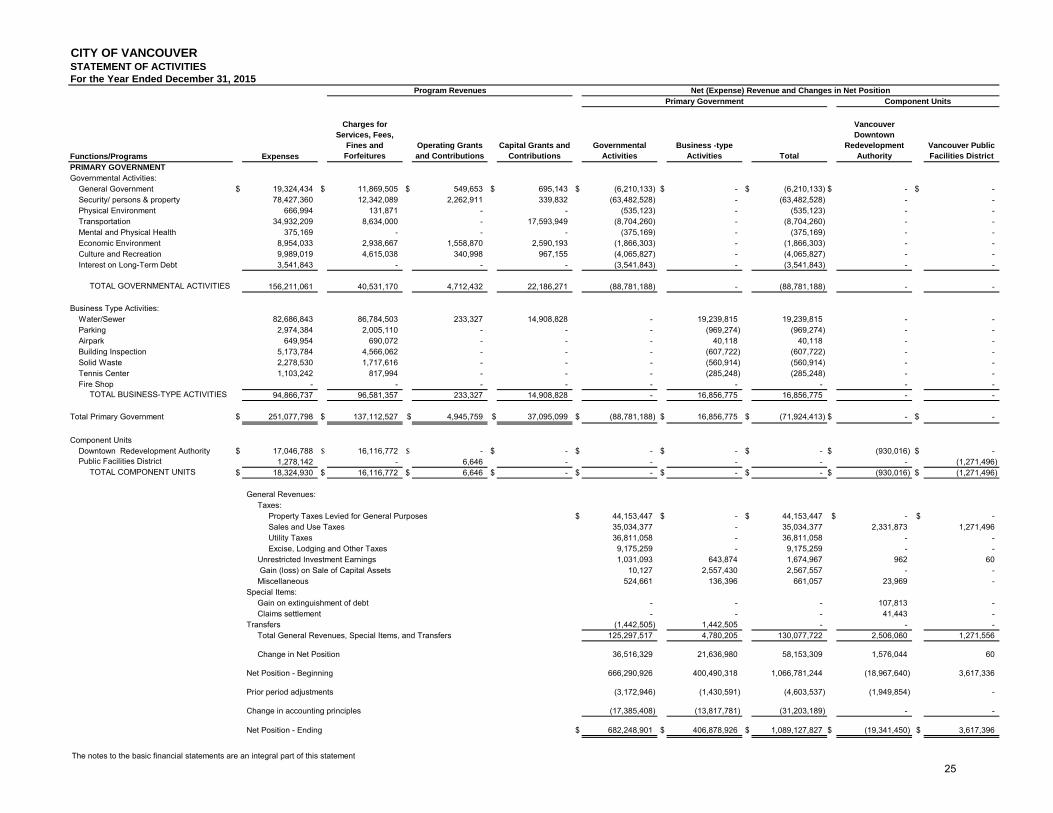
The notes to the basic financial statements are an integral part of this statement
CITY OF VANCOUVERSTATEMENT OF ACTIVITIESFor the Year Ended December 31, 2015
Functions/Programs Expenses
Charges for Services, Fees,
Fines and Forfeitures
Operating Grants and Contributions
Capital Grants and Contributions
Governmental Activities
Business -type Activities Total
Vancouver Downtown
Redevelopment Authority
Vancouver Public Facilities District
PRIMARY GOVERNMENTGovernmental Activities:
General Government $ 19,324,434 $ 11,869,505 $ 549,653 $ 695,143 $ (6,210,133) $ - $ (6,210,133) $ - $ - Security/ persons & property 78,427,360 12,342,089 2,262,911 339,832 (63,482,528) - (63,482,528) - - Physical Environment 666,994 131,871 - - (535,123) - (535,123) - - Transportation 34,932,209 8,634,000 - 17,593,949 (8,704,260) - (8,704,260) - - Mental and Physical Health 375,169 - - - (375,169) - (375,169) - - Economic Environment 8,954,033 2,938,667 1,558,870 2,590,193 (1,866,303) - (1,866,303) - - Culture and Recreation 9,989,019 4,615,038 340,998 967,155 (4,065,827) - (4,065,827) - - Interest on Long-Term Debt 3,541,843 - - - (3,541,843) - (3,541,843) - -
TOTAL GOVERNMENTAL ACTIVITIES 156,211,061 40,531,170 4,712,432 22,186,271 (88,781,188) - (88,781,188) - -
Business Type Activities:Water/Sewer 82,686,843 86,784,503 233,327 14,908,828 - 19,239,815 19,239,815 - - Parking 2,974,384 2,005,110 - - - (969,274) (969,274) - - Airpark 649,954 690,072 - - - 40,118 40,118 - - Building Inspection 5,173,784 4,566,062 - - - (607,722) (607,722) - - Solid Waste 2,278,530 1,717,616 - - - (560,914) (560,914) - - Tennis Center 1,103,242 817,994 - - - (285,248) (285,248) - - Fire Shop - - - - - - - - -
TOTAL BUSINESS-TYPE ACTIVITIES 94,866,737 96,581,357 233,327 14,908,828 - 16,856,775 16,856,775 - -
Total Primary Government $ 251,077,798 $ 137,112,527 $ 4,945,759 $ 37,095,099 $ (88,781,188) $ 16,856,775 $ (71,924,413) $ - $ -
Component UnitsDowntown Redevelopment Authority $ 17,046,788 $ 16,116,772 $ - $ - $ - $ - $ - $ (930,016) $ - Public Facilities District 1,278,142 - 6,646 - - - - - (1,271,496)
TOTAL COMPONENT UNITS $ 18,324,930 $ 16,116,772 $ 6,646 $ - $ - $ - $ - $ (930,016) $ (1,271,496)
General Revenues:Taxes:
Property Taxes Levied for General Purposes $ 44,153,447 $ - $ 44,153,447 $ - $ - Sales and Use Taxes 35,034,377 - 35,034,377 2,331,873 1,271,496 Utility Taxes 36,811,058 - 36,811,058 - - Excise, Lodging and Other Taxes 9,175,259 - 9,175,259 - -
Unrestricted Investment Earnings 1,031,093 643,874 1,674,967 962 60 Gain (loss) on Sale of Capital Assets 10,127 2,557,430 2,567,557 - - Miscellaneous 524,661 136,396 661,057 23,969 -
Special Items:Gain on extinguishment of debt - - - 107,813 - Claims settlement - - - 41,443 -
Transfers (1,442,505) 1,442,505 - - - Total General Revenues, Special Items, and Transfers 125,297,517 4,780,205 130,077,722 2,506,060 1,271,556
Change in Net Position 36,516,329 21,636,980 58,153,309 1,576,044 60
Net Position - Beginning 666,290,926 400,490,318 1,066,781,244 (18,967,640) 3,617,336
Prior period adjustments (3,172,946) (1,430,591) (4,603,537) (1,949,854) -
Change in accounting principles (17,385,408) (13,817,781) (31,203,189) - -
Net Position - Ending $ 682,248,901 $ 406,878,926 $ 1,089,127,827 $ (19,341,450) $ 3,617,396
Program Revenues Net (Expense) Revenue and Changes in Net PositionPrimary Government Component Units
25

This page has been intentionally left blank
26

Fund Financial Statements
General Fund In the City of Vancouver, this fund accounts for all receipt and disbursement transactions that are not specifically accounted for in other funds and which are generally considered to represent the ordinary operations of a municipality. This fund is both tax and general revenue supported. Expenditures are budgeted bi-annually on the modified accrual basis and its appropriations lapse at year-end. The primary sources of revenues for the General Fund are: property tax, sales tax, utility taxes, licenses and permits, the state shared liquor and vehicle excise tax, court fines, and reimbursements from other funds of the City for pro-rating the costs of management and overhead. Street Fund This is a general government service fund established in accordance with State RCW 35A.37.010 for the administration of street-oriented maintenance and construction. Revenues are derived from tax contributions distributed from the General Fund, state shared gasoline tax, an excise tax of ¼ of 1% of property value of transferred property, fines and fees. Consolidated Fire Fund This fund was established as a result of an agreement between the City of Vancouver and Fire District 5 to provide fire services. Two fire departments were consolidated and are now under the direction of the City. The fund will account for money received and expenditures made in providing fire services to the combined City and Fire District 5 service area. Water/Sewer Fund Water/Sewer Fund receives its revenue from service charges and from the sales of materials and supplies. Expenditures are for maintenance and extensions of drainage, water and sewer service facilities, operating a water supply system, maintaining sewer treatment plants, and operating a water drainage system. This fund also reflects the operation of revenue bonds outstanding, the funds available for redemption bonds, accumulative reserve, and construction funds. Parking Services Fund The Parking Services Fund was created in October 1981. It receives revenues from operations of City owned or operated public parking lots. Its expenses are directly related to the operation and maintenance of those facilities.
27

CITY OF VANCOUVERBALANCE SHEETGOVERNMENTAL FUNDSDecember 31, 2015
OtherNon-Major Total
General FundConsolidated
Fire Street FundGovernmental
FundsGovernmental
FundsASSETS
Cash and cash equivalents $ 55,288,983 $ 18,091,307 $ 6,582,590 $ 62,480,580 $ 142,443,460 Receivables (net)
Taxes/assessments 10,909,187 - 1,058,274 819,231 12,786,692 Accounts 347,129 132,627 73,647 816,460 1,369,863 Interest 55,383 17,524 6,383 60,500 139,790 Notes - - - 5,147,120 5,147,120
Due from other funds 282,829 31,306 796 499,303 814,234 Due from other governmental units 225,217 4,066 - 1,126,779 1,356,062 Capital assets held for resale 228,400 - - - 228,400 Prepaid items 88,348 - - 7,593 95,941
TOTAL ASSETS $ 67,425,476 $ 18,276,830 $ 7,721,690 $ 70,957,566 $ 164,381,562
LIABILITIESAccounts payable $ 2,847,727 $ 149,764 $ 141,996 $ 1,331,454 $ 4,470,941 Advances from other funds 3,443,844 - - - 3,443,844 Due to other funds 522,317 21,692 20,879 174,117 739,005 Due to other governmental units - - - 229,875 229,875 Accrued interest payable 124 - - - 124 Accrued liabilities 2,126,298 1,170,525 189,496 68,367 3,554,686 Revenues collected in advance 227,666 56,667 2,670 3,123 290,126 Custodial accounts 265,191 738 55,451 945 322,325 Unearned revenue - - - 29,158 29,158
Total liabilities 9,433,167 1,399,386 410,492 1,837,039 13,080,084
DEFERRED INFLOWS OF RESOURCESUnavailable revenue-property taxes 754,879 - - - 754,879
- - - 143,648 143,648
214,690 42,289 - 168,142 425,121
- - - 321,403 321,403 Total deferred inflows of resources 969,569 42,289 - 633,193 1,645,051
FUND BALANCESNonspendable 316,748 - - 7,593 324,341 Restricted 78,647 16,835,155 - 40,266,788 57,180,590 Committed 44,944,108 - 7,311,198 7,786,036 60,041,342 Assigned 3,787,063 - - 20,426,917 24,213,980 Unassigned 7,896,174 - - - 7,896,174
Total fund balances 57,022,740 16,835,155 7,311,198 68,487,334 149,656,427
$ 67,425,476 $ 18,276,830 $ 7,721,690 $ 70,957,566 164,381,562
Major Funds
TOTAL LIABILITIES, DEFERRED INFLOWS OF RESOURCES AND FUND BALANCES
Unavailable revenue-special assessments
Unavailable revenue-capital improvements
Unavailable revenue-grants and other
28The notes to the basic financial statements are an integral part of this statement.

The notes to the financial statements are an integral part of this statement.
CITY OF VANCOUVERRECONCILIATION OF THE BALANCE SHEET OF GOVERNMENTAL FUNDS TO THE GOVERNMENT WIDE STATEMENT OF NET POSITIONDecember 31, 2015
Fund Balance - Total Governmental Funds 149,656,427$
602,360,291
44,000
Bonds Payable (81,538,286) Plus: Issuance (Premium)/Discount (to be amortized as interest income) (5,348,914)
Special assessment debt (170,000) Accrued interest payable (301,487) Government loans (4,700,176)
(7,319,126) Impact fee credits (17,010,200) Net OPEB obligation (8,645,111) Net Pension Liability Mulit-Employer Plan (13,193,140) Net Pension Liability - Single Employer Plan (473,768)
Deferred amounts eliminated for government-wide 1,645,050 Investments in joint ventures 6,158,680 Net Pension Assets Multi-Employer Plan 16,309,449 Net pension asset - Single Employer Plan 928,727
Deferred outflows/(inflows) required to be recognized on government-wide2,972,955 4,245,540
(6,650,109)
43,278,099
Total net position of governmental activities 682,248,901$
Deferred outflows - unamortized loss on refunding (to be amortized as interest expense)Deferred outflows - related to pensionsDeferred inflows - related to pensions
Internal service funds are used to charge the costs of services to individual funds. The assets and liabilities of
Amounts reported for governmental activities in the statement of net position are different because (See Note II
Capital assets used in governmental activities are not financial resources and therefore are not reported in the funds
Capital Assets Held for Resale used in governmental activities that are not financial resources and therefore are not reported in the funds
Long-term liabilities that are not due and payable in the current period and are not reported in the funds
Compensated absences for non-Internal Service Funds
Other long-term assets are not available to pay for current-period expenditures and, therefore are deferred in
29

CITY OF VANCOUVERSTATEMENT OF REVENUES, EXPENDITURES AND CHANGES IN FUND BALANCESGOVERNMENTAL FUNDSFor the Year ended December 31, 2015
OtherNon-Major Total
General FundConsolidated
Fire Street FundGovernmental
FundsGovernmental
FundsREVENUES
Property taxes $ 44,230,563 $ - $ - $ - $ 44,230,563 Sales and use taxes 35,034,377 - - - 35,034,377 Other taxes 37,483,232 - 3,246,532 5,367,280 46,097,044 License and permits 1,102,543 572,211 378,397 2,525,981 4,579,132 Intergovernmental 5,016,528 43,329 3,557,599 9,177,844 17,795,300 Charges for services 9,447,941 9,405,914 495,481 3,078,478 22,427,814 Fines and penalties 1,447,917 16,938 - 100,921 1,565,776 Investment earnings 478,373 75,879 38,602 252,765 845,619 Rents and royalties 3,574,825 57,655 498,400 652,977 4,783,857 Contributions/donations 315,281 50,452 - 945,434 1,311,167 Miscellaneous 192,495 19 2,599 329,548 524,661
Total revenues 138,324,075 10,222,397 8,217,610 22,431,228 179,195,310
EXPENDITURESCurrent
General government 17,846,590 - - 1,750,222 19,596,812 Security/persons & property 44,326,974 34,074,368 - 518,620 78,919,962 Physical environment 590,653 - - 25,205 615,858 Transportation 132,767 - 11,818,002 2,917,016 14,867,785 Economic environment 5,364,859 - - 3,661,091 9,025,950 Mental and physical health 375,169 - - - 375,169 Culture and recreation 8,399,043 - - 2,131,792 10,530,835
Capital outlay 4,234,742 890,898 6,476,572 9,125,023 20,727,235 Debt service
Principal retirement - - - 10,225,697 10,225,697 Interest/fiscal charges - - - 3,960,811 3,960,811
Total expenditures 81,270,797 34,965,266 18,294,574 34,315,477 168,846,114
Excess (deficiency) of revenuesover (under) expenditures 57,053,278 (24,742,869) (10,076,964) (11,884,249) 10,349,196
OTHER FINANCING SOURCES (USES)Capital related debt issued - - - 4,771,500 4,771,500 Sale of capital assets - (1,974) - 332,978 331,004 Refunding bond issued - - - 19,625,000 19,625,000 Payment to refunded bond escrow account - - - (22,373,995) (22,373,995) Premium on debt issued - - - 3,220,364 3,220,364 Fiscal charges - - - (145,600) (145,600) Transfers in 625,064 25,923,859 11,831,555 37,548,344 75,928,822 Transfers out (61,956,379) (540,444) (1,685,762) (15,517,539) (79,700,124)
Total other financing sources and uses (61,331,315) 25,381,441 10,145,793 27,461,052 1,656,971
Net change in fund balances (4,278,037) 638,572 68,829 15,576,803 12,006,167
FUND BALANCES - BEGINNING 61,577,210 16,196,583 7,242,369 52,530,849 137,547,011 Prior period adjustments (276,433) - - 379,682 103,249
FUND BALANCES - ENDING $ 57,022,740 $ 16,835,155 $ 7,311,198 $ 68,487,334 $ 149,656,427
Major Funds
30The notes to the basic financial statements are an integral part of this statement.

CITY OF VANCOUVERRECONCILIATION OF THE STATEMENT OF REVENUES, EXPENDITURES AND CHANGES IN FUNDBALANCE OF GOVERNMENTAL FUNDS TO THE GOVERNEMENT WIDE STATEMENT OF ACTIVITIESFor the Year Ended December 31, 2015
Amounts reported for governmental activities in the statement of activities are different because:
Net Change in fund balances - total governmental funds $ 12,006,167
(2,879,509) Capital Outlay 18,687,623 Depreciation Expense (21,567,132)
15,224,605
(2,597,140) Earned taxes (77,116) Earned special assessments (110,727) Earned revenue considered available at fund level 198,326 Contributions related to impact fee credits (5,031,860) Contributions related to pension 1,257,591 Miscellaneous revenues related to joint venture 1,166,646
4,982,828 Defeasance of bonds - refunding 20,820,000 Issuance of bonds (24,396,500) Amount deferred on issuance of debt 870,330 Premiums recognized on issuance of debt (3,248,730) Remove premiums on old debt 683,665 Discounts recognized on issuance of debt 28,366 General obligation debt payments 7,967,392 Governmental loan payments 2,116,471 Special assessment debt payments 141,834
2,568,655 Compensated absences (104,851) OPEB Cost (1,431,921) Pension - single employer plan 1,536,082 Pension Cost - multiple employer plan 2,150,377 Accrued Interest 21,236 Amortization of deferred amount on refunding (281,362) Amortization of discounts/premiums 679,094
7,210,723
Changes in Net Position of Governmental Activities $ 36,516,329
Some expenses reported in the statement of activities do not require the use of current financial resources and, therefore, are not reported as expenditures in governmental funds.
Internal service funds are used by management to charge the costs of equipment, insurance and printing to individual funds. The net revenue of certain activities of internal service funds is reported with governmental activities.
The issuance of long-term debt provides current financial resources to governmental funds, while the repayment of the principal of long-term debt consumes the current financial resources of governmental funds. Neither transaction, however, has any effect on net position. Also governmental funds report the effect of issuance costs, premiums, discounts and similar items when debt is first issued, whereas these amounts are deferred and amortized in the statement of activities. This amount is the net effect of these differences in the treatment of long-term debt and related items.
Governmental funds report capital outlays as expenditures. However in the statement of activities the cost of those assets is allocated over their estimated useful lives and reported as depreciation expense.
The net effect of various miscellaneous transactions involving capital assets ( i.e., sales, trade-ins, and donations) not reported in governmental funds.
Revenues in the statement of activities that do not provide current financial resources are not reported as revenues in the funds.
31The notes to the basic financial statements are an integral part of this statement.

ActualOriginal Final Biennium2015-16 2015-16 To- Date VarianceBiennium Biennium Thru 12/31/15 Thru 12/31/15
REVENUESProperty tax $ 88,821,650 $ 88,821,650 $ 44,230,563 $ 44,591,087 Sales and use taxes 63,822,529 61,924,045 35,034,377 26,889,668 Other taxes 73,289,444 77,248,894 37,483,232 39,765,662 License and permits 1,845,602 1,851,602 1,102,543 749,059 Intergovernmental 6,702,851 9,253,636 5,016,528 4,237,108 Charges for services 18,215,177 18,277,293 9,265,098 9,012,195 Fines and forfeitures 3,189,454 3,189,454 1,447,917 1,741,537 Investment earnings 969,457 969,457 478,193 491,264 Rents and royalties 6,254,613 6,615,164 3,574,825 3,040,339 Contributions/donations - 154,100 315,281 (161,181) Miscellaneous 1,218,618 1,248,618 192,495 1,056,123
Total revenues 264,329,395 269,553,912 138,141,052 131,412,860
EXPENDITURESCurrent:
General government 39,716,577 39,722,307 17,846,590 21,875,717 Security/persons & property 92,076,730 90,997,286 44,145,348 46,851,938 Physical environment 1,168,392 1,188,392 590,653 597,739 Transportation 280,800 341,888 132,767 209,121 Economic environment 11,026,167 11,510,910 5,364,859 6,146,051 Mental and physical health 752,630 752,630 375,169 377,461 Culture and recreation 17,539,924 17,598,852 8,399,043 9,199,809
Capital outlay 75,201 4,524,478 4,234,742 289,736 Total expenditures 162,636,421 166,636,745 81,089,171 85,547,574
Excess (deficiency) of revenuesover expenditures 101,692,974 102,917,167 57,051,881 45,865,286
OTHER FINANCING SOURCES (USES)Sale of capital assets - 280,000 - 280,000 Transfers in 1,198,096 1,707,454 625,064 1,082,390 Transfers out (103,668,038) (114,588,669) (61,956,379) (52,632,290)
Total other financing sources (uses) (102,469,942) (112,601,215) (61,331,315) (51,269,900)
Net change in fund balance (776,968) (9,684,048) (4,279,434) (5,404,614)
FUND BALANCES - BEGINNING 61,577,210 61,577,210 61,577,210 - Prior period adjustments - - (276,433) 276,433
FUND BALANCES - ENDING $ 60,800,242 $ 51,893,162 $ 57,021,343 $ (5,128,181)
principles (GAAP) basis:
Riverwest RDA Fund budgeted as separate fund 1 School District ImPact Fees budgeted as separate fund (69) SW Washington Regional SWAT Team budgeted as separate fund 1,465
Fund Balance GAAP basis: $ 57,022,740
Adjustment to generally accepted accounting
Budget Amounts
CITY OF VANCOUVERGENERAL FUNDSTATEMENT OF REVENUES, EXPENDITURES, AND CHANGES IN FUND BALANCESCOMPARED TO BUDGET (GAAP BASIS) AND ACTUALFor the Year Ended December 31, 2015
32The notes to the basic financial statements are an integral part of this statement.

ActualOriginal Final Biennium2015-16 2015-16 To- Date VarianceBiennium Biennium Thru 12/31/15 Thru 12/31/15
REVENUESLicense and permits $ 1,022,241 $ 1,125,027 $ 572,211 $ 552,816 Intergovernmental - 57,939 43,329 14,610 Charges for services 18,746,715 18,768,844 9,405,914 9,362,930 Fines and forfeits 9,869 9,869 16,938 (7,069) Investment earnings 64,147 64,147 75,879 (11,732) Rents and royalties 111,100 108,386 57,655 50,731 Contributions/donations - 16,000 50,452 (34,452) Miscellaneous - - 19 (19)
Total revenues 19,954,072 20,150,212 10,222,397 9,927,815
EXPENDITURESCurrent
Security/persons & property 68,506,115 69,538,194 34,074,368 35,463,826 Capital outlay 2,130,386 3,410,659 890,898 2,519,761
Total expenditures 70,636,501 72,948,853 34,965,266 37,983,587
Excess (deficiency) of revenuesover (under) expenditures (50,682,429) (52,798,641) (24,742,869) (28,055,772)
OTHER FINANCING SOURCES (USES)Sale of capital assets - - (1,974) 1,974 Transfers in (51,772,182) 51,946,421 25,923,859 26,022,562 Transfers out (1,079,512) (1,062,704) (540,444) (522,260)
Total other financing sources and uses (52,851,694) 50,883,717 25,381,441 25,502,276
Net change in fund balances (103,534,123) (1,914,924) 638,572 (2,553,496)
FUND BALANCES - BEGINNING 16,196,583 16,196,583 16,196,583 -
FUND BALANCES - ENDING $ (87,337,540) $ 14,281,659 $ 16,835,155 $ (2,553,496)
Budget Amounts
CITY OF VANCOUVERCONSOLIDATED FIRE FUNDSTATEMENT OF REVENUES, EXPENDITURES, AND CHANGES IN FUND BALANCESCOMPARED TO BUDGET (GAAP BASIS) AND ACTUALFor the Year Ended December 31, 2015
33The notes to the basic financial statements are an integral part of this statement.

ActualOriginal Final Biennium2015-16 2015-16 To- Date VarianceBiennium Biennium Thru 12/31/15 Thru 12/31/15
REVENUESOther taxes $ 4,433,150 $ 4,433,150 $ 3,246,532 $ 1,186,618 License and permits 400,000 400,000 378,397 21,603 Intergovernmental 7,051,394 7,051,394 3,557,599 3,493,795 Charges for services 345,488 405,488 495,481 (89,993) Investment earnings - - 38,602 (38,602) Rents and royalties 1,434,808 1,434,808 498,400 936,408 Miscellaneous - - 2,599 (2,599)
Total revenues 13,664,840 13,724,840 8,217,610 5,507,230
EXPENDITURESCurrent:
Transportation 24,957,998 25,538,817 11,818,002 13,720,815 Capital outlay 9,866,584 10,101,584 6,476,572 3,625,012
Total expenditures 34,824,582 35,640,401 18,294,574 17,345,827
Excess (deficiency) of revenuesover expenditures (21,159,742) (21,915,561) (10,076,964) (11,838,597)
OTHER FINANCING SOURCES (USES)Transfers in 23,571,856 23,601,856 11,831,555 11,770,301 Transfers out (1,929,439) (2,676,588) (1,685,762) (990,826)
Total other financing sources (uses) 21,642,417 20,925,268 10,145,793 10,779,475
Net change in fund balance 482,675 (990,293) 68,829 (1,059,122)
FUND BALANCES - BEGINNING 7,242,369 7,242,369 7,242,369 -
FUND BALANCES - ENDING $ 7,725,044 $ 6,252,076 $ 7,311,198 $ (1,059,122)
Budget Amounts
CITY OF VANCOUVERSTREET FUNDSTATEMENT OF REVENUES, EXPENDITURES, AND CHANGES IN FUND BALANCESCOMPARED TO BUDGET (GAAP BASIS) AND ACTUALFor the Year Ended December 31, 2015
34The notes to the basic financial statements are an integral part of this statement.
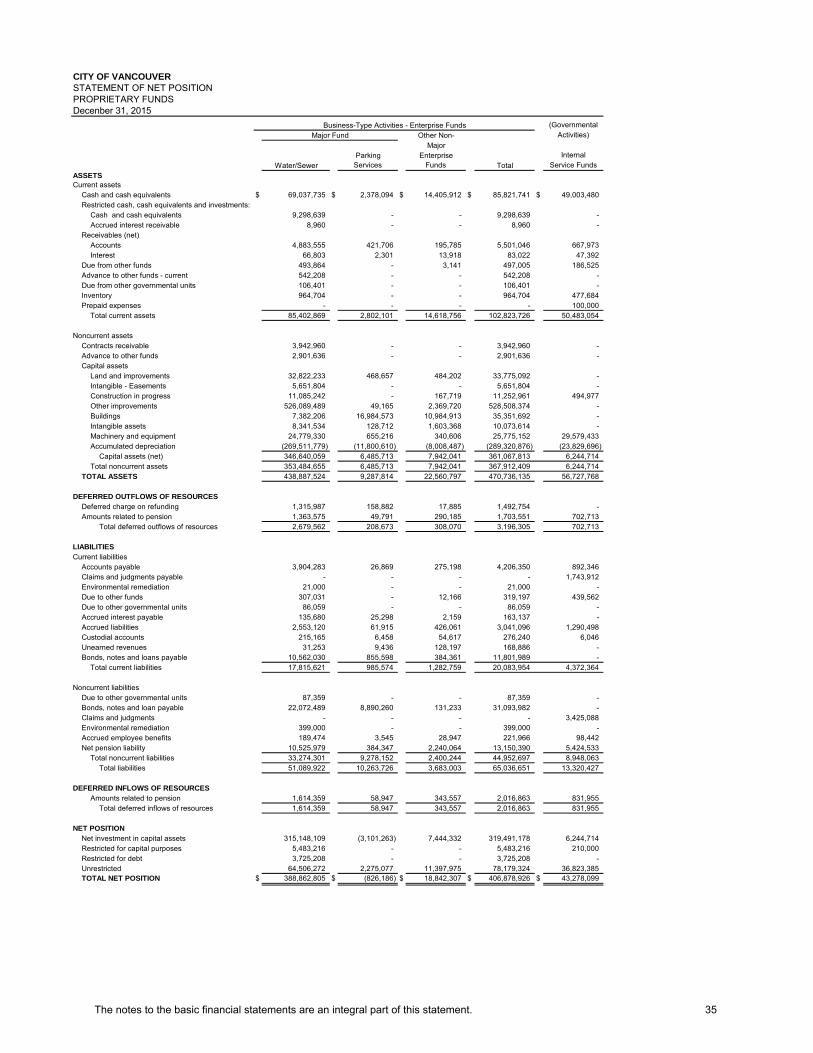
CITY OF VANCOUVERSTATEMENT OF NET POSITIONPROPRIETARY FUNDSDecenber 31, 2015
(Governmental Other Non- Activities)
MajorParking Enterprise Internal
Water/Sewer Services Funds Total Service FundsASSETSCurrent assets
Cash and cash equivalents $ 69,037,735 $ 2,378,094 $ 14,405,912 $ 85,821,741 $ 49,003,480 Restricted cash, cash equivalents and investments:
Cash and cash equivalents 9,298,639 - - 9,298,639 - Accrued interest receivable 8,960 - - 8,960 -
Receivables (net)Accounts 4,883,555 421,706 195,785 5,501,046 667,973 Interest 66,803 2,301 13,918 83,022 47,392
Due from other funds 493,864 - 3,141 497,005 186,525 Advance to other funds - current 542,208 - - 542,208 - Due from other governmental units 106,401 - - 106,401 - Inventory 964,704 - - 964,704 477,684 Prepaid expenses - - - - 100,000
Total current assets 85,402,869 2,802,101 14,618,756 102,823,726 50,483,054
Noncurrent assetsContracts receivable 3,942,960 - - 3,942,960 - Advance to other funds 2,901,636 - - 2,901,636 - Capital assets
Land and improvements 32,822,233 468,657 484,202 33,775,092 - Intangible - Easements 5,651,804 - - 5,651,804 - Construction in progress 11,085,242 - 167,719 11,252,961 494,977 Other improvements 526,089,489 49,165 2,369,720 528,508,374 - Buildings 7,382,206 16,984,573 10,984,913 35,351,692 - Intangible assets 8,341,534 128,712 1,603,368 10,073,614 - Machinery and equipment 24,779,330 655,216 340,606 25,775,152 29,579,433 Accumulated depreciation (269,511,779) (11,800,610) (8,008,487) (289,320,876) (23,829,696)
Capital assets (net) 346,640,059 6,485,713 7,942,041 361,067,813 6,244,714 Total noncurrent assets 353,484,655 6,485,713 7,942,041 367,912,409 6,244,714
TOTAL ASSETS 438,887,524 9,287,814 22,560,797 470,736,135 56,727,768
DEFERRED OUTFLOWS OF RESOURCESDeferred charge on refunding 1,315,987 158,882 17,885 1,492,754 - Amounts related to pension 1,363,575 49,791 290,185 1,703,551 702,713
Total deferred outflows of resources 2,679,562 208,673 308,070 3,196,305 702,713
LIABILITIESCurrent liabilities
Accounts payable 3,904,283 26,869 275,198 4,206,350 892,346 Claims and judgments payable - - - - 1,743,912 Environmental remediation 21,000 - - 21,000 - Due to other funds 307,031 - 12,166 319,197 439,562 Due to other governmental units 86,059 - - 86,059 - Accrued interest payable 135,680 25,298 2,159 163,137 - Accrued liabilities 2,553,120 61,915 426,061 3,041,096 1,290,498 Custodial accounts 215,165 6,458 54,617 276,240 6,046 Unearned revenues 31,253 9,436 128,197 168,886 - Bonds, notes and loans payable 10,562,030 855,598 384,361 11,801,989 -
Total current liabilities 17,815,621 985,574 1,282,759 20,083,954 4,372,364
Noncurrent liabilitiesDue to other governmental units 87,359 - - 87,359 - Bonds, notes and loan payable 22,072,489 8,890,260 131,233 31,093,982 - Claims and judgments - - - - 3,425,088 Environmental remediation 399,000 - - 399,000 - Accrued employee benefits 189,474 3,545 28,947 221,966 98,442 Net pension liability 10,525,979 384,347 2,240,064 13,150,390 5,424,533
Total noncurrent liabilities 33,274,301 9,278,152 2,400,244 44,952,697 8,948,063 Total liabilities 51,089,922 10,263,726 3,683,003 65,036,651 13,320,427
DEFERRED INFLOWS OF RESOURCESAmounts related to pension 1,614,359 58,947 343,557 2,016,863 831,955
Total deferred inflows of resources 1,614,359 58,947 343,557 2,016,863 831,955
NET POSITIONNet investment in capital assets 315,148,109 (3,101,263) 7,444,332 319,491,178 6,244,714 Restricted for capital purposes 5,483,216 - - 5,483,216 210,000 Restricted for debt 3,725,208 - - 3,725,208 - Unrestricted 64,506,272 2,275,077 11,397,975 78,179,324 36,823,385 TOTAL NET POSITION $ 388,862,805 $ (826,186) $ 18,842,307 $ 406,878,926 $ 43,278,099
Business-Type Activities - Enterprise FundsMajor Fund
35The notes to the basic financial statements are an integral part of this statement.

(Governmental Other Non- Activities)
MajorParking Enterprise Internal
Water/Sewer Services Funds Total Service FundsOPERATING REVENUES
Charges for services $ 85,242,621 $ 3,335 $ 6,956,675 $ 92,202,631 $ 37,724,044 Fines and penalties 599,482 382,717 13,500 995,699 - Rents and royalties 684,427 1,588,242 816,307 3,088,976 5,194,170 Miscellaneous 257,973 30,816 5,262 294,051 1,004
Total operating revenues 86,784,503 2,005,110 7,791,744 96,581,357 42,919,218
OPERATING EXPENSESPersonnel services 18,620,900 704,115 3,973,626 23,298,641 9,942,066 Supplies and contractual services 21,129,048 408,726 2,344,881 23,882,655 24,124,561 Interfund services 10,016,858 600,599 2,342,166 12,959,623 2,401,390 Intergovernmental payments 18,806,592 19,099 8,229 18,833,920 373,793 Depreciation 12,393,140 847,278 501,241 13,741,659 2,005,376
Total operating expenses 80,966,538 2,579,817 9,170,143 92,716,498 38,847,186
Operating income (loss) 5,817,965 (574,707) (1,378,399) 3,864,859 4,072,032
NONOPERATING REVENUES (EXPENSES)Investment earnings 575,138 7,737 60,999 643,874 185,474 State and federal grants 233,327 - - 233,327 142,480 Interest and fiscal charges (1,720,305) (394,567) (35,367) (2,150,239) - Gain (Loss) on disposal of capital assets 2,557,430 - - 2,557,430 99,182 Miscellaneous revenue (expense) 47,395 - 89,001 136,396 -
Total nonoperating revenues (expenses) 1,692,985 (386,830) 114,633 1,420,788 427,136
Income (loss) before contributions and transfers 7,510,950 (961,537) (1,263,766) 5,285,647 4,499,168
Capital contributions 14,908,828 - - 14,908,828 382,758 Transfers in 8,629 1,245,540 391,598 1,645,767 6,327,802 Transfers out (19,007) - (184,255) (203,262) (3,999,005)
Change in net position 22,409,400 284,003 (1,056,423) 21,636,980 7,210,723
TOTAL NET POSITION - BEGINNING 378,938,474 (706,336) 22,258,180 400,490,318 41,774,282 Prior period adjustments (1,424,889) - (5,702) (1,430,591) (7,073) Change in accounting principles (11,060,180) (403,853) (2,353,748) (13,817,781) (5,699,833)
TOTAL NET POSITION - ENDING $ 388,862,805 $ (826,186) $ 18,842,307 $ 406,878,926 $ 43,278,099
CITY OF VANCOUVERSTATEMENT OF REVENUES, EXPENSES AND CHANGES IN NET POSITIONPROPRIETARY FUNDSFor the Year Ended December 31, 2015
Enterprise FundsMajor Fund
36The notes to the basic financial statements are an integral part of this statement.

CITY OF VANCOUVERSTATEMENT OF CASH FLOWSPROPRIETARY FUNDSFor the Year Ended December 31, 2015 Page 1 of 2
(Governmental Other Activities)
Water/SewerParking Services
Non-Major Enterprise Funds Total
Internal Service Funds
CASH FLOWS FROM OPERATING ACTIVITIESCash received from customers $ 86,261,703 $ 1,975,638 $ 7,961,323 $ 96,198,664 $ 42,771,358 Cash received from other operating activities 257,973 30,816 5,143 293,932 1,004 Cash payments for goods and services (39,437,827) (444,337) (2,336,517) (42,218,681) (23,164,290) Internal activity - between funds (10,081,589) (615,166) (2,374,469) (13,071,224) (2,849,766) Cash payments to employees (18,566,848) (722,571) (3,944,696) (23,234,115) (9,703,910)
Net cash provided by operating activities 18,433,412 224,380 (689,216) 17,968,576 7,054,396
CASH FLOWS FROM NONCAPITALFINANCING ACTIVITIES
Unrestricted gifts received 47,395 - 89,001 136,396 - Receipt of grant funds - - - - 142,480 Transfers from other funds 8,629 1,245,540 391,598 1,645,767 6,327,802 Transfers to other funds (19,008) - (184,255) (203,263) (3,665,571)
Net cash provided by noncapital financing activities 37,016 1,245,540 296,344 1,578,900 2,804,711
CASH FLOWS FROM CAPITAL ANDRELATED FINANCING ACTIVITIES
Principal paid on capital debt (9,634,780) (780,000) (352,608) (10,767,388) - Interest paid on capital debt (1,871,722) (342,650) (44,426) (2,258,798) - Purchase of capital assets (10,252,100) - (18,040) (10,270,140) (2,225,140) Receipts from interfund capital transactions 363,436 - - 363,436 - Proceeds from sale of capital assets 42,812 - - 42,812 99,182 Capital contributions 8,151,546 - - 8,151,546 -
Net cash used by capital andrelated financing activities (13,200,808) (1,122,650) (415,074) (14,738,532) (2,125,958)
CASH FLOWS FROM INVESTING ACTIVITIESInvestment earnings (losses) 540,075 8,917 73,109 622,101 208,745 Interest received on interfund loans 83,969 - - 83,969 -
Net cash provided by investing activities 624,044 8,917 73,109 706,070 208,745
NET INCREASE (DECREASE) INCASH AND CASH EQUIVALENTS 5,893,664 356,187 (734,837) 5,515,014 7,941,894
72,442,710 2,021,907 15,140,749 89,605,366 41,061,586 $ 78,336,374 $ 2,378,094 $ 14,405,912 $ 95,120,380 $ 49,003,480
Business-Type Activities - Enterprise Funds
CASH AND CASH EQUIVALENTS - ENDINGCASH AND CASH EQUIVALENTS - BEGINNING
Major Fund
37The notes to the basic financial statements are an integral part of this statement.
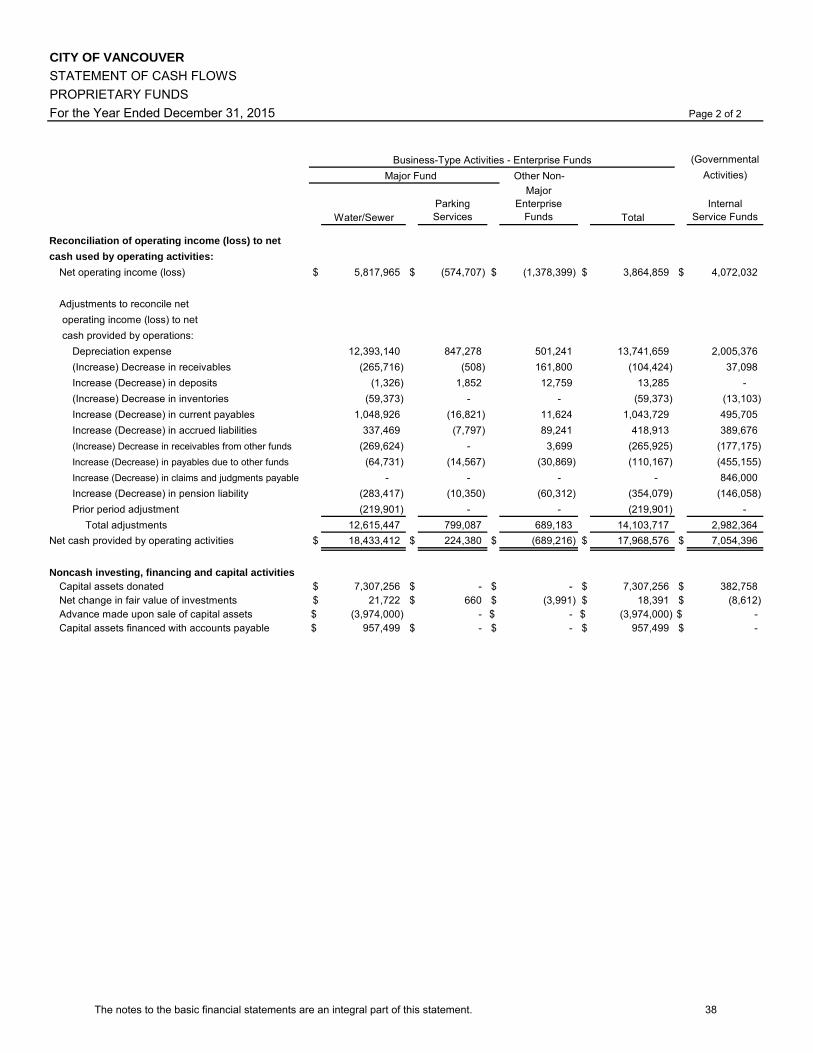
CITY OF VANCOUVERSTATEMENT OF CASH FLOWSPROPRIETARY FUNDSFor the Year Ended December 31, 2015 Page 2 of 2
(Governmental Other Non- Activities)
Water/SewerParking Services
Major Enterprise
Funds TotalInternal
Service Funds
Reconciliation of operating income (loss) to netcash used by operating activities:
Net operating income (loss) $ 5,817,965 $ (574,707) $ (1,378,399) $ 3,864,859 $ 4,072,032
Adjustments to reconcile net operating income (loss) to net cash provided by operations:
Depreciation expense 12,393,140 847,278 501,241 13,741,659 2,005,376 (Increase) Decrease in receivables (265,716) (508) 161,800 (104,424) 37,098 Increase (Decrease) in deposits (1,326) 1,852 12,759 13,285 - (Increase) Decrease in inventories (59,373) - - (59,373) (13,103) Increase (Decrease) in current payables 1,048,926 (16,821) 11,624 1,043,729 495,705 Increase (Decrease) in accrued liabilities 337,469 (7,797) 89,241 418,913 389,676 (Increase) Decrease in receivables from other funds (269,624) - 3,699 (265,925) (177,175) Increase (Decrease) in payables due to other funds (64,731) (14,567) (30,869) (110,167) (455,155) Increase (Decrease) in claims and judgments payable - - - - 846,000 Increase (Decrease) in pension liability (283,417) (10,350) (60,312) (354,079) (146,058) Prior period adjustment (219,901) - - (219,901) -
Total adjustments 12,615,447 799,087 689,183 14,103,717 2,982,364 Net cash provided by operating activities $ 18,433,412 $ 224,380 $ (689,216) $ 17,968,576 $ 7,054,396
Noncash investing, financing and capital activitiesCapital assets donated $ 7,307,256 $ - $ - $ 7,307,256 $ 382,758 Net change in fair value of investments $ 21,722 $ 660 $ (3,991) $ 18,391 $ (8,612) Advance made upon sale of capital assets $ (3,974,000) - $ - $ (3,974,000) $ - Capital assets financed with accounts payable $ 957,499 $ - $ - $ 957,499 $ -
Business-Type Activities - Enterprise FundsMajor Fund
38The notes to the basic financial statements are an integral part of this statement.

CITY OF VANCOUVERSTATEMENT OF NET POSITIONFIDUCIARY FUNDSDecember 31, 2015
Pension AgencyTrust Funds Funds
ASSETS
Cash and cash equivalents $ 4,269,381 $ 801,450 Certificates of Deposit 1,031,720 - Federal Agency Coupon Securities 1,974,260 - Corporate Bond 3,146,299 -
Receivables:Accounts 5,810 185,335 Interest 42,426 775
Prepaid expenses 60,000 -
TOTAL ASSETS 10,529,896 987,560
LIABILITIESAccounts and accrued employee payables 7,357 7,352 Due to other governmental units - 980,208
TOTAL LIABILITIES 7,357 987,560
NET POSITION
Held in trust for Pension and OPEB Benefits $ 10,522,539 $ -
39The notes to the basic financial statements are an integral part of this statement.

CITY OF VANCOUVERSTATEMENT OF CHANGES IN FIDUCIARY NET POSITIONFiduciary FundsFor The Year Ended December 31, 2015
PensionTrust Funds
Additions:Employer Contributions
For pension benefits $ 1,525,265 For postemployment healthcare benefits 1,310,731
Other Sources 179,118
Total Contributions 3,015,114
Investment Income Interest earnings 34,773
Total Investment Income 34,773
Total Additions 3,049,887
Deductions:Pension benefits 743,786 Healthcare premium subsidies 1,310,731 Administrative expense 103,452
Total Deductions 2,157,969
Change in fiduciary net position 891,918
Net position - beginning 9,630,621 Net position - ending $ 10,522,539
40The notes to the basic financial statements are an integral part of this statement.

NOTE I. SUMMARY OF SIGNIFICANT ACCOUNTING POLICIES The financial statements of the City of Vancouver (the City) conform to generally accepted accounting principles as applied to City governments. The following is a summary of the more significant policies:
A. REPORTING ENTITY
The City of Vancouver was incorporated January 23, 1857. The City operates under a Council-Manager form of government and provides services per its charter adopted February 10, 1952, as last amended November 3, 2015.
The Comprehensive Annual Financial Report of the City of Vancouver includes the primary government and its component units, entities for which the City is considered to be financially accountable. The discretely presented component units are reported in a separate column in the government-wide financial statements to emphasize that they are legally separate from the primary government.
Discretely Presented Component Units:
The Vancouver Public Facilities District (PFD) is a special purpose government established to participate in the development of the Hotel/Convention Center in downtown Vancouver. The PFD board is comprised of five (5) members appointed by the City Council of Vancouver. The City is able to impose its will on the district; however, PFD’s services do not exclusively or almost exclusively benefit the City of Vancouver. Therefore, financial statements are discretely presented as a business- type activity in the City’s annual financial report.
The Downtown Redevelopment Authority (DRA) is a special purpose government established in 1997 to plan, design, finance, acquire, construct, equip, own, maintain, operate, repair, remodel, expand, and promote the Vancouver Convention Center and Hotel Project. The DRA Board is composed of seven (7) members who are appointed by the City Council of Vancouver to four year terms. The City is able to impose its will on the authority; however, the DRA’s services do not exclusively or almost exclusively benefit the City of Vancouver. Therefore, financial statements are discretely presented as a business- type activity in the City’s annual financial report.
On February 27, 2006, the Vancouver City Council passed Ordinance M-3739 creating the City Center Redevelopment Authority (CCRA). CCRA is chartered with facilitating the redevelopment of property thereby promoting economic growth and urban livability within the Vancouver City Center Vision plan area. The CCRA will complement the work of the Downtown Redevelopment Authority (DRA) which is limited by indenture for construction and operation of the Hotel and Convention Center project. The CCRA is an independent legal entity, and its financial activities will be reported as a discretely presented component unit of the City; however, there was no financial information to report for fiscal year ending December 31, 2015.
On November 2, 2015, the Vancouver City Council passed Ordinance M-4139 creating the Vancouver Transportation Benefit District (TBD). Through an Interlocal agreement, funds generated from a vehicle registration fee will be passed to the City and used for transportation improvements that construct, reconstruct, preserve, maintain and operate the existing transportation infrastructure of the City of Vancouver consistent with RCW 36.73. The TBD is an independent legal entity but its financial activity will be presented as a blended component unit; however, there was no financial information to report for fiscal year ending December 31, 2015.
Unless noted otherwise in this report, the accounting policies of the component units are consistent with those described for the primary government. PFD and DRA issue separate financial statements which can be obtained from the City of Vancouver, Financial and Management Services, PO Box 1995, Vancouver, WA 98668-1995, or electronically by contacting Christine Smith, Accounting Manager, at [email protected].
B. GOVERNMENT-WIDE AND FUND FINANCIAL STATEMENTS
Government-wide financial statements (i.e., the Statement of Net Position and the Statement of Activities) report information on all of the non-fiduciary activities of the primary government and its component units. For the most part, the effect of interfund activity has been removed from these statements. Governmental activities, which normally are supported by taxes and intergovernmental revenues, are reported separately from business-type activities, which rely to a significant extent on fees and charges for support. Likewise, the primary government is reported separately from certain legally separate component units for which the primary government is financially accountable.
The Statement of Activities demonstrates the degree to which the direct expenses of a given function or segment is offset by program revenues. Direct expenses are those that are clearly identifiable with a specific function or segment. Program revenues include 1) charges to customers or applicants who purchase, use, or directly benefit from goods, services, or privileges provided by a given function or segment; and 2) grants and contributions that are restricted to meeting the operational or capital requirements of a particular function or segment. Taxes and other items not properly included among program revenues are reported instead as general revenues.
41
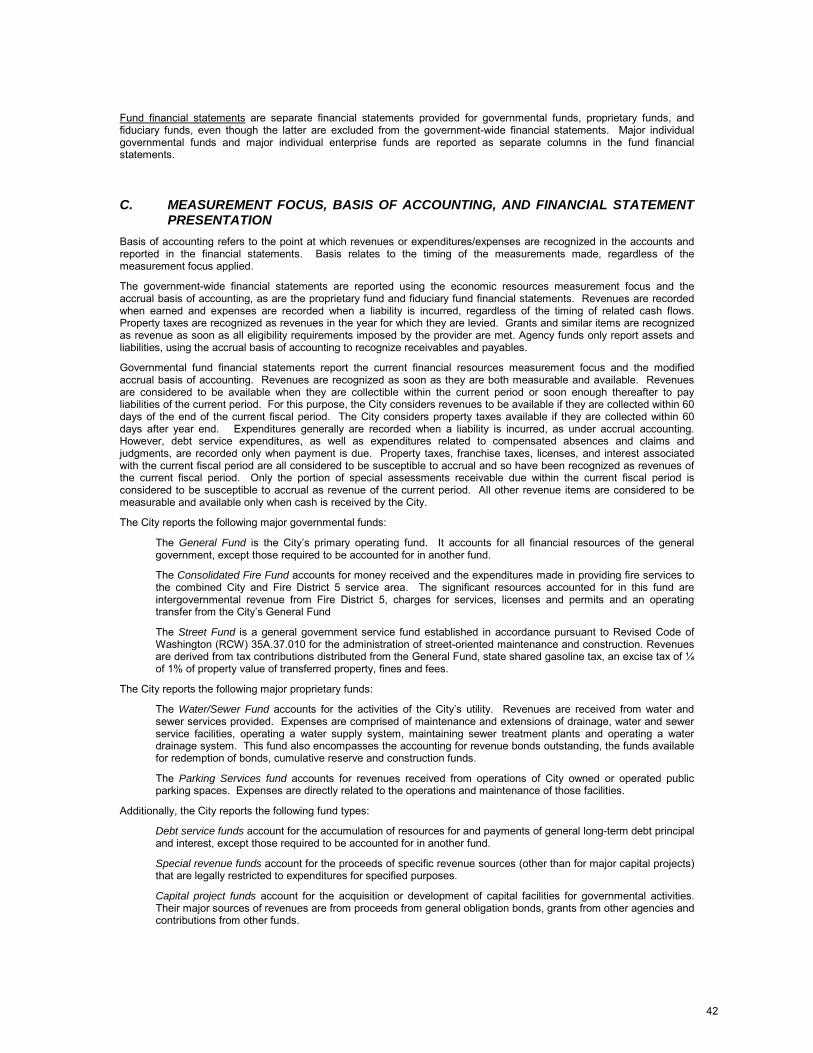
Fund financial statements are separate financial statements provided for governmental funds, proprietary funds, and fiduciary funds, even though the latter are excluded from the government-wide financial statements. Major individual governmental funds and major individual enterprise funds are reported as separate columns in the fund financial statements.
C. MEASUREMENT FOCUS, BASIS OF ACCOUNTING, AND FINANCIAL STATEMENT PRESENTATION
Basis of accounting refers to the point at which revenues or expenditures/expenses are recognized in the accounts and reported in the financial statements. Basis relates to the timing of the measurements made, regardless of the measurement focus applied.
The government-wide financial statements are reported using the economic resources measurement focus and the accrual basis of accounting, as are the proprietary fund and fiduciary fund financial statements. Revenues are recorded when earned and expenses are recorded when a liability is incurred, regardless of the timing of related cash flows. Property taxes are recognized as revenues in the year for which they are levied. Grants and similar items are recognized as revenue as soon as all eligibility requirements imposed by the provider are met. Agency funds only report assets and liabilities, using the accrual basis of accounting to recognize receivables and payables.
Governmental fund financial statements report the current financial resources measurement focus and the modified accrual basis of accounting. Revenues are recognized as soon as they are both measurable and available. Revenues are considered to be available when they are collectible within the current period or soon enough thereafter to pay liabilities of the current period. For this purpose, the City considers revenues to be available if they are collected within 60 days of the end of the current fiscal period. The City considers property taxes available if they are collected within 60 days after year end. Expenditures generally are recorded when a liability is incurred, as under accrual accounting. However, debt service expenditures, as well as expenditures related to compensated absences and claims and judgments, are recorded only when payment is due. Property taxes, franchise taxes, licenses, and interest associated with the current fiscal period are all considered to be susceptible to accrual and so have been recognized as revenues of the current fiscal period. Only the portion of special assessments receivable due within the current fiscal period is considered to be susceptible to accrual as revenue of the current period. All other revenue items are considered to be measurable and available only when cash is received by the City.
The City reports the following major governmental funds:
The General Fund is the City’s primary operating fund. It accounts for all financial resources of the general government, except those required to be accounted for in another fund.
The Consolidated Fire Fund accounts for money received and the expenditures made in providing fire services to the combined City and Fire District 5 service area. The significant resources accounted for in this fund are intergovernmental revenue from Fire District 5, charges for services, licenses and permits and an operating transfer from the City’s General Fund
The Street Fund is a general government service fund established in accordance pursuant to Revised Code of Washington (RCW) 35A.37.010 for the administration of street-oriented maintenance and construction. Revenues are derived from tax contributions distributed from the General Fund, state shared gasoline tax, an excise tax of ¼ of 1% of property value of transferred property, fines and fees.
The City reports the following major proprietary funds:
The Water/Sewer Fund accounts for the activities of the City’s utility. Revenues are received from water and sewer services provided. Expenses are comprised of maintenance and extensions of drainage, water and sewer service facilities, operating a water supply system, maintaining sewer treatment plants and operating a water drainage system. This fund also encompasses the accounting for revenue bonds outstanding, the funds available for redemption of bonds, cumulative reserve and construction funds.
The Parking Services fund accounts for revenues received from operations of City owned or operated public parking spaces. Expenses are directly related to the operations and maintenance of those facilities.
Additionally, the City reports the following fund types:
Debt service funds account for the accumulation of resources for and payments of general long-term debt principal and interest, except those required to be accounted for in another fund.
Special revenue funds account for the proceeds of specific revenue sources (other than for major capital projects) that are legally restricted to expenditures for specified purposes.
Capital project funds account for the acquisition or development of capital facilities for governmental activities. Their major sources of revenues are from proceeds from general obligation bonds, grants from other agencies and contributions from other funds.
42

Internal service funds account for services provided to other departments or agencies of the government, or to other governments on a cost reimbursement basis. The internal service funds account for the activities of health insurance for employees, fleet, facilities replacement, mail distribution, liability insurance, workers’ compensation insurance, and technology services.
The Trust funds account for the activities of the Police and Firemen’s Pension funds, which accumulate resources for pension benefit payments to qualified public safety employees.
Agency funds represent assets held in a trustee or agency capacity for others and do not report results of operations.
The City now follows the standards set by GASB Statement No.62 Codification of Accounting and Financial Reporting Guidance Contained in Pre-November 30, 1989 FASB and AICPA Pronouncements.
As a general rule the effect of interfund activity has been eliminated from the government-wide financial statements. Exceptions to this general rule are payments-in-lieu of taxes and other charges between the government’s water and sewer function and various other functions of the government. Elimination of these charges would distort the direct costs and program revenues reported for the various functions concerned.
Amounts reported as program revenues include 1) charges to customers or applicants for goods, services, or privileges provided, 2) operating grants and contributions, and 3) capital grants and contributions, including special assessments. Internally dedicated resources are reported as general revenues rather than as program revenues. Likewise, general revenues include all taxes.
Proprietary funds distinguish operating revenues and expenses from nonoperating items. Operating revenues and expenses generally result from providing services and producing and delivering goods in connection with a proprietary fund’s principal ongoing operations. The principal operating revenues of the Water/Sewer enterprise fund, of the non-major enterprise funds, and of the City’s internal service funds are charges to customers for sales and services. Operating expenses for enterprise funds and internal service funds include the cost of sales and services, administrative expenses, and depreciation on capital assets. All revenues and expenses not meeting this definition are reported as nonoperating revenues and expenses.
When both restricted and unrestricted resources are available for use, it is the City’s policy to use restricted resources first, then unrestricted resources as they are needed.
D. ASSETS, LIABILITIES, AND NET POSITION OR EQUITY 1. Cash and Cash Equivalents
The City’s cash and cash equivalents are considered to be cash on hand, demand deposits, and short-term investments with original maturities of three months or less from the date of acquisition. Cash resources of individual funds are invested directly into government securities with interest accruing for the benefit of the specific fund. This policy covers all funds operated by the City. Cash resources required for immediate reasons (within the next month) are invested to the extent possible in short-term investments such as money market/Washington State Local Government Investment Pool (LGIP) accounts with interest accruing to the benefit of each individual fund based on the monthly average cash balance of each fund.
Statutes authorize the City to invest in obligations of the U.S. Treasury, U.S. Agencies, and instrumentalities, banker’s acceptances, repurchase agreements, and the state treasurer’s investment pool. The City is also authorized to enter into reverse repurchase agreements, but did not participate in these investments during 2015. The Pension Trust Fund is also authorized to invest in corporate bonds rated “A” or better by Standard & Poor’s Corporation, or “A” or better by Moody’s Bond Ratings. Since the City maintains an internal investment pool, regulatory oversight is performed by the CFO, the Treasurer, and the Treasury accountant. Since the City is a governmental unit, at this point, no other type of regulatory oversight is required.
Investments for the City, as well as for its component units, are reported at fair value. The State Treasurer’s Investment Pool operates in accordance with appropriate state laws and regulations. The reported value of the pool is the same as the fair value of the pool shares. As of December 31, 2015, the City had $80,505,567 in the Washington State local investment pool and $790,621 in the Clark County Local Government Investment Pool, which were both classified as cash equivalents. Interest on these investments are prorated to the various funds.
For purposes of the statement of cash flows, the City considers the assets within the state and local government investment pools and all highly liquid investments with a maturity of three months or less to be cash equivalents.
2. Internal Balance and Receivables
Activities between funds that are representative of lending/borrowing arrangements outstanding at the end of the fiscal year are referred to as either “Interfund loan payable” (for the current portion of interfund loans) or “advances to/from other funds” (for the non-current portion of interfund loans). All other outstanding balances between funds are reported as “due to/from other funds.” Any residual balances outstanding between the governmental activities and business- type activities are reported in the government-wide financial statements as “internal balances.” A separate schedule of interfund receivable and payables is furnished in Note III.C.
43

Advances between funds, as reported in the fund financial statements, are offset by a fund balance reserve account in applicable governmental funds to indicate that they are not available for appropriation and are not expendable available financial resources.
All trade accounts receivable are shown net of an allowance for uncollectible accounts.
The Clark County Treasurer acts as an agent to collect property taxes levied in the county for all taxing authorities. Taxes are levied annually before December 15, and become a lien as of January 1, on property value listed as of the prior May 31. Assessed values are established by the Clark County Assessor at 100 percent of fair market value. A revaluation of all property is required every six years.
Taxes are due in two equal installments on April 30 and October 31. The Clark County Treasurer remits collections monthly to the appropriate district. Property taxes are recorded as a receivable and revenue in the period for which they are levied. Property taxes collected in advance of the fiscal year to which they apply are recorded as deferred inflows and recognized as revenue of the period to which they apply. No allowance for uncollectible taxes receivable is established because delinquent taxes are considered fully collectible and in the event of nonpayment, create a lien against the associated property. Prior year tax levies were recorded using the same principle as discussed previously, and delinquent taxes are evaluated annually. Taxes receivable also contains related interest and penalties. See Note V. E for more discussion.
Accrued interest receivable consists of amounts earned on investments, notes and contracts at the end of the year.
Special assessments are recorded when levied. Special assessments receivable consists of current and delinquent assessments, related interest, and penalties. Deferred inflow for special assessments consists of unbilled special assessments that are liens against the property benefited.
Customer accounts receivable consists of amounts owed from private individuals or organizations for goods and services including amounts owed for which billings have not been prepared. Notes and contracts receivable consists of amounts owed on open account from private individuals or organizations for goods and services rendered.
3. Inventories and prepaid items
The inventory carried by the Water/Sewer Fund is valued at average cost. A cycle count protocol is used to verify inventory amounts throughout the year and at year end.
Inventories of governmental funds are recorded as expenditures when purchased rather than when consumed.
Certain payments to vendors reflect costs applicable to future accounting periods and are recorded as prepaid items in both government-wide and fund financial statements.
4. Restricted assets
These accounts contain resources for construction and debt service in enterprise funds. Certain proceeds of the enterprise fund revenue bonds, as well as certain resources set aside for their repayment, are classified as restricted assets on the balance sheet because they may be maintained in separate bank accounts and their use is limited by applicable bond covenants. The restricted assets of the enterprise funds consist of $9,298,639 which is cash and investments held for debt service. Specific debt service reserve requirements are described in Note III.E.1.
5. Capital assets
Capital assets are generally considered property, plant, and equipment owned by the City costing $10,000 or more, and having an estimated useful life of 4 years or more. Additionally, new infrastructure construction (e.g. roads, bridges, sidewalks, etc.) of $100,000 or more is also reported as capital. Assets are reported in the applicable governmental or business-type activities columns in the government-wide financial statements. Such assets are recorded at historical cost or estimated historical cost if the actual cost is not available. Donated capital assets are recorded at estimated fair market value at the date of donation.
Costs for additions or improvements to capital assets are capitalized when they increase the effectiveness or efficiency of the asset.
The cost for normal maintenance and repairs are not capitalized.
Major outlays for capital assets and improvements are recorded in Construction in Progress as they are constructed, and capitalized upon completion. Interest incurred during the construction phase of capital assets of business-type activities is included as part of the capitalized value of the assets constructed.
44

Assets are depreciated using the straight line method over the following estimated useful lives:
Asset Category Useful Life Buildings 40 Infrastructure 15-40 Structures 20 Leasehold Improvements 5 Utility Improvements 5-60 Other Improvements 5-30 Rolling Stock 5-15 Information Tech Equipment 4 Equipment 5-15 Software (Intangibles)
5
The City has acquired certain assets with funding provided by federal financial assistance programs. Depending on the terms of the agreements involved, the federal government could retain an equity interest in these assets. However, the City has sufficient legal interest to accomplish the purposes for which the assets were acquired, and has included such assets within the applicable column in the statement of net position.
Easements with indefinite lives are considered non-depreciable assets. Other intangible assets with limited useful lives will be depreciated.
6. Compensated absences
City employees can accumulate a certain amount of earned but unused vacation and sick leave benefits. All vacation pay is accrued when incurred in the governerment-wide, proprietary and fiduciary fund financial statements. The City also reports a liability for sick leave accrual earned by certain employees. See Note III. E.2, for more information.
7. Other Accrued Liabilities
These accounts consist of accrued wages and employee related benefits and liabilities.
8. Long-term obligations
Long-term debt and other long-term obligations are reported as liabilities in all statements other than those statements prepared on the modified accrual basis of accounting (the governmental fund statements). Bond premiums and discounts, are amortized over the life of the bonds. Bonds payable are reported net of the applicable bond premium or discount.
In the fund financial statements, governmental fund types recognize bond premium and discounts, as well as bond issuance costs, during the current period as other financing sources or uses. The face amount of debt issued is reported as other financing sources while discounts on debt issuances are reported as other financing uses. Issuance costs, whether or not withheld from the actual debt proceeds received, are reported as debt service expenditures. See Note IV.E for more detail.
9. Pensions
For purposes of measuring the net pension liability, deferred outflows of resources and deferred inflows of resources related to pensions, and pension expense, information about the fiduciary net position of all state sponsored pension plans and additions to/deductions from those plans’ fiduciary net position have been determined on the same basis as they are reported by the Washington State Department of Retirement Systems. For this purpose, benefit payments (including refunds of employee contributions) are recognized when due and payable in accordance with the benefit terms. Investments are reported at fair value.
10. Unearned revenues
This includes amounts recognized as receivables but not revenues in governmental funds because the revenue recognition criteria have not been met.
11. Use of estimates
These financial statements have been prepared in conformity with accounting principles generally accepted in the United States of America. Generally accepted accounting principles (GAAP), requires management to make estimates and assumptions that affect the amounts reported in the financial statements. Actual results could differ from those estimates and assumptions.
12. Net position and fund balances
In the financial statements, assets and deferred outflows in excess of liabilities and deferred inflows are presented in one of two ways depending on the measurement focus of the statement. On the Statement of Net Position for government-wide reporting and for the proprietary funds and on the fiduciary funds’ Statement of Fiduciary Net Position, net position is segregated into three categories: net investment in capital assets,; restricted net position; and unrestricted net position.
45
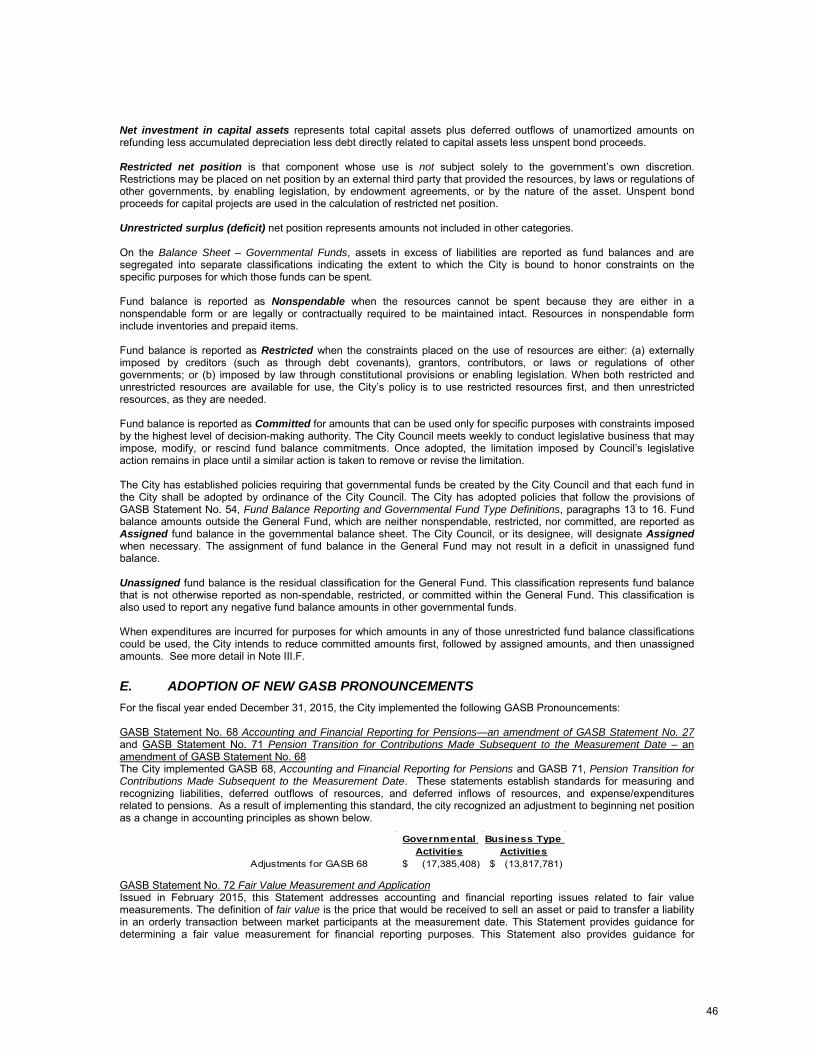
Net investment in capital assets represents total capital assets plus deferred outflows of unamortized amounts on refunding less accumulated depreciation less debt directly related to capital assets less unspent bond proceeds. Restricted net position is that component whose use is not subject solely to the government’s own discretion. Restrictions may be placed on net position by an external third party that provided the resources, by laws or regulations of other governments, by enabling legislation, by endowment agreements, or by the nature of the asset. Unspent bond proceeds for capital projects are used in the calculation of restricted net position. Unrestricted surplus (deficit) net position represents amounts not included in other categories. On the Balance Sheet – Governmental Funds, assets in excess of liabilities are reported as fund balances and are segregated into separate classifications indicating the extent to which the City is bound to honor constraints on the specific purposes for which those funds can be spent. Fund balance is reported as Nonspendable when the resources cannot be spent because they are either in a nonspendable form or are legally or contractually required to be maintained intact. Resources in nonspendable form include inventories and prepaid items. Fund balance is reported as Restricted when the constraints placed on the use of resources are either: (a) externally imposed by creditors (such as through debt covenants), grantors, contributors, or laws or regulations of other governments; or (b) imposed by law through constitutional provisions or enabling legislation. When both restricted and unrestricted resources are available for use, the City’s policy is to use restricted resources first, and then unrestricted resources, as they are needed. Fund balance is reported as Committed for amounts that can be used only for specific purposes with constraints imposed by the highest level of decision-making authority. The City Council meets weekly to conduct legislative business that may impose, modify, or rescind fund balance commitments. Once adopted, the limitation imposed by Council’s legislative action remains in place until a similar action is taken to remove or revise the limitation. The City has established policies requiring that governmental funds be created by the City Council and that each fund in the City shall be adopted by ordinance of the City Council. The City has adopted policies that follow the provisions of GASB Statement No. 54, Fund Balance Reporting and Governmental Fund Type Definitions, paragraphs 13 to 16. Fund balance amounts outside the General Fund, which are neither nonspendable, restricted, nor committed, are reported as Assigned fund balance in the governmental balance sheet. The City Council, or its designee, will designate Assigned when necessary. The assignment of fund balance in the General Fund may not result in a deficit in unassigned fund balance. Unassigned fund balance is the residual classification for the General Fund. This classification represents fund balance that is not otherwise reported as non-spendable, restricted, or committed within the General Fund. This classification is also used to report any negative fund balance amounts in other governmental funds. When expenditures are incurred for purposes for which amounts in any of those unrestricted fund balance classifications could be used, the City intends to reduce committed amounts first, followed by assigned amounts, and then unassigned amounts. See more detail in Note III.F.
E. ADOPTION OF NEW GASB PRONOUNCEMENTS For the fiscal year ended December 31, 2015, the City implemented the following GASB Pronouncements: GASB Statement No. 68 Accounting and Financial Reporting for Pensions—an amendment of GASB Statement No. 27 and GASB Statement No. 71 Pension Transition for Contributions Made Subsequent to the Measurement Date – an amendment of GASB Statement No. 68 The City implemented GASB 68, Accounting and Financial Reporting for Pensions and GASB 71, Pension Transition for Contributions Made Subsequent to the Measurement Date. These statements establish standards for measuring and recognizing liabilities, deferred outflows of resources, and deferred inflows of resources, and expense/expenditures related to pensions. As a result of implementing this standard, the city recognized an adjustment to beginning net position as a change in accounting principles as shown below.
Governmental Activities
Business Type Activities
Adjustments for GASB 68 (17,385,408)$ (13,817,781)$ GASB Statement No. 72 Fair Value Measurement and Application Issued in February 2015, this Statement addresses accounting and financial reporting issues related to fair value measurements. The definition of fair value is the price that would be received to sell an asset or paid to transfer a liability in an orderly transaction between market participants at the measurement date. This Statement provides guidance for determining a fair value measurement for financial reporting purposes. This Statement also provides guidance for
46

applying fair value to certain investments and disclosures related to all fair value measurements. There is no material impact to the City for the adoption of the standard. GASB Statement No. 79, Certain External Investment Pools and Pool Participants Issue in December 2015, this Statement addresses accounting and financial reporting for certain external investment pools and pool participants. Specifically, it establishes criteria for an external investment pool to qualify for making the election to measure all of its investments at amortized cost for financial reporting purposes. This Statement establishes additional note disclosure requirements for qualifying external investment pools that measure all of their investments at amortized cost for financial reporting purposes and for governments that participate in those pools. There is no material impact to the City for the adoption of the standard.
F. FUTURE ADOPTION OF GASB PRONOUNCEMENTS The following GASB pronouncements have been issued, but are not yet effective at December 31, 2015:
• GASB Statement No. 73 Accounting and Financial Reporting for Pensions and Related Assets That Are Not within the Scope of GASB Statement 68, and Amendments to Certain Provisions of GASB Statements 67 and 68
• GASB Statement No. 74 Financial Reporting for Postemployment Benefit Plans Other Than Pension Plans • GASB Statement No. 75 Accounting and Financial Reporting for Postemployment Benefits Other Than
Pensions • GASB Statement No. 76, The Hierarchy of Generally Accepted Accounting Principles for State and Local
Governments • GASB Statement No. 77, Tax Abatement Disclosures • GASB Statement No. 78, Pensions Provided through Certain Multiple-Employer Defined Benefit Pension Plans • GASB Statement No. 80, Blending Requirements for Certain Component Units—an amendment of GASB
Statement No. 14 • GASB Statement No. 81, Irrevocable Split-Interest Agreements
The City of Vancouver will implement the new GASB pronouncements in the fiscal year no later than the required effective date. The City has not yet determined if the above listed new GASB pronouncements will have a significant financial impact to the City or in issuing its financial statements.
47

NOTE II. STEWARDSHIP, COMPLIANCE, AND ACCOUNTABILITY
A. BUDGETARY INFORMATION The City prepares a biennial budget for all funds in accordance with the Revised Code of Washington (RCW) chapter 35.33. The budget is prepared on a basis consistent with accounting principles generally accepted in the United States of America, with the exception of proprietary funds which includes an appropriation for capital outlays and principal payments but does not include appropriations for depreciation expense and pension liability adjustments. All funds except custodial agency funds are budgeted to the fund level. Biennially appropriated budgets are adopted for all funds and lapse at the end of each biennium. However, some of the Special Revenue and Capital funds may carry forward budgeted amounts beyond the biennium for completion of certain projects.
Budgets are adopted at the level of the fund for a biennium, representing the legal expenditure authority. The budget appropriations in the general fund are set at the function level.
Budget amounts shown in the basic financial statements include the original budget amounts and all appropriation transfers and adjustments approved by the City Manager or City Council, as required during the biennium. The City Manager or his designee is authorized as the chief executive officer to approve intra-fund budget transfers from one department to another or between line items of the same department. Only the City Council has the authority to increase a given fund’s biennial budget. This is executed by City ordinance.
Year 2015 is the first year of the 2015-2016 Biennium. Amending the budget increases to total budget expenditures of the City that affect the number of authorized employee positions or salary ranges must be approved by City Council. When it is determined that it is in the best interest of the City to increase the appropriation for a particular fund or department within general fund, the City may do so by resolution approved by one more than the majority after holding public hearings. The calendar below outlines the general time frame followed to prepare, review and adopt 2015-2016 Biennial Budget.
January-March 2014
• Completed a Community Survey – a statistically valid random sample survey of residents.
April-June 2014
• Prepared the preliminary revenue and expenditure forecast for 2015-2020. • Identified the direction of the budget process and outlined specific guidelines for departmental submission. • The budget direction anticipated stability in the immediate future, but potential shortfalls developing in later
years of the forecast.
July-September 2014
• Reviewed the departmental proposals and prepared budget recommendations for the City Manager. • Held televised workshops with City Council to review:
o The budget process and provided a budget reductions overview. o The 2015-2020 revenue and expenditure forecast. o Input from the public on priority of City services and programs.
October-November 2014
• The City Manager’s Preliminary Recommended budget was published for public and Council review. • Filed the City’s Preliminary Budget with the City Clerk and made copies available to the public. • Presented the Preliminary Recommended Budget to City Council in televised workshop sessions and provided
Council members with detailed information on the proposed budget. • A public hearing on the Recommended Budget and related ordinances for fee increases was held on November
3, 2014. The final budget as adopted is published within the first three months of the new budget year. The City of Vancouver Biennial Budget is distributed to various agencies such as neighborhood associations and the Chamber of Commerce, and is made available to all interested citizens in paper format and on the Web.
State statutes provide for a mid-biennial review and modification of the biennial budget to allow flexibility for addressing issues unanticipated during the budget process. Modifications to the original adopted budget are proposed by departments and reviewed by the Budget Office staff in conjunction with the City Manager and his/her management team.
48

Adoption by the City Council requires a public hearing. There are usually two supplemental appropriations during any fiscal year. These procedures are in accordance with RCW's.
B. EXCESS OF EXPENDITURES OVER APPROPRIATIONS
The City has not had any occurrences of excesses of expenditures over appropriations as of December 31, 2015.
C. DEFICIT NET POSITION/NET FUND BALANCE
At December 31, 2015, the Parking Services fund had a deficit in the fund net position of $826,186. The Parking Services fund accounts for operations of City owned or operated public parking spaces. Depreciation expense (a non-cash item) for the period ending December 31, 2015 was $847,278, continues to be the largest contributor the negative fund balance. The City continues to monitor operations in the fund to ensure funds are available to meet current operating needs. The General Fund transfers cash to cover debt service requirements.
At December 31, 2015, Vancouver Downtown Redevelopment Authority (DRA), a component unit of the City, had a deficit in the fund net position of $19,341,450. The DRA activities involve the operation of a hotel and convention center in the City’s central downtown area. This is a cash flow based project and the negative net position balance is primarily attributed to accumulated depreciation, a non-cash item. Additionally, during the recession the economic environment had a negative impact on the convention and lodging business which is also reflected in the net position change. Deep cost-cutting measures have been put in place. The Board and the management of the DRA as well as the project monitor activities monthly. A series of revenue generating guidelines and on-going expense reductions have been implemented. The fund continues to improve slightly, while still remaining in a deficit position.
49

NOTE III. DETAILED NOTES ON ALL FUNDS
A. DEPOSITS AND INVESTMENTS
The City maintains a cash and investment pool that is available for use by all funds. Cash and investments are presented on the balance sheet in the basic financial statements at fair value or amortized cost, which approximates fair value, in accordance with GASB Statement No. 31, “Accounting and Financial Reporting for Certain Investments and for External Investment Pools.”, and in accordance with GASB Statement 72, “Fair Value Measurement and Application”.
Activities undertaken by the pool on behalf of the proprietary funds are not part of the operating, capital, investing, or financing activities of the proprietary funds, and details of these transactions are not reported in the Statement of Cash Flows. In general, interest earned from the pooled investments is allocated to each fund based on the average earnings and daily cash balance of each fund.
A reconciliation of cash, cash equivalents (including pooled investments) and investments as shown in the government-wide and fund financial statements is as follows:
NotesInvestments $ 293,509,714 Deposits 4,492,576 Deposits w/fiscal agent, escrow, trust 7,773,566
Total $ 305,775,856
Financial StatementsCash and cash equivalents $ 286,567,320 Cash and cash equivalents – component units 211,860 Cash with fiscal agent/trustee – component units 7,773,566 Fiduciary cash 5,070,831 Fiduciary investments 6,152,279
Total $ 305,775,856
1. Deposits
At year-end, the City’s carrying amount of deposits was $4,540,560 and bank balance was $6,258,099. The Federal Deposit Insurance Corporation (FDIC) provides unlimited insurance for the City’s non-interest bearing deposits and up to $250,000 insurance on interest bearing deposit and investments through December 31, 2015. All deposits and bank balances not covered by FDIC are covered under the State of Washington Public Deposit Protection Commission Act of 1969. As of June 30, 2009, the State of Washington Public Deposit Protection Commission Act of 1969 was amended to require all public depositories within the State of Washington to fully collateralize their uninsured public deposits at 100%.
2. Investments
The City maintains an Internal Investment Pool. The Pool has an average maturity of approximately nine months. Some funds are invested for the benefit of the respective fund. Remaining monies are aggregated in a residual account, and invested in the pool for the benefit of all funds. As required by state law, all investments of the City funds are obligations of the U.S. Government, U.S. agency issues, the State Treasurer’s Investment Pool, or the Clark County Investment Pool. Regulatory oversight is performed by the CFO, the Treasurer, and the Treasury accountant. At the times when City funds are invested in the State Treasurer’s Investment Pool or the Clark County Investment pool, the only limitation on withdrawal is a 24 hour notice for withdrawal of amounts. For the State Treasurer’s Investment Pool the notice is required for amounts in excess of $10 million. However the County has no dollar threshold. Because we are a government, at this point, we do not need any other type of regulatory oversight.
As of December 31, 2015 the fair value of the City’s investment portfolio was $293,509,714 of which $6,152,279 was invested on behalf of the Firemen’s Pension Fund, and $287,357,435 was invested in the City’s Internal Investment Pool for the benefit of all funds. Investments of pension funds are not subject to the preceding limitations under state law. The fair value of the investment portfolio is obtained using the market approach. Pricing is obtained through the City’s third-party safekeeping custodian, US Bank Corporate Trust Services, who obtains pricing on Federal Agencies and Corporate Bonds through IDC Institutional Bond Quotes, and uses Standard & Poor’s for pricing Municipal Bonds.
50

As of December 31, 2015, the City had the following investments:
Investment TypeFair Value (in $1,000)
Weighted Average
Maturity (Years)
County Pool $ 791 1.30
State Pool 80,506 0.10
Federal Agency Coupon Securities 188,651 1.20 Corporate Bond 1,032 1.00 Zero Coupon Bonds - Federal Agencies 4,221 0.90 Zero Coupon Bonds - Muni Bonds 1,974 1.40 Municipal Bonds 16,335 0.80
Total Fair Value $ 293,510
Portfolio Weighted Average Maturity 0.78
* Fair value of pooled investments does not include adjustments made for accrued interest distributed to pooled participants.
Interest Rate Risk: In accordance with its investment policy, the City manages its exposure to declines in fair values by keeping the average maturity of its investment portfolio less than 2 years.
Credit Risk: Credit risk is the risk that an issuer or other counterparty to an investment will not fulfill its obligations. The Washington State Investment Pool operates within the parameters outlined in GASB 79, and qualifies to report investments at amortized cost. The State Investment Pool’s investment objective is to effectively maximize the yield while maintaining liquidity and a stable share price of $1. The State Pool’s portfolio’s average maturity was 35 days on 12/31/15. The State Investment Pool in an unrated fund. The Clark County Investment Pool is an unrated fund and has oversight by the Clark County Finance Committee. The County Pool’s average maturity on 12/31/15 was 472 days however the City can withdraw its balance on a daily basis.
To limit risk, Washington State law and the City of Vancouver’s investment policy limits the amount of the portfolio invested in commercial paper, banker’s acceptances, and corporate bonds. It is the City’s policy to limit its credit risk by only investing in commercial paper or banker’s acceptances with a credit rating of A1 or P1, and investing in corporate bonds for the pension fund, with a credit rating of “A” or better (or equivalent) by nationally recognized statistical rating organizations. The ratings of debt securities as of December 31, 2015 are:
Investment TypeFair Value (in
$1,000) Not Rated Aaa Aa AU.S. Government Agencies 192,873 192,873 Municipal Bonds 18,309 2,564 15,163 582 Corporate Bonds (Pension Fund only) 1,032 1,032 State Pool 80,506 80,506 Clark County Investment Pool 791 791 Total 293,510$ 81,296$ 195,437$ 15,163$ 1,614$
Percentage of Portfolio 27.7% 66.6% 5.2% 0.5%
Concentration of credit risk: Concentration risk is the risk of loss attributed to the magnitude of a government’s investment in a single issuer. The City places limits on the amount it may invest in any one issuer depending on the security type of the investment. At the end of 2015, the City’s portfolio had the following concentration of securities in it: 23.5% of Federal Home Loan Bank, 3.1% of Federal National Mortgage Association, 16% of Federal Farm Credit Bank, and 23.1% of Federal Home Loan Mortgage Corporation. The City has several investments in government-sponsored enterprises which are not explicitly backed by the federal government. However, the federal government has provided significant support by increasing its investments in Federal National Mortgage Association and Federal Home Loan Mortgage Corporation and stated they would not allow these enterprises to fail.
51

B. CAPITAL ASSETS A summary of capital asset activity for the year ended December 31, 2015 is as follows:
Restated Beginning
Balance 01/01/15 Increases DecreasesEnding Balance
12/31/15Governmental activities:
Capital assets, not being depreciatedLand $ 68,826,020 $ 13,644,534 $ 298,357 $ 82,172,197 Intangible - Easements 8,089,930 36,403 - 8,126,333 Construction in progress 19,412,355 14,609,055 16,937,564 17,083,846
Total capital assets, not being depreciated 96,328,305 28,289,992 17,235,921 107,382,376
Capital assets, being depreciated/depleted:Cemetery land 1,101,047 - - 1,101,047 Buildings 114,081,483 2,428,648 - 116,510,131 Machinery and equipment 55,624,522 3,332,393 818,949 58,137,966 Infrastructure 601,391,135 19,887,329 - 621,278,464 Intangible 8,356,939 108,439 - 8,465,378 Total capital assets being depreciated/depleted 780,555,126 25,756,809 818,949 805,492,986
Less accumulated depreciation for:Cemetery land 724,054 1,111 - 725,165 Buildings 31,438,159 2,988,142 - 34,426,301 Machinery and equipment 38,679,540 4,299,516 528,194 42,450,862 Infrastructure 203,206,259 15,932,781 - 219,139,040 Intangible 7,178,031 350,958 - 7,528,989 Total accumulated depreciation 281,226,043 23,572,508 528,194 304,270,357
Total capital assets, being depreciated, net 499,329,083 2,184,301 290,755 501,222,629Governmental activities capital assets, net $ 595,657,388 $ 30,474,293 $ 17,526,676 $ 608,605,005
Restated Beginning
Balance 01/01/15 Increases Decreases Ending Balance
12/31/15Business-type activities:
Capital assets, not being depreciated:Land $ 33,026,876 $ 1,582,768 $ 834,552 $ 33,775,092 Intangible - Easements 4,676,838 974,966 - 5,651,804 Construction in progress 3,660,405 9,521,169 1,928,613 11,252,961
Total capital assets, not being depreciated 41,364,119 12,078,903 2,763,165 50,679,857
Capital assets, being depreciated: Buildings and system 36,910,483 272,560 1,831,351 35,351,692 Infrastructure 521,281,647 7,242,906 16,179 528,508,374 Machinery and equipment 24,964,731 869,135 58,714 25,775,152 Intangible 10,073,614 - - 10,073,614 Total capital assets, being depreciated 593,230,475 8,384,601 1,906,244 599,708,832
Less accumulated depreciation for:Buildings and system 20,160,886 1,164,034 1,206,522 20,118,398 Infrastructure 224,826,401 11,461,346 16,180 236,271,567 Machinery and equipment 22,613,757 847,257 58,717 23,402,297 Intangible 9,259,592 269,022 - 9,528,614 Total accumulated depreciation 276,860,636 13,741,659 1,281,419 289,320,876
Total capital assets, being depreciated, net 316,369,839 (5,357,058) 624,825 310,387,956 Business-type activities capital assets, net $ 357,733,958 $ 6,721,845 $ 3,387,990 $ 361,067,813
52

The beginning balances of the Governmental and Business-type activities were restated due to corrections found during the year ending December 31, 2015 that were more appropriately reflected in prior years. Balances were restated per chart below:
Governmental Activities:As Previously Reported
December 31, 2014Prior Period Adjustment
As Restated January 1, 2015
Land $ 71,356,965 $ (2,530,945) $ 68,826,020 Construction in progress 19,482,832 (70,477) 19,412,355 Buildings 117,721,219 (3,639,736) 114,081,483
Machinery and equipment 53,715,533 1,908,989 55,624,522 Infrastructure 602,952,910 (1,561,775) 601,391,135
Less accumulated depreciation:Buildings 34,043,643 (2,605,484) 31,438,159 Machinery and equipment 37,522,928 1,156,612 38,679,540 Infrastructure 203,799,346 (593,087) 203,206,259
$ 589,863,542 $ (3,851,985) $ 586,011,557
Business-type Activities:Land $ 32,709,463 $ 317,413 $ 33,026,876 Construction in progress 5,555,671 (1,895,266) 3,660,405 Buildings and systems 37,149,971 (239,488) 36,910,483
Machinery and equipment 520,950,290 331,357 521,281,647 Infrastructure 24,547,456 417,275 24,964,731
Less accumulated depreciation:Buildings and systems 20,194,272 (33,386) 20,160,886 Machinery and equipment 224,810,726 15,675 224,826,401 Infrastructure 22,454,065 159,692 22,613,757
$ 353,453,788 $ (1,210,690) $ 352,243,098
Net capital assets subject to adjustment
Net capital assets subject to adjustment
Depreciation expense as of December 31, 2015, was charged to functions/programs of the primary government as follows: Governmental Activities: General government $ 1,051,829
Security of persons & property 2,776,776Transportation, including depreciation of general infrastructure assets 15,313,279Physical Environment 2,789Economic Environment 800,215Culture and recreation 1,622,244Capital assets held by the government’s internal service funds are charged to various functions based on their usage of the assets
Total depreciation expense — Governmental Activities $ 23,572,508
Business-type Activities:Water/Sewer $ 12,393,140Airpark 226,019Building Inspection 243,137Sanitation 10,216Parking 847,278Tennis Center 21,869
Total depreciation expense — Business-type Activities $ 13,741,659
2,005,376
53

Component Units
A summary of capital asset activity for component units for the year ended December 31, 2015, is as follows:
Ending Balance 12/31/14
Amount of Restatement
Restated Beginning Balance 01/01/15 Increases Decreases
Ending Balance 12/31/15
Vancouver Downtown Redevelopment AuthorityBusiness-type activities:
Capital assets, not being depreciated:Construction in progress $ 1,780,488 $ - $ 1,780,488 $ 3,807,286 $ 267,511 $ 5,320,263
Capital assets, being depreciated:Buildings and system $ 51,605,004 $ (5,385,319) $ 46,219,685 $ - $ - 46,219,685$ Machinery and equipment 6,677,310 5,385,319 12,062,629 267,511 5,522,824 6,807,316
Total capital assets, being depreciated 58,282,314 - 58,282,314 267,511 5,522,824 53,027,001
Less accumulated depreciation for:Buildings and system 12,041,167 (1,063,992) 10,977,175 1,155,492 - 12,132,667 Machinery and equipment 6,294,778 3,013,846 9,308,624 449,731 5,522,824 4,235,531
Total accumulated depreciation 18,335,945 1,949,854 20,285,799 1,605,223 5,522,824 16,368,198
Total capital assets, being depreciated, net 39,946,369 (1,949,854) 37,996,515 (1,337,712) - 36,658,803
Business-type activities capital assets, net $ 41,726,857 $ (1,949,854) $ 39,777,003 $ 2,469,574 $ 267,511 $ 41,979,066
Vancouver Public Facilities DistrictBusiness-type activities:
Capital assets, not being depreciated:Land and improvements $ 3,603,691 $ - $ - $ 3,603,691
The beginning balance have been restated, in total by a net reduction of $1,949,854 as reported at December 31, 2014, due to the identification of assets that had previously be recorded as a portion of the building at the time of construction and given a 40 year life versus being identified separately with a much shorter useful life.
Depreciation expense was charged to the Vancouver Downtown Redevelopment Authority for the year ending December 31, 2015 for $1,605,223.
54

C. INTERFUND RECEIVABLES, PAYABLES AND TRANSFERS
Loans between funds are classified as interfund loans receivable or payable or as advances to and from other funds on the statement of net position. Within the City, one fund may borrow from another when specifically authorized by the City Council resolution. The interfund balances are in place to eliminate a temporary negative cash position. In 2015, the General Fund purchased from the Water/Sewer Fund a proportionate share of the Operations Center facility for $3.9 million. The transaction was recorded as an Advance between the two funds. At December 31, 2015, $3,443,844 remained as the outstanding balance. The transaction will likely be settled in full within the subsequent 12 months.
Due to other funds and due from other funds result from goods issued, work performed or services rendered to or for the benefit of another fund of the same government. The following table displays Due to and Due from activity outstanding as of December 31, 2015:
Due from Due toOther Funds Other Funds
Governmental ActivitiesGeneral Fund $ 282,829 $ 522,317 Consolidated Fire Funds 31,306 21,692 Street Fund 796 20,879 Non-Major Governmental Funds 499,303 174,117
Subtotal Governmental Activities 814,234 739,005 Internal Service Funds 186,525 439,562
Governmental Activities 1,000,759 1,178,567
Business ActivitesWater/Sewer 493,864 307,031 Non-Major Business Type Activities 3,141 12,166
Subtotal Business Activities 497,005 319,197
Total Government Wide $ 1,497,764 $ 1,497,764
Interfund transfers are the flow of assets without a reciprocal return of assets, goods or services. These are transfers to support other funds without a requirement for repayment. The interfund transfer activity for the year is as follows:
Transfers In General Fund Fire Street FundNon-Major Govt Funds
Water Sewer
Non-Major Enterprise
Funds
Insternal Service Funds Total
General Fund $ - $ 1,142 $ - $ 412,543 $ $ 104,310 $ 107,069 $ 625,064 Consolidated Fire 25,895,327 - 6,336 - 19,007 3,189 - 25,923,859
Street Fund 11,763,428 - - - - 68,127 - 11,831,555 Non-Major Govt Funds 18,391,186 539,302 1,679,426 15,104,996 - - 1,833,434 37,548,344 Water/Sewer - - - - - 8,629 - 8,629 Parking Services 1,245,540 - - - - - - 1,245,540 Enterprise Funds 391,598 - - - - - - 391,598
Internal Service Funds 4,269,300 - - - - - 2,058,502 6,327,802 Total $ 61,956,379 $ 540,444 $ 1,685,762 15,517,539 $ 19,007 $ 184,255 $ 3,999,005 $ 83,902,391
Transfers Out
There were no significant transfers made during 2015 that do not occur on a routine basis or are inconsistent with the activities of the fund making the transfer.
55

D. LEASE AGREEMENTS
1. Operating Leases
The City is obligated under certain leases accounted for as operating leases. Operating leases do not give rise to property rights or lease obligations, and therefore the results of the lease agreements are not reflected in City’s statement of net position. For the year ended December 31, 2015, the costs for such leases were $1,258,146 and $578,229 for governmental and business-type activities, respectively.
The following is a schedule of minimum future rental payments required under operating leases that have initial or remaining non-cancelable lease terms in excess of one year as of December 31, 2015
Governmental Activities
Business-type Activities
2016 192,902$ 2,800$ 2017 198,725 - 2018 204,455 - 2019 210,351 - 2020 216,417 -
2021-2025 593,964 - 2026-2030 714,895 -
$ 2,331,709 $ 2,800
2. City as Lessor
The City is the lessor for some non-cancelable operating leases for facilities and property located within the City limits. Expiration dates range between 2016 and 2056.
The following is a schedule of the minimum future rental income required under these leases. They all are considered governmental activities.
Governmental
Activities2016 1,189,447$ 2017 750,875 2018 395,914 2019 210,355 2020 202,429
2021-2025 161,471 2026-2030 112,540 2031-2035 112,569 2036-2040 112,697 2041-2045 112,697 2046-2050 112,697 2051-2055 112,697
2056 22,539 $ 3,608,927
56

E. LONG-TERM DEBT
1. BONDS AND DEBT:
General Obligation Bonds
The City issues general obligation bonds to provide funds for the acquisition and construction of major capital projects. General obligation bonds have been issued for both governmental and business-type activities.
General obligation bonds are direct obligations and are pledged by the full faith and credit of the government. These bonds generally are issued as 20-year serial bonds with fixed payments maturing each year. General obligation bonds are either created by 3/5 majority vote of the people and, therefore, financed by a special tax levy; or are created by ordinance, adopted by the City Council, and normally financed from general revenues (councilmanic bonds). General obligation bonds currently outstanding (in thousands) are as follows:
Original Issuance Maturity Interest DebtName of Issuance Purpose Debt Date Date Rate Outstanding
2002 LTGO BondGovernmental Activities & Business Type Activites Refunding 39,365$ 10/23/2002 12/1/2018 2%-5.25% 8,120$
2005 LTGO BondGovernmental Activities & Business Type Activites Refunding 18,090 7/15/2005 12/1/2018 3%-5% 5,140
2006 LTGO Bond Governmental Activities 14,785 10/11/2006 12/1/2016 3.75%-5% 730 2008 LTGO Bond Governmental Activities 14,570 6/30/2008 12/1/2017 3.5%-5% 1,185 2009 LTGO Bond Governmental Activities 12,970 6/1/2009 12/1/2028 3.5%-5% 9,650 2010 LTGO Bond Governmental Activities 13,410 12/1/2010 12/1/2035 2.0%-5.125% 9,205 2011 LTGO Bond Governmental Activities 10,515 6/1/2011 12/1/2035 2.0%-5.125% 9,325 2012A LTGO Bond Govermental Activities Refunding 15,945 1/12/2012 12/1/2029 2.0%-3.75% 14,640
2012B&C LTGO BondGovermental Activities Refunding and Business Type Activities Refunding 9,515 12/12/2012 12/1/2025 0.61%-2.89% 9,375
2015A LTGO Bond Governmental Activities 1,297 6/15/2015 12/1/2028 3.64% - 4.7% 1,297 2015B LTGO Bond Governmental Activities & Refunding 23,100 6/16/2015 12/1/2034 2.0% - 5.0% 23,005 Total General Obligation Bonds $ 173,562 $ 91,672
City management provides for cash to fund current debt service requirements as a part of the biennial budgeting process. Annual debt service requirements to maturity for general obligation bonds (in thousands) are as follows:
Total TotalPrincipal Interest Requirements Principal Interest Requirements
2016 7,529 3,517 11,046 1,181 329 1,510 2017 6,838 3,161 9,999 922 269 1,191 2018 7,025 2,857 9,881 965 222 1,188 2019 5,595 2,542 8,137 945 173 1,118 2020 4,990 2,363 7,353 960 156 1,116
2021-2025 25,383 8,970 34,352 5,160 427 5,587 2026-2030 16,510 3,932 20,442 - - - 2031-2035 7,670 1,079 8,749 - - -
$ 81,539 $ 28,421 $ 109,960 $ 10,133 $ 1,577 $ 11,710
Governmental Activities Business Type Activities
The City’s legal limit of indebtedness is 1 ½% of assessed property value without a vote of the taxpayers and an additional 1% with a vote of the taxpayers. At December 31, 2015 the remaining non-voted and voted remaining capacity for indebtedness was $221,318,009 and $168,232,209 respectively.
The City has also received governmental loans to provide for construction of capital projects. On May 28, 2015, the City converted the Section 108 Loan with the Secretary of Housing and Urban Development (HUD) from a variable rate note with a final maturity of 8/1/2015, to a fixed rate note with a final maturity of 8/1/2029. The original note had a balloon payment due 8/1/2015, and the new note will allow the city to pay level debt service payments through 2029. Governmental loans outstanding (in thousands) at year-end are as follows:
57

Name of Issuance Purpose
Original Debt
Issuance Date
Maturity Date
Interest Rate
Debt Outstanding
2006 PWTFGovernmental-Type Activities $ 2,200 11/30/2006 7/1/2026 1% $ 1,281
Section 108 HUD Loan
Governmental-Type Activities 5,419 7/7/2010 8/1/2029
0.28%- 3.70% $ 3,419
Dept of Ecology Revolving Fund Loan
Business-Type Activites 381 1/11/2010 12/31/2017 1.5% $ 173
$ 8,000 $ 4,873
Government and bank loan debt service requirements to maturity (in thousands) are as follows:
Principal Interest Total Principal Interest Total2016 335 90 425 86 2 88 2017 336 87 424 87 1 88 2018 336 85 421 - - - 2019 341 81 423 - - - 2020 346 76 423 - - -
2021-2025 1,797 290 2,088 - - - 2026-2029 1,206 91 1,297
$ 4,700 $ 800 $ 5,500 $ 173 $ 3 $ 177
Governmental Activities Business-Type Activities
At December 31, 2015, the City had $0 available in debt service fund balance. Several other funds are responsible for payment of the GO bonded debt. Through the budget appropriation process, arrangements are made for transfers from those funds to the debt service funds prior to payment of the debt.
Special Assessment Debt
The government also issues special assessment debt to provide funds for the construction of street safety improvements in connection with a train noise quiet zone. Special assessment bonds are created by ordinance, adopted by Council, and financed by assessments on property owners. A separate guaranty fund is available to cover most outstanding delinquencies at the end of the assessment period. The City’s obligation doesn’t extend beyond the guaranty fund assets. In the event that a deficiency exists because of unpaid or delinquent special assessments at the time a debt service payment is due, the government must provide resources to cover the deficiency until other resources, for example, foreclosure proceeds, are received. The City has a Local Improvement District Guaranty Fund to finance any uncollectible special assessment debt. Special assessment debt with a governmental commitment reported at year end is (in thousands) as follows:
Name of Issuance Original Debt Issuance
Date Maturity Date Interest Rate Debt
Outstanding LID 545 Assessment Bond 312$ 9/23/2014 9/23/2036 3.45% 170$
Total Assessment Debt 312$ 170$ Special assessment bonds are serial bonds but are called yearly based on assessments received. Annual debt service requirements to maturity for special assessment bonds are (in thousands) as follows:
58
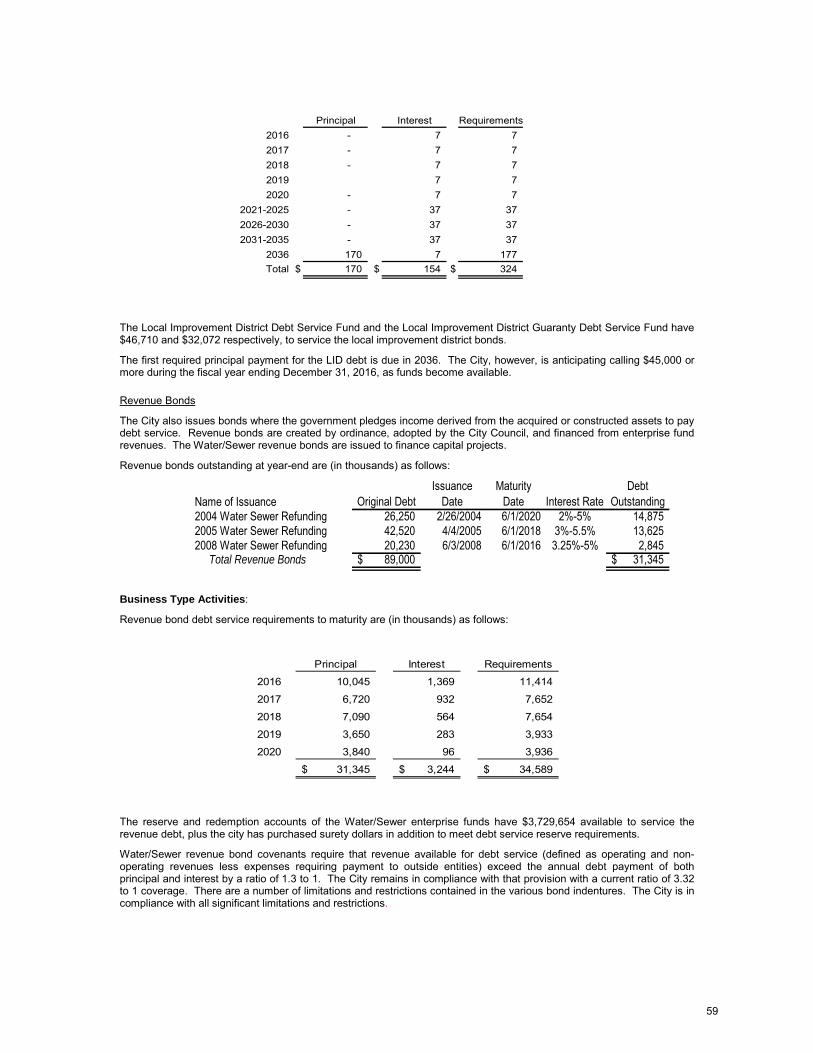
Principal Interest Requirements2016 - 7 7 2017 - 7 7 2018 - 7 7 2019 7 7 2020 - 7 7
2021-2025 - 37 37 2026-2030 - 37 37 2031-2035 - 37 37
2036 170 7 177 Total $ 170 $ 154 $ 324
The Local Improvement District Debt Service Fund and the Local Improvement District Guaranty Debt Service Fund have $46,710 and $32,072 respectively, to service the local improvement district bonds.
The first required principal payment for the LID debt is due in 2036. The City, however, is anticipating calling $45,000 or more during the fiscal year ending December 31, 2016, as funds become available.
Revenue Bonds
The City also issues bonds where the government pledges income derived from the acquired or constructed assets to pay debt service. Revenue bonds are created by ordinance, adopted by the City Council, and financed from enterprise fund revenues. The Water/Sewer revenue bonds are issued to finance capital projects.
Revenue bonds outstanding at year-end are (in thousands) as follows:
Name of Issuance Original DebtIssuance
DateMaturity
Date Interest RateDebt
Outstanding2004 Water Sewer Refunding 26,250 2/26/2004 6/1/2020 2%-5% 14,875 2005 Water Sewer Refunding 42,520 4/4/2005 6/1/2018 3%-5.5% 13,625 2008 Water Sewer Refunding 20,230 6/3/2008 6/1/2016 3.25%-5% 2,845 Total Revenue Bonds 89,000$ 31,345$
Business Type Activities:
Revenue bond debt service requirements to maturity are (in thousands) as follows:
The reserve and redemption accounts of the Water/Sewer enterprise funds have $3,729,654 available to service the revenue debt, plus the city has purchased surety dollars in addition to meet debt service reserve requirements.
Water/Sewer revenue bond covenants require that revenue available for debt service (defined as operating and non-operating revenues less expenses requiring payment to outside entities) exceed the annual debt payment of both principal and interest by a ratio of 1.3 to 1. The City remains in compliance with that provision with a current ratio of 3.32 to 1 coverage. There are a number of limitations and restrictions contained in the various bond indentures. The City is in compliance with all significant limitations and restrictions.
Principal Interest Requirements
2016 10,045 1,369 11,414
2017 6,720 932 7,652
2018 7,090 564 7,654
2019 3,650 283 3,933
2020 3,840 96 3,936
31,345$ 3,244$ 34,589$
59

Advance Refunding
In 2015, the City issued $23,100,000 of LTGO & Refunding bonds, of which $19,625,000 in general obligation refunding bonds provided resources to purchase United States Treasury Obligation securities (Treasury Notes) that were placed in an irrevocable trust for the purpose of generating resources for all future debt service payments on $20,820,000 of refunded debt. As a result, the refunded bonds are considered to be defeased and the liability has been removed from the governmental activities column of the statement of net position. This current and advance refunding was undertaken to reduce total debt service payments over the next 12 years by $1,894,109 in nominal savings, or resulted in an economic gain of $1,619,878 in present value savings, or 7.78%. The refunding bond issue defeased $3,430,000 of the 2005 LTGO & Refunding bond issue; $9,120,000 of the 2006 LTGO bond issue; and $8,270,000 of the 2008 LTGO bond issue.
2. COMPENSATED ABSENCES AND IMPACT FEE CREDITS:
Compensated Absences
Accumulated amounts of vacation leave are accrued as expenses when incurred in the government-wide and proprietary fund financial statements. At December 31, 2015, the recorded liability for compensated absences amounted to $10,523,215 with $8,303,544 recorded in governmental activities and $2,219,671 recorded in business-type activities. City employees receive personal time off (PTO), vacation and sick leave time at rates established by City policy or union agreement. PTO is accrued semi-monthly by employees at an annual rates ranging from 22.5 to 39.5 days depending upon tenure. Vacation is accrued semi-monthly by employees at annual rates ranging from 15 to 36 days depending upon tenure and union agreements. Accumulated PTO and vacation carryover between years is limited, generally, to twice an employee’s current year accrual. Sick leave accruals vary, depending upon union agreement, between 10 and 24 hours per month. City Policy and all contracts provide for a payoff of sick leave in some instances. Employees who are not covered by contract and were age 50 or who had more than 14 years of service as of January 1, 1980 may qualify for payoff of up to 50% of their sick leave balance at retirement. Employees who are covered by either the Joint Labor Coalition, AFSCME or OPEIU contracts and were hired prior to January 1, 1980 may qualify for 50% payoff of their sick leave balance at retirement. Employees covered under law enforcement contracts and who were hired prior to January 1, 1981, and employees covered by fire suppression and command contracts and who were hired prior to January 1, 1983, may qualify for 50% payoff of their sick leave balance at retirement, or 25% upon leaving the employer in good standing for reasons other than retirement. For the governmental activities, compensated absences are generally liquidated by operating funds, such as the General Fund and Consolidated Fire funds.
Impact Fee Credits In 1995, the City of Vancouver adopted an impact fee ordinance to ensure that adequate facilities are available to serve new growth and development. An impact fee is charged at the issuance of a building permit. In addition, the developer may be entitled to a non-refundable “credit” against the applicable impact fee component for the fair market value of appropriate dedications of land, improvements or new construction of system improvements provided by the developer. In the event that the amount of the “credit” is calculated to be greater than the amount of the impact fee due, the developer may apply the excess “credit” toward future impact assessment on other developments within the same service district. As of December 31, 2015, the amount of credits that may be applied against future impact fees is $17,010,200. This is recorded as a governmental activity in the Government-wide Financial Statements.
60

3. CHANGES IN LONG TERM LIABILITIES: The following is a summary of long-term debt changes of the City for the year:
Governmental activities
Bonds payable:
General obligation bonds $ 85,929,178 $ 24,396,500 $ 28,787,392 $ 81,538,286 $ 7,529,040
Issuance premiums 3,491,309 3,248,730 1,363,370 5,376,669 555,236
Issuance discounts - 611 28,366 (27,755) (1,467)
Total GO bonds payable 89,420,487 27,645,841 30,179,128 86,887,200 8,082,809 Special assessment debt w ith governmental commitment 311,834 - 141,834 170,000 45,000
Government loans 6,816,647 - 2,116,471 4,700,176 335,471
Claims and judgements (See Note IV.D for details) 4,323,000 3,152,757 2,306,757 5,169,000 1,743,912
Net OPEB Obligation (See Note IV.G for details) 7,213,190 2,742,653 1,310,732 8,645,111 -
Net Pension Liability* 15,254,961 4,313,523 477,043 19,091,441 -
Compensated absences** 8,085,669 7,494,977 7,277,102 8,303,544 7,473,190
Impact Fee Credit 11,978,340 8,136,377 3,104,517 17,010,200 3,928,009
Governmental activity long term liabilities $ 143,404,128 $ 53,486,128 $ 46,913,584 $ 149,976,672 $ 21,608,391
Business-type activities
Bonds payable
General obligation bonds $ 11,265,822 $ - $ 1,132,608 $ 10,133,214 $ 1,180,960
Revenue bonds 40,895,000 - 9,550,000 31,345,000 10,045,000
Issuance premiums (discounts) 1,993,787 - 576,029 1,417,758 576,029
Total bonds payable 54,154,609 - 11,258,637 42,895,972 11,801,989
Government loans 258,198 - 84,779 173,419 86,059
Environmental remediation (See Note V.H for details) 420,000 21,000 21,000 420,000 21,000
Net Pension Liability* 10,103,579 3,046,811 - 13,150,390 -
Compensated absences 1,944,147 2,025,256 1,749,732 2,219,671 1,997,704
Business-type activity long term liabilities $ 66,880,533 $ 5,093,067 $ 13,114,148 $ 58,859,452 $ 13,906,752
Ending Balance 12/31/15
Due Within One Year
Beginning Balance 1/1/15
Restated Additions Reductions
* Net Pension Liability beginning balance was added upon implementation of GASB 68.
**Compensated absences of $24,298 was added to governmental activities due to moving a fund presented as a fiduciary fund in 2014 into Governmental Activities. This was done after reviewing criteria used to classify use of fiduciary funds.
Internal service funds predominantly serve the governmental funds. Accordingly, long-term liabilities for them are included as part of the above totals for governmental activities. At year-end $984,418 of internal service funds compensated absences are included in the above amounts. For the governmental activities, claims and judgments and compensated absences are generally liquidated by operating funds, such as the General Fund, Consolidated Fire and the Street funds. The General Fund provides funding for the payment of benefits related to OPEB.
4. COMPONENT UNIT DEBT: In 2003, the Downtown Redevelopment Authority (DRA), a component unit of the City, issued bonds in which it pledged income derived from the acquired or constructed assets to pay debt service. The revenue bonds were authorized by resolution adopted by the DRA Board, and financed from operating revenues. The revenue bonds were issued to finance construction of the Conference Center and Hotel capital project. In June 2013, the remaining outstanding balance of $63,105,000 of the 2003 DRA Revenue bonds were refunded by issuing two series of revenue refunding bonds.
61

$41,185,000 DRA Conference Center Project Refunding Revenue Bonds were authorized by Resolution No. 2013-05-14-1 by the DRA Board. The Project Revenue Bonds are payable primarily from Project Revenues received by the Authority. In addition, the City has agreed pursuant to the Amended and Restated Payment Agreement, dated June 1, 2013, between the City and the Authority to make payments to the Trustee from any available funds if and to the extent necessary to pay debt service on the 2013 Project Revenue Bonds. The 2013 Amended and Restated Payment Agreement provides that if on the 10th business day prior to each interest payment date or principal payment date, if there is not sufficient money on deposit with the Trustee in the Project Revenue Bonds Debt Service Account as required by the Indenture, the City shall pay to the Trustee, in immediately available funds, on or prior to the 5th business day prior to the debt service date, the amount of any such deficiency; provided that the aggregate amount of such payments by the City to the Trustee in any calendar year shall not exceed the amount with to respect to such calendar year listed in Note V.B.1. The continent payment amounts equal the annual debt service payments on the Project Revenue Bonds. Any payment by the City of the Conditional Payment Amount to pay interest and/or principal on the 2013 Project Revenue Bonds will constitute a loan by the City to the Authority, with interest payable on such amounts at the rate or rates on such 2013 Project Revenue Bonds and the City shall have full rights of subrogation.
The City shall take such action as may be necessary under the Amended and Restated Payment Agreement to include all payments due in its operating budget for each fiscal year commencing on and after the date of execution, and to make all appropriations for such payments at such time and in such manner and amounts as may be necessary in order to make all debt service payments when due.
In addition, $18,045,000 of DRA Conference Center Project Sales and Lodging Tax Refunding Revenue Bonds were issued in June 2013. These bonds were authorized by Resolution No. 2013-05-14-1 by the DRA Board. The Tax Revenue Bonds are payable primarily from 1) certain proceeds of special sales and use taxes imposed by the Vancouver Public Facilities District (the “City PFD”) and the Clark County Public Facilities District (the “County PFD”); 2) certain proceeds of a special lodging tax levied by the City (the “Lodging Tax Revenues”); and 3) certain amounts of certain funds and accounts established under the Indenture. The Sales Taxes imposed by the City PFD will expire March 2026 and the Sales Tax imposed by the County PFD will expire March 2028. Lodging Tax Revenues will continue to be pledged for payment of principal and interest on the Tax Revenue Bonds until the final maturity of this bond series.
DRA Revenue Refunding bonds outstanding at year-end are as follows:
Outstanding DRA Revenue Bond Debt
Name of IssuanceOriginal Debt in
$1,000Issuance
DateMaturity
Date Interest RateDebt
Outstanding2013 DRA Conference Center Project Refunding Revenue Bonds 41,185$ 6/27/2013 1/1/2044 4.38% 41,185$ 2013 DRA Conference Center Project Sales & Lodging Tax Refunding Revenue Bonds 18,045$ 6/27/2013 1/1/2034 4.05% 18,045$ Total Revenue Bonds 59,230$ 59,230$
In order to make the 2013 refunding economically viable, ACA contributed $4,000,000 to the Authority, $1,430,555 of which is in consideration of the execution of a Note issued by the Authority to ACA, and the balance of which is in consideration for the elimination of any exposure ACA may have in respect to the Series 2003A Bonds. This Note is subordinate to the Project Revenue and Tax Revenue Bonds. There is a note associated with this contribution. Depending on the cash flows of the project, payments may start on 1/1/2033.
Under an Interlocal agreement with the Clark County PFD, DRA is liable to the Clark County PFD for state sales credit monies received by the DRA. Payments under this agreement are received by Clark County PFD monthly and forwarded to the DRA. This creates a liability for the DRA to repay these funds via two methods. The first is a predetermined tax cap in the 2003A Bond Indenture, which is carried forward to the 2013 Bond Indenture. The tax cap amount changes each year through 2034, for Clark County PFD, Vancouver PFD, and City of Vancouver lodging taxes, so that the funds in excess of the tax cap are returned to the Clark County PFD. The second method occurs after funds flow through the 2003A (replaced by the 2013 Bond Indenture) distribution requirements. The monies available in the end are split equally between the Authority and the Clark County PFD, and any amounts so distributed to the Clark County PFD will decrease the DRA liability to Clark County PFD after each payment.
62

DRA 2013 Project Revenue Bonds and the DRA 2013 Tax Revenue Bond debt service requirements to maturity are as follows:
Principal InterestTotal
Requirements Principal InterestTotal
Requirements2016 $ 170,000 $ 1,794,713 $ 1,964,713 $ 730,000 $ 786,650 $ 1,516,650 2017 290,000 1,787,812 2,077,812 795,000 763,775 1,558,775 2018 360,000 1,778,063 2,138,063 860,000 730,350 1,590,350 2019 740,000 1,761,562 2,501,562 945,000 685,225 1,630,225 2020 895,000 1,737,037 2,632,037 1,035,000 635,725 1,670,725
2021-2025 5,090,000 8,007,062 13,097,062 6,720,000 2,293,650 9,013,650 2026-2030 6,465,000 6,625,962 13,090,962 4,895,000 894,812 5,789,812 2031-2035 7,920,000 5,145,562 13,065,562 2,065,000 207,413 2,272,413 2036-2040 9,755,000 3,263,281 13,018,281 - - - 2041-2044 9,500,000 878,625 10,378,625 - - -
$ 41,185,000 $ 32,779,681 $ 73,964,681 $ 18,045,000 $ 6,997,600 $ 25,042,600
2013 Project Revenue Refunding Bonds 2013 Tax Revenue Refunding Bonds
The subordinate note to ACA, as described above, debt service requirements to maturity are estimated as follows:
Principal InterestTotal
Requirements2016 - - - 2017 - - - 2018 - - - 2019 - - - 2020 - - -
2021-2025 - - - 2026-2030 - - - 2031-2035 $ 146,098 $ 132,916 $ 279,014 2036-2040 506,828 557,885 1,064,713 2041-2044 777,629 1,001,805 1,779,434
$ 1,430,555 $ 1,692,607 $ 3,123,161
Other long-term loans and notes payable
Component Units Changes in Long Term Liabilities
The following is a summary of long-term debt changes of the authority for the year (in thousands):
Beginning Balance 1/1/15 Additions Reductions
Ending Balance 12/31/15
Due Within One Year
Bonds payable: Revenue bonds $ 59,230 $ - $ - $ 59,230 $ 900 Premiums (discounts) 565 - 29 536 29 Due to other governments 6,951 1,132 675 7,408 -
Total bonds payable 66,746 1,132 704 67,174 929Other long-term loans and notes 1,431 - - 1,431 - Subordinate management fee (see note V.B.3 for more detail) 916 - 108 808 - Component units long term liabilities $ 69,093 $ 1,132 $ 812 $ 69,413 $ 929
63

F. FUND BALANCE REPORTING
The City of Vancouver implemented GASB Statement no 54, Fund Balance Reporting and Governmental Fund Type Definitions. The objective of this statement is to improve the usefulness and understandability of governmental fund balance information. It provides more clearly defined categories to make the nature and extent of constraints placed on a government’s fund balance more transparent. It also clarifies the existing fund type definitions to improve the comparability of governmental fund financial statements and help users better understand the purpose for which governments have chosen to use particular funds for financial reporting. Categories of fund balance: Non-spendable – Amounts that cannot be spent either due to the physical form or as a result of a legal or contractual obligation (such as the corpus of an endowment fund). Restricted – Amounts constrained due to specific purposes by either a third party (such as grantors, bondholders, and creditors) or by law through constitutional provision or enabling legislation. Committed- Amounts constrained to specific purposes by formal action (adoption of enabling legislation) by the government’s highest level of decision-making authority (City Council). Committed amounts do not lapse nor can they be used for any other purpose unless the government takes the same level of action (adoption of similar enabling legislation) to remove it. Assigned- Amounts constrained by the City’s expressed intent to use the resources for specific purposes. With the exception of the General Fund, this is the residual fund balance of all governmental funds with positive fund balance. Unassigned – Amounts that are residual classification for the General Fund only.
64

Fund balances by classification for the year ended December 31, 2015, are as follows:
Fund Balance Classif ications:General
FundConsolidated
Fire Fund Street Fund
Non-major Governmental
Funds
Total Governmental
FundsNonspendable
Inventory/Prepaid $ 88,348 $ - $ - $ 7,593 $ 95,941 Capital assets held for resale 228,400 - - - 228,400
316,748 - - 7,593 324,341 Restricted
Federal Grants 78,647 - - 5,187,802 5,266,449 Capital purposes - - - 27,838,109 27,838,109 Economic development - - - 3,012,156 3,012,156 Fire Services - 16,835,155 - 2,070,225 18,905,380 Debt Service - - - 2,110,820 2,110,820 Culture and recreation - - - 47,676 47,676
78,647 16,835,155 - 40,266,788 57,180,590 Committed
Capital purposes 861,114 - - 6,140,388 7,001,502 Emergency reserves 10,719,912 - - - 10,719,912 Revenue Stabilization 3,618,878 - - - 3,618,878 Working capital 29,744,204 - - - 29,744,204 Economic development - - - 1,234,590 1,234,590 Cemetary - - - 411,058 411,058
- - 7,311,198 - 7,311,198 44,944,108 - 7,311,198 7,786,036 60,041,342
AssignedGrants 127,500 - - - 127,500 Capital purposes - - - 20,326,917 20,326,917 Economic development - - - 100,000 100,000 Compensated absences 3,659,563 - - - 3,659,563
3,787,063 - - 20,426,917 24,213,980
Unassigned 7,896,174 - - - 7,896,174 Total $ 57,022,740 $ 16,835,155 $ 7,311,198 $ 68,487,334 $ 149,656,427
Street-oriented maintenance and construction
Stabilization Arrangements There are two stabilization arrangements within the City, for which the City is disclosing as committed fund balance within the General Fund: Emergency Reserves and Revenue Stabilization. These reserves were committed by Council Resolution M-3370 and adopted on May 7, 2012. An Emergency Reserve will be maintained in the General Fund equal to 7% of actual external revenues in the preceding fiscal year in the General Fund, Street and Consolidated Fire Funds. The Emergency Reserve is for unexpected, large-scale events where damage in excess of $1 million is incurred, and immediate, remedial action must be taken to protect the health and safety of residents (e.g. major flood, earthquake, etc.). In the event these “Emergency Reserve” funds are utilized, the City shall restore the reserve to the full 7% level within a reasonable amount of time as necessitated by the scale of emergency. A clear plan will be developed to refill the reserve and the first significant deposit will occur the following fiscal year after the event. The City maintains a “Revenue Stabilization” reserve with a goal of reaching 2.5% of the current year’s budget in the General fund. This reserve may be used to provide funding to temporarily offset unanticipated fluctuations in on-going revenues or unanticipated events, such as unexpected external mandates, reductions in state shared revenues, etc. The reserve funds will provide time for the City to restructure its operations in a deliberate manner to ensure continuance of critical city activities. If the reserve is spent down, it shall be restored within the following two years. This reserve could be utilized if there is an identified 3-6 month trend of reduced revenues.
65
NOTE IV. OTHER DISCLOSURES
A. RELATED PARTY TRANSACTIONS
In December 2004, the Downtown Redevelopment Authority, a component unit of the City of Vancouver, began construction of a Convention Center and Hotel in downtown Vancouver. The project was funded by proceeds from the sale of tax exempt bonds issued by the Vancouver Downtown Redevelopment Authority. The bonds were secured by project revenues, together with a credit from the State of Washington equal to 0.033% of 1% of the sales and use tax collected within the City and Clark County, and a dedication of 50% of the lodging taxes collected within the City. During 2015, the City has recognized $1,060,374 in expenditures associated with lodging tax revenues dedicated to the project.
B. CONTINGENCIES AND COMMITMENTS
Litigation The City is contingently liable with respect to lawsuits and other claims incidental to the ordinary course of its operations. It is the opinion of City management and the City Attorney that any losses which may ultimately be incurred as a result of the suits and claims will not be material. Grants The City participates in a number of federal- and state-assisted programs. These grants are subject to audit by the grantors or their representatives. Such audits could result in requests for reimbursement to grantor agencies for expenditures disallowed under the terms of the grants. City management believes that such disallowances, if any, will be immaterial. Contract Commitments The City has active contracts for professional services and construction projects as of December 31, 2015. The professional services contracts are primarily for operations of a sewer treatment facility, architectural, engineering and technology contracts. These construction projects include large transportation and infrastructure projects and facility projects. Significant City commitments to contracts as of fiscal year end totals $70,214,085. Related Party Commitments: 1. Commitment to Downtown Redevelopment Authority (DRA), with respect to the Vancouver Conference Center The City signed an agreement on December 1, 2003, to participate in the construction and operation of the Vancouver Conference Center, using tourism funds. In June 2013, the DRA refinanced the debt associated with the construction of the Vancouver Conference Center. As a part of the refinancing, the City agreed that, if, prior to each Interest Payment Date or Principal Payment Date, the amounts on deposit with the Trustee in the Project Revenue Bonds Debt Service Account and in the Authority Reserve Account are insufficient to pay the principal and interest due on the 2013 Project Revenue Bonds, upon notice of such deficiency from the Trustee, the City shall pay to the Trustee an amount equal to the deficiency; the maximum obligation on that payment date being the debt service amount of the 2013 Project Revenue Bonds due on such date, as described in Note III.E. Any payment by the City of this conditional payment amount shall constitute a loan by the City to the DRA, with interest payable on such amounts at the rate or rates on the 2013 Project Revenue bonds. During 2015, the City made no payments under its contingent payment obligation. The city has no current expectation of having to make any such payments, as it expects project revenues and tax revenues to be sufficient for such purposes. 2. Commitment to Clark County, with respect to the Exhibition Hall The City signed an interlocal agreement on September 14, 2004, for support of the Exhibition Hall. This hall is considered a tourism related facility which would benefit both the County and City. Beginning in 2005, the City pledges it will pay an amount of money (up to certain maximum amounts) which would be necessary to enable the County to meet its semi-annual debt service obligation, should they fall short from revenues dedicated for this purpose. For 2012-2016, the maximum amount is $200,000, and from 2017 through termination, the maximum is $150,000. Under the terms of the interlocal, the amount of the City’s pledge is reduced by the amount of any rental reduction the County grants to the amphitheater lessee. In July of 2008, the County reduced the rental rates for the amphitheater to such an extent that this commitment has been reduced to zero.
66

To date, no such payments have been made against this agreement since the dedicated revenues have been adequate to cover the debt service. This agreement will be terminated once the bonds issued to finance the Exhibition Hall have been redeemed or defeased, no later than 2027. 3. Commitment to Hilton Hotel, with respect to the Subordinate and Supersubordinate Management Fees The DRA signed an agreement on December 1, 2003, for the operation of the Vancouver Conference Center. In that agreement, during the fourth full year of operation, which was 2009, the Manager of the Vancouver Conference Center (Hilton Hotels) would earn a subordinate management fee for its services. These fees would be paid subject to the availability of amounts in the Subordinate Management Fee Fund. Also, during the sixth full year of operation, the Manager would earn a super-subordinate management fee for its services. These fees would be paid subject to the availability of amounts in the Super-subordinate Management Fee Fund. Hotel operating results prior to the DRA debt refinancing completed in June 2013, were not sufficient to funds these fees. As part of the refinancing of the DRA debt in June 2013, a new agreement was signed with the Manager of the Vancouver Conference Center (Hilton Hotels) that provides for forgiveness of the above fee amounts over a 10-year period, on a straight-line basis. The forgiveness of these fees is recorded as a Special Item, Forgiveness of Debt on the Statement of Activities. During December 31, 2015, $107,813 had been forgiven. The outstanding obligation recorded on the Statement of Net Position as of December 31, 2015, is $808,597. 4. Commitment to the IRS, with respect to Arbitrage Rebatable arbitrage is defined by the Internal Revenue Service Code Section 148 as earnings on investments purchased from the gross proceeds of a bond issue that are in excess of the amount that would have been earned if the investments were invested at a yield equal to the yield on the bond issue. The rebatable arbitrage must be paid to the federal government. The City of Vancouver carefully monitors its investments to restrict earnings to a yield less than the bond issue, and therefore limit any arbitrage liability. As of December 31, 2015, the City has no arbitrage rebate liability.
C. JOINT VENTURES AND JOINTLY GOVERNED ORGANIZATIONS
Joint Ventures
The City is involved in a joint operation with other governmental entities in the establishment and operation of the Clark Regional Emergency Services Agency. Control of the entity is shared equitably by the controlling organizations. For reporting purposes, this entity is shown as a governmental activities joint venture. The City’s share of ownership is reported as “Investment in joint venture” in the government-wide statement of net position. Control in this entity, by participating governmental entities, is by board representation.
Clark Regional Emergency Services Agency
Clark Regional Emergency Services Agency (the Agency) was created under the Interlocal Cooperation Act (RCW 39.4) by agreement between the City and other governmental units and political districts. Its purpose is to provide a consolidated public safety communications service to participating cities, political districts, and Clark County. The City has a 40% interest in the equity and operations of the Agency. Given the timing of available information, the City is reporting its investment in the joint venture at the 2014 values. In 2014, the Agency had an increase in net position totaling $2,952,182. The City’s share of 2014 operations was a gain of $1,180,873. However, due to the Agency restating the of prior year financial statements, the City’s prior equity interest was reduced $14,226 for a total equity interest of $6,158,680 at the end of 2015. Current liabilities are comprised of amounts owed to vendors, other governments, and accrued employee leave liabilities. The entity’s long-term debt consists mainly of deferred compensation and accrued liabilities. The entity’s long-term debt is unsecured. Clark County maintains the accounting records for Clark Regional Emergency Services Agency. Detailed financial statements for this entity can be obtained from Clark Regional Emergency Services Agency at 710 W 13th St, Vancouver, WA 98660-2810.
Jointly Governed Organizations
Council for the Homeless
The City, Clark County, and the Vancouver Housing Authority entered into an Intergovernmental Cooperation Act (RCW 39.4) on December 20, 1989, for the establishment of the Council for the Homeless (Council) as a collaborative effort to address issues of homelessness. Each jurisdiction appoints one board member. The remaining 12 members of the Council are selected by the Council’s bylaws. Clark County and Vancouver Housing Authority provides annual fiscal support for operations where the City does not; funding, if provided by the City, comes in the form of Council applying for competitive grants as a subrecipient of the City. For the year ending December 31, 2015, the City made subrecipient grant payments to the Council totaling $61,021. The relationship between the City and the Council does not create an ongoing financial interest or financial responsibility.
67

D. RISK MANAGEMENT
During 1977, the City became a qualified self-insurer for workers’ compensation as an alternative to the state program. In 1978, all local governments within Washington State were brought under the state unemployment tax coverage, which also allowed qualified cities to become self-insured. The City qualified and became self-insured for unemployment in 1978. The City established a Self-Insurance Internal Service fund to account for and finance its insured and uninsured risks of loss. The fund addresses claims in four areas of risk that include general liability, workers’ compensation, unemployment, and property. Commercial insurance is purchased to handle risk of loss. In the past three years, no settlement has exceeded the City’s insurance limits. Beginning in 2015, the City also became self-insured for certain employees’ healthcare coverage. The City provides insurance coverage deemed as adequate and appropriate. In the case of City self-insurance activity, non-incremental claims adjustment expenses are not included as a part of the accrued claims liabilities in the financial statements.
General liability and Property
The self-insurance cost for liability claims and claims administration through December 31, 2015, is $735,833 with 105 new claims filed for 2015. The fund pays the majority of claims involving general liability, but has other liability coverage through specific policies. Currently, specific policies include airpark liability at an annual cost of $4,691. Coverage totals $5,000,000 for liability and $5,000,000 for hangar keepers legal. In addition, the City purchases excess liability insurance for all City operations including auto, for a limit of $10,000,000 plus $10,000,000 excess at an annual cost of $403,336. The excess policy provides $1,000,000 for self-insured retention. The City also purchases liability on specific vehicles up to $1,000,000 at an annual cost of $13,600 and inland marine coverage for the equipment fleet at an annual cost of $44,615. The deductible for fleet physical damage is 5% subject to $10,000 minimum.
Property claim costs in 2015 were $121,741, with 42 new first party property and vehicle claims reported in 2015. The City carries fire damage insurance (buildings and business personal property), earth movement, equipment breakdown, valuable papers, computer virus, accounts receivable and flood insurance coverage at an annual cost of $394,393 for all City buildings and contents. Policy coverage for property damage is up to $400 million with adjustable deductibles based on specific event types. This represents replacement cost for City buildings and contents.
Worker’s compensation
The cost for Workers’ Compensation claims and claims administration was $1,449,183 in 2015, with 89 new claims processed. Reportable claims costs for 2015 are $525,949 with 30 open claims. The City is self-insured through the fund for workers’ compensation; however, an excess coverage policy is carried at an annual premium cost of $88,506. The policy has a $1,000,000 deductible.
Contributions and reserves
City fund contributions to the Self-Insurance Fund are determined using information from the contributing funds past claims experience and loss exposures. The claims liability reported in the fund totaled $5,169,177 at December 31, 2015.
The claims liability, as reported in the fund, is based on the requirements of GASB Statement 10, Accounting and Financial Reporting for Risk Financing and Related Insurance Issues, which requires that a liability for claims be reported if information prior to the issuance of the financial statements indicates that it is probable that a liability has been incurred at the date of the financial statements and that the amount of the loss can be reasonably estimated. The following was prepared based on an actuarial analysis by Bickmore dated April 3, 2015. These are actuarial estimated amounts reflecting expected losses; actual losses may vary slightly. Changes in the fund’s claims liability amount in 2015, 2014, and 2013 are as follows:
Year
Beginning of Fiscal Year Liability
Current Year Claims and Changes in Estimates
Claim Payments
Balance at Fiscal Year End
2015 $ 4,323,000 $ 3,152,934 $ 2,306,757 $ 5,169,177
2014 3,153,529 4,200,529 3,031,058 4,323,000 2013 2,983,490 2,944,442 2,774,403 3,153,529
Employee healthcare Beginning January 2015, the City established an internal service fund for the purpose of self-insuring employee medical costs. The City pays claims and expenses for employees choosing this plan and contracts with a third party administrator to process claims. The plan carries reinsurance coverage with a $150,000 individual stop loss, and an aggregate stop loss of 125% of claims. Since the fund is recently established, no settlements have exceeded coverage to date. Any outstanding claims liabilities existing at the end of the fiscal year were deemed immaterial and were not booked in the financial statements.
68

The City is obligated to establish a 16 week contingency reserve of $2,058,502 for this internal service fund. As of December 31, 2015, fund balance for the self-insured health insurance fund is $4,018,343 after a full year of operations. The City is confident the reserve is adequate.
E. PROPERTY TAXES
The Clark County Treasurer acts as an agent to collect property taxes levied in the County for the City and all other taxing authorities. (See Note I: D.2 receivables and payables for additional discussions).
January 1 Taxes are levied and become an enforceable lien against properties.
February 14 Tax bills are mailed.
April 30 First of two equal installment payments is due.
May 31 Assessed value of property established for next year's levy at 100 percent of market value.
October 31 Second installment is due.
Property Tax Calendar
Cities are permitted to levy up to $3.60 per $1,000 of assessed valuation for general governmental services and $0.225 per $1,000 for local Fire Pension Funds. However, a separate library district was formed in 1981 for the tax year 1982, and this district annexed the City thus reducing the City’s levy rate by $.50 per $1,000 of assessed valuation to $3.10/$1,000. Because the City has a local Fire and Police Pension Funds, the City is able to add $0.225 to the levy rate per $1,000 of assessed valuation which makes the City’s maximum levy rate at $3.325/$1,000. This amount may be reduced for any of the following reasons:
• The Washington State Constitution limits the total regular property taxes to one percent of assessed valuation or $10 per $1,000 of value, except for port districts and public utility districts. Within the one percent limitation, RCW 84.52.043(2) imposes an aggregate limitation on regular levies by all taxing districts, other than the State, of $5.90/$1,000 of assessed value, except for levies for any port or public utility district; excess levies authorized in Article VII, Section 2 of the State Constitution; and certain levies for acquiring conservation futures, for emergency medical services or care, and to finance affordable housing.
• The regular property tax increase limitation (chapter 84.55 RCW), as amended most recently by Initiative No. 747
(which was passed by voters in 2001), limits the total dollar amount of regular property taxes levied by an individual local taxing district such as the City to the amount of such taxes levied in the highest of the three most recent years multiplied by a limit factor, plus an adjustment to account for taxes on new construction, annexations, improvements and State-assessed property at the previous year’s rate. The limit factor is the lesser of 101 percent of the highest levy in the three previous years (excluding new construction, improvements, and State-assessed property) or 100 percent plus inflation, unless a greater amount is approved by a simple majority of the voters. With a supermajority vote of the Council, the limit factor is a flat 101 percent. On November 8, 2007, the Washington Supreme Court ruled Initiative 747 unconstitutional. On November 29, 2007, the Legislature approved a bill reinstating the 101 percent property tax limit factor approved by the voters under Initiative 747.
• The City may voluntarily levy taxes below the legal limit.
Special levies approved by the voters are not subject to the above limitations.
For 2015, the City’s regular tax levy was $2.7996 per $1,000 on a total taxable 2015 assessed valuation of $15,812,154,819 for a total regular levy of $44,267,755.
Outstanding property taxes at December 31, 2015 amount to $900,974. The City does not establish an allowance for doubtful accounts since state law has authorized sales of taxed property to satisfy delinquent property taxes. All property taxes are deposited into the General Fund. Transfers are then made into the general obligation debt service funds as required by the bond ordinances. Any shortages due to delinquent property taxes are absorbed by the General Fund.
F. EMPLOYEE RETIREMENT SYSTEMS AND PENSION PLANS The following table represents the aggregate pension amounts for all plans subject to the requirements of the GASB Statement 68, Accounting and Financial Reporting for Pensions for the year 2015:
69

Aggregate Pension Amounts – All Plans Pension liabilities $32,241,831 Pension assets 17,238,178 Deferred outflows of resources 6,651,804 Deferred inflows of resources 9,498,927 Pension expense/expenditures 4,648,104
State Sponsored Pension Plans Substantially all City’s full-time and qualifying part-time employees participate in one of the following statewide retirement systems administered by the Washington State Department of Retirement Systems, under cost-sharing, multiple-employer public employee defined benefit and defined contribution retirement plans. The state Legislature establishes, and amends, laws pertaining to the creation and administration of all public retirement systems. The Department of Retirement Systems (DRS), a department within the primary government of the State of Washington, issues a publicly available comprehensive annual financial report (CAFR) that includes financial statements and required supplementary information for each plan. The DRS CAFR may be obtained by writing to: Department of Retirement Systems Communications Unit P.O. Box 48380 Olympia, WA 98540-8380 Or the DRS CAFR may be downloaded from the DRS website at www.drs.wa.gov. Public Employees’ Retirement System (PERS) PERS members include elected officials; state employees; employees of the Supreme, Appeals and Superior Courts; employees of the legislature; employees of district and municipal courts; employees of local governments; and higher education employees not participating in higher education retirement programs. PERS is comprised of three separate pension plans for membership purposes. PERS plans 1 and 2 are defined benefit plans, and PERS plan 3 is a defined benefit plan with a defined contribution component. PERS Plan 1 provides retirement, disability and death benefits. Retirement benefits are determined as two percent of the member’s average final compensation (AFC) times the member’s years of service. The AFC is the average of the member’s 24 highest consecutive service months. Members are eligible for retirement from active status at any age with at least 30 years of service, at age 55 with at least 25 years of service, or at age 60 with at least five years of service. Members retiring from active status prior to the age of 65 may receive actuarially reduced benefits. Retirement benefits are actuarially reduced to reflect the choice of a survivor benefit. Other benefits include duty and non-duty disability payments, an optional cost-of-living adjustment (COLA), and a one-time duty-related death benefit, if found eligible by the Department of Labor and Industries. PERS 1 members were vested after the completion of five years of eligible service. The plan was closed to new entrants on September 30, 1977. Contributions The PERS Plan 1 member contribution rate is established by State statute at 6 percent. The employer contribution rate is developed by the Office of the State Actuary and includes an administrative expense component that is currently set at 0.18 percent. Each biennium, the state Pension Funding Council adopts Plan 1 employer contribution rates. The PERS Plan 1 required contribution rates (expressed as a percentage of covered payroll) for 2015 were as follows:
PERS Plan 1 Actual Contribution Rates: Employer Employee* January through June 2015 9.21% 6.00% July through December 2015 11.18% 6.00%
The City’s actual contributions to the plan were $26,850 for the year ended December 31, 2015. PERS Plan 2/3 provides retirement, disability and death benefits. Retirement benefits are determined as two percent of the member’s average final compensation (AFC) times the member’s years of service for Plan 2 and 1 percent of AFC for Plan 3. The AFC is the average of the member’s 60 highest-paid consecutive service months. There is no cap on years of service credit. Members are eligible for retirement with a full benefit at 65 with at least five years of service credit. Retirement before age 65 is considered an early retirement. PERS Plan 2/3 members who have at least 20 years of service credit and are 55 years of age or older, are eligible for early retirement with a benefit that is reduced by a factor that varies according to age for each year before age 65. PERS Plan 2/3 members who have 30 or more years of service credit and are at least 55 years old can retire under one of two provisions:
• With a benefit that is reduced by three percent for each year before age 65; or
70

• With a benefit that has a smaller (or no) reduction (depending on age) that imposes stricter return-to-work rules. PERS Plan 2/3 members hired on or after May 1, 2013, have the option to retire early by accepting a reduction of five percent for each year of retirement before age 65. This option is available only to those who are age 55 or older and have at least 30 years of service credit. PERS Plan 2/3 retirement benefits are also actuarially reduced to reflect the choice of a survivor benefit. Other PERS Plan 2/3 benefits include duty and non-duty disability payments, a cost-of-living allowance (based on the CPI), capped at three percent annually and a one-time duty related death benefit, if found eligible by the Department of Labor and Industries. PERS 2 members are vested after completing five years of eligible service. Plan 3 members are vested in the defined benefit portion of their plan after ten years of service; or after five years of service if 12 months of that service are earned after age 44. PERS Plan 3 defined contribution benefits are totally dependent on employee contributions and investment earnings on those contributions. PERS Plan 3 members choose their contribution rate upon joining membership and have a chance to change rates upon changing employers. As established by statute, Plan 3 required defined contribution rates are set at a minimum of 5 percent and escalate to 15 percent with a choice of six options. Employers do not contribute to the defined contribution benefits. PERS Plan 3 members are immediately vested in the defined contribution portion of their plan. Contributions The PERS Plan 2/3 employer and employee contribution rates are developed by the Office of the State Actuary to fully fund Plan 2 and the defined benefit portion of Plan 3. The Plan 2/3 employer rates include a component to address the PERS Plan 1 UAAL and an administrative expense that is currently set at 0.18 percent. Each biennium, the state Pension Funding Council adopts Plan 2 employer and employee contribution rates and Plan 3 contribution rates. The PERS Plan 2/3 required contribution rates (expressed as a percentage of covered payroll) for 2015 were as follows:
PERS Plan 2/3 Actual Contribution Rates: Employer 2/3 Employee 2* January through June 2015 9.21% 4.92% July through December 2015 11.18% 6.12% Employee PERS Plan 3 varies
The City’s actual contributions to the plan were $3,920,974 for the year ended December 31, 2015. Law Enforcement Officers’ and Fire Fighters’ Retirement System (LEOFF) LEOFF membership includes all full-time, fully compensated, local law enforcement commissioned officers, firefighters, and as of July 24, 2005, emergency medical technicians. LEOFF is comprised of two separate defined benefit plans. LEOFF Plan 1 provides retirement, disability and death benefits. Retirement benefits are determined per year of service calculated as a percent of final average salary (FAS) as follows:
• 20+ years of service – 2.0% of FAS • 10-19 years of service – 1.5% of FAS • 5-9 years of service – 1% of FAS
The FAS is the basic monthly salary received at the time of retirement, provided a member has held the same position or rank for 12 months preceding the date of retirement. Otherwise, it is the average of the highest consecutive 24 months’ salary within the last ten years of service. Members are eligible for retirement with five years of service at the age of 50. Other benefits include duty and non-duty disability payments, a cost-of living adjustment (COLA), and a one-time duty-related death benefit, if found eligible by the Department of Labor and Industries. LEOFF 1 members were vested after the completion of five years of eligible service. The plan was closed to new entrants on September 30, 1977. Contributions Starting on July 1, 2000, LEOFF Plan 1 employers and employees contribute zero percent, as long as the plan remains fully funded. The LEOFF Plan I had no required employer or employee contributions for fiscal year 2015. Employers paid only the administrative expense of 0.18 percent of covered payroll. LEOFF Plan 2 provides retirement, disability and death benefits. Retirement benefits are determined as two percent of the final average salary (FAS) per year of service (the FAS is based on the highest consecutive 60 months). Members are eligible for retirement with a full benefit at 53 with at least five years of service credit. Members who retire prior to the age of 53 receive reduced benefits. If the member has at least 20 years of service and is age 50, the reduction is three percent for each year prior to age 53. Otherwise, the benefits are actuarially reduced for each year prior to age 53. LEOFF 2 retirement benefits are also actuarially reduced to reflect the choice of a survivor benefit. Other benefits include duty and non-duty disability payments, a cost-of-living allowance (based on the CPI), capped at three percent annually and a one-time duty-related death benefit, if found eligible by the Department of Labor and Industries. LEOFF 2 members are vested after the completion of five years of eligible service.
71

Contributions The LEOFF Plan 2 employer and employee contribution rates are developed by the Office of the State Actuary to fully fund Plan 2. The employer rate included an administrative expense component set at 0.18 percent. Plan 2 employers and employees are required to pay at the level adopted by the LEOFF Plan 2 Retirement Board. The LEOFF Plan 2 required contribution rates (expressed as a percentage of covered payroll) for 2015 were as follows:
LEOFF Plan 2 Actual Contribution Rates: Employer Employee State and local governments 5.23% 8.41% Ports and Universities 8.59% 8.41%
The City’s actual contributions to the plan were $2,042,874 for the year ended December 31, 2015. The Legislature, by means of a special funding arrangement, appropriates money from the state General Fund to supplement the current service liability and fund the prior service costs of Plan 2 in accordance with the recommendations of the Pension Funding Council and the LEOFF Plan 2 Retirement Board. This special funding situation is not mandated by the state constitution and could be changed by statute. For the state fiscal year ending June 30, 2015, the state contributed $58,339,032 to LEOFF Plan 2. At December 31, 2015, the City recorded Operating Contributions totaling $1,257,591 for the special funding situation. Actuarial Assumptions The total pension liability (TPL) for each of the DRS plans was determined using the most recent actuarial valuation completed in 2015 with a valuation date of June 30, 2014. The actuarial assumptions used in the valuation were based on the results of the Office of the State Actuary’s (OSA) 2007-2012 Experience Study. Additional assumptions for subsequent events and law changes are current as of the 2014 actuarial valuation report. The TPL was calculated as of the valuation date and rolled forward to the measurement date of June 30, 2015. Plan liabilities were rolled forward from June 30, 2014, to June 30, 2015, reflecting each plan’s normal cost (using the entry-age cost method), assumed interest and actual benefit payments.
• Inflation: 3% total economic inflation; 3.75% salary inflation
• Salary increases: In addition to the base 3.75% salary inflation assumption, salaries are also expected to grow by promotions and longevity.
• Investment rate of return: 7.5% Mortality rates were based on the RP-2000 report’s Combined Healthy Table and Combined Disabled Table, published by the Society of Actuaries. The OSA applied offsets to the base table and recognized future improvements in mortality by projecting the mortality rates using 100 percent Scale BB. Mortality rates are applied on a generational basis; meaning, each member is assumed to receive additional mortality improvements in each future year throughout his or her lifetime. There were minor changes in methods and assumptions since the last valuation.
• The OSA updated demographic assumptions, consistent with the changes from the 2007-2012 Experience
Study Report, used when valuing the PERS 1 Basic Minimum COLA.
• The OSA corrected how valuation software calculates a member’s entry age under the entry age normal actuarial cost method. Previously, the funding age was rounded, resulting in an entry age one year higher in some cases.
• For purposes of calculating the Plan 2/3 Entry Age Normal Cost contribution rates, the OSA now uses the current blend of Plan 2 and Plan 3 salaries rather than using a long-term membership assumption of two-thirds Plan 2 members and one-third Plan 3 members.
• The OSA changed the way it applies salary limits, as described in the 2007-2012 Experience Study Report. Discount Rate The discount rate used to measure the total pension liability for all DRS plans was 7.5 percent. To determine that rate, an asset sufficiency test included an assumed 7.7 percent long-term discount rate to determine funding liabilities for calculating future contribution rate requirements. (All plans use 7.7 percent except LEOFF 2, which
72

has assumed 7.5 percent). Consistent with the long-term expected rate of return, a 7.5 percent future investment rate of return on invested assets was assumed for the test. Contributions from plan members and employers are assumed to continue being made at contractually required rates (including PERS 2/3, PSERS 2, SERS 2/3, and TRS 2/3 employers, whose rates include a component for the PERS 1, and TRS 1 plan liabilities). Based on these assumptions, the pension plans’ fiduciary net position was projected to be available to make all projected future benefit payments of current plan members. Therefore, the long-term expected rate of return of 7.5 percent was used to determine the total liability. Long-Term Expected Rate of Return The long-term expected rate of return on the DRS pension plan investments of 7.5 percent was determined using a building-block-method. The Washington State Investment Board (WSIB) used a best estimate of expected future rates of return (expected returns, net of pension plan investment expense, including inflation) to develop each major asset class. Those expected returns make up one component of WSIB’s capital market assumptions. The WSIB uses the capital market assumptions and their target asset allocation to simulate future investment returns at various future times. The long-term expected rate of return of 7.5 percent approximately equals the median of the simulated investment returns over a 50-year time horizon. Estimated Rates of Return by Asset Class Best estimates of arithmetic real rates of return for each major asset class included in the pension plan’s target asset allocation as of June 30, 2015, are summarized in the table below. The inflation component used to create the table is 2.2 percent and represents the WSIB’s most recent long-term estimate of broad economic inflation.
Asset Class
Target Allocation
% Long-Term Expected Real Rate of Return
Arithmetic Fixed Income 20% 1.70% Tangible Assets 5% 4.40% Real Estate 15% 5.80% Global Equity 37% 6.60% Private Equity 23% 9.60% 100%
Sensitivity of Net Pension Liability The table below presents the City’s proportionate share of the net pension liability calculated using the discount rate of 7.5 percent, as well as what the City’s proportionate share of the net pension liability would be if it were calculated using a discount rate that is 1-percentage point lower (6.5 percent) or 1-percentage point higher (8.5 percent) than the current rate.
1% Decrease (6.5%) Current Discount Rate (7.5%) 1% Increase (8.5%) PERS 1 $20,698,818 $17,001,046 $13,821,301 PERS 2/3 43,179,520 14,767,016 (6,987,373) LEOFF 1 (1,901,464) (2,972,183) (3,884,772) LEOFF 2 13,356,408 (13,337,267) (33,425,271)
Pension Plan Fiduciary Net Position Detailed information about the State’s pension plans’ fiduciary net position is available in the separately issued DRS financial report. Pension Liabilities (Assets), Pension Expense, and Deferred Outflows of Resources and Deferred Inflows of Resources Related to Pensions At June 30, 2015, the City reported a total pension liability of $31,768,062 and 16,309,450 for its proportionate share of the net pension liabilities and net pension assets, respectively, as follows:
Liability (or Asset) PERS 1 $17,001,046 PERS 2/3 14,767,016 LEOFF 1 (2,972,183) LEOFF 2 (13,337,267)
The amount of the liability/(asset) reported above for LEOFF Plan 2 reflects a reduction for State pension support provided to the City. The amount recognized by the City as its proportionate share of the net pension liability/(asset), the
73

related State support, and the total portion of the net pension liability/(asset) that was associated with the City were as follows:
Liability (or Asset) LEOFF 2 – employer’s proportionate share
$(13,337,267
LEOFF 2 – State’s proportionate share of the net pension liability/(asset) associated with the employer
(8,818,610) Total $(22,155,877)
At June 30, 2015, the City’s proportionate share of the collective net pension liabilities was as follows:
Proportionate Share June 30, 2014
Proportionate Share June 30, 2015
Change in Proportion
PERS 1 0.3213490% 0.3250100% (0.003661%) PERS 2/3 0.4066380% 0.4132880% (0.006650%) LEOFF 1 0.2481670% 0.2466090% 0.001558% LEOFF 2 1.281662% 1.297652% (0.015990%)
Employer contribution transmittals received and processed by the DRS for the fiscal year ended June 30,2015, are used as the basis for determining each employer’s proportionate share of the collective pension amounts reported by the DRS in the Schedules of Employer and Nonemployer Allocations for all plans except LEOFF 1. LEOFF Plan 1 allocation percentages are based on the total historical employer contributions to LEOFF 1 from 1971 through 2000 and the retirement benefit payments in fiscal year 2015. Historical data was obtained from a 2011 study by the Office of the State Actuary (OSA). In fiscal year 2015, the state of Washington contributed 87.12 percent of LEOFF 1 employer contributions and all other employers contributed the remaining 12.88 percent of employer contributions. LEOFF 1 is fully funded and no further employer contributions have been required since June 2000. If the plan becomes underfunded, funding of the remaining liability will require new legislation. The allocation method the plan chose reflects the projected long-term contribution effort based on historical data. In fiscal year 2015, the state of Washington contributed 39.80 percent of LEOFF 2 employer contributions pursuant to RCW 41.27.726 and all other employers contributed the remaining 60.20 percent of employer contributions. The collective net pension liability (asset) was measured as of June 30, 2015, and the actuarial valuation date on which the total pension liability (asset) is based was as of June 30, 2014, with update procedures used to roll forward the total pension liability to the measurement date. Pension Expense For the year ended December 31, 2015, the City recognized pension expense as follows:
Pension Expense PERS 1 1,243,646 PERS 2/3 1,849,288 LEOFF 1 (575,866) LEOFF 2 823,596
Total 3,340,664
74

Deferred Outflows of Resources and Deferred Inflows of Resources At December 31, 2015, the City reported deferred outflows of resources and deferred inflows of resources related to pensions from the following sources:
PERS 1Deferred
Outflows of Resources
Deferred Inflows of Resources
Net difference between projected and actual investment earnings on pension plan investments
$ - $ 930,143
Contributions subsequent to the measurement date
1,012,901 -
TOTAL $ 1,012,901 $ 930,143
PERS 2/3Deferred
Outflows of Resources
Deferred Inflows of Resources
Differences between expected and actual experience
$ 1,569,738 $ -
Net difference between projected and actual investment earnings on pension plan investments
- 3,942,094
Changes of assumptions 23,793 - Changes in proportion and differences between contributions and proportionate share of contributions
213,974 -
Contributions subsequent to the measurement date
1,294,949 -
TOTAL $ 3,102,454 $ 3,942,094
LEOFF 1Deferred
Outflows of Resources
Deferred Inflows of Resources
Net difference between projected and actual investment earnings on pension plan investments
$ - $ 501,763
TOTAL $ - $ 501,763
LEOFF 2Deferred
Outflows of Resources
Deferred Inflows of Resources
Differences between expected and actual experience
$ 1,167,900 $ -
Net difference between projected and actual investment earnings on pension plan investments
- 4,041,122
Changes of assumptions 35,179 - Changes in proportion and differences between contributions and proportionate share of contributions
- 83,805
Contributions subsequent to the measurement date
1,079,630 -
TOTAL $ 2,282,709 $ 4,124,927
75

Deferred outflows of resources related to pensions resulting from the City’s contributions subsequent to the measurement date will be recognized as a reduction of the net pension liability in the year ended December 31, 2016. Other amounts reported as deferred outflows and deferred inflows of resources related to pensions will be recognized in pension expense as follows:
POLICE OFFICERS AND FIREFIGHTERS’ PENSION FUNDS
Plan Description Plan administration. The City administers the Fire and Police Pension Funds single-employer defined benefit pension plans. These funds were established by the City in compliance with requirements of the Revised Code of Washington 41.20 and 41.18. The plans are limited to police officers, firefighters and their beneficiaries for individuals employed before March 1, 1970, the effective date of LEOFF. The LEOFF laws were subsequently amended by the Pension Reform Act, which took effect October 1, 1977. Through the LEOFF Act, the state undertook to provide the bulk of police and fire pensions; however, the municipalities continue to be responsible for all or part of pension benefits for employees hired before March 1, 1970, as discussed later. The plans are closed plans that provide pension and medical benefits, some of which can be in excess of LEOFF benefits. The Policemen’s Pension Board is composed of seven members as follows: The mayor or his designate; the mayor pro-tem; the city clerk who acts as secretary; the city treasurer; and three police members who may be either active or retired city employees. The Firemen’s Pension Board is composed of five members as follows: The mayor or his designate; the city clerk who acts as secretary; the city treasurer; and two fire members who may be either active or retired city employees. The financial activity of the Police and Fire Pension Trust Funds are presented in the Statement of Net Position – Fiduciary Funds, and the Statement of Changes in Net Position – Fiduciary Funds. No separate stand-alone financial reports are issued for the plans. Plan membership. At December 31, 2015, pension plan membership consisted of only inactive plan members oar beneficiaries currently receiving benefits. Of the 113 members, 66 are fire members and 47 are police members. Benefit Provisions The LEOFF Act requires a varying obligation of the City for benefits paid to police officers and firefighters.
• Pension and medical expenses for police officers and firefighters retired prior to March 1, 1970, continue to be paid in their entirety by the City under the old pension laws.
• Police officers and firefighters hired before, but not retired on March 1, 1970, received at retirement the greater of the pension benefit provided under the old pension laws and under the LEOFF Act. Any excess of the old benefit over the LEOFF benefit is provided by the City. The City also pays the reasonable cost of necessary medical expenses of the retiree for life.
76

• For police officers and firefighters hired on or after March 1, 1970, and prior to October 1, 1977, the City is obligated for lifetime medical expenses only. The LEOFF system pays the entire retirement allowance.
• Police officers and firefighters hired on or after October 1, 1977, are covered entirely by the LEOFF system with no City obligation for either retirement allowance or medical expenses.
• The benefits are directly correlated to the salaries of active employees. Cost of Living Adjustments (COLAs) provided at the state level do not impact the total pension benefits provided to the members. The City’s obligation under the Plan consists of paying the difference between pension and medical benefits provided by LEOFF and those provided by the City’s Plan. There were no changes in benefit provisions in the current year.
Contributions Firemen Plan contributions are required by RCW 41.18, while Policemen Plan contributions are required by RCW 41.20. These Plans are closely tied to the LEOFF plan contributions. Any increases to the LEOFF plans decreases the contributions required by the City’s Police and Firemen Pension Plan. Any decreases to the LEOFF plan increase the contributions required by the Plans. Retirement benefit provisions are established in state statute and may only be amended by the State Legislature. Amendments to each of the Plans are authorized by the separate Police and Fire Pension Boards. Funding for the Police Pension Fund comes from annual transfers from the General Fund that are budgeted and approved by the City Council. Sources of funding for the Firefighters Pension Fund include donations, distributions from the state from fire insurance premium collections, and a property tax levy of up to $.225 per $1,000 of assessed valuation. Contributions are determined on a pay-as-you-go basis. Milliman Consultants and Actuaries completed actuarial studies of the two funds as of December 31, 2015; however, no actuarially determined contributions are provided. The General Fund is responsible for the costs of administering the plans, however the valuations assume this is coming from plan assets. If assets are depleted, the General Fund responsible for the costs. There have been no required employee contributions to the plans since March 1, 1970. For the year ended December 31, 2015, contributions made by the general fund to the Police and Fire Pension Funds were $1,080,000 and $1,755,996, respectively. These contributions came from the General Fund. The state contributes 25% of taxes on fire insurance premiums to the Fire Pension Fund and is considered a non-employer contributing entity. The amount contributed in 2015 to the Fire Pension Fund was $171,592. As of December 31, 2015, the Police Pension Funds and the Firefighters Pension Fund reported net position reserved for payment of future claims of $2,028,845 and $8,493,695, respectively. Investments Investment policy. The pension plan’s policy in regard to the allocation of invested assets is established and may be amended by the City Council. It is the policy of the City Council to pursue an investment strategy that reduces risk through the prudent diversification of the portfolio across a broad selection of distinct asset classes. The pension plan’s investment policy discourages the use of cash equivalents, except for liquidity purposes, and aims to refrain from dramatically shifting asset class allocations over short time spans City Council reviews the investment policy as part of the financial policies adopted as part of the biennial budget process. As of December 31, 2015, the Firefighters Pension fund had an investment portfolio with fair value of $6,152,279, which was invested in Corporate Bonds, and in Municipal Bonds on behalf of the Firemen’s Pension Fund. In addition to these investments, the Firefighters Pension fund had cash and cash equivalents invested in the City’s internal investment pool totaling $2,275,772. Investments in the City’s internal investment pool are invested in the Washington State Treasurer Local Government Investment Pool (LGIP), which operates within the parameters outlined in GASB 79, and qualifies to report investments at amortized cost. The State Investment Pool’s investment objective is to effectively maximize the yield while maintaining liquidity and a stable share price of $1. The State Pool’s portfolio’s average maturity was 35 days on 12/31/15. The State Investment Pool in an unrated fund. The City’s internal investment pool also invests in the Clark County Local Government Investment Pool, which is unrated, and in US Agencies and Municipal Bonds. All investments are valued at fair value. The average maturity of the City’s Internal Investment Pool is nine months. The fair value of the investment portfolio is obtained using the market approach. Pricing is obtained through the City’s third-party safekeeping custodian, US Bank Corporate Trust Services, who obtains pricing on Federal Agencies and Corporate Bonds through IDC Institutional Bond Quotes, and uses Standard & Poor’s for pricing Municipal Bonds. The Police Pension fund reported no investments at December 31, 2015, but did have $1,993,609 invested in the City’s internal investment pool. Investments are reported at fair value. The City does not hold an investment in any one corporation or organization exceeding 5% of net position available for benefits. Additionally, the City does not have any long-term contract for contributions and any amounts outstanding at the report date. Rate of return. The money-weighted rate of return expresses investment performance, net of investment expense, adjusted for the changing amounts actually invested. For the year ended December 31, 2015, the annual money-weighted rate of return on pension plan investments, net of pension plan investment expense, was as follows:
77

Year ending December 31, 2015
Net Money-Weighted Rate
of ReturnFire Pension Trust Fund 0.42%Police Pension Trust Fund 0.00%
Net Pension Liability The components of the net pension liability of the City at December 31, 2015, were as follows:
Fire PoliceTotal pension liability 7,564,968$ 2,502,613$ Plan fiduciary net position 8,493,695 2,028,845 Net pension liability (asset) (928,727)$ 473,768$
Fiduciary net position as a % of total pension liability 112.28% 81.07%Covered payroll 0 0Net pension liability as a % of covered payroll N/A N/A
Changes in net pension liability for each plan is as follows:
Changes in Net Pension Liability (Asset)
Balances as of December 31, 2014 7,825,761$ 7,949,189$ (123,428)$ Changes for the year:
Service Cost - - - Interest on total pension liability 264,784 - 264,784 Effect of plan changes - - - Effect of economic/demographic gains or losses - - - Effect of assumptions, changes or inputs - - - Benefit payments (525,577) (525,577) - Medical payments from fund - (836,230) 836,230 Employer contributions - 1,755,996 (1,755,996) Contributions from state fire insurance premium tax - 171,592 (171,592) Net investment income - 34,754 (34,754) Administrative expenses - (56,029) 56,029
Balance as of December 31, 2015 7,564,968$ 8,493,695$ (928,727)$
Increase (Decrease)Total
Pension Liability
Plan Fiduciary
Net PositionNet Pension
Liability
FIRE PENSION TRUST FUND
78

Changes in Net Pension Liability (Asset)Balances as of December 31, 2014 2,632,471$ 1,681,660$ 950,811$ Changes for the year:
Service Cost - - - Interest on total pension liability 88,350 - 88,350 Effect of plan changes - - - Effect of economic/demographic gains or losses - - - Effect of assumptions, changes or inputs - - - Benefit payments (218,208) (218,208) - Medical payments from fund - (474,502) 474,502 Employer contributions - 1,080,000 (1,080,000) Police auction income - 7,526 (7,526) Net investment income - 19 (19) Administrative expenses - (47,650) 47,650
Balance as of December 31, 2015 2,502,613$ 2,028,845$ 473,768$
Increase (Decrease)Total
Pension Liability
Plan Fiduciary Net
PositionNet Pension
Liability
POLICE PENSION TRUST FUND
Actuarial assumptions. The total pension liability for each plan was determined by an actuarial valuation as of January 1, 2015, calculated based on the discount rate and actuarial assumptions below, and was then projected forward to the measurement date. There were no significant changes during this period. The following actuarial assumptions were applied to all periods included in the measurement:
Discount rate 3.50%Long-term expected rate of return, net of investment expense 3.50%Municipal bond rate 3.50%Inflation 2.25%Salary increases 3.25%Actuarial cost method Entry Age Normal
Mortality rates were based on the RP-2000 Mortality Table (combined healthy) with generational projection using 100% of Projection Scale BB, with ages set back one year for males and forward one year for females (set forward two years for disabled members). The best-estimate range for the long-term expected rate of return is determined by combining expected inflation to expected long-term real returns and reflecting expected volatility and correlation. The capital market assumptions are per Milliman's investment consulting practice as of December 31, 2015. Best estimates of arithmetic real rates of return for each major asset class included in the pension plan’s target asset allocation as of January 1, 2015 are summarized in the following table:
Asset Class IndexCash Citigroup 90-day T-bills 0.65%Short-term bonds Citigroup 1-3 Year Gov/Cred 1.49%Long-term bonds Barclays Long Gov/Cred 3.05%
Assumed inflation - Mean 2.25%
Long-term expected rate of return 3.50%
Long-term Expected Rate of Real Return
The Police and Fire Pension plans are separately invested, but assume the same expected rate of real return.
Discount rate. GASB 67 generally requires that a blended discount rate be used to measure the Total Pension Liability (the Actuarial Accrued Liability calculated using the Individual Entry Age Normal Cost Method). The long-term expected
79

return on plan investments may be used to discount liabilities to the extent that the Plan’s Fiduciary Net Position (fair market value of assets) is projected to cover benefit payments and administrative expenses. A 20-year high quality (AA/Aa or higher) municipal bond rate must be used for periods where the Fiduciary Net Position is not projected to cover benefit payments and administrative expenses. Determining the discount rate under GASB 67 will often require that the actuary perform complex projections of future benefit payments and asset values. The assumption of 3.50% as of December 31, 2015 is an appropriate long-term expected rate of return on investments such as those in the City's trust. The Bond Buyer General Obligation 20-bond municipal bond index for bonds that mature in 20 years is 3.57% as of December 31, 2015. Rounding this to the nearest 1/4% results in a discount rate of 3.50%. Using 3.50% for both the long-term expected rate of return and the bond index will mean that 3.50% could be used as the single discount rate. This will need to be re-evaluated as of later valuation dates. External cash flows are determined on a monthly basis and are assumed to occur at the beginning of each month. The discount rate as of December 31, 2014 was 3.75%. The discount rate at December 31, 2015 represents a 0.25% decrease in rate. Sensitivity of the net pension liability to changes in the discount rate. The following presents the net pension liability of the County, calculated using the discount rate of 3.50 percent, as well as what the City’s net pension liability (asset) would be if it were calculated using a discount rate that is 1-percentage-point lower or 1-percentage-point higher than the current rate:
1% Decrease Current rate 1% Increase2.50% 3.50% 4.50%
Fire (170,462) (928,727) (1,576,779) Police 690,631 473,768 285,551
Pension Expense Pension expense recognized related to the City’s own pension trust funds for the year ended December 31, 2015, was as follows:
PlanPension expense
Fire Pension Trust Fund 748,847 Police Pension Trust Fund 558,593
Total 1,307,440$ Deferred Outflows of Resources At December 31, 2015, the City reported deferred outflows of resources related to pension trust funds from the following sources:
Source of Deferred Outflows of Resources Fire Pension Trust Fund
Police Pension Trust Fund
Net difference between projected and actual investment earnings on pension plan investments
$201,850 $51,890
80

Amounts reported as deferred outflows and deferred inflows of resources related to pensions will be recognized in pension expense as follows:
Year ended December 31:
Fire Pension Trust Fund
Police Pension Trust Fund
2016 $50,462 $12,972
2017 50,462 12,972
2018 50,462 12,972
2019 50,462 12,972
2020 - -
Thereafter - -
Separate financial statements are not issued for the police and fire pension plan. The statement of net position and the statement of changes in fiduciary net position for the police and fire pension plans are disclosed below.
Police Pension Fire Pension
Police Pension Fire Pension
ASSETS ADDITIONS:
$ 1,993,609 $ 2,275,772 Employer ContributionsInvestments (at fair value) For pension benefits $ 605,499 $ 919,766
Certificate of Deposit - 1,031,720 For healthcare benefits 474,501 836,230 Federal Agency Coupon Securities - 1,974,260 Other Sources 7,526 171,592 Corportate Bond - 3,146,299 Total Contributions 1,087,526 1,927,588
Receivables (net):Accounts 5,810 - Investment IncomeInterest - 42,426 Interest earnings 19 34,754
Prepaid expenses 30,000 30,000 Total Investment Income 19 34,754
TOTAL ASSETS $ 2,029,419 $ 8,500,477 Total Additions 1,087,545 1,962,342
LIABILITIES DEDUCTIONS:
$ 574 $ 6,783 Pension benefits 218,208 525,578 TOTAL LIABILITIES 574 6,783 Healthcare premium subsidies 474,501 836,230
Administrative expense 47,423 56,029 $ 2,028,845 $ 8,493,694 Total Deductions 740,132 1,417,837
Change in net position 347,413 544,505
BEGINNING OF YEAR 1,681,432 7,949,189 END OF YEAR $ 2,028,845 $ 8,493,694
Cash and cash equivalents
Accounts and accrued employee payables
TRUST FOR PENSION
NET POSITION HELD IN TRUST FOR PENSION BENEFITS:
81

G. POSTEMPLOYMENT BENEFITS OTHER THAN PENSION BENEFITS
Plan Description:
In addition to the pension benefits described in Note V.F.3, the City administers two single employer defined benefit plans covering postretirement healthcare and long term care in accordance with state statute to retired police and fire employees who are eligible under the Police Relief and Pension Fund and Firefighter’s Pension Fund through Law Enforcement Officers & Fire Fighters Plan 1(LEOFF-1). The activity of the plan is reported in the City’s Police and Fire Pension Trust Funds. LEOFF retirement benefit provisions are established in state statute and may be amended only by the State Legislature. A separate audited GAAP-basis Postemployment benefit plan report is not available.
Membership:
Membership in this program includes Plan 1 participants of LEOFF who joined the system by September 30, 1977. Currently, 113 retirees (47 Police and 66 Fire) meet those eligibility requirements. This is considered a closed group with no new members. There were no active employees who had not retired as of December 31, 2015.
Funding Policy:
The City reimburses 100 percent of the amount of validated claims for medical and hospitalization costs incurred by eligible retirees. The City pays for the retiree’s monthly insurance premium and also picks up the balance owing after insurance and Medicare payments are made. The pension board performs an annual survey to determine the limit of optical and chiropractic care to be covered. The City also reimburses a monthly fixed amount equal to the Medicare premium for each retiree eligible for Medicare. The methods used to determine the contribution rates are established under state statute in accordance with chapters 41.26 and 41.45 of the RCW. Under RCW law, medical, hospital, and nursing care are covered as long as a disability exists for any active fire fighter or police hired prior to March 1, 1970. Employer contributions are financed on a pay-as-you-go basis. Expenditures for postretirement health in 2015 were $1,310,732. Annual OPEB costs and Net OPEB Obligation: The city’s annual other post employment benefit (OPEB) cost for each plan is calculated based on the annual required contribution of the employer (ARC), an amount actuarially determined in accordance with GASB Statement 45. The ARC represents a level of funding that, if paid on an ongoing basis, is projected to cover normal cost each year and amortize any unfunded actuarial liabilities (or funding excess) over a period not to exceed thirty years. The city’s annual OPEB cost for the current year and the related information for each plan are as follows:
Police Fire
Annual required contribution 1,133,672$ 1,816,017$ Interest on net OPEB obligation 99,238 153,224 Adjustment to annual required contribution (180,620) (278,878)
Annual OPEB cost 1,052,290 1,690,363 Contributions made (474,502) (836,230)
Increase in net OPEB obligation 577,788 854,133 Net OPEB obligation - beginning of year 2,835,368 4,377,822 Net OPEB obligation - end of year 3,413,156$ 5,231,955$
The city’s annual OPEB cost, the percentage of annual OPEB cost contributed to the plan, and the net OPEB obligation for 2015 and the two preceding years for each were as follows:
82

Year EndedAnnual OPEB
Cost
Percentage of OPEB
Cost Contributed
Net OPEB obligation
Police December 31, 2015 1,052,290$ 53% 3,413,156$ December 31, 2014 1,028,116 57% 2,835,368 December 31, 2013 1,043,865 53% 2,388,191
Fire December 31, 2014 1,690,363$ 49% 5,231,955$ December 31, 2014 1,683,680 54% 4,377,822 December 31, 2013 1,706,238 60% 3,602,740
Funding Status and Funding Progress:
The actuarial updates on the funding status are as follows:
Police:
Valuation Date
Actuarial Value of Assets
Actuarial Accrued Liabilities
(AAL)
Unfunded Actuarial Liabilities (UAAL) Funded Ratio
Covered Payroll
UAAL as a percentage of
Covered PayrollJanuary 1, 2015 -$ 17,195$ 17,195$ 0% N/A N/AJanuary 1, 2013 - 17,048 17,048 0% N/A N/AJanuary 1, 2011 - 17,272 17,272 0% N/A N/A
Fire:
Valuation Date
Actuarial Value of Assets
Actuarial Accrued Liabilities
(AAL)
Unfunded Actuarial Liabilities (UAAL) Funded Ratio
Covered Payroll
UAAL as a percentage of
Covered PayrollJanuary 1, 2015 -$ 27,544$ 27,544$ 0% N/A N/AJanuary 1, 2013 - 27,794 27,794 0% N/A N/AJanuary 1, 2011 - 26,545 26,545 0% N/A N/A
Actuarial Methods and Assumptions:
The actuarial assumptions used in the January 1, 2015, OPEB actuarial valuations include techniques that are designed to estimate the future experience of the members, reduce short term volatility in actuarial accrued liabilities and the actuarial value of assets, consistent with the long term perspective of the calculations. In the January 1, 2015 actuarial valuation, the entry age normal cost method was used. The assumptions included a 3.50% investment rate of return, a medical inflation rate that ranges between 5.4-7.5% over the next 15 years, and a long-term care inflation rate of 3.25% for both plans. The plans unfunded actuarial accrued liability is being amortized over 30 years as a level percentage of projected payrolls on a closed basis. The remaining amortization period at December 31, 2015 is twenty-one years. Actuarial valuations of an ongoing plan involve estimates of the value of the reported amounts and assumptions about the probability of occurrence of events far into the future. Examples include assumptions about future employment, service retirement, disability, mortality and healthcare cost trends. Amounts determined regarding the funded status of the plan and the annual required contributions of the employer are subject to continual revision, as actual results are compared with past expectations and new estimates are made about the future. The schedule of funding progress, presented as required supplementary information following the notes to the financial statements presents the results of OPEB valuations as of December 31, 2015, and looking forward, the schedule of funding progress will eventually provide multiyear trend information about whether the actuarial values of plan assets are increasing or decreasing over time relative to the actuarial accrued liabilities for benefits. Calculations are based on the OPEB benefits provided under the terms of the substantive plan in effect at the time of each valuation and on the pattern of sharing of costs between the employer and the plan members to that point.
83

The schedule of funding progress, presented as RSI following the notes to the financial statements, presents multiyear trend information about whether the actuarial value of plan assets in increasing or decreasing over time relative to the actuarial accrued liability for benefits.
H. POLLUTION REMEDIATION OBLIGATION
Dry cleaning solvent had been dumped down a catch basin on a regular basis which subsequently caused perchloroethylene (PCE) to leak into the aquifer at Water Station No.4. The City is using aeration towers to treat this ground water. The towers remove trace volatile organic compounds, and carbon dioxide which occurs naturally. The environmental liability is expected to cost $420,000 over the next 20 years, with a current portion of $21,000. This estimate is based on prior year actual costs, and is subject to changes in price, technology or changes in applicable laws and regulations.
I. SPECIAL ITEMS
COMPONENT UNIT: Forgiveness of Debt As part of the refinancing of the DRA debt in June 2013, a new agreement was signed with the Manager of the Vancouver Conference Center (Hilton Hotels) that provides for forgiveness of the above fee amounts over a 10-year period, on a straight-line basis. The forgiveness of these fees is recorded as a Special Item, Forgiveness of Debt on the Statement of Activities. During December 31, 2015, $107,813 had been forgiven. The outstanding obligation recorded on the Statement of Net Position as of December 31, 2015, is $808,597. Claims settlement On January 2, 2009, Lehman Brothers Special Finance Inc. failed to tender for sale to the Downtown Redevelopment Authority the Qualified Securities pursuant to the terms of the Forward Purchase Agreement (FPA), and did not correct the issue in the Cure Period. Based on this, the Authority reinvested the investment balance held with the Trustee for 6-months in qualified investments, which matured on July 1, 2009, and was reinvested thereafter with maturities to coincide with the semi-annual interest and principal payments. The rate of return on the reinvestment was substantially below the 5.05%. The Authority pursued a claim with the Bankruptcy Court against Lehman Brothers Inc., and Lehman Brothers Special Finance Inc. for the difference between the fixed rate of 5.05% and the rate that a new Forward Purchase Agreement will generate. During 2015, the Authority received a distribution in the amount of $41,443 as a result of the bankruptcy claim. If the Lehman bankruptcy estate receives additional funds, more distributions are possible.
J. PRIOR PERIOD ADJUSTMENTS
The City has recorded prior period adjustments (PPA), which includes: Government-wide : Governmental Activities (not affecting the Fund Statements)
588,808$ Capital asset corrections (3,857,930)
(3,269,122)$ Government-wide : Governmental Funds
General Fund
Non-Major Governmental
FundsInternal Service
Funds Total Record transactions for compliance with GASB 54 (496,334)$ 379,682$ (13,018)$ (129,670)$ Capital asset corrections - - 5,945 5,945$ Recording of revenue related to utility taxes due but not accrued in prior year 219,901 - - 219,901
(276,433)$ 379,682$ (7,073)$ 96,176$
Combined Government Wide Prior Period Adjustments (3,172,946)$
Government-wide : Business Type Activities
Water Sewer Fund
Non-Major Enterprise
Funds TotalRecording of expenses related to utility taxes due but not accrued in prior year $ (219,901) $ - (219,901) Capital asset corrections (1,204,988) (5,702) (1,210,690)
(1,424,889)$ (5,702)$ (1,430,591)$
Component Unit - Downtown Redevelopment AuthorityCapital asset corrections (1,949,854)$
Record long-term assets and liabilities of funds now presented in compliance with GASB 54
84

K. SUBSEQUENT EVENTS
The City has evaluated events subsequent to the fiscal year-end December 31, 2015, and has identified the following events: The City sold LTGO Refunding bonds in May 26, 2016, to (i) advance refund and defease a portion of the City’s outstanding Limited Tax General Obligation Bonds, 2009 to obtain the benefit of debt service savings and (ii) pay costs of issuance for the Bonds. Proceeds of the 2009 Bonds were used to fund certain transportation improvement projects. The transactions will close on June 22, 2016.
85

Movies in the Marshall Park
86

December 31, 2015
Schedule of Funding Progress(in thousands)Six year trend *
Retirement System
Actuarial Valuation
Date
Actuarial Value of Assets
Actuarial Accrued Liabilities
Unfunded Actuarial Accrued Liabilities (UAAL)
Funded Ratio
Covered Payroll
UAAL as a Percentage of Covered
PayrollPolice Relief and Pension Fund 1/1/2015 $ - $ 17,195 $ 17,195 0% N/A N/A
1/1/2013 - 17,048 17,048 0% N/A N/A1/1/2011 - 17,272 17,272 0% N/A N/A1/1/2009 - 14,518 14,518 0% N/A N/A1/1/2007 - 9,734 9,734 0% N/A N/A
Fireman's Pension Fund 1/1/2015 $ - $ 27,544 $ 27,544 0% N/A N/A1/1/2013 - 27,794 27,794 0% N/A N/A1/1/2011 - 26,545 26,545 0% N/A N/A1/1/2009 - 21,587 21,587 0% N/A N/A1/1/2007 - 16,244 16,244 0% N/A N/A
* This is the fifth year of OPEB implementation. The actuarial updates on this information is done on a biennial basis.
CITY OF VANCOUVERRequired Supplementary InformationPolice and Fire Pension Funds
87

CITY OF VANCOUVERRequired Supplementary Information
State Sponsored PERS Plans
December 31, 2015
Schedule of Proportionate Share of the Net Pension LiabilityLast Two Fiscal Years
PERS Plan 1
Year Ended June 30,
Employer's proportion of the net pension liability (asset)
Employer's proportionate share of the net pension liability
Employer's covered employee payroll
Employer's proportionate share of the net pension liability as a percentage of covered employee payroll
Plan fiduciary net position as a percentage of the total pension liability
2015 0.325010% $ 17,001,046 $ 246,333 6901.65% 59.10%
2014 0.321349% 16,188,107 280,429 5772.62% 61.19%
PERS Plan 2/3
Year Ended June 30,
Employer's proportion of the net pension liability (asset)
Employer's proportionate share of the net pension liability
Employer's covered employee payroll
Employer's proportionate share of the net pension liability as a percentage of covered employee payroll
Plan fiduciary net position as a percentage of the total pension liability
2015 0.413288% $ 14,767,016 $ 36,685,226 40.25% 89.20%2014 0.406638% 8,219,622 35,219,137 23.34% 93.29%
88

CITY OF VANCOUVERRequired Supplementary Information
State Sponsored LEOFF Plan 1
December 31, 2015
Schedule of Proportionate Share of the Net Pension Liability
Year Ended June 30,
Employer's proportion of the net pension liability/asset
Employer's proportionate share of the net pension liability (asset)
Employer's covered employee payroll
Employer's proportionate share of the net pension liability as a percentage of covered employee payroll
Plan fiduciary net position as a percentage of the total pension liability
2015 0.246609% $ (2,972,183) N/A N/A 127.36%2014 0.248167% (3,009,747) N/A N/A 126.91%
Last Two Fiscal Years
89

CITY OF VANCOUVERRequired Supplementary Information
State Sponsored LEOFF Plan 2
December 31, 2015
Year Ended June 30,
Employer's proportion of the net pension liability/asset
Employer's proportionate share of the net pension liability (asset)
State's proportionate share of the net pension liability (asset) associated with the employer TOTAL
Employer's covered employee payroll
Employer's proportionate share of the net pension liability (asset) as a percentage of covered employee payroll
Plan fiduciary net position as a percentage of the total pension liability
2015 1.297652% $ (13,337,267) $ (8,818,610) $ (22,155,877) $ 37,663,087 -35.41% 111.67%
2014 1.281662% (17,008,206) (11,112,842) (28,121,048) 35,655,019 -47.70% 116.75%
Last Two Fiscal Years
Schedule of Proportionate Share of the Net Pension Liability
90

CITY OF VANCOUVERRequired Supplementary Information
State Sponsored PERS Plans
December 31, 2015
Schedule of Employer Contributions
Year Ended December 31,
Statutorily or contractually required contributions
Contributions in relation to the statutorily or contractually required contributions
Contribution deficiency (excess)
Covered employer payroll
Contributions as a percentage of covered employee payroll
2015 $ 1,745,867 $ (1,745,867) $ - $ 270,075 646.44%
2014 1,548,817 (1,548,817) - 255,381 606.47%
Year Ended December 31,
Statutorily or contractually required contributions
Contributions in relation to the statutorily or contractually required contributions
Contribution deficiency (excess)
Covered employer payroll
Contributions as a percentage of covered employee payroll
2015 $ 2,202,444 $ (2,202,444) $ - $ 38,756,185 5.68%2014 1,888,244 (1,888,244) - 37,065,498 5.09%
Last Two Fiscal Years
PERS Plan 1
PERS Plan 2/3
91

CITY OF VANCOUVERRequired Supplementary Information
State Sponsored LEOFF Plans
December 31, 2015
Schedule of Employer Contributions
Year Ended December 31,
Statutorily or contractually required contributions
Contributions in relation to the statutorily or contractually required contributions
Contribution deficiency (excess)
Covered employer payroll
Contributions as a percentage of covered employee payroll
2015 N/A N/A N/A N/A N/A
2014 N/A N/A N/A N/A N/A
Year Ended December 31,
Statutorily or contractually required contributions
Contributions in relation to the statutorily or contractually required contributions
Contribution deficiency (excess)
Covered employer payroll
Contributions as a percentage of covered employee payroll
2015 $ 2,042,874 $ (2,042,874) $ - $ 39,060,712 5.23%
2014 2,007,877 (2,007,877) - 38,390,731 5.23%
Last Two Fiscal Years
LEOFF 1
LEOFF 2
92

CITY OF VANCOUVERNotes to Required Supplemental Information - State Sponsored Plans
December 31, 2015
Note 1: Information Provided
Note 2: Significant Factors
Note 3: Change in contribution rate
Note 4: Employer Contributions
There were no changes of benefit terms, significant changes in the employees covered under the benefit terms or in the use of different assumptions.
The employer contribution rates for both PERS 1 and PERS 2/3 plans increased from 9.21% to 11.18% for pay periods beginning July 2015.
For LEOFF 1, there is a net pension asset for the City; however, there are no active employees participating in the plan, and no required contributions because the plan is fully funded. Therefore, covered payroll and contributions are displayed as N/A.
The City implemented GASB 68 for the year ended December 31, 2015, therefore there is no data available for years prior to 2014.
93

CITY OF VANCOUVER
Required Supplementary Information - Single Employer
Police and Fire Pension Funds
December 31, 2015
Fire Pension Trust Fund
In thousands
2015 2014
TOTAL PENSION LIABILITYService cost -$ -$ Interest 265 272 Changes in benefit terms - - Differences between expected and actual experience - - Changes of assumptions - - Benefit payments, including refunds of contributions (526) (477)
Net change in total pension liability (261) (205)
Total pension liability - beginning 7,826 8,031
Total pension liability - ending (a) 7,565$ 7,826$
PLAN FIDUCIARY NET POSITIONContributions - employer 1,756 1,756Contributions - state fire insurance premium tax 172 185Net investment income 35 35Prior period adjustment - 17Benefit payments, including refunds of contributions (526) (477)Medical payments from fund (836) (924)Administrative expense (56) (29)
Net change in plan fidiciary net position 545 563
Plan fiduciary net position - beginning 7,949 7,386
Plan fiduciary net position - ending (b) 8,494 7,949
Net pension liability ending (a) - (b) (929) (123)
112.28% 101.57%
Covered-employee payroll - -
N/A N/ANet pension liability as a % of covered employee payroll
Schedule of Changes in Net Pension Liability and Related Ratios
Last Two Fiscal Years
Plan fiduciary net position as a % of total pension liability (b)/(a)
94

CITY OF VANCOUVER
Required Supplementary Information - Single Employer
Police and Fire Pension Funds
December 31, 2015
Police Pension Trust Fund
(In thousands)
Last Two Fiscal Years
2015 2014
Total pension liabilityService cost -$ -$ Interest 88 93Changes in benefit terms - - Differences between expected and actual experience - - Changes of assumptions - - Benefit payments, including refunds of contributions (217) (301)
Net change in total pension liability (129) (208)
Total pension liability - beginning 2,632 2,841
Total pension liability - ending (a) 2,503$ 2,633$
Plan fiduciary net positionContributions - employer 1,080$ 1,080$ Contributions - state fire insurance premium tax 8 2Net investment income - - Prior period adjustment - 9Benefit payments, including refunds of contributions (218) (301)Medical payments from fund (475) (587)Administrative expense (48) (36)
Net change in plan fidiciary net position 347 167
Plan fiduciary net position - beginning 1,682 1,515
Plan fiduciary net position - ending (b) 2,029 1,682
Net pension liability ending (a) - (b) 474$ 951$
81.06% 63.88%
Covered-employee payroll - -
Net pension liability as a % of covered employee payroll N/A N/A
Schedule of Changes in Net Pension Liability and Related Ratios
Plan fiduciary net position as a % of total pension liability (b)/(a)
95

CITY OF VANCOUVER
Required Supplementary Information - Single Employer
Police and Fire Pension Funds
December 31, 2015
Schedule of Employer Contributions
Last Two Fiscal Years
Retirement System Year
Actuarially/ statutorily/
contractually determined contribution
Actual contribution in relation to the
above
Contribution deficiency (excess)
Covered employee
payroll
Contributions as a % of covered-
employee payroll
Fire Pension Trust Fund 2015 $ - $ - $ - $ - N/A
2014 - - - - N/A
Police Pension Trust Fund 2015 - - - - N/A
2014 - - - - N/A
96

CITY OF VANCOUVER
Required Supplementary Information - Single Employer
Police and Fire Pension Funds
December 31, 2015
Schedule of Investment Returns
Last Two Fiscal Years
Retirement System YearAnuual money-weighted rate of return,
net of investment expense
Fire Pension Trust Fund 2015 0.42%
2014 0.46%
Police Pension Trust Fund 2015 0.00%
2014 0.02%
97

CITY OF VANCOUVER
Notes to Required Supplementary Information
Police and Fire Pension Funds
December 31, 2015
Note 1: Information Provided
Note 2: Significant Factors
Note 3: Covered Payroll
Note 4: Significant Assumptions
Valuation date: January 1,2015
Methods and assumptions used to determine contribution rates:
Actuarial cost method Individual Entry Age
Amortization method 30 year closed
Remaining amortization period 16 years
Asset valuation method Fair Value
Inflation 2.25%
Salary increases 3.25%
Investment rate of return
3.5%, net of pension plan investment
expense, including inflation
Retirement age 53
Mortality
RP-2000 Mortality Table (combined
healthy)
There were no changes of benefit terms, significant changes in the employees covered under the benefit terms or in the use of different assumptions. Under the Police and Fire Pension funds requirement of State law, most adjustments are based on the change in salary for the rank of the members held at retirement or based on the Consumer Price Index. Adjustments are determined in accordance with RCW 41.18.150, RCW 41.20 and RCW 41.26.
There are no active employees participating in the City-sponsored plans, therefore, there is no covered payroll.
The City implemented GASB 68 for the year ended December 31, 2015, therefore there is no data available for years prior to 2014.
98

Combining Nonmajor Governmental Funds
99

CITY OF VANCOUVERCOMBINING BALANCE SHEETNONMAJOR GOVERNMENTAL FUNDSDecember 31, 2015
Total NonmajorSpecial Revenue Debt Service Capital Project Governmental
Funds Funds Funds FundsASSETS
Cash and cash equivalents $ 9,485,376 $ 79,329 $ 52,915,875 $ 62,480,580 Receivables (net)
Taxes/assessments 819,231 - - 819,231 Accounts 210,436 167,481 438,543 816,460 Interest 9,153 76 51,271 60,500 Notes 5,147,120 - - 5,147,120
Due from other funds 11,307 - 487,996 499,303 Due from other governmental units 164,523 - 962,256 1,126,779 Prepaid items 7,593 - - 7,593
TOTAL ASSETS $ 15,854,739 $ 246,886 $ 54,855,941 $ 70,957,566
LIABILITIESAccounts payable $ 122,659 $ - $ 1,208,795 $ 1,331,454 Due to other funds 5,257 - 168,860 174,117 Due to other governmental units 229,875 - - 229,875 Accrued liabilities 52,217 - 16,150 68,367 Revenues collected in advance 3,123 - - 3,123 Custodial accounts 909 - 36 945 Unearned revenues 29,158 - - 29,158
Total liabilities 443,198 - 1,393,841 1,837,039
DEFERRED INFLOWS OF RESOURCESUnavailable revenue-special assessments - 143,648 - 143,648 Unavailable revenue-grant funding - - 168,142 168,142 Unavailable revenue-capital improvements - - 321,403 321,403
Total deferred inflows of resources - 143,648 489,545 633,193
FUND BALANCESNonspendable 7,593 - - 7,593 Restricted 13,658,300 103,238 26,505,250 40,266,788 Committed 1,645,648 - 6,140,388 7,786,036 Assigned 100,000 - 20,326,917 20,426,917
Total fund balance 15,411,541 103,238 52,972,555 68,487,334 TOTAL LIABILITIES, DEFERRED INFLOWS OF
RESOURCES AND FUND BALANCES $ 15,854,739 $ 246,886 $ 54,855,941 $ 70,957,566
100

CITY OF VANCOUVERCOMBINING STATEMENT OF REVENUES, EXPENDITURES AND CHANGES IN FUND BALANCESNONMAJOR GOVERNMENTAL FUNDSFor the Year Ended December 31, 2015
Total NonmajorSpecial Revenue Debt Service Capital Project Governmental
Funds Funds Funds FundsREVENUES
Other taxes $ 5,237,280 $ - $ 130,000 $ 5,367,280 License and permits 2,525,981 - - 2,525,981 Intergovernmental 4,510,521 - 4,667,323 9,177,844 Charges for services 268,232 - 2,810,246 3,078,478 Fines and penalties 100,436 485 - 100,921 Investment earnings 77,431 10,556 164,778 252,765 Rents and royalties 358,928 - 294,049 652,977 Contributions/donations 134,005 - 811,429 945,434 Miscellaneous 218,821 110,727 - 329,548
Total revenues 13,431,635 121,768 8,877,825 22,431,228
EXPENDITURESCurrent
General government 1,125,214 - 625,008 1,750,222 Security/persons & property 86,139 - 432,481 518,620 Physical environment 25,205 - - 25,205 Transportation 153,866 - 2,763,150 2,917,016 Economic environment 3,119,688 - 541,403 3,661,091 Culture and recreation 6,880 - 2,124,912 2,131,792
Capital outlay - - 9,125,023 9,125,023 Debt service
Principal retirement - 10,225,697 - 10,225,697 Interest/fiscal charges - 3,849,471 111,340 3,960,811
Total expenditures 4,516,992 14,075,168 15,723,317 34,315,477
Excess (deficiency) of revenuesover (under) expenditures 8,914,643 (13,953,400) (6,845,492) (11,884,249)
OTHER FINANCING SOURCES (USES)Capital related debt issued - - 4,771,500 4,771,500 Sale of capital assets - - 332,978 332,978 Refunding bond issued - 19,625,000 - 19,625,000 Payment to refunded bond escrow account - (22,373,995) - (22,373,995) Premium on debt issued - 2,902,785 317,579 3,220,364 Fiscal charges - (145,600) - (145,600) Transfers in 466,667 13,913,896 23,167,781 37,548,344 Transfers out (8,121,857) - (7,395,682) (15,517,539)
Total other financing sources and uses (7,655,190) 13,922,086 21,194,156 27,461,052
Net change in fund balances 1,259,453 (31,314) 14,348,664 15,576,803
FUND BALANCES - BEGINNING 13,771,542 134,552 38,624,755 52,530,849 Prior period adjustments 380,546 - (864) 379,682
FUND BALANCES - ENDING $ 15,411,541 $ 103,238 $ 52,972,555 $ 68,487,334
101

Art Car
102

Special Revenue Funds
Special Revenue Funds are established to account for the proceeds of specific revenue sources (other than special assessments) to finance specific activities as required by law or administrative regulation. Their revenues are earmarked to finance particular activities or functions. Special Revenue Funds are created by local ordinance and are often mandated by state statutes. The funds are listed and briefly described below. Special revenue classified funds are accounted for and budgeted on the modified accrual basis of accounting and all related statements have been reported on this basis. Investigative Fund In 1983, the Investigative Fund was established pursuant to state statute RCW 69.50.505, to receive monies or property seized by city police when used in criminal activities relating to controlled substances. The funds are to be used by the police department for investigative purposes related to state statute RCW 69.50. Drug Enforcement Fund In 1983, the drug enforcement fund was established to receive court-ordered “contribution” pursuant to state laws under RCW 9.95.210 made by persons convicted of criminal drug offenses. Monies paid into the funds are to be used by the police department for drug enforcement purposes. Small Cities Fund Revenues received from HUD federal grants were used for neighborhood improvements. Improvements include home rehabilitation, street paving, curbs and sidewalks, water and sewer lines, and park development. Tourism Fund Four percent of revenue derived from the Hotel-Motel tax is returned by the state to the city for the purpose of promoting tourism or building/leasing stadium/convention facilities. VNHR Properties Fund Effective January 1, 2006 this fund was created to account for the revenues and expenses associated with the properties on the Vancouver National Historic Reserve. Criminal Justice Fund The Second Executive session of 1990 (RCW 82.44) provided funding for law enforcement purposes from the state general fund until April of 1991 and from automobile excise taxes until January of 1994. Monies are distributed based on population and must be used for law enforcement only. Transportation Special Revenue Fund This fund was created in 2006 to accommodate a new business license fee surcharge approved by Council effective January 1, 2007 and dedicated to funding transportation capital projects. Senior Messenger Fund This fund was originally established to account for Federal grant monies used to publish a newsletter directed toward senior citizens. As of 1985, the federal grants stopped, and the fund became self-supporting through the sale of advertising space and donations. Parks & Recreation Fund A separate City special revenue fund is created as of January 1, 2006 to account for the revenues and expenses associated with Parks and Recreation that are required to be used for restricted purposes. Parks Construction Fund This fund was established in 1996 to account for the revenues derived from a ¼ of 1% real estate tax imposed by the city on all transfers of property within the City of Vancouver. Funds are to be utilized for the construction of city parks. Parkhill Cemetery Improvement Fund This fund receives 25% from the sales of city-owned grave sites to improve and maintain the city cemetery. REET 2002 This fund is used to account for the Real Estate Excise Tax received for planning, acquisition, construction, and repair of streets and street related improvements. Downtown Initiatives Fund This fund was established in May of 1997 to account for money used to facilitate the redevelopment of under utilized property in the City’s downtown core. City/County Cable TV Fund The City/County Cable TV is a separate entity jointly operated by the City and Clark County. The purpose of the agency is to provide staff support in matters relating to the administration of the joint city/county urban area cable television franchises.
103

CITY OF VANCOUVERCOMBINING BALANCE SHEETNONMAJOR SPECIAL REVENUE FUNDSDecember 31, 2015
Drug Small
Investigative Enforcement Cities TourismASSETS
Cash and cash equivalents $ 363,112 $ 875,638 $ 24,633 $ 2,965,609 Taxes/assessments - 6,333 - 273,564 Accounts - - 80,237 - Interest 352 847 26 2,858 Notes - - 5,147,120 -
Due from other funds - - - - Due from other governmental units - - 164,523 - Prepaid items - - - -
TOTAL ASSETS $ 363,464 $ 882,818 $ 5,416,539 $ 3,242,031
LIABILITIESAccounts payable $ 1,312 $ 6,747 $ 84,516 $ - Due to other funds - - - - Due to other governmental units - - - 229,875 Accrued liabilities - 804 14,639 - Revenues collected in advance - - - - Custodial accounts - 3 424 - Unearned revenues - - 29,158 -
Total liabilities 1,312 7,554 128,737 229,875
FUND BALANCESNonspendable - - - - Restricted 362,152 875,264 5,187,802 3,012,156 Committed - - - - Assigned - - 100,000 -
Total fund balance 362,152 875,264 5,287,802 3,012,156 TOTAL LIABILITIES AND
FUND BALANCES $ 363,464 $ 882,818 $ 5,416,539 $ 3,242,031
104

CITY OF VANCOUVERCOMBINING BALANCE SHEETNONMAJOR SPECIAL REVENUE FUNDSDecember 31, 2015
ASSETSCash and cash equivalents
Taxes/assessments Accounts Interest Notes
Due from other fundsDue from other governmental units Prepaid items
TOTAL ASSETS
LIABILITIESAccounts payableDue to other fundsDue to other governmental units Accrued liabilitiesRevenues collected in advance Custodial accountsUnearned revenues
Total liabilities
FUND BALANCESNonspendableRestrictedCommittedAssigned
Total fund balanceTOTAL LIABILITIES AND
FUND BALANCES
(Page 1 of 2)
VNHR Criminal SeniorProperties Justice Transportation Messenger
$ 334,785 $ 771,970 $ 1,960,921 $ 373,709 - 60,091 - -
55,995 - 49,126 12,776 323 748 1,882 361 - - - - 300 - - - - - - - - - - -
$ 391,403 $ 832,809 $ 2,011,929 $ 386,846
$ - $ - $ - $ 165 - - 4,347 - - - - - - - - 304 - - - - - - - 226 - - - - - - 4,347 695
- - - - - 832,809 2,007,582 -
391,403 - - 386,151 - - - -
391,403 832,809 2,007,582 386,151
$ 391,403 $ 832,809 $ 2,011,929 $ 386,846
105

CITY OF VANCOUVERCOMBINING BALANCE SHEETNONMAJOR SPECIAL REVENUE FUNDSDecember 31, 2015
ASSETSCash and cash equivalents
Taxes/assessments Accounts Interest Notes
Due from other fundsDue from other governmental units Prepaid items
TOTAL ASSETS
LIABILITIESAccounts payableDue to other fundsDue to other governmental units Accrued liabilitiesRevenues collected in advance Custodial accountsUnearned revenues
Total liabilities
FUND BALANCESNonspendableRestrictedCommittedAssigned
Total fund balanceTOTAL LIABILITIES AND
FUND BALANCES
Parks & Parks Parkhill REETRecreation Construction Cemetery 2002
$ 47,482 $ 32,552 $ 409,926 $ 809,241 - - - 479,243 149 - 763 - 45 17 397 799
- - - - - - - 11,007 - - - - - - - -
$ 47,676 $ 32,569 $ 411,086 $ 1,300,290
$ - $ - $ - $ - - - - - - - - - - - - - - - - - - - 28 - - - - - - - 28 -
- - - - 47,676 32,569 - 1,300,290
- - 411,058 - - - - -
47,676 32,569 411,058 1,300,290
$ 47,676 $ 32,569 $ 411,086 $ 1,300,290
106

CITY OF VANCOUVERCOMBINING BALANCE SHEETNONMAJOR SPECIAL REVENUE FUNDSDecember 31, 2015
ASSETSCash and cash equivalents
Taxes/assessments Accounts Interest Notes
Due from other fundsDue from other governmental units Prepaid items
TOTAL ASSETS
LIABILITIESAccounts payableDue to other fundsDue to other governmental units Accrued liabilitiesRevenues collected in advance Custodial accountsUnearned revenues
Total liabilities
FUND BALANCESNonspendableRestrictedCommittedAssigned
Total fund balanceTOTAL LIABILITIES AND
FUND BALANCES
(Page 2 of 2)
Total Nonmajor Downtown City/County Special Initiatives Cable TV Revenue Funds
$ 64,169 $ 451,629 $ 9,485,376 - - 819,231
1,504 9,886 210,436 63 435 9,153
- - 5,147,120 - - 11,307 - - 164,523
7,593 - 7,593 $ 73,329 $ 461,950 $ 15,854,739
$ 5,610 $ 24,309 $ 122,659 - 910 5,257 - - 229,875
12,436 24,034 52,217 3,123 - 3,123
- 228 909 - - 29,158
21,169 49,481 443,198
7,593 - 7,593 - - 13,658,300
44,567 412,469 1,645,648 - - 100,000
52,160 412,469 15,411,541
$ 73,329 $ 461,950 $ 15,854,739
107
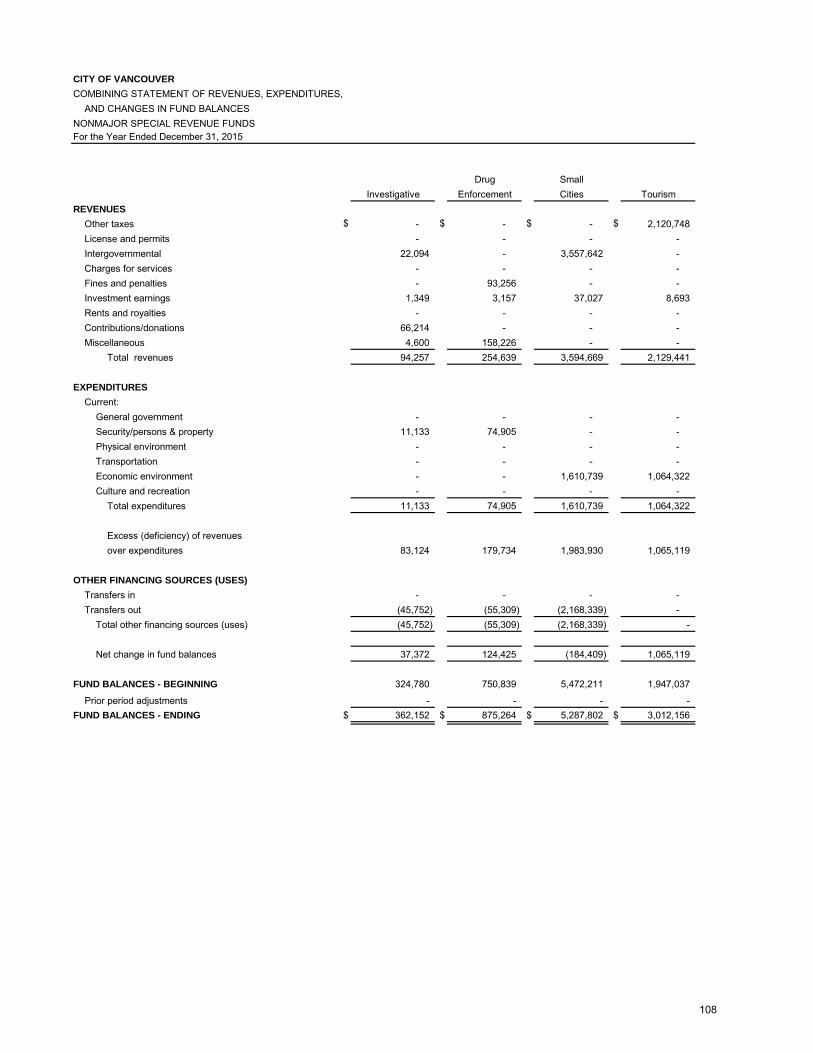
CITY OF VANCOUVERCOMBINING STATEMENT OF REVENUES, EXPENDITURES,
AND CHANGES IN FUND BALANCESNONMAJOR SPECIAL REVENUE FUNDSFor the Year Ended December 31, 2015
Drug SmallInvestigative Enforcement Cities Tourism
REVENUESOther taxes $ - $ - $ - $ 2,120,748 License and permits - - - - Intergovernmental 22,094 - 3,557,642 - Charges for services - - - - Fines and penalties - 93,256 - - Investment earnings 1,349 3,157 37,027 8,693 Rents and royalties - - - - Contributions/donations 66,214 - - - Miscellaneous 4,600 158,226 - -
Total revenues 94,257 254,639 3,594,669 2,129,441
EXPENDITURESCurrent:
General government - - - - Security/persons & property 11,133 74,905 - - Physical environment - - - - Transportation - - - - Economic environment - - 1,610,739 1,064,322 Culture and recreation - - - -
Total expenditures 11,133 74,905 1,610,739 1,064,322
Excess (deficiency) of revenuesover expenditures 83,124 179,734 1,983,930 1,065,119
OTHER FINANCING SOURCES (USES)Transfers in - - - - Transfers out (45,752) (55,309) (2,168,339) -
Total other financing sources (uses) (45,752) (55,309) (2,168,339) -
Net change in fund balances 37,372 124,425 (184,409) 1,065,119
FUND BALANCES - BEGINNING 324,780 750,839 5,472,211 1,947,037
Prior period adjustments - - - - FUND BALANCES - ENDING $ 362,152 $ 875,264 $ 5,287,802 $ 3,012,156
108

CITY OF VANCOUVERCOMBINING STATEMENT OF REVENUES, EXPENDITURES
AND CHANGES IN FUND BALANCESNONMAJOR SPECIAL REVENUE FUNDSFor the Year Ended December 31, 2015
REVENUESOther taxesLicense and permitsIntergovernmentalCharges for servicesFines and penaltiesInvestment earningsRents and royaltiesContributions/donationsMiscellaneous
Total revenues
EXPENDITURESCurrent:
General governmentSecurity/persons & propertyPhysical environmentTransportationEconomic environmentCulture and recreation
Total expenditures
Excess (deficiency) of revenuesover expenditures
OTHER FINANCING SOURCES (USES)Transfers inTransfers out
Total other financing sources (uses)
Net change in fund balances
FUND BALANCES - BEGINNINGPrior period adjustments
FUND BALANCES - ENDING
(Page 1 of 2)
VNHR Criminal SeniorProperties Justice Transportation Messenger
$ - $ - $ - $ - - - 2,525,981 - - 235,642 - - - - - 251,478 - - 7,180 -
1,417 3,045 8,875 1,336 183,046 - - -
- - - 37,393 55,995 - - -
240,458 238,687 2,542,036 290,207
- - - - - 101 - - - - - - - - 153,866 -
102,589 - - 244,422 - - - -
102,589 101 153,866 244,422
137,869 238,586 2,388,170 45,785
- - - - (55,995) (127,146) (1,940,650) - (55,995) (127,146) (1,940,650) -
81,874 111,440 447,520 45,785
309,529 721,369 1,560,062 340,366
- - - - $ 391,403 $ 832,809 $ 2,007,582 $ 386,151
109
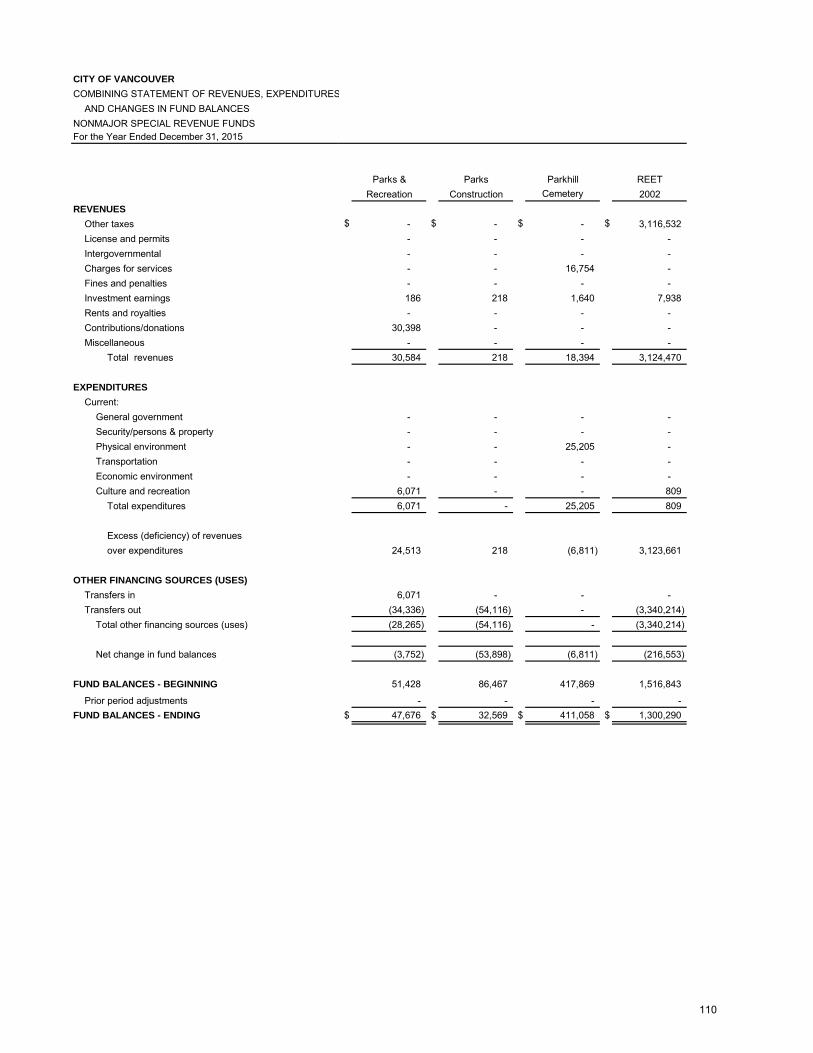
CITY OF VANCOUVERCOMBINING STATEMENT OF REVENUES, EXPENDITURES
AND CHANGES IN FUND BALANCESNONMAJOR SPECIAL REVENUE FUNDSFor the Year Ended December 31, 2015
REVENUESOther taxesLicense and permitsIntergovernmentalCharges for servicesFines and penaltiesInvestment earningsRents and royaltiesContributions/donationsMiscellaneous
Total revenues
EXPENDITURESCurrent:
General governmentSecurity/persons & propertyPhysical environmentTransportationEconomic environmentCulture and recreation
Total expenditures
Excess (deficiency) of revenuesover expenditures
OTHER FINANCING SOURCES (USES)Transfers inTransfers out
Total other financing sources (uses)
Net change in fund balances
FUND BALANCES - BEGINNINGPrior period adjustments
FUND BALANCES - ENDING
Parks & Parks Parkhill REETRecreation Construction Cemetery 2002
$ - $ - $ - $ 3,116,532 - - - - - - - - - - 16,754 - - - - - 186 218 1,640 7,938 - - - -
30,398 - - - - - - -
30,584 218 18,394 3,124,470
- - - - - - - - - - 25,205 - - - - - - - - -
6,071 - - 809 6,071 - 25,205 809
24,513 218 (6,811) 3,123,661
6,071 - - - (34,336) (54,116) - (3,340,214) (28,265) (54,116) - (3,340,214)
(3,752) (53,898) (6,811) (216,553)
51,428 86,467 417,869 1,516,843
- - - - $ 47,676 $ 32,569 $ 411,058 $ 1,300,290
110

CITY OF VANCOUVERCOMBINING STATEMENT OF REVENUES, EXPENDITURES
AND CHANGES IN FUND BALANCESNONMAJOR SPECIAL REVENUE FUNDSFor the Year Ended December 31, 2015
REVENUESOther taxesLicense and permitsIntergovernmentalCharges for servicesFines and penaltiesInvestment earningsRents and royaltiesContributions/donationsMiscellaneous
Total revenues
EXPENDITURESCurrent:
General governmentSecurity/persons & propertyPhysical environmentTransportationEconomic environmentCulture and recreation
Total expenditures
Excess (deficiency) of revenuesover expenditures
OTHER FINANCING SOURCES (USES)Transfers inTransfers out
Total other financing sources (uses)
Net change in fund balances
FUND BALANCES - BEGINNINGPrior period adjustments
FUND BALANCES - ENDING
(Page 2 of 2)
Total NonmajorDowntown City/County SpecialInitiatives Cable TV Revenue Funds
$ - $ - $ 5,237,280 - - 2,525,981 - 695,143 4,510,521 - - 268,232 - - 100,436
1,152 1,398 77,431 175,882 - 358,928
- - 134,005 - - 218,821
177,034 696,541 13,431,635
- 1,125,214 1,125,214 - - 86,139 - - 25,205 - - 153,866
97,616 - 3,119,688 - - 6,880
97,616 1,125,214 4,516,992
79,418 (428,673) 8,914,643
- 460,596 466,667 (300,000) - (8,121,857) (300,000) 460,596 (7,655,190)
(220,582) 31,923 1,259,453
272,742 - 13,771,542
- 380,546 380,546 $ 52,160 $ 412,469 $ 15,411,541
111

Vancouver Farmer’s Market
112

Debt Service Funds
Debt Service Funds are accounted for and budgeted annually on the modified accrual basis and all appropriations lapse at year-end. Debt Service Funds in the City of Vancouver account for the principal and interest on the general obligation bonds of the city. General obligation bonds are those bonds for which the full faith and credit of the city are pledged for payment. They are generally payable from general property taxes and other general revenues. These funds exclude debt service payments for debt issued for the benefit of a governmental enterprise from those revenues it will be servicing. GO Debt Service Fund This fund was established to accumulate monies for the payment of general obligation debt of the City of Vancouver. L.I.D. Fund This fund was established in November of 1988 in accordance with GASB Statement 6 to accumulate monies for the payment of special assessment bonds and notes issued to pay construction costs in providing special benefits to a particular area of the city. Payments range from $5,000 to $200,000 at interest rates ranging from 5.875% to 10.125%. Revenue is derived from special assessments levied against property receiving the benefit or improvements. L.I.D. Guaranty Fund This fund is authorized by law to insure that no bonds or notes will be left unpaid when all of the assessments from approved local government districts have been received. Revenue is from money remaining on L.I.D.s after all debt obligations have been met.
113

COMBINING BALANCE SHEETNONMAJOR DEBT SERVICE FUNDS
Total NonmajorG.O. Debt Debt ServiceService L.I.D. Debt L.I.D. Guaranty Funds
ASSETSCash and cash equivalents $ - $ 46,751 $ 32,578 $ 79,329 Receivables (net)
Accounts - 167,481 - 167,481 Interest - 45 31 76
TOTAL ASSETS $ - $ 214,277 $ 32,609 $ 246,886
DEFERRED INFLOWS OF RESOURCES Unavailable revenue-special assessments $ - $ 143,648 $ - $ 143,648
Total deferred inflows of resources - 143,648 - 143,648
FUND BALANCESRestricted - 70,629 32,609 103,238
Total fund balance - 70,629 32,609 103,238
TOTAL LIABILITIES, DEFERRED INFLOWS OFRESOURCES AND FUND BALANCES $ - $ 214,277 $ 32,609 $ 246,886
CITY OF VANCOUVER
December 31, 2015
114

COMBINING STATEMENT OF REVENUES, EXPENDITURES,
Total NonmajorG.O. Debt Debt ServiceService L.I.D. Debt L.I.D. Guaranty Funds
REVENUESFines and forfeits $ - $ 485 $ - $ 485 Investment earnings - 10,046 510 10,556 Miscellaneous - 110,727 - 110,727
Total revenues - 121,258 510 121,768
EXPENDITURESDebt service
Principal retirement 10,083,863 141,834 - 10,225,697 Interest/fiscal charges 3,838,223 11,248 - 3,849,471
Total expenditures 13,922,086 153,082 - 14,075,168
Excess (deficiency) of revenuesover (under) expenditures (13,922,086) (31,824) 510 (13,953,400)
OTHER FINANCING SOURCES (USES)Refunding bond issued 19,625,000 - - 19,625,000 Payment to refunded bond escrow account (22,373,995) - - (22,373,995) Premium on debt issued 2,902,785 - - 2,902,785 Fiscal charges (145,600) - - (145,600) Transfers in 13,913,896 - - 13,913,896
Total other financing sources (uses) 13,922,086 - - 13,922,086
Net change in fund balances - (31,824) 510 (31,314)
FUND BALANCES - BEGINNING - 102,453 32,099 134,552
FUND BALANCES - ENDING $ - $ 70,629 $ 32,609 $ 103,238
CITY OF VANCOUVER
AND CHANGES IN FUND BALANCESFor the Year Ended December 31, 2015
115

Concert in Esther Short Park
116

Capital Projects Funds
Capital Project funds account for the acquisition or development of capital facilities by a government unit, except those financed by assessment and enterprise funds. Their major sources of revenue are from proceeds from general obligation bonds, grants from other agencies, and contributions from other funds. The budgeting for capital project funds differs from that of the general and some of the special revenue funds. A capital budget is adopted which consists of a plan of proposed capital outlays and the means of financing them. The appropriations do not lapse at year-end, but continue until the project is finalized. Bond funds receive appropriations equal to the proceeds received, and are increased for expenditures supported from only additional revenues received. Though most of the capital project funds in the city represent individual projects, a number of them incorporate subsidiary project control for all projects related to the legal existence of the fund. The city utilizes the modified accrual method of accounting for capital project funds. The expenditures incurred are capitalized upon completion of the project to general fixed assets unless proprietary fund related. Parks Construction Fund This fund was created in January of 1981 to acquire or improve the public parks and recreation facilities of the city. This project is being paid for by voter approved G.O. bonds issued in 1981. Capital Improvement Fund This fund was created in 1977 to fund major capital improvement projects. Funding came primarily from Revenue Sharing monies until 1987. Current revenues are interest earning, grants, and contributions from the general fund. Transportation Capital Fund This fund was created in 1998 to account for all capital projects in the Transportation Department. The funding for the projects is primarily from grants, bonds, and developer agreements as well as other public and private funding sources. 2011 Bond Capital Fund This fund was established to account for bond money used to 1) partially fund the improvements for the Waterfront Access Project; and 2) pay issuance costs of the Bonds. 2015 Bond Capital-VNHR This fund was established to account for bond money used to renovate historic buildings located on Officer’s Row. Transportation/Parks Impact Fees The Transportation/Parks Impact Fee fund was established in 1995 to account for the accumulation and disposition of impact fees assessed against new development under the Growth Management Act of 1990. Each is shown in separate legal funds.
117

NONMAJOR CAPITAL PROJECT FUNDS
Parks Capital Transportation 2011 Bond
Construction Improvements Capital Capital ASSETS
Cash and cash equivalents $ 12,407,838 $ 8,020,958 $ 5,895,988 $ 4,653,171 Receivables (net)
Accounts - 294,049 105,211 - Interest 12,088 7,730 5,714 4,516
Due from other funds 6,587 362,120 119,289 - Due from other governmental units 168,142 195,776 598,338 -
TOTAL ASSETS $ 12,594,655 $ 8,880,633 $ 6,724,540 $ 4,657,687
LIABILITIESAccounts payable $ 516,439 $ 163,057 $ 529,299 $ - Due to other funds 6,587 - 11,410 21,203 Accrued liabilities 61 - 16,089 - Custodial accounts 20 16 - -
Total liabilities 523,107 163,073 556,798 21,203
DEFERRED INFLOWS OF RESOURCESUnavailable revenue-grant funding 168,142 - - - Unavailable revenue-capital improvements - 294,049 27,354 -
Total deferred inflows of resources 168,142 294,049 27,354 -
FUND BALANCESRestricted - - - 4,636,484 Committed - - 6,140,388 - Assigned 11,903,406 8,423,511 - -
Total fund balances 11,903,406 8,423,511 6,140,388 4,636,484
TOTAL LIABILITIES, DEFERRED INFLOWS OFRESOURCES AND FUND BALANCES $ 12,594,655 $ 8,880,633 $ 6,724,540 $ 4,657,687
CITY OF VANCOUVERCOMBINING BALANCE SHEET
December 31, 2015
118

NONMAJOR CAPITAL PROJECT FUNDS
Total Nonmajor2015 Bond Transportation Parks Capital Projects
Capital-VNHR Impact Fees Impact Fees FundsASSETS
Cash and cash equivalents $ 4,686,406 $ 6,961,022 $ 10,290,492 $ 52,915,875 Receivables (net)
Accounts - 39,283 - 438,543 Interest 4,532 6,729 9,962 51,271
Due from other funds - - - 487,996 Due from other governmental units - - - 962,256
TOTAL ASSETS $ 4,690,938 $ 7,007,034 $ 10,300,454 $ 54,855,941
LIABILITIESAccounts payable $ - $ - $ - $ 1,208,795 Due to other funds 28,686 94,387 6,587 168,860 Accrued liabilities - - - 16,150 Custodial accounts - - - 36
Total liabilities 28,686 94,387 6,587 1,393,841
DEFERRED INFLOWS OF RESOURCES - - Unavailable revenue-grant funding - - - 168,142 Unavailable revenue-capital improvements - - - 321,403
Total deferred inflows of resources - - - 489,545
FUND BALANCESRestricted 4,662,252 6,912,647 10,293,867 26,505,250 Committed - - - 6,140,388 Assigned - - - 20,326,917
Total fund balances 4,662,252 6,912,647 10,293,867 52,972,555
TOTAL LIABILITIES, DEFERRED INFLOWS OFRESOURCES AND FUND BALANCES $ 4,690,938 $ 7,007,034 $ 10,300,454 $ 54,855,941
CITY OF VANCOUVERCOMBINING BALANCE SHEET
December 31, 2015
119

CITY OF VANCOUVERCOMBINING STATEMENT OF REVENUES, EXPENDITURES, AND CHANGES IN FUND BALANCESNONMAJOR CAPITAL PROJECTS FUNDSFor the Year Ended December 31, 2015
Parks Capital Transportation 2011 Bond
Construction Improvements Capital Capital REVENUES
Other taxes $ - $ - $ 130,000 $ - Intergovernmental 800 165,600 4,500,923 - Charges for services - - 75,917 - Investment earnings 4,556 32,621 17,745 19,013 Rents and royalties - 294,049 - - Contributions/donations - - 811,429 -
Total revenues 5,356 492,270 5,536,014 19,013
EXPENDITURESCurrent
General government - 625,008 - - Security/persons & property - 432,481 - - Transportation - - 2,763,150 - Economic environment - 541,403 - - Culture and recreation 2,124,912 - - -
Capital outlay 305,824 1,923,699 6,895,500 - Debt service
Interest/fiscal charges - - 14,178 - Total expenditures 2,430,736 3,522,591 9,672,828 -
Excess (deficiency) of revenuesover (under) expenditures (2,425,380) (3,030,321) (4,136,814) 19,013
OTHER FINANCING SOURCES (USES)Capital related debt issued - - - - Sale of capital assets - - 332,978 - Premium (discount) on debt issued - - - - Transfers in 13,452,163 4,996,064 4,719,554 - Transfers out (150,000) (2,500,000) (2,024,657) (155,487)
Total other financing sources(uses) 13,302,163 2,496,064 3,027,875 (155,487)
Net change in fund balances 10,876,783 (534,257) (1,108,939) (136,474)
FUND BALANCES - BEGINNING 1,026,623 8,957,768 7,249,327 4,772,958 Prior period adjustments - - - -
FUND BALANCES - ENDING $ 11,903,406 $ 8,423,511 $ 6,140,388 $ 4,636,484
120

CITY OF VANCOUVERCOMBINING STATEMENT OF REVENUES, EXPENDITURES, AND CHANGES IN FUND BALANCESNONMAJOR CAPITAL PROJECTS FUNDSFor the Year Ended December 31, 2015
Total Nonmajor2015 Bond Transportation Parks Capital Projects
Capital-VNHR Impact Fees Impact Fees FundsREVENUES
Other taxes $ - $ - $ - $ 130,000 Intergovernmental - - - 4,667,323 Charges for services - 966,355 1,767,974 2,810,246 Investment earnings 8,356 29,997 52,490 164,778 Rents and royalties - - - 294,049 Contributions/donations - - - 811,429
Total revenues 8,356 996,352 1,820,464 8,877,825
EXPENDITURESCurrent
General government - - - 625,008 Security/persons & property - - - 432,481 Transportation - - - 2,763,150 Economic environment - - - 541,403 Culture and recreation - - - 2,124,912
Capital outlay - - - 9,125,023 Debt service
Interest/fiscal charges 84,199 - 12,963 111,340 Total expenditures 84,199 - 12,963 15,723,317
Excess (deficiency) of revenuesover (under) expenditures (75,843) 996,352 1,807,501 (6,845,492)
OTHER FINANCING SOURCES (USES)Capital related debt issued 4,771,500 - - 4,771,500 Sale of capital assets - - - 332,978 Premium (discount) on debt issued 317,579 - - 317,579 Transfers in - - - 23,167,781 Transfers out (350,984) (1,345,563) (868,991) (7,395,682)
Total other financing sources(uses) 4,738,095 (1,345,563) (868,991) 21,194,156
Net change in fund balances 4,662,252 (349,211) 938,510 14,348,664
FUND BALANCES - BEGINNING - 7,261,858 9,356,221 38,624,755 Prior period adjustments - - (864) (864)
FUND BALANCES - ENDING $ 4,662,252 $ 6,912,647 $ 10,293,867 $ 52,972,555
121

Kiggins Theater
122

Governmental Budget and Actual Schedules
123

ActualOriginal Final Biennium2015-16 2015-16 To- Date VarianceBiennium Biennium Thru 12/31/15 Thru 12/31/15
REVENUESIntergovernmental $ - $ - $ 22,094 $ (22,094) Investment earnings - - 1,349 (1,349) Contributions/donations 60,000 123,629 66,214 57,415 Miscellaneous - - 4,600 (4,600)
Total revenues 60,000 123,629 94,257 29,372
EXPENDITURESCurrent:
Security/persons & property 29,155 41,369 11,133 30,236 Total expenditures 29,155 41,369 11,133 30,236
Excess (deficiency) of revenuesover expenditures 30,845 82,260 83,124 (864)
OTHER FINANCING SOURCES (USES)Transfers out - (137,927) (45,752) (92,175)
Total other financing sources (uses) - (137,927) (45,752) (92,175)
Net change in fund balance 30,845 (55,667) 37,372 (93,039)
FUND BALANCES - BEGINNING 324,780 324,780 324,780 -
FUND BALANCES - ENDING $ 355,625 $ 269,113 $ 362,152 $ (93,039)
Budget Amounts
CITY OF VANCOUVERINVESTIGATIVE FUNDSTATEMENT OF REVENUES, EXPENDITURES, AND CHANGES IN FUND BALANCESCOMPARED TO BUDGET (GAAP BASIS) AND ACTUALFor the Year Ended December 31, 2015
124

ActualOriginal Final Biennium2015-16 2015-16 To- Date VarianceBiennium Biennium Thru 12/31/15 Thru 12/31/15
REVENUESFines and forfeitures $ 230,000 $ 230,000 $ 93,256 $ 136,744 Investment earnings - - 3,157 (3,157) Miscellaneous 380,000 380,000 158,226 221,774
Total revenues 610,000 610,000 254,639 355,361
EXPENDITURESCurrent:
Security/persons & property 226,815 226,815 74,905 151,910 Total expenditures 226,815 226,815 74,905 151,910
Excess (deficiency) of revenuesover expenditures 383,185 383,185 179,734 203,451
OTHER FINANCING SOURCES (USES)Transfers out (205,783) (205,783) (55,309) (150,474)
Total other financing sources (uses) (205,783) (205,783) (55,309) (150,474)
Net change in fund balance 177,402 177,402 124,425 52,977
FUND BALANCES - BEGINNING 750,839 750,839 750,839 -
FUND BALANCES - ENDING $ 928,241 $ 928,241 $ 875,264 $ 52,977
Budget Amounts
CITY OF VANCOUVERDRUG ENFORCEMENT FUNDSTATEMENT OF REVENUES, EXPENDITURES, AND CHANGES IN FUND BALANCESCOMPARED TO BUDGET (GAAP BASIS) AND ACTUALFor the Year Ended December 31, 2015
125

ActualOriginal Final Biennium2015-16 2015-16 To- Date VarianceBiennium Biennium Thru 12/31/15 Thru 12/31/15
REVENUESIntergovernmental $ 5,907,642 $ 5,907,642 $ 3,557,642 $ 2,350,000 Investment earnings - - 37,027 (37,027)
Total revenues 5,907,642 5,907,642 3,594,669 2,312,973
EXPENDITURESCurrent:
Economic environment 4,070,153 3,763,019 1,610,739 2,152,280 Total expenditures 4,070,153 3,763,019 1,610,739 2,152,280
Excess (deficiency) of revenuesover expenditures 1,837,489 2,144,623 1,983,930 160,693
OTHER FINANCING SOURCES (USES)Transfers out (2,067,000) (2,375,000) (2,168,339) (206,661)
Total other financing sources (uses) (2,067,000) (2,375,000) (2,168,339) (206,661)
Net change in fund balance (229,511) (230,377) (184,409) (45,968)
FUND BALANCES - BEGINNING 5,472,211 5,472,211 5,472,211 -
FUND BALANCES - ENDING $ 5,242,700 $ 5,241,834 $ 5,287,802 $ (45,968)
Budget Amounts
CITY OF VANCOUVERSMALL CITIES FUNDSTATEMENT OF REVENUES, EXPENDITURES, AND CHANGES IN FUND BALANCESCOMPARED TO BUDGET (GAAP BASIS) AND ACTUALFor the Year Ended December 31, 2015
126

ActualOriginal Final Biennium2015-16 2015-16 To- Date VarianceBiennium Biennium Thru 12/31/15 Thru 12/31/15
REVENUESOther taxes $ 3,008,330 $ 3,008,330 $ 2,120,748 $ 887,582 Investment earnings 4,872 4,872 8,693 (3,821)
Total revenues 3,013,202 3,013,202 2,129,441 883,761
EXPENDITURESCurrent:
Economic environment 5,536,434 5,536,434 1,064,322 4,472,112 Total expenditures 5,536,434 5,536,434 1,064,322 4,472,112
Net change in fund balance (2,523,232) (2,523,232) 1,065,119 (3,588,351)
FUND BALANCES - BEGINNING 1,947,037 1,947,037 1,947,037 -
FUND BALANCES - ENDING $ (576,195) $ (576,195) $ 3,012,156 $ (3,588,351)
Budget Amounts
CITY OF VANCOUVERTOURISM FUNDSTATEMENT OF REVENUES, EXPENDITURES, AND CHANGES IN FUND BALANCESCOMPARED TO BUDGET (GAAP BASIS) AND ACTUALFor the Year Ended December 31, 2015
127
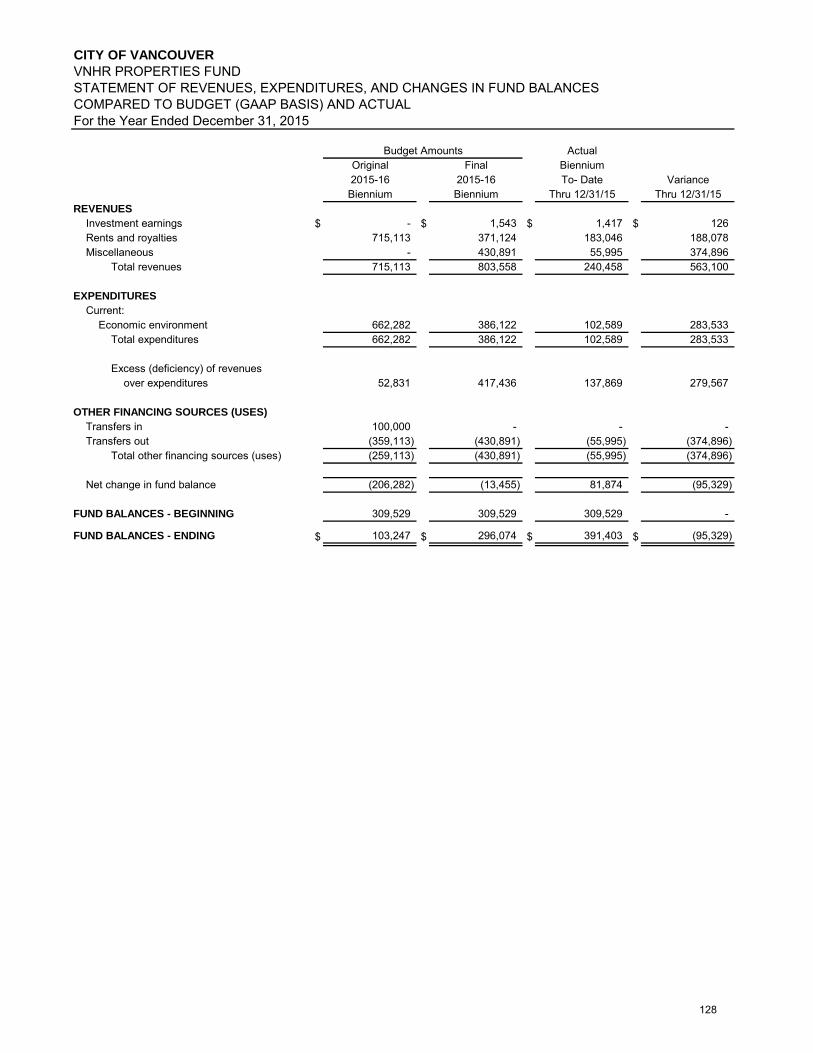
ActualOriginal Final Biennium2015-16 2015-16 To- Date VarianceBiennium Biennium Thru 12/31/15 Thru 12/31/15
REVENUESInvestment earnings $ - $ 1,543 $ 1,417 $ 126 Rents and royalties 715,113 371,124 183,046 188,078 Miscellaneous - 430,891 55,995 374,896
Total revenues 715,113 803,558 240,458 563,100
EXPENDITURESCurrent:
Economic environment 662,282 386,122 102,589 283,533 Total expenditures 662,282 386,122 102,589 283,533
Excess (deficiency) of revenuesover expenditures 52,831 417,436 137,869 279,567
OTHER FINANCING SOURCES (USES)Transfers in 100,000 - - - Transfers out (359,113) (430,891) (55,995) (374,896)
Total other financing sources (uses) (259,113) (430,891) (55,995) (374,896)
Net change in fund balance (206,282) (13,455) 81,874 (95,329)
FUND BALANCES - BEGINNING 309,529 309,529 309,529 -
FUND BALANCES - ENDING $ 103,247 $ 296,074 $ 391,403 $ (95,329)
Budget Amounts
CITY OF VANCOUVERVNHR PROPERTIES FUNDSTATEMENT OF REVENUES, EXPENDITURES, AND CHANGES IN FUND BALANCESCOMPARED TO BUDGET (GAAP BASIS) AND ACTUALFor the Year Ended December 31, 2015
128

ActualOriginal Final Biennium2015-16 2015-16 To- Date VarianceBiennium Biennium Thru 12/31/15 Thru 12/31/15
REVENUESIntergovernmental $ 592,393 $ 592,393 $ 235,642 $ 356,751 Investment earnings 4,675 4,675 3,045 1,630
Total revenues 597,068 597,068 238,687 358,381
EXPENDITURESCurrent:
Security/persons & property 809 809 101 708 Total expenditures 809 809 101 708
Excess (deficiency) of revenuesover expenditures 596,259 596,259 238,586 357,673
OTHER FINANCING SOURCES (USES)Transfers out (363,997) (498,091) (127,146) (370,945)
Total other financing sources (uses) (363,997) (498,091) (127,146) (370,945)
SPECIAL ITEMNet change in fund balance 232,262 98,168 111,440 (13,272)
FUND BALANCES - BEGINNING 721,369 721,369 721,369 -
FUND BALANCES - ENDING $ 953,631 $ 819,537 $ 832,809 $ (13,272)
Budget Amounts
CITY OF VANCOUVERCRIMINAL JUSTICE FUNDSTATEMENT OF REVENUES, EXPENDITURES, AND CHANGES IN FUND BALANCESCOMPARED TO BUDGET (GAAP BASIS) AND ACTUALFor the Year Ended December 31, 2015
129

ActualOriginal Final Biennium2015-16 2015-16 To- Date VarianceBiennium Biennium Thru 12/31/15 Thru 12/31/15
REVENUESLicense and permits $ 4,637,400 $ 5,077,400 $ 2,525,981 $ 2,551,419 Fines and forfeitures 14,374 14,374 7,180 7,194 Investment earnings 14,480 14,480 8,875 5,605
Total revenues 4,666,254 5,106,254 2,542,036 2,564,218
EXPENDITURESCurrent:
Transportation 310,859 310,859 153,866 156,993 Total expenditures 310,859 310,859 153,866 156,993
Excess (deficiency) of revenuesover expenditures 4,355,395 4,795,395 2,388,170 2,407,225
OTHER FINANCING SOURCES (USES)Transfers out (4,062,992) (4,439,609) (1,940,650) (2,498,959)
Total other financing sources (uses) (4,062,992) (4,439,609) (1,940,650) (2,498,959)
Net change in fund balance 292,403 355,786 447,520 (91,734)
FUND BALANCES - BEGINNING 1,560,062 1,560,062 1,560,062 -
FUND BALANCES - ENDING $ 1,852,465 $ 1,915,848 $ 2,007,582 $ (91,734)
Budget Amounts
CITY OF VANCOUVERTRANSPORTATION FUNDSTATEMENT OF REVENUES, EXPENDITURES, AND CHANGES IN FUND BALANCESCOMPARED TO BUDGET (GAAP BASIS) AND ACTUALFor the Year Ended December 31, 2015
130

ActualOriginal Final Biennium2015-16 2015-16 To- Date VarianceBiennium Biennium Thru 12/31/15 Thru 12/31/15
REVENUESCharges for services $ 500,000 $ 500,000 $ 251,478 $ 248,522 Investment earnings - - 1,336 (1,336) Contributions/donations - - 37,393 (37,393)
Total revenues 500,000 500,000 290,207 209,793
EXPENDITURESCurrent:
Economic environment 640,734 642,852 244,422 398,430 Total expenditures 640,734 642,852 244,422 398,430
Net change in fund balance (140,734) (142,852) 45,785 (188,637)
FUND BALANCES - BEGINNING 340,366 340,366 340,366 -
FUND BALANCES - ENDING $ 199,632 $ 197,514 $ 386,151 $ (188,637)
Budget Amounts
CITY OF VANCOUVERSENIOR MESSENGER FUNDSTATEMENT OF REVENUES, EXPENDITURES, AND CHANGES IN FUND BALANCESCOMPARED TO BUDGET (GAAP BASIS) AND ACTUALFor the Year Ended December 31, 2015
131

ActualOriginal Final Biennium2015-16 2015-16 To- Date VarianceBiennium Biennium Thru 12/31/15 Thru 12/31/15
REVENUESInvestment earnings $ - $ - $ 186 $ (186) Contributions/donations 30,000 51,653 30,398 21,255
Total revenues 30,000 51,653 30,584 21,069
EXPENDITURESCurrent:
Culture and recreation 9,676 9,676 6,071 3,605 Total expenditures 9,676 9,676 6,071 3,605
Excess (deficiency) of revenuesover expenditures 20,324 41,977 24,513 17,464
OTHER FINANCING SOURCES (USES)Transfers in 10,000 9,676 6,071 3,605 Transfers out (40,000) (49,336) (34,336) (15,000)
Total other financing sources (uses) (30,000) (39,660) (28,265) (11,395)
Net change in fund balance (9,676) 2,317 (3,752) 6,069
FUND BALANCES - BEGINNING 51,428 51,428 51,428 -
FUND BALANCES - ENDING $ 41,752 $ 53,745 $ 47,676 $ 6,069
Budget Amounts
CITY OF VANCOUVERPARKS & RECREATION FUNDSTATEMENT OF REVENUES, EXPENDITURES, AND CHANGES IN FUND BALANCESCOMPARED TO BUDGET (GAAP BASIS) AND ACTUALFor the Year Ended December 31, 2015
132

ActualOriginal Final Biennium2015-16 2015-16 To- Date VarianceBiennium Biennium Thru 12/31/15 Thru 12/31/15
REVENUESInvestment earnings $ - $ - $ 218 $ (218)
Total revenues - - 218 (218)
EXPENDITURESTotal expenditures - - - -
Excess (deficiency) of revenuesover expenditures - - 218 (218)
OTHER FINANCING SOURCES (USES)Transfers out (55,045) (89,877) (54,116) (35,761)
Total other financing sources (uses) (55,045) (89,877) (54,116) (35,761)
Net change in fund balance (55,045) (89,877) (53,898) (35,979)
FUND BALANCES - BEGINNING 86,467 86,467 86,467 -
FUND BALANCES - ENDING $ 31,422 $ (3,410) $ 32,569 $ (35,979)
Budget Amounts
CITY OF VANCOUVERPARKS CONSTRUCTION FUNDSTATEMENT OF REVENUES, EXPENDITURES, AND CHANGES IN FUND BALANCESCOMPARED TO BUDGET (GAAP BASIS) AND ACTUALFor the Year Ended December 31, 2015
133

ActualOriginal Final Biennium2015-16 2015-16 To- Date VarianceBiennium Biennium Thru 12/31/15 Thru 12/31/15
REVENUESCharges for services $ 24,000 $ 24,000 $ 16,754 $ 7,246 Investment earnings - - 1,640 (1,640)
Total revenues 24,000 24,000 18,394 5,606
EXPENDITURESCurrent:
Physical environment 43,339 43,339 25,205 18,134 Total expenditures 43,339 43,339 25,205 18,134
Net change in fund balance (19,339) (19,339) (6,811) (12,528)
FUND BALANCES - BEGINNING 417,869 417,869 417,869 -
FUND BALANCES - ENDING $ 398,530 $ 398,530 $ 411,058 $ (12,528)
Budget Amounts
CITY OF VANCOUVERPARKHILL CEMETARY FUNDSTATEMENT OF REVENUES, EXPENDITURES, AND CHANGES IN FUND BALANCESCOMPARED TO BUDGET (GAAP BASIS) AND ACTUALFor the Year Ended December 31, 2015
134

ActualOriginal Final Biennium2015-16 2015-16 To- Date VarianceBiennium Biennium Thru 12/31/15 Thru 12/31/15
REVENUESOther taxes $ 4,167,161 $ 5,567,161 $ 3,116,532 $ 2,450,629 Investment earnings 8,000 8,000 7,938 62
Total revenues 4,175,161 5,575,161 3,124,470 2,450,691
EXPENDITURESCurrent:
Culture and recreation 2,007 2,007 809 1,198 Total expenditures 2,007 2,007 809 1,198
Excess (deficiency) of revenuesover expenditures 4,173,154 5,573,154 3,123,661 2,449,493
OTHER FINANCING SOURCES (USES)Transfers in 230,000 230,000 - 230,000 Transfers out (4,272,901) (6,923,796) (3,340,214) (3,583,582)
Total other financing sources (uses) (4,042,901) (6,693,796) (3,340,214) (3,353,582)
Net change in fund balance 130,253 (1,120,642) (216,553) (904,089)
FUND BALANCES - BEGINNING 1,516,843 1,516,843 1,516,843 -
FUND BALANCES - ENDING $ 1,647,096 $ 396,201 $ 1,300,290 $ (904,089)
Budget Amounts
CITY OF VANCOUVERREET 2002 FUNDSTATEMENT OF REVENUES, EXPENDITURES, AND CHANGES IN FUND BALANCESCOMPARED TO BUDGET (GAAP BASIS) AND ACTUALFor the Year Ended December 31, 2015
135

ActualOriginal Final Biennium2015-16 2015-16 To- Date VarianceBiennium Biennium Thru 12/31/15 Thru 12/31/15
REVENUESInvestment earnings $ 1,614 $ 1,614 $ 1,152 $ 462 Rents and royalties 323,074 323,074 175,882 147,192
Total revenues 324,688 324,688 177,034 147,654
EXPENDITURESCurrent:
Economic environment 202,426 202,426 97,616 104,810 Total expenditures 202,426 202,426 97,616 104,810
Excess (deficiency) of revenuesover expenditures 122,262 122,262 79,418 42,844
OTHER FINANCING SOURCES (USES)Transfers out - (300,000) (300,000) -
Total other financing sources (uses) - (300,000) (300,000) -
Net change in fund balance 122,262 (177,738) (220,582) 42,844
FUND BALANCES - BEGINNING 272,742 272,742 272,742 -
FUND BALANCES - ENDING $ 395,004 $ 95,004 $ 52,160 $ 42,844
Budget Amounts
CITY OF VANCOUVERDOWNTOWN INITIATIVES FUNDSTATEMENT OF REVENUES, EXPENDITURES, AND CHANGES IN FUND BALANCESCOMPARED TO BUDGET (GAAP BASIS) AND ACTUALFor the Year Ended December 31, 2015
136

ActualOriginal Final Biennium2015-16 2015-16 To- Date VarianceBiennium Biennium Thru 12/31/15 Thru 12/31/15
REVENUESIntergovernmental $ 1,890,000 $ 1,370,200 $ 695,143 $ 675,057 Investment earnings 10,000 10,000 1,398 8,602
Total revenues 1,900,000 1,380,200 696,541 683,659
EXPENDITURESCurrent:
General government 2,186,436 2,356,387 1,125,214 1,231,173 Total expenditures 2,186,436 2,356,387 1,125,214 1,231,173
Excess (deficiency) of revenuesover expenditures (286,436) (976,187) (428,673) (547,514)
OTHER FINANCING SOURCES (USES)Transfers in - 886,240 460,596 425,644
Total other financing sources (uses) - 886,240 460,596 425,644
Net change in fund balance (286,436) (89,947) 31,923 (121,870)
FUND BALANCES - BEGINNING - - - - Prior period adjustments - - 380,546 (380,546)
FUND BALANCES - ENDING $ (286,436) $ (89,947) $ 412,469 $ (502,416)
Budget Amounts
CITY OF VANCOUVERCITY/COUNTY CABLE TV FUNDSTATEMENT OF REVENUES, EXPENDITURES, AND CHANGES IN FUND BALANCESCOMPARED TO BUDGET (GAAP BASIS) AND ACTUALFor the Year Ended December 31, 2015
137
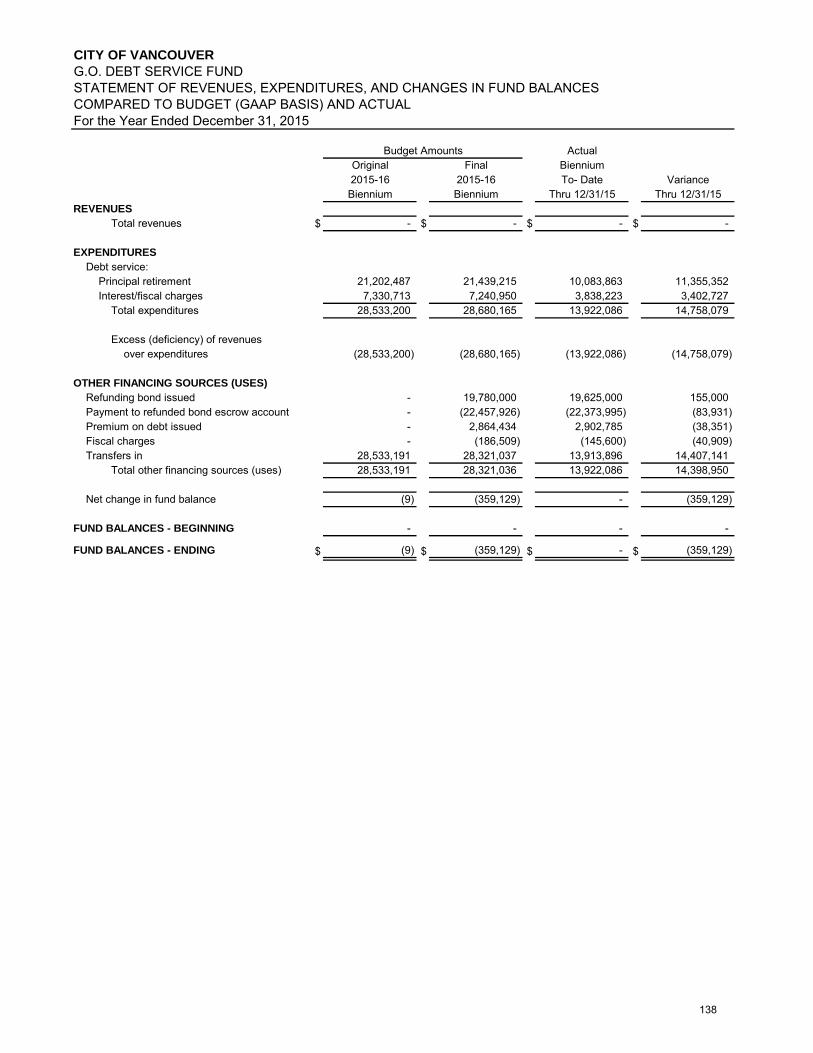
ActualOriginal Final Biennium2015-16 2015-16 To- Date VarianceBiennium Biennium Thru 12/31/15 Thru 12/31/15
REVENUESTotal revenues $ - $ - $ - $ -
EXPENDITURESDebt service:
Principal retirement 21,202,487 21,439,215 10,083,863 11,355,352 Interest/fiscal charges 7,330,713 7,240,950 3,838,223 3,402,727
Total expenditures 28,533,200 28,680,165 13,922,086 14,758,079
Excess (deficiency) of revenuesover expenditures (28,533,200) (28,680,165) (13,922,086) (14,758,079)
OTHER FINANCING SOURCES (USES)Refunding bond issued - 19,780,000 19,625,000 155,000 Payment to refunded bond escrow account - (22,457,926) (22,373,995) (83,931) Premium on debt issued - 2,864,434 2,902,785 (38,351) Fiscal charges - (186,509) (145,600) (40,909) Transfers in 28,533,191 28,321,037 13,913,896 14,407,141
Total other financing sources (uses) 28,533,191 28,321,036 13,922,086 14,398,950
Net change in fund balance (9) (359,129) - (359,129)
FUND BALANCES - BEGINNING - - - -
FUND BALANCES - ENDING $ (9) $ (359,129) $ - $ (359,129)
Budget Amounts
CITY OF VANCOUVERG.O. DEBT SERVICE FUNDSTATEMENT OF REVENUES, EXPENDITURES, AND CHANGES IN FUND BALANCESCOMPARED TO BUDGET (GAAP BASIS) AND ACTUALFor the Year Ended December 31, 2015
138

ActualOriginal Final Biennium2015-16 2015-16 To- Date VarianceBiennium Biennium Thru 12/31/15 Thru 12/31/15
REVENUESFines and forfeitures $ - $ - $ 485 $ (485) Investment earnings - - 10,046 (10,046) Miscellaneous - - 110,727 (110,727)
Total revenues - - 121,258 (121,258)
EXPENDITURESCurrent:Debt service:
Principal retirement 55,000 201,082 141,834 59,248 Interest/fiscal charges 52,000 59,400 11,248 48,152
Total expenditures 107,000 260,482 153,082 107,400
Net change in fund balance (107,000) (260,482) (31,824) (228,658)
FUND BALANCES - BEGINNING 102,453 102,453 102,453 -
FUND BALANCES - ENDING $ (4,547) $ (158,029) $ 70,629 $ (228,658)
Budget Amounts
CITY OF VANCOUVERL.I.D. DEBT SERVICE FUNDSTATEMENT OF REVENUES, EXPENDITURES, AND CHANGES IN FUND BALANCESCOMPARED TO BUDGET (GAAP BASIS) AND ACTUALFor the Year Ended December 31, 2015
139

ActualOriginal Final Biennium2015-16 2015-16 To- Date VarianceBiennium Biennium Thru 12/31/15 Thru 12/31/15
REVENUESInvestment earnings $ - $ - $ 510 $ (510)
Total revenues - - 510 (510)
EXPENDITURESTotal expenditures - - - -
Excess (deficiency) of revenuesover expenditures - - 510 (510)
OTHER FINANCING SOURCES (USES)Transfers in 8,000 4,000 - 4,000
Total other financing sources (uses) 8,000 4,000 - 4,000
Net change in fund balance 8,000 4,000 510 3,490
FUND BALANCES - BEGINNING 32,099 32,099 32,099 -
FUND BALANCES - ENDING $ 40,099 $ 36,099 $ 32,609 $ 3,490
Budget Amounts
CITY OF VANCOUVERL.I.D. DEBT SERVICE GUARANTY FUNDSTATEMENT OF REVENUES, EXPENDITURES, AND CHANGES IN FUND BALANCESCOMPARED TO BUDGET (GAAP BASIS) AND ACTUALFor the Year Ended December 31, 2015
140

ActualOriginal Final Biennium2015-16 2015-16 To- Date VarianceBiennium Biennium Thru 12/31/15 Thru 12/31/15
REVENUESIntergovernmental $ - $ 6,115,757 $ 800 $ 6,114,957 Investment earnings - - 4,556 (4,556) Contributions/donations 281,000 6,281,000 - 6,281,000
Total revenues 281,000 12,396,757 5,356 12,391,401
EXPENDITURESCurrent:
Culture and recreation 7,955 314,105 2,124,912 (1,810,807) Capital outlay 4,177,039 28,633,874 305,824 28,328,050
Total expenditures 4,184,994 28,947,979 2,430,736 26,517,243
Excess (deficiency) of revenuesover expenditures (3,903,994) (16,551,222) (2,425,380) (14,125,842)
OTHER FINANCING SOURCES (USES)Transfers in 3,206,726 16,542,973 13,452,163 3,090,810 Transfers out - (150,000) (150,000) -
Total other financing sources (uses) 3,206,726 16,392,973 13,302,163 3,090,810
Net change in fund balance (697,268) (158,249) 10,876,783 (11,035,032)
FUND BALANCES - BEGINNING 1,026,623 1,026,623 1,026,623 -
FUND BALANCES - ENDING $ 329,355 $ 868,374 $ 11,903,406 $ (11,035,032)
Budget Amounts
CITY OF VANCOUVERPARKS CONSTRUCTIONSTATEMENT OF REVENUES, EXPENDITURES, AND CHANGES IN FUND BALANCESCOMPARED TO BUDGET (GAAP BASIS) AND ACTUALFor the Year Ended December 31, 2015
141

ActualOriginal Final Biennium2015-16 2015-16 To- Date VarianceBiennium Biennium Thru 12/31/15 Thru 12/31/15
REVENUESCharges for services $ 1,079,648 $ 1,079,648 $ 966,355 $ 113,293 Investment earnings 33,736 33,736 29,997 3,739
Total revenues 1,113,384 1,113,384 996,352 117,032
EXPENDITURESTotal expenditures - - - -
Excess (deficiency) of revenuesover expenditures 1,113,384 1,113,384 996,352 117,032
OTHER FINANCING SOURCES (USES)Transfers out (6,241,154) (6,617,567) (1,345,563) (5,272,004)
Total other financing sources (uses) (6,241,154) (6,617,567) (1,345,563) (5,272,004)
Net change in fund balance (5,127,770) (5,504,183) (349,211) (5,154,972)
FUND BALANCES - BEGINNING 7,261,858 7,261,858 7,261,858 -
FUND BALANCES - ENDING $ 2,134,088 $ 1,757,675 $ 6,912,647 $ (5,154,972)
Budget Amounts
CITY OF VANCOUVERTRANSPORTATION IMPACT FEE FUNDSTATEMENT OF REVENUES, EXPENDITURES, AND CHANGES IN FUND BALANCESCOMPARED TO BUDGET (GAAP BASIS) AND ACTUALFor the Year Ended December 31, 2015
142

ActualOriginal Final Biennium2015-16 2015-16 To- Date VarianceBiennium Biennium Thru 12/31/15 Thru 12/31/15
REVENUESCharges for services $ 1,274,000 $ 1,274,000 $ 1,767,974 $ (493,974) Investment earnings 36,000 36,000 52,490 (16,490)
Total revenues 1,310,000 1,310,000 1,820,464 (510,464)
EXPENDITURESCurrent:
Principal retirement 240,848 240,848 - 240,848 Interest/fiscal charges 19,000 19,000 12,963 6,037
Total expenditures 259,848 259,848 12,963 246,885
Excess (deficiency) of revenuesover expenditures 1,050,152 1,050,152 1,807,501 (757,349)
OTHER FINANCING SOURCES (USES)Transfers out (51,681) (1,960,610) (868,991) (1,091,619)
Total other financing sources (uses) (51,681) (1,960,610) (868,991) (1,091,619)
Net change in fund balance 998,471 (910,458) 938,510 (1,848,968)
FUND BALANCES - BEGINNING 9,356,222 9,356,222 9,356,222 -
FUND BALANCES - ENDING $ 10,354,693 $ 8,445,764 $ 10,294,732 $ (1,848,968)
Budget Amounts
CITY OF VANCOUVERPARK IMPACT FEE FUNDSTATEMENT OF REVENUES, EXPENDITURES, AND CHANGES IN FUND BALANCESCOMPARED TO BUDGET (GAAP BASIS) AND ACTUALFor the Year Ended December 31, 2015
143

ActualOriginal Final Biennium2015-16 2015-16 To- Date VarianceBiennium Biennium Thru 12/31/15 Thru 12/31/15
REVENUESIntergovernmental $ 1,282,040 $ 1,565,061 $ 165,600 $ 1,399,461 Investment earnings 30,000 30,000 32,621 (2,621) Rents and royalties - 358,533 294,049 64,484 Contributions/donations 850,000 991,511 - 991,511
Total revenues 2,162,040 2,945,105 492,270 2,452,835
EXPENDITURESCurrent:
General government 1,343,297 2,910,797 625,008 2,285,789 Security/persons & property 8,940,000 10,315,000 432,481 9,882,519 Economic environment 2,174,602 2,274,602 541,403 1,733,199
Capital outlay 10,360,353 11,372,252 1,923,699 9,448,553 Total expenditures 22,818,252 26,872,651 3,522,591 23,350,060
Excess (deficiency) of revenuesover expenditures (20,656,212) (23,927,546) (3,030,321) (20,897,225)
OTHER FINANCING SOURCES (USES)Sale of capital assets 4,260,000 3,570,000 - 3,570,000 Transfers in 16,020,915 19,423,584 4,996,064 14,427,520 Transfers out (1,800,000) (2,500,000) (2,500,000) -
Total other financing sources (uses) 18,480,915 20,493,584 2,496,064 17,997,520
Net change in fund balance (2,175,297) (3,433,962) (534,257) (2,899,705)
FUND BALANCES - BEGINNING 8,957,768 8,957,768 8,957,768 -
FUND BALANCES - ENDING $ 6,782,471 $ 5,523,806 $ 8,423,511 $ (2,899,705)
Budget Amounts
CITY OF VANCOUVERCAPITAL IMPROVEMENTS FUNDSTATEMENT OF REVENUES, EXPENDITURES, AND CHANGES IN FUND BALANCESCOMPARED TO BUDGET (GAAP BASIS) AND ACTUALFor the Year Ended December 31, 2015
144

ActualOriginal Final Biennium2015-16 2015-16 To- Date VarianceBiennium Biennium Thru 12/31/15 Thru 12/31/15
REVENUESInvestment earnings $ - $ - $ 19,013 $ (19,013)
Total revenues - - 19,013 (19,013)
EXPENDITURESTotal expenditures - - - -
Excess (deficiency) of revenuesover expenditures - - 19,013 (19,013)
OTHER FINANCING SOURCES (USES)Transfers out (4,521,229) (4,756,429) (155,487) (4,600,942)
Total other financing sources (uses) (4,521,229) (4,756,429) (155,487) (4,600,942)
Net change in fund balance (4,521,229) (4,756,429) (136,474) (4,619,955)
FUND BALANCES - BEGINNING 4,772,958 4,772,958 4,772,958 -
FUND BALANCES - ENDING $ 251,729 $ 16,529 $ 4,636,484 $ (4,619,955)
Budget Amounts
CITY OF VANCOUVER2011 CAPITAL BOND FUNDSTATEMENT OF REVENUES, EXPENDITURES, AND CHANGES IN FUND BALANCESCOMPARED TO BUDGET (GAAP BASIS) AND ACTUALFor the Year Ended December 31, 2015
145

ActualOriginal Final Biennium2015-16 2015-16 To- Date VarianceBiennium Biennium Thru 12/31/15 Thru 12/31/15
REVENUESInvestment earnings $ - $ - $ 8,356 $ (8,356)
Total revenues - - 8,356 (8,356)
EXPENDITURESInterest/fiscal charges - 156,529 84,198 72,331
Total expenditures - 156,529 84,198 72,331
Excess (deficiency) of revenuesover expenditures - (156,529) (75,842) (80,687)
OTHER FINANCING SOURCES (USES)Capital related debt issued 5,024,415 5,180,944 4,771,500 409,444 Premium on debt issued - - 317,579 (317,579) Transfers out (5,024,415) (5,000,000) (350,984) (4,649,016)
Total other financing sources (uses) - 180,944 4,738,095 (4,557,151)
Net change in fund balance - 24,415 4,662,253 (4,637,838)
FUND BALANCES - BEGINNING - - - . -
FUND BALANCES - ENDING $ - $ 24,415 $ 4,662,253 $ (4,637,838)
Budget Amounts
CITY OF VANCOUVER2015 CAPITAL BOND FUNDSTATEMENT OF REVENUES, EXPENDITURES, AND CHANGES IN FUND BALANCESCOMPARED TO BUDGET (GAAP BASIS) AND ACTUALFor the Year Ended December 31, 2015
146

ActualOriginal Final Biennium2015-16 2015-16 To- Date VarianceBiennium Biennium Thru 12/31/15 Thru 12/31/15
REVENUESOther taxes $ 465,989 $ 265,989 $ 130,000 $ 135,989 Intergovernmental 15,836,189 19,420,516 4,500,923 14,919,593 Charges for services 1,495,000 1,595,000 75,917 1,519,083 Investment earnings - - 17,745 (17,745) Contributions/donations 5,800,000 5,800,000 811,430 4,988,570
Total revenues 23,597,178 27,081,505 5,536,015 21,545,490
EXPENDITURESCurrent:
Transportation 397,579 393,746 2,763,150 (2,369,404) Capital outlay 32,054,269 37,042,176 6,895,500 30,146,676 Debt service:
Interest/fiscal charges - - 14,178 (14,178) Total expenditures 32,451,848 37,435,922 9,672,828 27,763,094
Excess (deficiency) of revenuesover expenditures (8,854,670) (10,354,417) (4,136,813) (6,217,604)
OTHER FINANCING SOURCES (USES)Sale of capital assets - - 332,978 (332,978) Transfers in 14,976,945 14,823,675 4,719,553 10,104,122 Transfers out (6,143,000) (5,443,000) (2,024,657) (3,418,343)
Total other financing sources (uses) 8,833,945 9,380,675 3,027,874 6,352,801
Net change in fund balance (20,725) (973,742) (1,108,939) 135,197
FUND BALANCES - BEGINNING 7,249,327 7,249,327 7,249,327 -
FUND BALANCES - ENDING $ 7,228,602 $ 6,275,585 $ 6,140,388 $ 135,197
Budget Amounts
CITY OF VANCOUVERTRANSPORTATION CAPITAL STATEMENT OF REVENUES, EXPENDITURES, AND CHANGES IN FUND BALANCESCOMPARED TO BUDGET (GAAP BASIS) AND ACTUALFor the Year Ended December 31, 2015
147

This page has been intentionally left blank
148

Nonmajor Enterprise Funds
The accounting for Enterprise Funds generally follows the accounting principles and procedures used in commercial accounting very closely. Since operating results are a primary concern for enterprise funds, the accrual method of accounting must be used. In the City of Vancouver, all enterprise funds are budgeted annually as required by state law for the purpose of providing expense control. The Enterprise Funds in the City of Vancouver are established to account for self-supporting services carried on by this governmental unit. Most services are provided to the general public whose user fees are used to support the activities of the specific enterprises. Airpark The Airpark Fund receives its revenue from hangar rental and from per gallon fees charged on all fuel sold at the airpark. Expenses are for the redemption of bonds sold to construct hangars, provide maintenance of the facility, and service to its customers. Building Inspection Fund The Building Inspection Fund was created in 1987. Its revenues come from fees paid for building inspections, permit fees, zoning changes, and building demolition. Expenses are costs to provide inspection services. Solid Waste The sanitary fund contracts for garbage and trash services, and receives a franchise fee from the contractor. Revenues are used for the payment of city expenses related to monitoring the contract, funding for recycling programs, and general fund administrative expenses. Tennis Center Fund The majority of revenues are received through court use fees and instruction fees. Expenses are mainly for salaries of employees and debt payments on bonds to build the tennis/racquetball facility.
149

CITY OF VANCOUVERCOMBINING STATEMENT OF NET POSITIONNONMAJOR ENTERPRISE FUNDSDecember 31, 2015
Total Nonmajor
Building EnterpriseAirpark Inspection Solid Waste Tennis Center Funds
ASSETSCurrent assets
Cash and cash equivalents $ 695,294 $ 7,513,207 $ 6,009,914 $ 187,497 $ 14,405,912 Receivables (net)
Accounts 3,827 188 191,328 442 195,785 Interest 671 7,278 5,789 180 13,918
Due from other funds - - - 3,141 3,141 Total current assets 699,792 7,520,673 6,207,031 191,260 14,618,756
Noncurrent assetsCapital assets
Land and improvements 484,202 - - - 484,202 Construction in progress - 167,719 - - 167,719 Other improvements 2,369,720 - - - 2,369,720 Buildings 6,466,748 2,538,758 204,330 1,775,077 10,984,913 Intangible assets - 1,603,368 - - 1,603,368 Machinery and equipment - 315,184 25,422 - 340,606 Accumulated depreciation (4,869,098) (1,680,516) (151,252) (1,307,621) (8,008,487)
Capital assets net of accumulated depreciation 4,451,572 2,944,513 78,500 467,456 7,942,041 Total noncurrent assets 4,451,572 2,944,513 78,500 467,456 7,942,041
TOTAL ASSETS 5,151,364 10,465,186 6,285,531 658,716 22,560,797
DEFERRED OUTFLOWS OF RESOURCESDeferred charge on refunding 17,885 - - - 17,885 Amounts related to pension 7,249 196,907 28,872 57,157 290,185
TOTAL DEFERRED OUTFLOWS OF RESOURCES 25,134 196,907 28,872 57,157 308,070
LIABILITIESCurrent liabilities
Accounts payable 8,692 18,194 245,956 2,356 275,198 Due to other funds - 12,166 - - 12,166 Accrued interest payable 2,159 - - - 2,159 Accrued liabilities 17,689 284,224 75,636 48,512 426,061 Custodial accounts 47,920 3,449 71 3,177 54,617 Unearned revenues 17,478 - 107,814 2,905 128,197 Bonds, notes and loans payable 384,361 - - - 384,361
Total current liabilities 478,299 318,033 429,477 56,950 1,282,759
Noncurrent liabilitiesBonds, notes and loan payable 131,233 - - - 131,233 Accrued employee benefits 1,500 18,803 6,835 1,809 28,947 Net pension liability 55,961 1,520,009 222,879 441,215 2,240,064
Total noncurrent liabilities 188,694 1,538,812 229,714 443,024 2,400,244 Total liabilities 666,993 1,856,845 659,191 499,974 3,683,003
DEFERRED INFLOWS OF RESOURCESAmount related to pension 8,583 233,122 34,183 67,669 343,557
TOTAL DEFERRED INFLOWS OF RESOURCES 8,583 233,122 34,183 67,669 343,557
NET POSITIONNet investment in capital assets 3,953,863 2,944,513 78,500 467,456 7,444,332 Unrestricted 547,059 5,627,613 5,542,529 (319,226) 11,397,975
TOTAL NET POSITION $ 4,500,922 $ 8,572,126 $ 5,621,029 $ 148,230 $ 18,842,307
150
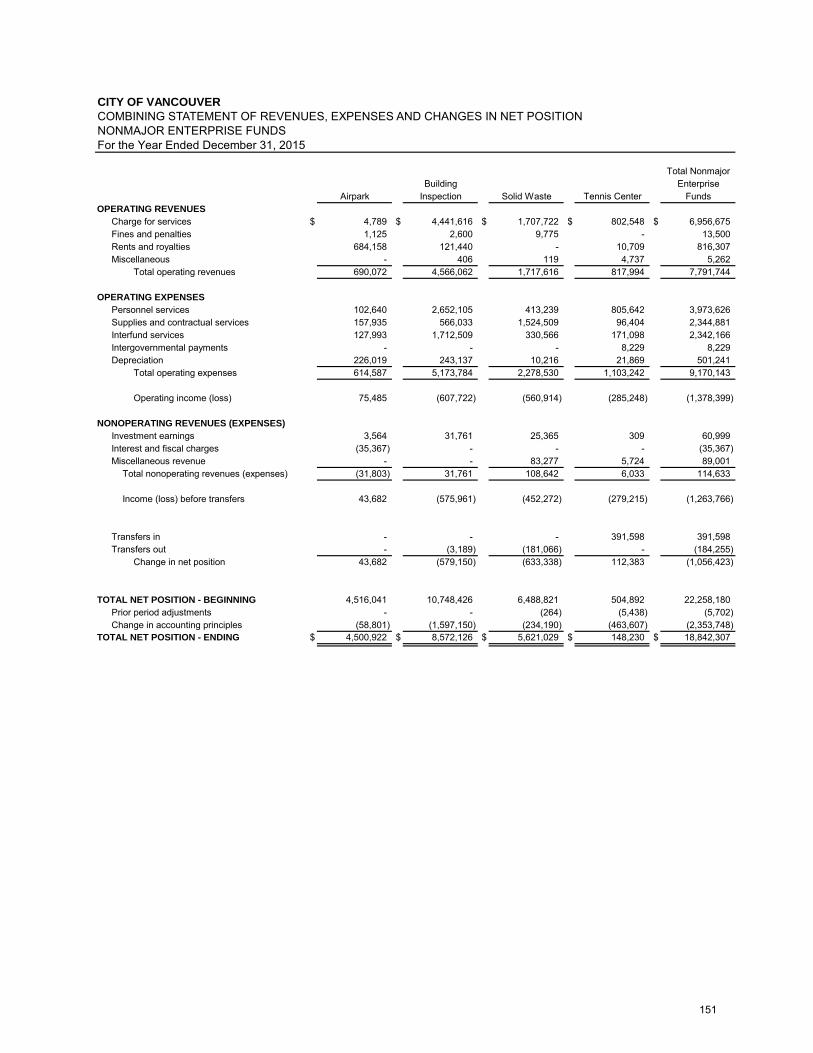
CITY OF VANCOUVERCOMBINING STATEMENT OF REVENUES, EXPENSES AND CHANGES IN NET POSITION NONMAJOR ENTERPRISE FUNDSFor the Year Ended December 31, 2015
Total Nonmajor Building Enterprise
Airpark Inspection Solid Waste Tennis Center FundsOPERATING REVENUES
Charge for services $ 4,789 $ 4,441,616 $ 1,707,722 $ 802,548 $ 6,956,675 Fines and penalties 1,125 2,600 9,775 - 13,500 Rents and royalties 684,158 121,440 - 10,709 816,307 Miscellaneous - 406 119 4,737 5,262
Total operating revenues 690,072 4,566,062 1,717,616 817,994 7,791,744
OPERATING EXPENSESPersonnel services 102,640 2,652,105 413,239 805,642 3,973,626 Supplies and contractual services 157,935 566,033 1,524,509 96,404 2,344,881 Interfund services 127,993 1,712,509 330,566 171,098 2,342,166 Intergovernmental payments - - - 8,229 8,229 Depreciation 226,019 243,137 10,216 21,869 501,241
Total operating expenses 614,587 5,173,784 2,278,530 1,103,242 9,170,143
Operating income (loss) 75,485 (607,722) (560,914) (285,248) (1,378,399)
NONOPERATING REVENUES (EXPENSES)Investment earnings 3,564 31,761 25,365 309 60,999 Interest and fiscal charges (35,367) - - - (35,367) Miscellaneous revenue - - 83,277 5,724 89,001
Total nonoperating revenues (expenses) (31,803) 31,761 108,642 6,033 114,633
Income (loss) before transfers 43,682 (575,961) (452,272) (279,215) (1,263,766)
Transfers in - - - 391,598 391,598 Transfers out - (3,189) (181,066) - (184,255)
Change in net position 43,682 (579,150) (633,338) 112,383 (1,056,423)
TOTAL NET POSITION - BEGINNING 4,516,041 10,748,426 6,488,821 504,892 22,258,180 Prior period adjustments - - (264) (5,438) (5,702) Change in accounting principles (58,801) (1,597,150) (234,190) (463,607) (2,353,748)
TOTAL NET POSITION - ENDING $ 4,500,922 $ 8,572,126 $ 5,621,029 $ 148,230 $ 18,842,307
151

CITY OF VANCOUVERCOMBINING STATEMENT OF CASH FLOWSNONMAJOR ENTERPRISE FUNDSFor the Year Ended December 31, 2015
AirparkBuilding
Inspection Solid Waste Tennis CenterTotal Nonmajor
Enterprise Funds
CASH FLOWS FROM OPERATING ACTIVITIESCash received from customers $ 698,144 $ 4,565,825 $ 1,884,375 $ 812,979 $ 7,961,323 Cash received from other operating activities - 406 4,737 5,143 Cash payments for goods and services (147,630) (569,393) (1,511,505) (107,989) (2,336,517) Internal activity-between funds (129,172) (1,731,252) (338,459) (175,586) (2,374,469) Cash payments to employees (101,604) (2,622,668) (390,135) (830,289) (3,944,696)
Net cash provided (used) by operating activities 319,738 (357,082) (355,724) (296,148) (689,216)
CASH FLOWS FROM NONCAPITALFINANCING ACTIVITIES
Unrestricted gifts received - - 83,277 5,724 89,001 Transfers from other funds - - - 391,598 391,598 Transfers to other funds - (3,189) (181,066) - (184,255)
Net cash provided (used) by noncapital financing activities - (3,189) (97,789) 397,322 296,344
CASH FLOWS FROM CAPITAL ANDRELATED FINANCING ACTIVITIES
Principal paid on capital debt (352,608) - - - (352,608) Interest paid on capital debt (44,426) - - - (44,426) Purchase of capital assets - (18,040) - - (18,040)
Net cash used by capital andrelated financing activities (397,034) (18,040) - - (415,074)
CASH FLOWS FROM INVESTING ACTIVITIESInvestment earnings (losses) 4,213 38,018 30,603 275 73,109
Net cash provided in investing activities 4,213 38,018 30,603 275 73,109
NET INCREASE (DECREASE) INCASH AND CASH EQUIVALENTS (73,083) (340,293) (422,910) 101,449 (734,837)
768,377 7,853,500 6,432,824 86,048 15,140,749 $ 695,294 $ 7,513,207 $ 6,009,914 $ 187,497 $ 14,405,912
Reconciliation of operating income (loss) to netcash used by operating activities:
Net operating income (loss) $ 75,485 $ (607,722) $ (560,914) $ (285,248) $ (1,378,399)
Adjustments to reconcile net operating income (loss) to net cash provided (used) by operations:
Depreciation and amortization expense 226,019 243,137 10,216 21,869 501,241 (Increase) Decrease in receivables (541) 169 162,614 (442) 161,800 (Increase) Decrease in deposits 8,613 - 4,146 - 12,759 Increase (Decrease) in current payables 5,173 (3,360) 13,003 (3,192) 11,624 Increase (Decrease) in accrued liabilities 2,541 70,363 29,104 (12,767) 89,241 (Increase) Decrease in receivables from other funds 3,954 145 - (400) 3,699 Increase (Decrease) in payables due to other funds - (18,888) (7,893) (4,088) (30,869) Increase (Decrease) in net pension liability (1,506) (40,926) (6,000) (11,880) (60,312)
Total adjustments 244,253 250,640 205,190 (10,900) 689,183
Net cash provided by operating activities $ 319,738 $ (357,082) $ (355,724) $ (296,148) $ (689,216)
Noncash investing, financing and capital activitiesNet change in fair value of investments $ (193) $ (2,087) $ (1,660) $ (52) $ (3,991)
CASH AND CASH EQUIVALENTS - BEGINNINGCASH AND CASH EQUIVALENTS - ENDING
152

Internal Service Funds
The Internal Service Funds in the City of Vancouver are service funds for the departments within this governmental entity. The services provided are reimbursed by transfers from the budget appropriations of the departments served. An internal service fund must recover its complete cost of operations without producing any significant profit. Though the operations of the Internal Service Funds do not theoretically require budgeting, budgets are prepared to assure proper expense control. Facilities Asset Mgmt. & Replacement Reserve Fund To accumulate funds as they become available for the costs associated with the eventual replacement of City facilities. Equipment Repair & Replacement Fund RCW 35.21.088 requires that all cities whose population exceeds 8,000 must establish an Equipment Rental Fund, charging rates adequate to the using departments for the replacement, operation, and maintenance of equipment. The Equipment R & R Fund is a working capital fund. Fixed assets are maintained with depreciation reserves programmed for each individual piece of equipment or other fixed assets. Computer Repair and Replacement Fund This fund was established in 1996 to account for the replacement of computer equipment originally purchased by user departments. Revenues are derived from monthly charges to city departments based on their technology usage. Self-Insured Worker’s Comp & Liability Fund During 1977, the city began a program of becoming self-insured except for major claims over the amounts specified in the insurance policies listed in the statistical section. The different operating funds are currently being charged on the basis of past insurance payments and actual claim history accumulated since 1977. Internal Administrative Services Fund This fund was established January 2015 to account for the revenues and expenses associated with providing administrative internal services to all City departments. Benefits Fund During 1992, the city began a program to consolidate the payment of premium costs out of one central point, the Benefits Fund. This fund pays premiums for all insurance including medical, dental, vision, life, and long-term disability. The fund pays administration costs, both internal and external, including the city Wellness Program. All operating funds are currently being charged a set monthly rate per full-time employee. Self-Insured Health Insurance Fund This fund was established January 2015 to account for the revenues and expenses associated with providing self-insured health care to City employees. Mail Services Fund Established in 1999, the Mail Services Fund provides in-house mail services for city departments funded through interfund charges.
153

CITY OF VANCOUVERCOMBINING STATEMENT OF NET POSITIONINTERNAL SERVICE FUNDSDecember 31, 2015
Facilities Equipment Computer Self-InsuredAsset Mgmt & Repair & Repair & Worker's CompReplacement Replacement Replacement & Liability
ASSETSCurrent assets
Cash, cash equivalents $ 9,844,455 $ 17,315,703 $ 7,944,780 $ 4,581,147 Receivables (net)
Accounts - 3,041 263 3,714 Interest 9,531 16,756 7,683 4,426
Due from other funds - 46,510 - - Inventory - 477,684 - - Prepaid expenses - - - 100,000
Total current assets 9,853,986 17,859,694 7,952,726 4,689,287
Noncurrent assetsCapital assets
Construction in progress - 494,977 - - Machinery and equipment - 26,484,899 3,006,369 - Accumulated depreciation - (21,549,165) (2,194,679) -
Capital assets net of accumulated depreciation - 5,430,711 811,690 - Total noncurrent assets - 5,430,711 811,690 -
TOTAL ASSETS 9,853,986 23,290,405 8,764,416 4,689,287
DEFERRED OUTFLOWS OF RESOURCESAmounts related to pension - 142,331 - -
Total deferred ouflows of resources - 142,331 - -
LIABILITIESCurrent liabilities
Accounts payable - 147,886 4,862 257,963 Claims and judgments payable - - - 1,743,912 Due to other funds 333,434 986 96,855 6,285 Accrued liabilities - 262,083 - 84,578 Custodial accounts - 5,684 25 -
Total current liabilities 333,434 416,639 101,742 2,092,738
Noncurrent liabilitiesClaims and judgments - - - 3,425,088 Accrued employee benefits - 19,965 - 7,547 Net pension liability - 1,098,716 - -
Total noncurrent liabilities - 1,118,681 - 3,432,635 TOTAL LIABILITIES 333,434 1,535,320 101,742 5,525,373
DEFERRED INFLOWS OF RESOURCESAmounts related to pension - 168,509 - -
Total deferred inflows of resources - 168,509 - -
NET POSITIONNet investment in capital assets - 5,430,711 811,690 - Restricted for capital purposes - - 210,000 - Unrestricted 9,520,552 16,298,196 7,640,984 (836,086)
TOTAL NET POSITION $ 9,520,552 $ 21,728,907 $ 8,662,674 $ (836,086)
154

CITY OF VANCOUVERCOMBINING STATEMENT OF NET POSITIONINTERNAL SERVICE FUNDSDecember 31, 2015
Internal Self-Insured TotalAdministrative Health Internal Service
Services Benefits Insurance Mail Services FundsASSETSCurrent assets
Cash, cash equivalents $ 3,317,932 $ 1,868,671 $ 3,912,796 $ 217,996 $ 49,003,480 Receivables (net)
Accounts - 404,870 256,085 - 667,973 Interest 3,208 1,794 3,783 211 47,392
Due from other funds 140,015 - - - 186,525 Inventory - - - - 477,684 Prepaid expenses - - - - 100,000
Total current assets 3,461,155 2,275,335 4,172,664 218,207 50,483,054
Noncurrent assetsCapital assets
Construction in progress - - - - 494,977 Machinery and equipment - - - 88,165 29,579,433 Accumulated depreciation - - - (85,852) (23,829,696)
Capital assets net of accumulated depreciation - - - 2,313 6,244,714 Total noncurrent assets - - - 2,313 6,244,714
TOTAL ASSETS 3,461,155 2,275,335 4,172,664 220,520 56,727,768
DEFERRED OUTFLOWS OF RESOURCESAmounts related to pension 560,382 - - - 702,713
Total deferred ouflows of resources 560,382 - - - 702,713
LIABILITIESCurrent liabilities
Accounts payable 323,638 2,664 154,321 1,012 892,346 Claims and judgments payable - - - - 1,743,912 Due to other funds - 2,002 - - 439,562 Accrued liabilities 931,074 - - 12,763 1,290,498 Custodial accounts 337 - - - 6,046
Total current liabilities 1,255,049 4,666 154,321 13,775 4,372,364
Noncurrent liabilitiesClaims and judgments - - - - 3,425,088 Accrued employee benefits 69,814 - - 1,116 98,442 Net pension liability 4,325,817 - - - 5,424,533
Total noncurrent liabilities 4,395,631 - - 1,116 8,948,063 TOTAL LIABILITIES 5,650,680 4,666 154,321 14,891 13,320,427
DEFERRED INFLOWS OF RESOURCESAmounts related to pension 663,446 - - - 831,955
Total deferred inflows of resources 663,446 - - - 831,955
NET POSITIONNet investment in capital assets - - - - - 2,313 6,244,714 Restricted for capital purposes - - - - 210,000 Unrestricted (2,292,589) 2,270,669 4,018,343 203,316 36,823,385
TOTAL NET POSITION $ (2,292,589) $ 2,270,669 $ 4,018,343 $ 205,629 $ 43,278,099
155
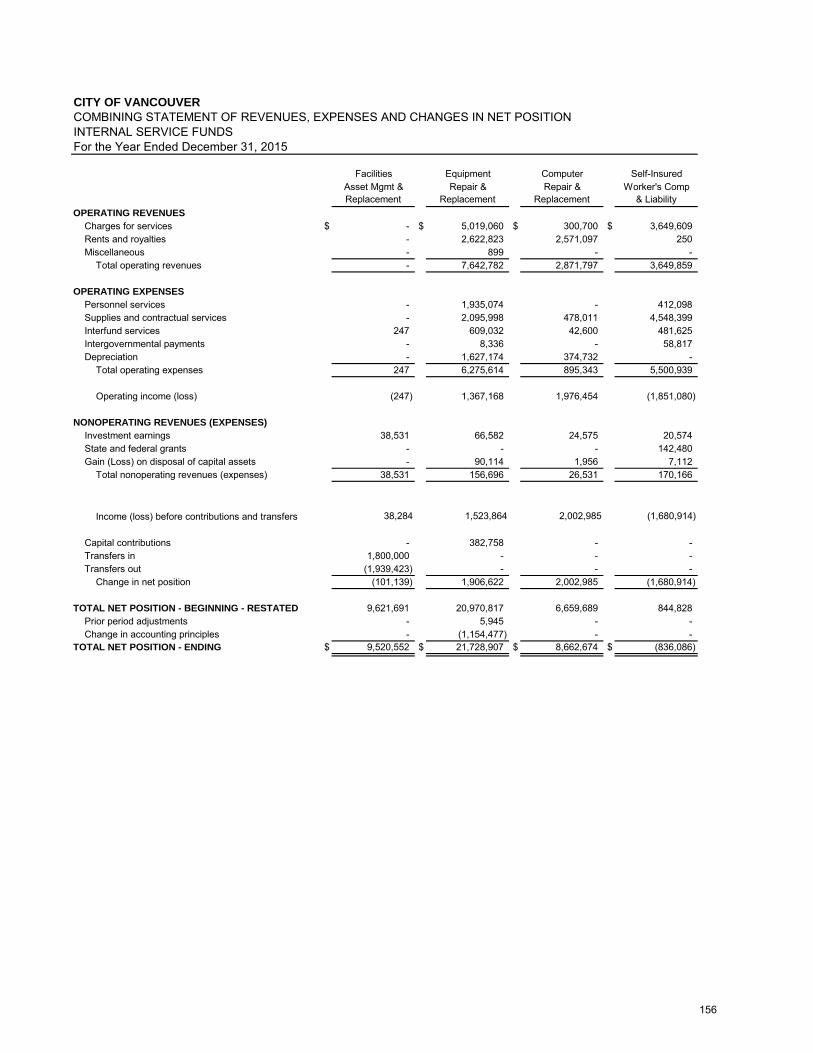
CITY OF VANCOUVERCOMBINING STATEMENT OF REVENUES, EXPENSES AND CHANGES IN NET POSITIONINTERNAL SERVICE FUNDSFor the Year Ended December 31, 2015
Facilities Equipment Computer Self-InsuredAsset Mgmt & Repair & Repair & Worker's Comp
Replacement Replacement Replacement & LiabilityOPERATING REVENUES
Charges for services $ - $ 5,019,060 $ 300,700 $ 3,649,609 Rents and royalties - 2,622,823 2,571,097 250 Miscellaneous - 899 - -
Total operating revenues - 7,642,782 2,871,797 3,649,859
OPERATING EXPENSESPersonnel services - 1,935,074 - 412,098 Supplies and contractual services - 2,095,998 478,011 4,548,399 Interfund services 247 609,032 42,600 481,625 Intergovernmental payments - 8,336 - 58,817 Depreciation - 1,627,174 374,732 -
Total operating expenses 247 6,275,614 895,343 5,500,939
Operating income (loss) (247) 1,367,168 1,976,454 (1,851,080)
NONOPERATING REVENUES (EXPENSES)Investment earnings 38,531 66,582 24,575 20,574 State and federal grants - - - 142,480 Gain (Loss) on disposal of capital assets - 90,114 1,956 7,112
Total nonoperating revenues (expenses) 38,531 156,696 26,531 170,166
38,284 1,523,864 2,002,985 (1,680,914)
Capital contributions - 382,758 - - Transfers in 1,800,000 - - - Transfers out (1,939,423) - - -
Change in net position (101,139) 1,906,622 2,002,985 (1,680,914)
TOTAL NET POSITION - BEGINNING - RESTATED 9,621,691 20,970,817 6,659,689 844,828 Prior period adjustments - 5,945 - - Change in accounting principles - (1,154,477) - -
TOTAL NET POSITION - ENDING $ 9,520,552 $ 21,728,907 $ 8,662,674 $ (836,086)
Income (loss) before contributions and transfers
156

CITY OF VANCOUVERCOMBINING STATEMENT OF REVENUES, EXPENSES AND CHANGES IN NET POSITIONINTERNAL SERVICE FUNDSFor the Year Ended December 31, 2015
Internal Self-Insured TotalAdministrative Health Mail Internal Service
Services Benefits Insurance Services FundsOPERATING REVENUES
Charges for services $ 11,487,686 $ 9,903,212 $ 7,111,500 $ 252,277 $ 37,724,044 Rents and royalties - - - - 5,194,170 Miscellaneous 105 - - - 1,004
Total operating revenues 11,487,791 9,903,212 7,111,500 252,277 42,919,218
OPERATING EXPENSESPersonnel services 7,504,162 17,021 - 73,711 9,942,066 Supplies and contractual services 2,699,763 9,065,987 5,162,871 73,532 24,124,561 Interfund services 1,192,527 29,188 - 46,171 2,401,390 Intergovernmental payments 306,375 265 - - 373,793 Depreciation - - - 3,470 2,005,376
Total operating expenses 11,702,827 9,112,461 5,162,871 196,884 38,847,186
Operating income (loss) (215,036) 790,751 1,948,629 55,393 4,072,032
NONOPERATING REVENUES (EXPENSES)Investment earnings 12,601 10,641 11,212 758 185,474 State and federal grants - - - - 142,480 Gain (Loss) on disposal of capital assets - - - - 99,182
Total nonoperating revenues (expenses) 12,601 10,641 11,212 758 427,136
(202,435) 801,392 1,959,841 56,151 4,499,168
Capital contributions - - - - 382,758 Transfers in 2,469,300 - 2,058,502 - 6,327,802 Transfers out (1,080) (2,058,502) - - (3,999,005)
Change in net position 2,265,785 (1,257,110) 4,018,343 56,151 7,210,723
TOTAL NET POSITION - BEGINNING - RESTATED - 3,527,779 - 149,478 41,774,282 Prior period adjustments (13,018) - - - (7,073) Change in accounting principles (4,545,356) - - - (5,699,833)
TOTAL NET POSITION - ENDING $ (2,292,589) $ 2,270,669 $ 4,018,343 $ 205,629 $ 43,278,099
Income (loss) before contributions and transfers
157
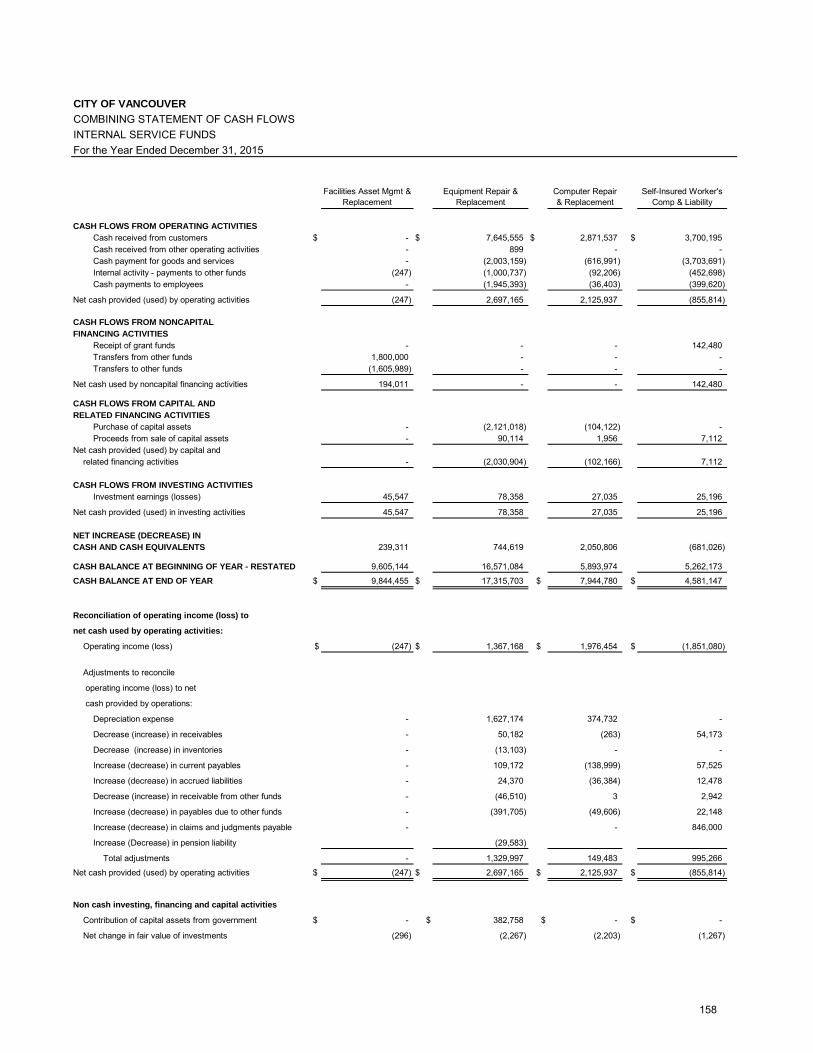
CITY OF VANCOUVERCOMBINING STATEMENT OF CASH FLOWSINTERNAL SERVICE FUNDSFor the Year Ended December 31, 2015
Facilities Asset Mgmt & Replacement
Equipment Repair & Replacement
Computer Repair & Replacement
Self-Insured Worker's Comp & Liability
CASH FLOWS FROM OPERATING ACTIVITIESCash received from customers $ - $ 7,645,555 $ 2,871,537 $ 3,700,195 Cash received from other operating activities - 899 - - Cash payment for goods and services - (2,003,159) (616,991) (3,703,691) Internal activity - payments to other funds (247) (1,000,737) (92,206) (452,698) Cash payments to employees - (1,945,393) (36,403) (399,620)
Net cash provided (used) by operating activities (247) 2,697,165 2,125,937 (855,814)
CASH FLOWS FROM NONCAPITALFINANCING ACTIVITIES
Receipt of grant funds - - - 142,480 Transfers from other funds 1,800,000 - - - Transfers to other funds (1,605,989) - - -
Net cash used by noncapital financing activities 194,011 - - 142,480
CASH FLOWS FROM CAPITAL ANDRELATED FINANCING ACTIVITIES
Purchase of capital assets - (2,121,018) (104,122) - Proceeds from sale of capital assets - 90,114 1,956 7,112
Net cash provided (used) by capital andrelated financing activities - (2,030,904) (102,166) 7,112
CASH FLOWS FROM INVESTING ACTIVITIESInvestment earnings (losses) 45,547 78,358 27,035 25,196
Net cash provided (used) in investing activities 45,547 78,358 27,035 25,196
NET INCREASE (DECREASE) INCASH AND CASH EQUIVALENTS 239,311 744,619 2,050,806 (681,026)
CASH BALANCE AT BEGINNING OF YEAR - RESTATED 9,605,144 16,571,084 5,893,974 5,262,173
CASH BALANCE AT END OF YEAR $ 9,844,455 $ 17,315,703 $ 7,944,780 $ 4,581,147
Reconciliation of operating income (loss) to
net cash used by operating activities:
Operating income (loss) $ (247) $ 1,367,168 $ 1,976,454 $ (1,851,080)
Adjustments to reconcile
operating income (loss) to net
cash provided by operations:
Depreciation expense - 1,627,174 374,732 -
Decrease (increase) in receivables - 50,182 (263) 54,173
Decrease (increase) in inventories - (13,103) - -
Increase (decrease) in current payables - 109,172 (138,999) 57,525
Increase (decrease) in accrued liabilities - 24,370 (36,384) 12,478
Decrease (increase) in receivable from other funds - (46,510) 3 2,942
Increase (decrease) in payables due to other funds - (391,705) (49,606) 22,148
Increase (decrease) in claims and judgments payable - - 846,000
Increase (Decrease) in pension liability (29,583)
Total adjustments - 1,329,997 149,483 995,266
Net cash provided (used) by operating activities $ (247) $ 2,697,165 $ 2,125,937 $ (855,814)
Non cash investing, financing and capital activities
Contribution of capital assets from government $ - $ 382,758 $ - $ -
Net change in fair value of investments (296) (2,267) (2,203) (1,267)
158

CITY OF VANCOUVERCOMBINING STATEMENT OF CASH FLOWSINTERNAL SERVICE FUNDSFor the Year Ended December 31, 2015
Internal Administrative
Services BenefitsSelf-Insured
Health Insurance Mail ServicesTotal Internal
Service Funds
CASH FLOWS FROM OPERATING ACTIVITIESCash received from customers $ 11,347,671 $ 10,098,708 $ 6,855,415 $ 252,277 $ 42,771,358 Cash received from other operating activities 105 - - - 1,004 Cash payment for goods and services (2,682,163) (9,076,412) (5,008,550) (73,324) (23,164,290) Internal activity - payments to other funds (1,192,527) (64,750) - (46,601) (2,849,766) Cash payments to employees (7,232,855) (17,021) - (72,618) (9,703,910)
Net cash provided (used) by operating activities 240,231 940,525 1,846,865 59,734 7,054,396
CASH FLOWS FROM NONCAPITALFINANCING ACTIVITIES
Receipt of grant funds - - 142,480 Transfers from other funds 2,469,300 - 2,058,502 - 6,327,802 Transfers to other funds (1,080) (2,058,502) (3,665,571)
Net cash used by noncapital financing activities 2,468,220 (2,058,502) 2,058,502 - 2,804,711
CASH FLOWS FROM CAPITAL ANDRELATED FINANCING ACTIVITIES
Purchase of capital assets - - - - (2,225,140) Proceeds from sale of capital assets - - - - 99,182
Net cash provided (used) by capital andrelated financing activities - - - - (2,125,958)
CASH FLOWS FROM INVESTING ACTIVITIESInvestment earnings (losses) 10,423 13,939 7,429 818 208,745
Net cash provided (used) in investing activities 10,423 13,939 7,429 818 208,745
NET INCREASE (DECREASE) INCASH AND CASH EQUIVALENTS 2,718,874 (1,104,038) 3,912,796 60,552 7,941,894
CASH BALANCE AT BEGINNING OF YEAR - RESTATED 599,058 2,972,709 - 157,444 41,061,586
CASH BALANCE AT END OF YEAR $ 3,317,932 $ 1,868,671 $ 3,912,796 $ 217,996 $ 49,003,480
Reconciliation of operating income (loss) to
net cash used by operating activities:
Operating income (loss) $ (215,036) $ 790,751 $ 1,948,629 $ 55,393 $ 4,072,032
Adjustments to reconcile
operating income (loss) to net
cash provided by operations:
Depreciation expense - - - 3,470 2,005,376
Decrease (increase) in receivables - 189,091 (256,085) - 37,098
Decrease (increase) in inventories - - - - (13,103)
Increase (decrease) in current payables 323,638 (10,160) 154,321 208 495,705
Increase (decrease) in accrued liabilities 388,119 - - 1,093 389,676
Decrease (increase) in receivable from other funds (140,015) 6,405 - - (177,175)
Increase (decrease) in payables due to other funds - (35,562) - (430) (455,155)
Increase (decrease) in claims and judgments payable - - - - 846,000
Increase (Decrease) in pension liability (116,475) (146,058)
Total adjustments 455,267 149,774 (101,764) 4,341 2,982,364
Net cash provided (used) by operating activities $ 240,231 $ 940,525 $ 1,846,865 $ 59,734 $ 7,054,396
Non cash investing, financing and capital activities
Contribution of capital assets from government $ - $ - $ - $ - $ 382,758
Net change in fair value of investments (920) (514) (1,085) (60) (8,612)
159
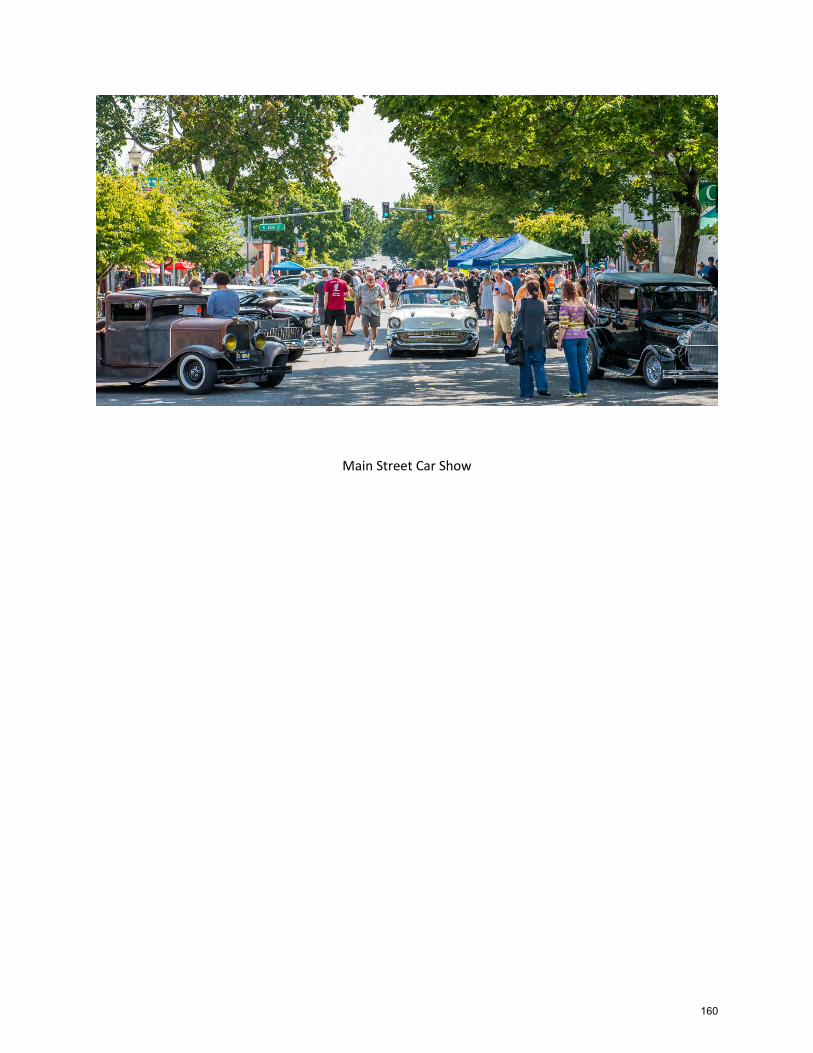
Main Street Car Show
160

Fiduciary Funds
Trust Funds are used to account for assets held in a trustee capacity, and Agency Funds are used to account for individuals, private organizations, other governments, and/or other funds. Such funds are classified as Pension Trust, Non-Expendable Trust, Expendable Trust, Agency, and Clearing Funds. Though Trust Funds normally do not require a budget, the city does budget annually the Police and Fire Pension Funds in order to comply with state mandated expenditure controls. Trust Funds Police Pension Fund The Police Pension Fund is supported by annual contributions from the General Fund. Expenditures are for retired uniformed personnel pensions, their medical expenses, and expense of prescription drugs for currently employed uniformed personnel. The state assumed a major portion of pension expense for retirees terminating after March 1, 1970.
Fire Pension Fund The Firemen’s Pension Fund is supported by annual contributions and interest earnings from monies in the trust fund. Expenditures are for retired uniformed personnel pensions, their medical expenses and expense of prescription drugs for currently employed uniformed personnel. The state assumed a major portion of pension expense for retirees terminating after March 1, 1970. Agency Funds PEG Capital Support Fund The PEG Capital Support Fund was established in 1999. The fund receives franchise fees collected from City of Vancouver and Clark County cable television subscribers, and awards grants to designated public, educational and governmental access providers. The City acts as the collection and disbursing agent on behalf of the City of Vancouver and Clark County.
161

FIDUCIARY FUNDSPENSION TRUST FUNDS
Police Pension Fire Pension
Total Fiduciary Pension Trust
FundsASSETS
Cash, cash equivalents $ 1,993,609 $ 2,275,772 $ 4,269,381
Investments (at fair value)Certificates of Deposit - 1,031,720 1,031,720 Federal Agency Coupon Securities - 1,974,260 1,974,260 Corporate Bond - 3,146,299 3,146,299
Receivables (net):Accounts 5,810 - 5,810 Interest - 42,426 42,426
Prepaid expenses 30,000 30,000 60,000
TOTAL ASSETS $ 2,029,419 $ 8,500,477 $ 10,529,896
LIABILITIES
$ 574 $ 6,783 $ 7,357
TOTAL LIABILITIES 574 6,783 7,357
NET POSITIONPension benefits $ 2,028,845 $ 8,493,694 $ 10,522,539
Accounts and accrued employee payables
CITY OF VANCOUVERCOMBINING STATEMENT OF NET POSITION
December 31, 2015
162

FIDUCIARY FUNDAGENCY FUND
PEG Capital Support
ASSETSCash and cash equivalents $ 801,450 Receivables (net):
Accounts 185,335 Interest 775
TOTAL ASSETS $ 987,560
LIABILITIES$ 7,352
Custodial accountsDue to other governmental units from restricted assets 980,208
TOTAL LIABILITIES $ 987,560
Accounts and accrued employee payables
CITY OF VANCOUVERCOMBINING STATEMENT OF ASSETS & LIABILITIES
December 31, 2015
163
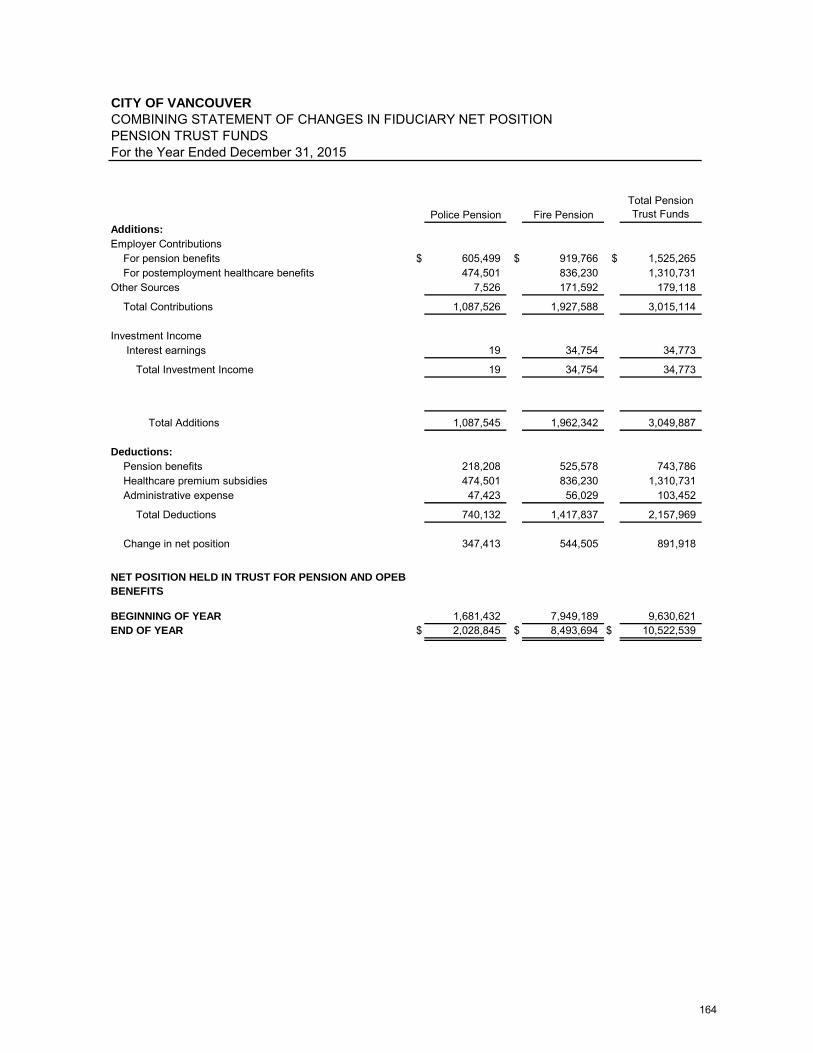
CITY OF VANCOUVERCOMBINING STATEMENT OF CHANGES IN FIDUCIARY NET POSITIONPENSION TRUST FUNDS
Police Pension Fire PensionTotal Pension Trust Funds
Additions: Employer Contributions
For pension benefits $ 605,499 $ 919,766 $ 1,525,265 For postemployment healthcare benefits 474,501 836,230 1,310,731
Other Sources 7,526 171,592 179,118
Total Contributions 1,087,526 1,927,588 3,015,114
Investment Income Interest earnings 19 34,754 34,773
Total Investment Income 19 34,754 34,773
Total Additions 1,087,545 1,962,342 3,049,887
Deductions:Pension benefits 218,208 525,578 743,786 Healthcare premium subsidies 474,501 836,230 1,310,731 Administrative expense 47,423 56,029 103,452
Total Deductions 740,132 1,417,837 2,157,969
Change in net position 347,413 544,505 891,918
BEGINNING OF YEAR 1,681,432 7,949,189 9,630,621 END OF YEAR $ 2,028,845 $ 8,493,694 $ 10,522,539
For the Year Ended December 31, 2015
NET POSITION HELD IN TRUST FOR PENSION AND OPEB BENEFITS
164

CITY OF VANCOUVERSTATEMENT OF CHANGES IN ASSETS AND LIABILITIESAGENCY FUNDFor The Year Ended December 31, 2015
Balance Balance01/01/15 Additions Deductions 12/31/15
PEGAssets
Cash and cash equivalents $ 1,008,185 $ 755,730 $ 962,465 $ 801,450 Accounts Receivable 185,292 185,335 185,292 185,335 Interest receivable 1,735 775 1,735 775
Total assets $ 1,195,212 $ 941,840 $ 1,149,492 $ 987,560
LiabilitiesAccounts and accrued employee payables $ 156,501 $ 415,335 $ 564,484 $ 7,352 Due to other governmental units 1,038,711 747,910 806,413 980,208
Total liabilities $ 1,195,212 $ 1,163,245 $ 1,370,897 $ 987,560
165

Out and about even on a rainy morning
166

Statistical Section
167

Statistical Section This part of the City of Vancouver’s (The City) comprehensive annual financial report presents detailed information as a context for understanding what the information in the financial statements, note disclosures, and required supplementary information says about the City’s overall financial health. Contents Page Financial Trends 169
These schedules contain trend information to help the reader understand how the City’s financial performance and well-being have changed over time.
Revenue Capacity 178
These schedules contain information to help the reader assess the City’s most significant local revenue source, property taxes.
Debt Capacity 183
These schedules present information to help the reader assess the affordability of the City’s current levels of outstanding debt and the City’s ability to issue additional debt in the future.
Demographic and Economic Information 188
These schedules offer demographic and economic indicators to help the reader understand the environment within which the City’s financial activities take place.
Operating Information 191
These schedules contain service and infrastructure data to help the reader understand how the information in the City’s financial report relates to the services the City provides and the activities it performs.
Sources: Unless otherwise noted, the information in these schedules is derived from the comprehensive annual financial reports for the relevant year. Note: Amounts are presented using the full accrual basis of accounting unless otherwise noted.
168
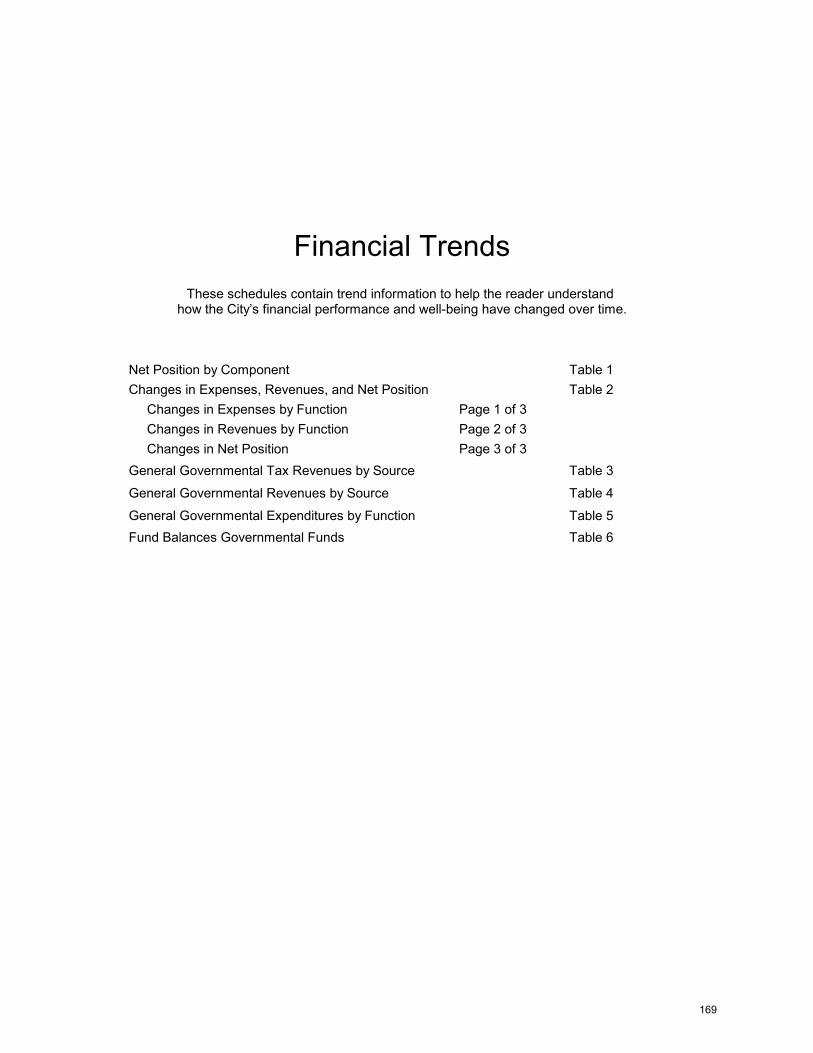
Net Position by Component Table 1Changes in Expenses, Revenues, and Net Position Table 2
Changes in Expenses by Function Page 1 of 3Changes in Revenues by Function Page 2 of 3Changes in Net Position Page 3 of 3
General Governmental Tax Revenues by Source Table 3
General Governmental Revenues by Source Table 4
General Governmental Expenditures by Function Table 5Fund Balances Governmental Funds Table 6
Financial TrendsThese schedules contain trend information to help the reader understand
how the City’s financial performance and well-being have changed over time.
169
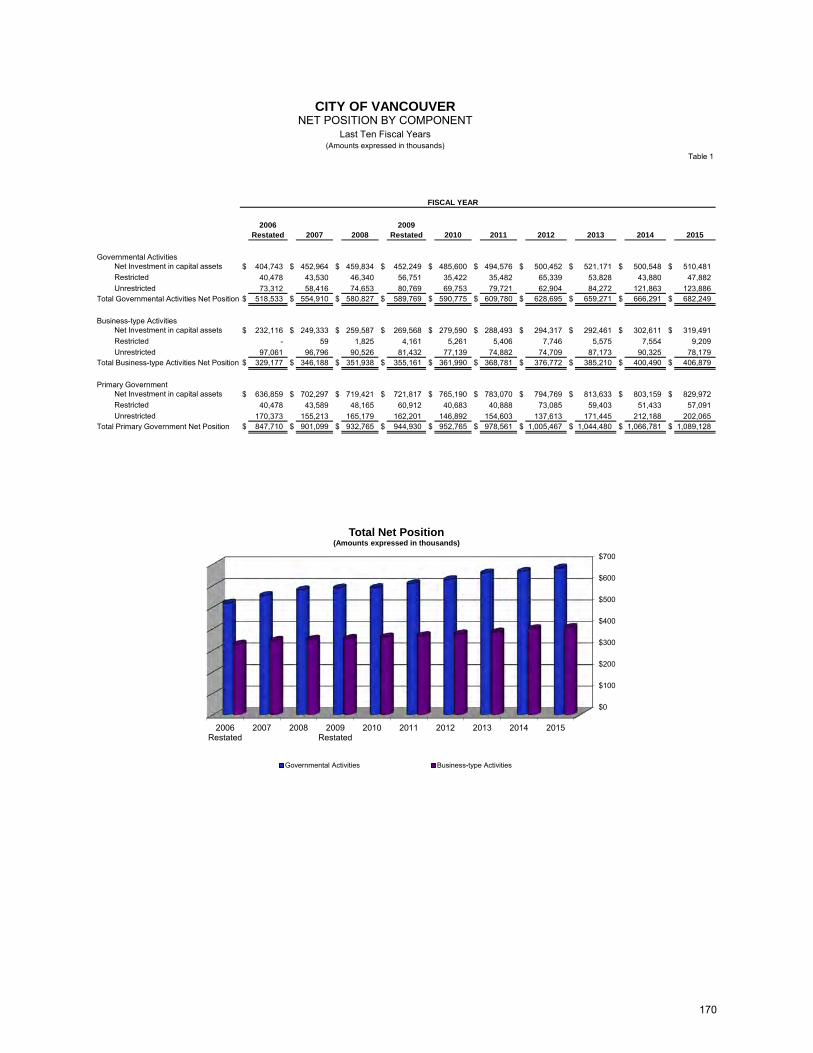
Table 1
2006Restated 2007 2008
2009Restated 2010 2011 2012 2013 2014 2015
Governmental ActivitiesNet Investment in capital assets $ 404,743 $ 452,964 $ 459,834 $ 452,249 $ 485,600 $ 494,576 $ 500,452 $ 521,171 $ 500,548 $ 510,481 Restricted 40,478 43,530 46,340 56,751 35,422 35,482 65,339 53,828 43,880 47,882 Unrestricted 73,312 58,416 74,653 80,769 69,753 79,721 62,904 84,272 121,863 123,886
Total Governmental Activities Net Position $ 518,533 $ 554,910 $ 580,827 $ 589,769 $ 590,775 $ 609,780 $ 628,695 $ 659,271 $ 666,291 $ 682,249
Business-type ActivitiesNet Investment in capital assets $ 232,116 $ 249,333 $ 259,587 $ 269,568 $ 279,590 $ 288,493 $ 294,317 $ 292,461 $ 302,611 $ 319,491 Restricted - 59 1,825 4,161 5,261 5,406 7,746 5,575 7,554 9,209Unrestricted 97,061 96,796 90,526 81,432 77,139 74,882 74,709 87,173 90,325 78,179
Total Business-type Activities Net Position $ 329,177 $ 346,188 $ 351,938 $ 355,161 $ 361,990 $ 368,781 $ 376,772 $ 385,210 $ 400,490 $ 406,879
Primary GovernmentNet Investment in capital assets $ 636,859 $ 702,297 $ 719,421 $ 721,817 $ 765,190 $ 783,070 $ 794,769 $ 813,633 $ 803,159 $ 829,972Restricted 40,478 43,589 48,165 60,912 40,683 40,888 73,085 59,403 51,433 57,091Unrestricted 170,373 155,213 165,179 162,201 146,892 154,603 137,613 171,445 212,188 202,065
Total Primary Government Net Position $ 847,710 $ 901,099 $ 932,765 $ 944,930 $ 952,765 $ 978,561 $ 1,005,467 $ 1,044,480 $ 1,066,781 $ 1,089,128
FISCAL YEAR
CITY OF VANCOUVERNET POSITION BY COMPONENT
Last Ten Fiscal Years(Amounts expressed in thousands)
$0
$100
$200
$300
$400
$500
$600
$700
2006Restated
2007 2008 2009Restated
2010 2011 2012 2013 2014 2015
Total Net Position (Amounts expressed in thousands)
Governmental Activities Business-type Activities
170

Table 2Page 1 of 3
2006 2007 2008 2009 2010 2011 2012 2013 2014 2015Expenses Governmental Activities:
General Government 25,840$ 27,030$ 27,457$ 26,611$ 36,530$ 25,992$ 24,741$ 20,448$ 23,192$ 19,325$
Security Persons & Property 59,408 68,036 67,999 70,266 68,995 65,156 67,724 70,511 73,922 78,427
Physical Environment 34 448 564 530 521 315 474 515 474 667
Transportation 23,554 32,684 34,934 30,588 30,895 26,830 29,713 33,012 29,205 34,932
Mental and Physical Health 294 494 319 355 384 265 386 339 369 375
Economic Environment 7,796 7,977 8,810 10,013 11,096 9,201 8,389 7,132 7,657 8,954
Culture and Recreation 18,486 19,403 20,917 18,924 18,033 12,773 10,924 11,796 11,258 9,989
Interest on Long-Term Debt 3,858 4,028 4,109 4,590 4,566 4,933 4,747 4,506 3,963 3,542
Total Governmental Activities Expenses 139,270 160,100 165,109 161,877 171,020 145,465 147,098 148,259 150,040 156,211
Business-type Activities:
Water/Sewer 63,660 67,215 70,344 71,886 70,561 71,883 73,306 75,592 75,245 82,687
Parking 3,892 3,440 3,830 3,772 3,572 3,637 3,372 2,964 2,902 2,974
Airpark 605 591 671 575 581 702 697 586 631 650
Building Inspection 4,261 6,087 5,928 4,755 4,298 3,764 3,642 3,761 4,180 5,174
Solid Waste 4,031 4,174 4,592 3,899 1,825 2,006 1,912 2,132 2,076 2,279
Tennis Center 1,181 1,104 1,164 1,143 1,072 1,033 1,124 1,036 1,076 1,103
Fire Shop 964 1,013 968 980 921 - - - - -
Total Business-type Activities Expenses 78,594 83,624 87,496 87,010 82,830 83,025 84,053 86,071 86,110 94,867
Total Primary Government Expenses 217,864$ 243,724$ 252,606$ 248,887$ 253,850$ 228,490$ 231,151$ 234,330$ 236,150$ 251,078$
FISCAL YEAR
CITY OF VANCOUVERChanges in Expenses by Function
Last Ten Fiscal Years(Amounts expressed in thousands)
87.2%
3.2%
0.7% 5.3%
2.4% 1.2%
2015 Business-type Expenses
87.2%, Water/Sewer 3.2%, Parking 0.7%, Airpark
5.3%, Building Inspection 2.4%, Solid Waste 1.2%, Tennis Center
12.4% 50.2%
0.4% 22.4% 0.2% 5.7%
6.4%
2.3%
2015 Governmental Expenses
12.4%, General Government 50.2%, Security Persons & Property
0.4%, Physical Environment 22.4%, Transportation
0.2%, Mental and Physical Health 5.7%, Economic Environment
6.4%, Culture and Recreation 2.3%, Interest on Long-Term Debt
171

Table 2Page 2 of 3
2006 2007 2008 2009 2010 2011 2012 2013 2014 2015
Program Revenues Governmental Activities:
Charges for Services, Fees, Fines & Forfeitures
General Government 8,113$ 14,715$ 12,070$ 12,715$ 20,732$ 10,733$ 10,432$ 9,169$ 6,613$ 11,870$
Security Persons & Property 9,650 11,244 11,186 11,557 10,920 10,923 11,681 13,101 11,911 12,342
Physical Environment 89 125 103 119 108 127 161 1,944 108 132 Transportation 5,157 3,571 4,171 1,717 1,117 2,343 1,073 3,792 5,115 8,634
Mental & Physical Health - 47 - - - - - - - -
Economic Environment 4,008 8,905 5,356 4,855 5,022 3,641 3,111 333 890 2,939
Culture and Recreation 11,112 5,055 6,933 6,022 6,178 5,303 7,234 5,789 6,929 4,615
Operating Grants and Contributions 3,289 4,748 7,252 11,426 9,915 6,942 7,419 6,257 3,625 4,712
Capital Grants and Contributions 10,724 32,443 22,771 13,057 6,646 14,175 9,474 28,745 12,981 22,186
Total Governmental Activities Revenues 52,142 80,853 69,841 61,468 60,639 54,187 50,585 69,130 48,172 67,430
Business-type Activities:
Charges for Services
Water/Sewer 59,938 63,158 63,779 67,994 67,424 70,000 73,410 76,983 80,904 86,785
Parking 1,876 2,211 1,899 2,116 2,060 2,129 2,082 2,146 1,771 2,005
Airpark 529 573 609 609 622 630 621 628 697 690
Building Inspection 5,128 5,597 4,717 3,820 4,438 4,057 4,021 4,703 3,654 4,566
Solid Waste 5,327 5,690 5,498 2,542 2,996 3,286 2,805 2,558 2,275 1,718
Tennis Center 860 905 863 873 816 867 954 878 856 818
Fire Shop 1,118 1,052 966 1,063 978 - - - - -
Operating Grants and Contributions - 270 89 19 242 625 442 323 1 233
Capital Grants and Contributions 14,609 14,934 11,467 8,430 5,231 5,425 6,737 9,873 8,771 14,909
Total Business-type Activities Revenues 89,385 94,390 89,887 87,465 84,807 87,020 91,072 98,092 98,928 111,724
Total Primary Government Revenues 141,527$ 175,243$ 159,729$ 148,933$ 145,446$ 141,207$ 141,658$ 167,222$ 147,100$ 179,154$
FISCAL YEAR
Changes in Revenues by FunctionLast Ten Fiscal Years
(Amounts expressed in thousands)
CITY OF VANCOUVER
77.7%
1.8% 0.6%
4.1%
1.5% .7%
.0% 0.2% 13.4%
2015 Business-type Revenues
77.7%, Water/Sewer 1.8%, Parking0.6%, Airpark 4.1%, Building Inspection1.5%, Solid Waste 0.7%, Tennis Center0%, Fire Shop 0.2%, Operating Grants and Contributions13.4%, Capital Grants and Contributions
17.6%
18.3%
0.3%
12.8% 0.0%
4.3% 6.8%
6.9%
33.0%
2015 Governmental Revenues
17.6%, General Government 18.3%, Security Persons & Property
0.3%, Physical Environment 12.8%, Transportation
0%, Mental & Physical Health 4.3%, Economic Environment
6.8%, Culture and Recreation 6.9%, Operating Grants and Contributions
33%, Capital Grants and Contributions
172

Table 2
Page 3 of 3
2006 2007 2008 2009 2010 2011 2012 2013 2014 2015Net (Expense)/Revenue
Governmental Activities (87,128)$ (79,247)$ (95,268)$ (100,409)$ (110,381)$ (91,278)$ (96,512)$ (79,129)$ (101,868)$ (88,781)$
Business-type Activities 10,791 10,766 2,391 456 1,977 3,995 7,019 12,021 12,818 16,857
(76,337)$ (68,481)$ (92,877)$ (99,953)$ (108,404)$ (87,283)$ (89,493)$ (67,108)$ (89,050)$ (71,924)$
General Revenues and Other Changes in Net Position
Governmental Activities:
Taxes 105,133$ 106,494$ 100,670$ 107,397$ 107,992$ 112,298$ 112,816$ 119,075$ 124,193$ 125,174$ Intergovernmental Revenues not
2,608 2,863 7,100 - - - - - - -
Investment Earnings 4,822 6,094 4,926 2,271 1,312 1,096 799 462 838 1,031
Miscellaneous 6 939 114 - 1,980 2 2,410 530 296 535
Transfers (789) (767) (1,056) (1,362) (163) (2,258) (1,167) (1,099) (1,148) (1,443)
Extraordinary Item - - - - - - - (10,699) 0 0
Total Governmental Activities 111,780 115,623 111,754 108,306 111,121 111,139 114,858 108,270 124,179 125,297
Business-type Activities:
Investment Earnings 4,557 5,294 4,076 1,613 840 670 516 316 518 644
Miscellaneous - 185 23 454 53 46 51 1,052 110 2,694
Special Item - - - - - - - (3,682) - -
Transfers 789 767 1,056 1,362 163 2,258 1,167 1,099 1,148 1,442
Total Business-type Activities 5,346 6,246 5,155 3,430 1,056 2,973 1,735 (1,215) 1,776 4,780 Total Primary Government 117,126$ 121,869$ 116,909$ 111,736$ 112,177$ 114,112$ 116,592$ 107,055$ 125,955$ 130,077$
Change in Net Position
Governmental Activities 24,652$ 36,376$ 16,486$ 7,897$ 740$ 19,860$ 18,345$ 29,141$ 22,311$ 36,516$
Business-type Activities 16,137 17,012 7,546 3,886 3,034 6,969 8,754 10,805 14,594 21,637
Total Primary Government 40,789$ 53,388$ 24,032$ 11,783$ 3,774$ 26,829$ 27,099$ 39,946$ 36,905$ 58,153$
Restricted to a specific program
Total Primary Government Net (Expense)/Revenue
FISCAL YEAR
(Amounts expressed in thousands)
CITY OF VANCOUVERChanges in Net Position
Last Ten Fiscal Years
$-
$10,000
$20,000
$30,000
$40,000
2006 2007 2008 2009 2010 2011 2012 2013 2014 2015
Total Change in Net Position
Governmental Change in Net Position Business-type Change in Net Position
173

Table 3
Fiscal Year Property Taxes Sales and Use Taxes Other Taxes Total Taxes
2006 34,928 30,118 40,027 105,0732007 36,488 33,262 34,471 104,2212008 37,661 29,380 33,333 100,3752009 38,803 27,327 34,373 100,5032010 39,404 28,208 33,807 101,4202011 40,334 31,342 34,521 106,197 2012 40,948 26,735 38,901 106,584 2013 42,133 29,060 41,819 113,012 2014 43,344 31,299 43,390 118,033 2015 44,231 35,034 46,097 125,362
CITY OF VANCOUVERGENERAL GOVERNMENTAL TAX REVENUES BY SOURCE
Last Ten Fiscal Years(Modified accrual basis of accounting)
(Amounts expressed in thousands)
10,000
15,000
20,000
25,000
30,000
35,000
40,000
45,000
50,000
2006 2007 2008 2009 2010 2011 2012 2013 2014 2015
Tax Revenues by Source
Property Taxes Sales and Use Taxes Other Taxes
35.3% Property Taxes
28% Sales and Use Taxes
36.7% Other Taxes
2015 Tax Revenues by Source
174

Table 4
Fiscal Year Taxes
Licenses and
Permits
Inter-govern-mental
Charges for
ServicesFines and Penalties Miscellaneous
Total Revenues
Capital Related
Debt Issued
Sale of Capital Assets
Net Transfers In (Out)
Financing Sources (Uses)
Total Revenues and Other Sources
2006 $ 105,073 $ 1,465 $ 25,906 $ 22,779 $ 1,715 6,676$ 163,614$ 16,578$ 2$ (2,039)$ 14,541$ 178,155$ 2007 104,221 1,243 33,858 27,606 2,153 8,691 177,772 1,100 2,971 (3,892) 179 177,951 2008 100,375 3,656 38,038 24,064 1,995 6,333 174,460 14,634 1,094 (2,131) 13,597 188,057 2009 100,503 3,604 35,437 19,334 1,834 4,173 164,885 13,480 192 (2,276) 11,396 176,280 2010 101,419 3,527 31,094 19,422 1,649 5,919 163,031 14,439 501 (673) 14,267 177,298 2011 106,197 3,610 34,089 14,787 1,592 4,719 164,995 10,988 54 (2,648) 8,394 173,390 2012 106,584 3,842 27,797 15,402 1,657 5,598 160,880 172 320 (1,167) (675) 160,205 2013 113,012 3,853 20,343 24,756 1,487 6,107 169,557 1,496 100 (8,899) (7,303) 162,254 2014 118,033 3,713 18,041 24,939 1,786 6,592 173,104 312 (380) (7,522) (7,590) 165,514 2015 125,362 4,579 17,795 22,428 1,566 7,465 179,195 4,772 331 (3,771) 1,331 180,527
OTHER FINANCING SOURCES (USES)REVENUES
CITY OF VANCOUVERGENERAL GOVERNMENTAL REVENUES BY SOURCE
Last Ten Fiscal Years(Modified accrual basis of accounting)
(Amounts expressed in thousands)
69.9%
2.6%
9.9%
12.5%
0.9% 4.2%
2015 General Governmental Revenues by Source
69.9%, Taxes 2.6%, Licenses and Permits9.9%, Intergovernmental 12.5%, Charges for Services0.9%, Fines and Penalties 4.2%, Miscellaneous
100,000
120,000
140,000
160,000
180,000
200,000
2006 2007 2008 2009 2010 2011 2012 2013 2014 2015
Total General Governmental Revenues (Amounts expressed in thousands)
175

Table 5
Principal Interest
2006 23,799$ 59,149$ 493$ 19,357$ 7,586$ 294$ 14,508$ 31,002$ 3,304$ 3,666$ 163,158$ 14,997$ (83)$ 14,914$ 5.27%2007 25,873 65,745 457 20,794 7,377 500 16,894 32,986 3,767 4,090 178,483 (532) - (532) 5.39%2008 26,730 66,844 955 22,196 8,781 318 15,979 25,455 4,574 4,339 176,171 11,886 993 12,879 5.87%2009 25,362 69,006 528 18,931 9,132 392 16,275 16,681 5,720 4,664 166,690 (2,203) 344 (1,859) 7.03%2010 24,789 66,356 536 15,624 10,239 384 14,082 38,431 6,111 4,717 181,269 (3,971) (99) (4,070) 7.25%2011 25,051 64,092 301 13,573 8,734 265 9,814 25,261 6,277 5,039 158,407 14,983 (102) 14,881 8.61%2012 24,355 66,523 474 11,993 7,798 386 8,485 21,438 7,167 4,903 153,522 6,683 139 6,822 8.86%2013 24,485 71,083 504 13,125 6,434 339 9,672 24,564 7,366 4,534 162,105 (10,549) 2,325 (8,224) 8.65%2014 26,300 72,668 537 14,143 6,843 369 7,240 13,506 7,673 4,251 153,530 11,984 309 12,294 8.45%2015 19,597 80,813 616 14,868 9,026 375 10,531 18,834 10,226 3,961 168,846 12,006 103 12,109 9.45%
Changes in fund balance nets the results of Tables 5 and 6.
(Amounts expressed in thousands)
CITY OF VANCOUVERGENERAL GOVERNMENTAL EXPENDITURES BY FUNCTION
AND CHANGES IN FUND BALANCELast Ten Fiscal Years
(Modified accrual basis of accounting)
Debt Service % of
Non-capital Expenditures
(restated)
Culture and
RecreationEconomic
Environment Debt Service Fiscal
YearGeneral
Government
Security of Persons & Property
Physical Environment
Capital Projects
Mental and Physical Health
Total Expenditures
Total Change in Fund Balance
Other Changes in
Fund Balance
Net Changes in
Fund BalanceTransportation
$135,000 $140,000 $145,000 $150,000 $155,000 $160,000 $165,000 $170,000 $175,000 $180,000 $185,000
2006 2007 2008 2009 2010 2011 2012 2013 2014 2015
Total General Governmental Expenditures
11.6% - General Government
8.4% - Debt Service
47.9% Security of Persons &
Property
0.4% Physical Environment
8.8% - Transportation
5.3% - Economic Environment
.2% - Mental and Physical Health
6.2% - Cultural and Recreation
11.2% Capital Projects
2015 Total General Governmental Expenditures by Function
176

Table 6
2006 2007 2008 2009 2010 2011 2012 2013 2014 2015
General FundReserved 2,228,016$ 10,134,641$ 2,796,253$ 1,061,735$ 955,735$ Unreserved 21,184,989 14,161,873 22,193,539 27,125,784 32,395,545
* Nonspendable 415,377$ 913,400$ 228,400$ 236,595$ 316,748$ * Restricted 889,198 1,064,707 241,331 152,808 78,647 * Committed - 40,276,519 41,095,993 43,119,624 44,944,108 * Assigned 34,528,923 3,893,165 4,148,166 4,156,542 3,787,063 * Unassigned 36,861,898 4,788,967 12,787,935 13,911,641 7,896,174
Total General Fund 23,413,005$ 24,296,514$ 24,989,792$ 28,187,519$ 33,351,280$ 72,695,396$ 50,936,758$ 58,501,825$ 61,577,210$ 57,022,740$
All Other Governmental FundsReserved 36,691$ 9,036$ 4,799$ 3,151,350$ 28,128,422$ Unreserved
Special Revenue Funds 50,760,088 54,532,614 55,411,540 50,693,960 23,933,985 Capital Project Funds 19,354,430 14,173,948 25,483,759 33,810,705 26,359,262 Debt Service Funds - 19,323 20,379 1,518 1,560
* Nonspendable 63,930,034$ 10,367,595$ 10,761,381$ 37,707$ 7,593$ * Restricted 12,495,574 59,540,775 42,102,683 48,493,146 57,101,943 * Committed 3,105,111 10,262,185 10,749,039 17,385,057 15,097,234 * Assigned - 2,370,033 3,138,231 10,053,891 20,426,917 * Unassigned 89,793,362 - - - -
Total All Other Governmental Funds 70,151,209$ 68,734,921$ 80,920,476$ 87,657,533$ 78,423,229$ 169,324,081$ 82,540,588$ 66,751,334$ 75,969,801$ 92,633,687$
Total Fund Balance Governmental Funds 93,564,214$ 93,031,435$ 105,910,269$ 115,845,052$ 111,774,509$ 242,019,477$ 133,477,346$ 125,253,159$ 137,547,011$ 149,656,427$
* The City implemented GASB 54 in 2011.
CITY OF VANCOUVERFUND BALANCES GOVERNMENTAL FUNDS
Last Ten Fiscal Years(Modified accrual basis of accounting)
$-
$10,000,000
$20,000,000
$30,000,000
$40,000,000
$50,000,000
$60,000,000
$70,000,000
$80,000,000
2006 2009 2012 2015
Fund Balances Governmental Funds
Total General Fund Total All Other Governmental Funds
1% Nonspendable
38% Restricted
40% Committed
16% Assigned
5% Unassigned
2015 Governmental Fund Balances
1% Nonspendable Governmental Funds38% Restricted Governmental Funds40% Committed Governmental Funds16% Assigned Governmental Funds5% Unassigned Governmental Funds
177

Assessed and Estimated Actual Value of Taxable Property Table 7Property Tax Rates - Direct and Overlapping Governments Table 8Property Tax Levies and Collections Table 9Principal Property Tax Payers Table 10
Revenue CapacityThese schedules contain information to help the reader assess the City’s
most significant local revenue source, property taxes.
178

Table 7
Ratio of Total Total Personal Less: Total Direct Assessed
Assessed Property Exemptions Tax Rate Value to Assessed Collection Value of Real Assessed Real Assessed Estimated per $1000 of Estimated
Year Year Residential Commercial Industrial Property Value Property Value Actual Value Assessed Value Actual Value (b)
2006 2007 11,208,991$ 2,253,933$ 802,692$ 14,265,616$ 595,260$ 125,827$ 14,735,049$ 15,827,120$ 2.45 93.1%2007 2008 11,506,945 3,511,234 1,230,956 16,249,135 703,435 128,249 16,824,321 17,691,189 2.26 95.1%2008 2009 11,801,001 3,274,472 1,136,600 16,212,073 810,254 127,308 16,895,019 18,225,479 2.32 92.7%2009 2010 10,535,645 3,092,670 932,112 14,560,427 823,680 165,765 15,218,341 16,559,675 2.57 91.9%2010 2011 9,702,583 2,658,791 809,992 13,171,366 713,480 166,647 13,718,199 14,959,868 2.90 91.7%2011 2012 9,497,266 2,681,228 812,821 12,991,316 712,908 167,377 13,536,847 14,416,238 2.99 93.9%2012 2013 8,914,482 2,714,244 895,670 12,524,396 697,870 162,939 13,059,327 14,102,945 3.17 92.6%2013 2014 9,874,748 2,824,685 918,608 13,618,040 708,137 168,760 14,157,417 14,778,097 3.02 95.8%2014 2015 11,248,985 2,878,956 944,978 15,072,920 739,235 173,478 15,638,677 16,172,365 2.80 96.7%2015 2016 12,153,668 2,929,835 934,561 16,018,064 805,156 136,567 16,686,654 17,436,420 2.67 95.7%
(a) The breakdown of Real Property became available 2005. Data from prior years is not available. (b) Ratio was provided by State of Washington Department of Revenue, Research and Statistics for Clark County.
Source: Clark County Department of Assessment and GIS
Note: The Clark County Treasurer acts as an agent to collect property taxes levied in the county for all taxing authorities. Taxes are levied annually before December 15, and become a lien as of January 1, on property value listed as of the prior May 31. Assessed values are established by the Clark County Assessor at 100 percent of fair market value. A revaluation of all property is required every six years.
Assessed Value (a) TotalReal Property
CITY OF VANCOUVERASSESSED AND ESTIMATED ACTUAL VALUE OF TAXABLE PROPERTY
Last Ten Fiscal Years(Amounts expressed in thousands)
Residential 72%
Commercial 17%
Industrial 6%
Personal Property 5%
2015 Assessed Value of Property for Collections in 2016
179

Table 8
Assessed Year
Collection Year General Fund
General Obligation
Total Direct Tax Rate
School Districts (a)
Port of Vancouver Clark County
State of Washington
Public Library Parks
Total Overlapping
Tax Rate
2006 2007 2.45 - 2.45 4.10 0.34 1.22 2.18 0.36 8.202007 2008 2.26 - 2.26 3.90 0.31 1.13 1.92 0.38 0.21 7.862008 2009 2.32 - 2.32 3.95 0.32 1.18 1.89 0.39 0.22 7.952009 2010 2.57 - 2.57 4.56 0.36 1.37 2.02 0.59 0.26 9.172010 2011 2.90 - 2.90 5.29 0.41 1.51 2.26 0.75 0.27 10.472011 2012 2.99 - 2.99 5.52 0.40 1.55 2.36 0.75 0.27 10.862012 2013 3.17 - 3.17 6.05 0.44 1.64 2.49 0.76 0.16 11.532013 2014 3.02 - 3.02 5.82 0.40 1.52 2.35 0.74 0.25 11.082014 2015 2.80 - 2.80 5.39 0.36 1.40 2.22 0.71 0.23 10.312015 2016 2.67 - 2.67 5.20 0.34 1.33 2.08 0.67 0.21 9.83
(a) The School District tax rate is the weighted average of the districts within the City of Vancouver.
Overlapping rates are those of local and county governments that apply to property owners within the City of Vancouver. Not all overlapping rates apply to all Vancouver property owners.
Source: Clark County Department of Assessment and GIS
Direct Tax Rate Overlapping Tax Rate
CITY OF VANCOUVERPROPERTY TAX RATES - DIRECT AND OVERLAPPING GOVERNMENTS
Last Ten Fiscal Years(Per $1,000 of Assessed Value)
2.00
3.00
4.00
5.00
6.00
7.00
8.00
9.00
10.00
11.00
12.00
2007 2008 2009 2010 2011 2012 2013 2014 2015 2016
Direct & Overlapping Tax Rates by Collection Year
Direct Tax Rate Overlapping Tax Rate
General Fund 21.4%
School Districts 41.7%
Port of Vancouver
2.7% Clark County
10.6%
State of Washington
16.5%
Public Library 5.4%
Parks 1.7%
2015 Property Tax Rates as Percentage of Total
180

Table 9
Certified Direct Certified Collection OutstandingFiscal Taxable Tax Rate Total Tax of Delinquent % of Levy Delinquent Year Assessed Value General Fund Levy Amount % of Levy Tax Levy (a) Amount (a) Taxes
2006 12,098,366,000$ 2.90 35,071,590$ 34,108,734$ 97.3 730,563$ 34,839,297$ 99.3 1,106,201$ 2007 14,860,876,000 2.45 36,362,632 35,505,729 97.6 648,659 36,154,388 99.4 1,267,2152008 16,952,570,000 2.26 38,287,888 36,721,939 95.9 765,343 37,487,282 97.9 1,573,0182009 17,022,327,000 2.32 39,415,028 37,917,601 96.2 851,497 38,769,098 98.4 1,758,2652010 15,384,106,717 2.57 39,506,232 38,333,709 97.0 1,072,342 39,406,051 99.7 1,560,5602011 13,884,845,470 2.90 40,213,881 39,455,229 98.1 867,751 40,322,979 100.3 1,372,4752012 13,704,224,212 2.99 40,957,344 40,152,853 98.0 670,906 40,823,759 99.7 1,241,4272013 13,222,265,791 3.17 41,943,790 41,485,605 98.9 620,674 42,106,280 100.4 1,120,7332014 14,326,177,779 3.02 43,295,235 43,704,833 100.9 663,005 44,367,838 102.5 998,5902015 15,812,154,819 2.80 44,267,755 43,704,833 98.7 560,203 44,265,036 100.0 900,974
Source: City of Vancouver, Treasurer's Office
CITY OF VANCOUVERPROPERTY TAX LEVIES AND COLLECTIONS
Last Ten Fiscal Years
(a) Total collections include both current and delinquent taxed owed. It has not been practical to break out delinquent tax collections by assessment year, based on the way the information was presented to us by the tax assessor's office.
Collected within the Fiscal Year of the Levy Total Collections to Date
Note: Revenue received from taxes is recorded as revenue within the General Fund. General Obligation Debt are distributed to the various Debt Service Funds in full, as levied. Consequently, all prior year outstanding taxes are a potential revenue for the General Fund.
$-
$5,000
$10,000
$15,000
$20,000
$25,000
$30,000
$35,000
$40,000
$45,000
2006 2007 2008 2009 2010 2011 2012 2013 2014 2015
Certified Total Tax Levy and Collections (in thousands)
Certified Levy Collected within Year
181

Table 10
Taxpayer Type of Business
2005 Assessed
Taxable Value Rank
Percentage of Total Taxable
Assessed Value
2014 Assessed
Taxable Value Rank
Percentage of Total Taxable
Assessed Value
Columbia Tech Center LLC Property investment 143,716$ 2 1.19% 197,406$ 1 1.25%SEH America Microelectronic Mfg. 184,059 1 1.52% 185,750 2 1.17%Vancouver Mall Retail 53,773 7 0.44% 74,148 3 0.47%Comcast of WA/OR Mass Media 63,760 4 0.40%Wal-Mart Real Est Bus Trust Retail 47,486 10 0.39% 59,088 5 0.37%Frito Lay Inc. Food processing 56,426 5 0.47% 59,040 6 0.37%Vancouver Clinic Inc. PS Medical buildings 56,117 7 0.36%Mission Hills LLC Property investment 53,818 8 0.34%United Grain Corp Food processing 52,919 9 0.34%Holland Acquisition Co LLC Property investment 49,723 10 0.32%Hewlett Packard Computers & e-services 84,685 3 0.70%SW WA Medical Center Medical Buildings 73,893 4 0.61%Angelo Prop Company LP Property investment 55,142 6 0.46%Cafaro Northwest Ptnsp Property investment 49,838 8 0.41%Park Plaza Inc. Property investment 48,354 9 0.40%
Subtotal - Principal Property Tax Payers 797,372 6.59% 851,769 5.39%
All Other City Taxpayers 11,300,994 93.41% 14,960,386 94.61%
Total City Taxpayers 12,098,366$ 100.00% 15,812,155$ 100.00%
Assessed Taxable Value does not include exemptions for real propertySource: Clark County Department of Assessment and GIS
2006 2015
CITY OF VANCOUVERPRINCIPAL PROPERTY TAX PAYERS
Current Year and Nine Years Ago(Taxable value expressed in thousands)
Microelectronic Mfg. 21.8%
Property Investment 35.3%
Food Processing 13.1%
Retail 15.7%
Mass Media 7.5%
Medical Buildings 6.6%
2015 Top Ten Taxpayers by Type of Business
182

Ratio of Outstanding Debt by Type Table 11Direct and Overlapping Governmental Activities Debt Table 12Legal Debt Margin Information Table 13Pledged - Revenue Coverage Table 14
current levels of outstanding debt and the City’s ability to issue additional debt in the future.
Debt CapacityThese schedules present information to help the reader assess the affordability of the City's
183

Table 11
Water/Sewer Solid
Waste Per
Capita (a)
2006 84,325$ 1,112$ 81$ 17,990$ 418$ 118,540$ -$ 222,466$ 3.93% 1,421$ 102,315$ 0.85% 653$ 2007 80,603 2,173 74 17,332 332 110,095 - 210,609 3.41% 1,310 97,935 0.66% 609 2008 90,751 2,023 72 16,629 244 100,930 - 210,649 3.25% 1,297 107,380 0.63% 661 2009 98,207 1,980 18 15,898 158 91,655 - 207,916 3.05% 1,264 114,105 0.67% 694 2010 102,545 5,704 15 15,090 430 81,940 - 205,724 3.22% 1,243 117,635 0.76% 711 2011 106,903 5,664 12 14,187 356 71,785 - 198,907 3.11% 1,226 121,090 0.87% 746 2012 100,725 5,554 9 13,375 356 61,140 - 181,159 2.69% 1,110 114,100 0.83% 699 2013 93,479 6,933 6 12,346 342 49,990 - 163,096 2.30% 991 105,825 0.80% 643 2014 89,421 6,817 312 11,453 258 42,702 - 150,963 2.06% 902 100,874 0.70% 603 2015 86,887 4,700 170 10,261 173 32,635 - 134,827 1.73% 791 97,149 0.61% 570
Note: Details regarding the City's outstanding debt can be found in the notes to the financial statements.(a) See Table 15 for personal income and population data. These ratios were calculated using personal income and population for the calendar year.(b) See Table 9 for taxable property value data.
Fiscal Year
General Obligation
Debt
Gov't and Bank Loans
CITY OF VANCOUVERRATIO OF OUTSTANDING DEBT BY TYPE
Last Ten Fiscal Years(Amounts expressed in thousands, except per capita)
Total General
Obligation Debt
Percentage of Actual Property Value (b)
General Obligation Debt per
Capita (a)
Special Assessment
Debt
General Obligation
Debt
Gov't and Bank Loans
Total Primary Government
Percentage of Personal Income (a)
Revenue Bonds
GOVERNMENTAL ACTIVITIES BUSINESS-TYPE ACTIVITIES
64.43%
24.20%
7.61% 3.49% 0.14%
0.13% 2015 Primary Government Debt
64.43%, Governmental General Obligation Debt 24.20%, Water/Sewer Revenue Bonds7.61%, Business-type General Obligation Debt 3.49%, Governmental Gov't & Bank Loans0.13%, Business-type Gov't & Bank Loans 0.14%, Special Assessment Debt
$-
$100
$200
$300
$400
$500
$600
$700
$800
2006 2007 2008 2009 2010 2011 2012 2013 2014 2015
General Obligation Debt Per Capita
184

Table 12
Property Valuation (2014 Assessment for 2015 Revenue) 15,812,154,819$
Governmental Activities Direct Debt:Outstanding direct debt
General obligation debt 86,887,200$ Government and bank loans 4,700,176 Special assessment debt 170,000
Total outstanding direct debt 91,757,377$
Overlapping Debt:Estimated Estimated
Direct Debt Less Percentage Share of Debt repaid with property taxes Outstanding Reserves Net Applicable to City(a) Overlapping Debt
Vancouver School District #37General obligation debt 48,194,189$ (1,891,736)$ 46,302,453$ 46.85% 21,692,699$
Evergreen School District #114General obligation debt 138,091,389 (1,374,275) 136,717,114 72.92% 99,694,120
Camas School District #117General obligation debt 86,325,000 (2,194,643) 84,130,357 3.42% 2,877,258
Port of VancouverGeneral obligation debt 50,135,000 - 50,135,000 57.11% 28,632,099
Vancouver Library General obligation debt 34,030,000 (528) 34,029,472 100.00% 34,029,472
Clark CountyGeneral obligation debt 119,376,986 - 119,376,986 36.54% 43,620,351
Subtotal- overlapping debt repaid with property taxes 230,545,998
Total governmental direct and overlapping debt 322,303,375$
Per thousandRatio of direct and overlapping debt repaid with property taxes to property valuation 0.02$
Ratio of direct debt to population (2015: 170,400) Per capitaGovernmental activities direct debt 538.48$ Overlapping and direct debt 1,891.45$ Estimated actual valuation 92,794.34$
Source: Debt outstanding: Clark County Treasurer's OfficeAssessed value data used to estimate applicable percentages: Clark County Department of Assessment and GIS
(a) For debt repaid with property taxes, the percentage of overlapping debt applicable is estimated using taxable assessed property values. Applicable percentages were estimated by determining the portion of another governmental unit's taxable assessed value that is within the city's boundaries and dividing it by each unit's total taxable assessed value.
Note: Overlapping governments are those that coincide, at least in part, with the geographic boundaries of the city. This schedule estimates the portion of the outstanding debt of those overlapping governments that is borne by the residents and businesses of Vancouver. This process recognizes that , when considering the city's ability to issue and repay long-term debt, the entire debt burden borne by the residents and businesses should be taken into account. However, this does not imply that every taxpayer is a resident, and therefore responsible for repaying the debt, of each overlapping government.
CITY OF VANCOUVERDIRECT AND OVERLAPPING GOVERNMENTAL ACTIVITIES DEBT
As of December 31, 2015
185

Table 13
15,812,155$
158,122237,182
86,887$
general obligation debt -
86,887
308,417$
2006 2007 2008 2009 2010 2011 2012 2013 2014 2015
General purpose debt limit 299,150$ 368,376$ 420,608$ 422,375$ 380,459$ 347,121$ 342,606$ 330,557$ 358,155$ 395,304$ Total net debt applicable to limit 102,311 97,935 107,380 114,105 117,635 121,090 113,141 105,825 85,929 86,887 Legal debt margin 196,839$ 270,441$ 313,228$ 308,270$ 262,824$ 226,031$ 229,465$ 224,732$ 272,226$ 308,417$
Total net debt applicable to the limit as a percentage of debt limit 34.20% 26.59% 25.53% 27.02% 30.92% 34.88% 33.02% 32.01% 23.99% 21.98%
Note: The City's 2 1/2% general purpose assessed property value legal limit of indebtedness is allocated between debt outstanding without a vote and debt outstanding with a vote of the taxpayer. General purpose debt outstanding is allocated 1 1/2 % to without a vote and 1% to with a vote.
The City reserves 10% of its non voted debt capacity as a contingency against unforeseen emergencies requiring the issuance of debt.
CITY OF VANCOUVERLEGAL DEBT MARGIN INFORMATION
Last Ten Fiscal Years(Amounts expressed in thousands)
Debt Limit:Debt Limit with vote (1% of assessed value)
General obligation bondsLess: Amount set aside for repayment of
Total net debt applicable to limit without vote
Total general purpose legal debt margin
Legal General Debt Margin Calculation for Fiscal Year 2015Assessed value (2014 Assessment for 2015 Revenue)
Debt Limit without vote (1 1/2% of assessed value)
Debt applicable to without vote limit:
0.00%
10.00%
20.00%
30.00%
40.00%
200634.2%
200726.6%
200825.5%
200927.0%
201030.9%
201134.9%
201233.0%
201332.0%
201424.0%
201522.0%
General Purpose Legal Debt Limit
Total net debt applicable to the limit as a percentage of debtlimit
186

Table 14
Net Revenue Net Revenue Special Fiscal Available For Gross Available For Assessment Year Debt Service Principal Interest Revenue Expense Debt Service Principal Interest Coverage Collections Principal Interest Coverage
2006 63,874$ 37,167$ 26,707$ 8,090$ 5,928$ 1.91 5,411$ 4,010$ 1,401$ 340$ 33$ 3.76 12$ 17$ 7$ 0.502007 68,010 40,174 27,836 8,445 5,569 1.99 5,872 4,174 1,698 - 11 154.36 15 7 6 1.152008 67,273 42,497 24,776 8,785 5,154 1.78 5,498 4,592 906 - - N/A 7 3 6 0.782009 69,785 40,865 28,920 9,275 4,685 2.07 2,652 3,899 (1,247) - - N/A 5 53 5 0.092010 68,394 40,416 27,978 9,715 4,253 2.00 3,064 1,813 1,250 - - N/A 6 3 1 1.312011 71,039 38,764 32,275 10,155 3,807 2.31 3,358 1,996 1,363 - - N/A 2 3 1 0.532012 74,277 41,073 33,204 10,645 3,322 2.38 2,871 1,902 970 - - N/A 4 3 1 1.002013 77,389 44,442 32,947 11,150 2,812 2.36 2,610 2,122 488 - - N/A 4 3 1 1.102014 81,415 44,422 36,993 9,095 2,331 3.24 2,334 2,065 268 - - N/A 54 6.33 0.25 8.202015 90,198 52,369 37,829 9,550 1,868 3.31 1,826 2,268 (442) - - N/A 118 141.83 11.25 0.77
Note: Details regarding the City's outstanding debt can be found in the notes to the financial statements.
(1) Gross Revenue is defined as all operating and nonoperating revenues of the Water/Sewer Enterprise Fund. This does not include systems development revenue.(2) Expense is defined as requiring a payment to an outside entity but not including debt service interest and fiscal charges. Therefore, expense does not include depreciation, amortization, or tax payments made to the City of Vancouver.(3) Debt coverage is calculated by using current net revenues available for debt service divided by current debt service requirements. Water/Sewer Bond covenants require a minimum coverage of 1.3%.
Special assessment debt is repaid by assessment on property owners.
CITY OF VANCOUVERPLEDGED - REVENUE COVERAGE
Last Ten Fiscal Years(Amounts expressed in thousands)
Debt Service
Water/Sewer Revenue Bonds
Gross Revenue (1) Expense (2)
Coverage (3)
Debt Service
Solid Waste Revenue Bonds
Debt Service
Special Assessment Debt
$-
$10,000
$20,000
$30,000
$40,000
$50,000
$60,000
$70,000
$80,000
$90,000
$100,000
2006 2007 2008 2009 2010 2011 2012 2013 2014 2015
Net Water Sewer Revenue Available for Debt Service
Total Revenue Total Expenses Revenue Available for Debt Service
-
1.00
2.00
3.00
4.00
5.00
6.00
7.00
8.00
2006 2007 2008 2009 2010 2011 2012 2013 2014 2015
Debt Service Coverage
Water Sewer Series2 Special Assessment
187

Demographic and Economic Statistics Table 15Principal Employers Table 16
the environment within which the City’s financial activities take place.
Demographic and Economic InformationThese schedules offer demographic and economic indicators to help the reader understand
188

Table 15
Fiscal Year Population
Personal Income1
(thousands of dollars)
Per Capita Income2
School Enrollment
Local Unemployment
Rate %
2006 156,600 5,662,343 36,158 48,080 4.72007 160,800 6,177,293 38,416 47,516 4.52008 162,400 6,480,247 39,903 48,051 5.12009 164,500 6,811,945 41,410 48,305 8.62010 165,500 6,382,508 38,565 48,084 8.12011 162,300 6,392,023 39,384 48,153 12.72012 163,200 6,740,486 41,302 48,737 10.72013 164,500 7,090,444 43,103 49,138 10.12014 167,400 7,320,067 43,728 49,146 8.02015 170,400 7,803,298 45,794 49,842 6.6
1 Personal income is calculated by multiplying population by per capita income.2 Per capita income listed for Clark County, WA. Amount is estimated for 2014.
Source: Population - State of Washington Office of Financial ManagementPer Capita Income - U.S. Bureau of Economic Analysis, and State of Washington Office of Financial ManagementSchool Enrollment - Office of Superintendent of Public Instruction, Washington State Report CardUnemployment - U.S. Department of Labor, Bureau of Labor Statistics
CITY OF VANCOUVERDEMOGRAPHIC AND ECONOMIC STATISTICS
Last Ten Fiscal Years
- 20,000 40,000 60,000 80,000
100,000 120,000 140,000 160,000 180,000
2006 2009 2012 2015
Population and School Enrollment
Population School Enrollment
3.04.05.06.07.08.09.0
10.011.012.013.0
2006 2009 2012 2015
Percent Unemployment
Local Unemployment State Unemployment
189

Table 16
Employer Type of Business Employees Rank
Percent of Total City
Employment Employees Rank
Percent of Total City
Employment
PeaceHealth (SW WA Medical Center) Healthcare 3,229 2 4.37% 4,374 1 5.75%Bonneville Power Administration Public Utility 1,139 10 1.54% 2,946 2 3.87%Evergreen School District Public Education 3,052 3 4.13% 2,764 3 3.64%Vancouver School District Public Education 3,380 1 4.58% 2,400 4 3.16%Fred Meyer Retail 1,295 7 1.75% 1,743 5 2.29%Clark County Government 1,703 5 2.31% 1,550 6 2.04%Vancouver Clinic Inc. PS Healthcare 1,061 7 1.40%City of Vancouver Government 1,148 9 1.55% 995 8 1.31%SEH America Inc. Microelectronic Mfg. 878 9 1.15%Integra Internet Service 600 10 0.79%Hewlett Packard Computers & e-services 1,800 4 2.44%Clark College Public Education 1,297 6 1.76%Safeway Retail 1,205 8 1.63%
Subtotal of Ten Largest Employers 19,248 26.06% 19,311 25.40%
All Other Employers 54,624 73.94% 56,727 74.60%
Total Vancouver Employment 73,872 100.00% 76,038 100.00%
Sources:Employees - Vancouver Business Journal Book of ListsEmployment - US Department of Labor, Bureau of Labor Statistics
2006 2015
CITY OF VANCOUVERPRINCIPAL EMPLOYERS
Current Year and Nine Years Ago
Public Education 27%
Healthcare 28%
Public Utility 15%
Government 13%
Retail 9%
Microelectronic Mfg. 5%
Internet Service 3%
2015 Top Ten Principal Employers
190

Full-Time Equivalent City Government Positions by Function Table 17Operating Indicators by Function Table 18Capital Assets Statistics by Function Table 19
information in the City’s financial report relates to the services the City provides and the activities it perform
Operating InformationThese schedules contain service and infrastructure data to help the reader understand how the
191

Table 17
Function 2006 2007 2008 2009 2010 2011 2012 2013 2014 2015
General GovernmentCity Council 7 7 7 7 7 7 7 7 7 7 City Management 11 11 10 13 11 16 14 15 15 13 Support Services 109 115 116 110 104 83 83 84 82 85 Community Services 9 9 9 7 7 5 5 5 4 4 Media & Technology Services 34 32 32 38 36 25 25 24 25 28 Equipment Services 23 22 22 17 16 21 21 22 22 22
Public SafetyPolice 234 245 247 251 223 216 212 213 213 221 Fire 207 209 222 226 216 203 198 198 198 206
Judicial 29 29 31 30 29 28 25 26 29 29 Physical Environment 4 4 4 1 1 1 1 1 1 0 Transportation 82 81 81 75 66 40 40 41 41 47 Economic Environment 98 104 103 74 60 53 51 53 54 58 Culture and Recreation 83 84 84 78 72 61 41 41 41 39 Water/Sewer 190 210 217 223 223 222 222 219 219 217 Parking 9 12 12 11 7 7 7 8 8 9 Airpark 1 1 1 1 1 1 1 1 1 1 Sanitation 6 8 8 8 5 5 5 5 5 5 Tennis Center 5 5 5 5 5 5 4 4 4 4 Fire Shop 9 9 9 9 7 - - - - -
Total 1,148 1,195 1,217 1,181 1,093 999 962 967 969 995
Note: Information presented has been revised to reflect approved, full-time-equivalent positions as of December 31 of the year shown.
Source: City of Vancouver, Budget Office
CITY OF VANCOUVERFULL-TIME EQUIVALENT CITY GOVERNMENT POSITIONS BY FUNCTION
Last Ten Fiscal Years
Other 2%
Judicial 3%
Transportation 5%
Economic Environment 6%
Culture and Recreation 4%
General Government 15%
Water/Sewer 22% Public Safety
43%
2015 Positions By Function
192

Table 18Page 1 of 2
Governmental Function 2006 2007 2008 2009 2010 2011 2012 2013 2014 2015 Change
General Government / OtherTotal number of employees, general governmental only 154 148 144 137 138 129 127 120 123 136 11%Number of telephone translations to serve citizens 638 677 688 377 381 348 416 766 590 504 -15%Number of City FTEs (includes temps) 1,249 1,271 1,312 1,455 1,283 1,198 1,274 1,214 1,207 1,240 3%Number of unions represented 10 10 10 10 12 10 10 10 10 10 0%Number of external job applications processed 2,225 3,519 2,189 416 369 6,284 6,876 4,220 6,454 7,341 14%Number of desktop & laptop computer systems in use 890 1,047 1,042 1,167 1,086 1,060 1,165 1,046 1,095 1,313 20%Number of calls for service to help desk 8,236 7,804 7,834 7,786 9,420 12,427 13,705 13,297 13,911 13,351 -4%Number of CVTV programs produced per year 626 593 606 583 465 399 434 450 444 425 -4%
Public SafetyPolice
Number of commissioned FTEs 201 209 210 206 200 193 193 187 186 187 1%Number of support FTEs 33 36 36 43 22 23 23 23 22 23 5%Number of calls for service (excludes officer initiated) 104,109 105,507 107,321 105,879 103,077 91,509 93,834 98,458 94,113 90,134 -4%Number of officer-initiated responses 55,149 54,663 51,665 48,746 42,982 42,129 36,560 36,595 36,641 47,417 29%Number of traffic stops 40,642 38,838 34,407 31,512 23,784 21,097 17,037 17,187 17,138 14,809 -14%FBI Crime Index - Violent crimes per 1,000 residents * 3.8 4.0 3.7 4.0 4.1 3.8 N/AFBI Crime Index - Property crimes per 1,000 residents * 42.0 45.1 38.2 36.1 39.5 41.9 N/ANIBRS - Crimes against Persons/Property per 1,000 residents ** 71.9 63.2 57.3 64.5 13%NIBRS - Crimes against Society per 1,000 residents *** 4.0 3.5 3.6 3.7 3%Number of impared driving arrests 552 516 383 277 231 291 306 396 382 344 -10%Number of false alarms 2,145 1,990 1,887 1,597 1,154 1,216 1,237 1,251 1,531 1,731 13%
FireNumber of commissioned FTEs 184 194 194 192 189 189 189 189 188 188 0%Number of non commissioned (support) FTEs 25 25 25 34 11 11 11 11 14 16 14%Number of fire apparatus 22 23 23 22 23 21 21 21 22 22 0%Number of EMS dedicated vehicles 3 3 2 1 0 0 0 0 0 2 0%Number of fire specific responses 627 582 857 877 658 740 897 821 866 1,232 42%Number of medical responses 18,834 18,970 14,263 17,743 18,810 17,562 16,667 16,261 16,631 17,945 8%
TransportationLane miles of pavement under management 1,715 1,782 1,789 1,798 1,806 1,810 1,810 1,812 1,812 1,815 0%Lane miles of streets swept 16,322 16,991 16,342 16,871 13,860 13,315 13,525 13,373 13,170 12,032 -9%
Culture and RecreationTotal FTEs of employees 91 91 84 72 58 48 45 44 42 43 2%Total acreage of managed city park space 7,371 7,658 6,836 3,195 3,197 2,138 2,138 2,138 1,600 1,587 -1%Miles of trails 54 54 54 66 66 23 23 23 23 20 -13%
The % change column compares the difference between the two most recent years.
Public Safety * The FBI Crime Index was a summary-based system called UCR (Uniform Crime Reporting) and is replaced by NIBRS.
NIBRS (National Incident-Based Reporting System) is more detailed than the UCR system. ** NIBRS Group "A" Offenses against Persons and Property *** NIBRS Group "A" Offenses against Society (Drugs, Narcotics, other activities prohibited by society's rules)
Source: International City/County Management Association (ICMA) annual data collection, and City of Vancouver Performance Analysis Office
CITY OF VANCOUVEROPERATING INDICATORS BY FUNCTION
Last Ten Fiscal Years
193

Table 18Page 2 of 2
Business-type Function 2006 2007 2008 2009 2010 2011 2012 2013 2014 2015 Change
WaterNumber of residential water connections 62,208 64,276 64,488 64,680 64,924 65,067 65,360 66,231 66,858 68,219 2%Number of non-residential water connections 3,398 3,490 3,498 3,310 3,585 3,596 3,489 3,514 3,537 3,688 4%Number of new water connections 1,620 586 204 428 628 154 186 896 650 1,512 133%Daily average water consumption (gallons) 28,082,191 25,753,425 26,301,370 25,782,833 23,287,671 24,521,899 25,470,150 20,327,323 18,931,903 18,727,645 -1%
SewerNumber of total waste connections 52,168 51,510 54,462 54,935 55,303 55,533 55,964 56,836 57,520 58,588 2%Number of non-residential waste water connections 2,326 2,537 2,586 2,487 2,495 2,739 2,750 2,781 2,815 2,654 -6%Number of new waste connections 1,104 1,060 400 513 496 230 431 868 684 1,068 56%Daily average treated 19,622,000 21,420,000 20,274,000 19,398,907 21,095,000 21,950,000 21,960,000 20,180,000 20,300,000 20,550,000 1%
Surface WaterNumber of drain basins cleaned 9,066 8,144 11,038 10,453 3,242 10,478 13,267 14,012 9,814 10,942 11%Miles of drainage mains cleaned 3.9 2.7 7.9 12.7 13.8 8.6 8.8 36.1 11.7 6.7 -43%
ParkingNumber of parking violations issued per year 39,840 43,251 35,458 33,863 24,633 26,473 27,583 24,133 20,608 24,552 19%
Building InspectionTotal code violation cases initiated 5,083 1,852 2,371 2,094 1,300 1,187 1,041 1,009 1,184 1,308 10%Number of new residential building permits issued 1,569 1,460 1,081 527 821 787 1,039 1,498 1,485 1,859 25%Number of total building permits issued 8,104 8,266 6,847 7,141 7,031 7,223 7,654 8,464 8,133 9,679 19%Number of total building inspections conducted 52,314 46,603 42,725 28,141 26,577 24,738 31,574 32,110 30,154 37,487 24%
Last Ten Fiscal Years
CITY OF VANCOUVEROPERATING INDICATORS BY FUNCTION
194

Table 19
Governmental Function 2006 2007 2008 2009 2010 2011 2012 2013 2014 2015 Change
General Government / OtherTotal city light vehicle fleet (no marked patrol) 346 333 350 379 393 368 363 329 320 320 0%Square ft. of administrative space 459,654 217,591 169,949 198,672 321,561 252,550 252,550 252,550 166,877 266,840 60%Square ft. of warehouse space 153,188 51,075 50,575 50,575 84,116 84,116 84,116 84,116 43,505 39,881 -8%
Public SafetyPolice
Number of marked police patrol 96 94 88 81 77 77 90 87 74 74 0%Number of total police facilities 6 6 6 6 6 4 4 4 3 4 33%
FireNumber of total response vehicles 25 26 25 23 23 21 21 21 22 22 0%Number of stations 10 9 9 10 10 10 10 10 10 10 0%Number of total fire fleet vehicles (includes apparatus) 92 98 100 79 72 68 68 68 69 69 0%
TransportationNumber of signaled intersections 210 224 233 228 234 234 237 237 241 241 0%Number of bridges 10 10 10 10 10 10 10 10 10 10 0%Miles of roads 540.0 569.0 575.0 575.0 579.0 580.0 580.3 581.0 581.0 582.0 0%
Culture and RecreationParks
Number of neighborhood parks 69 70 68 68 70 70 67 76 76 76 0%Number of community parks 15 15 14 11 11 11 12 13 15 14 -7%
Indoor Recreation Facilities 3 3 3 3 3 3 3 3 3 3 0%Museums 2 2 2 2 2 2 1 1 1 1 0%
Business-Type Function 2006 2007 2008 2009 2010 2011 2012 2013 2014 2015 Change
WaterTotal miles of water mains 939 961 976 982 985 999 1,001 1,009 1,012 1,020 1%Miles of supply and transmission mains 12" and larger 60 63 63 63 187 191 192 194 194 195 1%Hydrants in use 6,680 6,944 7,099 7,197 7,275 7,394 7,443 7,512 7,564 7,633 1%Storage (mg) 25 25 25 25 25 25 25 25 25 25 0%
SewerMiles of sewage mains 665 693 703 707 714 725 728 735 741 753 2%Treatment Plants 2 2 2 2 2 2 2 2 2 2 0%Capacity (mg) 37.0 37.4 37.4 37.4 37.4 37.4 37.4 37.4 37.4 37.4 0%
ParkingLots 7 7 6 6 6 6 7 7 7 7 0%Garages 4 4 4 4 4 4 3 2 2 2 0%Meters, on and off street 1,547 1,563 1,562 1,538 1,546 1,546 1,575 1,595 1,595 1,595 0%Pay Stations 16 24 26 28 28 28 30 30 30 32 7%
AirparkHangars 150 150 150 150 150 150 150 150 150 150 0%Tie-Downs 12 12 12 12 12 12 12 12 12 12 0%Land (acres) 62 62 62 62 62 62 62 62 62 62 0%
Tennis CenterIndoor Courts 9 9 9 9 9 9 9 9 9 9 0%Outdoor Courts 4 4 4 4 4 4 4 4 4 4 0%Racquetball Courts 3 3 2 2 2 2 2 2 2 2 0%Square feet of recreation centers in use (non-pool) 129,545 209,545 209,545 209,545 209,545 209,545 209,545 209,545 209,545 209,945 0%
The % change column compares the difference between the two most recent years.
Note 1: Asset information for areas not shown are under evaluation
Source: Various city departments.
CITY OF VANCOUVERCAPITAL ASSET STATISTICS BY FUNCTION
Last Ten Fiscal Years
195
Lantern tour of historic Fort Vancouver
196

Schedule of Expenditures of Federal Awards (SEFA) Table 20
NOTE 1 BASIS OF ACCOUNTINGThe Schedule of Financial Assistance is prepared on the same basis of accounting as the City's financialstatements.
NOTE 2 PROGRAM COSTSThe amounts shown as current year expenditures represent only federal grant portions of the programcosts. Entire program costs, including the City's portion may be more than shown.
NOTE 3 PROGRAM INCOMERevolving Loan - The City has a revolving loan program for low income housing. Under this federal grant,repayments to the City are considered program revenues (income) and loans of such funds to eligible recipients are considered expenditures.
NOTE 4 INDIRECT COST RATEThe City does not have an approved indirect cost rate and has elected to use the 10-percent de mimimisindirect cost rate allowed under the Uniform Guidance.
NOTE 5 AMERICAN RECOVERY AND REINVESTMENT ACT (ARRA) OF 2009The City has received Federal awards made under the Recovery Act which have been identified separatelyon the Schedule of Expenditures of Federal Awards (SEFA). These awards are entered by CFDA numberand have included the prefix "ARRA" to identify the name of the Federal program.
AND STATE/LOCAL FINANCIAL ASSISTANCE
Schedule of Federal AwardsThis schedule contains information about expenditures of federal grant awards
to help the reader understand the contributions the City receives from the Federal Government.
NOTES TO THE SCHEDULE OF EXPENDITURES OF FEDERAL AWARDS
197

Table 20Page 1 of 2
Grantor/Pass-Through Grantor
Program TitleCFDA
NumberOther Identification
Number
DirectFederal
Expenditures
IndirectFederal
Expenditures
TotalFederal
Expenditures
Passed through to
Subrecipeints
Foot-Note Ref.
Department of Agriculture:Passed through Department of Natural Resources:Cooperative Forestry Assistance 10.664 IAA-14-51 / K244-12-DG-010 1,899$
Total Department of Agriculture: 1,899 1,899
Department of Environmental Protection Agency:Brownfields Training, Research and Technical Assistance Grants 66.814 TR-00J80101-0 94,268$
Brownfields Assessment and Cleanup Cooperative Agreements 66.818 BF-00J80201-0 69,703
Total Department of Environmental Protection Agency: 163,971 163,971
Department of Housing and Urban Development:Community Development Block Grants/Entitlement Grants 14.218 B-12-MC-53-0013 168,774 140,301 3Community Development Block Grants/Entitlement Grants 14.218 B-13-MC-53-0013 390,346 46,505 3Community Development Block Grants/Entitlement Grants 14.218 B-14-MC-53-0013 668,566 436,419 3Community Development Block Grants/Entitlement Grants 14.218 B-15-MC-53-0013 246,199 95,367 3
Total CFDA 14.218 1,473,885 718,592
Home Investment Partnerships Program 14.239 M-12-MC-53-0208 543 Home Investment Partnerships Program 14.239 M-13-MC-53-0208 215,335 203,146 3Home Investment Partnerships Program 14.239 M-14-MC-53-0208 232,406 202,626 3Home Investment Partnerships Program 14.239 M-15-MC-53-0208 21,840
Passed through Department of Commerce:Home Investment Partnerships Program 14.239 14-42404-005 5,476
Total CFDA 14.239 470,124 5,476 405,772
Congressional Grants / Neighborhood Initiatives Grants 14.251 B-09-NI-WA-0010 1,917,303
Total Department of Housing and Urban Development: 3,861,312 5,476 3,866,788 1,124,364
Department of Justice:Grants to Encourage Arrest Policies and Enforcement of Protection Orders 16.590 2012-WE-AX-0023 37,326 18,860 Grants to Encourage Arrest Policies and Enforcement of Protection Orders 16.590 2014-WE-AX-0039 54,233 35,332
Total CFDA 16.590 91,559 54,192
Public Safety Partnership & Community Policing Grants 16.710 2010-CS-WX-0015 68,493
Congressionally Recommended Awards 16.753 2009-D1-BX-0217 114,398 Congressionally Recommended Awards 16.753 2010-DD-BX-0508 225,434
Total CFDA 16.753 339,832
Passed through City of Seattle:Missing Children's Assistance 16.543 2012-MC-FX-K046 1,470
Passed through Clark County:Violence Against Women Formula Grants 16.588 F-14-31103-073 6,520
Passed through Clark County:Edward Byrne Memorial Justice Assistance Grant Program 16.738 2013-DJ-BX-0717 26,044 Edward Byrne Memorial Justice Assistance Grant Program 16.738 2014-DJ-BX-0841 28,446
Total CFDA 16.738 54,490
Total Department of Justice: 499,884 62,480 562,364 54,192
CITY OF VANCOUVERSCHEDULE OF EXPENDITURES OF FEDERAL AWARDS
For the Year Ended December 31, 2015
198
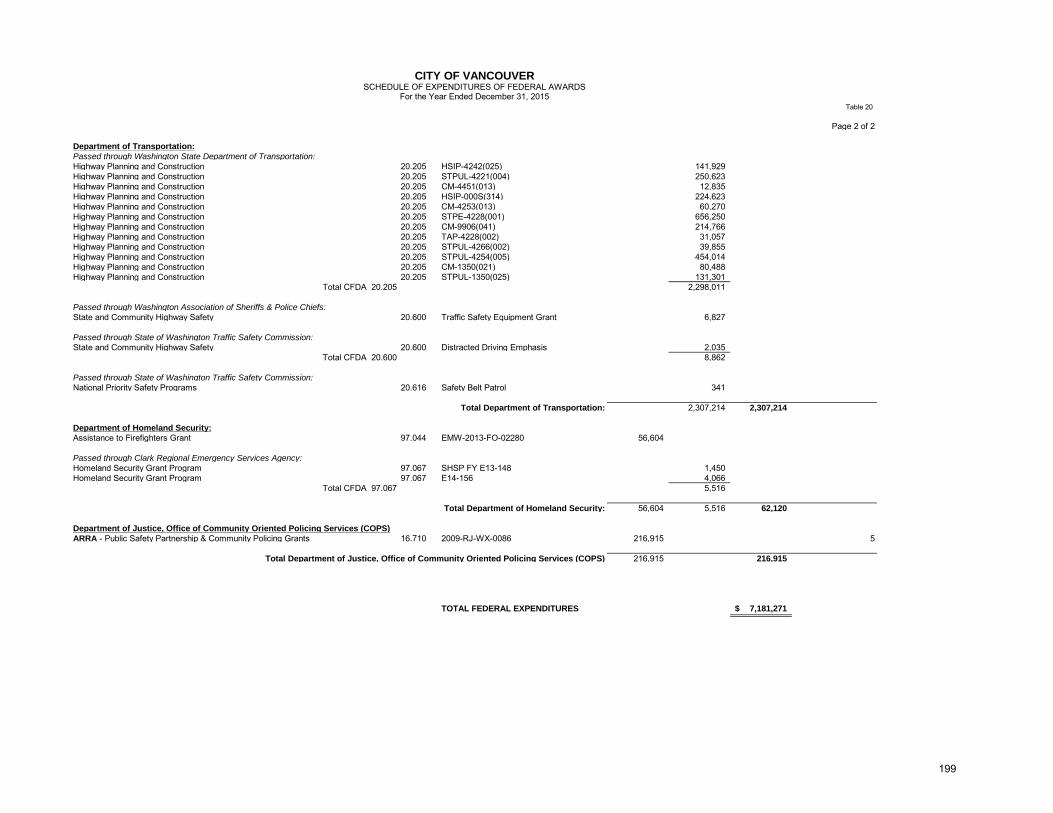
Table 20
CITY OF VANCOUVERSCHEDULE OF EXPENDITURES OF FEDERAL AWARDS
For the Year Ended December 31, 2015
Page 2 of 2
Department of Transportation:Passed through Washington State Department of Transportation:Highway Planning and Construction 20.205 HSIP-4242(025) 141,929Highway Planning and Construction 20.205 STPUL-4221(004) 250,623Highway Planning and Construction 20.205 CM-4451(013) 12,835 Highway Planning and Construction 20.205 HSIP-000S(314) 224,623 Highway Planning and Construction 20.205 CM-4253(013) 60,270 Highway Planning and Construction 20.205 STPE-4228(001) 656,250 Highway Planning and Construction 20.205 CM-9906(041) 214,766Highway Planning and Construction 20.205 TAP-4228(002) 31,057Highway Planning and Construction 20.205 STPUL-4266(002) 39,855Highway Planning and Construction 20.205 STPUL-4254(005) 454,014Highway Planning and Construction 20.205 CM-1350(021) 80,488Highway Planning and Construction 20.205 STPUL-1350(025) 131,301
Total CFDA 20.205 2,298,011
Passed through Washington Association of Sheriffs & Police Chiefs:State and Community Highway Safety 20.600 Traffic Safety Equipment Grant 6,827
Passed through State of Washington Traffic Safety Commission:State and Community Highway Safety 20.600 Distracted Driving Emphasis 2,035
Total CFDA 20.600 8,862
Passed through State of Washington Traffic Safety Commission:National Priority Safety Programs 20.616 Safety Belt Patrol 341
Total Department of Transportation: 2,307,214 2,307,214
Department of Homeland Security:Assistance to Firefighters Grant 97.044 EMW-2013-FO-02280 56,604
Passed through Clark Regional Emergency Services Agency:Homeland Security Grant Program 97.067 SHSP FY E13-148 1,450 Homeland Security Grant Program 97.067 E14-156 4,066
Total CFDA 97.067 5,516
Total Department of Homeland Security: 56,604 5,516 62,120
Department of Justice, Office of Community Oriented Policing Services (COPS)ARRA - Public Safety Partnership & Community Policing Grants 16.710 2009-RJ-WX-0086 216,915 5
Total Department of Justice, Office of Community Oriented Policing Services (COPS) 216,915 216,915
TOTAL FEDERAL EXPENDITURES 7,181,271$
199

Time to be done…for now!
200