Embed Size (px)
Citation preview
ComprehensiveAnnual Financial Report
Included in the Higher Education Funds of the State of South Carolina
FISCAL YEAR ENDED JUNE 30, 2015
MIDLANDS TECHNICAL COLLEGE
Comprehensive Annual Financial Report Fiscal Year Ended June 30, 2015
A college included in the higher education funds of the state of South Carolina
STATEMENT OF MISSION Midlands Technical College is a comprehensive, multi-campus, two-year public college serving the primary region of Richland, Lexington and Fairfield counties of South Carolina. College programs and services provide accessible, affordable, quality education that prepares a diverse student population to enter the job market, transfer to senior colleges and universities, and achieve their professional and personal goals. Through its programs and services, the College equitably provides higher education opportunities and strengthens the economic and social vitality of the community.
Prepared by the Finance and Accounting Office
Debbie M. Walker, M.B.A., CGFO
Interim Vice President for Business Affairs
Sheila W. Smith, M.B.A. Interim Executive Director for Business Affairs
Jessica H. Booth, CGFO
Interim Director of Finance and Financial Reporting

MIDLANDS TECHNICAL COLLEGE
Comprehensive Annual Financial Report Fiscal Year Ended June 30, 2015
A college included in the higher education funds of the state of South Carolina
TABLE OF CONTENTS Introductory Section (Unaudited and not covered by the Independent Auditor’s Report) President’s Letter ..................................................................................................................................................... 1 Letter of Transmittal ................................................................................................................................................ 2 Certificate of Achievement for Excellence in Financial Reporting ........................................................................... 6 Organizational Data .................................................................................................................................................. 7 Organizational Chart ................................................................................................................................................ 8 College-Wide Goals and Priority Initiatives .............................................................................................................. 9 Financial Section Independent Auditor’s Report ............................................................................................................................... 11 Management’s Discussion and Analysis – (Required Supplementary Information) .............................................. 15 Basic Financial Statements: Statement of Net Position ............................................................................................................................... 23 Statement of Revenues, Expenses, and Changes in Net Position ................................................................... 24 Statement of Cash Flows ................................................................................................................................. 25 Statement of Financial Position – Discretely Presented Component Unit ...................................................... 26 Statement of Activities – Discretely Presented Component Unit ................................................................... 27 Notes to Financial Statements ......................................................................................................................... 28 Required Supplemental Information
Schedule of Proportionate Share of the South Carolina Retirement Systems ................................................ 57 Schedule of South Carolina Retirement Systems Contributions ..................................................................... 58
Statistical Section (Unaudited and not covered by the Independent Auditor’s Report) Financial Trends: Schedule of Net Position by Component ......................................................................................................... 63 Schedule of Other Changes in Net Position ..................................................................................................... 64 Schedule of Expenses by Function ................................................................................................................... 65 Schedule of Expenses by Use ........................................................................................................................... 67
- i -
Revenue Capacity: Schedule of Revenues by Source ..................................................................................................................... 71 South Carolina Public Two-Year Institutions .................................................................................................... 74 Admissions, Enrollment and Degree Statistics ................................................................................................ 76 Credit Student Enrollment Percentages by County ......................................................................................... 78 Debt Capacity: Schedule of Ratios of Outstanding Bonded Debt and Note Payable ............................................................... 81 Schedule of Bond Coverage ............................................................................................................................. 83 Demographic and Economic Information: Schedule of Demographic and Economic Statistics ......................................................................................... 87 Principal Employers by County ........................................................................................................................ 88 Operating Information: Faculty and Staff Statistics ............................................................................................................................... 91 Schedule of Capital Asset Information by Function ......................................................................................... 92 Other Information: College Accreditation as of June 30, 2015 ....................................................................................................... 95 Statement of Nondiscrimination ..................................................................................................................... 95 Statement of Gainful Employment .................................................................................................................. 95 Federal Awards Single Audit and other Compliance Reports Section Schedule of Expenditures of Federal Awards ......................................................................................................... 99 Notes to Schedule of Expenditures of Federal Awards ........................................................................................ 102 Independent Auditor’s Report on Internal Control over Financial Reporting and on Compliance and Other Matters Based on an Audit of Financial Statements Performed in Accordance with Government Auditing Standards. .......................................................................................................... 103 Independent Auditor’s Report on Compliance for Each Major Program and on Internal Control over Compliance Required by OMB Circular A-133 ....................................................................................... 105 Schedule of Findings and Questioned Costs ........................................................................................................ 107
Independent Accountant’s Report on State Lottery Tuition Assistance .............................................................. 109
- ii -
MIDLANDS TECHNICAL COLLEGE
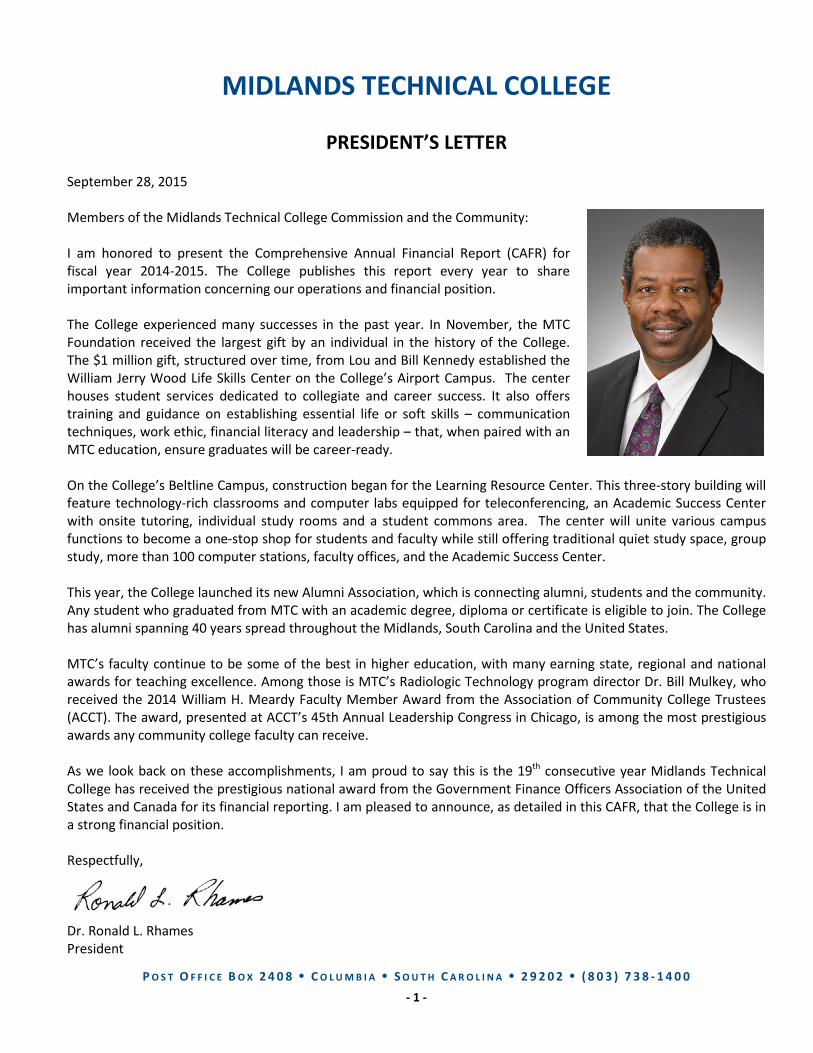
PRESIDENT’S LETTER September 28, 2015 Members of the Midlands Technical College Commission and the Community: I am honored to present the Comprehensive Annual Financial Report (CAFR) for fiscal year 2014-2015. The College publishes this report every year to share important information concerning our operations and financial position. The College experienced many successes in the past year. In November, the MTC Foundation received the largest gift by an individual in the history of the College. The $1 million gift, structured over time, from Lou and Bill Kennedy established the William Jerry Wood Life Skills Center on the College’s Airport Campus. The center houses student services dedicated to collegiate and career success. It also offers training and guidance on establishing essential life or soft skills – communication techniques, work ethic, financial literacy and leadership – that, when paired with an MTC education, ensure graduates will be career-ready. On the College’s Beltline Campus, construction began for the Learning Resource Center. This three-story building will feature technology-rich classrooms and computer labs equipped for teleconferencing, an Academic Success Center with onsite tutoring, individual study rooms and a student commons area. The center will unite various campus functions to become a one-stop shop for students and faculty while still offering traditional quiet study space, group study, more than 100 computer stations, faculty offices, and the Academic Success Center. This year, the College launched its new Alumni Association, which is connecting alumni, students and the community. Any student who graduated from MTC with an academic degree, diploma or certificate is eligible to join. The College has alumni spanning 40 years spread throughout the Midlands, South Carolina and the United States. MTC’s faculty continue to be some of the best in higher education, with many earning state, regional and national awards for teaching excellence. Among those is MTC’s Radiologic Technology program director Dr. Bill Mulkey, who received the 2014 William H. Meardy Faculty Member Award from the Association of Community College Trustees (ACCT). The award, presented at ACCT’s 45th Annual Leadership Congress in Chicago, is among the most prestigious awards any community college faculty can receive. As we look back on these accomplishments, I am proud to say this is the 19th consecutive year Midlands Technical College has received the prestigious national award from the Government Finance Officers Association of the United States and Canada for its financial reporting. I am pleased to announce, as detailed in this CAFR, that the College is in a strong financial position. Respectfully,
Dr. Ronald L. Rhames President
P O S T O F F I C E B O X 2 4 0 8 C O L U M B I A S O U T H C A R O L I N A 2 9 2 0 2 ( 8 0 3 ) 7 3 8 - 1 4 0 0 - 1 -
September 28, 2015 To: Midlands Technical College Commission, the
President, the Executive Council and the community served by Midlands Technical College
We are pleased to present the Comprehensive Annual Financial Report (CAFR) of Midlands Technical College (the “College”) for fiscal year ended June 30, 2015. State law, federal guidelines and certain debt covenants require an annual audit of the College’s financial records. The College has contracted with the independent certified public accounting firm of The Brittingham Group, L.L.P. to perform the annual audit of its financial statements and federal awards. The Independent Auditor’s Report is included in the financial section of this CAFR and reflects an unqualified opinion on the basic financial statements. As a recipient of federal financial awards, the College complies with the requirements of the Single Audit Act, and separate Single Audit reports have been issued, which are included in the Federal Awards section. The management of the College is responsible for the accuracy of the data presented and the completeness and fairness of the presentation, including all disclosures. To the best of our knowledge, the information presented is accurate in all material respects and is comparable to equivalent institutions. All disclosures have been included and will provide the reader with a reasonable understanding of the College’s financial activities that support its mission. The management of the College is responsible for establishing and maintaining the framework of all internal control. In fulfilling this responsibility, estimates and judgments are required to assess the expected benefits and related costs of policies and procedures related to the internal control framework. The system of internal control is designed to ensure that certain organizational objectives are met. Accordingly, organizational structure, policies and procedures have been established to safeguard assets; ensure the reliability of accounting data; promote efficient operations; and ensure compliance with established governmental laws, regulations and policies, College policies, and other requirements of those to whom the College is accountable. The internal accounting control structure is designed to provide reasonable, not absolute, assurance that these objectives are met.
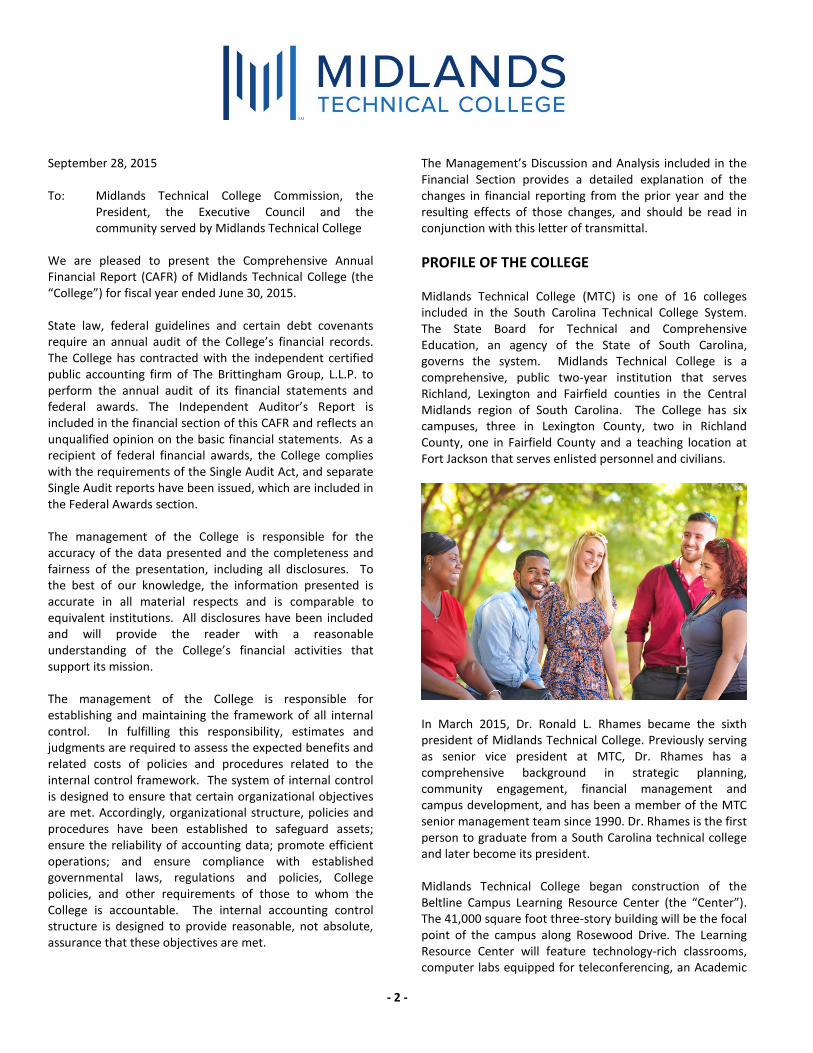
The Management’s Discussion and Analysis included in the Financial Section provides a detailed explanation of the changes in financial reporting from the prior year and the resulting effects of those changes, and should be read in conjunction with this letter of transmittal. PROFILE OF THE COLLEGE Midlands Technical College (MTC) is one of 16 colleges included in the South Carolina Technical College System. The State Board for Technical and Comprehensive Education, an agency of the State of South Carolina, governs the system. Midlands Technical College is a comprehensive, public two-year institution that serves Richland, Lexington and Fairfield counties in the Central Midlands region of South Carolina. The College has six campuses, three in Lexington County, two in Richland County, one in Fairfield County and a teaching location at Fort Jackson that serves enlisted personnel and civilians.
In March 2015, Dr. Ronald L. Rhames became the sixth president of Midlands Technical College. Previously serving as senior vice president at MTC, Dr. Rhames has a comprehensive background in strategic planning, community engagement, financial management and campus development, and has been a member of the MTC senior management team since 1990. Dr. Rhames is the first person to graduate from a South Carolina technical college and later become its president. Midlands Technical College began construction of the Beltline Campus Learning Resource Center (the “Center”). The 41,000 square foot three-story building will be the focal point of the campus along Rosewood Drive. The Learning Resource Center will feature technology-rich classrooms, computer labs equipped for teleconferencing, an Academic
- 2 -
Success Center with onsite tutoring, individual study rooms and a student commons area. The Center will unite various campus functions to become a one-stop shop for students and faculty while still offering traditional quiet study space and it will house the William Jerry Wood Life Skills Center. The College will complete the up fit and construction of the 35,000 square foot Advanced Manufacturing and Skilled Crafts Center in late fall of 2015. The building will include Continuing Education and credit classes in programs such as mechatronics, industrial mechanical/electrical and building constructions. The building will house computer labs and general classrooms. The College outsourced its bookstore with Barnes and Noble College Bookseller, LLC. Barnes and Noble provides new, used and rental textbooks options, as well as, supplies and merchandise to Midlands Technical College. The College’s governing board, the Commission, is appointed by the Governor of South Carolina upon the recommendation of the legislative delegations from Richland and Lexington counties. The 12 officers are elected every two years, with the chairmanship alternated between the two counties. The Governor signed into law an amendment to the SC Code of Law 59-53-1710 which allows for an additional member to be added to the College’s Board of Commissioners. This thirteenth member will represent Fairfield County, and will serve a four year term. State law mandates Richland and Lexington counties to provide sufficient funding to build, maintain and operate the College’s physical plant. The division of financial responsibility is based on population and is used each year for budget request purposes. The current distribution is 40.56 percent for Lexington County and 59.44 percent for Richland County. Fairfield County also provides financial support by funding the difference between the in-county tuition rate and the in-state tuition rate for its residents who attend the College. Fairfield County provided 1.4% percent of the total county support for the current fiscal year. Midlands Technical College is reported as a discretely presented component unit in the State of South Carolina’s Comprehensive Annual Financial Report. The Midlands Technical College Foundation, Inc., (the Foundation) is a nonprofit organization that was formed on August 12, 1970, to benefit and support education at Midlands Technical College. It is a legally separate tax exempt component unit of the College. The Foundation acts primarily as a fundraising organization to supplement the resources that are available to the College in support of its programs. A separate Board of Directors governs the Foundation. The 21-member board of the Foundation is
self-perpetuating and provides the structure through which individuals, corporations, and other private sector interests can demonstrate their support of the College. The activity of the Foundation is included separately in the College’s financial statements. The Midlands Technical College Enterprise Campus Authority (the Authority) was established in 2004 by S.C. Act 200, codified as sub-article 3, Article 20, Chapter 53, Title 59, of the 1976 South Carolina Code of Laws, as amended. For accounting purposes, the Authority is considered a blended component unit of Midlands Technical College. The Authority was established to provide for the management, development and operation of the Enterprise Campus of Midlands Technical College, located on the Northeast Campus. The Board of the Authority consists of the members of the Midlands Technical College Commission. The activity of the Authority is blended in the financial statements of the College.
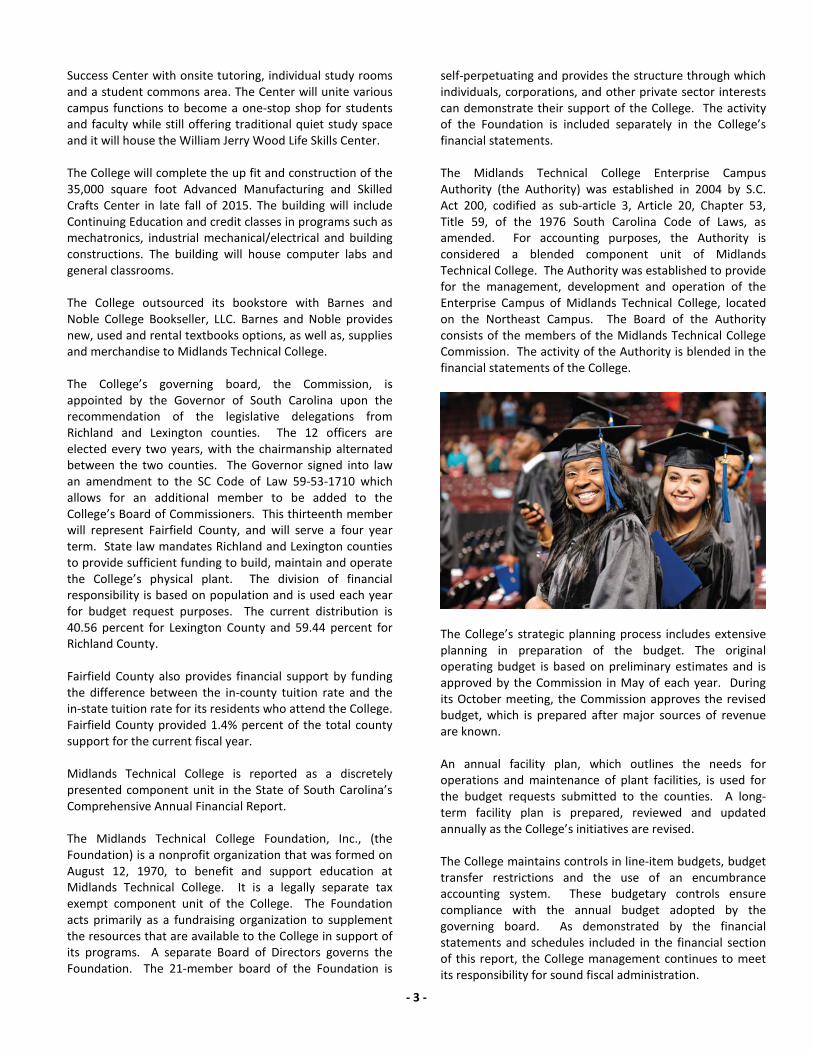
The College’s strategic planning process includes extensive planning in preparation of the budget. The original operating budget is based on preliminary estimates and is approved by the Commission in May of each year. During its October meeting, the Commission approves the revised budget, which is prepared after major sources of revenue are known. An annual facility plan, which outlines the needs for operations and maintenance of plant facilities, is used for the budget requests submitted to the counties. A long-term facility plan is prepared, reviewed and updated annually as the College’s initiatives are revised. The College maintains controls in line-item budgets, budget transfer restrictions and the use of an encumbrance accounting system. These budgetary controls ensure compliance with the annual budget adopted by the governing board. As demonstrated by the financial statements and schedules included in the financial section of this report, the College management continues to meet its responsibility for sound fiscal administration.
- 3 -
ECONOMIC CONDITIONS Fiscal year 2014-2015 was a relatively stable year economically for the College and other South Carolina higher education institutions as economic conditions continue to improve. The College did not face any budget reductions from the State. The State provided a slight increase in the form of support for a pay increase for state funded employees. The counties, during fiscal year 2014-2015, continued to fully support the College’s physical plant operations budget request and maintained its commitment to the College’s capital and debt-service needs by funding the requested amounts.
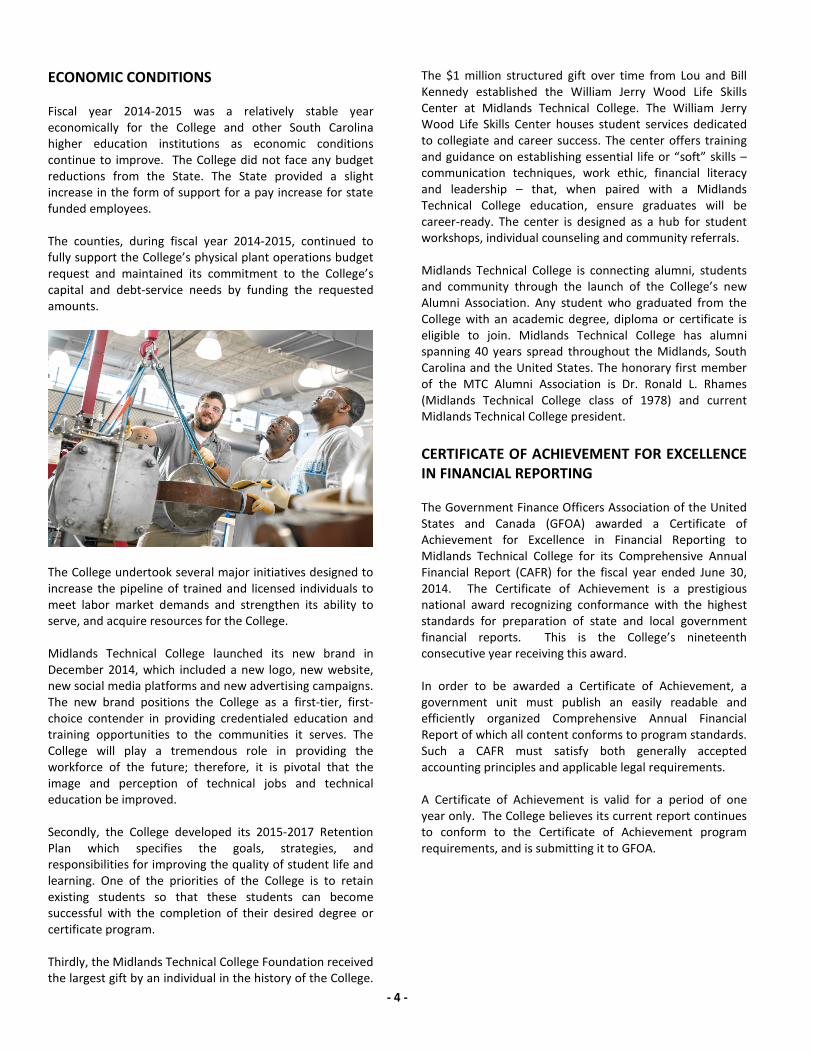
The College undertook several major initiatives designed to increase the pipeline of trained and licensed individuals to meet labor market demands and strengthen its ability to serve, and acquire resources for the College. Midlands Technical College launched its new brand in December 2014, which included a new logo, new website, new social media platforms and new advertising campaigns. The new brand positions the College as a first-tier, first-choice contender in providing credentialed education and training opportunities to the communities it serves. The College will play a tremendous role in providing the workforce of the future; therefore, it is pivotal that the image and perception of technical jobs and technical education be improved. Secondly, the College developed its 2015-2017 Retention Plan which specifies the goals, strategies, and responsibilities for improving the quality of student life and learning. One of the priorities of the College is to retain existing students so that these students can become successful with the completion of their desired degree or certificate program. Thirdly, the Midlands Technical College Foundation received the largest gift by an individual in the history of the College.
The $1 million structured gift over time from Lou and Bill Kennedy established the William Jerry Wood Life Skills Center at Midlands Technical College. The William Jerry Wood Life Skills Center houses student services dedicated to collegiate and career success. The center offers training and guidance on establishing essential life or “soft” skills – communication techniques, work ethic, financial literacy and leadership – that, when paired with a Midlands Technical College education, ensure graduates will be career-ready. The center is designed as a hub for student workshops, individual counseling and community referrals. Midlands Technical College is connecting alumni, students and community through the launch of the College’s new Alumni Association. Any student who graduated from the College with an academic degree, diploma or certificate is eligible to join. Midlands Technical College has alumni spanning 40 years spread throughout the Midlands, South Carolina and the United States. The honorary first member of the MTC Alumni Association is Dr. Ronald L. Rhames (Midlands Technical College class of 1978) and current Midlands Technical College president. CERTIFICATE OF ACHIEVEMENT FOR EXCELLENCE IN FINANCIAL REPORTING The Government Finance Officers Association of the United States and Canada (GFOA) awarded a Certificate of Achievement for Excellence in Financial Reporting to Midlands Technical College for its Comprehensive Annual Financial Report (CAFR) for the fiscal year ended June 30, 2014. The Certificate of Achievement is a prestigious national award recognizing conformance with the highest standards for preparation of state and local government financial reports. This is the College’s nineteenth consecutive year receiving this award. In order to be awarded a Certificate of Achievement, a government unit must publish an easily readable and efficiently organized Comprehensive Annual Financial Report of which all content conforms to program standards. Such a CAFR must satisfy both generally accepted accounting principles and applicable legal requirements. A Certificate of Achievement is valid for a period of one year only. The College believes its current report continues to conform to the Certificate of Achievement program requirements, and is submitting it to GFOA.
- 4 -
ACKNOWLEDGEMENTS The timely preparation of the Comprehensive Annual Financial Report is a coordinated College-wide effort. We would like to express sincere appreciation to all employees in the Business Affairs Division who contributed to the timely closing of the College’s financial records and the preparation of this report; to Marketing Communications unit for its contributions in design, editing, printing and publication of the document; and to Institutional Support’s Assessment, Research and Planning unit for providing statistical data. Our sincere appreciation is also expressed to other individuals and to our Commission for their support of this initiative. Sincerely,
Debbie M. Walker, M.B.A., CGFO Interim Vice President for Business Affairs
Sheila W. Smith, M.B.A. Interim Executive Director for Business Affairs
Jessica H. Booth, CGFO Interim Director of Finance and Financial Reporting
- 5 -
6
MIDLANDS TECHNICAL COLLEGE
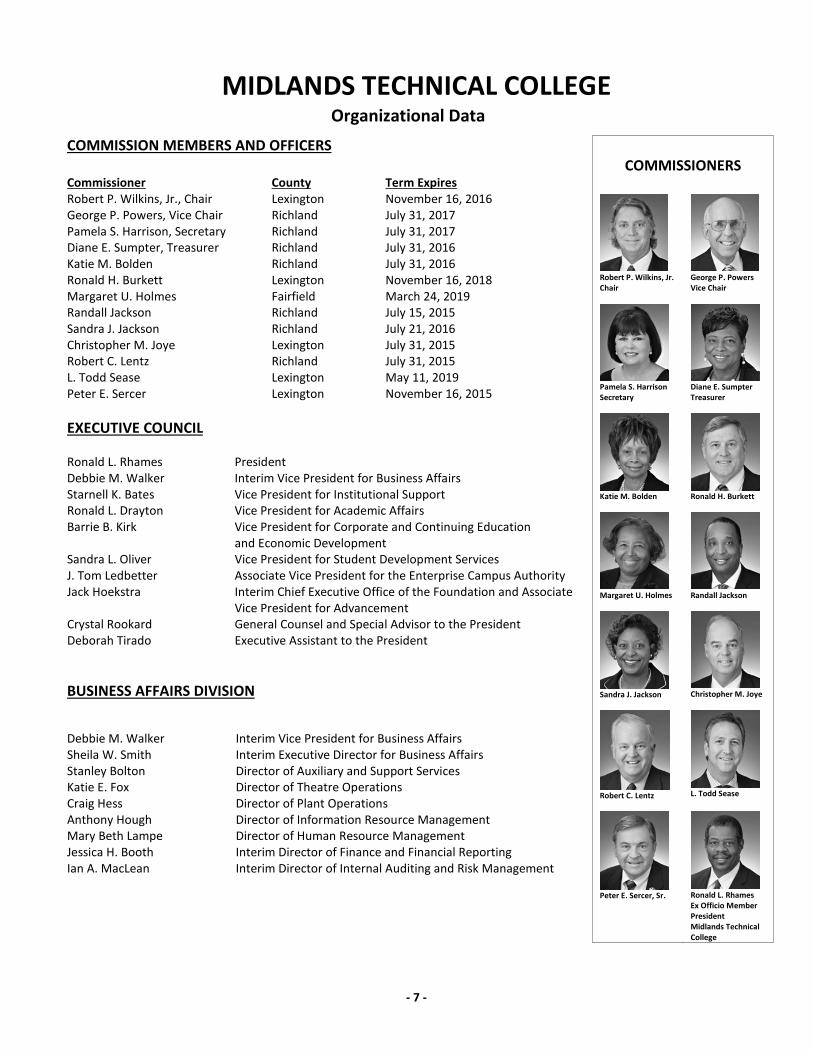
COMMISSION MEMBERS AND OFFICERS
Commissioner County Term Expires Robert P. Wilkins, Jr., Chair Lexington November 16, 2016 George P. Powers, Vice Chair Richland July 31, 2017 Pamela S. Harrison, Secretary Richland July 31, 2017 Diane E. Sumpter, Treasurer Richland July 31, 2016 Katie M. Bolden Richland July 31, 2016 Ronald H. Burkett Lexington November 16, 2018 Margaret U. Holmes Fairfield March 24, 2019 Randall Jackson Richland July 15, 2015 Sandra J. Jackson Richland July 21, 2016 Christopher M. Joye Lexington July 31, 2015 Robert C. Lentz Richland July 31, 2015 L. Todd Sease Lexington May 11, 2019 Peter E. Sercer Lexington November 16, 2015
EXECUTIVE COUNCIL
Ronald L. Rhames President Debbie M. Walker Interim Vice President for Business Affairs Starnell K. Bates Vice President for Institutional Support Ronald L. Drayton Vice President for Academic Affairs Barrie B. Kirk Vice President for Corporate and Continuing Education
and Economic Development Sandra L. Oliver Vice President for Student Development Services J. Tom Ledbetter Associate Vice President for the Enterprise Campus Authority Jack Hoekstra Interim Chief Executive Office of the Foundation and Associate
Vice President for Advancement Crystal Rookard General Counsel and Special Advisor to the President Deborah Tirado Executive Assistant to the President
BUSINESS AFFAIRS DIVISION
COMMISSIONERS
Robert P. Wilkins, Jr. Chair
George P. Powers Vice Chair
Pamela S. Harrison Secretary
Diane E. Sumpter Treasurer
Katie M. Bolden Ronald H. Burkett
Margaret U. Holmes Randall Jackson
Sandra J. Jackson Christopher M. Joye
Robert C. Lentz L. Todd Sease
Peter E. Sercer, Sr. Ronald L. Rhames Ex Officio Member President Midlands Technical College
Debbie M. Walker Interim Vice President for Business Affairs Sheila W. Smith Interim Executive Director for Business Affairs Stanley Bolton Director of Auxiliary and Support Services Katie E. Fox Director of Theatre Operations Craig Hess Director of Plant Operations Anthony Hough Director of Information Resource Management Mary Beth Lampe Director of Human Resource Management Jessica H. Booth Interim Director of Finance and Financial Reporting Ian A. MacLean Interim Director of Internal Auditing and Risk Management
Organizational Data
- 7 -
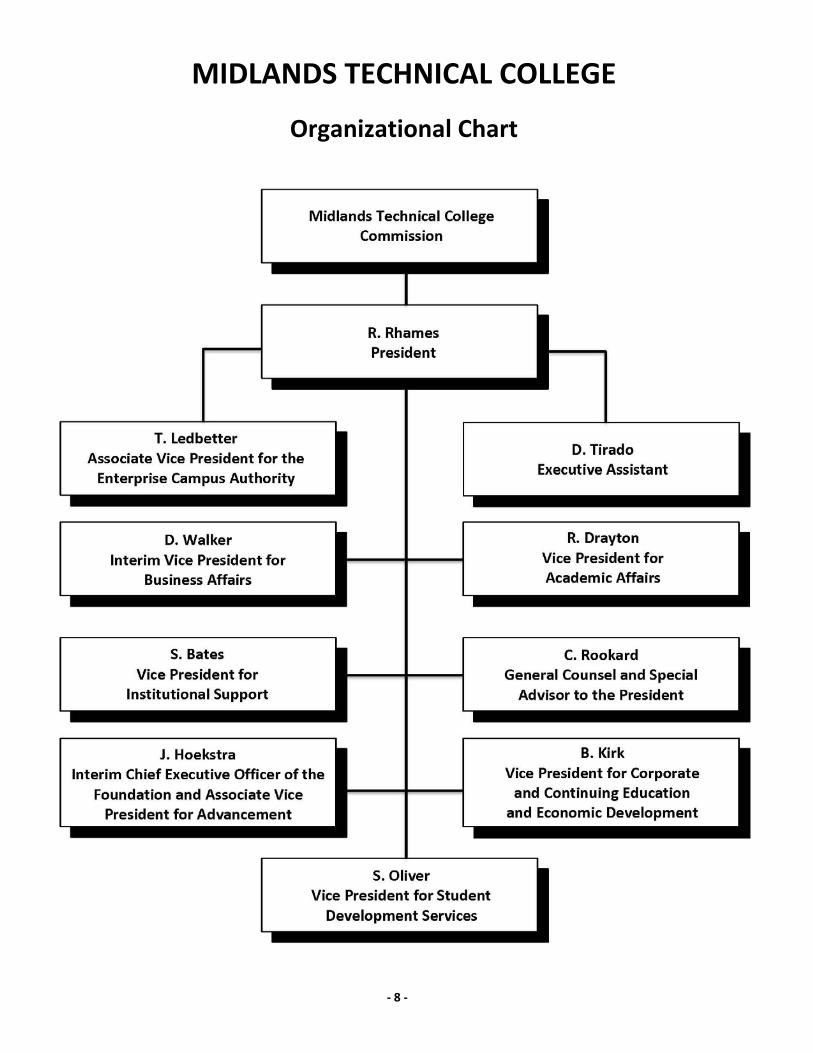
MIDLANDS TECHNICAL COLLEGE
Organizational Chart
- 8 -
MIDLANDS TECHNICAL COLLEGE
Organizational Chart
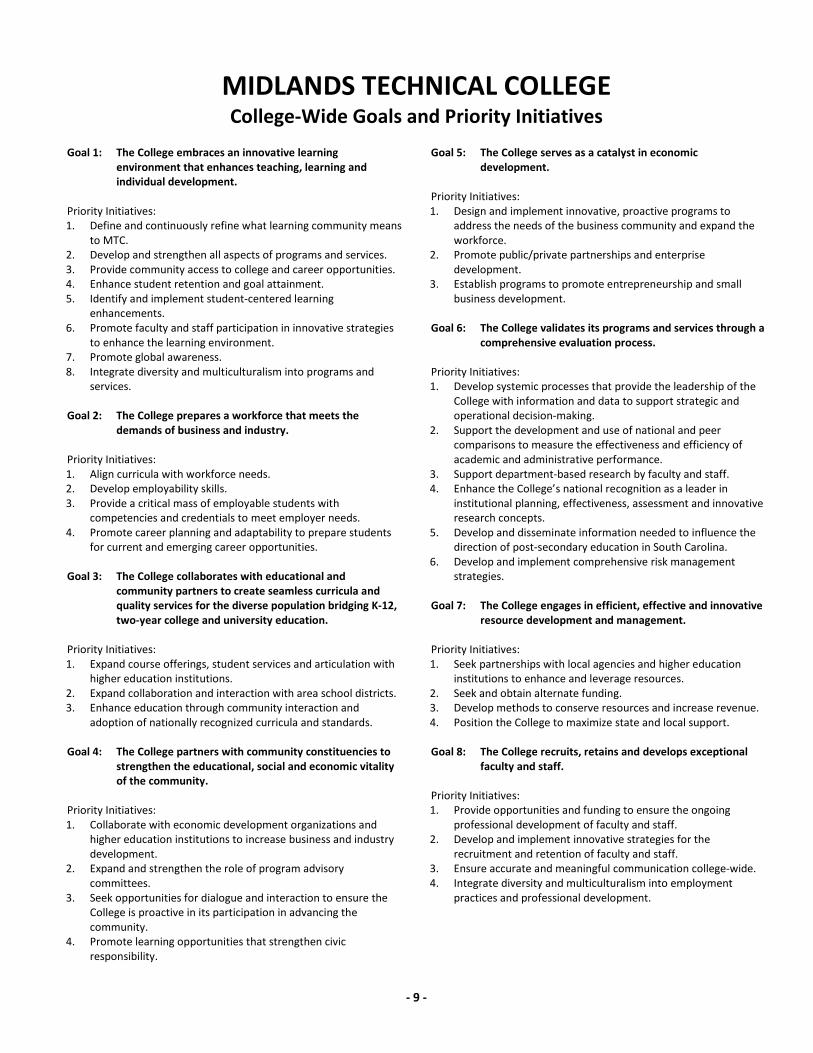
MIDLANDS TECHNICAL COLLEGE College-Wide Goals and Priority Initiatives
Goal 1: The College embraces an innovative learning environment that enhances teaching, learning and individual development.
Priority Initiatives: 1. Define and continuously refine what learning community means
to MTC. 2. Develop and strengthen all aspects of programs and services.3. Provide community access to college and career opportunities.4. Enhance student retention and goal attainment.5. Identify and implement student-centered learning
enhancements.6. Promote faculty and staff participation in innovative strategies
to enhance the learning environment.7. Promote global awareness.8. Integrate diversity and multiculturalism into programs and
services.
Goal 2: The College prepares a workforce that meets the demands of business and industry.
Priority Initiatives: 1. Align curricula with workforce needs.2. Develop employability skills.3. Provide a critical mass of employable students with
competencies and credentials to meet employer needs.4. Promote career planning and adaptability to prepare students
for current and emerging career opportunities.
Goal 3: The College collaborates with educational and community partners to create seamless curricula and quality services for the diverse population bridging K-12, two-year college and university education.
Priority Initiatives: 1. Expand course offerings, student services and articulation with
higher education institutions. 2. Expand collaboration and interaction with area school districts.3. Enhance education through community interaction and
adoption of nationally recognized curricula and standards.
Goal 4: The College partners with community constituencies to strengthen the educational, social and economic vitality of the community.
Priority Initiatives: 1. Collaborate with economic development organizations and
higher education institutions to increase business and industry development.
2. Expand and strengthen the role of program advisorycommittees.
3. Seek opportunities for dialogue and interaction to ensure the College is proactive in its participation in advancing the community.
4. Promote learning opportunities that strengthen civicresponsibility.
Goal 5: The College serves as a catalyst in economic development.
Priority Initiatives: 1. Design and implement innovative, proactive programs to
address the needs of the business community and expand the workforce.
2. Promote public/private partnerships and enterprise development.
3. Establish programs to promote entrepreneurship and smallbusiness development.
Goal 6: The College validates its programs and services through a comprehensive evaluation process.
Priority Initiatives: 1. Develop systemic processes that provide the leadership of the
College with information and data to support strategic and operational decision-making.
2. Support the development and use of national and peercomparisons to measure the effectiveness and efficiency of academic and administrative performance.
3. Support department-based research by faculty and staff.4. Enhance the College’s national recognition as a leader in
institutional planning, effectiveness, assessment and innovativeresearch concepts.
5. Develop and disseminate information needed to influence the direction of post-secondary education in South Carolina.
6. Develop and implement comprehensive risk managementstrategies.
Goal 7: The College engages in efficient, effective and innovative resource development and management.
Priority Initiatives: 1. Seek partnerships with local agencies and higher education
institutions to enhance and leverage resources. 2. Seek and obtain alternate funding.3. Develop methods to conserve resources and increase revenue.4. Position the College to maximize state and local support.
Goal 8: The College recruits, retains and develops exceptional faculty and staff.
Priority Initiatives: 1. Provide opportunities and funding to ensure the ongoing
professional development of faculty and staff. 2. Develop and implement innovative strategies for the
recruitment and retention of faculty and staff. 3. Ensure accurate and meaningful communication college-wide.4. Integrate diversity and multiculturalism into employment
practices and professional development.
- 9 -

This page intentionally left blank
- 10 -
INDEPENDENT AUDITOR’S REPORT
The President and Members of the Area Commission Midlands Technical College Post Office Box 2408 Columbia, South Carolina 29202
Report on Financial Statements We have audited the accompanying financial statements of the business-type activities of Midlands Technical College (the “College”), a component unit of the State of South Carolina and a member institution of the South Carolina Technical College System, including its blended component unit, the Midlands Technical College Enterprise Campus Authority (the “Authority”), and its discretely presented component unit, Midlands Technical College Foundation, Inc. (the “Foundation”), as of and for the year ended June 30, 2015, and the related notes to the financial statements, which collectively comprise the College’s basic financial statements as listed in the table of contents.
Management’s Responsibility for the Financial Statements Management is responsible for the preparation and fair presentation of these financial statements in accordance with accounting principles generally accepted in the United States of America; this includes the design, implementation, and maintenance of internal control relevant to the preparation and fair presentation of financial statements that are free from material misstatement, whether due to fraud or error.
Auditor’s Responsibility Our responsibility is to express opinions on these financial statements based on our audit. We conducted our audit in accordance with auditing standards generally accepted in the United States of America and the standards applicable to financial audits contained in Government Auditing Standards, issued by the Comptroller General of the United States. Those standards require that we plan and perform the audit to obtain reasonable assurance about whether the financial statements are free from material misstatement.
An audit involves performing procedures to obtain audit evidence about the amounts and disclosures in the financial statements. The procedures selected depend on the auditor’s judgment, including the assessment of the risks of material misstatement of the financial statements, whether due to fraud or error. In making those risk assessments, the auditor considers internal control relevant to the College’s preparation and fair presentation of the financial statements in order to design audit procedures that are appropriate in the circumstances, but not for the purpose of expressing an opinion on the effectiveness of the College’s internal control. Accordingly, we express no such opinion. An audit also includes evaluating the appropriateness of accounting policies used and the reasonableness of significant accounting estimates made by management, as well as evaluating the overall presentation of the financial statements.
We believe that the audit evidence we have obtained is sufficient and appropriate to provide a basis for our audit opinions.
Opinions In our opinion, the financial statements referred to above present fairly, in all material respects, the respective financial position of the business-type activities and the discretely presented component unit of the College, as of June 30, 2015, and the respective changes in financial position, and, cash flows thereof for the year then ended in accordance with accounting principles generally accepted in the United States of America.
- 11 -
Change in Accounting Principle As discussed in Notes 6 and 21 to the financial statements, in 2015 the College adopted new accounting guidance, GASB Statement No. 68, Accounting and Financial Reporting for Pensions – An Amendment of GASB Statement No. 27. Our opinion is not modified with respect to this matter.
Other Matters Required Supplementary Information Accounting principles generally accepted in the United States of America require that the management’s discussion and analysis, Schedule of Proportionate Share of South Carolina Retirement Systems Net Pension Liabilities, and Schedule of South Carolina Retirement Systems Contributions on pages 15 – 19, 57, and 58 be presented to supplement the basic financial statements. Such information, although not a part of the basic financial statements, is required by the Governmental Accounting Standards Board, who considers it to be an essential part of financial reporting for placing the basic financial statements in an appropriate operational, economic, or historical context. We have applied certain limited procedures to the required supplementary information in accordance with auditing standards generally accepted in the United States of America, which consisted of inquiries of management about the methods of preparing the information and comparing the information for consistency with management’s responses to our inquiries, the basic financial statements, and other knowledge we obtained during our audit of the basic financial statements. We do not express an opinion or provide any assurance on the information because the limited procedures do not provide us with sufficient evidence to express an opinion or provide any assurance.
Supplementary and Other Information Our audit was conducted for the purpose of forming opinions on the financial statements that collectively comprise the College’s basic financial statements. The introductory section and statistical section are presented for purposes of additional analysis and are not a required part of the basic financial statements. The schedule of expenditures of federal awards is presented for purposes of additional analysis as required by U.S. Office of Management and Budget Circular A- 133, Audits of States, Local Governments, and Non‐Profit Organizations, and is also not a required part of the basic financial statements.
The schedule of expenditures of federal awards is the responsibility of management and was derived from and relate directly to the underlying accounting and other records used to prepare the basic financial statements. Such information has been subjected to the auditing procedures applied in the audit of the basic financial statements and certain additional procedures, including comparing and reconciling such information directly to the underlying accounting and other records used to prepare the basic financial statements or to the basic financial statements themselves, and other additional procedures in accordance with auditing standards generally accepted in the United States of America. In our opinion, the schedule of expenditures of federal awards is fairly stated in all material respects in relation to the basic financial statements as a whole.
The introductory and statistical sections have not been subjected to the auditing procedures applied in the audit of the basic financial statements and, accordingly, we do not express an opinion or provide any assurance on them.
Other Reporting Required by Government Auditing Standards In accordance with Government Auditing Standards, we have also issued our report dated September 28, 2015 on our consideration of the College’s internal control over financial reporting and on our tests of its compliance with certain provisions of laws, regulations, contracts, and grant agreements and other matters. The purpose of that report is to describe the scope of our testing of internal control over financial reporting and compliance and the results of that testing, and not to provide an opinion on internal control over financial reporting or on compliance. That report is an integral part of an audit performed in accordance with Government Auditing Standards in considering the College’s internal control over financial reporting and compliance.
West Columbia, South Carolina September 28, 2015
- 12 -
Management’s Discussion and Analysis
MIDLANDS TECHNICAL COLLEGE
- 13 -

This page intentionally left blank
- 14 -
MANAGEMENT’S DISCUSSION AND ANALYSIS
This section of the Comprehensive Annual Financial Report of Midlands Technical College (the College) presents management’s discussion and analysis of the College’s financial performance during the fiscal year ended June 30, 2015. This discussion should be read in conjunction with the transmittal letter, the College’s basic financial statements, the component unit’s financial statements and the notes to the financial statements. COMPONENT UNITS The College has included the Midlands Technical College Foundation, Inc., (the Foundation) and the Midlands Technical College Enterprise Campus Authority (the Authority) in its financial statements in accordance with Governmental Accounting Standards Board Statement No. 39, Determining Whether Certain Organizations are Component Units. The Foundation is reported as a discretely presented component unit of the College. The Statement of Financial Position, the Statement of Activities and relevant note disclosures for the Foundation follow the College’s financial statements. The governing body of the Authority is essentially the same Board as that of the College and it provides services that benefit the College, although it does not provide services directly to the College; therefore the Authority is reported as a blended component unit and the activity is included in the financial statements of the College. Complete financial statements for the Foundation or the Authority may be obtained by mailing a request to Midlands Technical College, Interim Executive Director for Business Affairs, Post Office Box 2408, Columbia, South Carolina 29202. USING THIS ANNUAL REPORT Midlands Technical College is pleased to present its financial statements for fiscal year ended June 30, 2015. Comparative financial statements are not presented in this report; however, condensed data is presented in this section, which will aid the reader in assessing the changes in the College’s financial position since last year. The emphasis of discussions regarding these statements will focus on the current year.
The College is engaged only in Business-Type Activities that are financed in part by fees charged to students for educational services. Accordingly, its activities are reported using the three financial statements required for proprietary funds: Statement of Net Position; Statement of Revenues, Expenses and Changes in Net Position; and Statement of Cash Flows. These statements present financial information in a format similar to that used by the private sector. STATEMENT OF NET POSITION The Statement of Net Position provides a snapshot of the College’s assets, deferred outflows of resources, liabilities, deferred inflows of resources and net position at the end of the fiscal year. It provides the reader with information concerning the Institution’s ability to continue its operations and to determine its financial stability. Assets and liabilities are separated into current, those that are due or to be paid within the current year, and non-current, those that are longer term in nature. Net position represents total assets and deferred outflows of resources, minus total liabilities and deferred inflows of resources and provides information, in part, concerning any amount available to be spent by the institution. Net position is divided into three major categories. The first category, net invested in capital assets, provides the equity in property, plant and equipment owned by the College. The next category, which is restricted net position, is expendable in nature and is specifically for capital projects and debt service, as indicated. The final category of net position is unrestricted, and not subject to external stipulations. These amounts represent the net position of the Authority and the College’s 30-day operating reserve, as well as, the College’s proportionate share of the unfunded pension liability. Assets and Deferred Outflows of Resources The following schedule is a condensed version of the College’s assets, deferred outflows of resources, liabilities, deferred inflows of resources and net position and is prepared from the Statement of Net Position.
- 15 -
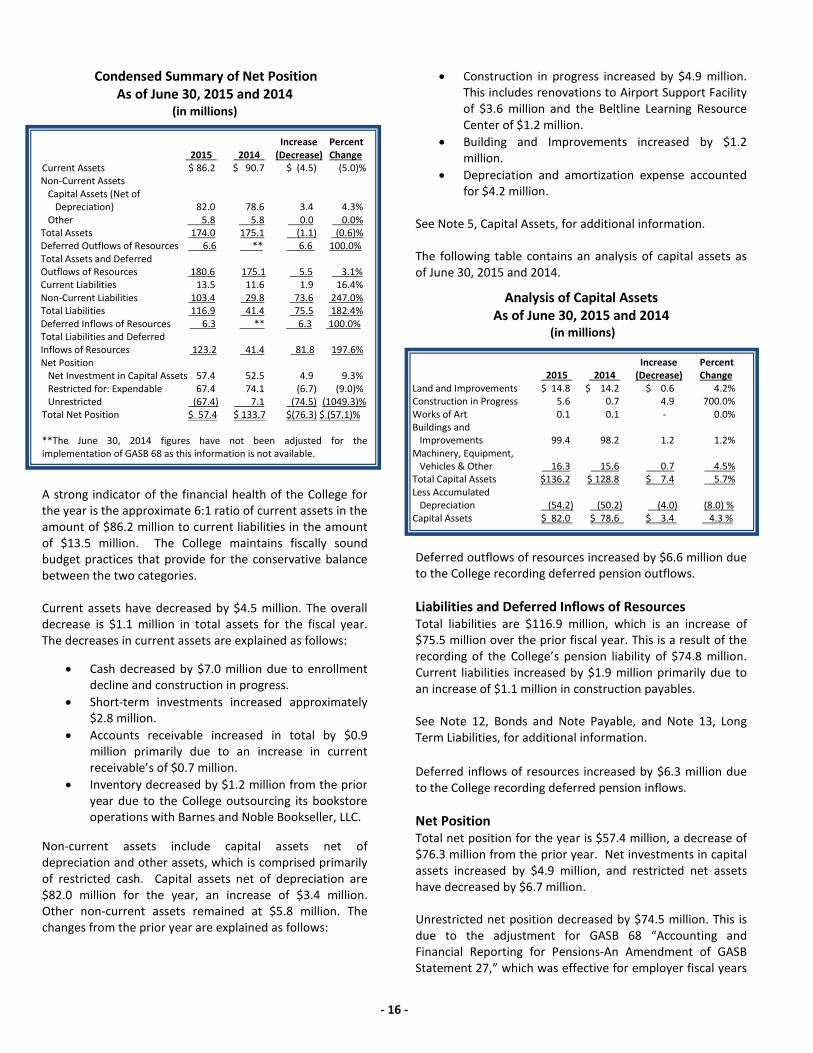
Condensed Summary of Net Position As of June 30, 2015 and 2014
(in millions)
Increase Percent 2015 2014 (Decrease) Change Current Assets $ 86.2 $ 90.7 $ (4.5) (5.0)% Non-Current Assets Capital Assets (Net of Depreciation) 82.0 78.6 3.4 4.3% Other 5.8 5.8 0.0 0.0% Total Assets 174.0 175.1 (1.1) (0.6)% Deferred Outflows of Resources 6.6 ** 6.6 100.0% Total Assets and Deferred Outflows of Resources 180.6 175.1 5.5 3.1% Current Liabilities 13.5 11.6 1.9 16.4% Non-Current Liabilities 103.4 29.8 73.6 247.0% Total Liabilities 116.9 41.4 75.5 182.4% Deferred Inflows of Resources 6.3 ** 6.3 100.0% Total Liabilities and Deferred Inflows of Resources 123.2 41.4 81.8 197.6% Net Position Net Investment in Capital Assets 57.4 52.5 4.9 9.3% Restricted for: Expendable 67.4 74.1 (6.7) (9.0)% Unrestricted (67.4) 7.1 (74.5) (1049.3)% Total Net Position $ 57.4 $ 133.7 $(76.3) $ (57.1)% **The June 30, 2014 figures have not been adjusted for the implementation of GASB 68 as this information is not available.
A strong indicator of the financial health of the College for the year is the approximate 6:1 ratio of current assets in the amount of $86.2 million to current liabilities in the amount of $13.5 million. The College maintains fiscally sound budget practices that provide for the conservative balance between the two categories. Current assets have decreased by $4.5 million. The overall decrease is $1.1 million in total assets for the fiscal year. The decreases in current assets are explained as follows:
• Cash decreased by $7.0 million due to enrollment decline and construction in progress.
• Short-term investments increased approximately $2.8 million.
• Accounts receivable increased in total by $0.9 million primarily due to an increase in current receivable’s of $0.7 million.
• Inventory decreased by $1.2 million from the prior year due to the College outsourcing its bookstore operations with Barnes and Noble Bookseller, LLC.
Non-current assets include capital assets net of depreciation and other assets, which is comprised primarily of restricted cash. Capital assets net of depreciation are $82.0 million for the year, an increase of $3.4 million. Other non-current assets remained at $5.8 million. The changes from the prior year are explained as follows:
• Construction in progress increased by $4.9 million. This includes renovations to Airport Support Facility of $3.6 million and the Beltline Learning Resource Center of $1.2 million.
• Building and Improvements increased by $1.2 million.
• Depreciation and amortization expense accounted for $4.2 million.
See Note 5, Capital Assets, for additional information. The following table contains an analysis of capital assets as of June 30, 2015 and 2014.
Analysis of Capital Assets As of June 30, 2015 and 2014
(in millions)
Increase Percent 2015 2014 (Decrease) Change Land and Improvements $ 14.8 $ 14.2 $ 0.6 4.2% Construction in Progress 5.6 0.7 4.9 700.0% Works of Art 0.1 0.1 - 0.0% Buildings and Improvements 99.4 98.2 1.2 1.2% Machinery, Equipment, Vehicles & Other 16.3 15.6 0.7 4.5% Total Capital Assets $136.2 $ 128.8 $ 7.4 5.7% Less Accumulated Depreciation (54.2) (50.2) (4.0) (8.0) % Capital Assets $ 82.0 $ 78.6 $ 3.4 4.3 %
Deferred outflows of resources increased by $6.6 million due to the College recording deferred pension outflows. Liabilities and Deferred Inflows of Resources Total liabilities are $116.9 million, which is an increase of $75.5 million over the prior fiscal year. This is a result of the recording of the College’s pension liability of $74.8 million. Current liabilities increased by $1.9 million primarily due to an increase of $1.1 million in construction payables. See Note 12, Bonds and Note Payable, and Note 13, Long Term Liabilities, for additional information. Deferred inflows of resources increased by $6.3 million due to the College recording deferred pension inflows. Net Position Total net position for the year is $57.4 million, a decrease of $76.3 million from the prior year. Net investments in capital assets increased by $4.9 million, and restricted net assets have decreased by $6.7 million. Unrestricted net position decreased by $74.5 million. This is due to the adjustment for GASB 68 “Accounting and Financial Reporting for Pensions-An Amendment of GASB Statement 27,” which was effective for employer fiscal years
- 16 -
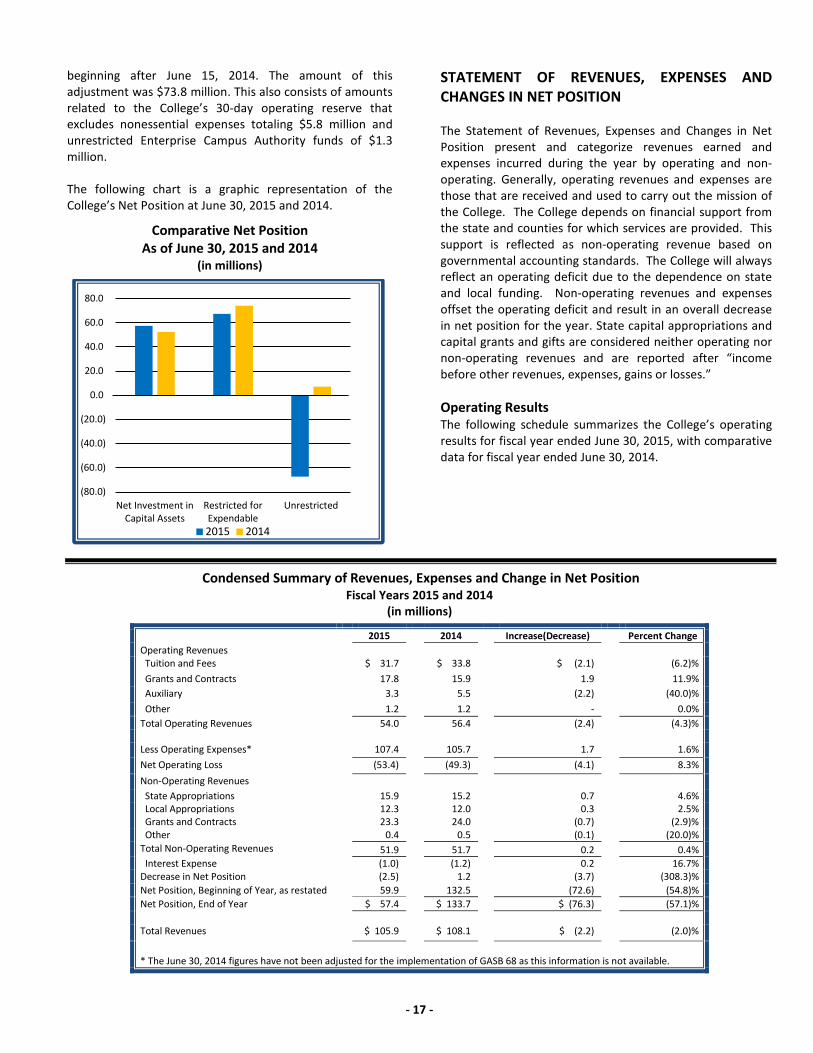
beginning after June 15, 2014. The amount of this adjustment was $73.8 million. This also consists of amounts related to the College’s 30-day operating reserve that excludes nonessential expenses totaling $5.8 million and unrestricted Enterprise Campus Authority funds of $1.3 million. The following chart is a graphic representation of the College’s Net Position at June 30, 2015 and 2014.
Comparative Net Position As of June 30, 2015 and 2014
(in millions)
STATEMENT OF REVENUES, EXPENSES AND CHANGES IN NET POSITION The Statement of Revenues, Expenses and Changes in Net Position present and categorize revenues earned and expenses incurred during the year by operating and non-operating. Generally, operating revenues and expenses are those that are received and used to carry out the mission of the College. The College depends on financial support from the state and counties for which services are provided. This support is reflected as non-operating revenue based on governmental accounting standards. The College will always reflect an operating deficit due to the dependence on state and local funding. Non-operating revenues and expenses offset the operating deficit and result in an overall decrease in net position for the year. State capital appropriations and capital grants and gifts are considered neither operating nor non-operating revenues and are reported after “income before other revenues, expenses, gains or losses.” Operating Results The following schedule summarizes the College’s operating results for fiscal year ended June 30, 2015, with comparative data for fiscal year ended June 30, 2014.
Condensed Summary of Revenues, Expenses and Change in Net Position Fiscal Years 2015 and 2014
(in millions)
2015 2014 Increase(Decrease) Percent Change Operating Revenues Tuition and Fees $ 31.7 $ 33.8 $ (2.1) (6.2)% Grants and Contracts 17.8 15.9 1.9 11.9% Auxiliary 3.3 5.5 (2.2) (40.0)% Other 1.2 1.2 - 0.0% Total Operating Revenues 54.0 56.4 (2.4) (4.3)% Less Operating Expenses* 107.4 105.7 1.7 1.6% Net Operating Loss (53.4) (49.3) (4.1) 8.3% Non-Operating Revenues State Appropriations 15.9 15.2 0.7 4.6% Local Appropriations 12.3 12.0 0.3 2.5% Grants and Contracts 23.3 24.0 (0.7) (2.9)% Other 0.4 0.5 (0.1) (20.0)% Total Non-Operating Revenues 51.9 51.7 0.2 0.4% Interest Expense (1.0) (1.2) 0.2 16.7% Decrease in Net Position (2.5) 1.2 (3.7) (308.3)% Net Position, Beginning of Year, as restated 59.9 132.5 (72.6) (54.8)% Net Position, End of Year $ 57.4 $ 133.7 $ (76.3) (57.1)% Total Revenues $ 105.9 $ 108.1 $ (2.2) (2.0)%
* The June 30, 2014 figures have not been adjusted for the implementation of GASB 68 as this information is not available.
(80.0)
(60.0)
(40.0)
(20.0)
0.0
20.0
40.0
60.0
80.0
Net Investment inCapital Assets
Restricted forExpendable
Unrestricted
2015 2014
- 17 -
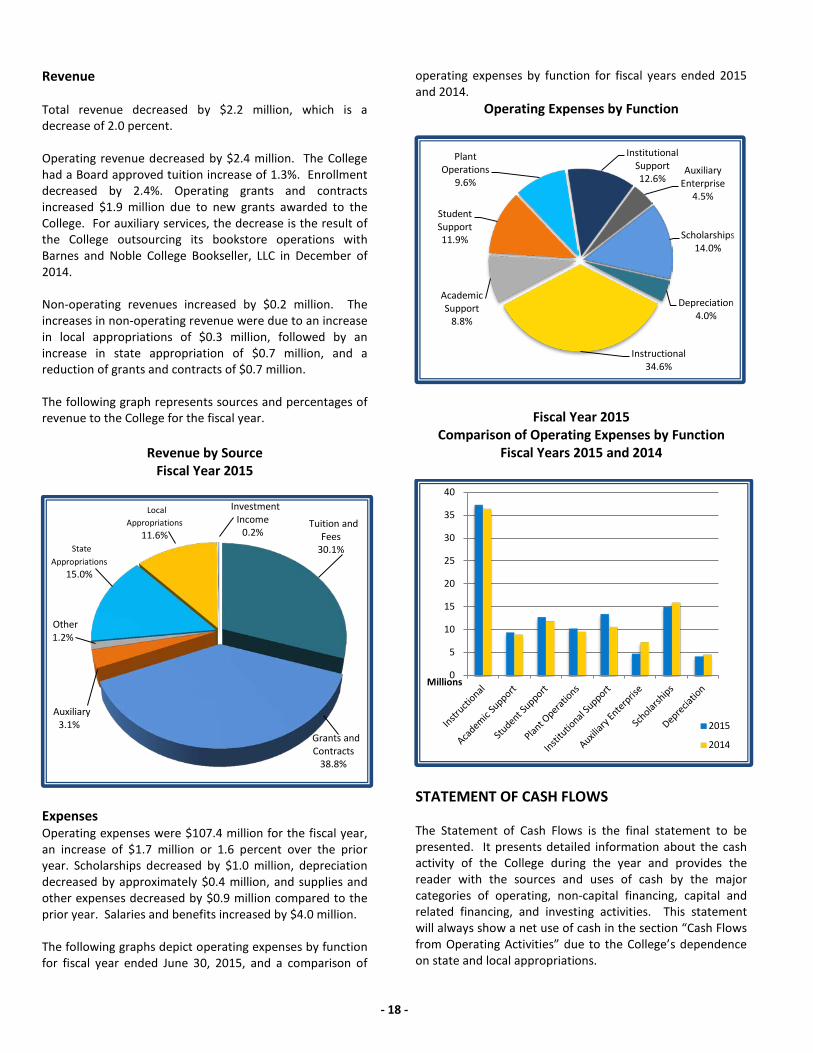
Revenue Total revenue decreased by $2.2 million, which is a decrease of 2.0 percent. Operating revenue decreased by $2.4 million. The College had a Board approved tuition increase of 1.3%. Enrollment decreased by 2.4%. Operating grants and contracts increased $1.9 million due to new grants awarded to the College. For auxiliary services, the decrease is the result of the College outsourcing its bookstore operations with Barnes and Noble College Bookseller, LLC in December of 2014. Non-operating revenues increased by $0.2 million. The increases in non-operating revenue were due to an increase in local appropriations of $0.3 million, followed by an increase in state appropriation of $0.7 million, and a reduction of grants and contracts of $0.7 million. The following graph represents sources and percentages of revenue to the College for the fiscal year.
Revenue by Source
Fiscal Year 2015
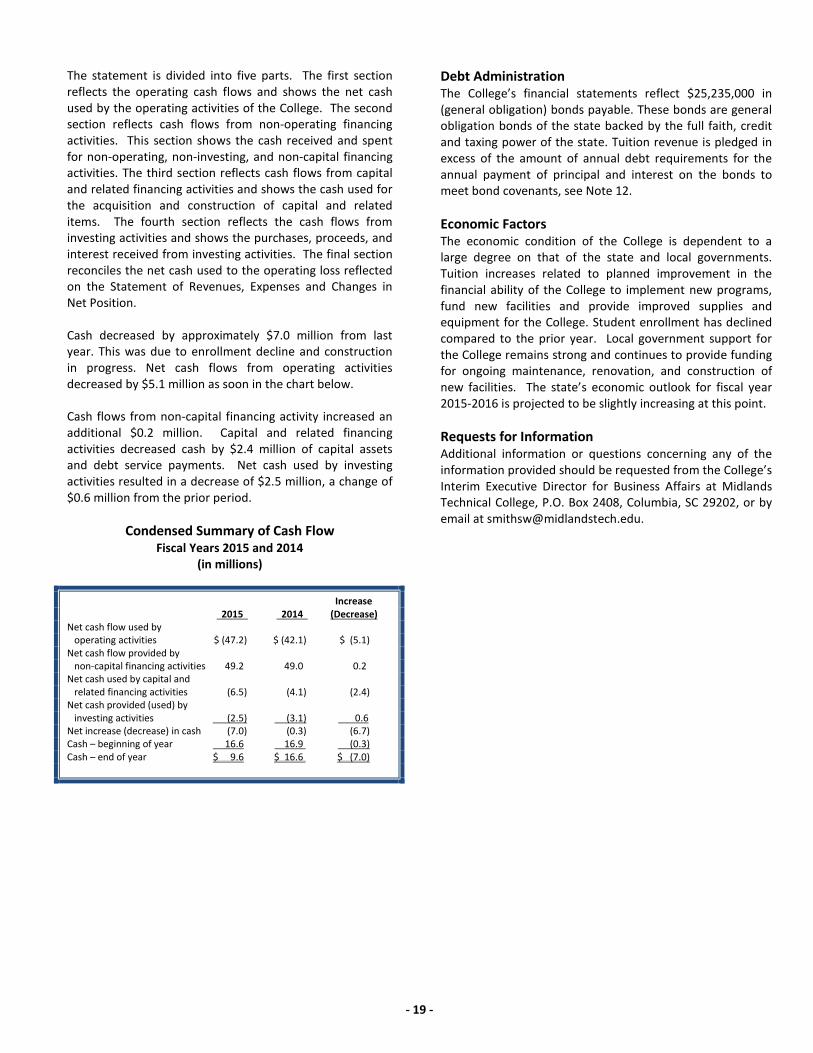
Expenses Operating expenses were $107.4 million for the fiscal year, an increase of $1.7 million or 1.6 percent over the prior year. Scholarships decreased by $1.0 million, depreciation decreased by approximately $0.4 million, and supplies and other expenses decreased by $0.9 million compared to the prior year. Salaries and benefits increased by $4.0 million. The following graphs depict operating expenses by function for fiscal year ended June 30, 2015, and a comparison of
operating expenses by function for fiscal years ended 2015 and 2014.
Operating Expenses by Function
Fiscal Year 2015 Comparison of Operating Expenses by Function
Fiscal Years 2015 and 2014
STATEMENT OF CASH FLOWS The Statement of Cash Flows is the final statement to be presented. It presents detailed information about the cash activity of the College during the year and provides the reader with the sources and uses of cash by the major categories of operating, non-capital financing, capital and related financing, and investing activities. This statement will always show a net use of cash in the section “Cash Flows from Operating Activities” due to the College’s dependence on state and local appropriations.
Tuition and Fees
30.1%
Grants and Contracts
38.8%
Auxiliary 3.1%
Other 1.2%
State Appropriations
15.0%
Local Appropriations
11.6%
Investment Income
0.2%
0
5
10
15
20
25
30
35
40
Millions
2015
2014
Instructional 34.6%
Academic Support
8.8%
Student Support 11.9%
Plant Operations
9.6%
Institutional Support 12.6%
Auxiliary Enterprise
4.5%
Scholarships 14.0%
Depreciation 4.0%
- 18 -
The statement is divided into five parts. The first section reflects the operating cash flows and shows the net cash used by the operating activities of the College. The second section reflects cash flows from non-operating financing activities. This section shows the cash received and spent for non-operating, non-investing, and non-capital financing activities. The third section reflects cash flows from capital and related financing activities and shows the cash used for the acquisition and construction of capital and related items. The fourth section reflects the cash flows from investing activities and shows the purchases, proceeds, and interest received from investing activities. The final section reconciles the net cash used to the operating loss reflected on the Statement of Revenues, Expenses and Changes in Net Position. Cash decreased by approximately $7.0 million from last year. This was due to enrollment decline and construction in progress. Net cash flows from operating activities decreased by $5.1 million as soon in the chart below. Cash flows from non-capital financing activity increased an additional $0.2 million. Capital and related financing activities decreased cash by $2.4 million of capital assets and debt service payments. Net cash used by investing activities resulted in a decrease of $2.5 million, a change of $0.6 million from the prior period.
Condensed Summary of Cash Flow Fiscal Years 2015 and 2014
(in millions)
Increase 2015 2014 (Decrease) Net cash flow used by operating activities $ (47.2) $ (42.1) $ (5.1) Net cash flow provided by non-capital financing activities 49.2 49.0 0.2 Net cash used by capital and related financing activities (6.5) (4.1) (2.4) Net cash provided (used) by investing activities (2.5) (3.1) 0.6 Net increase (decrease) in cash (7.0) (0.3) (6.7) Cash – beginning of year 16.6 16.9 (0.3) Cash – end of year $ 9.6 $ 16.6 $ (7.0)
Debt Administration The College’s financial statements reflect $25,235,000 in (general obligation) bonds payable. These bonds are general obligation bonds of the state backed by the full faith, credit and taxing power of the state. Tuition revenue is pledged in excess of the amount of annual debt requirements for the annual payment of principal and interest on the bonds to meet bond covenants, see Note 12. Economic Factors The economic condition of the College is dependent to a large degree on that of the state and local governments. Tuition increases related to planned improvement in the financial ability of the College to implement new programs, fund new facilities and provide improved supplies and equipment for the College. Student enrollment has declined compared to the prior year. Local government support for the College remains strong and continues to provide funding for ongoing maintenance, renovation, and construction of new facilities. The state’s economic outlook for fiscal year 2015-2016 is projected to be slightly increasing at this point. Requests for Information Additional information or questions concerning any of the information provided should be requested from the College’s Interim Executive Director for Business Affairs at Midlands Technical College, P.O. Box 2408, Columbia, SC 29202, or by email at [email protected].
- 19 -

This page intentionally left blank
- 20 -
Basic Financial Statements
MIDLANDS TECHNICAL COLLEGE
- 21 -

This page intentionally left blank
- 22 -
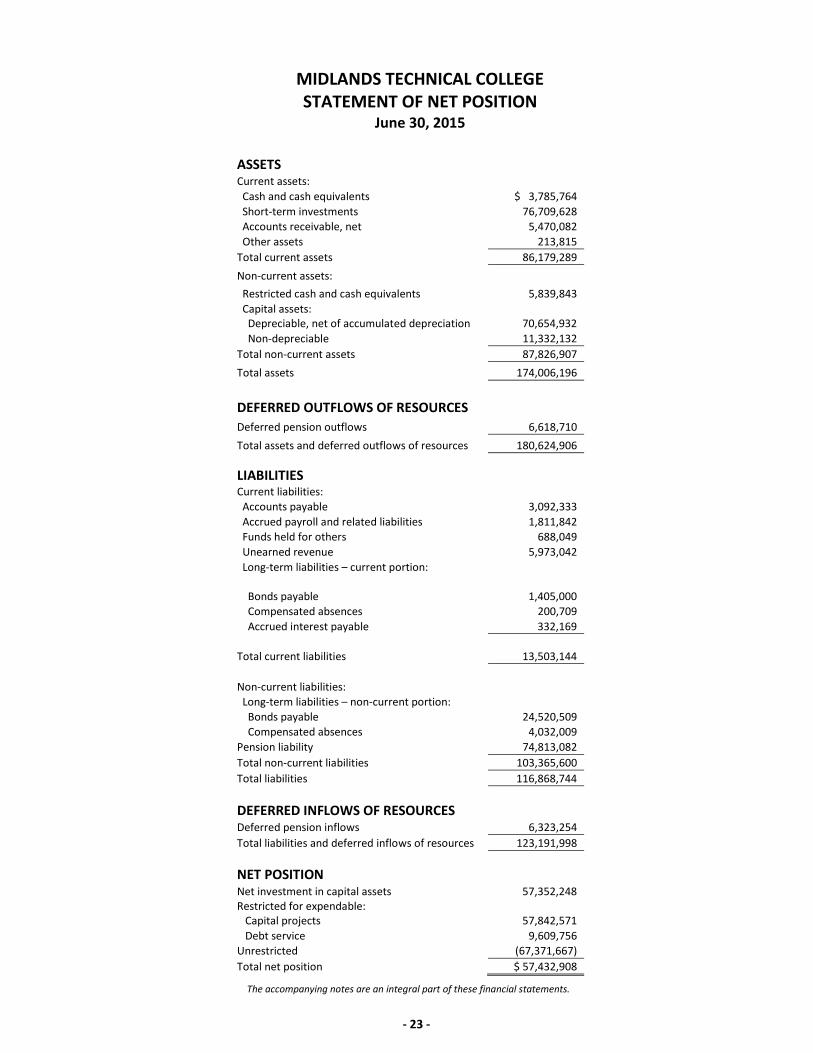
MIDLANDS TECHNICAL COLLEGE STATEMENT OF NET POSITION
June 30, 2015
ASSETS Current assets: Cash and cash equivalents $ 3,785,764 Short-term investments 76,709,628 Accounts receivable, net 5,470,082 Other assets 213,815 Total current assets 86,179,289 Non-current assets: Restricted cash and cash equivalents 5,839,843 Capital assets: Depreciable, net of accumulated depreciation 70,654,932 Non-depreciable 11,332,132 Total non-current assets 87,826,907 Total assets 174,006,196 DEFERRED OUTFLOWS OF RESOURCES Deferred pension outflows 6,618,710 Total assets and deferred outflows of resources 180,624,906 LIABILITIES Current liabilities: Accounts payable 3,092,333 Accrued payroll and related liabilities 1,811,842 Funds held for others 688,049 Unearned revenue 5,973,042 Long-term liabilities – current portion:
Bonds payable
1,405,000 Compensated absences 200,709 Accrued interest payable 332,169
Total current liabilities
13,503,144 Non-current liabilities: Long-term liabilities – non-current portion: Bonds payable 24,520,509 Compensated absences 4,032,009 Pension liability 74,813,082 Total non-current liabilities 103,365,600 Total liabilities 116,868,744 DEFERRED INFLOWS OF RESOURCES Deferred pension inflows 6,323,254 Total liabilities and deferred inflows of resources 123,191,998 NET POSITION Net investment in capital assets 57,352,248 Restricted for expendable: Capital projects 57,842,571 Debt service 9,609,756 Unrestricted (67,371,667) Total net position $ 57,432,908
The accompanying notes are an integral part of these financial statements.
- 23 -
MIDLANDS TECHNICAL COLLEGE
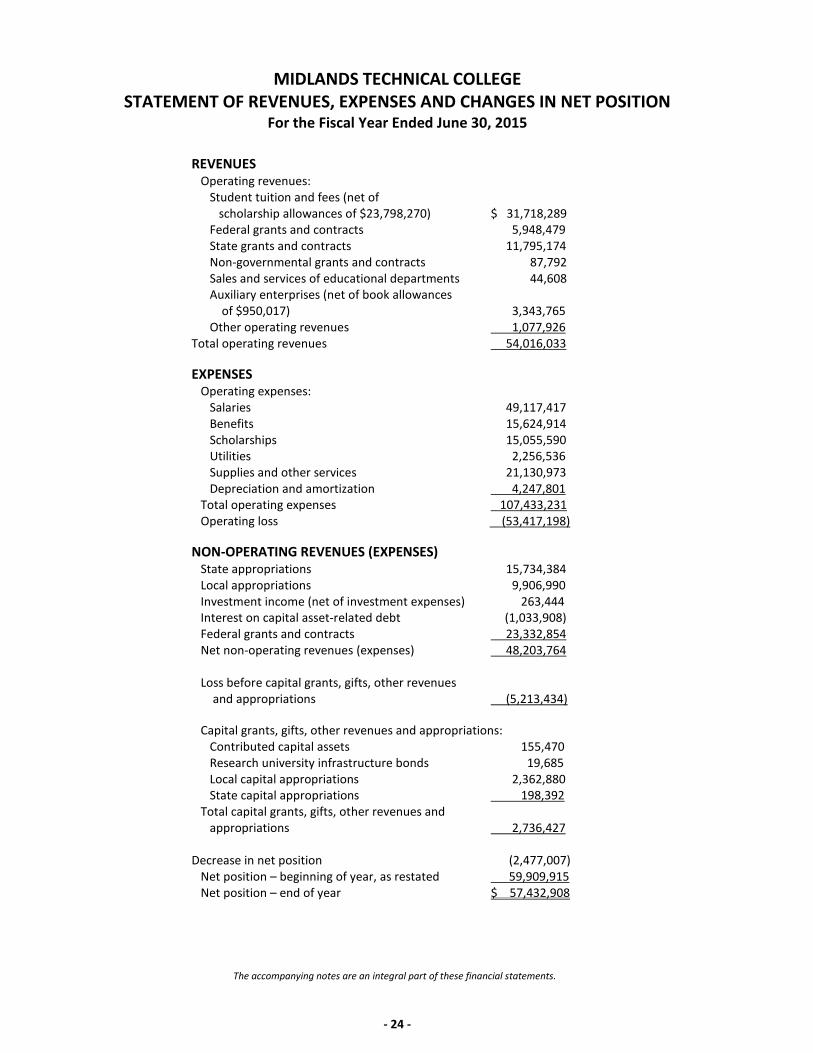
STATEMENT OF REVENUES, EXPENSES AND CHANGES IN NET POSITION For the Fiscal Year Ended June 30, 2015
REVENUES Operating revenues: Student tuition and fees (net of scholarship allowances of $23,798,270) $ 31,718,289 Federal grants and contracts 5,948,479 State grants and contracts 11,795,174 Non-governmental grants and contracts 87,792 Sales and services of educational departments 44,608 Auxiliary enterprises (net of book allowances of $950,017) 3,343,765 Other operating revenues 1,077,926 Total operating revenues 54,016,033 EXPENSES Operating expenses: Salaries 49,117,417 Benefits 15,624,914 Scholarships 15,055,590 Utilities 2,256,536 Supplies and other services 21,130,973 Depreciation and amortization 4,247,801 Total operating expenses 107,433,231 Operating loss (53,417,198) NON-OPERATING REVENUES (EXPENSES) State appropriations 15,734,384 Local appropriations 9,906,990 Investment income (net of investment expenses) 263,444 Interest on capital asset-related debt (1,033,908) Federal grants and contracts 23,332,854 Net non-operating revenues (expenses) 48,203,764 Loss before capital grants, gifts, other revenues and appropriations (5,213,434) Capital grants, gifts, other revenues and appropriations: Contributed capital assets 155,470 Research university infrastructure bonds 19,685 Local capital appropriations 2,362,880 State capital appropriations 198,392 Total capital grants, gifts, other revenues and appropriations 2,736,427 Decrease in net position (2,477,007) Net position – beginning of year, as restated 59,909,915 Net position – end of year $ 57,432,908
The accompanying notes are an integral part of these financial statements.
- 24 -
MIDLANDS TECHNICAL COLLEGE
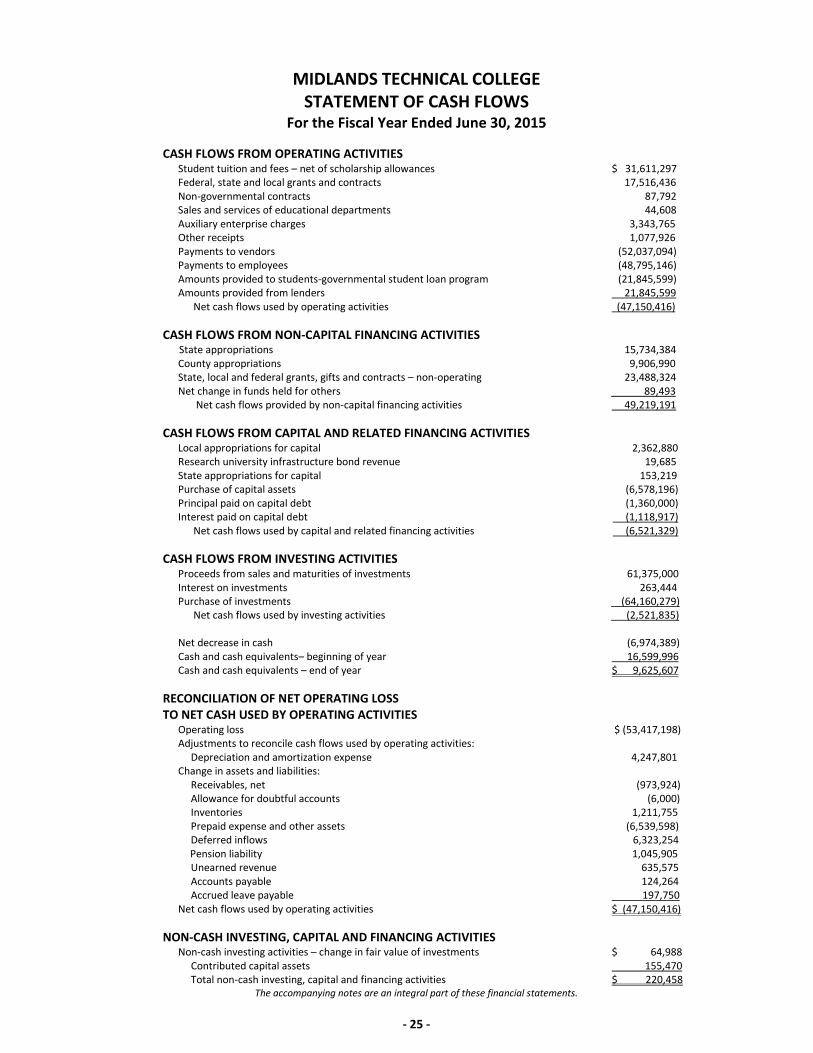
STATEMENT OF CASH FLOWS For the Fiscal Year Ended June 30, 2015
CASH FLOWS FROM OPERATING ACTIVITIES Student tuition and fees – net of scholarship allowances $ 31,611,297 Federal, state and local grants and contracts 17,516,436 Non-governmental contracts 87,792 Sales and services of educational departments 44,608 Auxiliary enterprise charges 3,343,765 Other receipts 1,077,926 Payments to vendors (52,037,094) Payments to employees (48,795,146) Amounts provided to students-governmental student loan program (21,845,599) Amounts provided from lenders 21,845,599 Net cash flows used by operating activities (47,150,416) CASH FLOWS FROM NON-CAPITAL FINANCING ACTIVITIES State appropriations 15,734,384 County appropriations 9,906,990 State, local and federal grants, gifts and contracts – non-operating 23,488,324 Net change in funds held for others 89,493 Net cash flows provided by non-capital financing activities 49,219,191 CASH FLOWS FROM CAPITAL AND RELATED FINANCING ACTIVITIES Local appropriations for capital 2,362,880 Research university infrastructure bond revenue 19,685 State appropriations for capital 153,219 Purchase of capital assets (6,578,196) Principal paid on capital debt (1,360,000) Interest paid on capital debt (1,118,917) Net cash flows used by capital and related financing activities (6,521,329) CASH FLOWS FROM INVESTING ACTIVITIES Proceeds from sales and maturities of investments 61,375,000 Interest on investments 263,444 Purchase of investments (64,160,279) Net cash flows used by investing activities (2,521,835) Net decrease in cash (6,974,389) Cash and cash equivalents– beginning of year 16,599,996 Cash and cash equivalents – end of year $ 9,625,607 RECONCILIATION OF NET OPERATING LOSS TO NET CASH USED BY OPERATING ACTIVITIES Operating loss $ (53,417,198) Adjustments to reconcile cash flows used by operating activities: Depreciation and amortization expense 4,247,801 Change in assets and liabilities: Receivables, net (973,924) Allowance for doubtful accounts (6,000) Inventories 1,211,755 Prepaid expense and other assets (6,539,598) Deferred inflows 6,323,254 Pension liability 1,045,905 Unearned revenue 635,575 Accounts payable 124,264 Accrued leave payable 197,750 Net cash flows used by operating activities $ (47,150,416) NON-CASH INVESTING, CAPITAL AND FINANCING ACTIVITIES Non-cash investing activities – change in fair value of investments $ 64,988 Contributed capital assets 155,470 Total non-cash investing, capital and financing activities $ 220,458
The accompanying notes are an integral part of these financial statements.
- 25 -
MIDLANDS TECHNICAL COLLEGE FOUNDATION, INC.
DISCRETELY PRESENTED COMPONENT UNIT STATEMENT OF FINANCIAL POSITION
As of June 30, 2015 |
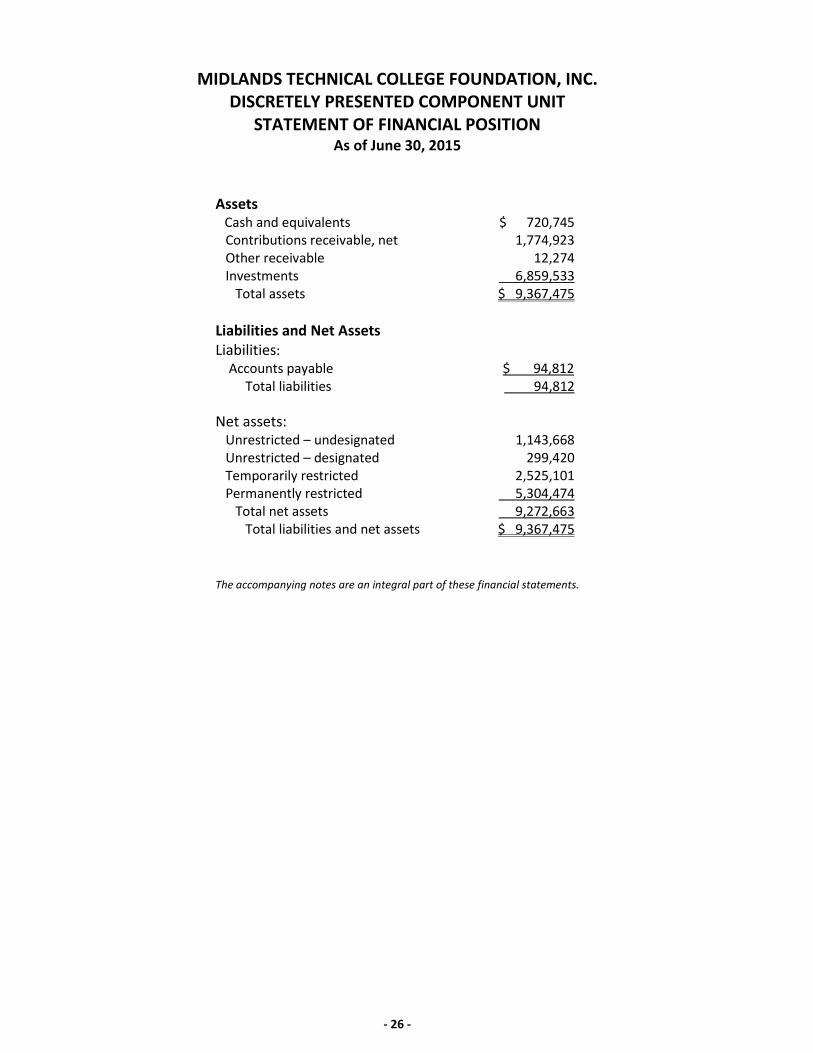
Assets Cash and equivalents $ 720,745 Contributions receivable, net 1,774,923 Other receivable 12,274 Investments 6,859,533 Total assets $ 9,367,475 Liabilities and Net Assets Liabilities: Accounts payable $ 94,812 Total liabilities 94,812 Net assets: Unrestricted – undesignated 1,143,668 Unrestricted – designated 299,420 Temporarily restricted 2,525,101 Permanently restricted 5,304,474 Total net assets 9,272,663 Total liabilities and net assets $ 9,367,475
The accompanying notes are an integral part of these financial statements.
- 26 -

MIDLANDS TECHNICAL COLLEGE FOUNDATION, INC.
DISCRETELY PRESENTED COMPONENT UNIT STATEMENT OF ACTIVITIES
For the Fiscal Year Ended June 30, 2015
Unrestricted | Temporarily Permanently | Undesignated Designated Restricted | Restricted | Totals | Revenue, gains, and other support Contributions $ 347,261 $ – $ 491,669 $ 1,627,877 $ 2,466,807 Grant revenue – – 14,000 – 14,000 Income on long-term investments 100,325 16,272 57,337 – 173,934 Other investment income 502 – – – 502 Net unrealized and realized gains (losses) on long-term investments (701,826) 114,841 404,651 – (182,334) Net assets released from restrictions: Satisfaction of program restrictions 104,513 (14,000) (590,513) 500,000 – Expiration of time restrictions 36,321 – (36,321) – – Total revenue, gains and other support (112,904) 117,113 340,823 2,127,877 2,472,909 Expenses and losses Management and general 137,372 – – – 137,372 College support 495,482 – – – 495,482 Student support 119,740 – – – 119,740 Fundraising 181,496 – – – 181,496 Total expenses 934,090 – – – 934,090 Change in net assets (1,046,994) 117,113 340,823 2,127,877 1,538,819 Net assets at beginning of year 2,190,662 182,307 2,184,278 3,176,597 7,733,844 Net assets at end of year $ 1,143,668 $ 299,420 $ 2,525,101 $ 5,304,474 $ 9,272,663
The accompanying notes are an integral part of these financial statements.
- 27 -
MIDLANDS TECHNICAL COLLEGE
NOTES TO FINANCIAL STATEMENTS
- CONTINUED -
NOTE 1 – SUMMARY OF SIGNIFICANT ACCOUNTING POLICIES Nature of Operations Midlands Technical College (the College), a member institution of the South Carolina Technical College System, provides a range of educational programs to meet the needs of the adult population of Richland, Lexington and Fairfield counties. Included in this range of programs are technical and occupational associate degree, diploma and certificate curricula that are consistent with the needs of employers in the College’s service area. As an integral part of this mission, the College provides a program of continuing education designed to satisfy the occupational demands of employers through retraining and upgrading the skills of individual employees. The College also provides a variety of developmental education programs, support services and offerings to assist students in meeting their personal and professional educational objectives. Reporting Entity The financial reporting entity, as defined by the Governmental Accounting Standards Board (GASB), consists of the primary government, organizations for which the primary government is financially accountable, and other organizations for which the nature and significance of their relationship with the reporting entity are such that exclusion could cause the financial statements to be misleading or incomplete. Accordingly, the financial statements include the accounts of Midlands Technical College, as the reporting entity, Midlands Technical College Enterprise Campus Authority, and the accounts of the Midlands Technical College Foundation (the Foundation), its component unit. The College is reported as a discretely presented component unit in the State of South Carolina’s Comprehensive Annual Financial Report. However, based on the nature and significance of the Foundation’s relationship with the State of South Carolina, the Foundation is not a component unit of the State of South Carolina. The Midlands Technical College Enterprise Campus Authority (the Authority) was established in 2004 by SC Act 200, codified as sub-article 3, Article 20, Chapter 53, Title 59, of the 1976 South Carolina Code of Laws, as amended. For accounting purposes, the Authority is considered a component unit of Midlands Technical College. The Authority was established to provide for the management, development and operation of the Enterprise Campus of
Midlands Technical College, located on the Northeast Campus. The Board of the Authority consists of the members of the Midlands Technical College Commission. The activity of the Authority is blended in the financial statements of the College. The Midlands Technical College Foundation, Inc., (the Foundation) is a private not-for-profit organization that was formed August 12, 1970, to benefit and support education at Midlands Technical College. The Foundation is a legally separate, tax-exempt component unit of the College. The Foundation acts primarily as a fundraising organization to supplement the resources that are available to the College in support of its programs. The 21-member board of the Foundation is self-perpetuating and consists of graduates and friends of the College. Although the College does not control the timing or amount of receipts from the Foundation, the majority of resources or income thereon that the Foundation holds and invests are restricted to the activities of the College or its students by the donors. Because these restricted resources held by the Foundation can only be used by, or for the benefit of, the College, the Foundation is considered a component unit of the College. The Foundation is reported in separate financial statements because of the difference in its reporting model, as further described below. Financial Statements The financial statements of the College and its blended component unit are presented in accordance with GASB Standards. The financial statement presentation required by these standards provides a comprehensive, entity-wide perspective of the College’s net position, revenues, expenses, changes in net position and cash flows. The financial statements of the Midlands Technical College Foundation are presented in accordance with the accounting principles generally accepted in the United States of America for not-for-profit organizations as issued by the Financial Accounting Standards Board (FASB) through its Accounting Standards Codification. The Foundation’s revenue and expenses are recognized as increases and decreases in one of three net asset classifications – unrestricted, temporarily restricted, and permanently restricted. Permanently restricted net assets consist of contributions and other inflows of assets whose use is limited in perpetuity by donor-imposed stipulations.
MIDLANDS TECHNICAL COLLEGE
NOTES TO FINANCIAL STATEMENTS
June 30, 2015
- 28 -
MIDLANDS TECHNICAL COLLEGE
NOTES TO FINANCIAL STATEMENTS
- CONTINUED -
NOTE 1 – SUMMARY OF SIGNIFICANT ACCOUNTING POLICIES (Continued) Temporarily restricted net assets consist of contributions and other transactions whose use is limited by time or purpose by donor-imposed stipulations. Unrestricted net assets are transactions that are neither temporarily nor permanently restricted. When a restriction expires (that is, when a stipulated time restriction ends or purpose restriction is accomplished), temporarily restricted net assets are reclassified to unrestricted net assets and reported in the statement of activities as net assets released from restrictions. Financial statements for the Foundation can be obtained by mailing a request to Midlands Technical College Foundation, Post Office Box 2408, Columbia, South Carolina 29202. Basis of Accounting For financial reporting purposes, the College is considered a special-purpose government engaged only in business-type activities. Accordingly, the College’s financial statements have been presented using the economic resources measurement focus and the accrual basis of accounting. Under the accrual basis, revenues are recognized when earned, and expenses are recorded when an obligation has been incurred. Student tuition and auxiliary enterprise fees are presented net of scholarships and fellowships applied to student accounts, while stipends and other payments made directly are presented as scholarship expenses. All significant intra-institutional transactions have been eliminated. The Foundation’s statements are presented on the accrual basis of accounting in accordance with FASB pronouncements. Therefore, certain revenue recognition criteria and presentation features are different from GASB criteria and presentation features. No modifications have been made to the Foundation’s financial statements included in the College’s financial reporting entity for these differences. Estimates The preparation of financial statements in accordance with accounting principles generally accepted in the United States of America requires the use of estimates. Actual amounts may differ from the estimates used.
Cash and Cash Equivalents For purposes of the statement of cash flows, the College considers all highly liquid investments with an original maturity of three months or less to be cash equivalents. Funds invested through the South Carolina State Treasurer’s Office are considered cash equivalents. Investments Deposits and investments for the College are governed by the South Carolina Code of Laws, Section 11-9-660, “Investments of Funds.” Governmental Accounting Standards require disclosures related to deposit risks, such as custodial credit risk, and investment risks, such as credit risk (including custodial credit risk and concentrations of credit risks) and interest rate risk. The College accounts for its investments at fair value. Changes in unrealized gain (loss) on the fair value of investments are reported as a component of investment income in the statement of revenues, expenses and changes in net position. Accounts Receivable Accounts receivable consists of tuition and fee charges to students, gift pledges, certain state and local funding and auxiliary enterprise services provided to students, faculty and staff. Accounts receivable also includes amounts due from the federal government, state and local governments, or private sources, in connection with reimbursement of allowable expenditures made pursuant to the College’s grants and contracts. Accounts receivable are recorded net of estimated uncollectible amounts. Capital Assets Capital assets are recorded at cost at the date of acquisition or fair market value at the date of donation in the case of gifts. The College follows capitalization guidelines established by the State of South Carolina. All land is capitalized, regardless of cost. Qualifying improvements that rest in or on the land itself are recorded as depreciable land improvements. Major additions and renovations and other improvements that add to the usable space, prepare existing buildings for new uses, or extend the useful life of an existing building are capitalized. The College capitalizes movable personal property with a unit value of $5,000 or more and a useful life in excess of
- 29 -
MIDLANDS TECHNICAL COLLEGE
NOTES TO FINANCIAL STATEMENTS
- CONTINUED -
NOTE 1 – SUMMARY OF SIGNIFICANT ACCOUNTING POLICIES (Continued) two years; depreciable land improvements, buildings and improvements; and intangible assets costing $100,000 or more. Routine repairs and maintenance and library materials, except individual items costing $5,000 or more, are charged to operating expenses in the year in which the expense is incurred. Certain works of art are considered inexhaustible. These capital assets are not subject to depreciation. Depreciation is computed using the straight-line method over the estimated useful lives of the assets, generally 15 to 50 years for buildings and improvements and land improvements and 2 to 25 years for machinery, equipment, and vehicles. Effective July 1, 2012, the State of South Carolina adopted a monthly depreciation convention for the straight-line method. Under this convention, depreciation is recognized in the month of purchase on a prorata basis of days placed in service. At the end of the life of the asset, a prorated amount of depreciation is recognized for the days within the month until the assets are removed from service. Deferred Outflows/Inflows of Resources In addition to assets, the statement of net position will sometimes report a separate section for deferred outflows of resources. This separate financial statement element, deferred outflows of resources, represents a consumption of net position that applies to a future period(s) and so will not be recognized as an outflow of resources (expense) until then. In addition to liabilities, the statement of net position will sometimes report a separate section for deferred inflows of resources. This separate financial statement element, deferred inflows of resources, represents an acquisition of net position that applies to a future period(s) and so will not be recognized as an inflow of resources (revenue) until that time. Unearned Revenues and Deposits Unearned revenues include amounts received for tuition and fees and certain auxiliary activities prior to the end of the fiscal year but related to the subsequent accounting period. Unearned revenues also include amounts received
from grant and contract sponsors that have not yet been earned. Deposits represent student fee refunds and other miscellaneous deposits. Student deposits are recognized as revenue during the semester for which the fee is applicable, and earned when the deposit is nonrefundable to the student under the forfeit terms of the agreement. Compensated Absences Employee vacation pay expense is accrued at year-end for financial statement purposes. The liability and expense incurred are recorded at year-end as a component of current and long-term liabilities in the statement of net position and as a component of benefit expenses in the statement of revenues, expenses, and changes in net position. Pension Liability During 2015, the College adopted the provisions of GASB 68 “Accounting and Financial Reporting for Pensions – An Amendment of GASB Statement 27.” GASB required that the College recognize in its government wide statements their proportionate share of pension liability as a participant in the South Carolina Retirement Systems. See Note 6 for additional information. Net Position The College’s net position is classified as follows:
• Net investment in capital assets: This represents the College’s total investment in capital assets, net of outstanding debt obligations related to those capital assets. To the extent debt has been incurred but not yet expended for capital assets, such amounts are not included as a component of net investment in capital assets.
• Restricted net position – expendable: Restricted expendable net position includes resources in which the College is legally or contractually obligated to spend resources in accordance with restrictions imposed by external third parties.
- 30 -
MIDLANDS TECHNICAL COLLEGE
NOTES TO FINANCIAL STATEMENTS
- CONTINUED -
NOTE 1 – SUMMARY OF SIGNIFICANT ACCOUNTING POLICIES (Continued)
• Restricted net position – non‐expendable: Non-expendable restricted net position consists of endowment and similar type funds in which donors or other outside sources have stipulated, as a condition of the gift instrument, that the principal is to be maintained inviolate and in perpetuity, and invested for the purpose of producing present and future income, which may either be expended or added to principal. The College does not currently report any net position in this classification.
• Unrestricted net position: Unrestricted net
position represent resources derived from student tuition and fees, appropriations, and sales and services of educational departments and auxiliary enterprises. These resources are used for transactions relating to the educational and general operations of the College, and may be used at the discretion of the governing board to meet current expenses for any purpose. These resources also include auxiliary enterprises, which are substantially self-supporting activities that provide services for students, faculty and staff.
The College’s policy for applying expenses that can use both restricted and unrestricted resources is delegated to the departmental administrative level. General practice is to first apply the expense to restricted resources and then to unrestricted resources. Income Taxes The College is exempt from income taxes under the Internal Revenue Code. Classification of Revenues and Expenses The College has classified its revenues and expenses as either operating or non-operating according to the following criteria: • Operating revenues and expenses: Operating revenues
generally result from exchange transactions to provide goods or services related to the College’s principal ongoing operations. These revenues include (1) student tuition and fees received in exchange for
providing educational services and other related services to students; (2) receipts for scholarships where the provider has identified the student recipients; (3) fees received from organizations and individuals in exchange for miscellaneous goods and services provided by the College; and (4) grants and contracts that are essentially the same as contracts for services that finance programs the College would not otherwise undertake. Operating expenses include all expense transactions incurred other than those related to investing, non-capital or non-capital financing activities.
• Non‐operating revenues and expenses: Non-operating revenues include activities that have the characteristics of non-exchange transactions. These revenues include gifts and contributions, appropriations, investment income, and any grants and contracts that are not classified as operating revenue or restricted by the grantor to be used exclusively for capital purposes.
Sales and Services of Educational and Other Activities Revenues from sales and services of educational and other activities generally consist of amounts received from instructional activities that incidentally create goods and services that may be sold to students, faculty, staff, and the general public. The College receives such revenues primarily from the automotive and dental auxiliary departments. Auxiliary Enterprises and Internal Service Activities Auxiliary enterprise revenues primarily represent revenues generated by bookstores, food services, the Authority facility rentals and vending. Revenues of internal service and auxiliary enterprise activities and the related expenditures of college departments have been eliminated. Scholarship Discounts and Allowances Student tuition and fee revenues, and certain other revenues from students, are reported net of scholarship discounts and allowances in the statement of revenues, expenses and changes in net position. Scholarship discounts and allowances are the difference between the stated charge for goods and services provided by the College, and the amount that is paid by students and/or third parties making payments on the students’ behalf. Certain governmental grants, and other federal, state or non-governmental programs, are recorded as operating
- 31 -
MIDLANDS TECHNICAL COLLEGE
NOTES TO FINANCIAL STATEMENTS
- CONTINUED -
NOTE 1 – SUMMARY OF SIGNIFICANT ACCOUNTING POLICIES (Continued) revenues in the College’s financial statements. To the extent that revenues from such programs are used to satisfy tuition and fees and other student charges, the College has recorded a scholarship discount and allowance. Capitalized Interest The College’s policy is to capitalize as a component of construction in progress interest cost in excess of earnings on debt associated with capital projects that will be capitalized in the applicable capital asset categories upon completion. The College incurred $1,033,908 of interest cost during the year ended June 30, 2015, all of which was expensed. Discretely Presented Component Unit What follows below are the more significant accounting policies of the College’s Discretely Presented Component Unit (Midlands Technical College Foundation). The financial statements of the Foundation are presented in accordance with accounting principles generally accepted in the United States of America and are prepared on the accrual basis of accounting. Consequently, the net assets of the Foundation are reported as follows: • Unrestricted Undesignated – Unrestricted Undesignated
Net Assets are not subject to donor-imposed restrictions that will be met by actions of the Foundation and/or passage of time.
• Unrestricted Designated – Unrestricted Designated Net Assets are not subject to donor-imposed restrictions, but is subject to Foundation Board imposed stipulations.
• Temporarily Restricted – Temporarily Restricted Net Assets are subject to donor-imposed stipulations that will be met by actions of the Foundation and/or passage of time.
Permanently Restricted – Permanently Restricted Net Assets are subject to donor-imposed stipulations that require them to be maintained permanently by the Foundation. Generally, the donors of these assets permit
the Foundation to use all or part of the income earned on related investments for general or specific purposes. Revenue, Gains and Other Support and Expenses and Losses – Revenues are reported as increases in the unrestricted net asset classification unless use of the related assets is limited by donor-imposed restrictions. Contributions, including unconditional promises to give, are recognized as revenue in the period received. Conditional promises to give are not recognized as revenue until the conditions on which they depend are substantially met. Donor-restricted contributions whose restrictions are met in the same reporting period are reported as unrestricted support. Increases in the allowance for uncollectible pledges are netted against contribution income. Expenses are reported as decreases in unrestricted undesignated or unrestricted designated net asset as appropriate. Gains and losses on investments and other assets or liabilities are reported as increases or decreases in unrestricted undesignated or unrestricted designated net asset unless their use is restricted by explicit donor stipulation or by law. Donated Services, Goods and Facilities – A substantial number of volunteers have donated an undetermined number of hours to the Foundation's program services and fundraising campaigns during the year; however, these donated services are not reflected in the financial statements since the services do not require specialized skills. During the year ended June 30, 2015, the Foundation received in-kind contributions valued at approximately $128,001. Substantially all contributions of equipment to the Foundation become property of the College upon receipt of the property from the donor. Accordingly, the Foundation records the contributions at their fair value with an offset to college support in these financial statements. Cash and Cash Equivalents – Cash and cash equivalents consist of cash held in checking and money market accounts with maturities of less than 90 days at the time of purchase.
- 32 -
MIDLANDS TECHNICAL COLLEGE
NOTES TO FINANCIAL STATEMENTS
- CONTINUED -
NOTE 1 – SUMMARY OF SIGNIFICANT ACCOUNTING POLICIES (Continued) Investments – Investments in equity securities with readily determinable fair values and all investments in debt securities are measured at fair value in the statement of financial position. Investment in real estate held for sale is reported at the lower of cost or market. Securities or other investments donated are recorded at their market value at the date of the gift. Concentrations of Credit and Market Risk – Financial instruments that potentially expose the Foundation to concentrations of credit and market risk consist primarily of cash equivalents and investments. Cash equivalents are maintained at high-quality financial institutions and credit exposure is limited to any one institution. The Foundation has not experienced any losses on its cash equivalents. Management believes that the Foundation's investment portfolio is adequately diversified among issuers. In addition, management believes that the Foundation has the ability to hold its investment portfolio during periods of temporary market declines. Management believes the Foundation is not exposed to any significant credit risk on cash and cash equivalents.
Income Taxes – Midlands Technical College Foundation, Inc. has received a determination letter from the Internal Revenue Service that it is exempt from federal income taxes under Section 501 (c)(3) of the Internal Revenue Code (the “IRC”). However, it would be subject to tax on income unrelated to its exempt purposes (unless that income is otherwise excluded by the IRC). The tax years ending June 30, 2015, 2014, 2013, and 2012 are still open to audit for both federal and state purposes. The Foundation is not classified as a private foundation.
- 33 -
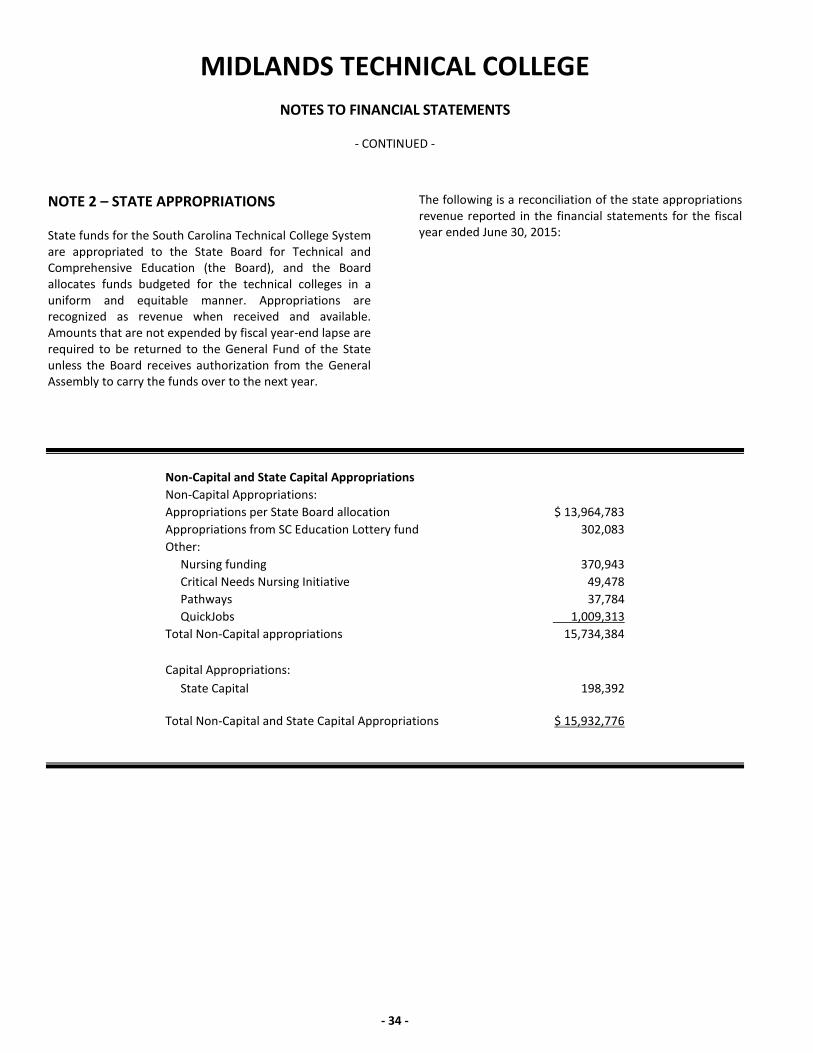
MIDLANDS TECHNICAL COLLEGE
NOTES TO FINANCIAL STATEMENTS
- CONTINUED -
NOTE 2 – STATE APPROPRIATIONS State funds for the South Carolina Technical College System are appropriated to the State Board for Technical and Comprehensive Education (the Board), and the Board allocates funds budgeted for the technical colleges in a uniform and equitable manner. Appropriations are recognized as revenue when received and available. Amounts that are not expended by fiscal year-end lapse are required to be returned to the General Fund of the State unless the Board receives authorization from the General Assembly to carry the funds over to the next year.
The following is a reconciliation of the state appropriations revenue reported in the financial statements for the fiscal year ended June 30, 2015:
Non-Capital and State Capital Appropriations Non-Capital Appropriations: Appropriations per State Board allocation $ 13,964,783 Appropriations from SC Education Lottery fund 302,083 Other: Nursing funding 370,943 Critical Needs Nursing Initiative 49,478 Pathways 37,784 QuickJobs 1,009,313 Total Non-Capital appropriations 15,734,384 Capital Appropriations: State Capital 198,392 Total Non-Capital and State Capital Appropriations $ 15,932,776
- 34 -
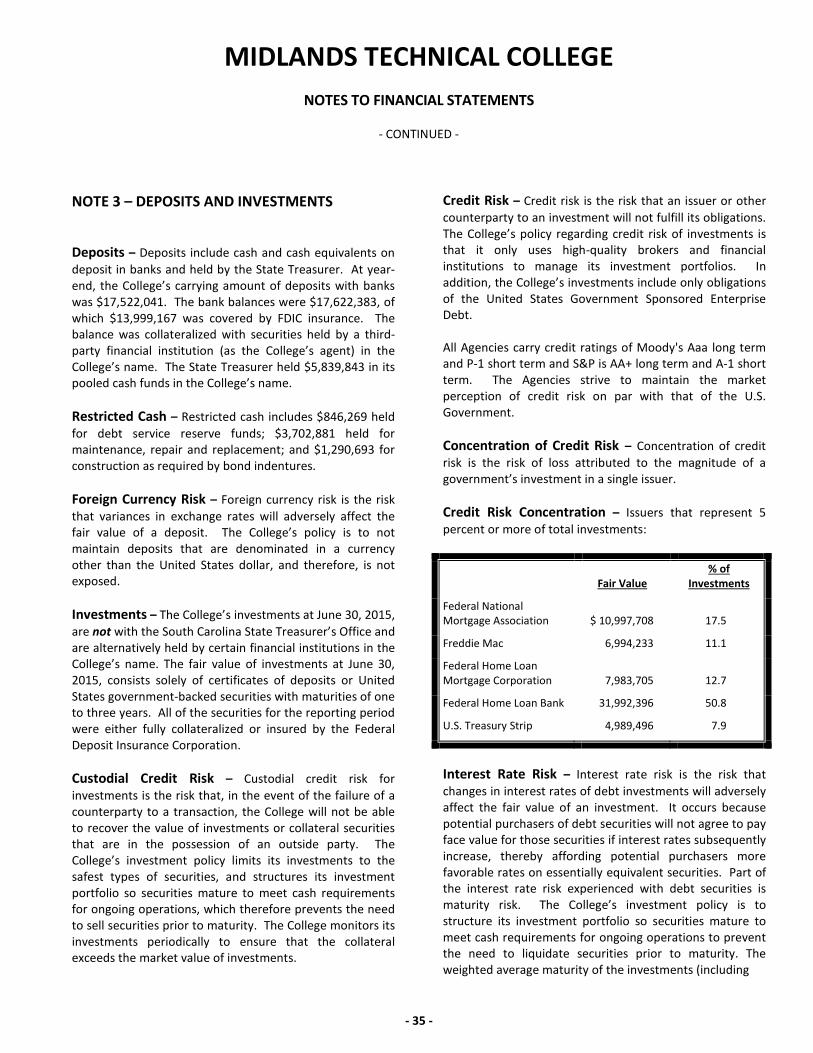
MIDLANDS TECHNICAL COLLEGE
NOTES TO FINANCIAL STATEMENTS
- CONTINUED -
NOTE 3 – DEPOSITS AND INVESTMENTS
Deposits – Deposits include cash and cash equivalents on deposit in banks and held by the State Treasurer. At year-end, the College’s carrying amount of deposits with banks was $17,522,041. The bank balances were $17,622,383, of which $13,999,167 was covered by FDIC insurance. The balance was collateralized with securities held by a third-party financial institution (as the College’s agent) in the College’s name. The State Treasurer held $5,839,843 in its pooled cash funds in the College’s name. Restricted Cash – Restricted cash includes $846,269 held for debt service reserve funds; $3,702,881 held for maintenance, repair and replacement; and $1,290,693 for construction as required by bond indentures. Foreign Currency Risk – Foreign currency risk is the risk that variances in exchange rates will adversely affect the fair value of a deposit. The College’s policy is to not maintain deposits that are denominated in a currency other than the United States dollar, and therefore, is not exposed. Investments – The College’s investments at June 30, 2015, are not with the South Carolina State Treasurer’s Office and are alternatively held by certain financial institutions in the College’s name. The fair value of investments at June 30, 2015, consists solely of certificates of deposits or United States government-backed securities with maturities of one to three years. All of the securities for the reporting period were either fully collateralized or insured by the Federal Deposit Insurance Corporation. Custodial Credit Risk – Custodial credit risk for investments is the risk that, in the event of the failure of a counterparty to a transaction, the College will not be able to recover the value of investments or collateral securities that are in the possession of an outside party. The College’s investment policy limits its investments to the safest types of securities, and structures its investment portfolio so securities mature to meet cash requirements for ongoing operations, which therefore prevents the need to sell securities prior to maturity. The College monitors its investments periodically to ensure that the collateral exceeds the market value of investments.
Credit Risk – Credit risk is the risk that an issuer or other counterparty to an investment will not fulfill its obligations. The College’s policy regarding credit risk of investments is that it only uses high-quality brokers and financial institutions to manage its investment portfolios. In addition, the College’s investments include only obligations of the United States Government Sponsored Enterprise Debt. All Agencies carry credit ratings of Moody's Aaa long term and P-1 short term and S&P is AA+ long term and A-1 short term. The Agencies strive to maintain the market perception of credit risk on par with that of the U.S. Government. Concentration of Credit Risk – Concentration of credit risk is the risk of loss attributed to the magnitude of a government’s investment in a single issuer. Credit Risk Concentration – Issuers that represent 5 percent or more of total investments:
Fair Value % of
Investments
Federal National Mortgage Association $ 10,997,708 17.5
Freddie Mac 6,994,233 11.1
Federal Home Loan Mortgage Corporation 7,983,705 12.7
Federal Home Loan Bank 31,992,396 50.8
U.S. Treasury Strip 4,989,496 7.9
Interest Rate Risk – Interest rate risk is the risk that changes in interest rates of debt investments will adversely affect the fair value of an investment. It occurs because potential purchasers of debt securities will not agree to pay face value for those securities if interest rates subsequently increase, thereby affording potential purchasers more favorable rates on essentially equivalent securities. Part of the interest rate risk experienced with debt securities is maturity risk. The College’s investment policy is to structure its investment portfolio so securities mature to meet cash requirements for ongoing operations to prevent the need to liquidate securities prior to maturity. The weighted average maturity of the investments (including
- 35 -
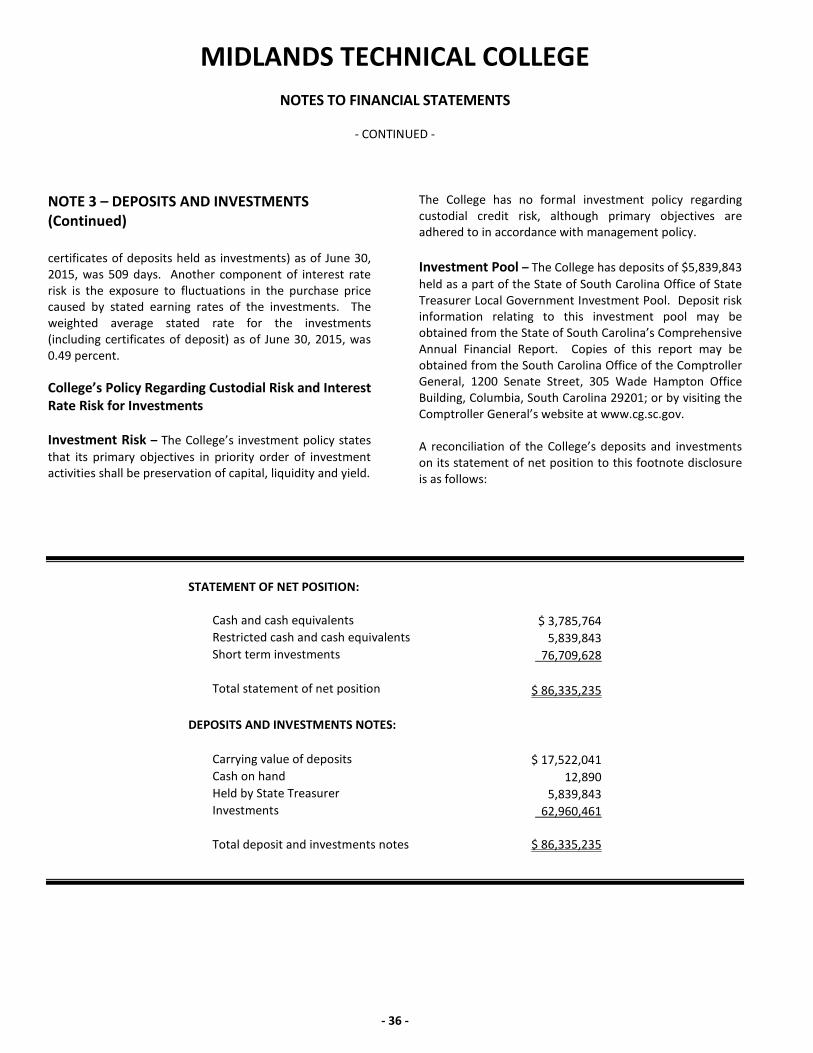
MIDLANDS TECHNICAL COLLEGE
NOTES TO FINANCIAL STATEMENTS
- CONTINUED -
NOTE 3 – DEPOSITS AND INVESTMENTS (Continued) certificates of deposits held as investments) as of June 30, 2015, was 509 days. Another component of interest rate risk is the exposure to fluctuations in the purchase price caused by stated earning rates of the investments. The weighted average stated rate for the investments (including certificates of deposit) as of June 30, 2015, was 0.49 percent. College’s Policy Regarding Custodial Risk and Interest Rate Risk for Investments Investment Risk – The College’s investment policy states that its primary objectives in priority order of investment activities shall be preservation of capital, liquidity and yield.
The College has no formal investment policy regarding custodial credit risk, although primary objectives are adhered to in accordance with management policy. Investment Pool – The College has deposits of $5,839,843 held as a part of the State of South Carolina Office of State Treasurer Local Government Investment Pool. Deposit risk information relating to this investment pool may be obtained from the State of South Carolina’s Comprehensive Annual Financial Report. Copies of this report may be obtained from the South Carolina Office of the Comptroller General, 1200 Senate Street, 305 Wade Hampton Office Building, Columbia, South Carolina 29201; or by visiting the Comptroller General’s website at www.cg.sc.gov. A reconciliation of the College’s deposits and investments on its statement of net position to this footnote disclosure is as follows:
STATEMENT OF NET POSITION: Cash and cash equivalents $ 3,785,764 Restricted cash and cash equivalents 5,839,843 Short term investments 76,709,628 Total statement of net position $ 86,335,235
DEPOSITS AND INVESTMENTS NOTES: Carrying value of deposits $ 17,522,041 Cash on hand 12,890 Held by State Treasurer 5,839,843 Investments 62,960,461 Total deposit and investments notes $ 86,335,235
- 36 -
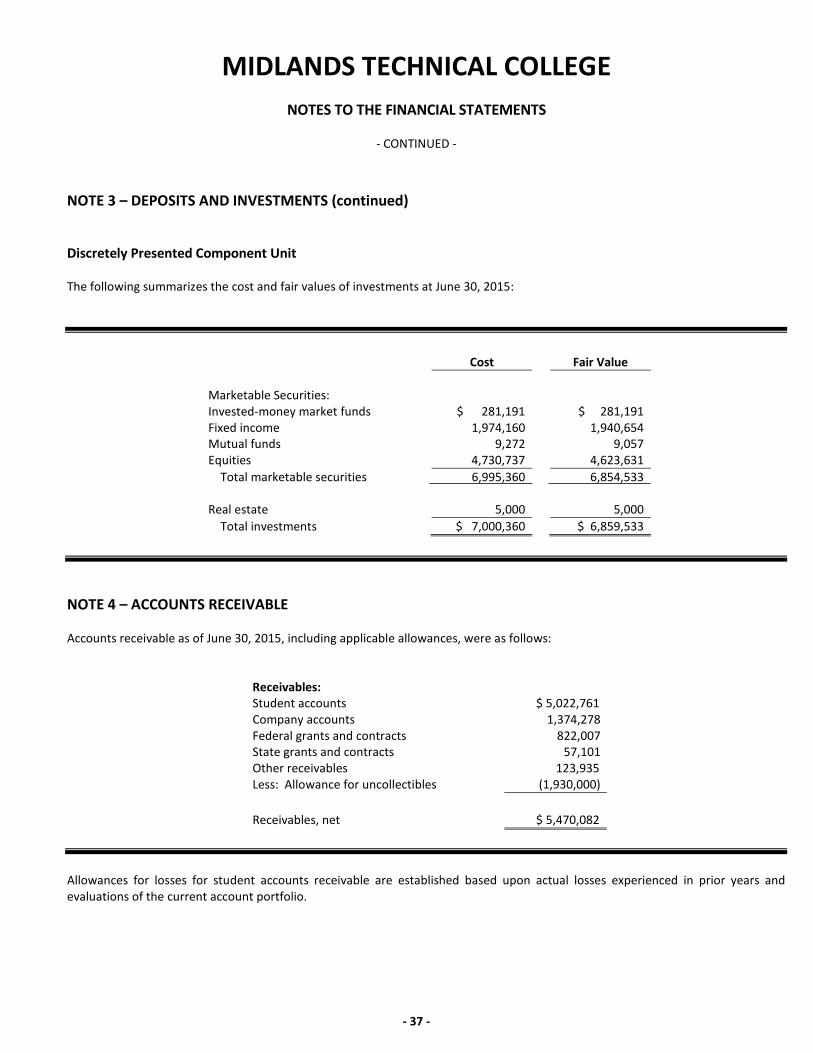
MIDLANDS TECHNICAL COLLEGE
NOTES TO THE FINANCIAL STATEMENTS
- CONTINUED -
NOTE 3 – DEPOSITS AND INVESTMENTS (continued) Discretely Presented Component Unit The following summarizes the cost and fair values of investments at June 30, 2015:
Cost Fair Value Marketable Securities: Invested-money market funds $ 281,191 $ 281,191 Fixed income 1,974,160 1,940,654 Mutual funds 9,272 9,057 Equities 4,730,737 4,623,631 Total marketable securities
6,995,360 6,854,533
Real estate 5,000 5,000 Total investments $ 7,000,360 $ 6,859,533
NOTE 4 – ACCOUNTS RECEIVABLE Accounts receivable as of June 30, 2015, including applicable allowances, were as follows:
Receivables:
Student accounts $ 5,022,761 Company accounts 1,374,278 Federal grants and contracts 822,007 State grants and contracts 57,101 Other receivables 123,935 Less: Allowance for uncollectibles (1,930,000) Receivables, net $ 5,470,082
Allowances for losses for student accounts receivable are established based upon actual losses experienced in prior years and evaluations of the current account portfolio.
- 37 -
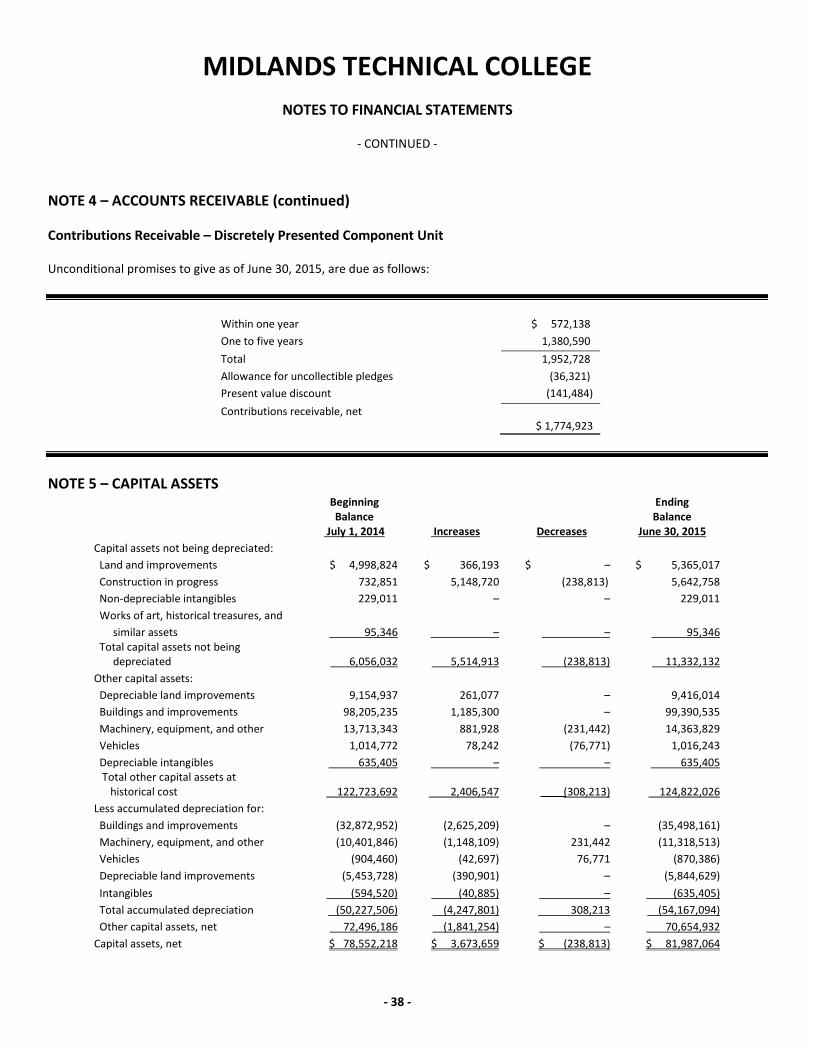
MIDLANDS TECHNICAL COLLEGE
NOTES TO FINANCIAL STATEMENTS
- CONTINUED -
NOTE 4 – ACCOUNTS RECEIVABLE (continued) Contributions Receivable – Discretely Presented Component Unit Unconditional promises to give as of June 30, 2015, are due as follows:
Within one year $ 572,138 One to five years 1,380,590 Total 1,952,728 Allowance for uncollectible pledges (36,321) Present value discount (141,484) Contributions receivable, net
$ 1,774,923
NOTE 5 – CAPITAL ASSETS
Beginning Balance
July 1, 2014 Increases Decreases
Ending Balance
June 30, 2015 Capital assets not being depreciated: Land and improvements $ 4,998,824 $ 366,193 $ – $ 5,365,017 Construction in progress 732,851 5,148,720 (238,813) 5,642,758 Non-depreciable intangibles 229,011 – – 229,011 Works of art, historical treasures, and similar assets 95,346 – – 95,346 Total capital assets not being depreciated 6,056,032 5,514,913 (238,813) 11,332,132 Other capital assets: Depreciable land improvements 9,154,937 261,077 – 9,416,014 Buildings and improvements 98,205,235 1,185,300 – 99,390,535 Machinery, equipment, and other 13,713,343 881,928 (231,442) 14,363,829 Vehicles 1,014,772 78,242 (76,771) 1,016,243 Depreciable intangibles 635,405 – – 635,405 Total other capital assets at historical cost 122,723,692 2,406,547
(308,213) 124,822,026
Less accumulated depreciation for: Buildings and improvements (32,872,952) (2,625,209) – (35,498,161) Machinery, equipment, and other (10,401,846) (1,148,109) 231,442 (11,318,513) Vehicles (904,460) (42,697) 76,771 (870,386) Depreciable land improvements (5,453,728) (390,901) – (5,844,629) Intangibles (594,520) (40,885) – (635,405) Total accumulated depreciation (50,227,506) (4,247,801) 308,213 (54,167,094) Other capital assets, net 72,496,186 (1,841,254) – 70,654,932 Capital assets, net $ 78,552,218 $ 3,673,659 $ (238,813) $ 81,987,064
- 38 -
MIDLANDS TECHNICAL COLLEGE
NOTES TO FINANCIAL STATEMENTS - CONTINUED -
NOTE 6 – PENSION PLANS South Carolina Retirement System The majority of employees of Midlands Technical College are covered by a retirement plan through the South Carolina Retirement System (SCRS), a cost-sharing multiple-employer defined benefit pension plan administered by the Retirement Benefits Division of the South Carolina Public Employee Benefit Authority (PEBA). Generally, all full-time or part-time equivalent State employees in a permanent position are required to participate in and contribute to the SCRS as a condition of employment unless exempted by law as provided in Section 9-1-480 of the South Carolina Code of Laws, as amended, or are eligible and elect to participate in the State Optional Retirement Program (ORP). The SCRS plan provides lifetime monthly retirement annuity benefits to eligible members as well as disability, survivor options, annual benefit adjustments and incidental death benefits to eligible employees and retired members. The Retirement Division maintains five independent defined benefit plans and issues its own publicly available Comprehensive Annual Financial Report (CAFR) which includes financial statements and required supplementary information. A copy of the separately issued CAFR may be obtained by writing to the South Carolina Public Employee Benefit Authority, P.O. Box 11960, Columbia, South Carolina 29211-1960. Furthermore, the Division and the five pension plans are included in the State of South Carolina’s CAFR. Under the SCRS, Class II members are eligible for a full-service retirement annuity upon reaching age 65 or completion of 28 years of credited service regardless of age. Employees who first became members of the System after June 30, 2013 are considered Class III members and are eligible for a full service retirement annuity upon reaching age 65 or upon meeting the rule of 90 requirement (i.e., the member’s age plus the years of service add up to a total of at least 90). The benefit formula for full-service retirement annuity effective since July 1, 1989 for the SCRS is 1.82 percent of an employee’s average final compensation (AFC) multiplied by the number of years of credited service. For Class II members, AFC is the average annual earnable compensation during 12 consecutive quarters and includes an amount for up to 45 days termination pay at retirement for unused annual leave. For Class III members, AFC is the average annual earnable compensation during 20 consecutive quarters,
and termination pay for unused annual leave at retirement is not included. Early retirement options with reduced benefits are available as early as age 55 for Class II members and age 60 for Class III members. Class II members are vested for a deferred annuity after five years of earned service. Class III members are vested for a deferred annuity after eight years of earned service. Members qualify for a survivor’s benefit upon completion of 15 years of credited service (five years effective January 1, 2002). Disability annuity benefits are available to Class II members if they have permanent incapacity to perform regular duties of the member’s job and they have at least 5 years of earned service (this requirement does not apply if the disability is a result of a job related injury). Class III members can apply for disability annuity benefits provided they have a permanent incapacity to perform the regular duties of the member’s job and they have minimum of eight years of credited service. For disability applications received after December 31, 2014, a member of SCRS will have to be approved for disability benefits from the Social Security Administration in order to be eligible for SCRS disability retirement benefits. An incidental death benefit equal to an employee’s annual rate of compensation is payable upon the death of an active employee with a minimum of one year of credited service or to a working retired contributing member. There is no service requirement for death resulting from actual performance of duties for an active member. For eligible retired members, a lump-sum payment is made to the retiree’s beneficiary of up to $6,000 based on years of service at retirement. TERI participants and retired contributing members are eligible for the increased death benefit equal to their annual salary in lieu of the standard retired member benefit. Effective January 1, 2001, Section 9-1-2210 of the South Carolina Code of Laws allows employees eligible for service retirement to participate in the Teacher and Employee Retention Incentive (TERI) Program. TERI participants may retire and begin accumulating retirement benefits on a deferred basis without terminating employment for up to five years.
- 39 -
MIDLANDS TECHNICAL COLLEGE
NOTES TO FINANCIAL STATEMENTS - CONTINUED -
NOTE 6 – PENSION PLANS (Continued) Upon termination of employment or at the end of the TERI period, whichever is earlier, participants will begin receiving monthly service retirement benefits which will include any benefit adjustments granted during the TERI period. Because participants are considered retired during the TERI period, they do not earn service credit, and are ineligible for disability retirement benefits. The TERI program will end effective June 30, 2018 and a member’s participation may not continue after this date. Effective July 1, 2014, employees participating in the SCRS were required to contribute 7.50% of all earnable compensation. The employer contribution rate for SCRS was 15.52%. Included in the total SCRS employer contribution rate is a base retirement contribution of 10.45%, 0.15% for the incidental death program and a 4.92% surcharge that will fund retiree health and dental insurance coverage. The College’s actual contributions to the SCRS for the years ended June 30, 2015, 2014, and 2013 were approximately $4,118,079, $3,863,556, and $3,694,563, respectively, and equaled the base required retirement contribution rate, excluding retiree insurance surcharge and incidental death benefit program contributions of 10.75% for 2015, 10.45% for 2014, and 9.39% for 2013. Also, the College paid employer incidental death benefit program contributions of approximately $57,462, $55,458, and $53,045, at the rate of 0.15% of compensation for the current fiscal years ended June 30, 2015, 2014, and 2013, respectively. Police Officers Retirement System The South Carolina Police Officers Retirement System (PORS) is a cost-sharing multiple employer defined benefit public employee retirement plan. Generally, all full-time employees whose principal duties are the preservation of public order or the protection or prevention and control of property destruction by fire are required to participate in and contribute to PORS as a condition of employment. This plan provides for lifetime monthly annuity benefits as well as disability, survivor benefits and incidental death benefits to eligible employees and retirees. In addition, participating employers in the PORS may elect to contribute to the accidental death program which provides annuity benefits to beneficiaries of police officers and firemen killed in the actual performance of their duties.
These benefits are independent of any other retirement benefits available to the beneficiary. Under the PORS, Class II members are eligible for a full-service retirement annuity upon reaching age 55 or completion of 25 years of credited service regardless of age. Class III members are eligible for a full-service retirement annuity upon reaching age 55 or 27 years of credited service. The benefit formula for full benefits for the PORS is 2.14 percent of an employee’s average final compensation (AFC) multiplied by the number of years of credited service. For Class II members, AFC is the average annual compensation during 12 consecutive quarters and includes an amount for up to 45 days termination pay for unused annual leave. For Class III members, AFC is the average annual earnable compensation during 20 consecutive quarters and termination pay for unused annual leave at retirement is not included. PORS does not have an early retirement option. Class II members are vested for a deferred annuity after five years of earned service. Class III members are vested for a deferred annuity after eight years of earned service. Members qualify for a survivor’s benefit upon completion of 15 years of credited service (five years effective January 1, 2002). Effective July 1, 2014, employees participating in the PORS were required to contribute 8.41% of all earnable compensation. The employer contribution rate for PORS was 18.41%. Included in the total PORS employer contribution rate is a base retirement contribution of 13.01%, 0.20% for the incidental death benefit program, 0.20% for the accidental death program, and a 5.00% surcharge that will fund retiree health and dental insurance coverage. The College’s actual contributions to the PORS for the years ended June 30, 2015, 2014, and 2013 were approximately $46,328, $39,738, and $31,769, respectively, and equaled the base retirement required contribution rate, excluding surcharge and death program contributions, of 13.01% for 2015, 12.44% for 2014 and 11.90% for 2013. The College also paid employer incidental death benefit program contributions of approximately $712, $639, and $533, at the rate of 0.20% of compensation for the current fiscal years ended June 30, 2015, 2014, and 2013 respectively. In addition, the College paid accidental death program contributions of approximately $712, $639, and $533, at the rate of 0.20% of compensation for the current fiscal years ended June 30, 2015, 2014, and 2013 respectively.
- 40 -
MIDLANDS TECHNICAL COLLEGE
NOTES TO FINANCIAL STATEMENTS - CONTINUED -
NOTE 6 – PENSION PLANS (Continued) Optional Retirement Program As an alternative to membership in the SCRS, newly hired employees of the College may elect to participate in the State Optional Retirement Program (ORP), a defined contribution retirement plan. The ORP was established in 1987 under Title 9, Chapter 20, of South Carolina Code of Laws. State ORP participants direct the investment of their funds into a plan administered by one of four investment providers. The State assumes no liability for the State ORP plan other than for the employer’s payment of contribution to designated companies. To elect participation in the ORP, eligible employees must elect membership within their first 30 days of employment. Under State law, contributions to the ORP are required at the same rates as for the SCRS, 10.90% plus the retiree surcharge of 5.00% from the employer in fiscal year 2015. Of the 10.90% employer retirement contribution rate, the employer remits 5.75% directly to the participant’s ORP account and the remaining 5.00% retirement contribution and 0.15% incidental death benefit program contribution amounts are remitted to SCRS. For fiscal year 2015, total contributions requirements to the ORP were approximately $503,553 (excluding the surcharge) from the College as employer and approximately $374,737 from its employees as plan members. The amounts paid by the College for pension, incidental death program and accidental death benefit program contributions are reported as employer contribution expenditures within the applicable functional expenditure categories to which the related salaries are charged.
Article X, Section 16, of the South Carolina Constitution requires that all State-operated retirement systems be funded on a sound actuarial basis. Title 9 of the South Carolina Code of Laws of 1976, as amended, prescribes requirements relating to membership, benefit, and employee/employer contributions for each retirement system. Employee and employer contribution rate to SCRS are actuarially determined. While the surcharge to fund retiree health and dental insurance benefits is collected by the Retirement Benefits Division of PEBA, it is remitted to the Insurance Benefits Division of PEBA, which is responsible for administration of retiree health and dental insurance benefits and establishment of the applicable retiree insurance surcharge rate. Net Pension Liability At June 30, 2015, the College reported $74,304,629 for its proportionate share of the net pension liabilities of SCRS and $508,453 for PORS. The net pension liability defined of the SCRS and PORS defined benefit pension plan was determined based on the July 1, 2013 actuarial valuations, using membership data as of July 1, 2013, projected forward to June 30, 2014, and financial information of the pension trust funds as of June 30, 2014, using generally accepted actuarial procedures. The College’s portion of the net pension liability was based on the College’s share of contributions to the pension plans relative to the contributions of all participating entities. At June 30, 2014, the College’s SCRS proportion was $77,410,953 and $550,561 for PORS, which was the same as its portion of the net pension liability measured as of June 30, 2013. For the year ended June 30, 2015, the College recognized additional pension expense of $744,095 for SCRS and $6,356 for PORS.
At June 30, 2015 the state reported deferred outflows of resources and deferred inflows of resources to pensions from the following sources:
Deferred Outflows of Resources Differences between expected and actual experience for SCRS $ 2,105,481 Differences between expected and actual experience for PORS 13,568 Contributions made to SCRS from measurement date to June 30, 2015 4,451,909 Contributions made to PORS from measurement date to June 30, 2015 47,752 Total deferred outflows of resources $ 6,618,710
- 41 -
MIDLANDS TECHNICAL COLLEGE
NOTES TO FINANCIAL STATEMENTS - CONTINUED -
NOTE 6 – PENSION PLANS (Continued) Amounts reported as deferred outflows of resources and deferred inflows of resources related to pensions will be recognized in pension expenses as follows:
Year ended June 30, SCRS PORS Net 2016 $ 3,537,050 $ 36,563 $ 3,573,613 2017 (914,859) (11,189) (926,048) 2018 (914,859) (11,189) (926,048) 2019 (1,414,364) (11,697) (1,426,061)
$ 292,968 $ 2,488 $ 295,456
The total pension liabilities in the July 1, 2013 actuarial valuation was determined using the following actuarial assumptions applied to all periods included in the measurement:
Actuarial Cost Method Entry Age Actuarial Assumptions: Investment Rate or Return 7.5% Projected Salary Increases Levels Off at 3.5% Inflation Rate 2.75% Benefit Adjustments Lesser of 1% or $500
South Carolina state statute requires that an actuarial experience study be completed at least once in each five-year period. The last experience study was performed on data through June 30, 2015 annual valuation is complete.
The post-retiree mortality assumption is dependent upon the member’s job category and gender. This assumption includes base rates which are automatically adjusted for future improvement in mortality using published Scale AA projected from the year 2000.
Deferred Inflows of Resources Net differences between projected and actual earnings on Pension Plan Investments for SCRS $ 6,264,422 Net differences between projected and actual earnings on Pension Plan Investments for PORS 58,832 Total deferred inflows of resources $ 6,323,254
Former Job Class Males Females
Educators and Judges RP- 2,000 Males (with White Collar Adjustment) Multiplied by 110%
RP- 2,000 Females (with White Collar Adjustment) Multiplied by 95%
General Employees and Members of the General Assembly
RP- 2,000 Males multiplied by 100% RP- 2,000 Females multiplied by 90%
Public Safety, Firefighters and Members of the South Carolina
National Guard
RP- 2,000 Males (with Blue Collar Adjustment) multiplied by 115%
RP- 2,000 Females (with Blue Collar Adjustment) multiplied by 115%
- 42 -
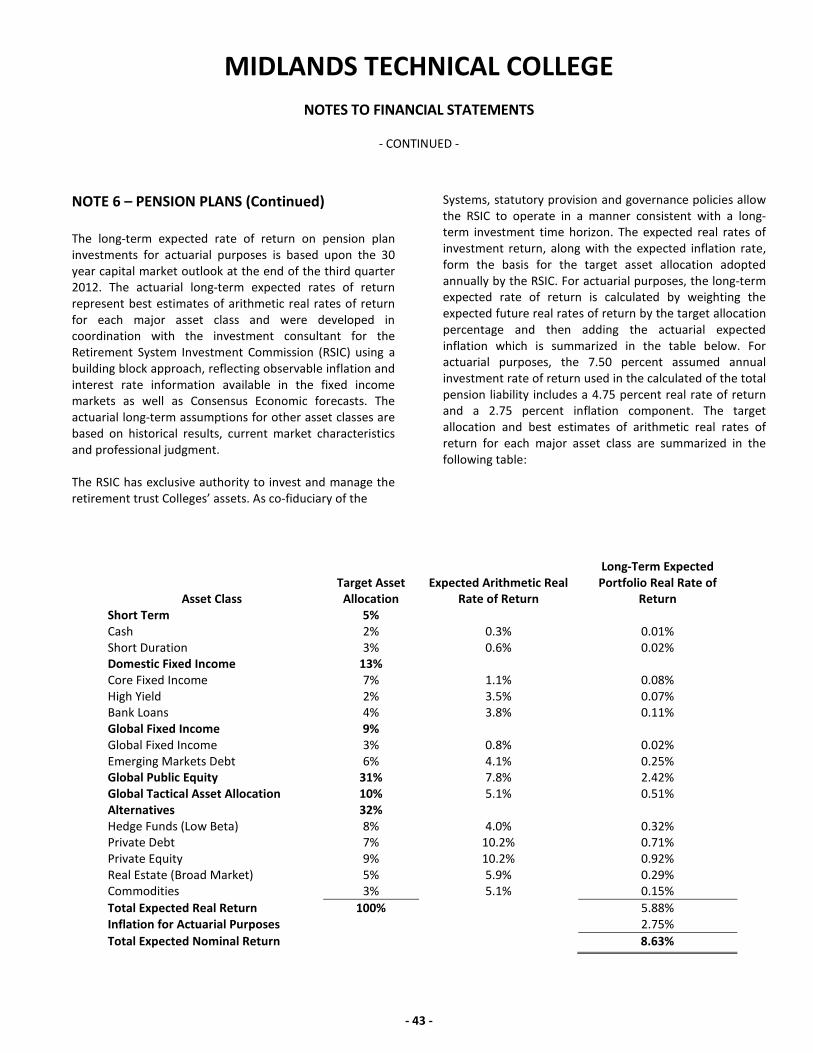
MIDLANDS TECHNICAL COLLEGE
NOTES TO FINANCIAL STATEMENTS - CONTINUED -
NOTE 6 – PENSION PLANS (Continued) The long-term expected rate of return on pension plan investments for actuarial purposes is based upon the 30 year capital market outlook at the end of the third quarter 2012. The actuarial long-term expected rates of return represent best estimates of arithmetic real rates of return for each major asset class and were developed in coordination with the investment consultant for the Retirement System Investment Commission (RSIC) using a building block approach, reflecting observable inflation and interest rate information available in the fixed income markets as well as Consensus Economic forecasts. The actuarial long-term assumptions for other asset classes are based on historical results, current market characteristics and professional judgment. The RSIC has exclusive authority to invest and manage the retirement trust Colleges’ assets. As co-fiduciary of the
Systems, statutory provision and governance policies allow the RSIC to operate in a manner consistent with a long-term investment time horizon. The expected real rates of investment return, along with the expected inflation rate, form the basis for the target asset allocation adopted annually by the RSIC. For actuarial purposes, the long-term expected rate of return is calculated by weighting the expected future real rates of return by the target allocation percentage and then adding the actuarial expected inflation which is summarized in the table below. For actuarial purposes, the 7.50 percent assumed annual investment rate of return used in the calculated of the total pension liability includes a 4.75 percent real rate of return and a 2.75 percent inflation component. The target allocation and best estimates of arithmetic real rates of return for each major asset class are summarized in the following table:
Asset Class Target Asset
Allocation Expected Arithmetic Real
Rate of Return
Long-Term Expected Portfolio Real Rate of
Return Short Term 5% Cash 2% 0.3% 0.01% Short Duration 3% 0.6% 0.02% Domestic Fixed Income 13% Core Fixed Income 7% 1.1% 0.08% High Yield 2% 3.5% 0.07% Bank Loans 4% 3.8% 0.11% Global Fixed Income 9% Global Fixed Income 3% 0.8% 0.02% Emerging Markets Debt 6% 4.1% 0.25% Global Public Equity 31% 7.8% 2.42% Global Tactical Asset Allocation 10% 5.1% 0.51% Alternatives 32% Hedge Funds (Low Beta) 8% 4.0% 0.32% Private Debt 7% 10.2% 0.71% Private Equity 9% 10.2% 0.92% Real Estate (Broad Market) 5% 5.9% 0.29% Commodities 3% 5.1% 0.15% Total Expected Real Return 100% 5.88% Inflation for Actuarial Purposes 2.75% Total Expected Nominal Return 8.63%
- 43 -
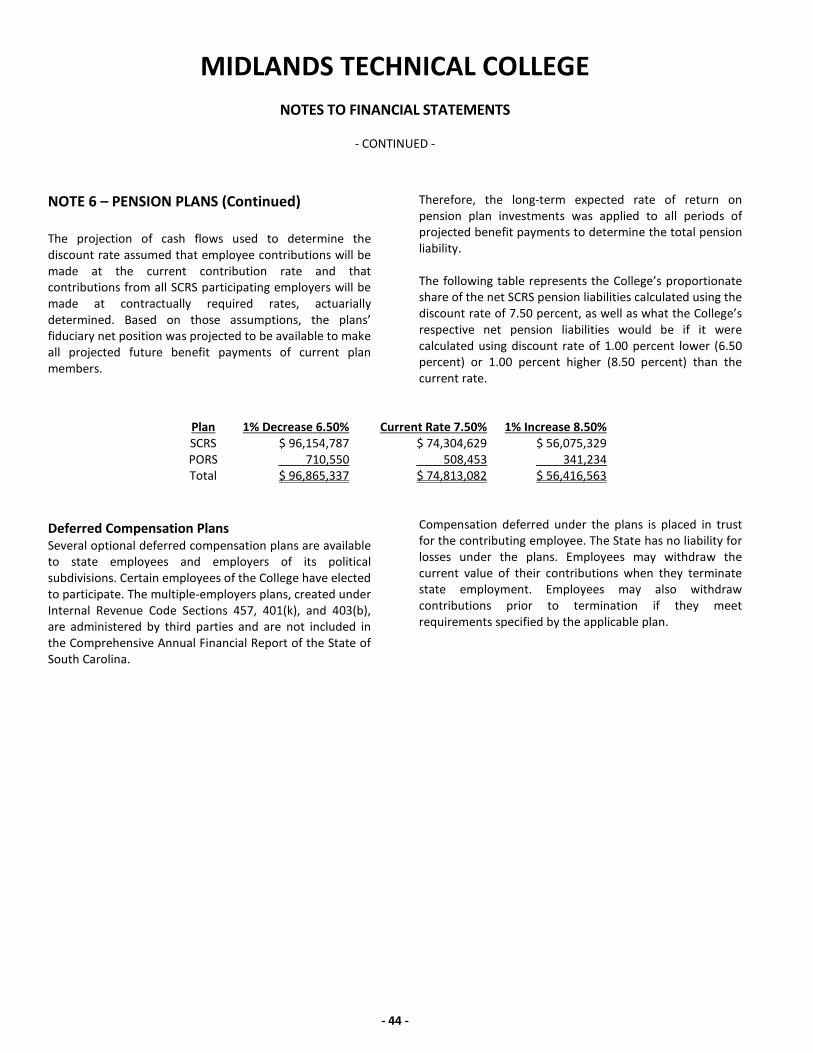
MIDLANDS TECHNICAL COLLEGE
NOTES TO FINANCIAL STATEMENTS - CONTINUED -
NOTE 6 – PENSION PLANS (Continued) The projection of cash flows used to determine the discount rate assumed that employee contributions will be made at the current contribution rate and that contributions from all SCRS participating employers will be made at contractually required rates, actuarially determined. Based on those assumptions, the plans’ fiduciary net position was projected to be available to make all projected future benefit payments of current plan members.
Therefore, the long-term expected rate of return on pension plan investments was applied to all periods of projected benefit payments to determine the total pension liability. The following table represents the College’s proportionate share of the net SCRS pension liabilities calculated using the discount rate of 7.50 percent, as well as what the College’s respective net pension liabilities would be if it were calculated using discount rate of 1.00 percent lower (6.50 percent) or 1.00 percent higher (8.50 percent) than the current rate.
Plan 1% Decrease 6.50% Current Rate 7.50% 1% Increase 8.50% SCRS $ 96,154,787 $ 74,304,629 $ 56,075,329 PORS 710,550 508,453 341,234 Total $ 96,865,337 $ 74,813,082 $ 56,416,563
Deferred Compensation Plans Several optional deferred compensation plans are available to state employees and employers of its political subdivisions. Certain employees of the College have elected to participate. The multiple-employers plans, created under Internal Revenue Code Sections 457, 401(k), and 403(b), are administered by third parties and are not included in the Comprehensive Annual Financial Report of the State of South Carolina.
Compensation deferred under the plans is placed in trust for the contributing employee. The State has no liability for losses under the plans. Employees may withdraw the current value of their contributions when they terminate state employment. Employees may also withdraw contributions prior to termination if they meet requirements specified by the applicable plan.
- 44 -
MIDLANDS TECHNICAL COLLEGE
NOTES TO FINANCIAL STATEMENTS - CONTINUED -
NOTE 7 – POSTEMPLOYMENT AND OTHER EMPLOYEE BENEFITS In accordance with the South Carolina Code of Laws and the annual Appropriations Act, the State provides post-employment health and dental and long-term disability benefits to retired State and school district employees and their covered dependents. The College contributes to the South Carolina Retiree Health Insurance Trust Fund (SCRHITF) and the South Carolina Long-Term Disability Insurance Trust Fund (SCLTDITF), cost-sharing multiple employer defined benefit postemployment healthcare, and long-term disability plans administered by the Insurance Benefits Division (IB), a part of the South Carolina Public Employee Benefit Authority (PEBA). Generally, retirees are eligible for the health and dental benefits if they have established at least ten years of retirement service credit. For new hires beginning employment May 2, 2008 and after, retirees are eligible for benefits if they have established 25 years of service for 100% employer funding and 15 through 24 years of service for 50% employer funding. Benefits become effective when the former employee retires under a State retirement system. Basic Long-Term Disability (BLTD) benefits are provided to active state, public school district, and participating local government employees approved for disability. Funding Policies Section 1-11-710 of the South Carolina Code of Laws of 1976, as amended, requires these postemployment and long-term disability benefits be funded through annual appropriations by the General Assembly for active employees to the IB and participating retirees to the PEBA, except for the portion funded through the pension surcharge and provided from the other applicable sources of the IB, for its active employees who are not funded by State General Fund appropriations. Employers participating in the RMP are mandated by State statue to contribute at a rate assessed each year by the Office of the State Budget, 5.00% of annual covered payroll for 2015, 4.92% of annual covered payroll for 2014 and 4.55% of annual covered payroll for 2013. The IB sets the employer contribution rate based on a pay-as-you-go basis. The College paid approximately $2,167,401, $2,036,044, and $1,788,754 included with the employer contribution for
retirement benefits for the fiscal years ended June 30, 2015 and 2014 and 2013, respectively, and equaled the required contributions of 10.75% for fiscal year 2015 (excluding the surcharge) and 10.45% for fiscal year 2014 (excluding the surcharge) and 10.45% for fiscal year 2013 (excluding the surcharge). BLTD benefits are funded through a person’s premium charged to State agencies, public school districts, and other participating local governments. The monthly premium per active employee paid to IB was $3.22 for the fiscal years ended June 30, 2015 and 2014. The College recorded employer contributions expenses applicable to these insurance benefits for active employees in the amount of approximately $3,498,637 and $3,013,530 for the years ended June 30, 2015 and 2014, respectively. Effective May 1, 2008 the State established two trust funds through Act 195 for the purpose of funding and accounting for the employer costs of retiree health and dental insurance benefits and long-term disability insurance benefits. The SCRHITF is primarily funded through the payroll surcharge. Other sources of funding include additional State appropriated dollars, accumulated IB reserves, and income generated from investments. The SCLTDITF is primarily funded through investment income and employer contributions. A copy of the separately issued financial statements for the benefit plans and the trust funds may be obtained by writing to the South Carolina Public Employee Benefit Authority-Insurance Benefits Division, P.O. Box 11960, Columbia, South Carolina 29211-1960. Other Employee Benefits In accordance with the South Carolina Code of Laws and the annual Appropriation Act, the State of South Carolina provides certain health care, dental, and life insurance benefits to all permanent full-time and certain permanent part-time employees of the College. These benefits are provided on a reimbursement basis by the employer agency based on rates established at the beginning of the service period by PEBA. The College recorded benefit expenses for these insurance benefits for active employees in the amount of $3,801,699 for the year ended June 30, 2015.
- 45 -
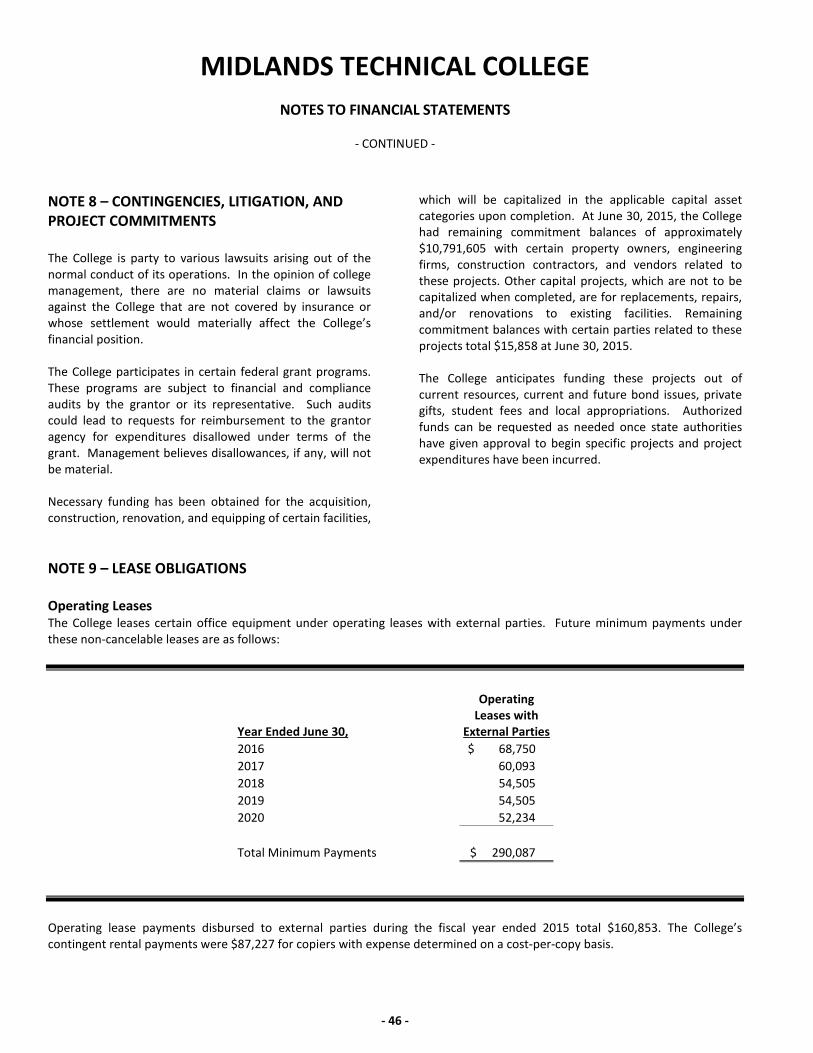
MIDLANDS TECHNICAL COLLEGE
NOTES TO FINANCIAL STATEMENTS - CONTINUED -
NOTE 8 – CONTINGENCIES, LITIGATION, AND PROJECT COMMITMENTS The College is party to various lawsuits arising out of the normal conduct of its operations. In the opinion of college management, there are no material claims or lawsuits against the College that are not covered by insurance or whose settlement would materially affect the College’s financial position. The College participates in certain federal grant programs. These programs are subject to financial and compliance audits by the grantor or its representative. Such audits could lead to requests for reimbursement to the grantor agency for expenditures disallowed under terms of the grant. Management believes disallowances, if any, will not be material. Necessary funding has been obtained for the acquisition, construction, renovation, and equipping of certain facilities,
which will be capitalized in the applicable capital asset categories upon completion. At June 30, 2015, the College had remaining commitment balances of approximately $10,791,605 with certain property owners, engineering firms, construction contractors, and vendors related to these projects. Other capital projects, which are not to be capitalized when completed, are for replacements, repairs, and/or renovations to existing facilities. Remaining commitment balances with certain parties related to these projects total $15,858 at June 30, 2015. The College anticipates funding these projects out of current resources, current and future bond issues, private gifts, student fees and local appropriations. Authorized funds can be requested as needed once state authorities have given approval to begin specific projects and project expenditures have been incurred.
NOTE 9 – LEASE OBLIGATIONS Operating Leases The College leases certain office equipment under operating leases with external parties. Future minimum payments under these non-cancelable leases are as follows:
Operating lease payments disbursed to external parties during the fiscal year ended 2015 total $160,853. The College’s contingent rental payments were $87,227 for copiers with expense determined on a cost-per-copy basis.
Operating
Leases with External Parties Year Ended June 30,
2016 $ 68,750 2017 60,093 2018 54,505 2019 54,505 2020 52,234 Total Minimum Payments $ 290,087
- 46 -
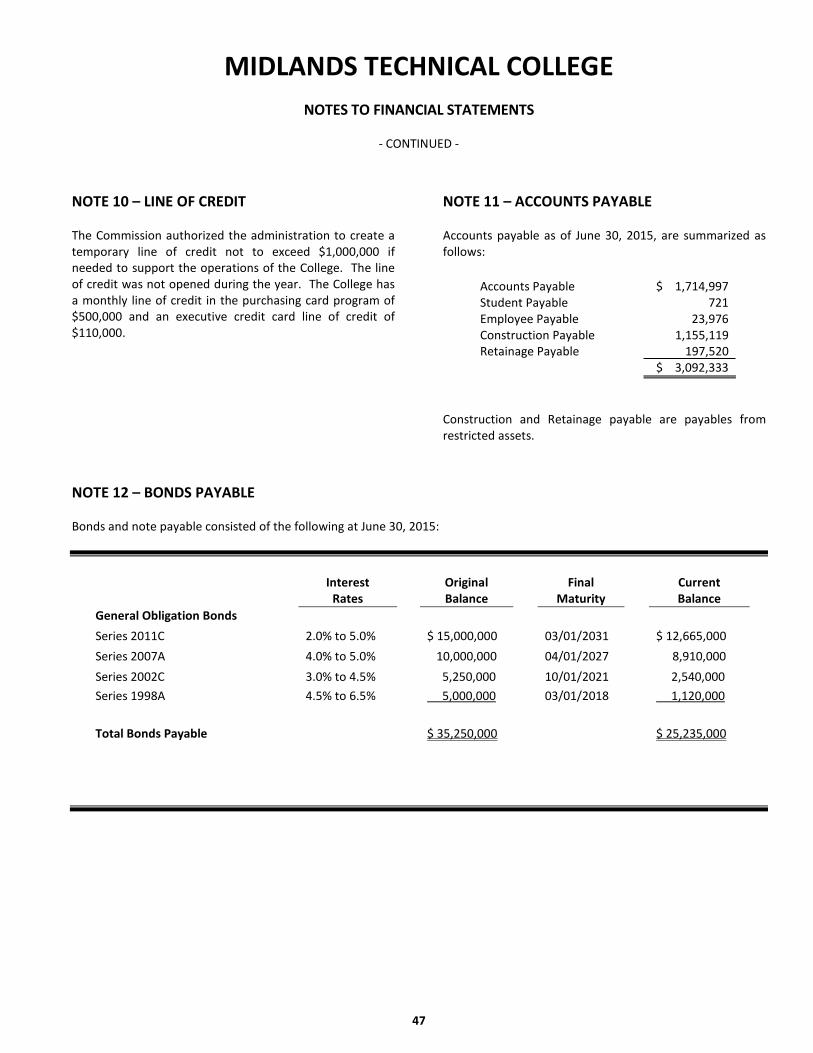
MIDLANDS TECHNICAL COLLEGE
NOTES TO FINANCIAL STATEMENTS
- CONTINUED -
NOTE 10 – LINE OF CREDIT The Commission authorized the administration to create a temporary line of credit not to exceed $1,000,000 if needed to support the operations of the College. The line of credit was not opened during the year. The College has a monthly line of credit in the purchasing card program of $500,000 and an executive credit card line of credit of $110,000.
NOTE 11 – ACCOUNTS PAYABLE Accounts payable as of June 30, 2015, are summarized as follows:
Accounts Payable $ 1,714,997 Student Payable 721 Employee Payable 23,976 Construction Payable 1,155,119 Retainage Payable 197,520 $ 3,092,333
Construction and Retainage payable are payables from restricted assets.
NOTE 12 – BONDS PAYABLE Bonds and note payable consisted of the following at June 30, 2015:
Interest
Rates Original
Balance Final
Maturity Current
Balance General Obligation Bonds Series 2011C 2.0% to 5.0% $ 15,000,000 03/01/2031 $ 12,665,000 Series 2007A 4.0% to 5.0% 10,000,000 04/01/2027 8,910,000 Series 2002C 3.0% to 4.5% 5,250,000 10/01/2021 2,540,000 Series 1998A 4.5% to 6.5% 5,000,000 03/01/2018 1,120,000 Total Bonds Payable $ 35,250,000 $ 25,235,000
47
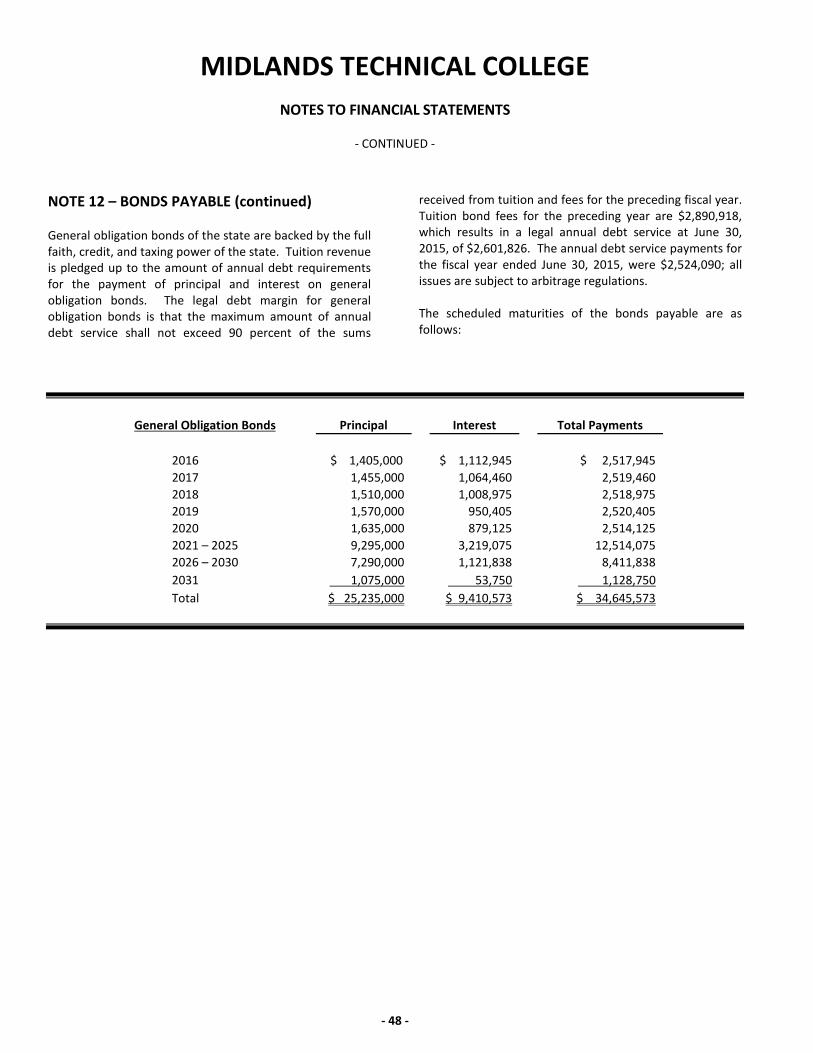
MIDLANDS TECHNICAL COLLEGE
NOTES TO FINANCIAL STATEMENTS
- CONTINUED -
NOTE 12 – BONDS PAYABLE (continued) General obligation bonds of the state are backed by the full faith, credit, and taxing power of the state. Tuition revenue is pledged up to the amount of annual debt requirements for the payment of principal and interest on general obligation bonds. The legal debt margin for general obligation bonds is that the maximum amount of annual debt service shall not exceed 90 percent of the sums
received from tuition and fees for the preceding fiscal year. Tuition bond fees for the preceding year are $2,890,918, which results in a legal annual debt service at June 30, 2015, of $2,601,826. The annual debt service payments for the fiscal year ended June 30, 2015, were $2,524,090; all issues are subject to arbitrage regulations. The scheduled maturities of the bonds payable are as follows:
General Obligation Bonds Principal Interest Total Payments
2016 $ 1,405,000 $ 1,112,945 $ 2,517,945 2017 1,455,000 1,064,460 2,519,460 2018 1,510,000 1,008,975 2,518,975 2019 1,570,000 950,405 2,520,405 2020 1,635,000 879,125 2,514,125 2021 – 2025 9,295,000 3,219,075 12,514,075 2026 – 2030 7,290,000 1,121,838 8,411,838 2031 1,075,000 53,750 1,128,750 Total $ 25,235,000 $ 9,410,573 $ 34,645,573
- 48 -
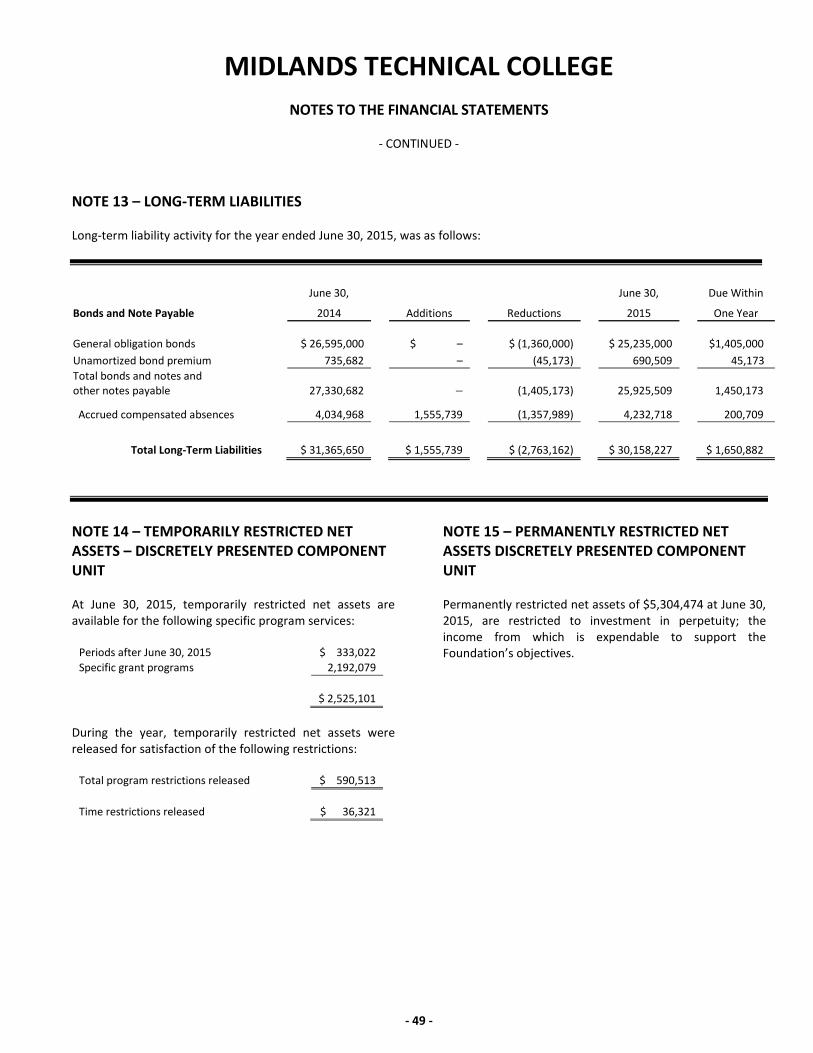
MIDLANDS TECHNICAL COLLEGE
NOTES TO THE FINANCIAL STATEMENTS
- CONTINUED -
NOTE 13 – LONG-TERM LIABILITIES Long-term liability activity for the year ended June 30, 2015, was as follows:
June 30, June 30, Due Within
Bonds and Note Payable 2014 Additions Reductions 2015 One Year
General obligation bonds $ 26,595,000 $ –
$ (1,360,000) $ 25,235,000 $1,405,000 Unamortized bond premium 735,682 – (45,173) 690,509 45,173 Total bonds and notes and other notes payable 27,330,682 – (1,405,173) 25,925,509 1,450,173
Accrued compensated absences 4,034,968 1,555,739 (1,357,989) 4,232,718 200,709
Total Long-Term Liabilities $ 31,365,650 $ 1,555,739 $ (2,763,162) $ 30,158,227 $ 1,650,882
NOTE 14 – TEMPORARILY RESTRICTED NET ASSETS – DISCRETELY PRESENTED COMPONENT UNIT At June 30, 2015, temporarily restricted net assets are available for the following specific program services:
Periods after June 30, 2015 $ 333,022 Specific grant programs 2,192,079 $ 2,525,101
During the year, temporarily restricted net assets were released for satisfaction of the following restrictions:
Total program restrictions released $ 590,513 Time restrictions released $ 36,321
NOTE 15 – PERMANENTLY RESTRICTED NET ASSETS DISCRETELY PRESENTED COMPONENT UNIT Permanently restricted net assets of $5,304,474 at June 30, 2015, are restricted to investment in perpetuity; the income from which is expendable to support the Foundation’s objectives.
- 49 -
MIDLANDS TECHNICAL COLLEGE
NOTES TO THE FINANCIAL STATEMENTS
- CONTINUED -
NOTE 16 – RELATED ORGANIZATIONS, RELATED PARTY TRANSACTIONS, AND TRANSACTIONS WITH DISCRETELY AND BLENDED PRESENTED COMPONENT UNITS Certain separately chartered legal entities whose activities are related to those of the College exist primarily to provide financial assistance and other support to the College and its educational programs. Financial statements for these entities are audited by independent auditors and retained by them. They include the Foundation and Enterprise Campus Authority. Management has reviewed its relationship with the Foundation. Because of the nature and the significance of its relationship with the College, the Foundation is considered a component unit of the College. Following is a more detailed discussion of the Foundation and a summary of significant transactions (if any) between the Foundation and the College for the year ended June 30, 2015.
The Midlands Technical College Foundation: The Foundation is a separately chartered corporation organized exclusively to receive and manage private funds for the exclusive benefit and support of the Foundation, scholarships for Midlands Technical College students, or other support of Midlands Technical College. The Foundation’s activities are governed by its Board of Directors. The Foundation exists to provide support of educational programs at Midlands Technical College. All of the Foundation’s expenditures are for the operation of the Foundation, scholarships for Midlands Technical College students, or other support of Midlands Technical College. Midlands Technical College provides office space and support services to the Foundation at no cost. Additionally, the Foundation paid the College a total of $3,000 for administrative services during the year. The Foundation’s assets as of June 30, 2015, were $9,367,475. Amounts due from/to the Foundation as of June 30, 2015, are as follows: Due from the Foundation $94,812.
- 50 -
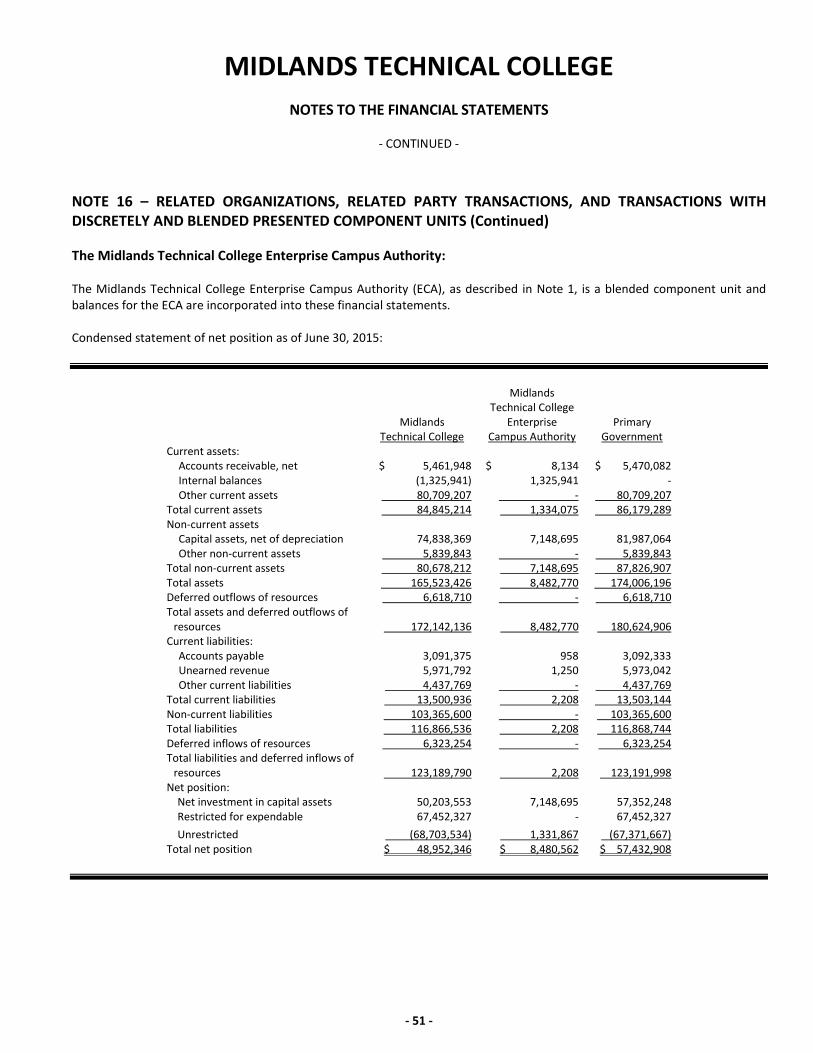
MIDLANDS TECHNICAL COLLEGE
NOTES TO THE FINANCIAL STATEMENTS
- CONTINUED -
NOTE 16 – RELATED ORGANIZATIONS, RELATED PARTY TRANSACTIONS, AND TRANSACTIONS WITH DISCRETELY AND BLENDED PRESENTED COMPONENT UNITS (Continued) The Midlands Technical College Enterprise Campus Authority: The Midlands Technical College Enterprise Campus Authority (ECA), as described in Note 1, is a blended component unit and balances for the ECA are incorporated into these financial statements. Condensed statement of net position as of June 30, 2015:
Midlands Technical College
Midlands Technical College
Enterprise Campus Authority
Primary Government
Current assets: Accounts receivable, net $ 5,461,948 $ 8,134 $ 5,470,082
Internal balances (1,325,941) 1,325,941 - Other current assets 80,709,207 - 80,709,207
Total current assets 84,845,214 1,334,075 86,179,289 Non-current assets
Capital assets, net of depreciation 74,838,369 7,148,695 81,987,064 Other non-current assets 5,839,843 - 5,839,843
Total non-current assets 80,678,212 7,148,695 87,826,907 Total assets 165,523,426 8,482,770 174,006,196 Deferred outflows of resources 6,618,710 - 6,618,710 Total assets and deferred outflows of
resources 172,142,136 8,482,770 180,624,906 Current liabilities:
Accounts payable 3,091,375 958 3,092,333 Unearned revenue 5,971,792 1,250 5,973,042 Other current liabilities 4,437,769 - 4,437,769
Total current liabilities 13,500,936 2,208 13,503,144 Non-current liabilities 103,365,600 - 103,365,600 Total liabilities 116,866,536 2,208 116,868,744 Deferred inflows of resources 6,323,254 - 6,323,254 Total liabilities and deferred inflows of
resources 123,189,790 2,208 123,191,998 Net position:
Net investment in capital assets 50,203,553 7,148,695 57,352,248 Restricted for expendable 67,452,327 - 67,452,327 Unrestricted (68,703,534) 1,331,867 (67,371,667) Total net position $ 48,952,346 $ 8,480,562 $ 57,432,908
- 51 -
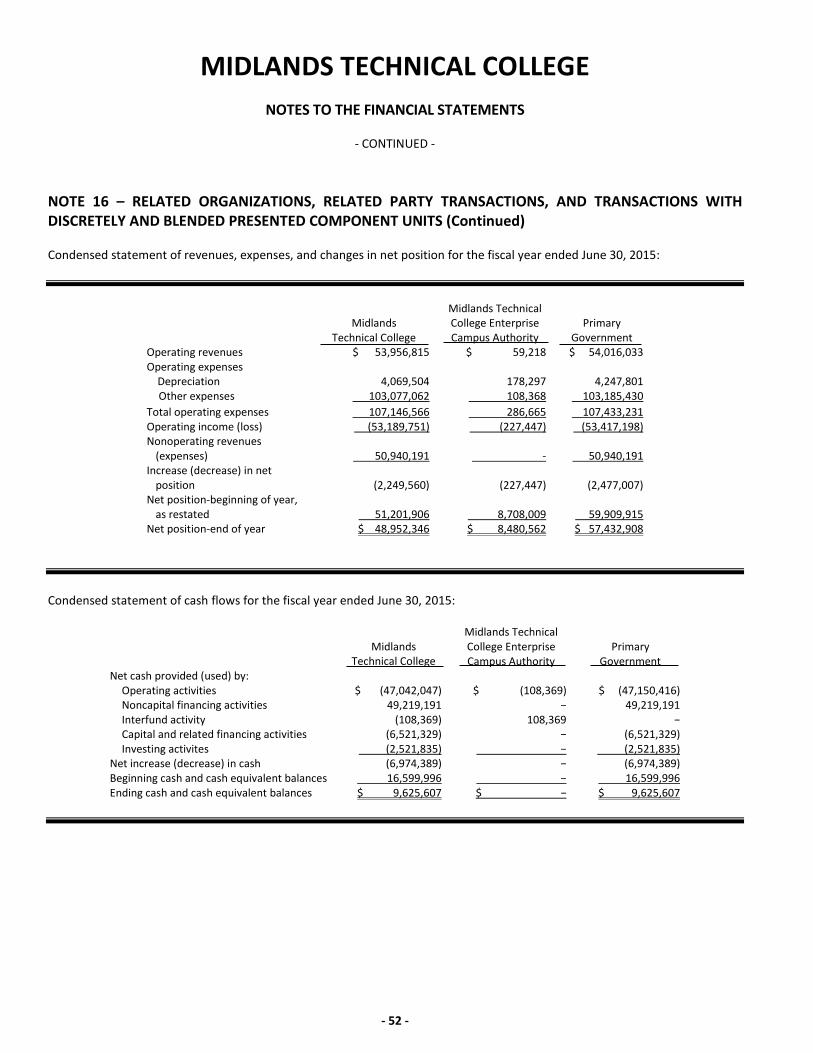
MIDLANDS TECHNICAL COLLEGE
NOTES TO THE FINANCIAL STATEMENTS
- CONTINUED -
NOTE 16 – RELATED ORGANIZATIONS, RELATED PARTY TRANSACTIONS, AND TRANSACTIONS WITH DISCRETELY AND BLENDED PRESENTED COMPONENT UNITS (Continued) Condensed statement of revenues, expenses, and changes in net position for the fiscal year ended June 30, 2015:
Midlands Technical College
Midlands Technical College Enterprise Campus Authority
Primary Government
Operating revenues $ 53,956,815 $ 59,218 $ 54,016,033 Operating expenses
Depreciation 4,069,504 178,297 4,247,801 Other expenses 103,077,062 108,368 103,185,430
Total operating expenses 107,146,566 286,665 107,433,231 Operating income (loss) (53,189,751) (227,447) (53,417,198) Nonoperating revenues
(expenses) 50,940,191 - 50,940,191 Increase (decrease) in net
position (2,249,560) (227,447) (2,477,007) Net position-beginning of year,
as restated 51,201,906 8,708,009 59,909,915 Net position-end of year $ 48,952,346 $ 8,480,562 $ 57,432,908
Condensed statement of cash flows for the fiscal year ended June 30, 2015:
Midlands Technical College
Midlands Technical College Enterprise Campus Authority
Primary Government
Net cash provided (used) by: Operating activities $ (47,042,047) $ (108,369) $ (47,150,416)
Noncapital financing activities 49,219,191 − 49,219,191 Interfund activity (108,369) 108,369 − Capital and related financing activities (6,521,329) − (6,521,329) Investing activites (2,521,835) − (2,521,835)
Net increase (decrease) in cash (6,974,389) − (6,974,389) Beginning cash and cash equivalent balances 16,599,996 − 16,599,996 Ending cash and cash equivalent balances $ 9,625,607 $ − $ 9,625,607
- 52 -
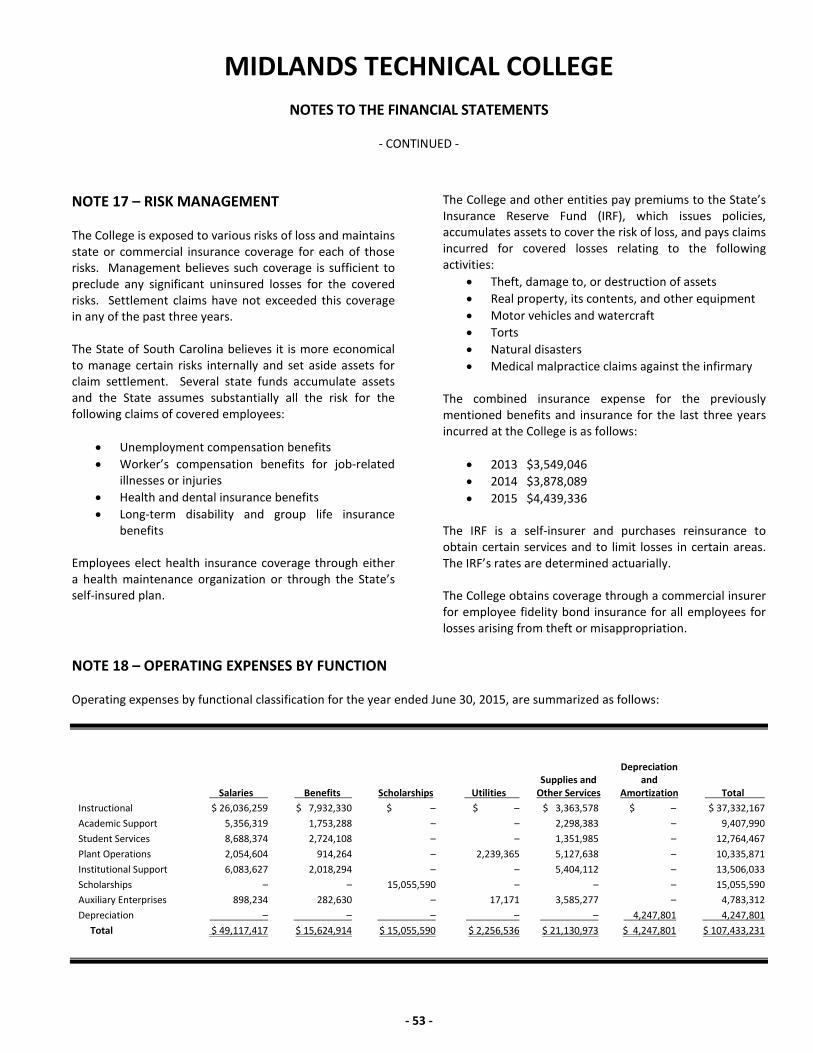
MIDLANDS TECHNICAL COLLEGE
NOTES TO THE FINANCIAL STATEMENTS
- CONTINUED -
NOTE 17 – RISK MANAGEMENT The College is exposed to various risks of loss and maintains state or commercial insurance coverage for each of those risks. Management believes such coverage is sufficient to preclude any significant uninsured losses for the covered risks. Settlement claims have not exceeded this coverage in any of the past three years. The State of South Carolina believes it is more economical to manage certain risks internally and set aside assets for claim settlement. Several state funds accumulate assets and the State assumes substantially all the risk for the following claims of covered employees:
• Unemployment compensation benefits • Worker’s compensation benefits for job-related
illnesses or injuries • Health and dental insurance benefits • Long-term disability and group life insurance
benefits Employees elect health insurance coverage through either a health maintenance organization or through the State’s self-insured plan.
The College and other entities pay premiums to the State’s Insurance Reserve Fund (IRF), which issues policies, accumulates assets to cover the risk of loss, and pays claims incurred for covered losses relating to the following activities:
• Theft, damage to, or destruction of assets • Real property, its contents, and other equipment • Motor vehicles and watercraft • Torts • Natural disasters • Medical malpractice claims against the infirmary
The combined insurance expense for the previously mentioned benefits and insurance for the last three years incurred at the College is as follows:
• 2013 $3,549,046 • 2014 $3,878,089 • 2015 $4,439,336
The IRF is a self-insurer and purchases reinsurance to obtain certain services and to limit losses in certain areas. The IRF’s rates are determined actuarially. The College obtains coverage through a commercial insurer for employee fidelity bond insurance for all employees for losses arising from theft or misappropriation.
NOTE 18 – OPERATING EXPENSES BY FUNCTION Operating expenses by functional classification for the year ended June 30, 2015, are summarized as follows:
Salaries Benefits Scholarships Utilities
Supplies and Other Services
Depreciation
and Amortization Total
Instructional $ 26,036,259 $ 7,932,330 $ – $ – $ 3,363,578 $ – $ 37,332,167 Academic Support 5,356,319 1,753,288 – – 2,298,383 – 9,407,990 Student Services 8,688,374 2,724,108 – – 1,351,985 – 12,764,467 Plant Operations 2,054,604 914,264 – 2,239,365 5,127,638 – 10,335,871 Institutional Support 6,083,627 2,018,294 – – 5,404,112 – 13,506,033 Scholarships – – 15,055,590 – – – 15,055,590 Auxiliary Enterprises 898,234 282,630 – 17,171 3,585,277 – 4,783,312 Depreciation – – – – – 4,247,801 4,247,801 Total $ 49,117,417 $ 15,624,914 $ 15,055,590 $ 2,256,536 $ 21,130,973 $ 4,247,801 $ 107,433,231
- 53 -
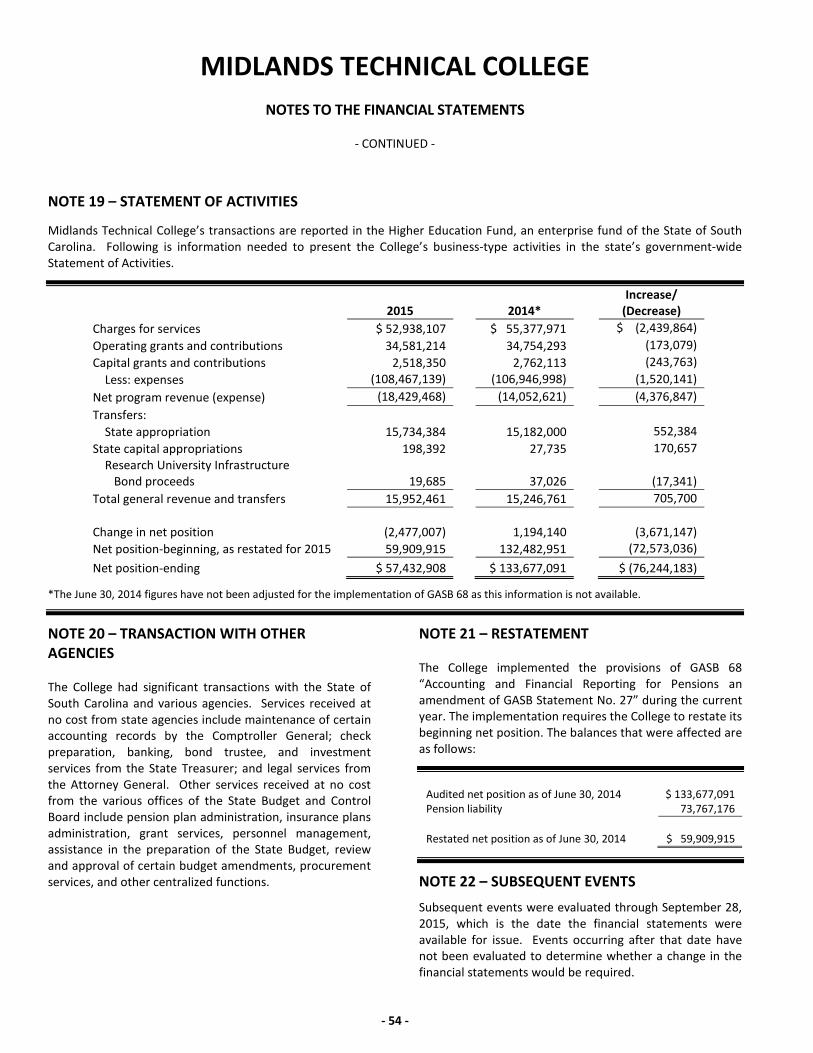
MIDLANDS TECHNICAL COLLEGE
NOTES TO THE FINANCIAL STATEMENTS
- CONTINUED -
NOTE 19 – STATEMENT OF ACTIVITIES
Midlands Technical College’s transactions are reported in the Higher Education Fund, an enterprise fund of the State of South Carolina. Following is information needed to present the College’s business-type activities in the state’s government-wide Statement of Activities.
2015 2014* Increase/
(Decrease) Charges for services $ 52,938,107 $ 55,377,971 $ (2,439,864) Operating grants and contributions 34,581,214 34,754,293 (173,079) Capital grants and contributions 2,518,350 2,762,113 (243,763) Less: expenses (108,467,139) (106,946,998) (1,520,141) Net program revenue (expense) (18,429,468) (14,052,621) (4,376,847) Transfers: State appropriation 15,734,384 15,182,000 552,384 State capital appropriations 198,392 27,735 170,657 Research University Infrastructure Bond proceeds 19,685
37,026
(17,341)
Total general revenue and transfers 15,952,461 15,246,761 705,700
Change in net position (2,477,007) 1,194,140
(3,671,147) Net position-beginning, as restated for 2015 59,909,915 132,482,951 (72,573,036) Net position-ending $ 57,432,908 $ 133,677,091 $ (76,244,183)
*The June 30, 2014 figures have not been adjusted for the implementation of GASB 68 as this information is not available.
NOTE 20 – TRANSACTION WITH OTHER AGENCIES The College had significant transactions with the State of South Carolina and various agencies. Services received at no cost from state agencies include maintenance of certain accounting records by the Comptroller General; check preparation, banking, bond trustee, and investment services from the State Treasurer; and legal services from the Attorney General. Other services received at no cost from the various offices of the State Budget and Control Board include pension plan administration, insurance plans administration, grant services, personnel management, assistance in the preparation of the State Budget, review and approval of certain budget amendments, procurement services, and other centralized functions.
NOTE 21 – RESTATEMENT The College implemented the provisions of GASB 68 “Accounting and Financial Reporting for Pensions an amendment of GASB Statement No. 27” during the current year. The implementation requires the College to restate its beginning net position. The balances that were affected are as follows:
Audited net position as of June 30, 2014 $ 133,677,091 Pension liability 73,767,176 Restated net position as of June 30, 2014 $ 59,909,915
NOTE 22 – SUBSEQUENT EVENTS
Subsequent events were evaluated through September 28, 2015, which is the date the financial statements were available for issue. Events occurring after that date have not been evaluated to determine whether a change in the financial statements would be required.
- 54 -
Required Supplemental Information
MIDLANDS TECHNICAL COLLEGE
- 55 -

This page intentionally left blank
- 56 -
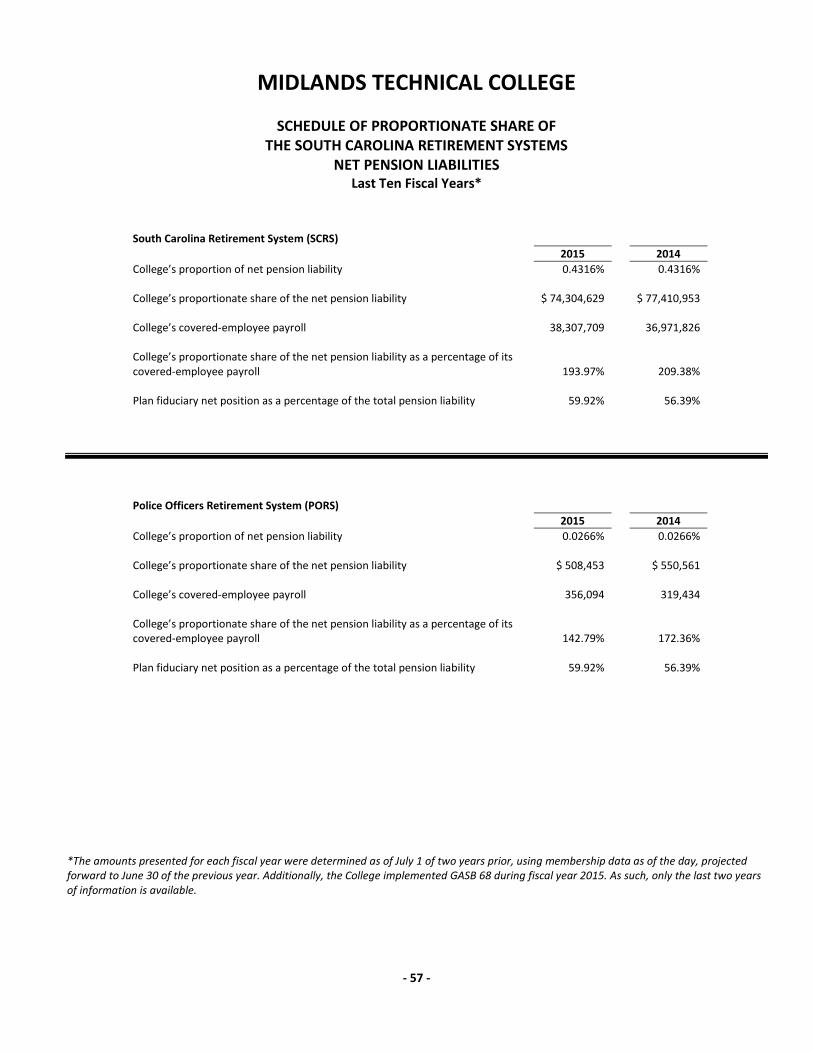
MIDLANDS TECHNICAL COLLEGE
SCHEDULE OF PROPORTIONATE SHARE OF THE SOUTH CAROLINA RETIREMENT SYSTEMS
NET PENSION LIABILITIES Last Ten Fiscal Years*
South Carolina Retirement System (SCRS) 2015 2014 College’s proportion of net pension liability 0.4316% 0.4316% College’s proportionate share of the net pension liability $ 74,304,629 $ 77,410,953 College’s covered-employee payroll 38,307,709 36,971,826 College’s proportionate share of the net pension liability as a percentage of its covered-employee payroll 193.97%
209.38%
Plan fiduciary net position as a percentage of the total pension liability 59.92% 56.39%
*The amounts presented for each fiscal year were determined as of July 1 of two years prior, using membership data as of the day, projected forward to June 30 of the previous year. Additionally, the College implemented GASB 68 during fiscal year 2015. As such, only the last two years of information is available.
Police Officers Retirement System (PORS) 2015 2014 College’s proportion of net pension liability 0.0266% 0.0266% College’s proportionate share of the net pension liability $ 508,453 $ 550,561 College’s covered-employee payroll 356,094 319,434 College’s proportionate share of the net pension liability as a percentage of its covered-employee payroll 142.79%
172.36%
Plan fiduciary net position as a percentage of the total pension liability 59.92% 56.39%
- 57 -
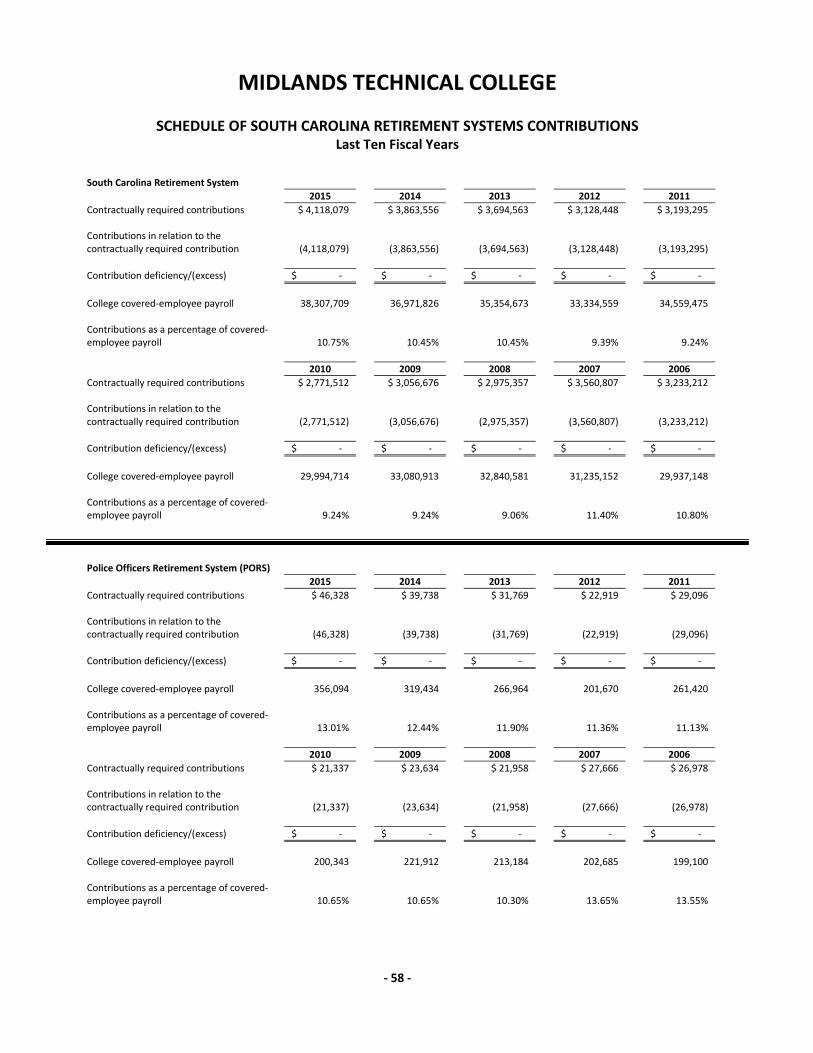
MIDLANDS TECHNICAL COLLEGE
SCHEDULE OF SOUTH CAROLINA RETIREMENT SYSTEMS CONTRIBUTIONS Last Ten Fiscal Years
South Carolina Retirement System 2015 2014 2013 2012 2011
Contractually required contributions $ 4,118,079 $ 3,863,556 $ 3,694,563 $ 3,128,448 $ 3,193,295 Contributions in relation to the contractually required contribution (4,118,079) (3,863,556) (3,694,563) (3,128,448) (3,193,295) Contribution deficiency/(excess) $ - $ - $ - $ - $ - College covered-employee payroll 38,307,709 36,971,826 35,354,673 33,334,559 34,559,475 Contributions as a percentage of covered-employee payroll 10.75% 10.45% 10.45% 9.39% 9.24%
2010 2009 2008 2007 2006
Contractually required contributions $ 2,771,512 $ 3,056,676 $ 2,975,357 $ 3,560,807 $ 3,233,212 Contributions in relation to the contractually required contribution (2,771,512) (3,056,676) (2,975,357) (3,560,807) (3,233,212) Contribution deficiency/(excess) $ - $ - $ - $ - $ - College covered-employee payroll 29,994,714 33,080,913 32,840,581 31,235,152 29,937,148 Contributions as a percentage of covered-employee payroll 9.24% 9.24% 9.06% 11.40% 10.80%
Police Officers Retirement System (PORS) 2015 2014 2013 2012 2011
Contractually required contributions $ 46,328 $ 39,738 $ 31,769 $ 22,919 $ 29,096 Contributions in relation to the contractually required contribution (46,328) (39,738) (31,769) (22,919) (29,096) Contribution deficiency/(excess) $ - $ - $ - $ - $ - College covered-employee payroll 356,094 319,434 266,964 201,670 261,420 Contributions as a percentage of covered-employee payroll 13.01% 12.44% 11.90% 11.36% 11.13%
2010 2009 2008 2007 2006
Contractually required contributions $ 21,337 $ 23,634 $ 21,958 $ 27,666 $ 26,978 Contributions in relation to the contractually required contribution (21,337) (23,634) (21,958) (27,666) (26,978) Contribution deficiency/(excess) $ - $ - $ - $ - $ - College covered-employee payroll 200,343 221,912 213,184 202,685 199,100 Contributions as a percentage of covered-employee payroll 10.65% 10.65% 10.30% 13.65% 13.55%
- 58 -
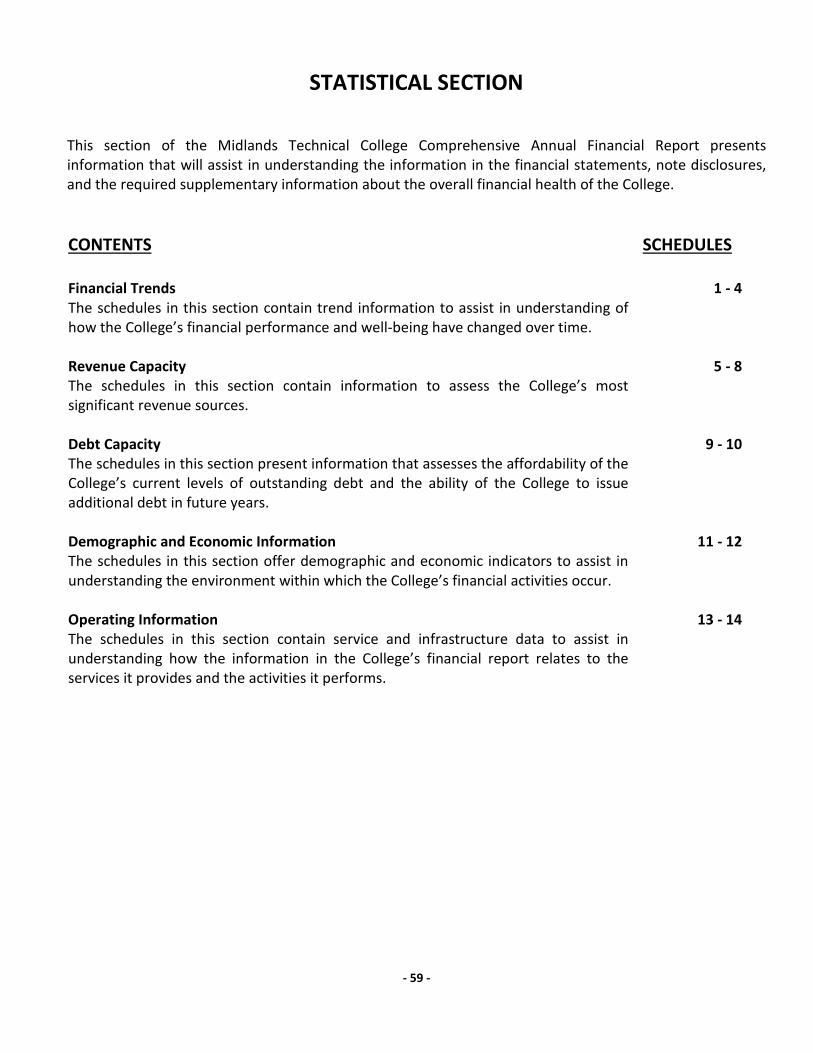
STATISTICAL SECTION
This section of the Midlands Technical College Comprehensive Annual Financial Report presents information that will assist in understanding the information in the financial statements, note disclosures, and the required supplementary information about the overall financial health of the College. CONTENTS
SCHEDULES
Financial Trends The schedules in this section contain trend information to assist in understanding of how the College’s financial performance and well-being have changed over time.
1 - 4
Revenue Capacity The schedules in this section contain information to assess the College’s most significant revenue sources.
5 - 8
Debt Capacity The schedules in this section present information that assesses the affordability of the College’s current levels of outstanding debt and the ability of the College to issue additional debt in future years.
9 - 10
Demographic and Economic Information The schedules in this section offer demographic and economic indicators to assist in understanding the environment within which the College’s financial activities occur.
11 - 12
Operating Information The schedules in this section contain service and infrastructure data to assist in understanding how the information in the College’s financial report relates to the services it provides and the activities it performs.
13 - 14
- 59 -

This page intentionally left blank
- 60 -
Financial Trends
MIDLANDS TECHNICAL COLLEGE
- 61 -

This page intentionally left blank
- 62 -
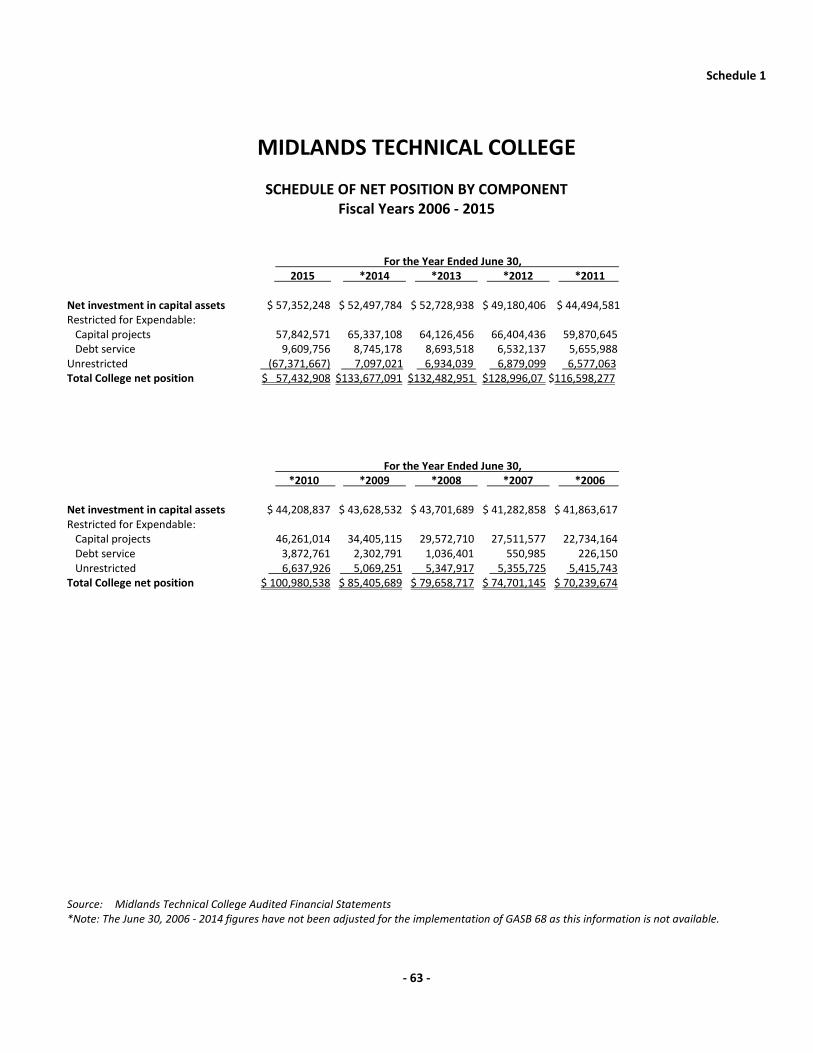
Schedule 1
MIDLANDS TECHNICAL COLLEGE
SCHEDULE OF NET POSITION BY COMPONENT Fiscal Years 2006 - 2015
For the Year Ended June 30, 2015 *2014 *2013 *2012 *2011 Net investment in capital assets $ 57,352,248 $ 52,497,784 $ 52,728,938 $ 49,180,406 $ 44,494,581 Restricted for Expendable: Capital projects 57,842,571 65,337,108 64,126,456 66,404,436 59,870,645 Debt service 9,609,756 8,745,178 8,693,518 6,532,137 5,655,988 Unrestricted (67,371,667) 7,097,021 6,934,039 6,879,099 6,577,063 Total College net position $ 57,432,908 $133,677,091 $132,482,951 $128,996,07 $116,598,277 For the Year Ended June 30, *2010 *2009 *2008 *2007 *2006 Net investment in capital assets $ 44,208,837 $ 43,628,532 $ 43,701,689 $ 41,282,858 $ 41,863,617 Restricted for Expendable: Capital projects 46,261,014 34,405,115 29,572,710 27,511,577 22,734,164 Debt service 3,872,761 2,302,791 1,036,401 550,985 226,150 Unrestricted 6,637,926 5,069,251 5,347,917 5,355,725 5,415,743 Total College net position $ 100,980,538 $ 85,405,689 $ 79,658,717 $ 74,701,145 $ 70,239,674 Source: Midlands Technical College Audited Financial Statements *Note: The June 30, 2006 ‐ 2014 figures have not been adjusted for the implementation of GASB 68 as this information is not available.
- 63 -
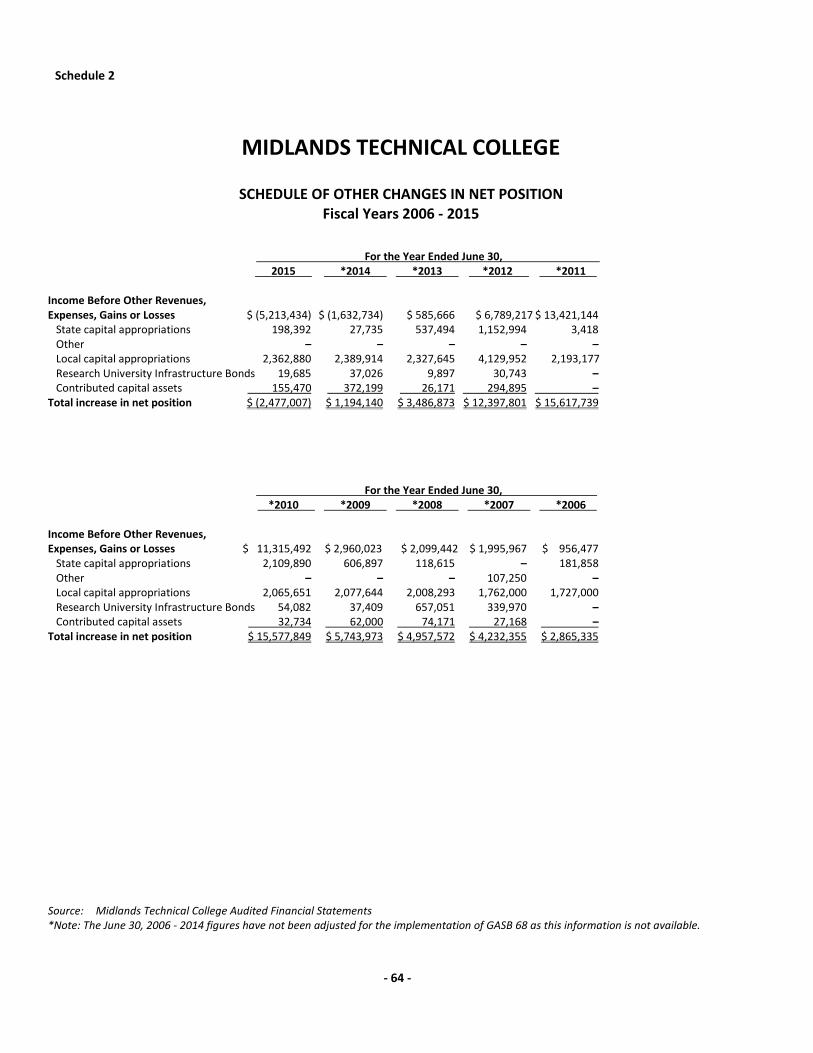
Schedule 2
MIDLANDS TECHNICAL COLLEGE
SCHEDULE OF OTHER CHANGES IN NET POSITION Fiscal Years 2006 - 2015
For the Year Ended June 30, 2015 *2014 *2013 *2012 *2011 Income Before Other Revenues, Expenses, Gains or Losses $ (5,213,434) $ (1,632,734) $ 585,666 $ 6,789,217 $ 13,421,144 State capital appropriations 198,392 27,735 537,494 1,152,994 3,418 Other – – – – – Local capital appropriations 2,362,880 2,389,914 2,327,645 4,129,952 2,193,177 Research University Infrastructure Bonds 19,685 37,026 9,897 30,743 – Contributed capital assets 155,470 372,199 26,171 294,895 – Total increase in net position $ (2,477,007) $ 1,194,140 $ 3,486,873 $ 12,397,801 $ 15,617,739 For the Year Ended June 30, *2010 *2009 *2008 *2007 *2006 Income Before Other Revenues, Expenses, Gains or Losses $ 11,315,492 $ 2,960,023 $ 2,099,442 $ 1,995,967 $ 956,477 State capital appropriations 2,109,890 606,897 118,615 – 181,858 Other – – – 107,250 – Local capital appropriations 2,065,651 2,077,644 2,008,293 1,762,000 1,727,000 Research University Infrastructure Bonds 54,082 37,409 657,051 339,970 – Contributed capital assets 32,734 62,000 74,171 27,168 – Total increase in net position $ 15,577,849 $ 5,743,973 $ 4,957,572 $ 4,232,355 $ 2,865,335 Source: Midlands Technical College Audited Financial Statements *Note: The June 30, 2006 ‐ 2014 figures have not been adjusted for the implementation of GASB 68 as this information is not available.
- 64 -
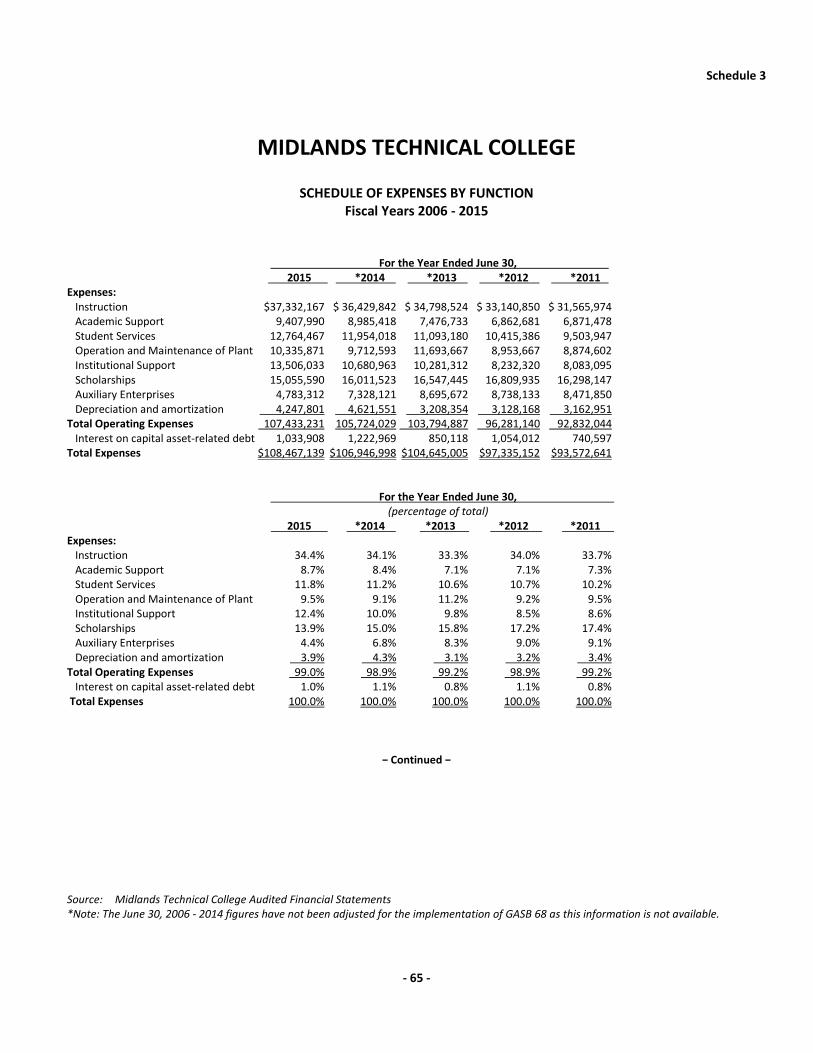
Schedule 3
MIDLANDS TECHNICAL COLLEGE
SCHEDULE OF EXPENSES BY FUNCTION Fiscal Years 2006 - 2015
For the Year Ended June 30, 2015 *2014 *2013 *2012 *2011 Expenses: Instruction $37,332,167 $ 36,429,842 $ 34,798,524 $ 33,140,850 $ 31,565,974 Academic Support 9,407,990 8,985,418 7,476,733 6,862,681 6,871,478 Student Services 12,764,467 11,954,018 11,093,180 10,415,386 9,503,947 Operation and Maintenance of Plant 10,335,871 9,712,593 11,693,667 8,953,667 8,874,602 Institutional Support 13,506,033 10,680,963 10,281,312 8,232,320 8,083,095 Scholarships 15,055,590 16,011,523 16,547,445 16,809,935 16,298,147 Auxiliary Enterprises 4,783,312 7,328,121 8,695,672 8,738,133 8,471,850 Depreciation and amortization 4,247,801 4,621,551 3,208,354 3,128,168 3,162,951 Total Operating Expenses 107,433,231 105,724,029 103,794,887 96,281,140 92,832,044 Interest on capital asset-related debt 1,033,908 1,222,969 850,118 1,054,012 740,597 Total Expenses $108,467,139 $106,946,998 $104,645,005 $97,335,152 $93,572,641 For the Year Ended June 30, (percentage of total) 2015 *2014 *2013 *2012 *2011 Expenses: Instruction 34.4% 34.1% 33.3% 34.0% 33.7% Academic Support 8.7% 8.4% 7.1% 7.1% 7.3% Student Services 11.8% 11.2% 10.6% 10.7% 10.2% Operation and Maintenance of Plant 9.5% 9.1% 11.2% 9.2% 9.5% Institutional Support 12.4% 10.0% 9.8% 8.5% 8.6% Scholarships 13.9% 15.0% 15.8% 17.2% 17.4% Auxiliary Enterprises 4.4% 6.8% 8.3% 9.0% 9.1% Depreciation and amortization 3.9% 4.3% 3.1% 3.2% 3.4% Total Operating Expenses 99.0% 98.9% 99.2% 98.9% 99.2% Interest on capital asset-related debt 1.0% 1.1% 0.8% 1.1% 0.8% Total Expenses 100.0% 100.0% 100.0% 100.0% 100.0%
− Continued −
Source: Midlands Technical College Audited Financial Statements *Note: The June 30, 2006 ‐ 2014 figures have not been adjusted for the implementation of GASB 68 as this information is not available.
- 65 -
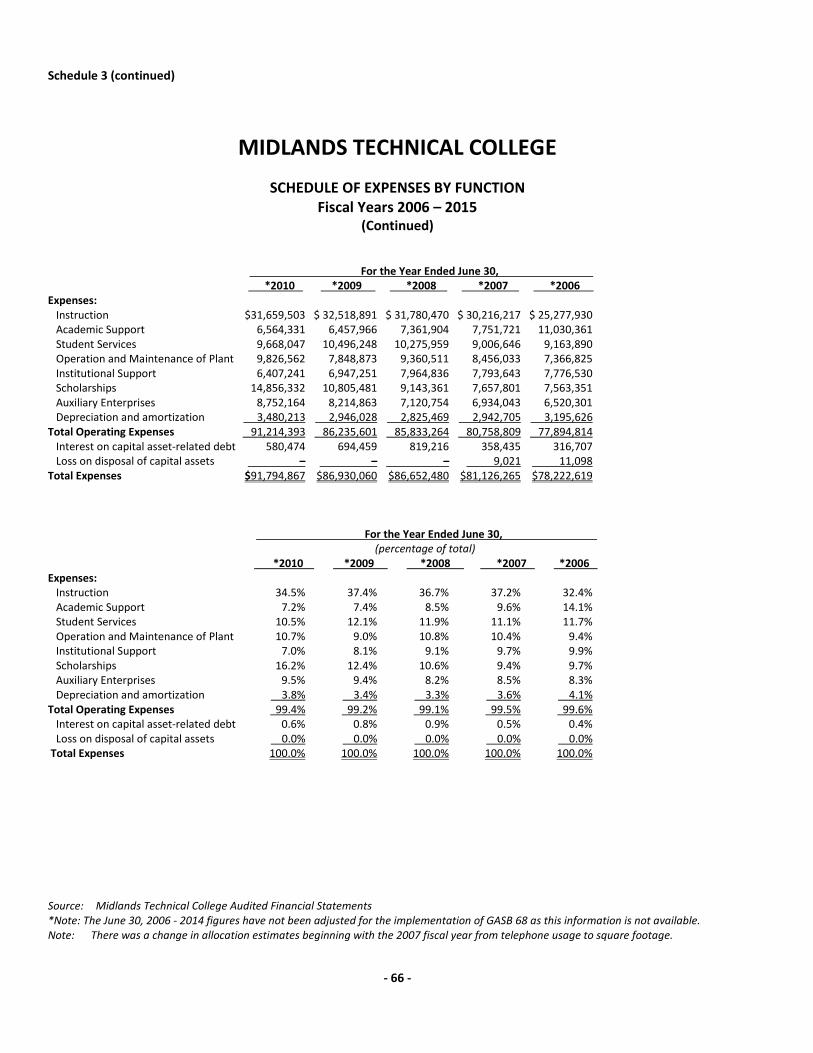
Schedule 3 (continued)
MIDLANDS TECHNICAL COLLEGE
SCHEDULE OF EXPENSES BY FUNCTION Fiscal Years 2006 – 2015
(Continued) For the Year Ended June 30, *2010 *2009 *2008 *2007 *2006 Expenses: Instruction $31,659,503 $ 32,518,891 $ 31,780,470 $ 30,216,217 $ 25,277,930 Academic Support 6,564,331 6,457,966 7,361,904 7,751,721 11,030,361 Student Services 9,668,047 10,496,248 10,275,959 9,006,646 9,163,890 Operation and Maintenance of Plant 9,826,562 7,848,873 9,360,511 8,456,033 7,366,825 Institutional Support 6,407,241 6,947,251 7,964,836 7,793,643 7,776,530 Scholarships 14,856,332 10,805,481 9,143,361 7,657,801 7,563,351 Auxiliary Enterprises 8,752,164 8,214,863 7,120,754 6,934,043 6,520,301 Depreciation and amortization 3,480,213 2,946,028 2,825,469 2,942,705 3,195,626 Total Operating Expenses 91,214,393 86,235,601 85,833,264 80,758,809 77,894,814 Interest on capital asset-related debt 580,474 694,459 819,216 358,435 316,707 Loss on disposal of capital assets – – – 9,021 11,098 Total Expenses $91,794,867 $86,930,060 $86,652,480 $81,126,265 $78,222,619 For the Year Ended June 30, (percentage of total) *2010 *2009 *2008 *2007 *2006 Expenses: Instruction 34.5% 37.4% 36.7% 37.2% 32.4% Academic Support 7.2% 7.4% 8.5% 9.6% 14.1% Student Services 10.5% 12.1% 11.9% 11.1% 11.7% Operation and Maintenance of Plant 10.7% 9.0% 10.8% 10.4% 9.4% Institutional Support 7.0% 8.1% 9.1% 9.7% 9.9% Scholarships 16.2% 12.4% 10.6% 9.4% 9.7% Auxiliary Enterprises 9.5% 9.4% 8.2% 8.5% 8.3% Depreciation and amortization 3.8% 3.4% 3.3% 3.6% 4.1% Total Operating Expenses 99.4% 99.2% 99.1% 99.5% 99.6% Interest on capital asset-related debt 0.6% 0.8% 0.9% 0.5% 0.4% Loss on disposal of capital assets 0.0% 0.0% 0.0% 0.0% 0.0% Total Expenses 100.0% 100.0% 100.0% 100.0% 100.0% Source: Midlands Technical College Audited Financial Statements *Note: The June 30, 2006 ‐ 2014 figures have not been adjusted for the implementation of GASB 68 as this information is not available. Note: There was a change in allocation estimates beginning with the 2007 fiscal year from telephone usage to square footage.
- 66 -
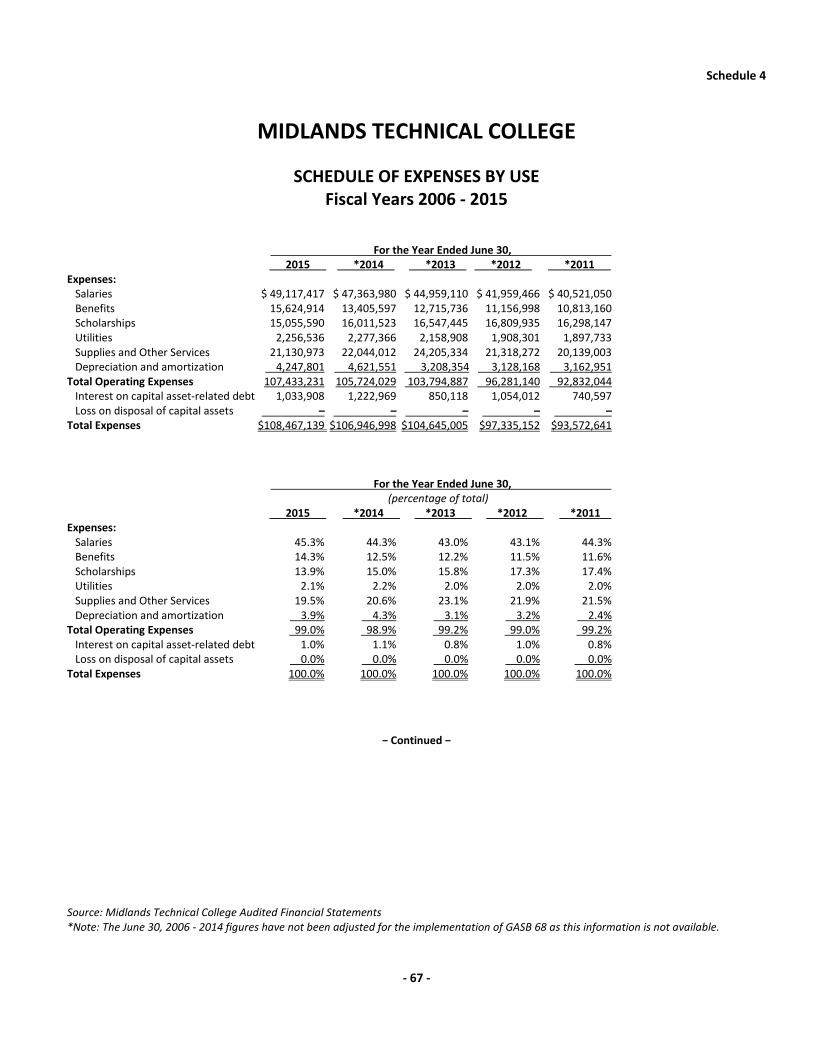
Schedule 4
MIDLANDS TECHNICAL COLLEGE
SCHEDULE OF EXPENSES BY USE Fiscal Years 2006 - 2015
For the Year Ended June 30, 2015 *2014 *2013 *2012 *2011 Expenses: Salaries $ 49,117,417 $ 47,363,980 $ 44,959,110 $ 41,959,466 $ 40,521,050 Benefits 15,624,914 13,405,597 12,715,736 11,156,998 10,813,160 Scholarships 15,055,590 16,011,523 16,547,445 16,809,935 16,298,147 Utilities 2,256,536 2,277,366 2,158,908 1,908,301 1,897,733 Supplies and Other Services 21,130,973 22,044,012 24,205,334 21,318,272 20,139,003 Depreciation and amortization 4,247,801 4,621,551 3,208,354 3,128,168 3,162,951 Total Operating Expenses 107,433,231 105,724,029 103,794,887 96,281,140 92,832,044 Interest on capital asset-related debt 1,033,908 1,222,969 850,118 1,054,012 740,597 Loss on disposal of capital assets – – – – – Total Expenses $108,467,139 $106,946,998 $104,645,005 $97,335,152 $93,572,641 For the Year Ended June 30, (percentage of total) 2015 *2014 *2013 *2012 *2011 Expenses: Salaries 45.3% 44.3% 43.0% 43.1% 44.3% Benefits 14.3% 12.5% 12.2% 11.5% 11.6% Scholarships 13.9% 15.0% 15.8% 17.3% 17.4% Utilities 2.1% 2.2% 2.0% 2.0% 2.0% Supplies and Other Services 19.5% 20.6% 23.1% 21.9% 21.5% Depreciation and amortization 3.9% 4.3% 3.1% 3.2% 2.4% Total Operating Expenses 99.0% 98.9% 99.2% 99.0% 99.2% Interest on capital asset-related debt 1.0% 1.1% 0.8% 1.0% 0.8% Loss on disposal of capital assets 0.0% 0.0% 0.0% 0.0% 0.0% Total Expenses 100.0% 100.0% 100.0% 100.0% 100.0%
− Continued −
Source: Midlands Technical College Audited Financial Statements *Note: The June 30, 2006 ‐ 2014 figures have not been adjusted for the implementation of GASB 68 as this information is not available.
- 67 -
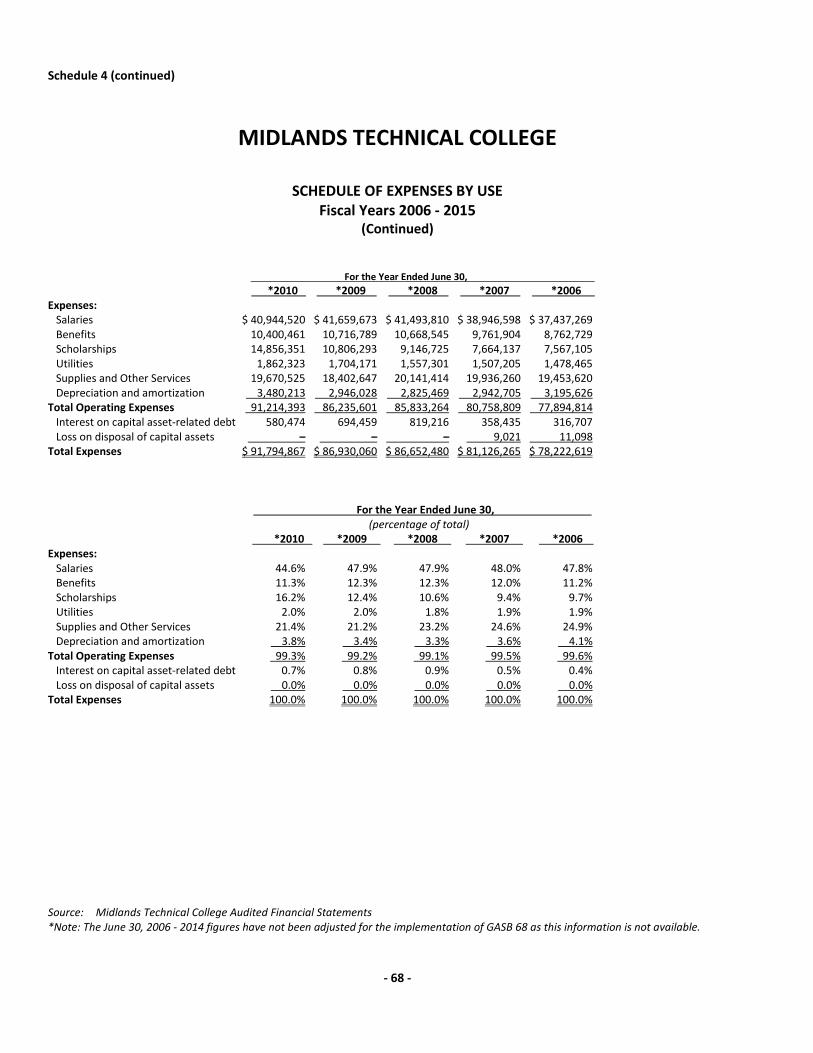
Schedule 4 (continued)
MIDLANDS TECHNICAL COLLEGE
SCHEDULE OF EXPENSES BY USE
Fiscal Years 2006 - 2015 (Continued)
For the Year Ended June 30, *2010 *2009 *2008 *2007 *2006 Expenses: Salaries $ 40,944,520 $ 41,659,673 $ 41,493,810 $ 38,946,598 $ 37,437,269 Benefits 10,400,461 10,716,789 10,668,545 9,761,904 8,762,729 Scholarships 14,856,351 10,806,293 9,146,725 7,664,137 7,567,105 Utilities 1,862,323 1,704,171 1,557,301 1,507,205 1,478,465 Supplies and Other Services 19,670,525 18,402,647 20,141,414 19,936,260 19,453,620 Depreciation and amortization 3,480,213 2,946,028 2,825,469 2,942,705 3,195,626 Total Operating Expenses 91,214,393 86,235,601 85,833,264 80,758,809 77,894,814 Interest on capital asset-related debt 580,474 694,459 819,216 358,435 316,707 Loss on disposal of capital assets – – – 9,021 11,098 Total Expenses $ 91,794,867 $ 86,930,060 $ 86,652,480 $ 81,126,265 $ 78,222,619 For the Year Ended June 30, (percentage of total) *2010 *2009 *2008 *2007 *2006 Expenses: Salaries 44.6% 47.9% 47.9% 48.0% 47.8% Benefits 11.3% 12.3% 12.3% 12.0% 11.2% Scholarships 16.2% 12.4% 10.6% 9.4% 9.7% Utilities 2.0% 2.0% 1.8% 1.9% 1.9% Supplies and Other Services 21.4% 21.2% 23.2% 24.6% 24.9% Depreciation and amortization 3.8% 3.4% 3.3% 3.6% 4.1% Total Operating Expenses 99.3% 99.2% 99.1% 99.5% 99.6% Interest on capital asset-related debt 0.7% 0.8% 0.9% 0.5% 0.4% Loss on disposal of capital assets 0.0% 0.0% 0.0% 0.0% 0.0% Total Expenses 100.0% 100.0% 100.0% 100.0% 100.0% Source: Midlands Technical College Audited Financial Statements *Note: The June 30, 2006 ‐ 2014 figures have not been adjusted for the implementation of GASB 68 as this information is not available.
- 68 -
Revenue Capacity
MIDLANDS TECHNICAL COLLEGE
- 69 -

This page intentionally left blank
- 70 -
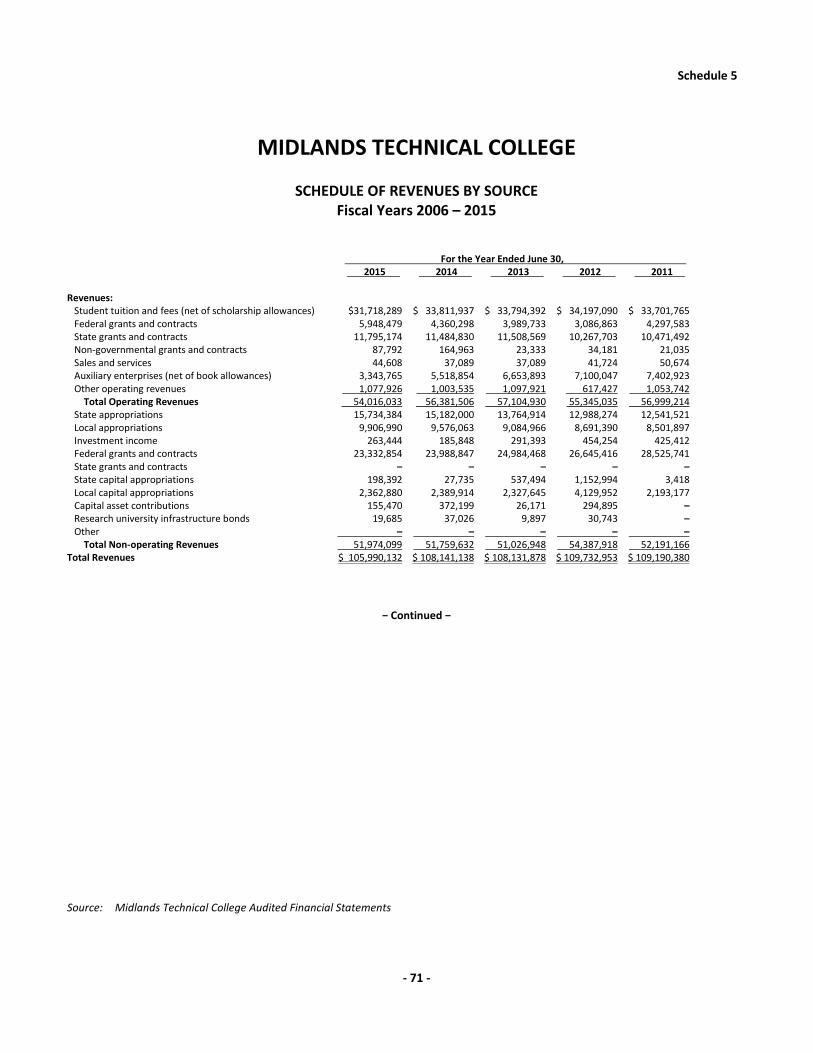
Schedule 5
MIDLANDS TECHNICAL COLLEGE
SCHEDULE OF REVENUES BY SOURCE Fiscal Years 2006 – 2015
For the Year Ended June 30, 2015 2014 2013 2012 2011 Revenues: Student tuition and fees (net of scholarship allowances) $31,718,289 $ 33,811,937 $ 33,794,392 $ 34,197,090 $ 33,701,765 Federal grants and contracts 5,948,479 4,360,298 3,989,733 3,086,863 4,297,583 State grants and contracts 11,795,174 11,484,830 11,508,569 10,267,703 10,471,492 Non-governmental grants and contracts 87,792 164,963 23,333 34,181 21,035 Sales and services 44,608 37,089 37,089 41,724 50,674 Auxiliary enterprises (net of book allowances) 3,343,765 5,518,854 6,653,893 7,100,047 7,402,923 Other operating revenues 1,077,926 1,003,535 1,097,921 617,427 1,053,742 Total Operating Revenues 54,016,033 56,381,506 57,104,930 55,345,035 56,999,214 State appropriations 15,734,384 15,182,000 13,764,914 12,988,274 12,541,521 Local appropriations 9,906,990 9,576,063 9,084,966 8,691,390 8,501,897 Investment income 263,444 185,848 291,393 454,254 425,412 Federal grants and contracts 23,332,854 23,988,847 24,984,468 26,645,416 28,525,741 State grants and contracts – – – – – State capital appropriations 198,392 27,735 537,494 1,152,994 3,418 Local capital appropriations 2,362,880 2,389,914 2,327,645 4,129,952 2,193,177 Capital asset contributions 155,470 372,199 26,171 294,895 – Research university infrastructure bonds 19,685 37,026 9,897 30,743 – Other – – – – – Total Non-operating Revenues 51,974,099 51,759,632 51,026,948 54,387,918 52,191,166 Total Revenues $ 105,990,132 $ 108,141,138 $ 108,131,878 $ 109,732,953 $ 109,190,380
− Continued −
Source: Midlands Technical College Audited Financial Statements
- 71 -
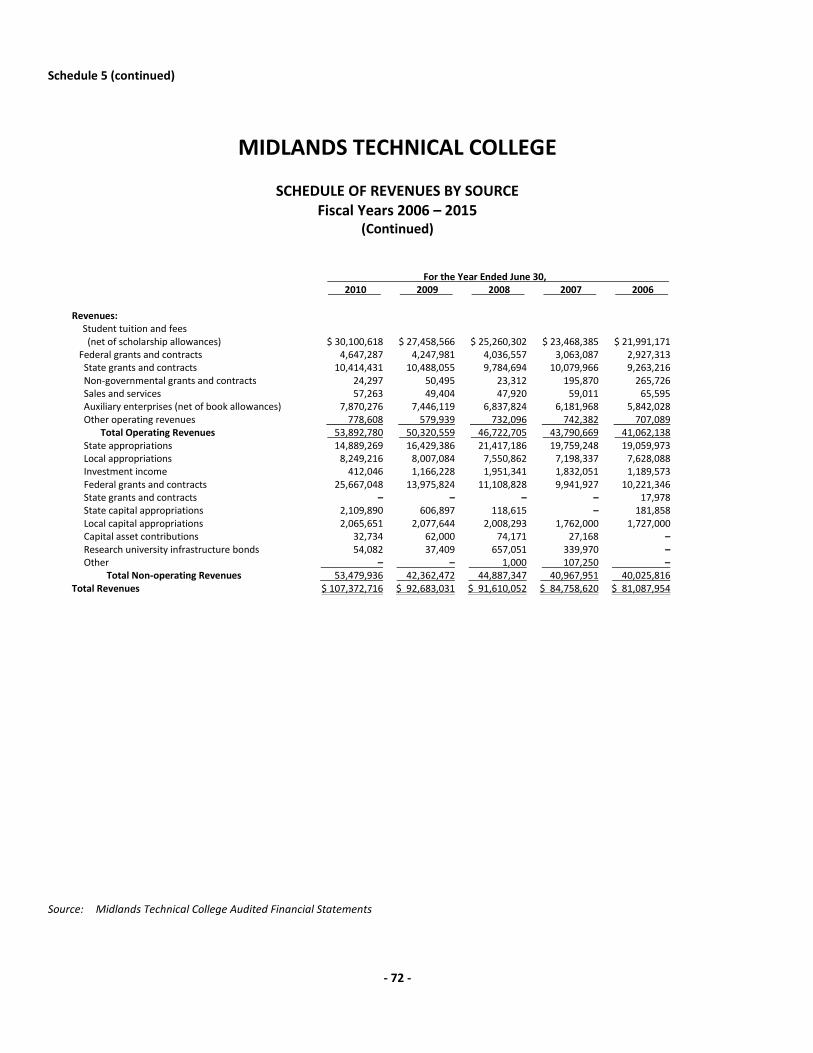
Schedule 5 (continued)
MIDLANDS TECHNICAL COLLEGE
SCHEDULE OF REVENUES BY SOURCE Fiscal Years 2006 – 2015
(Continued)
For the Year Ended June 30, 2010 2009 2008 2007 2006
Revenues:
Student tuition and fees (net of scholarship allowances) $ 30,100,618 $ 27,458,566 $ 25,260,302 $ 23,468,385 $ 21,991,171
Federal grants and contracts 4,647,287 4,247,981 4,036,557 3,063,087 2,927,313 State grants and contracts 10,414,431 10,488,055 9,784,694 10,079,966 9,263,216 Non-governmental grants and contracts 24,297 50,495 23,312 195,870 265,726 Sales and services 57,263 49,404 47,920 59,011 65,595 Auxiliary enterprises (net of book allowances) 7,870,276 7,446,119 6,837,824 6,181,968 5,842,028 Other operating revenues 778,608 579,939 732,096 742,382 707,089
Total Operating Revenues 53,892,780 50,320,559 46,722,705 43,790,669 41,062,138 State appropriations 14,889,269 16,429,386 21,417,186 19,759,248 19,059,973 Local appropriations 8,249,216 8,007,084 7,550,862 7,198,337 7,628,088 Investment income 412,046 1,166,228 1,951,341 1,832,051 1,189,573 Federal grants and contracts 25,667,048 13,975,824 11,108,828 9,941,927 10,221,346 State grants and contracts – – – – 17,978 State capital appropriations 2,109,890 606,897 118,615 – 181,858 Local capital appropriations 2,065,651 2,077,644 2,008,293 1,762,000 1,727,000 Capital asset contributions 32,734 62,000 74,171 27,168 – Research university infrastructure bonds 54,082 37,409 657,051 339,970 – Other – – 1,000 107,250 –
Total Non-operating Revenues 53,479,936 42,362,472 44,887,347 40,967,951 40,025,816 Total Revenues $ 107,372,716 $ 92,683,031 $ 91,610,052 $ 84,758,620 $ 81,087,954
Source: Midlands Technical College Audited Financial Statements
- 72 -
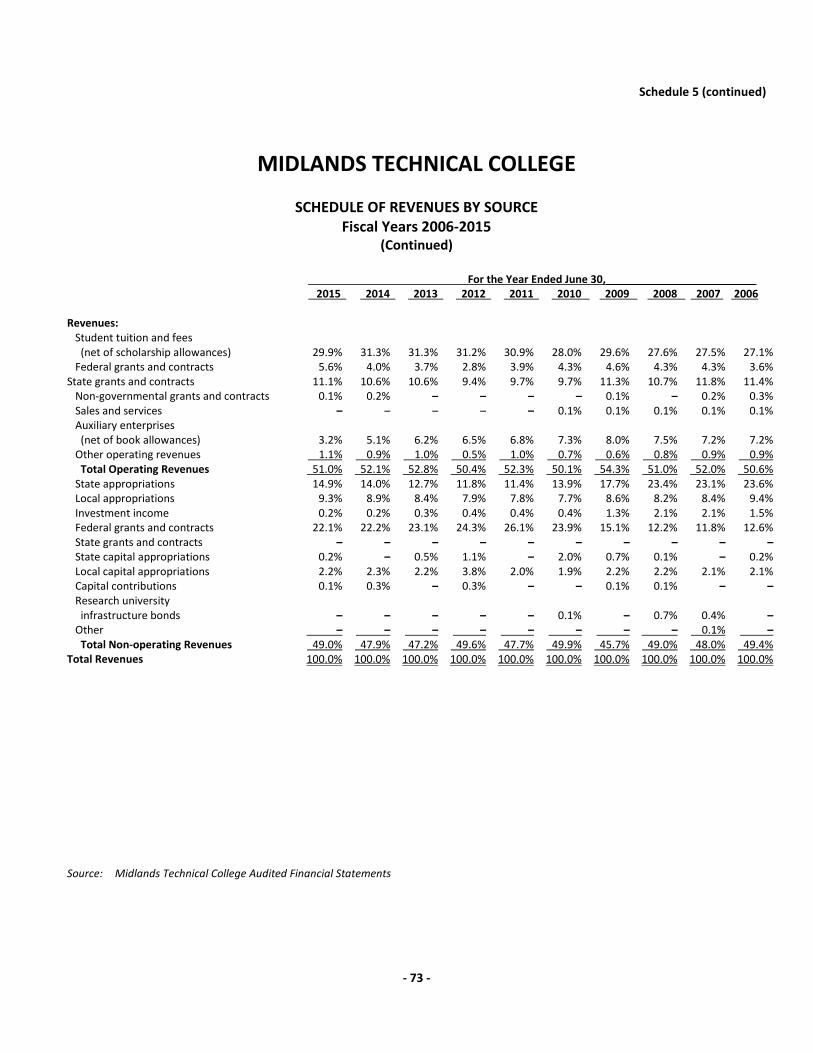
Schedule 5 (continued)
MIDLANDS TECHNICAL COLLEGE
SCHEDULE OF REVENUES BY SOURCE Fiscal Years 2006-2015
(Continued)
For the Year Ended June 30, 2015 2014 2013 2012 2011 2010 2009 2008 2007 2006 Revenues: Student tuition and fees (net of scholarship allowances) 29.9% 31.3% 31.3% 31.2% 30.9% 28.0% 29.6% 27.6% 27.5% 27.1% Federal grants and contracts 5.6% 4.0% 3.7% 2.8% 3.9% 4.3% 4.6% 4.3% 4.3% 3.6% State grants and contracts 11.1% 10.6% 10.6% 9.4% 9.7% 9.7% 11.3% 10.7% 11.8% 11.4% Non-governmental grants and contracts 0.1% 0.2% – – – – 0.1% – 0.2% 0.3% Sales and services – – – – – 0.1% 0.1% 0.1% 0.1% 0.1% Auxiliary enterprises (net of book allowances) 3.2% 5.1% 6.2% 6.5% 6.8% 7.3% 8.0% 7.5% 7.2% 7.2% Other operating revenues 1.1% 0.9% 1.0% 0.5% 1.0% 0.7% 0.6% 0.8% 0.9% 0.9% Total Operating Revenues 51.0% 52.1% 52.8% 50.4% 52.3% 50.1% 54.3% 51.0% 52.0% 50.6% State appropriations 14.9% 14.0% 12.7% 11.8% 11.4% 13.9% 17.7% 23.4% 23.1% 23.6% Local appropriations 9.3% 8.9% 8.4% 7.9% 7.8% 7.7% 8.6% 8.2% 8.4% 9.4% Investment income 0.2% 0.2% 0.3% 0.4% 0.4% 0.4% 1.3% 2.1% 2.1% 1.5% Federal grants and contracts 22.1% 22.2% 23.1% 24.3% 26.1% 23.9% 15.1% 12.2% 11.8% 12.6% State grants and contracts – – – – – – – – – – State capital appropriations 0.2% – 0.5% 1.1% – 2.0% 0.7% 0.1% – 0.2% Local capital appropriations 2.2% 2.3% 2.2% 3.8% 2.0% 1.9% 2.2% 2.2% 2.1% 2.1% Capital contributions 0.1% 0.3% – 0.3% – – 0.1% 0.1% – – Research university infrastructure bonds – – – – – 0.1% – 0.7% 0.4% – Other – – – – – – – – 0.1% – Total Non-operating Revenues 49.0% 47.9% 47.2% 49.6% 47.7% 49.9% 45.7% 49.0% 48.0% 49.4% Total Revenues 100.0% 100.0% 100.0% 100.0% 100.0% 100.0% 100.0% 100.0% 100.0% 100.0%
Source: Midlands Technical College Audited Financial Statements
- 73 -
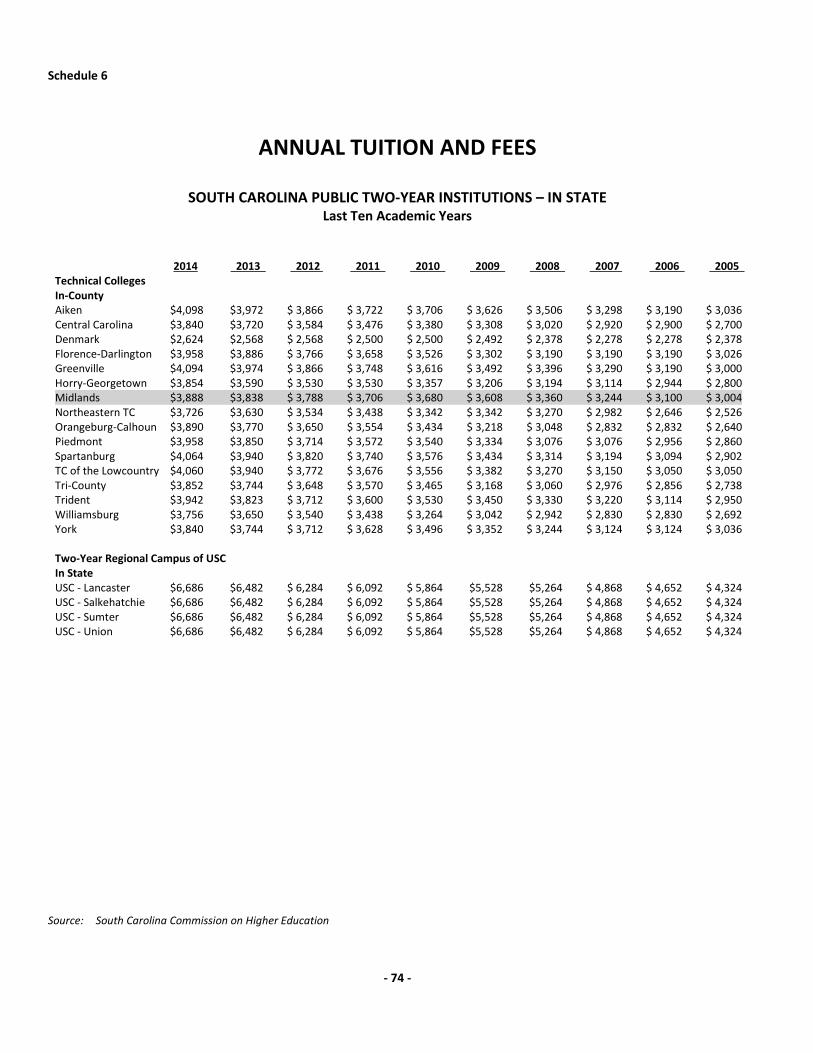
Schedule 6
ANNUAL TUITION AND FEES
SOUTH CAROLINA PUBLIC TWO-YEAR INSTITUTIONS – IN STATE Last Ten Academic Years
2014 2013 2012 2011 2010 2009 2008 2007 2006 2005 Technical Colleges In-County Aiken $4,098 $3,972 $ 3,866 $ 3,722 $ 3,706 $ 3,626 $ 3,506 $ 3,298 $ 3,190 $ 3,036 Central Carolina $3,840 $3,720 $ 3,584 $ 3,476 $ 3,380 $ 3,308 $ 3,020 $ 2,920 $ 2,900 $ 2,700 Denmark $2,624 $2,568 $ 2,568 $ 2,500 $ 2,500 $ 2,492 $ 2,378 $ 2,278 $ 2,278 $ 2,378 Florence-Darlington $3,958 $3,886 $ 3,766 $ 3,658 $ 3,526 $ 3,302 $ 3,190 $ 3,190 $ 3,190 $ 3,026 Greenville $4,094 $3,974 $ 3,866 $ 3,748 $ 3,616 $ 3,492 $ 3,396 $ 3,290 $ 3,190 $ 3,000 Horry-Georgetown $3,854 $3,590 $ 3,530 $ 3,530 $ 3,357 $ 3,206 $ 3,194 $ 3,114 $ 2,944 $ 2,800 Midlands $3,888 $3,838 $ 3,788 $ 3,706 $ 3,680 $ 3,608 $ 3,360 $ 3,244 $ 3,100 $ 3,004 Northeastern TC $3,726 $3,630 $ 3,534 $ 3,438 $ 3,342 $ 3,342 $ 3,270 $ 2,982 $ 2,646 $ 2,526 Orangeburg-Calhoun $3,890 $3,770 $ 3,650 $ 3,554 $ 3,434 $ 3,218 $ 3,048 $ 2,832 $ 2,832 $ 2,640 Piedmont $3,958 $3,850 $ 3,714 $ 3,572 $ 3,540 $ 3,334 $ 3,076 $ 3,076 $ 2,956 $ 2,860 Spartanburg $4,064 $3,940 $ 3,820 $ 3,740 $ 3,576 $ 3,434 $ 3,314 $ 3,194 $ 3,094 $ 2,902 TC of the Lowcountry $4,060 $3,940 $ 3,772 $ 3,676 $ 3,556 $ 3,382 $ 3,270 $ 3,150 $ 3,050 $ 3,050 Tri-County $3,852 $3,744 $ 3,648 $ 3,570 $ 3,465 $ 3,168 $ 3,060 $ 2,976 $ 2,856 $ 2,738 Trident $3,942 $3,823 $ 3,712 $ 3,600 $ 3,530 $ 3,450 $ 3,330 $ 3,220 $ 3,114 $ 2,950 Williamsburg $3,756 $3,650 $ 3,540 $ 3,438 $ 3,264 $ 3,042 $ 2,942 $ 2,830 $ 2,830 $ 2,692 York $3,840 $3,744 $ 3,712 $ 3,628 $ 3,496 $ 3,352 $ 3,244 $ 3,124 $ 3,124 $ 3,036 Two-Year Regional Campus of USC In State USC - Lancaster $6,686 $6,482 $ 6,284 $ 6,092 $ 5,864 $5,528 $5,264 $ 4,868 $ 4,652 $ 4,324 USC - Salkehatchie $6,686 $6,482 $ 6,284 $ 6,092 $ 5,864 $5,528 $5,264 $ 4,868 $ 4,652 $ 4,324 USC - Sumter $6,686 $6,482 $ 6,284 $ 6,092 $ 5,864 $5,528 $5,264 $ 4,868 $ 4,652 $ 4,324 USC - Union $6,686 $6,482 $ 6,284 $ 6,092 $ 5,864 $5,528 $5,264 $ 4,868 $ 4,652 $ 4,324
Source: South Carolina Commission on Higher Education
- 74 -
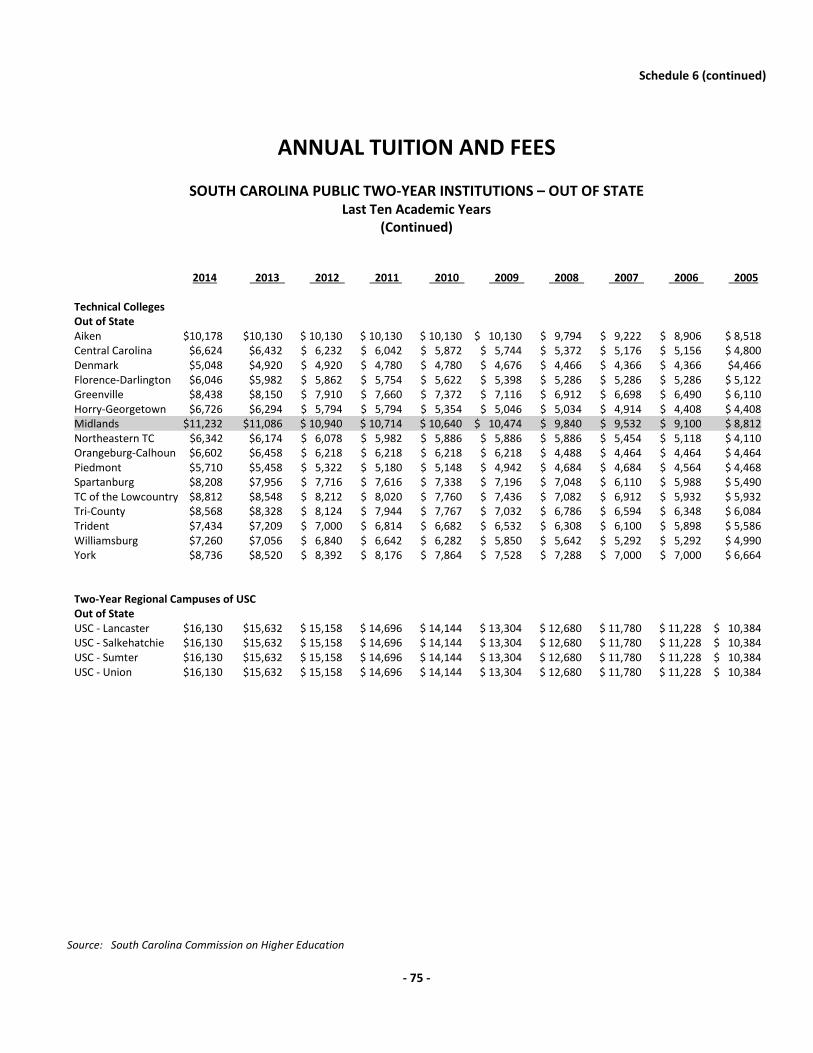
Schedule 6 (continued)
ANNUAL TUITION AND FEES
SOUTH CAROLINA PUBLIC TWO-YEAR INSTITUTIONS – OUT OF STATE Last Ten Academic Years
(Continued)
2014 2013 2012 2011 2010 2009 2008 2007 2006 2005 Technical Colleges Out of State Aiken $10,178 $10,130 $ 10,130 $ 10,130 $ 10,130 $ 10,130 $ 9,794 $ 9,222 $ 8,906 $ 8,518 Central Carolina $6,624 $6,432 $ 6,232 $ 6,042 $ 5,872 $ 5,744 $ 5,372 $ 5,176 $ 5,156 $ 4,800 Denmark $5,048 $4,920 $ 4,920 $ 4,780 $ 4,780 $ 4,676 $ 4,466 $ 4,366 $ 4,366 $4,466 Florence-Darlington $6,046 $5,982 $ 5,862 $ 5,754 $ 5,622 $ 5,398 $ 5,286 $ 5,286 $ 5,286 $ 5,122 Greenville $8,438 $8,150 $ 7,910 $ 7,660 $ 7,372 $ 7,116 $ 6,912 $ 6,698 $ 6,490 $ 6,110 Horry-Georgetown $6,726 $6,294 $ 5,794 $ 5,794 $ 5,354 $ 5,046 $ 5,034 $ 4,914 $ 4,408 $ 4,408 Midlands $11,232 $11,086 $ 10,940 $ 10,714 $ 10,640 $ 10,474 $ 9,840 $ 9,532 $ 9,100 $ 8,812 Northeastern TC $6,342 $6,174 $ 6,078 $ 5,982 $ 5,886 $ 5,886 $ 5,886 $ 5,454 $ 5,118 $ 4,110 Orangeburg-Calhoun $6,602 $6,458 $ 6,218 $ 6,218 $ 6,218 $ 6,218 $ 4,488 $ 4,464 $ 4,464 $ 4,464 Piedmont $5,710 $5,458 $ 5,322 $ 5,180 $ 5,148 $ 4,942 $ 4,684 $ 4,684 $ 4,564 $ 4,468 Spartanburg $8,208 $7,956 $ 7,716 $ 7,616 $ 7,338 $ 7,196 $ 7,048 $ 6,110 $ 5,988 $ 5,490 TC of the Lowcountry $8,812 $8,548 $ 8,212 $ 8,020 $ 7,760 $ 7,436 $ 7,082 $ 6,912 $ 5,932 $ 5,932 Tri-County $8,568 $8,328 $ 8,124 $ 7,944 $ 7,767 $ 7,032 $ 6,786 $ 6,594 $ 6,348 $ 6,084 Trident $7,434 $7,209 $ 7,000 $ 6,814 $ 6,682 $ 6,532 $ 6,308 $ 6,100 $ 5,898 $ 5,586 Williamsburg $7,260 $7,056 $ 6,840 $ 6,642 $ 6,282 $ 5,850 $ 5,642 $ 5,292 $ 5,292 $ 4,990 York $8,736 $8,520 $ 8,392 $ 8,176 $ 7,864 $ 7,528 $ 7,288 $ 7,000 $ 7,000 $ 6,664
Two-Year Regional Campuses of USC Out of State USC - Lancaster $16,130 $15,632 $ 15,158 $ 14,696 $ 14,144 $ 13,304 $ 12,680 $ 11,780 $ 11,228 $ 10,384 USC - Salkehatchie $16,130 $15,632 $ 15,158 $ 14,696 $ 14,144 $ 13,304 $ 12,680 $ 11,780 $ 11,228 $ 10,384 USC - Sumter $16,130 $15,632 $ 15,158 $ 14,696 $ 14,144 $ 13,304 $ 12,680 $ 11,780 $ 11,228 $ 10,384 USC - Union $16,130 $15,632 $ 15,158 $ 14,696 $ 14,144 $ 13,304 $ 12,680 $ 11,780 $ 11,228 $ 10,384
Source: South Carolina Commission on Higher Education
- 75 -
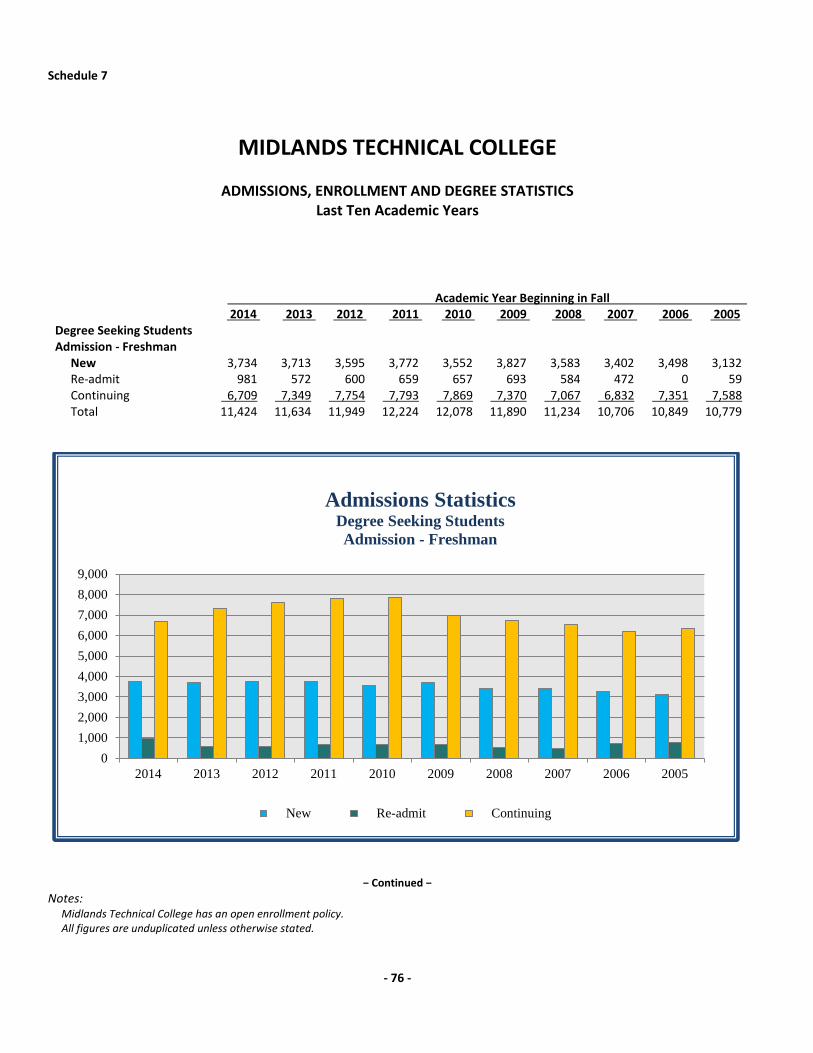
Schedule 7
MIDLANDS TECHNICAL COLLEGE
ADMISSIONS, ENROLLMENT AND DEGREE STATISTICS Last Ten Academic Years
Academic Year Beginning in Fall 2014 2013 2012 2011 2010 2009 2008 2007 2006 2005 Degree Seeking Students Admission - Freshman New 3,734 3,713 3,595 3,772 3,552 3,827 3,583 3,402 3,498 3,132 Re-admit 981 572 600 659 657 693 584 472 0 59 Continuing 6,709 7,349 7,754 7,793 7,869 7,370 7,067 6,832 7,351 7,588 Total 11,424 11,634 11,949 12,224 12,078 11,890 11,234 10,706 10,849 10,779
− Continued − Notes: Midlands Technical College has an open enrollment policy. All figures are unduplicated unless otherwise stated.
01,0002,0003,0004,0005,0006,0007,0008,0009,000
2014 2013 2012 2011 2010 2009 2008 2007 2006 2005
New Re-admit Continuing
Admissions Statistics Degree Seeking Students Admission - Freshman
- 76 -
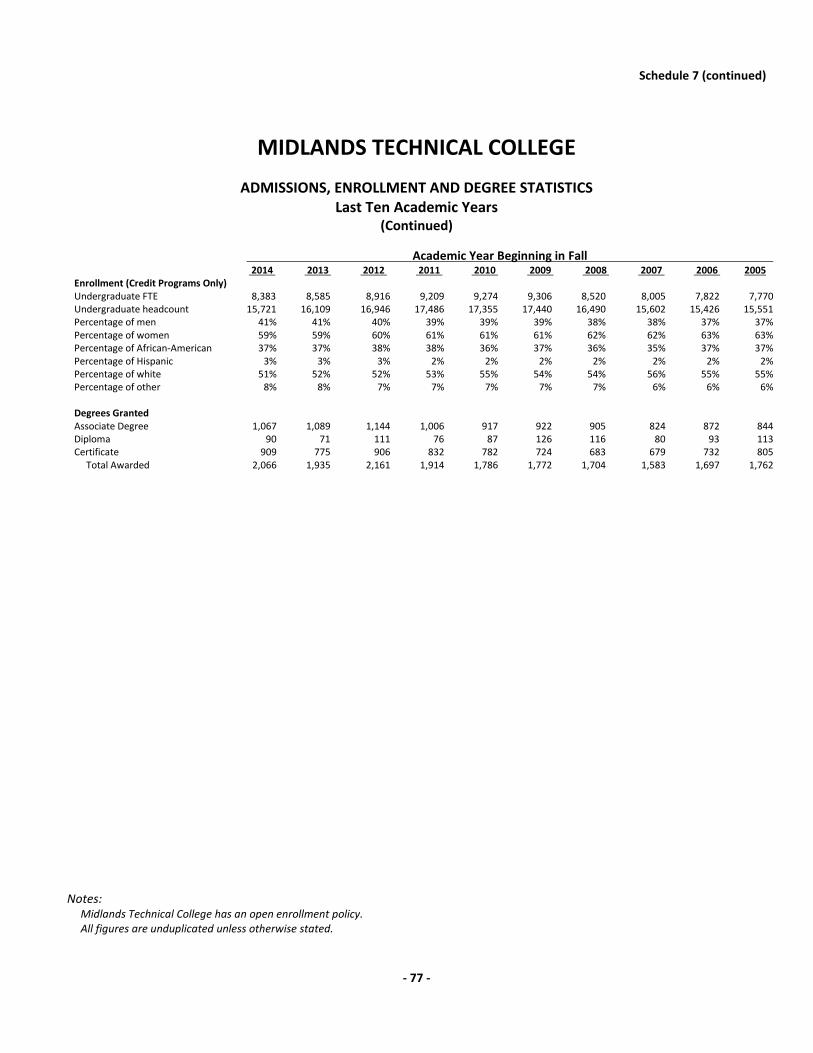
Schedule 7 (continued)
MIDLANDS TECHNICAL COLLEGE
ADMISSIONS, ENROLLMENT AND DEGREE STATISTICS Last Ten Academic Years
(Continued)
Academic Year Beginning in Fall 2014 2013 2012 2011 2010 2009 2008 2007 2006 2005 Enrollment (Credit Programs Only) Undergraduate FTE 8,383 8,585 8,916 9,209 9,274 9,306 8,520 8,005 7,822 7,770 Undergraduate headcount 15,721 16,109 16,946 17,486 17,355 17,440 16,490 15,602 15,426 15,551 Percentage of men 41% 41% 40% 39% 39% 39% 38% 38% 37% 37% Percentage of women 59% 59% 60% 61% 61% 61% 62% 62% 63% 63% Percentage of African-American 37% 37% 38% 38% 36% 37% 36% 35% 37% 37% Percentage of Hispanic 3% 3% 3% 2% 2% 2% 2% 2% 2% 2% Percentage of white 51% 52% 52% 53% 55% 54% 54% 56% 55% 55% Percentage of other 8% 8% 7% 7% 7% 7% 7% 6% 6% 6% Degrees Granted Associate Degree 1,067 1,089 1,144 1,006 917 922 905 824 872 844 Diploma 90 71 111 76 87 126 116 80 93 113 Certificate 909 775 906 832 782 724 683 679 732 805 Total Awarded 2,066 1,935 2,161 1,914 1,786 1,772 1,704 1,583 1,697 1,762
Notes: Midlands Technical College has an open enrollment policy. All figures are unduplicated unless otherwise stated.
- 77 -
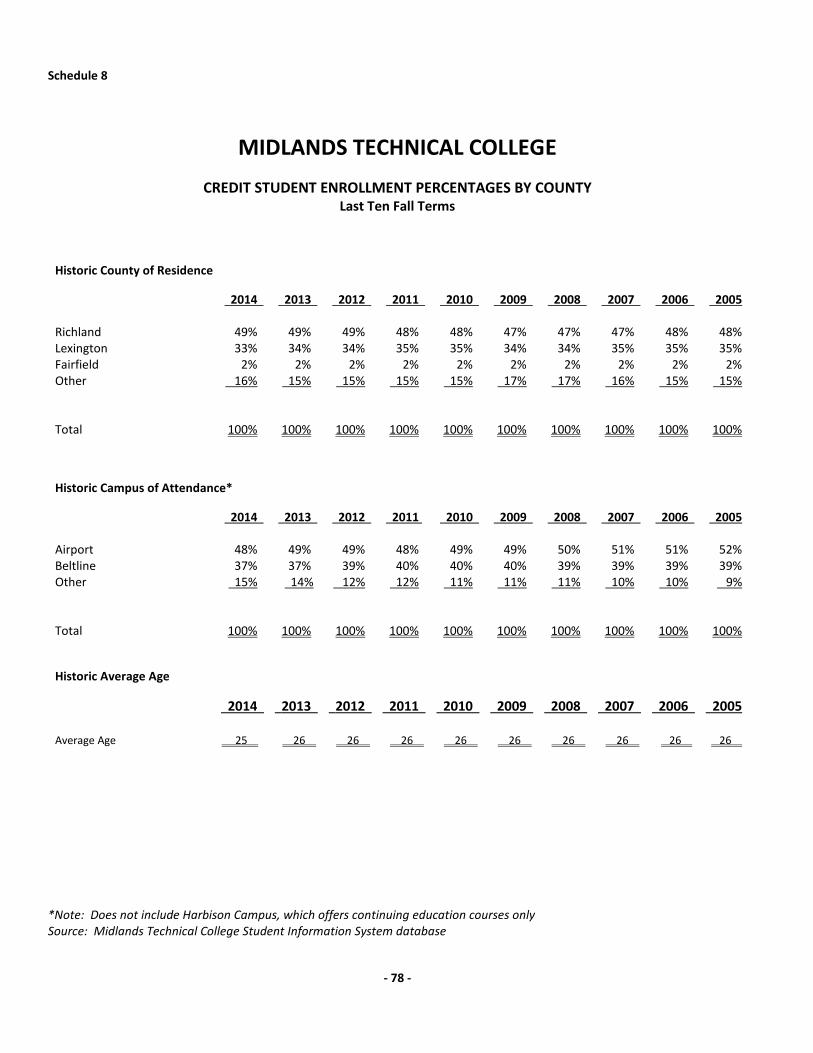
Schedule 8
MIDLANDS TECHNICAL COLLEGE
CREDIT STUDENT ENROLLMENT PERCENTAGES BY COUNTY Last Ten Fall Terms
Historic County of Residence 2014 2013 2012 2011 2010 2009 2008 2007 2006 2005 Richland 49% 49% 49% 48% 48% 47% 47% 47% 48% 48% Lexington 33% 34% 34% 35% 35% 34% 34% 35% 35% 35% Fairfield 2% 2% 2% 2% 2% 2% 2% 2% 2% 2% Other 16% 15% 15% 15% 15% 17% 17% 16% 15% 15% Total 100% 100% 100% 100% 100% 100% 100% 100% 100% 100% Historic Campus of Attendance* 2014 2013 2012 2011 2010 2009 2008 2007 2006 2005 Airport 48% 49% 49% 48% 49% 49% 50% 51% 51% 52% Beltline 37% 37% 39% 40% 40% 40% 39% 39% 39% 39% Other 15% 14% 12% 12% 11% 11% 11% 10% 10% 9% Total 100% 100% 100% 100% 100% 100% 100% 100% 100% 100% Historic Average Age 2014 2013 2012 2011 2010 2009 2008 2007 2006 2005 Average Age 25 26 26 26 26 26 26 26 26 26
*Note: Does not include Harbison Campus, which offers continuing education courses only Source: Midlands Technical College Student Information System database
- 78 -
Debt Capacity
MIDLANDS TECHNICAL COLLEGE
- 79 -

This page intentionally left blank
- 80 -
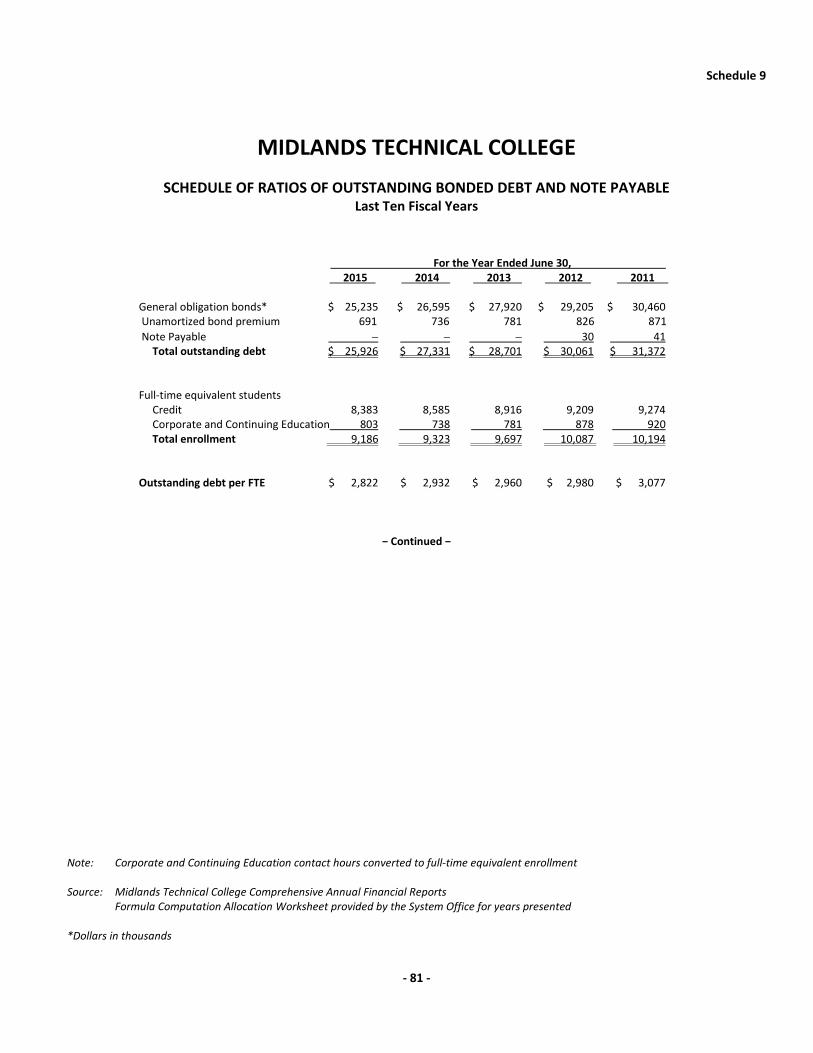
Schedule 9
MIDLANDS TECHNICAL COLLEGE
SCHEDULE OF RATIOS OF OUTSTANDING BONDED DEBT AND NOTE PAYABLE Last Ten Fiscal Years
For the Year Ended June 30, 2015 2014 2013 2012 2011
General obligation bonds* $ 25,235 $ 26,595 $ 27,920 $ 29,205 $ 30,460 Unamortized bond premium 691 736 781 826 871 Note Payable − − − 30 41 Total outstanding debt $ 25,926 $ 27,331 $ 28,701 $ 30,061 $ 31,372 Full-time equivalent students Credit 8,383 8,585 8,916 9,209 9,274 Corporate and Continuing Education 803 738 781 878 920 Total enrollment 9,186 9,323 9,697 10,087 10,194 Outstanding debt per FTE $ 2,822 $ 2,932 $ 2,960 $ 2,980 $ 3,077
− Continued −
Note: Corporate and Continuing Education contact hours converted to full‐time equivalent enrollment Source: Midlands Technical College Comprehensive Annual Financial Reports Formula Computation Allocation Worksheet provided by the System Office for years presented *Dollars in thousands
- 81 -
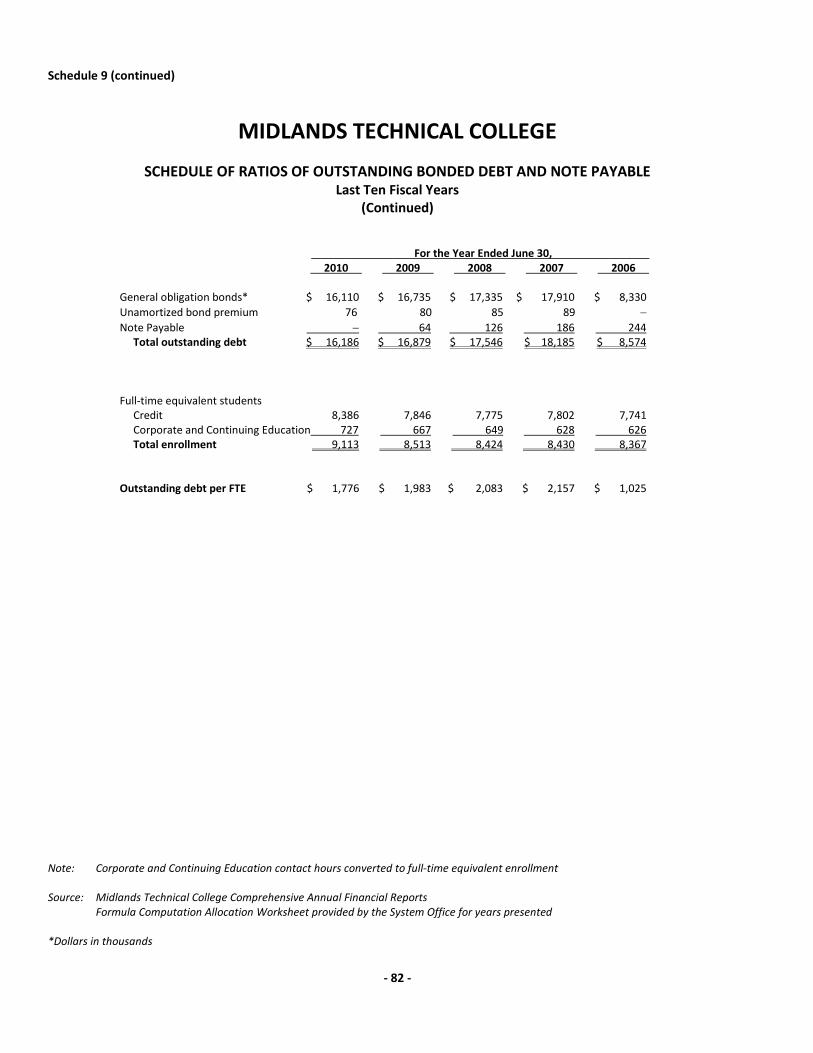
Schedule 9 (continued)
MIDLANDS TECHNICAL COLLEGE
SCHEDULE OF RATIOS OF OUTSTANDING BONDED DEBT AND NOTE PAYABLE Last Ten Fiscal Years
(Continued)
For the Year Ended June 30, 2010 2009 2008 2007 2006
General obligation bonds* $ 16,110 $ 16,735 $ 17,335 $ 17,910 $ 8,330 Unamortized bond premium 76 80 85 89 − Note Payable − 64 126 186 244 Total outstanding debt $ 16,186 $ 16,879 $ 17,546 $ 18,185 $ 8,574 Full-time equivalent students Credit 8,386 7,846 7,775 7,802 7,741 Corporate and Continuing Education 727 667 649 628 626 Total enrollment 9,113 8,513 8,424 8,430 8,367 Outstanding debt per FTE $ 1,776 $ 1,983 $ 2,083 $ 2,157 $ 1,025
Note: Corporate and Continuing Education contact hours converted to full‐time equivalent enrollment Source: Midlands Technical College Comprehensive Annual Financial Reports Formula Computation Allocation Worksheet provided by the System Office for years presented *Dollars in thousands
- 82 -
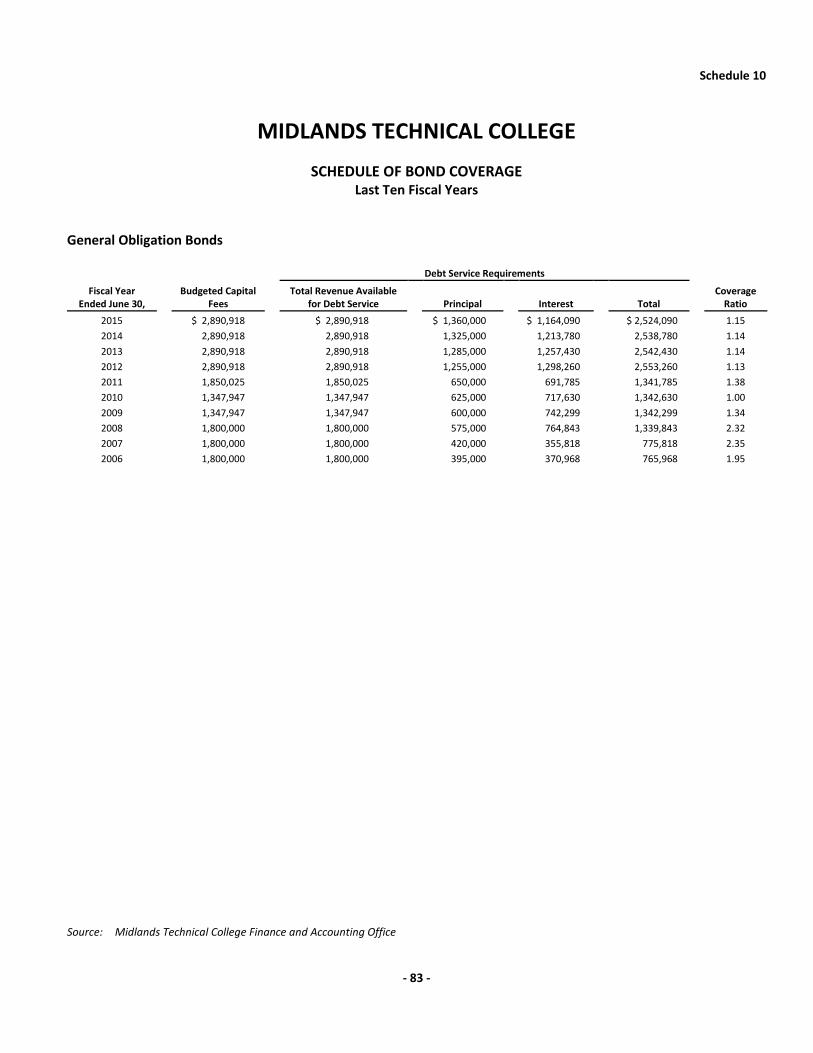
Schedule 10
MIDLANDS TECHNICAL COLLEGE
SCHEDULE OF BOND COVERAGE Last Ten Fiscal Years
General Obligation Bonds
Debt Service Requirements
Fiscal Year Ended June 30,
Budgeted Capital Fees
Total Revenue Available for Debt Service Principal Interest Total
Coverage Ratio
2015 $ 2,890,918 $ 2,890,918 $ 1,360,000 $ 1,164,090 $ 2,524,090 1.15 2014 2,890,918 2,890,918 1,325,000 1,213,780 2,538,780 1.14 2013 2,890,918 2,890,918 1,285,000 1,257,430 2,542,430 1.14 2012 2,890,918 2,890,918 1,255,000 1,298,260 2,553,260 1.13 2011 1,850,025 1,850,025 650,000 691,785 1,341,785 1.38 2010 1,347,947 1,347,947 625,000 717,630 1,342,630 1.00 2009 1,347,947 1,347,947 600,000 742,299 1,342,299 1.34 2008 1,800,000 1,800,000 575,000 764,843 1,339,843 2.32 2007 1,800,000 1,800,000 420,000 355,818 775,818 2.35 2006 1,800,000 1,800,000 395,000 370,968 765,968 1.95
Source: Midlands Technical College Finance and Accounting Office
- 83 -

This page intentionally left blank
- 84 -
Demographic and Economic Information
MIDLANDS TECHNICAL COLLEGE
- 85 -

This page intentionally left blank
- 86 -
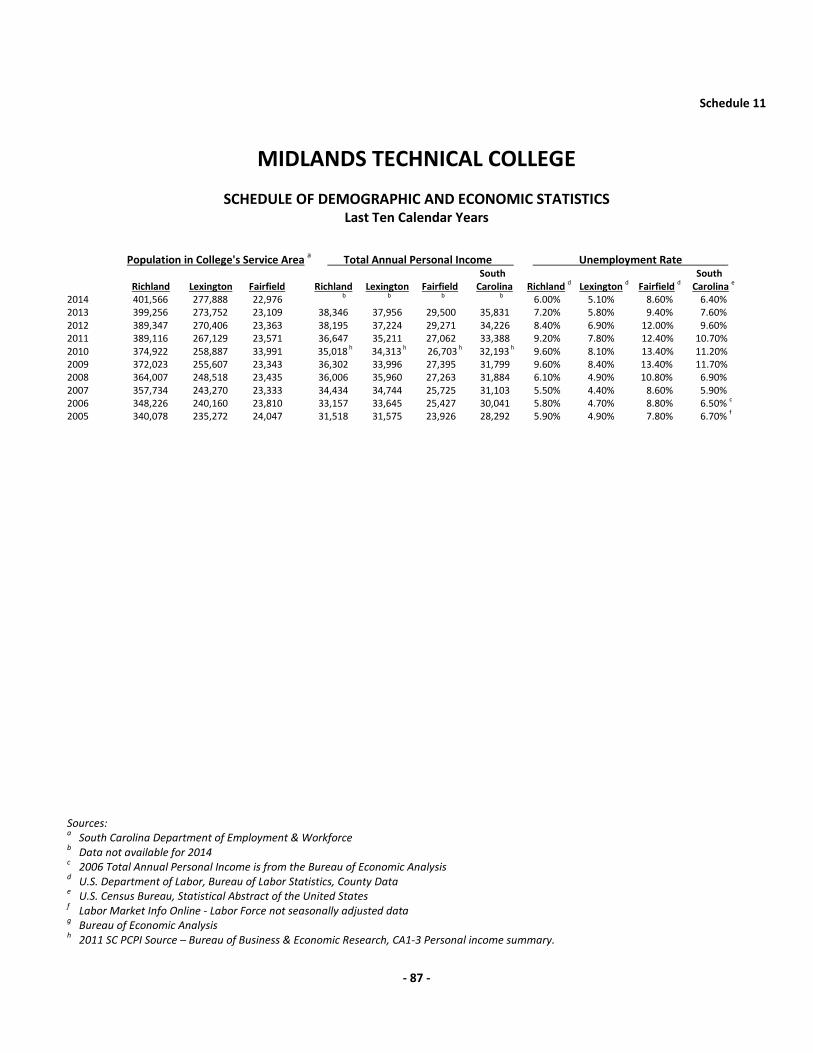
Schedule 11
MIDLANDS TECHNICAL COLLEGE
SCHEDULE OF DEMOGRAPHIC AND ECONOMIC STATISTICS Last Ten Calendar Years
Population in College's Service Area a Total Annual Personal Income Unemployment Rate South South Richland Lexington Fairfield Richland Lexington Fairfield Carolina Richland d Lexington d Fairfield d Carolina e 2014 401,566 277,888 22,976 b b b b 6.00% 5.10% 8.60% 6.40%
2013 399,256 273,752 23,109 38,346 37,956 29,500 35,831 7.20% 5.80% 9.40% 7.60% 2012 389,347 270,406 23,363 38,195 37,224 29,271 34,226 8.40% 6.90% 12.00% 9.60% 2011 389,116 267,129 23,571 36,647 35,211 27,062 33,388 9.20% 7.80% 12.40% 10.70% 2010 374,922 258,887 33,991 35,018 h 34,313 h 26,703 h 32,193 h 9.60% 8.10% 13.40% 11.20% 2009 372,023 255,607 23,343 36,302 33,996 27,395 31,799 9.60% 8.40% 13.40% 11.70% 2008 364,007 248,518 23,435 36,006 35,960 27,263 31,884 6.10% 4.90% 10.80% 6.90% 2007 357,734 243,270 23,333 34,434 34,744 25,725 31,103 5.50% 4.40% 8.60% 5.90% 2006 348,226 240,160 23,810 33,157 33,645 25,427 30,041 5.80% 4.70% 8.80% 6.50% c
2005 340,078 235,272 24,047 31,518 31,575 23,926 28,292 5.90% 4.90% 7.80% 6.70% f
Sources: a South Carolina Department of Employment & Workforce b Data not available for 2014 c 2006 Total Annual Personal Income is from the Bureau of Economic Analysis d U.S. Department of Labor, Bureau of Labor Statistics, County Data e U.S. Census Bureau, Statistical Abstract of the United States f Labor Market Info Online ‐ Labor Force not seasonally adjusted data g Bureau of Economic Analysis h 2011 SC PCPI Source – Bureau of Business & Economic Research, CA1‐3 Personal income summary.
- 87 -
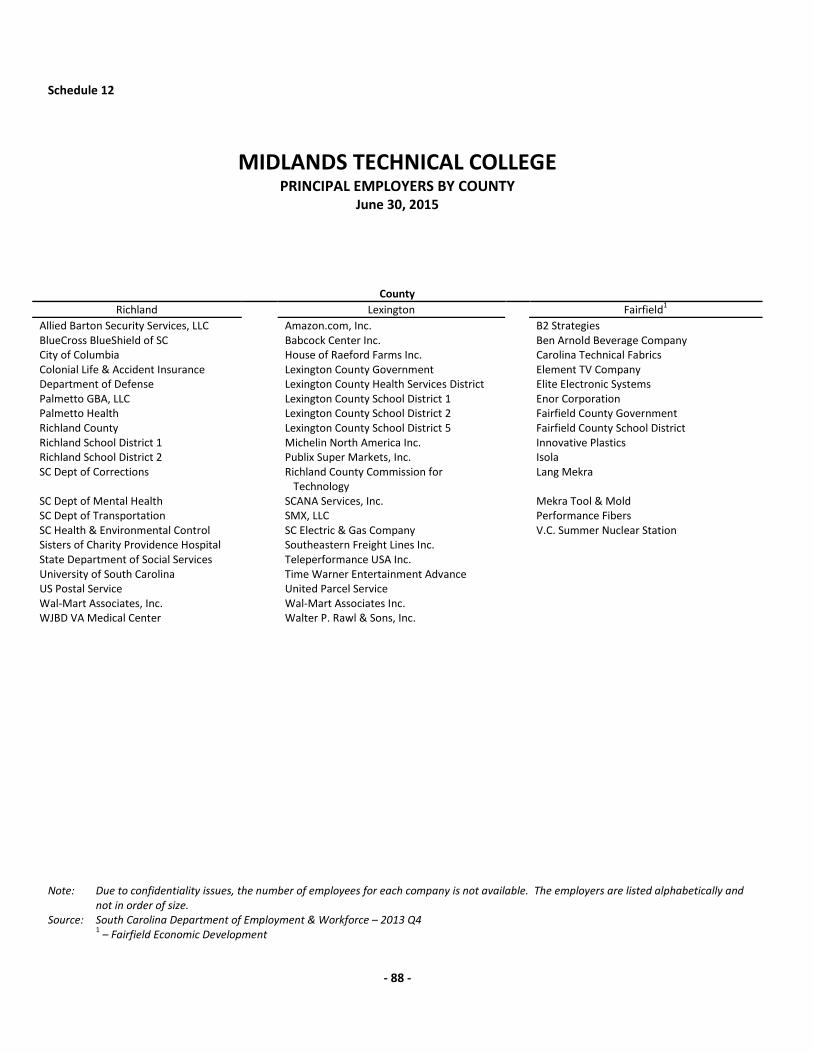
Schedule 12
MIDLANDS TECHNICAL COLLEGE PRINCIPAL EMPLOYERS BY COUNTY
June 30, 2015
County Richland Lexington Fairfield1
Allied Barton Security Services, LLC Amazon.com, Inc. B2 Strategies BlueCross BlueShield of SC Babcock Center Inc. Ben Arnold Beverage Company City of Columbia House of Raeford Farms Inc. Carolina Technical Fabrics Colonial Life & Accident Insurance Lexington County Government Element TV Company Department of Defense Lexington County Health Services District Elite Electronic Systems Palmetto GBA, LLC Lexington County School District 1 Enor Corporation Palmetto Health Lexington County School District 2 Fairfield County Government Richland County Lexington County School District 5 Fairfield County School District Richland School District 1 Michelin North America Inc. Innovative Plastics Richland School District 2 Publix Super Markets, Inc. Isola SC Dept of Corrections Richland County Commission for
Technology Lang Mekra
SC Dept of Mental Health SCANA Services, Inc. Mekra Tool & Mold SC Dept of Transportation SMX, LLC Performance Fibers SC Health & Environmental Control SC Electric & Gas Company V.C. Summer Nuclear Station Sisters of Charity Providence Hospital Southeastern Freight Lines Inc. State Department of Social Services Teleperformance USA Inc. University of South Carolina Time Warner Entertainment Advance US Postal Service United Parcel Service Wal-Mart Associates, Inc. Wal-Mart Associates Inc. WJBD VA Medical Center Walter P. Rawl & Sons, Inc.
Note: Due to confidentiality issues, the number of employees for each company is not available. The employers are listed alphabetically and
not in order of size. Source: South Carolina Department of Employment & Workforce – 2013 Q4 1 – Fairfield Economic Development
- 88 -

Operating Information
MIDLANDS TECHNICAL COLLEGE
- 89 -

This page intentionally left blank
- 90 -
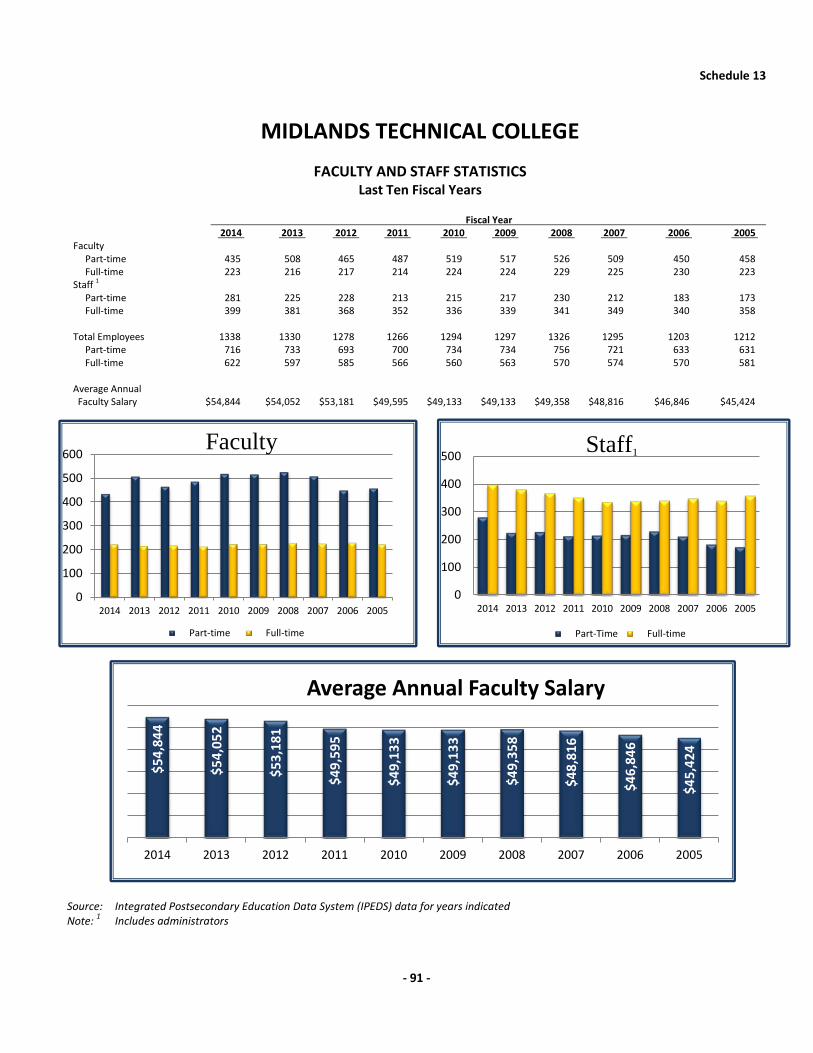
Schedule 13
MIDLANDS TECHNICAL COLLEGE
FACULTY AND STAFF STATISTICS Last Ten Fiscal Years
Fiscal Year 2014 2013 2012 2011 2010 2009 2008 2007 2006 2005 Faculty Part-time 435 508 465 487 519 517 526 509 450 458 Full-time 223 216 217 214 224 224 229 225 230 223 Staff 1 Part-time 281 225 228 213 215 217 230 212 183 173 Full-time 399 381 368 352 336 339 341 349 340 358 Total Employees 1338 1330 1278 1266 1294 1297 1326 1295 1203 1212 Part-time 716 733 693 700 734 734 756 721 633 631 Full-time 622 597 585 566 560 563 570 574 570 581 Average Annual Faculty Salary $54,844 $54,052 $53,181 $49,595 $49,133 $49,133 $49,358 $48,816 $46,846 $45,424
Source: Integrated Postsecondary Education Data System (IPEDS) data for years indicated Note: 1 Includes administrators
0
100
200
300
400
500
2014 2013 2012 2011 2010 2009 2008 2007 2006 2005
Part-Time Full-time
Staff1
0
100
200
300
400
500
600
2014 2013 2012 2011 2010 2009 2008 2007 2006 2005
Part-time Full-time
Faculty
$54
,844
$54
,052
$53
,181
$49
,595
$49
,133
$49
,133
$49
,358
$48
,816
$46
,846
$45
,424
2014 2013 2012 2011 2010 2009 2008 2007 2006 2005
Average Annual Faculty Salary
- 91 -
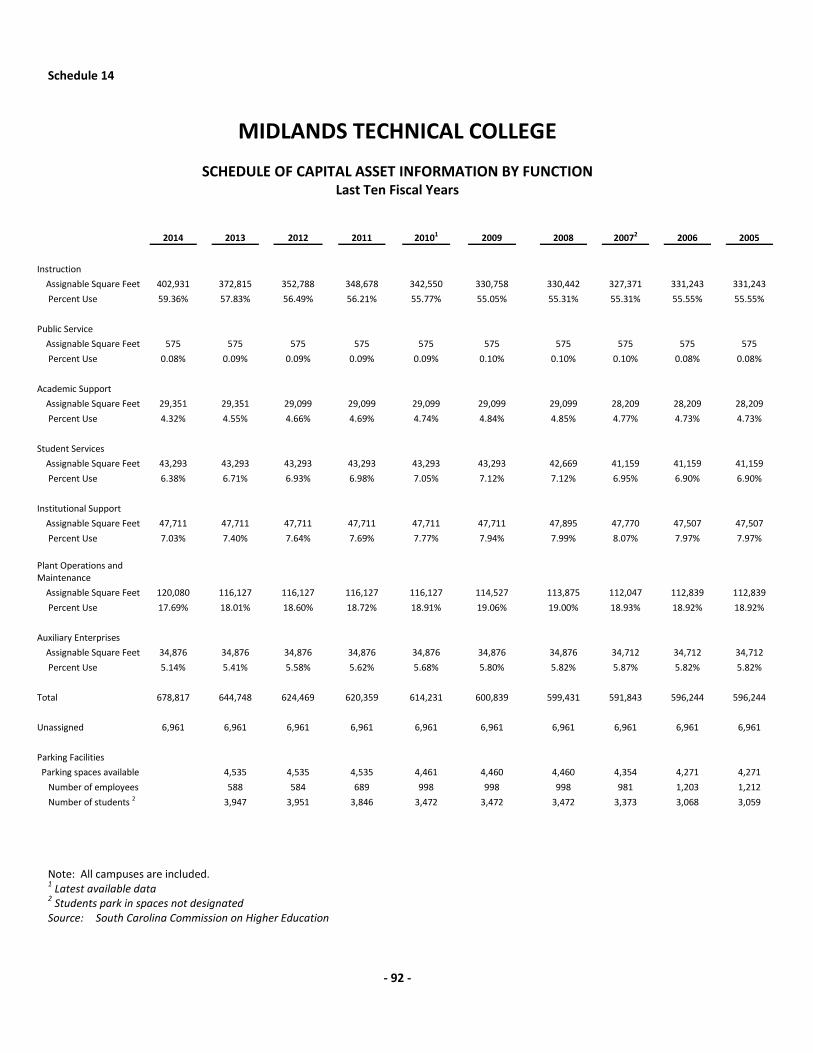
Schedule 14
MIDLANDS TECHNICAL COLLEGE
SCHEDULE OF CAPITAL ASSET INFORMATION BY FUNCTION Last Ten Fiscal Years
2014 2013 2012 2011 20101 2009 2008 20072 2006 2005
Instruction
Assignable Square Feet 402,931 372,815 352,788 348,678 342,550 330,758 330,442 327,371 331,243 331,243 Percent Use 59.36% 57.83% 56.49% 56.21% 55.77% 55.05% 55.31% 55.31% 55.55% 55.55%
Public Service Assignable Square Feet 575 575 575 575 575 575 575 575 575 575 Percent Use 0.08% 0.09% 0.09% 0.09% 0.09% 0.10% 0.10% 0.10% 0.08% 0.08%
Academic Support Assignable Square Feet 29,351 29,351 29,099 29,099 29,099 29,099 29,099 28,209 28,209 28,209 Percent Use 4.32% 4.55% 4.66% 4.69% 4.74% 4.84% 4.85% 4.77% 4.73% 4.73% Student Services Assignable Square Feet 43,293 43,293 43,293 43,293 43,293 43,293 42,669 41,159 41,159 41,159 Percent Use 6.38% 6.71% 6.93% 6.98% 7.05% 7.12% 7.12% 6.95% 6.90% 6.90% Institutional Support Assignable Square Feet 47,711 47,711 47,711 47,711 47,711 47,711 47,895 47,770 47,507 47,507 Percent Use 7.03% 7.40% 7.64% 7.69% 7.77% 7.94% 7.99% 8.07% 7.97% 7.97% Plant Operations and Maintenance
Assignable Square Feet 120,080 116,127 116,127 116,127 116,127 114,527 113,875 112,047 112,839 112,839 Percent Use 17.69% 18.01% 18.60% 18.72% 18.91% 19.06% 19.00% 18.93% 18.92% 18.92% Auxiliary Enterprises Assignable Square Feet 34,876 34,876 34,876 34,876 34,876 34,876 34,876 34,712 34,712 34,712 Percent Use 5.14% 5.41% 5.58% 5.62% 5.68% 5.80% 5.82% 5.87% 5.82% 5.82% Total 678,817 644,748 624,469 620,359 614,231 600,839 599,431 591,843 596,244 596,244 Unassigned 6,961 6,961 6,961 6,961 6,961 6,961 6,961 6,961 6,961 6,961 Parking Facilities Parking spaces available 4,535 4,535 4,535 4,461 4,460 4,460 4,354 4,271 4,271 Number of employees 588 584 689 998 998 998 981 1,203 1,212 Number of students 2 3,947 3,951 3,846 3,472 3,472 3,472 3,373 3,068 3,059
Note: All campuses are included. 1 Latest available data 2 Students park in spaces not designated Source: South Carolina Commission on Higher Education
- 92 -
Other Information
MIDLANDS TECHNICAL COLLEGE
- 93 -

This page intentionally left blank
- 94 -
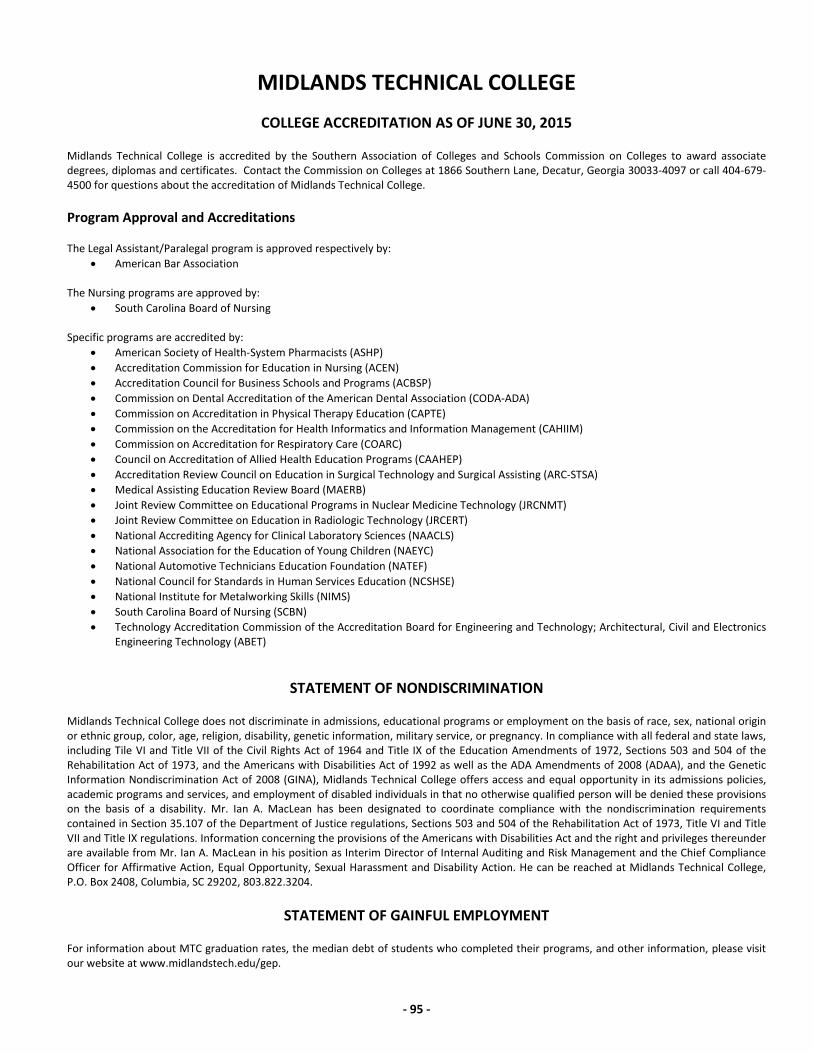
MIDLANDS TECHNICAL COLLEGE
COLLEGE ACCREDITATION AS OF JUNE 30, 2015 Midlands Technical College is accredited by the Southern Association of Colleges and Schools Commission on Colleges to award associate degrees, diplomas and certificates. Contact the Commission on Colleges at 1866 Southern Lane, Decatur, Georgia 30033-4097 or call 404-679-4500 for questions about the accreditation of Midlands Technical College. Program Approval and Accreditations The Legal Assistant/Paralegal program is approved respectively by:
• American Bar Association The Nursing programs are approved by:
• South Carolina Board of Nursing Specific programs are accredited by:
• American Society of Health-System Pharmacists (ASHP) • Accreditation Commission for Education in Nursing (ACEN) • Accreditation Council for Business Schools and Programs (ACBSP) • Commission on Dental Accreditation of the American Dental Association (CODA-ADA) • Commission on Accreditation in Physical Therapy Education (CAPTE) • Commission on the Accreditation for Health Informatics and Information Management (CAHIIM) • Commission on Accreditation for Respiratory Care (COARC) • Council on Accreditation of Allied Health Education Programs (CAAHEP) • Accreditation Review Council on Education in Surgical Technology and Surgical Assisting (ARC-STSA) • Medical Assisting Education Review Board (MAERB) • Joint Review Committee on Educational Programs in Nuclear Medicine Technology (JRCNMT) • Joint Review Committee on Education in Radiologic Technology (JRCERT) • National Accrediting Agency for Clinical Laboratory Sciences (NAACLS) • National Association for the Education of Young Children (NAEYC) • National Automotive Technicians Education Foundation (NATEF) • National Council for Standards in Human Services Education (NCSHSE) • National Institute for Metalworking Skills (NIMS) • South Carolina Board of Nursing (SCBN) • Technology Accreditation Commission of the Accreditation Board for Engineering and Technology; Architectural, Civil and Electronics
Engineering Technology (ABET)
STATEMENT OF NONDISCRIMINATION Midlands Technical College does not discriminate in admissions, educational programs or employment on the basis of race, sex, national origin or ethnic group, color, age, religion, disability, genetic information, military service, or pregnancy. In compliance with all federal and state laws, including Tile VI and Title VII of the Civil Rights Act of 1964 and Title IX of the Education Amendments of 1972, Sections 503 and 504 of the Rehabilitation Act of 1973, and the Americans with Disabilities Act of 1992 as well as the ADA Amendments of 2008 (ADAA), and the Genetic Information Nondiscrimination Act of 2008 (GINA), Midlands Technical College offers access and equal opportunity in its admissions policies, academic programs and services, and employment of disabled individuals in that no otherwise qualified person will be denied these provisions on the basis of a disability. Mr. Ian A. MacLean has been designated to coordinate compliance with the nondiscrimination requirements contained in Section 35.107 of the Department of Justice regulations, Sections 503 and 504 of the Rehabilitation Act of 1973, Title VI and Title VII and Title IX regulations. Information concerning the provisions of the Americans with Disabilities Act and the right and privileges thereunder are available from Mr. Ian A. MacLean in his position as Interim Director of Internal Auditing and Risk Management and the Chief Compliance Officer for Affirmative Action, Equal Opportunity, Sexual Harassment and Disability Action. He can be reached at Midlands Technical College, P.O. Box 2408, Columbia, SC 29202, 803.822.3204.
STATEMENT OF GAINFUL EMPLOYMENT For information about MTC graduation rates, the median debt of students who completed their programs, and other information, please visit our website at www.midlandstech.edu/gep.
- 95 -

This page intentionally left blank
- 96 -
Federal Awards Single Audit and other Compliance Reports Section
MIDLANDS TECHNICAL COLLEGE
- 97 -

This page intentionally left blank
- 98 -
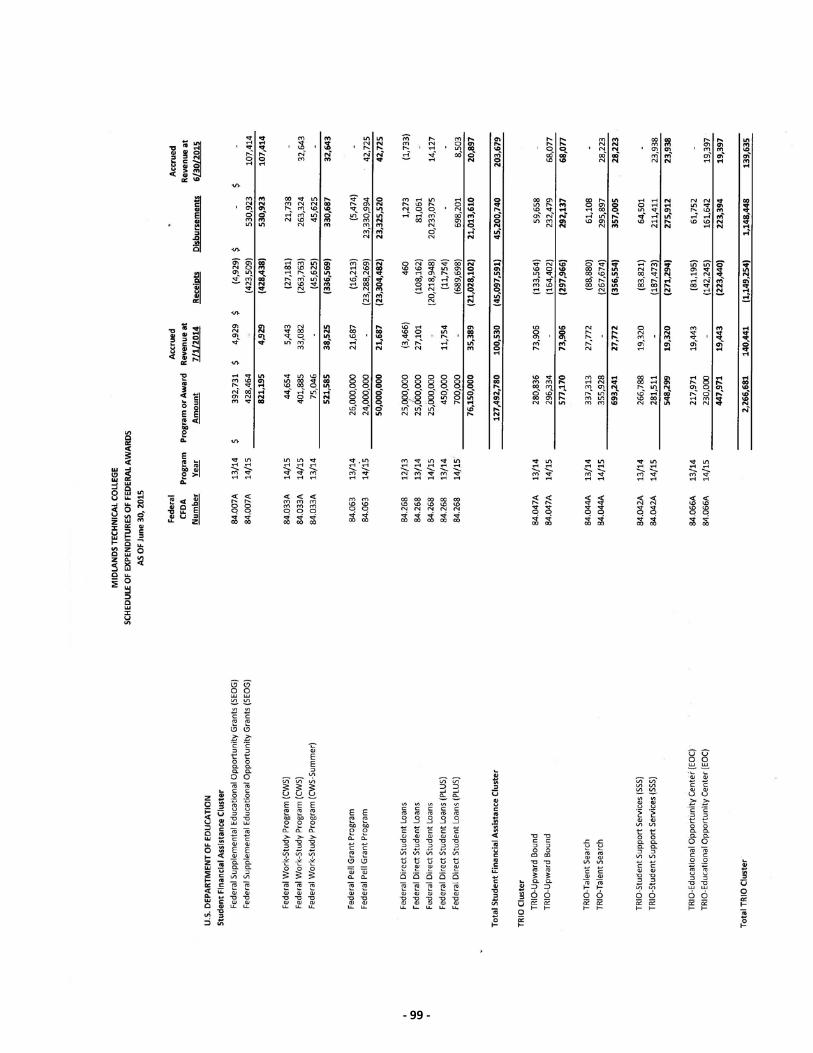
- 99 -
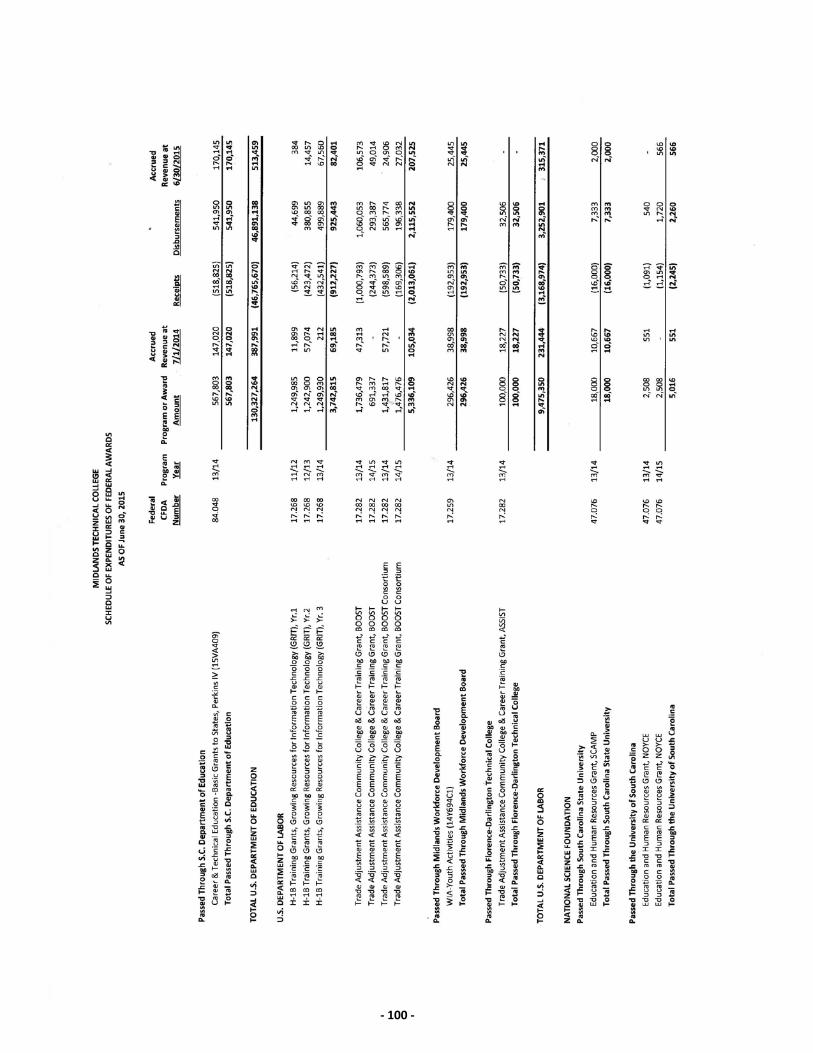
- 100 -
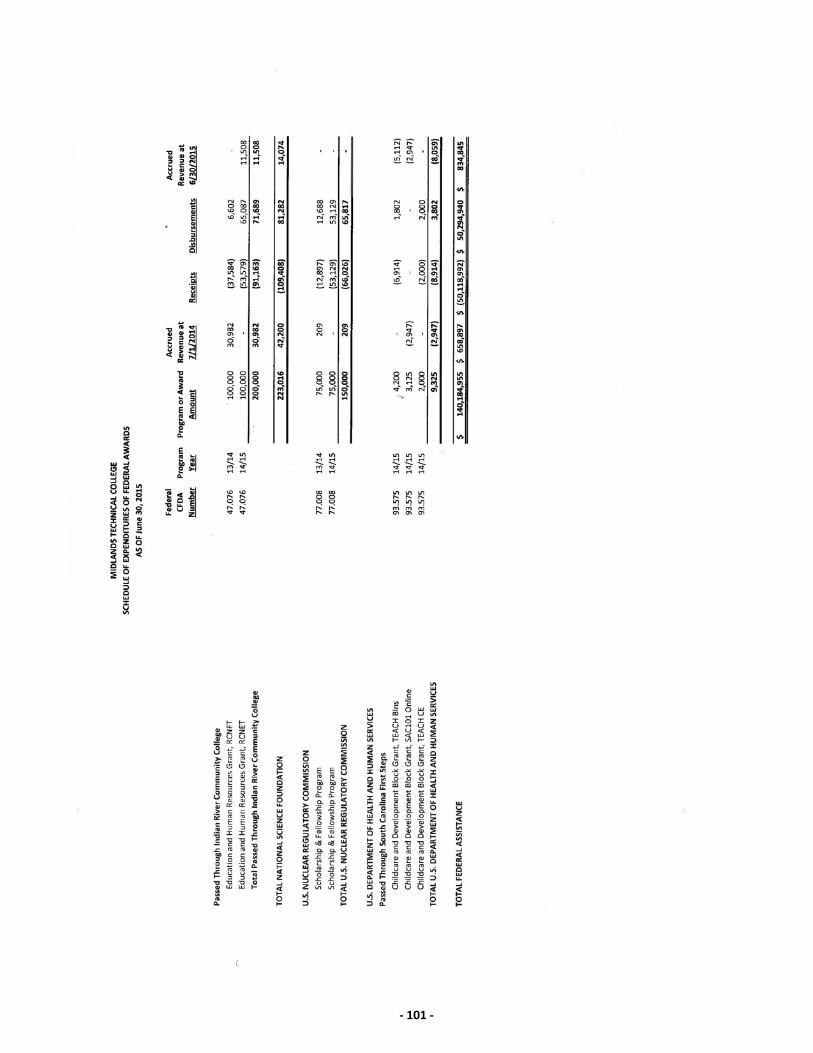
- 101 -
MIDLANDS TECHNICAL COLLEGE
NOTES TO SCHEDULE OF EXPENDITURES OF FEDERAL AWARDS June 30, 2015
1. Description Midlands Technical College (the College) has adopted the Federal Office of Management and Budget’s (OMB) Circular A-
133, Audits of States, Local Governments, and Non‐Profit Organizations (as revised). For purposes of implementing OMB Circular A-133, federal grant awards were made susceptible to audit and are included in the Schedule of Expenditures of Federal Awards.
2. Summary of Significant Accounting Principles Basis of Presentation The financial activity shown in the Schedule of Expenditures of Federal Awards reflects amounts recorded by the College
on the accrual basis, during its fiscal year July 1, 2014, through June 30, 2015.
3. Loan Programs
The College has students who have approved Federal Direct Loans. Those loans were disbursed to the students during the current fiscal year. The College is not the lender. The College only processes the loans for the lender, the Department of Education. The total Federal Direct Loans for the current fiscal year were $21,013,610.
- 102 -
Independent Auditor’s Report on Internal Control Over Financial Reporting and on
Compliance and Other Matters Based on an Audit of Financial Statements Performed in Accordance with Government Auditing Standards
The President and Members of the Area Commission Midlands Technical College Post Office Box 2408 Columbia, South Carolina 29202
We have audited, in accordance with the auditing standards generally accepted in the United States of America and the standards applicable to financial audits contained in Government Auditing Standards issued by the Comptroller General of the United States, the financial statements of the business-type activities and the discretely presented component unit of Midlands Technical College (the “College”), as of and for the year ended June 30, 2015, and the related notes to the financial statements, which collectively comprise the College’s basic financial statements and have issued our report thereon dated September 28, 2015.
Internal Control Over Financial Reporting In planning and performing our audit of the financial statements, we considered the College’s internal control over financial reporting (internal control) to determine the audit procedures that are appropriate in the circumstances for the purpose of expressing our opinions on the financial statements, but not for the purpose of expressing an opinion on the effectiveness of the College’s internal control. Accordingly, we do not express an opinion on the effectiveness of the College’s internal control.
A deficiency in internal control exists when the design or operation of a control does not allow management or employees, in the normal course of performing their assigned functions, to prevent, or detect and correct, misstatements on a timely basis. A material weakness is a deficiency, or a combination of deficiencies, in internal control, such that there is a reasonable possibility that a material misstatement of the College’s financial statements will not be prevented, or detected and corrected on a timely basis. A significant deficiency is a deficiency, or a combination of deficiencies, in internal control that is less severe than a material weakness, yet important enough to merit attention by those charged with governance.
Our consideration of internal control was for the limited purpose described in the first paragraph of this section and was not designed to identify all deficiencies in internal control that might be material weaknesses or, significant deficiencies. Given these limitations, during our audit we did not identify any deficiencies in internal control that we consider to be material weaknesses. However, material weaknesses may exist that have not been identified.
- 103 -
Compliance and Other Matters As part of obtaining reasonable assurance about whether the College’s financial statements are free from material misstatement, we performed tests of its compliance with certain provisions of laws, regulations, contracts, and grant agreements, noncompliance with which could have a direct and material effect on the determination of financial statement amounts. However, providing an opinion on compliance with those provisions was not an objective of our audit, and accordingly, we do not express such an opinion. The results of our tests disclosed no instances of noncompliance or other matters that are required to be reported under Government Auditing Standards.
Purpose of this Report The purpose of this report is solely to describe the scope of our testing of internal control and compliance and the results of that testing, and not to provide an opinion on the effectiveness of the College’s internal control or on compliance. This report is an integral part of an audit performed in accordance with Government Auditing Standards in considering the College’s internal control and compliance. Accordingly, this communication is not suitable for any other purpose.
West Columbia, South Carolina September 28, 2015
- 104 -
Independent Auditor’s Report on Compliance for Each Major Program and on Internal
Control Over Compliance Required by OMB Circular A-133
The President and Members of the Area Commission Midlands Technical College Post Office Box 2408 Columbia, South Carolina 29202
We have audited Midlands Technical College’s (the “College”) compliance with the types of compliance requirements described in the OMB Circular A‐133 Compliance Supplement that could have a direct and material effect on each of the College’s major federal programs for the year ended June 30, 2015. The College’s major federal programs are identified in the summary of auditor’s results section of the accompanying schedule of findings and questioned costs.
Management’s Responsibility Management is responsible for compliance with the requirements of laws, regulations, contracts, and grants applicable to its federal programs.
Auditor’s Responsibility Our responsibility is to express an opinion on compliance for each of the College’s major federal programs based on our audit of the types of compliance requirements referred to above. We conducted our audit of compliance in accordance with auditing standards generally accepted in the United States of America; the standards applicable to financial audits contained in Government Auditing Standards, issued by the Comptroller General of the United States; and OMB Circular A-133, Audits of States, Local Governments, and Non‐Profit Organizations. Those standards and OMB Circular A-133 require that we plan and perform the audit to obtain reasonable assurance about whether noncompliance with the types of compliance requirements referred to above that could have a direct and material effect on a major federal program occurred. An audit includes examining, on a test basis, evidence about the College’s compliance with those requirements and performing such other procedures as we considered necessary in the circumstances.
We believe that our audit provides a reasonable basis for our opinion on compliance for each major federal program. However, our audit does not provide a legal determination of Midlands Technical College’s compliance. Opinion on Each Major Federal Program In our opinion, Midlands Technical College’s, complied, in all material respects, with the types of compliance requirements referred to above that could have a direct and material effect on each of its major federal programs for the year ended June 30, 2015.
- 105 -
Report on Internal Control Over Compliance Management of the College is responsible for establishing and maintaining effective internal control over compliance with the types of compliance requirements referred to above. In planning and performing our audit of compliance, we considered the College’s internal control over compliance with the types of requirements that could have a direct and material effect on each major federal program to determine the auditing procedures that are appropriate in the circumstances for the purpose of expressing an opinion on compliance for each major federal program and to test and report on internal control over compliance in accordance with OMB Circular A-133, but not for the purpose of expressing an opinion on the effectiveness of internal control over compliance. Accordingly, we do not express an opinion on the effectiveness of the College’s internal control over compliance.
A deficiency in internal control over compliance exists when the design or operation of a control over compliance does not allow management or employees, in the normal course of performing their assigned functions, to prevent, or detect and correct, noncompliance with a type of compliance requirement of a federal program on a timely basis. A material weakness in internal control over compliance is a deficiency, or combination of deficiencies, in internal control over compliance, such that there is a reasonable possibility that material noncompliance with a type of compliance requirement of a federal program will not be prevented, or detected and corrected, on a timely basis. A significant deficiency in internal control over compliance is a deficiency, or a combination of deficiencies, in internal control over compliance with a type of compliance requirement of a federal program that is less severe than a material weakness in internal control over compliance, yet important enough to merit attention by those charged with governance.
Our consideration of internal control over compliance was for the limited purpose described in the first paragraph of this section and was not designed to identify all deficiencies in internal control over compliance that might be material weaknesses or significant deficiencies. We did not identify any deficiencies in internal control over compliance that we consider to be material weaknesses. However, material weaknesses may exist that have not been identified.
The purpose of this report on internal control over compliance is solely to describe the scope of our testing of internal control over compliance and the results of that testing based on the requirements of OMB Circular A-133. Accordingly, this report is not suitable for any other purpose.
West Columbia, South Carolina September 28, 2015
- 106 -
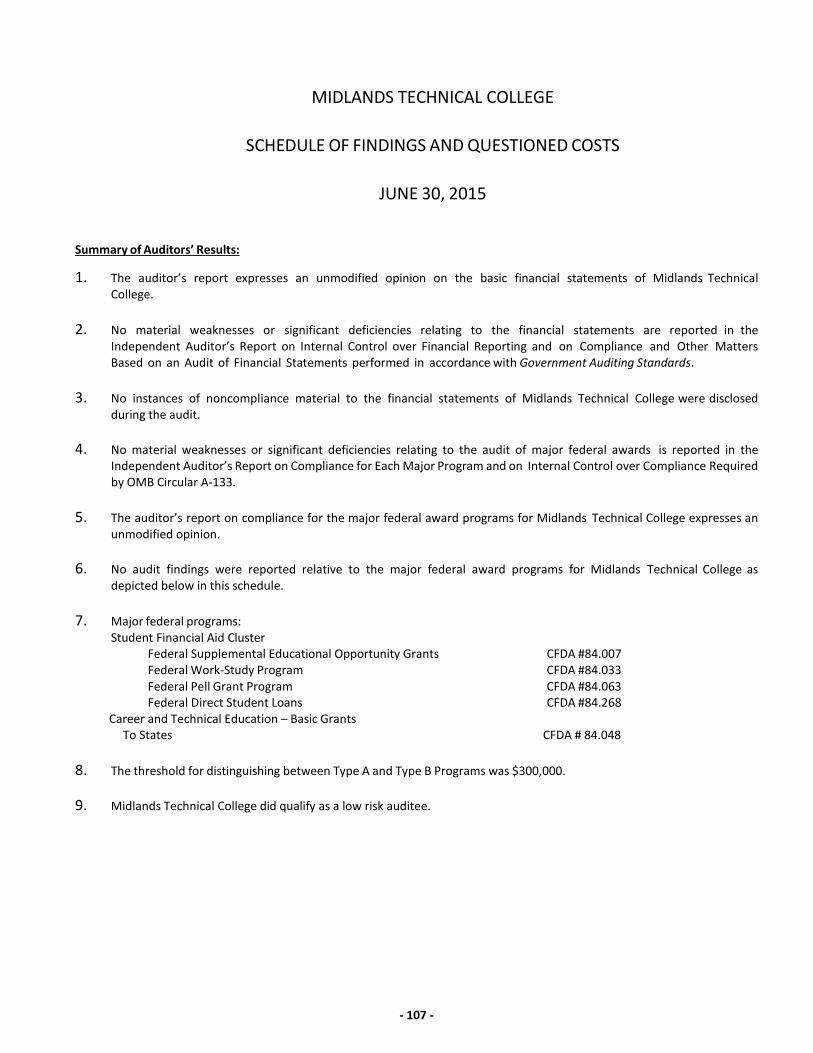
MIDLANDS TECHNICAL COLLEGE
SCHEDULE OF FINDINGS AND QUESTIONED COSTS
JUNE 30, 2015
Summary of Auditors’ Results:
1. The auditor’s report expresses an unmodified opinion on the basic financial statements of Midlands Technical College.
2. No material weaknesses or significant deficiencies relating to the financial statements are reported in the
Independent Auditor’s Report on Internal Control over Financial Reporting and on Compliance and Other Matters Based on an Audit of Financial Statements performed in accordance with Government Auditing Standards.
3. No instances of noncompliance material to the financial statements of Midlands Technical College were disclosed
during the audit.
4. No material weaknesses or significant deficiencies relating to the audit of major federal awards is reported in the Independent Auditor’s Report on Compliance for Each Major Program and on Internal Control over Compliance Required by OMB Circular A-133.
5. The auditor’s report on compliance for the major federal award programs for Midlands Technical College expresses an
unmodified opinion.
6. No audit findings were reported relative to the major federal award programs for Midlands Technical College as depicted below in this schedule.
7. Major federal programs:
Student Financial Aid Cluster Federal Supplemental Educational Opportunity Grants CFDA #84.007 Federal Work-Study Program CFDA #84.033 Federal Pell Grant Program CFDA #84.063 Federal Direct Student Loans CFDA #84.268
Career and Technical Education – Basic Grants To States CFDA # 84.048
8. The threshold for distinguishing between Type A and Type B Programs was $300,000.
9. Midlands Technical College did qualify as a low risk auditee.
- 107 -
MIDLANDS TECHNICAL COLLEGE
SCHEDULE OF FINDINGS AND QUESTIONED COSTS
(CONTINUED)
Financial Statement Findings:
None
Federal Awards Findings and Questioned Costs:
No findings or questioned costs.
Status of Prior Year Findings:
None were reported.
- 108 -
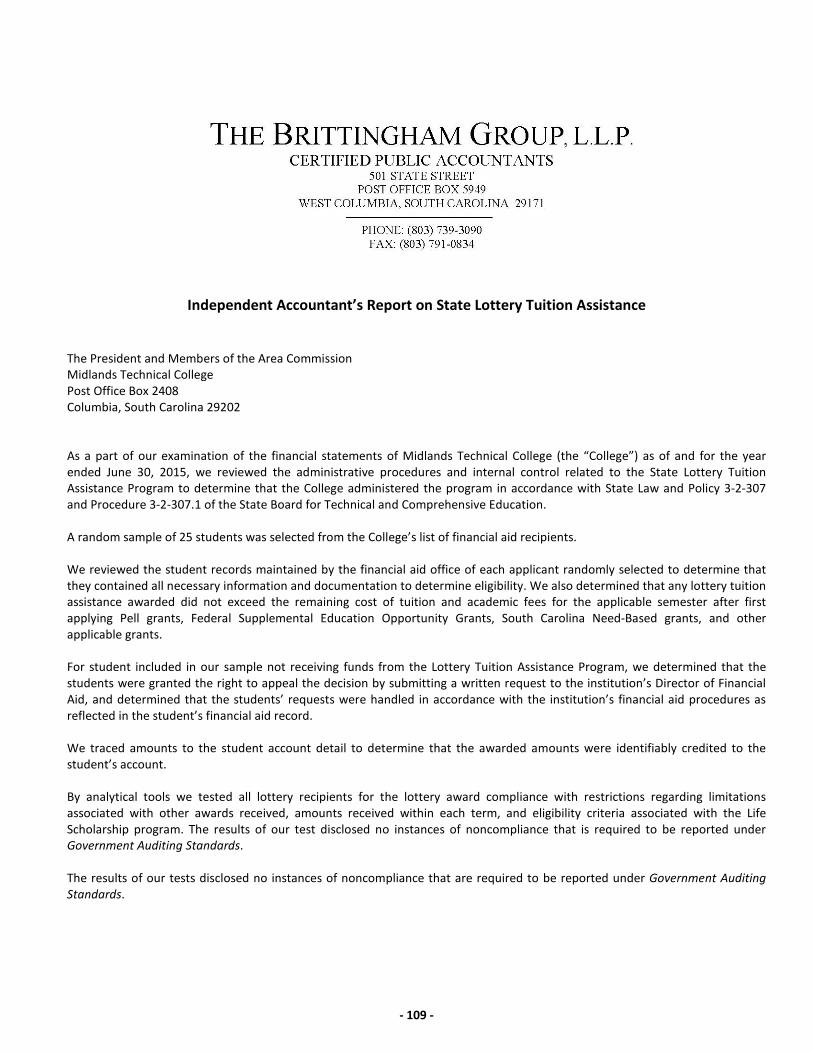
Independent Accountant’s Report on State Lottery Tuition Assistance
The President and Members of the Area Commission Midlands Technical College Post Office Box 2408 Columbia, South Carolina 29202 As a part of our examination of the financial statements of Midlands Technical College (the “College”) as of and for the year ended June 30, 2015, we reviewed the administrative procedures and internal control related to the State Lottery Tuition Assistance Program to determine that the College administered the program in accordance with State Law and Policy 3-2-307 and Procedure 3-2-307.1 of the State Board for Technical and Comprehensive Education. A random sample of 25 students was selected from the College’s list of financial aid recipients. We reviewed the student records maintained by the financial aid office of each applicant randomly selected to determine that they contained all necessary information and documentation to determine eligibility. We also determined that any lottery tuition assistance awarded did not exceed the remaining cost of tuition and academic fees for the applicable semester after first applying Pell grants, Federal Supplemental Education Opportunity Grants, South Carolina Need-Based grants, and other applicable grants. For student included in our sample not receiving funds from the Lottery Tuition Assistance Program, we determined that the students were granted the right to appeal the decision by submitting a written request to the institution’s Director of Financial Aid, and determined that the students’ requests were handled in accordance with the institution’s financial aid procedures as reflected in the student’s financial aid record. We traced amounts to the student account detail to determine that the awarded amounts were identifiably credited to the student’s account. By analytical tools we tested all lottery recipients for the lottery award compliance with restrictions regarding limitations associated with other awards received, amounts received within each term, and eligibility criteria associated with the Life Scholarship program. The results of our test disclosed no instances of noncompliance that is required to be reported under Government Auditing Standards. The results of our tests disclosed no instances of noncompliance that are required to be reported under Government Auditing Standards.
- 109 -
In our opinion, the State Lottery Tuition Assistance Program has been administered in accordance with State Law and Policy 3-2-307 and Procedure 3-2-307.1 of the State Board for Technical and Comprehensive Education. This report is intended solely for the use of management of the College, the Area Commission for Midlands Technical College, management of the South Carolina State Board for Technical and Comprehensive Education, and the South Carolina Commission of Higher Education and should not be used by anyone other than these specified parties.
West Columbia, South Carolina September 28, 2015
- 110 -