Embed Size (px)
Citation preview

Comprehensive Annual Financial Report
Utility Board of the
City of Key West, Florida
For the Fiscal Year Ended September 30, 2006

COMPREHENSIVE ANNUAL FINANCIAL REPORT
UTILITY BOARD OF THE CITY OF KEY WEST, FLORIDA
FOR THE FISCAL YEAR ENDED SEPTEMBER 30, 2006
JACK WETZLER LYNNE TEJEDA ASSISTANT GENERAL MANAGER & GENERAL MANAGER & CHIEF FINANCIAL OFFICER CHIEF EXECUTIVE OFFICER

CONTENTS PageINTRODUCTORY SECTION Letter of Transmittal iCertificate of Achievement for Excellence in Financial Reporting xOfficials and Employees xi
FINANCIAL SECTION Independent Auditor’s Report 1Management’s Discussion and Analysis 3Financial Statements: Balance Sheets 8 Statements of Revenues, Expenses and Changes in Net Assets 10 Statements of Cash Flows 11 Notes to Financial Statements 13Supplemental Schedules: Schedules of Revenues Earned 28 Schedules of Revenues and Expenditures - Budget to Actual 29
STATISTICAL SECTION Statistical Section Description 30Financial Trends – Condensed Balance Sheets – Last 10 Fiscal Years 31Financial Trends – Changes in Net Assets – Last 10 Fiscal Years 33Financial Trends – Net Assets by Component – Last 10 Fiscal Years 36Revenue Capacity – Revenues by Type of Customer – Last 10 Fiscal Years 37Revenue Capacity – Actual Number of Customers Billed – Last 10 Fiscal Years 38Revenue Capacity – kWh Sales by Type of Customer – Last 10 Fiscal Years 39Revenue Capacity – Average Monthly Bill – Last 10 Fiscal Years 40Revenue Capacity – Residential Rate Analysis (September) – Last 10 Fiscal Years 41Revenue Capacity – Rate Increases – Last 10 Fiscal Years 42Debt Capacity – Debt Service Coverage & Ratios of Outstanding Debt– Last 10 Fiscal Years 43Debt Capacity – Principal Payments Payable for All Debt Issues Through 2031 44Demographic and Economic Information – Last 10 Fiscal Years 45Operating Information – Operating Expenses – Last 10 Fiscal Years 46Operating Information – Energy Sources – Last 10 Fiscal Years 47Operating Information – Generating Capacity – Last 10 Fiscal Years 48Operating Information – Employee Information – Last 10 Fiscal Years 49Operating Information – Ten Highest Consumption Locations 50
SINGLE AUDIT Report on Internal Control Over Financial Reporting and on Compliance and Other Matters Based on an Audit of Financial Statements Performed in Accordance with Government Audit Standards 51Report on Compliance with Requirements Applicable to Each Major Program and on Internal Control over Compliance in Accordance with OMB Circular A-133 53Schedule of Expenditures of Federal Awards 55Notes to Schedule of Expenditures of Federal Awards 56Schedule of Findings and Questioned Costs 57Summary Schedule of Prior Audit Findings 58Corrective Action Plan 59

i
(305) 295-1000 1001 James Street
PO Box 6100 Key West, FL 33040-6100
www.KeysEnergy.com
U T I L I T Y B O A R D O F T H E C I T Y O F K E Y W E S T
January 11, 2007 To the Chairman and Members of the Utility Board of the City of Key West, Florida The Comprehensive Annual Financial Report (CAFR) of the Utility Board of the City of Key West, Florida, for the Fiscal Year ended September 30, 2006, is submitted herewith, pursuant to and by the authority of Chapter 69-1191, Laws of Florida, as amended, and Resolution No. 532 of the Utility Board, Article V, Section 5.01 (H), adopted November 13, 1985, as amended and supplemented. The CAFR was compiled by the staff of the Finance Department with the close cooperation of our independent auditor and represents the official report of the Utility’s financial operations and conditions to the citizens, Utility Board, management personnel, rating agencies, bond holders and other interested parties. Management is responsible for the contents of the CAFR. The Introductory Section includes the table of contents and this transmittal letter. The Financial Section is comprised of the independent auditor’s report, management’s discussion and analysis of our financial position and results of operations, the financial statements, supplemental schedules and other auditor’s reports. The notes to the financial statements are considered an integral and essential part of adequate disclosure and fair presentation of the financial statements. The Statistical Section includes selected financial and demographic trend information. The tables within this section differ from the financial section schedules in that they present some non-accounting data covering more than two fiscal years. Please refer to these sections for in depth analysis. The Utility Board of the City of Key West realizes its role, as a public power entity, has never been more important. The present organization was created by provisions of Chapter 69-1191, Laws of Florida (1969), as amended, to manage, operate and maintain the electric utility serving the citizens of the City of Key West, Florida and the Lower Florida Keys.

ii
The Power of Leadership While Florida Keys residents were offered a respite with an extremely quiet hurricane season in 2006, recollections of the 2005 season were close at hand throughout the year and served as a guiding light as residents, and businesses alike, rebuilt and looked toward the future. Keys Energy Services’ (KEYS) recognized leadership in the field of hurricane preparation and restoration was called upon throughout the year as fellow utilities looked to emulate enviable practices and restoration statistics. Most notably, in the spring of 2006 the City of Lake Worth requested assistance, via the Florida Municipal Electric Association (FMEA), in reviewing and improving their hurricane procedures after a tumultuous 2005 season. Among the five utilities asked to participate, KEYS was the most sought after by both FMEA and Lake Worth given its relative size and proven track record. KEYS Financial Advisor Craig Dunlap, in a presentation to the Utility Board regarding an upcoming Bond Issuance, further added that, “no other utility in the State of Florida is more prepared than KEYS, when it comes to hurricanes, with a set of proven policies and procedures that are second to none.” Looking toward the future, KEYS became one of the first local public agencies to offer an online payment option to its customers in May 2006. The online payment feature further expands KEYS numerous online services and allows customers to pay their monthly energy bills via the web and have 24-hour access to their billing consumption and history. More than 3,000 KEYS customers have registered to pay and/or access their billing online since the program’s inception. The year 2006 also marked the 10th anniversary of KEYS annual calendar, featuring the artwork of local elementary school students to illustrate its pages. In yet another example of community and industry leadership, the academic year calendar focused on promoting energy conservation and efficiency at a time when the national conversation had yet to focus on these same concepts. KEYS led the charge for over ten years to both educate and inform its customers by utilizing the innocent wisdom of children, and in doing so further established itself as a conscientious, forward-thinking member of the community. Fiscal Year (FY) 2006 can be looked back on as a year when the successes of the past served to elevate the expectations of leaders and test their mettle. FY 2006 proved, yet again, that when it comes to reliably powering paradise and lighting the path to the future, no one comes close to KEYS.
iii
Entity Definition
Enabling Legislation - Pursuant to the provisions of Chapter 69-1191, Laws of Florida, Special Act of 1969, as amended and supplemented, Section 11, the said Utility Board shall have full and complete power and exclusive authority to fix rates and charges for electricity and charges or prices for any other real and personal property, products and services, materials and commodities, by-products of and from all or any of its activities or operations, furnished or sold by said Utility Board, and to provide for the collection of the same. Bond Resolution - Pursuant to the provisions of the Original Bond Resolution, 532, adopted on November 13, 1985, as amended and supplemented, Article V, Section 5.01, (B), the Board covenants to fix, establish, revise from time to time whenever necessary, maintain and collect always such fees, rates, rentals and other charges for the use of the product, services and facilities of the Utility which will always provide Revenues in each Fiscal Year sufficient to pay, and out of such funds pay, 100% of all Operating Expenses of the Utility in such year and all reserve or other payments herein required, and 125% of the Debt Service Requirement in such Fiscal Year on the Bonds. Such rates, fees, rentals or other charges shall not be reduced so as to be insufficient to provide Revenues for such purposes. The Board further covenants and agrees that the Board will annually within thirty (30) days after adoption of the budget revise such fees, rates, rentals and other charges for the use of the product, services and facilities of the Utility to the extent necessary for the estimated Gross Revenues during the next succeeding Fiscal Year to increase over the amount of actual Gross Revenues for the next preceding Fiscal Year by the amount that the estimated Operating Expenditures during such next succeeding Fiscal Year shall exceed the actual Operating Expenses of the Utility during such next preceding Fiscal Year. The Florida Public Service Commission (FPSC) – has rate structure jurisdiction. No rules and regulations, or schedules of rates and charges, or modifications or revisions of the same, shall be effective until filed with and approved by the FPSC as provided by law. Upon acceptable showing by any utility, the FPSC may waive or modify, as to that utility, the provisions of any rule, except when such provisions are fixed by Statute. No deviation from these rules shall be permitted unless authorized in writing by the FPSC. Each utility shall file with the FPSC tariffs applicable to all territory served by it, showing all rates, classifications, and charges for service subject to the jurisdiction of the FPSC, furnished by the utility, and all rules and regulations relating thereto. A letter of transmittal shall be accompanied by various items in connection with each service classification in which any change is proposed. Where the change involves a rate or charge and the electric utility elects to make a cost study, the utility shall file a cost information statement containing a summary of the cost study performed. After acceptance, one stamped copy will be returned to the utility, which shall be the notice to the utility that the filing has been accepted and approved. Florida Municipal Power Agency (FMPA) - The Utility is a member of, and receives all of its power needs from FMPA’s All-Requirements Project. Each member appoints one representative to FMPA’s Board of Directors, which governs the Agency’s activities. The governance of rates charged to members includes the All-Requirements Project Committee (one vote per member) and the FMPA Board of Directors (a member’s vote is weighted based on the Member City’s net energy for load). Basis of Accounting The financial statements are prepared on the basis of accounting required by the Federal Energy Regulatory Commission (FERC), which is an application of generally accepted accounting principles that is peculiar to utilities. Revenues are recognized in the period earned and expenses are recognized in the period incurred.

iv
Budgetary control is maintained through the use of monthly financial reports and the use of purchase orders, work orders, and miscellaneous cash disbursements and approval procedures. Property, Plant and Equipment is stated at cost, which includes costs of contract work, labor, materials, allocated indirect charges, and capitalized interest. Major renewals and betterments are capitalized while minor replacements and repairs are expensed as incurred. The cost of electric plant retired, together with removal costs less salvage, is charged to accumulated depreciation at such time as property is removed from service. In June 1999, the Governmental Accounting Standards Board (GASB) adopted Statement 34, Basic Financial Statements- and Management’s Discussion and Analysis- for State and Local Governments. The standard requires that a “Management Discussion and Analysis” be included with annual audited basic financial statements. KEYS implemented GASB Statement 34 for the fiscal year ended September 30, 2002. Your attention is directed to Note 1 of the Notes to the Financial Statements, which fully describes the accounting practices for the presentation of the financial statements. Internal Accounting Controls In developing and maintaining the accounting system, consideration is given by the administration as to the adequacy of internal controls. Internal controls are designed to provide reasonable, but not absolute, assurance as to the safeguarding of assets against loss from unauthorized use or disposition; the reliability of financial records for preparing financial statements in conformity with generally accepted accounting principles; and maintaining accountability for assets. The concept of reasonable assurance recognizes that (1) the cost of a control should not exceed the benefits likely to be derived and (2) the evaluation of costs and benefits requires estimates and judgments by management. For the fiscal year ended September 30, 2006, the Auditor noted no matters involving internal control over financial reporting and its operation that would be considered to be a material weakness. The first level of control comes directly from the Enabling Act (69-1161). Section 17 requires that the Utility Board hire an independent certified public accountant to complete an annual audit. The second level of control comes from the covenants made by the Utility Board to the bondholders. Among other requirements, the Utility Board must keep accounts in accordance with generally accepted accounting principles and to file audited annual financial statements with the Auditor General of the State of Florida within 180 days after the close of its fiscal year. As an additional level of control the Utility Board has established an audit committee in which two board members are part. Budgetary Control In accordance with the Enabling legislation, the Utility Board holds public hearings and subsequently adopts an annual budget for operating expenses and capital outlay prior to October 1 of the fiscal year. Actual revenues and expenses are compared to the budget on a line item basis (which is the legal level of control) within cost centers, and an analysis of variances report is prepared and submitted to the Utility Board each month as required by bond indentures. During the year, staff can make amendments within the operating budget or the capital budget that do not change the total budget for those categories, provided that the change is within the same limitations established by Resolution adopted by the Utility Board. The Utility Board approves all other budget changes. Supplemental appropriations were necessary and the Utility Board in accordance with Utility Board policies amended the budgetary data presented herein. Budget appropriations lapse at each fiscal year-end except for the Capital Budget. The budget is adopted on a basis consistent with KEYS’ basis of accounting except for depreciation and amortization, debt service on revenue bonds, and allocation of administrative costs to capital projects.

v
Rates for Service The following table compares average monthly charges for electric service among selected utilities in Florida for the fiscal year ended September 30, 2006.
Residential Commercial 1,000 kWh 30KW - 6,000 kWh
Utility Board of the City of Key West 130.90$ 782.90$ Other Municipal Ft Pierce Utilities Authority 119.00$ 744.26$
Utilities in City of Jacksonville Beach 120.76$ 703.56$ Florida Ocala Electric Utility 108.69$ 549.98$
Investor-Owned Florida Power & Light 105.89$ 707.65$ Utilities in Progress Energy 106.82$ 599.52$
Florida Tampa Electric Company 106.87$ 596.14$
Source: Florida Municipal Electric Association, Inc. Tallahassee, Florida
COMPARISON OF AVERAGE MONTHLY ELECTRIC BILLS
Residential 1,000 kWh
$100.00$105.00$110.00$115.00$120.00$125.00$130.00$135.00
Utility Board ofthe City of Key
West
Ft Pierce UtilitiesAuthority
City ofJacksonville
Beach
Ocala ElectricUtility
Florida Power &Light
Progress Energy Tampa ElectricCompany
Commercial 30 KW - 6,000 kWh
$450.00$500.00$550.00$600.00$650.00$700.00$750.00$800.00
Utility Board ofthe City of Key
West
Ft Pierce UtilitiesAuthority
City ofJacksonville
Beach
Ocala ElectricUtility
Florida Power &Light
Progress Energy Tampa ElectricCompany

vi
Customer Statistics At fiscal year end 2006, the Utility’s customer base was 29,507 or 38 less than the 2005 level of 29,545. Peak Demand (60 minute net) decreased to 136.0 MW compared to the 2005 peak of 145.5 MW. Load Factor was 63.1% in Fiscal 2006 compared to 61.1% in 2005. The number of residential customers decreased 70 to 24,011. The average monthly consumption of 1,132 kWh was lower than the 2005 level by 18 kWh. The number of commercial customers increased 46 to 3,743. The average monthly consumption of 6,874 kWh was higher than the 2005 level by 170 kWh. The average monthly consumption for the Military decreased 875.0 thousand kWh.
Comparison of Number of Customers
0
5,000
10,000
15,000
20,000
25,000
Residential Commercial Miltary City & OtherAccounts
20062005
Comparison of MWh Sold
050,000
100,000150,000200,000250,000300,000350,000
Residential Commercial Miltary City & OtherAccounts
20062005
Cash Management The Utility Board’s investment policies are governed by state statutes, bond covenants, and the Utility Board’s own investment practices. Utility Board monies must be deposited in banks designated as qualified public depositories by the State of Florida, Department of Insurance and Treasurer. Permissible investments include the obligations of the U.S. Treasury, U.S. agencies and any state of the United States of America; certificates of deposit; repurchase agreements; and commercial paper which is rated at the time of purchase in the single highest classification, “P-1” by Moody’s and “A-1” by S&P and which matures not more than 270 calendar days after the date of purchase; units of participation in the State of Florida Local Government Surplus Funds Trust Fund; and investment agreements with a bank or insurance company which has an unsecured, uninsured and unguaranteed obligation rated “A3” or better by Moody’s and “A-“ or better by S&P. Collateral is provided for demand deposits and certificates of deposit through the Florida Security for Public Deposits Act. This Act establishes guidelines for qualification and participation by banks and savings associations, procedures for the administration of the collateral requirements, and characteristics of eligible collateral. Under the Act, a qualified public depository must pledge collateral valued at not less than 50% of the average daily balance for each month of all public deposits in excess of any applicable deposit insurance. Additional collateral, up to a maximum of 125%, may be required if deemed necessary under certain conditions. The investment goal of the Utility Board is to invest public funds in a manner which will provide the highest investment return with the maximum security, while meeting the daily cash flow demands of the Utility Board and conforming to all state and local laws governing the investment of public funds. Safety of principal is regarded as the foremost objective of the investment program. Maintaining sufficient liquidity is also an important investment objective. The cash management performance for Fiscal 2006 produced earnings in the amount of $1.0 million, which was $434.2 thousand more than 2005 as a result of higher interest rates.

vii
Purchased Power The Utility Board voted on July 7, 1997, to participate in the FMPA All-Requirements Project (ARP) whereby the Utility will purchase their bulk power supply requirements, in excess of certain excluded resources, from the ARP. The Utility began operations as a project participant effective April 1, 1998. The Utility Board has previously entered into several purchased power arrangements including (i) the FMPA Tri-City Project (Stanton 1); (ii) the FMPA Stanton 2 Project, and (iii) long-term purchase agreement from Florida Power & Light Company (FPL). As a member of the ARP, the Utility Board’s resources and costs under these three contracts have been assigned to FMPA. Other power resource and sale arrangements include the Utility Board’s purchases from a small resource recovery unit located on Stock Island, sale of power to the Florida Keys Electric Cooperative Association, Inc. (FKEC) and interchange service arrangements with other Florida utilities and with power marketers. All of the power purchases listed above, except for the purchase from the resource recovery unit, requires transmission over the FKEC transmission system. On January 1, 1992, this became a jointly owned system between KEYS and FKEC and is covered by a Long-Term Joint Investment Transmission Agreement. Please see Notes to Financial Statements for further information. Transmission Facilities KEYS is connected to the mainland Florida transmission network through a 61 mile long, 138 kV transmission line jointly-owned by the Utility Board and the FKEC and which allows interconnection between KEYS and FKEC at its Marathon Substation. The 138 kV transmission line extends northeast along U.S. 1 through FKEC’s service territory and ties in with FPL at the Monroe-Dade County line. The Utility Board’s solely-owned portion of the 138 kV line extends from Marathon Key, in the FKEC service territory, to the Stock Island (U.S. 1) Substation. Along this route, the line loops in and out of the Utility Board’s Big Pine and Big Coppitt substations. Pursuant to the current transmission agreement with FKEC, the Utility Board constructed and jointly owns with FKEC a second 138 kV transmission line, which extends 21 miles from the Tavernier Substation in the FKEC service territory to the Monroe-Dade County line, where it ties into the FPL 138 kV transmission line. The two transmission lines between Florida City and Tavernier provide greater reliability and increased import capability to KEYS. With the addition of this latest segment of 138 kV line and the conversion of the decommissioned steam generating unit at the Stock Island Plant to a synchronous condenser, the firm MW transfer allocation for KEYS over the Transmission Line is approximately 110 MW. The transfer capability of the transmission line is approximately 270 MW. KEYS local transmission facilities consist of seven-69 kV lines (14.9 miles) in Key West/Stock Island and four-138 kV lines (51.2 miles) from Key West to Marathon. Distribution is supplied from the 69/138 kV system to KEYS’ eight distribution substations. Distribution Facilities KEYS’ distribution system comprises approximately 244 miles of three-phase equivalent 13.8 kV lines from the Utility’s power plants and eight distribution substations. Switching for the 13.8 kV distribution is provided by 13.8 kV metal clad switchgear. Distribution at 13.8 kV is provided via substation power 13.8kV transformers with varying capacities. There are numerous sectionalizing and isolation switches on the 13.8 kV distribution systems. Additionally, transformer vaults are used on the distribution systems to step down from distribution voltage to utilization voltage at hotels and other large loads. Local Generation Facilities The Utility Board currently owns, operates and maintains six generating units with a total Nameplate rating of 43.4 MW. This includes a combustion turbine (CT) unit, two medium speed diesel units and three peaking diesel units located at Stock Island. Three other peaking diesel units, located at Big Pine Key and Cudjoe Key, are in the process of being decommissioned and are not available for use.
viii
Additionally, FMPA owns three combustion turbines at Stock Island; the combined Nameplate ratings are 79.7 MW. These units contribute to the total Nameplate rating of 123.1 MW and the Utility operates all the units with No. 2 oil. Under provisions of the ARP Supply Contract, the output of the Utility-owned generating facilities is being purchased in its entirety by FMPA as part of the ARP. The table entitled “Generating Capacity” in the Statistical Section provides more detailed information. Debt Administration The principal amount of Long Term Debt, net of the current portion, was $55.0 million at September 30, 2006, compared to $60.4 million at September 30, 2005. All outstanding debt had fixed interest rates, with exception of the Loan Payable, which carried a variable rate. Total revenue bond debt was comprised of three refunding bond issues: 1991, 2000 and 2001. All issues are rated AAA by Standard & Poor’s (S&P) and insured by AMBAC Indemnity Corporation. The Utility Board approved the execution of a loan agreement in May 2005 for $1,185,000 from the Florida Municipal Power Authority Pooled Loan Project to provide funding for capital projects. As of September 30, 2006, the outstanding balance on the FMPA Pooled Loan was $948,000. Capital projects funded included a field communication system, converting a 4160 Feeder to 13.8KV, purchase and installation of a telephone system, and performing transmission pole foundation repairs. Long Term Financial Planning On October 31, 2006, KEYS issued $42.0 million of Electric System Refunding and Capital Improvement Revenue Bonds, Series 2006. The bonds refunded the FMPA loan of $948,000 and will fund several capital projects, including a pole hardening program, transmission and distribution improvements, a new substation located in Stock Island, installation of new feeders at the Big Pine substation, replace certain substation transformers and install fin fan coolers at the Stock Island Generating Facilities. Since many of the projects rehabilitate deteriorating lines, the impact on operating and maintenance related to that rehabilitation is expected to be favorable. The issue is rated AAA by Standard & Poor’s (S&P) and Fitch and Aaa by Moody’s and is insured by the MBIA Insurance Company. In addition, KEYS obtained an underlying bond rating of A2 from Moody’s and A- from Standard & Poor’s (S&P). Risk Management The Utility is exposed to various risks of loss related to torts, damage, theft or destruction of assets, errors or omissions, injuries to employees, and natural disasters. The System will either retain the exposures to loss or transfer the risk to a commercial carrier, to minimize the financial impact on the Utility. The Utility retains the risk of loss up to the deductible amounts. The Risk Management section has developed a specific coverage program. Under this program, coverage is provided for worker’s compensation, comprehensive general liability, excess liability, automobile comprehensive and physical damage, crime and fiduciary, public official’s errors and omissions, property, boiler and machinery, windstorm, flood and pollution liability. The Risk Management section, is striving to meet the goal of continuous no-lost time accidents and minimizing injury claims, through their coordinated and continuous efforts in monitoring potential risk exposures and implementing safety control programs, such as Safety Training Observation Program (“STOP”), coupled with effective claims administration. Independent Audit Resolution No. 532 of the Utility Board, Article V, Section 5.01 (H), adopted November 13, 1985, as amended and supplemented requires an annual audit by independent certified public accountants. For Fiscal Years 2006 and 2005 the Utility Board selected the accounting firm of Oropeza & Parks, CPAs. The auditor’s report on the financial statements is included in the Financial Section of this report.

ix
Certificate of Achievement The Government Finance Officers Association of the United States and Canada (GFOA) awarded a Certificate of Achievement for Excellence in Financial Reporting to the Utility Board of the City of Key West for its comprehensive annual financial report for the fiscal year ended September 30, 2005. This was the fourteenth consecutive year that the Utility Board has achieved this prestigious national award. In order to be awarded a Certificate of Achievement, a government unit must publish an easy to read and efficiently organized comprehensive annual financial report. This report must satisfy both generally accepted accounting principles and applicable legal requirements. A Certificate of Achievement is valid for a period of one year only. We believe that our current comprehensive annual financial report continues to conform to the Certificate of Achievement Program’s requirements and we are submitting it to the GFOA to determine its eligibility for another certificate. Acknowledgments We extend our personal thanks to the dedicated efforts of the Finance Department and efforts of those employees who spent many hours preparing, revising and finalizing this document. We are grateful to Oropeza & Parks, CPAs whose professional skill and integrity have allowed us to present a report that meets the highest standards of financial reporting. Finally, we would like to thank the members of the Utility Board of the City of Key West for their interest and support in planning and conducting the operations of the Utility in a responsible and progressive manner. Respectfully submitted,

x

xi
Utility Board of the City of Key West, Florida
Chairman Robert R. Padron has served on the Utility Board since 1995. He was employed by Keys Energy Services from 1961 to 1994, and retired as the General Manager. Mr. Padron holds a Bachelor of Science Degree from Tulane University and a Master’s of Science from Nova University. He serves on various committees of the Florida Municipal Power Agency (FMPA), the American Public Power Association (APPA) and the Florida Municipal Electric Association (FMEA), where he is a past president. He was the 2002 recipient of the APPA’s Spence Vanderlinden Public Official Award. Vice Chairman Lou Hernandez has served on the Utility Board since 1997. He is the Executive Director of HELPLINE, Inc., a crisis intervention and information referral telephone hotline in Monroe County. Upon graduation from Texas A&M University, Mr. Hernandez was commissioned by the U.S. Army and served as an Infantry Officer in Vietnam. After completing his Armed Services commitment, Mr. Hernandez secured a Federal internship with the US Department of Transportation in the Human Resources Development area. He worked with several Federal agencies, completing his career in Washington as the Director of Training and Employee Development with the General Services Administration. He moved to Key West in 1983 and has worked in the home renovation business and as a counselor at FTPA and the Public Health Department. He is the current Vice-Chair of the Citizen's Review Board of the City of Key West. Mr. Peter Batty, has served on the Utility Board since 2005. He is a Florida Licensed Real Estate Broker and Mortgage Broker and has lived in the Florida Keys since 1989. On November 18, 2000, he was ordained as a Permanent Deacon to the Archdiocese of Miami. Mr. Batty received his Bachelor of Science degree from Eastern Michigan University and his Masters degree from St. Thomas University. Mr. Batty is a member of the Florida Keys Community College Education Foundation Board and former Vice President of the Wesley House Board of Directors. Mr. Batty was born in Salisbury, England, and immigrated to the United States in 1955. He and his wife Ellen have raised four children in the Florida Keys. Mr. Charles A. Bradford Jr. has served on the Utility Board since 2006. He has worked in the Banking and Finance industry for 30 years and is currently the Vice President of Keys Federal Credit Union. Mr. Bradford received his Bachelor’s degree in Banking and Finance from the University of North Florida and has certifications in Consumer Lending, Cash Flow Analysis, and Accounting. He is a member of the City of Key West’s Port Advisory Board and Workforce Housing Committee, Sunrise Rotary Club, and is past Chair of the Key West Chamber of Commerce and former member of KEYS Advisory Committee. Mr. Bradford has lived in the Florida Keys since 1980. Ms. Mona C. Clark has served on the Utility Board since 2004 and holds the distinction of being the first female Board member in the Utility’s history. She has worked for the Monroe County School District for over 30 years, serving as an educator and an administrator – she is currently the Site Administrator at May Sands School. Ms. Clark received her Bachelor of Science in Education degree from Florida A & M University and her Masters of Education/Leadership degree from the University of South Florida. Ms. Clark is the Chair of the Mayor’s Revolving Loan Fund for the City of Key West and Chair of the Citizen’s Advisory Task Force for the Monroe County Housing Authority.
xii
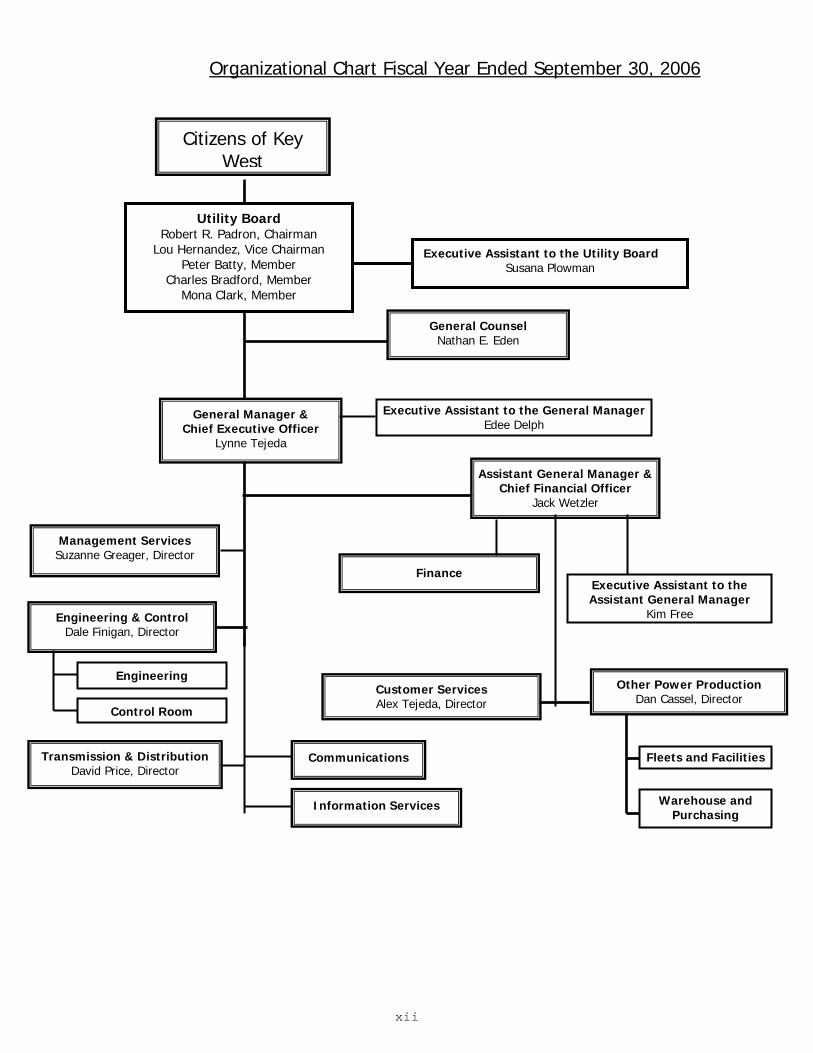
Organizational Chart Fiscal Year Ended September 30, 2006
Assistant General Manager & Chief Financial Officer
Jack Wetzler
Fleets and Facilities
Warehouse and Purchasing
Customer Services Alex Tejeda, Director
Other Power Production Dan Cassel, Director
Finance
Engineering
Management Services Suzanne Greager, Director
Engineering & Control Dale Finigan, Director
Executive Assistant to the General Manager Edee Delph
Control Room
Transmission & Distribution David Price, Director
General Manager & Chief Executive Officer
Lynne Tejeda
Communications
Information Services
Executive Assistant to the Assistant General Manager
Kim Free
Utility Board Robert R. Padron, Chairman
Lou Hernandez, Vice Chairman Peter Batty, Member
Charles Bradford, Member Mona Clark, Member
Executive Assistant to the Utility Board Susana Plowman
Citizens of Key West
General Counsel Nathan E. Eden

Keys Energy Services Employees as of September 30, 2006
xiii
Sylvia Adams
John Albury
Matthew Alfonso
Barbara Archer
Frank Arencibia
Heather Arencibia
Marcos Arencibia
Pedro Arencibia
Raymond Baker
Eric Balbuena
Deborah Barnett
Robert Barrios
Julio J. Barroso
James Barry*
Terry Beeman
Tony Bethel
Cassie Blanco
Karla Bravo
Kris Bremer
Lynda Bringle
Heath Brundage
Robert Burchett
Elaine Carey
Harry Carey
Mike Carey
Brandon Casanta
Walter Cashwell
Dan Cassel
George Castellon
Jason Cohen
Michael Commander
David Cottar
Kevin Crockett
Fred Culpepper
John Curry
Wayne Davila
Maria De La Torre
Jose Del Rio
Daniel Delice
Edee Delph
Joseph Diaz
Patty Dixon
Michael Domenech
Eugene Edwards
John Fallon
Albert Fernandez
Desiree Fernandez
Dale Finigan
Chuck Finlayson
Nancy Flores
Margie Fontanez
Elizabeth Franco
Kim Free
Russell Free
Daniel Garcia
Eddie Garcia
Estela Garcia
Juan Carlos Garcia
Mark Garcia
Ralph A. Garcia
Roger George
Dave Gerstenkorn
Edward Giesler
Thomas Grassi
Suzanne Greager
Michael Griffin
Sabrina Hall
Susan Ham**
Kevin Hawthorne
Timothy Hertzog
Cecelia Hoversen
Ana Kerr
Emmanuel Kerr
Johnny Kerr
Steven Key
Harold Knowles
Brenda LaLama
Wayne Lewallen
Julio Lot
Herschell Major
Laurence Marius
James McClendon
Cindy McVeigh
Neil Mellies*
Ony Mendez*
Juan Menendez
James Menite
Robert Mesa
Armando Mira III
Horace Mobley
Patrick Mobley
Sharon Moore
Scott Morgan
David Morris
James Newton
Catherine Nix
Patrick Nolan
Chomi Oropeza
Milagros Ortiz
Allen Palka
Carliss Parks
Jeff Partington
Don Paxson
Catherine Peace
Chasity Perez
Desi Perez
Jack Pins
Jerry Pita
Susana Plowman
Eva Pope
Letisia Powell
David Price
Alberto Pumar
Stacey Pyle
Martha Ramas
Beverly Ray
Milton Roberts
Randy Roberts
Alvaro Rodriguez
David Rodriguez
Manuel Rodriguez
Steve Rodriguez
Armando Rojas
Bobby Ruble
Stan Rzad
Daniel Sabino
Manuel Sanchez
Austin Sands
Thomas Schuler
Vin Smith
Dennis Stone
Susan Storm
Frank Story
Alex Tejeda
Lynne Tejeda
Larry Thomas
Barry Travis
Ivan Urbay
Hugo Valdes
Bryan Veliz
Mary Vidal
Chuck Vinson
Dane’lle Waldon
Peggy Walls
Charles Walterson
Stefan Washington
Frankie Webb
Jack Wetzler
Bruce Woodard
Donnie Yarbrough
Joshua Yarbrough
Idalia Yorba
Erica Zarate
* Employee of the Quarter 2006 **Employee of the Year 2006

1
INDEPENDENT AUDITOR’S REPORT
Utility Board of the City of Key West, Florida “Keys Energy Services” Key West, Florida
We have audited the accompanying financial statements of the Utility Board of the City of Key West, Florida, d/b/a Keys Energy Services, (“KEYS”) as of and for the years ended September 30, 2006 and 2005 as listed in the table of contents. These financial statements are the responsibility of KEYS’ management. Our responsibility is to express an opinion on these financial statements based on our audits.
We conducted our audits in accordance with auditing standards generally accepted in the United States of America and Government Auditing Standards, and the standards applicable to financial audits contained in Government Auditing Standards, issued by the Comptroller General of the United States of America. Those standards require that we plan and perform the audit to obtain reasonable assurance about whether the financial statements are free of material misstatement. An audit includes examining, on a test basis, evidence supporting the amounts and disclosures in the financial statements. An audit also includes assessing the accounting principles used and significant estimates made by management, as well as evaluating the overall financial statement presentation. We believe that our audits provide a reasonable basis for our opinion.
In our opinion, the financial statements referred to above present fairly, in all material respects, the financial position of the Utility Board of the City of Key West, Florida, Keys Energy Services as of September 30, 2006 and 2005, and the changes in financial position, and cash flows for the years then ended in conformity with accounting principles generally accepted in the United States of America.
In accordance with Government Auditing Standards, we have also issued our report dated January 11, 2007, on our consideration of KEYS’ internal control over financial reporting and on our tests of its compliance with certain provisions of laws, regulations, contracts and grant agreements and other matters. The purpose of that report is to describe the scope of our testing of internal control over financial reporting and compliance and the results of that testing, and not to provide an opinion on the internal control over financial reporting or on compliance. That report is an integral part of an audit performed in accordance with Government Auditing Standards and should be read in conjunction with this report in considering the results of our audit.
The management’s discussion and analysis and budgetary comparison information as listed in the table of contents are not a required part of the basic financial statements but are supplementary information required by the Governmental Accounting Standards Board.

2
We have applied certain limited procedures, which consisted principally of inquiries of management regarding the methods of measurement and presentation of the required supplementary information. However we did not audit the information and express no opinion on it.
Our audit was conducted for the purpose of forming opinions on the financial statements that collectively comprise KEYS’ basic financial statements. The introductory section and statistical section are presented for purposes of additional analysis and are not a required part of the basic financial statements. The accompanying schedule of expenditures of federal awards is presented for purposes of additional analysis as required by U.S. Office of Management and Budget Circular A-133, Audits of States, Local Governments, and Non-Profit Organizations, and is also not a required part of the basic financial statements of KEYS’. The schedule of expenditures of federal awards has been subjected to the auditing procedures applied in the audit of the basic financial statements and, in our opinion, is fairly stated in all material respects in relation to the basic financial statement taken as a whole. The introductory and statistical sections have not been subjected to the auditing procedures applied in the audit of the basic financial statements and, accordingly, we express no opinion on them.
January 11, 2007

3
Management’s Discussion and Analysis
As management of the Utility Board of the City of Key West, Florida, we offer readers of the Utility Board’s financial statements this narrative overview and analysis of the financial activities of the Utility Board of the City of Key West for the fiscal year ended September 30, 2006. We encourage readers to consider the information presented here in conjunction with additional information we have furnished in our Letter of Transmittal. Required Financial Statements The financial statements consist of the Balance Sheet, Statement of Revenues, Expenses and Changes in Net Assets, and Statement of Cash Flows. The Balance Sheet provides information about the nature and amounts of investments in resources (assets) and the obligations to creditors (liabilities). It also provides the basis for assessing the liquidity and financial flexibility of the Utility. All of the current year’s revenues and expenses are accounted for in the Statement of Revenues, Expenses and Changes in Net Assets. This statement reports all the revenues and expenses during the time periods indicated, and can be used to determine whether the Utility has successfully recovered all its costs. The primary purpose of the Statement of Cash Flows is to provide information about the Utility’s cash receipts and cash payments. This statement reports cash receipts, cash payments, and net changes in cash resulting from activities related to operations, non-capital financing, and capital and related financing. The statement also provides answers to such questions as “where did cash come from?” “what was cash used for?” and “what was the change in cash balance during the reporting period?” Balance Sheet The Utility’s Net Assets, which do not include the negative net pension obligation, increased in Fiscal 2006 by $6.0 million, or 9%.
2005 to 2006 Increase (Decrease)
2004 2005 2006 Amount PercentNet Property, Plant and Equipment $115,031,750 $114,111,920 $114,832,809 $720,889 0.6%
Other Property and Investments 25,791,610 14,709,156 16,076,733 1,367,577 9.3%Current and Non-Current Assets 16,404,585 33,723,321 33,923,421 200,100 0.6%
Total Assets $157,227,945 $162,544,397 $164,832,963 $2,288,566 1.4%
Invested in Capital Assets, net of related debt $47,004,365 $48,044,762 $53,995,651 $5,950,889 12.4%Restricted for Working Capital 3,243,009 3,243,009 3,243,009 - 0.0%
Unrestricted 11,263,359 15,830,949 15,934,969 104,020 0.7%Net Assets 61,510,733 67,118,720 73,173,629 6,054,909 9.0%
Long-Term Debt, Net of Current Portion 77,786,466 75,257,723 71,126,824 (4,130,899) -5.5%Liabilities Payable from Restricted Assets 10,989,426 11,200,080 11,998,052 797,972 7.1%Current Liabilities and Deferred Revenue 6,941,320 8,967,874 8,534,458 (433,416) -4.8%
Total Liabilities 95,717,212 95,425,677 91,659,334 (3,766,343) -3.9%Total Net Assets and Liabilities $157,227,945 $162,544,397 $164,832,963 $2,288,566 1.4%
4
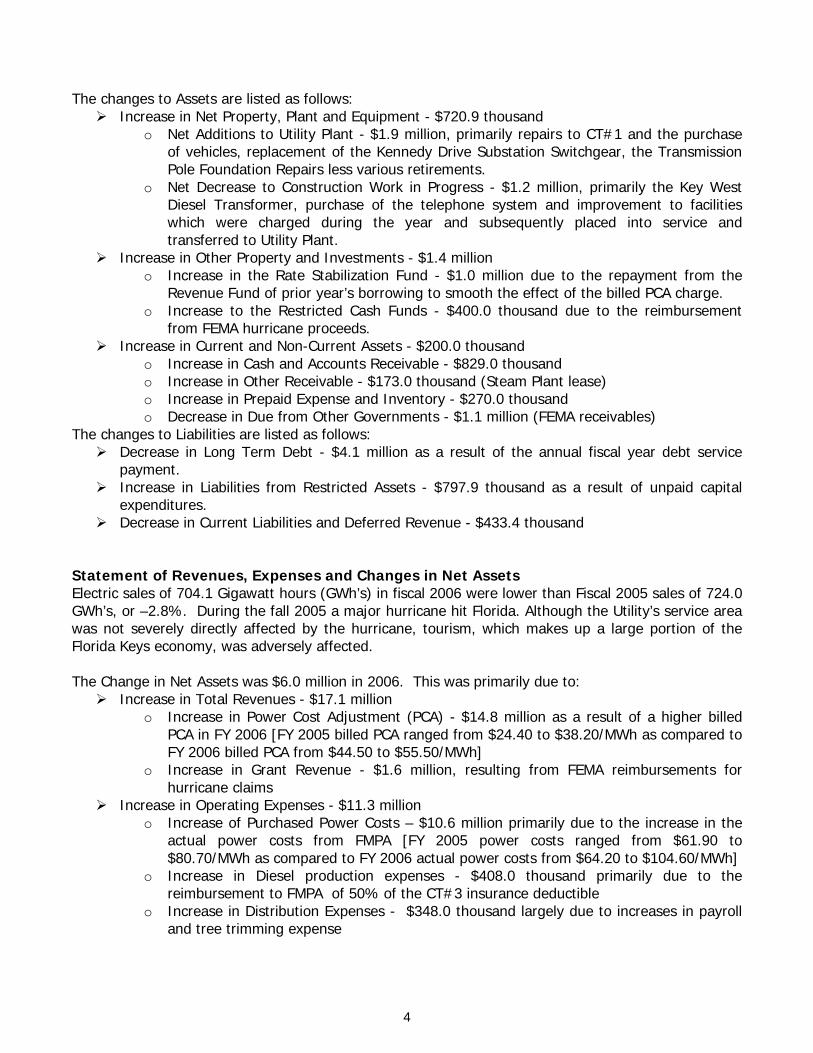
The changes to Assets are listed as follows:
Increase in Net Property, Plant and Equipment - $720.9 thousand o Net Additions to Utility Plant - $1.9 million, primarily repairs to CT#1 and the purchase
of vehicles, replacement of the Kennedy Drive Substation Switchgear, the Transmission Pole Foundation Repairs less various retirements.
o Net Decrease to Construction Work in Progress - $1.2 million, primarily the Key West Diesel Transformer, purchase of the telephone system and improvement to facilities which were charged during the year and subsequently placed into service and transferred to Utility Plant.
Increase in Other Property and Investments - $1.4 million o Increase in the Rate Stabilization Fund - $1.0 million due to the repayment from the
Revenue Fund of prior year’s borrowing to smooth the effect of the billed PCA charge. o Increase to the Restricted Cash Funds - $400.0 thousand due to the reimbursement
from FEMA hurricane proceeds. Increase in Current and Non-Current Assets - $200.0 thousand
o Increase in Cash and Accounts Receivable - $829.0 thousand o Increase in Other Receivable - $173.0 thousand (Steam Plant lease) o Increase in Prepaid Expense and Inventory - $270.0 thousand o Decrease in Due from Other Governments - $1.1 million (FEMA receivables)
The changes to Liabilities are listed as follows: Decrease in Long Term Debt - $4.1 million as a result of the annual fiscal year debt service
payment. Increase in Liabilities from Restricted Assets - $797.9 thousand as a result of unpaid capital
expenditures. Decrease in Current Liabilities and Deferred Revenue - $433.4 thousand
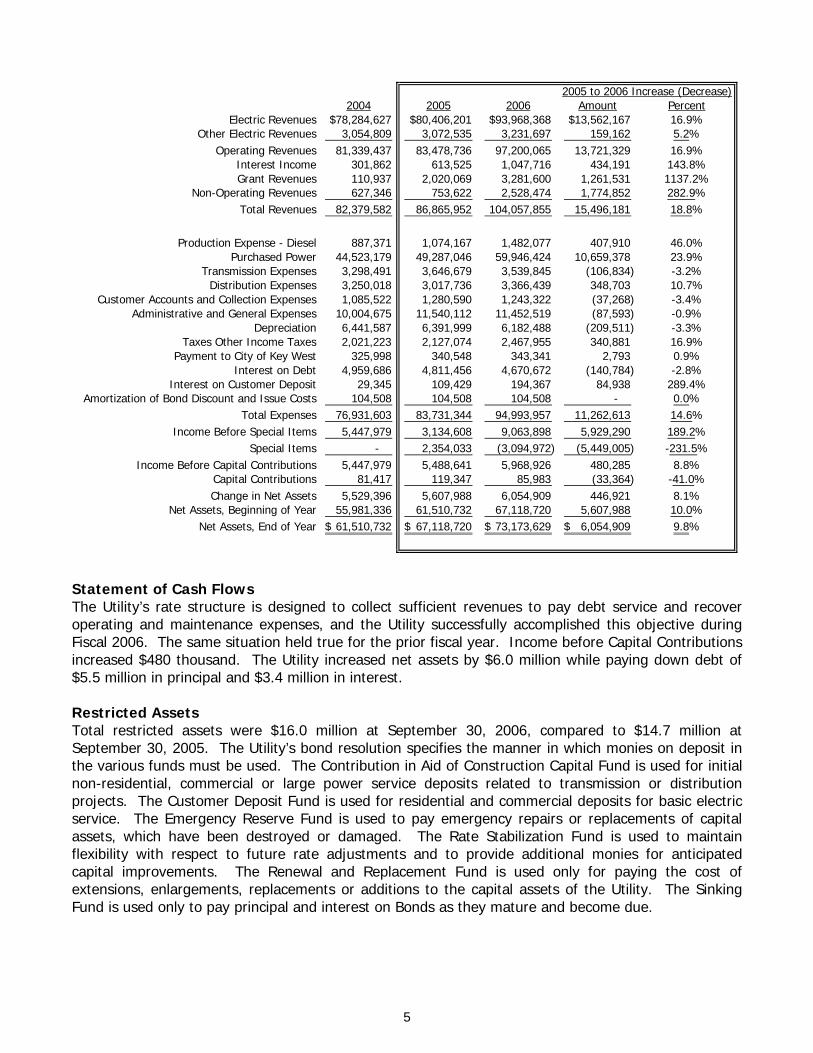
Statement of Revenues, Expenses and Changes in Net Assets Electric sales of 704.1 Gigawatt hours (GWh’s) in fiscal 2006 were lower than Fiscal 2005 sales of 724.0 GWh’s, or –2.8%. During the fall 2005 a major hurricane hit Florida. Although the Utility’s service area was not severely directly affected by the hurricane, tourism, which makes up a large portion of the Florida Keys economy, was adversely affected. The Change in Net Assets was $6.0 million in 2006. This was primarily due to:
Increase in Total Revenues - $17.1 million o Increase in Power Cost Adjustment (PCA) - $14.8 million as a result of a higher billed
PCA in FY 2006 [FY 2005 billed PCA ranged from $24.40 to $38.20/MWh as compared to FY 2006 billed PCA from $44.50 to $55.50/MWh]
o Increase in Grant Revenue - $1.6 million, resulting from FEMA reimbursements for hurricane claims
Increase in Operating Expenses - $11.3 million o Increase of Purchased Power Costs – $10.6 million primarily due to the increase in the
actual power costs from FMPA [FY 2005 power costs ranged from $61.90 to $80.70/MWh as compared to FY 2006 actual power costs from $64.20 to $104.60/MWh]
o Increase in Diesel production expenses - $408.0 thousand primarily due to the reimbursement to FMPA of 50% of the CT#3 insurance deductible
o Increase in Distribution Expenses - $348.0 thousand largely due to increases in payroll and tree trimming expense
5
2005 to 2006 Increase (Decrease)2004 2005 2006 Amount Percent
Electric Revenues $78,284,627 $80,406,201 $93,968,368 $13,562,167 16.9%Other Electric Revenues 3,054,809 3,072,535 3,231,697 159,162 5.2%
Operating Revenues 81,339,437 83,478,736 97,200,065 13,721,329 16.9%Interest Income 301,862 613,525 1,047,716 434,191 143.8%Grant Revenues 110,937 2,020,069 3,281,600 1,261,531 1137.2%
Non-Operating Revenues 627,346 753,622 2,528,474 1,774,852 282.9%Total Revenues 82,379,582 86,865,952 104,057,855 15,496,181 18.8%
Production Expense - Diesel 887,371 1,074,167 1,482,077 407,910 46.0%Purchased Power 44,523,179 49,287,046 59,946,424 10,659,378 23.9%
Transmission Expenses 3,298,491 3,646,679 3,539,845 (106,834) -3.2%Distribution Expenses 3,250,018 3,017,736 3,366,439 348,703 10.7%
Customer Accounts and Collection Expenses 1,085,522 1,280,590 1,243,322 (37,268) -3.4%Administrative and General Expenses 10,004,675 11,540,112 11,452,519 (87,593) -0.9%
Depreciation 6,441,587 6,391,999 6,182,488 (209,511) -3.3%Taxes Other Income Taxes 2,021,223 2,127,074 2,467,955 340,881 16.9%
Payment to City of Key West 325,998 340,548 343,341 2,793 0.9%Interest on Debt 4,959,686 4,811,456 4,670,672 (140,784) -2.8%
Interest on Customer Deposit 29,345 109,429 194,367 84,938 289.4%Amortization of Bond Discount and Issue Costs 104,508 104,508 104,508 - 0.0%
Total Expenses 76,931,603 83,731,344 94,993,957 11,262,613 14.6%Income Before Special Items 5,447,979 3,134,608 9,063,898 5,929,290 189.2%
Special Items - 2,354,033 (3,094,972) (5,449,005) -231.5%Income Before Capital Contributions 5,447,979 5,488,641 5,968,926 480,285 8.8%
Capital Contributions 81,417 119,347 85,983 (33,364) -41.0%Change in Net Assets 5,529,396 5,607,988 6,054,909 446,921 8.1%
Net Assets, Beginning of Year 55,981,336 61,510,732 67,118,720 5,607,988 10.0%Net Assets, End of Year 61,510,732$ 67,118,720$ 73,173,629$ 6,054,909$ 9.8%
Statement of Cash Flows The Utility’s rate structure is designed to collect sufficient revenues to pay debt service and recover operating and maintenance expenses, and the Utility successfully accomplished this objective during Fiscal 2006. The same situation held true for the prior fiscal year. Income before Capital Contributions increased $480 thousand. The Utility increased net assets by $6.0 million while paying down debt of $5.5 million in principal and $3.4 million in interest. Restricted Assets Total restricted assets were $16.0 million at September 30, 2006, compared to $14.7 million at September 30, 2005. The Utility’s bond resolution specifies the manner in which monies on deposit in the various funds must be used. The Contribution in Aid of Construction Capital Fund is used for initial non-residential, commercial or large power service deposits related to transmission or distribution projects. The Customer Deposit Fund is used for residential and commercial deposits for basic electric service. The Emergency Reserve Fund is used to pay emergency repairs or replacements of capital assets, which have been destroyed or damaged. The Rate Stabilization Fund is used to maintain flexibility with respect to future rate adjustments and to provide additional monies for anticipated capital improvements. The Renewal and Replacement Fund is used only for paying the cost of extensions, enlargements, replacements or additions to the capital assets of the Utility. The Sinking Fund is used only to pay principal and interest on Bonds as they mature and become due.

6
Significant Capital Assets Net Property, Plant and Equipment totaled $114.8 million at the end of Fiscal 2006 compared to $114.1 million the prior year, an increase of $720.9 thousand. Significant projects placed in service occurred in Distribution Plant – Kennedy Drive Substation Switchgear Replacement, Distribution Improvements, Key West Diesel Substation Upgrade, Purchase of Residential and Commercial Meters, Daily Work Orders, ER’s and Transformers; Generation Plant – Repair CT#1; Transmission Plant – Transmission Pole Foundation Repair; and General Plant – Replace Telephone System, Upgrade Field Communications and Emergency Purchase of Company Vehicles. Major retirements occurred in Distribution Plant - transformers, switches, meters and poles; General Plant – Vehicles, radios and telephones. Please see Note 1 in Notes to Financial Statements for further information.
Capital Additions
$- $500
$1,000
$1,500
$2,000
$2,500
$3,000
$3,500
$4,000
Generation
Transmission
Distribution
General Plant
Dollars in Thousands ($000s)
Long Term Debt The Utility’s trustee paid to the bondholders a principal payment of $5.4 million on October 1, 2006. In accordance with the Bond covenants, monthly transfers are made from the Revenue Fund to the Sinking Fund, which are reflected on the balance sheet as Other Property and Investments - “restricted assets.” The bondholders are paid annual principal payments on October 1 and semiannual interest payments on April 1st and October 1st of each year. On October 31, 2006, KEYS issued $42.0 million of Electric System Refunding and Capital Improvement Revenue Bonds, Series 2006. The bonds refunded the FMPA loan of $948,000 and will fund several capital projects, including a pole hardening program, transmission and distribution improvements, a new substation located in Stock Island, installation of new feeders at the Big Pine substation, replace certain substation transformers and install fin fan coolers at the Stock Island Generating Facilities. The issue is rated AAA by Standard & Poor’s (S&P) and Fitch and Aaa by Moody’s and is insured by the MBIA Insurance Company. In addition, KEYS obtained an underlying bond rating of A2 from Moody’s and A- from S&P. The Utility’s debt service payments have been structured to remain fairly constant at approximately $8.5 million through 2014, $9.3 million through 2018 and $4.4 million from 2019 through 2031. Please see Note 4 in Notes to Financial Statements for further information.

7
Summary This report is intended to provide our customers, bondholders, and other interested parties with a general overview of the financial position of the Utility Board of the City of Key West and to indicate accountability for the revenues received. Questions about this report or requests for additional information should be directed to the Assistant General Manager & Chief Financial Officer, 305-295-1013, or to our offices located at 1001 James Street, Key West Florida 33040.

UTILITY BOARD OF THE CITY OF KEY WEST, FLORIDA
BALANCE SHEETS
SEPTEMBER 30, 2006 AND 2005
8
ASSETS
2006 2005Current Assets
Cash and Cash Equivalents 7,064,406$ 6,657,203$ Customer Accounts Receivable, net of Allowance for
Bad Debts of $263,331 and $322,571 for 2006 and2005 respectively 6,152,177 5,729,570
Other Accounts Receivable 495,129 492,778 Due From Other Governments 823,921 1,900,702 Plant Material and Operating Supplies Inventory 2,722,320 2,454,805 Prepaid Expenses 7,918,510 7,810,145
Total Unrestricted Current Assets 25,176,463 25,045,203
Cash and Cash Equivalents-Restricted 12,833,724 11,466,147
Total Restricted Currents Assets 12,833,724 11,466,147
Total Current Assets 38,010,187 36,511,350
Non-Current AssetsCapital Assets
Utility Plant 196,142,287 191,713,948 Less Accumulated Depreciation 82,465,916 79,909,835 Net Utility Plant 113,676,371 111,804,113 Construction in Progress 1,156,438 2,307,807
Total Capital Assets 114,832,809 114,111,920
Restricted Non-Current AssetsDeposits-Restricted 3,243,009 3,243,009
Total Restricted Non-Current Assets 3,243,009 3,243,009
Unrestricted Non-Current AssetsOther Accounts Receivable 7,942,212 7,768,864 Bond Discount and Issue Costs, Net 804,746 909,254
Total Unrestricted Non-Current Assets 8,746,958 8,678,118
Total Non-Current Assets 126,822,776 126,033,047
Total Assets 164,832,963$ 162,544,397$
(Continued) (Continued)
The accompanying notes are an integral part of these financial statements.

UTILITY BOARD OF THE CITY OF KEY WEST, FLORIDA
BALANCE SHEETS (CONTINUED)
SEPTEMBER 30, 2006 AND 2005
9
NET ASSETS AND LIABILITIES
2006 2005Current Liabilities
Unrestricted Current LiabilitiesAccounts Payable 5,709,921 6,751,776 Accrued Expenses 2,508,409 2,133,812 Deferred Revenues 316,128 82,286
Total Unrestricted Current Liabilities 8,534,458 8,967,874
Restricted Current LiabilitiesCurrent Portion of Long-Term Debt 5,454,373 5,169,373 Accounts Payable 914,510 196,656 Accrued Interest 1,498,275 1,639,823 Security Deposits Payable 110,000 110,000 Due to Customers 4,020,894 4,084,228
Total Restricted Current Liabilities 11,998,052 11,200,080
Total Current Liabilities 20,532,510 20,167,954
Long-Term Debt, Net of Current PortionRevenue Bonds 55,032,256 60,486,629 Accrued Interest 15,146,568 13,586,094 Loan Payable 948,000 1,185,000
Total Long-Term Debt 71,126,824 75,257,723
Net AssetsInvested in Capital Assets
net of related debt 53,995,651$ 48,044,762$ Restricted for Working Capital 3,243,009 3,243,009 Unrestricted 15,934,969 15,830,949
Total Net Assets 73,173,629 67,118,720
Total Net Assets and Liabilities 164,832,963$ 162,544,397$
The accompanying notes are an integral part of these financial statements.

UTILITY BOARD OF THE CITY OF KEY WEST, FLORIDA
STATEMENTS OF REVENUE, EXPENSES, AND CHANGES IN NET ASSETS
FOR THE YEARS ENDED SEPTEMBER 30, 2006 AND 2005
10
2006 2005
Operating RevenuesSalaes & Charges for Service 94,831,374$ 80,675,032$ Other Operating Revenues 2,368,691 2,803,704
Total Operating Revenues 97,200,065 83,478,736
Operating ExpensesProduction Expenses - Diesel 1,482,077 1,074,167 Purchased Power 59,946,424 49,287,046 Transmission Expenses 3,539,845 3,646,679 Distribution Expenses 3,366,439 3,017,736 Customer Accounts and Collection Expenses 1,243,322 1,280,590 Administrative and General Expenses 11,452,519 11,540,112 Depreciation 6,182,488 6,391,999 Taxes Other than Income Taxes 2,467,955 2,127,074
Total Operating Expenses 89,681,069 78,365,403
Operating Income 7,518,996 5,113,333
Non-Operating Revenue and (Expenses)Interest Income 1,047,716 613,525 Grant Revenue - 119,367 Miscellaneous Non-Operating Revenue 2,255,168 753,622 Payment to City of Key West (343,341) (340,548) Interest on Debt (4,670,672) (4,811,456) Interest on Customer Deposit (194,367) (109,429) Amortization of Bond Discount and Issue Costs (104,508) (104,508)
Total Non-Operating Revenue and (Expenses) (2,010,004) (3,879,427)
Income Before Special Items 5,508,992 1,233,906
Special ItemsHurricane-Grant Revenue 3,281,600 1,900,702 Hurricane-Expenses (3,094,972) (2,214,686) Hurricane - Insurance Proceeds 273,306 - Sale of Steam Plant - 4,568,719
Total Special Items 459,934 4,254,735
Income Before Capital Contributions 5,968,926 5,488,641
Capital Contributions 85,983 119,347
Change in Net Assets 6,054,909 5,607,988
Net Assets, Beginning of Year 67,118,720 61,510,732
Net Assets, End of Year 73,173,629$ 67,118,720$
The accompanying notes are an integral
part of these financial statements.

UTILITY BOARD OF THE CITY OF KEY WEST, FLORIDA
STATEMENTS OF CASH FLOWS
FOR THE YEARS ENDED SEPTEMBER 30, 2006 AND 2005
11
2006 2005
Cash Flows Provided by Operating ActivitiesCash Received from Customers 96,550,156$ 83,029,877$ Cash Payments to Suppliers for Goods and services (76,347,419) (68,095,776) Cash Payments for Restricted Working Capital Deposits - - Cash Payments to Employees for Services (8,142,697) (8,357,425) Cash Received for Deposits 871,306 935,250 Cash Deposits Refunded (934,640) (863,988) Cash Received from Other Operating revenue 2,489,010 727,511 Cash Paid for Hurricane Expenses 1,263,409 (2,214,686)
Net Cash Provided by Operating Sources 15,749,125$ 5,160,763$
Cash Flows Provided (Used) by Non-Capital Financing ActivitiesCash Received from Insurance Proceeds 273,306 119,367 Cash Paid to City of Key West, Florida (343,341) (340,548)
Net Cash (Used) by Non-Capital Financing Activities (70,035) (221,181)
Cash Flows Provided (Used) by Capital and Related Financing ActivitiesPrincipal Paid on Long-Term Debt (5,467,000) (3,785,000) Interest Paid on Revenue Bond Maturities (3,385,486) (3,533,002) Contributions in Aid of Construction 85,983 119,347 Acquisitions and Construction of Capital Assets (6,303,685) (5,015,976) Proceeds (costs) from Disposal of Assets 118,162 (748,797)
Net Cash (Used) by Capital and Related Financing Activities (14,952,026) (12,963,428)
Cash Flows Provided (Used) by Investing ActivitiesRedemption of Investments - 44,075 Interest Received on Investments 1,047,716 613,525
Net Cash Provided by Investing Activities 1,047,716 657,600
Net Increase (Decrease) in Cash and Cash Equivalents 1,774,780 (7,366,246)
Cash and Cash Equivalents at Beginning of year 18,123,350 25,489,596
Cash and Cash Equivalents at End of Year 19,898,130$ 18,123,350$
(Continued) (Continued)
The accompanying notes are an integral
part of these financial statements.

UTILITY BOARD OF THE CITY OF KEY WEST, FLORIDA
STATEMENTS OF CASH FLOWS
FOR THE YEARS ENDED SEPTEMBER 30, 2006 AND 2005
12
Reconciliation of Operating Income to
Net Cash Provided by Operating Activities
2006 2005
Operating Income 7,518,996$ 5,113,333$
Adjustments to Reconcile Operating Income to Net Cash Provided by Operating Activities
Depreciation 6,182,488 6,391,999 Provision for Uncollectible Accounts 238,648 346,350 Amortization of Deferred Revenue (82,286) (108,397) Receipt of Deferred Revenue 316,128 82,286 Other Non-Operating Sources of Revenue 2,255,168 753,622 Hurricane Loss 186,628 (313,984)
Changes in Assets and Liabilities:(Increase) Decrease in Restricted Working Capital Deposit - - (Increase) Decrease in Accounts Receivable (836,954) (755,862) (Increase) Decrease in Plant Material & Inventory (267,515) 205,008 (Increase) Decrease in Prepaid Expenses (108,365) (6,886,821) (Increase) Decrease in Due from Other Governments 1,076,781 (1,900,702) Increase (Decrease) in Accounts Payable (1,041,855) 1,616,759 Increase (Decrease) in Accrued Expenses 374,597 435,911 Increase (Decrease) in Customer Deposits (63,334) 71,261 Increase (Decrease) in Security Deposits - 110,000
Total Adjustments 8,230,129 47,430
Net Cash Provided by Operating Activities 15,749,125$ 5,160,763$
Supplemental Schedule of Non-Cash Financing, Capital and Investing Activities In Fiscal Years 2006 and 2005, amortization of bond discount and issue costs were $104,508 in both fiscal years.
The accompanying notes are an integral part of these financial statements.

UTILITY BOARD OF THE CITY OF KEY WEST, FLORIDA
NOTES TO FINANCIAL STATEMENTS
FOR THE YEARS ENDED SEPTEMBER 30, 2006 AND 2005
13
NOTE 1 - SUMMARY OF SIGNIFICANT ACCOUNTING POLICIES The accounting policies and the presentation of the financial report of the Utility Board of the City of Key West, Florida "Keys Energy Services" (KEYS) have been designed to conform to generally accepted accounting principles as applicable to governmental units, in accordance with the Governmental Accounting Standards Board (GASB). The GASB embodies the official pronouncements previously issued by the National Council on Governmental Accounting (NCGA). KEYS applies Financial Accounting Standards Board (FASB) pronouncements and Accounting Principles Board (APB) opinions issued on or before November 30, 1989, unless those pronouncements conflict with or contradict GASB pronouncements, in which case, GASB prevails. The following is a summary of the significant accounting policies. Entity Definition - KEYS was created by an Act of the Florida Legislature to manage, operate and maintain the electric utility servicing the citizens of the City of Key West, Florida (the City) and the lower Florida Keys. KEYS is the successor of the electric public utility once owned by the City and was given all powers and rights necessary to manage, operate, maintain, control, and extend the electric utility property owned by the City of Key West at the time of its creation. The Board is composed of a Chairman who is elected every two years and four members who are elected every four years by the voters of the City. The General Manager & CEO of KEYS serves as Secretary to the Board and is responsible for the day-to-day operations of KEYS. KEYS is not a component unit of the City. Measurement Focus - The accounting and financial reporting treatment applied to a fund is determined by its measurement focus. KEYS’ operations are accounted for on a flow of economic resources measurement focus. With this measurement focus, all assets and all liabilities associated with the operation of the enterprise fund are included on the balance sheet. Operating statements present increases (e.g. revenue) and decreases (e.g. expenses) in net assets. Basis of Accounting - KEYS’ financial statements are accounted for based on accounting required by the Federal Energy Regulatory Commission (FERC), which is an application of generally accepted accounting principles that is peculiar to utilities. Revenues are recognized in the period earned and expenses are recognized in the period incurred, regardless of the timing of the related cash flows. Budget - In accordance with KEYS’ enabling Legislation, the Utility Board holds public hearings and subsequently adopts an annual budget for operating expenses and capital outlay. Actual revenues and expenses are compared to the budget on a line item basis (which is the legal level of control) within cost centers and an analysis of variances report is prepared and submitted to the Utility Board each month as required by bond indentures. During the year, staff can make amendments within the operating budget or the capital budget that do not change the total budget for those categories. The Utility Board approves all other budget changes. Supplemental appropriations were necessary during FY 06 and the Utility Board, in accordance with KEYS’ policies, amended the budgetary data presented herein. Budget appropriations lapse at each fiscal year-end except for the Capital Budget. The budget is adopted on a basis consistent with KEYS’ basis of accounting except for depreciation and amortization, debt service on revenue bonds and allocation of administrative costs to capital projects. Cash and Investments - Cash and investments in U.S. Government Securities are recorded at cost or amortized cost. Amortized cost does not significantly vary from market value.

UTILITY BOARD OF THE CITY OF KEY WEST, FLORIDA
NOTES TO FINANCIAL STATEMENTS
FOR THE YEARS ENDED SEPTEMBER 30, 2006 AND 2005
14
NOTE 1 - SUMMARY OF SIGNIFICANT ACCOUNTING POLICIES (Continued) Any other investments are stated at fair value in accordance with GASB 31. Florida Statutes govern KEYS’ investment policies. These policies are described in more detail in Note 3. Revenue - Revenue is recognized based on monthly route billings to customers. Revenue is not accrued for services supplied but unbilled at the end of the fiscal period. Charges for new service are reported as revenue only to the extent of connection costs, while amounts exceeding this cost are recorded as contributed capital revenue. Bond Discount and Issue Costs - Bond discount and issue costs consist of debt issue costs, original issue discounts, and underwriter discounts, which are capitalized and amortized over the term of the related indebtedness. Property, Plant and Equipment - Property, Plant and Equipment is stated at cost. Transmission, Distribution and Generation Plant are defined by KEYS as assets with an initial, individual cost of $5,000 or more and an estimated useful life of more than one year. General Plant assets are defined as assets with an initial, individual cost of $1,000 or more and an estimated useful life of more than one year. Under FERC accounting practices and procedures, the cost of electric plant retired, together with removal costs less salvage, is charged to accumulated depreciation when property is removed from service. The following is a summary of property, plant and equipment for the year ended September 30, 2006:
Balance Balance2005 Additions Deletions 2006
Utility Plant in Service:Generation Plant 49,248,023$ 1,435,368$ -$ 50,683,391$ Transmission Plant 71,321,581 1,159,574 - 72,481,155 Distribution Plant 56,439,514 3,738,199 2,015,356 58,162,357 General Plant 14,484,566 1,839,767 1,729,213 14,595,120 Other 220,264 - - 220,264
Total Utility Plant in Service 191,713,948 8,172,908 3,744,569 196,142,287 Accumulated Depreciation:
Generation Plant (26,044,882) (1,682,392) - (27,727,274) Transmission Plant (26,373,582) (1,773,954) - (28,147,536) Distribution Plant (20,400,310) (1,771,439) (2,088,646) (20,083,103) General Plant (7,091,061) (954,702) (1,537,760) (6,508,003) Other - - - -
Total Accumulated Depreciation (79,909,835) (6,182,487) (3,626,406) (82,465,916)
Net Utility Plant in Service 111,804,113$ 1,990,421$ 118,163$ 113,676,371$
Construction Work in Progress 2,307,807$ 7,021,539$ 8,172,908$ 1,156,438$

UTILITY BOARD OF THE CITY OF KEY WEST, FLORIDA
NOTES TO FINANCIAL STATEMENTS
FOR THE YEARS ENDED SEPTEMBER 30, 2006 AND 2005
15
NOTE 1 - SUMMARY OF SIGNIFICANT ACCOUNTING POLICIES (Continued) KEYS’ policy concerning capitalized interest costs is in accordance with Statement of Financial Accounting Standards No. 62, which requires the capitalization of interest costs of restricted tax-exempt borrowings less any interest earned on investment funds during the construction period. For the fiscal years ended 2006 and 2005, there was no capitalized interest cost. Property, Plant and Equipment is depreciated using the straight-line method at rates which will amortize costs over the estimated useful lives of the assets. The estimated useful lives of the electric plant assets are as follows:
Generation Plant 25 Years Transmission Plant 31 - 45 Years Distribution Plant 20 - 45 Years General Plant 5 - 40 Years
Inventory - Inventories are stated at the lower of cost (determined on an average cost basis) or market. Compensated Absences - KEYS records compensation for unused vacation and sick leave as an expense in the year in which the vacation and sick leave is earned in accordance with GASB Statement No. 16. At September 30, 2006, annual vacation leave earned but not taken is $413,346 and sick leave accumulated but not taken is $769,156. Operating Revenues and Expenses – Operating revenues and expenses generally result from providing services and producing and delivering goods in connection with the KEYS principal ongoing operations. The principal operating revenues of KEYS are charges to customers for sales and services. Operating expenses include the cost of sales and services, administrative expenses, and depreciation on capital assets. All revenues and expenses not meeting this definition are reported as nonoperating revenues and expenses. Interest - Interest for the years ended September 30, 2006 and 2005 is summarized as follows:
2006 2005
Electric Refunding Revenue Bonds, Series 1991 1,560,475$ 1,455,631$ Electric Forward Refunding Revenue Bonds, Series 2000 2,635,599 2,886,875 Electric Forward Refunding Revenue Bonds, Series 2001 360,950 392,771 Series 2001 Loss on Refunding 60,627 60,626 Interest on Customer Deposits 194,367 109,429 FMPA Pooled Loan 53,021 15,553 Total Interest Expense 4,865,039$ 4,920,885$
UTILITY BOARD OF THE CITY OF KEY WEST, FLORIDA
NOTES TO FINANCIAL STATEMENTS
FOR THE YEARS ENDED SEPTEMBER 30, 2006 AND 2005
16
NOTE 1 - SUMMARY OF SIGNIFICANT ACCOUNTING POLICIES (Continued) Use of Estimates – The preparation of financial statements in conformity with generally accepted accounting principles requires management to make estimates and assumptions that affect the reported amounts of assets and liabilities and disclosure of contingent assets and liabilities at the date of the financial statements and the reported amounts of revenues and expenditures/expenses during the reporting period. Actual results could differ from those estimates. Net Assets – Equity is classified as net assets and displayed in three components:
Invested in Capital Assets, net of related debt – Consists of capital assets, net of accumulated depreciation and reduced by the outstanding balances of any bonds that are attributable to the acquisition, construction, or improvement of those assets.
Restricted for Working Capital – Consists of a restricted working capital deposit required by FMPA for participation in the All Requirements Project. Unrestricted – All other net assets that do not meet the definition of “restricted for debt service” or “invested in capital assets, net of related debt.” For the years ended September 30, 2006 and 2005, the board has designated $1.2 million and $954.2 thousand respectively, for certain future repair and replacement costs.
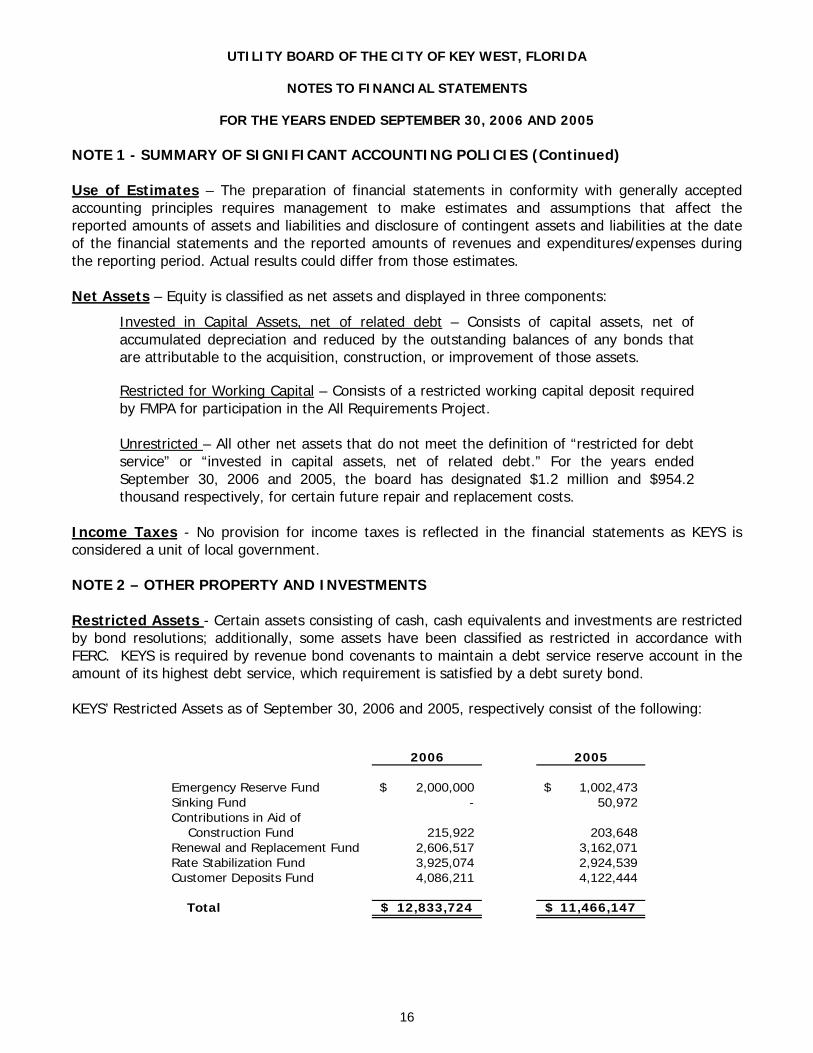
Income Taxes - No provision for income taxes is reflected in the financial statements as KEYS is considered a unit of local government. NOTE 2 – OTHER PROPERTY AND INVESTMENTS Restricted Assets - Certain assets consisting of cash, cash equivalents and investments are restricted by bond resolutions; additionally, some assets have been classified as restricted in accordance with FERC. KEYS is required by revenue bond covenants to maintain a debt service reserve account in the amount of its highest debt service, which requirement is satisfied by a debt surety bond. KEYS’ Restricted Assets as of September 30, 2006 and 2005, respectively consist of the following:
2006 2005
Emergency Reserve Fund 2,000,000$ 1,002,473$ Sinking Fund - 50,972Contributions in Aid of Construction Fund 215,922 203,648Renewal and Replacement Fund 2,606,517 3,162,071Rate Stabilization Fund 3,925,074 2,924,539Customer Deposits Fund 4,086,211 4,122,444
Total 12,833,724$ 11,466,147$

UTILITY BOARD OF THE CITY OF KEY WEST, FLORIDA
NOTES TO FINANCIAL STATEMENTS
FOR THE YEARS ENDED SEPTEMBER 30, 2006 AND 2005
17
NOTE 2 – OTHER PROPERTY AND INVESTMENTS (Continued) Restricted Deposits- Florida Municipal Power Agency (FMPA) has required a working capital contribution. As of September 30, 2006 and 2005, the deposit balance remained at $3,243,009.
NOTE 3 – CASH, CASH EQUIVALENTS, AND INVESTMENTS State Statutes govern KEYS’ investment policies. In addition, KEYS has its own investment practices. Monies must be deposited in banks designated as qualified public depositories by the State of Florida, Department of Insurance and Treasurer. Permissible investments include the obligations of the U.S. Treasury and U.S. agencies, certificates of deposit, commercial paper, repurchase agreements, and other securities meeting KEYS’ criteria for risk and return. Collateral is provided for demand deposits and certificates of deposit through the Florida Security for Public Deposits Act. This Act established guidelines for qualification and participation by banks and savings associations, procedures for the administration of the collateral requirements and characteristics of eligible collateral. Under the Act, the qualified public depository must pledge at least 50% of the average daily balance for each month of all public deposits in excess of any applicable deposit insurance. Additional collateral, up to a maximum of 125%, may be required if deemed necessary under the conditions set forth in the Act. Eligible collateral consists of obligations of the United States and its agencies and obligations of states and their political subdivisions, and unaffiliated corporations. Obligations pledged to secure deposits must be delivered to the State Treasurer or, with the approval of the State Treasurer, to a bank, savings association, or trust company provided a power of attorney is delivered to the Treasurer. On a monthly basis, the State Treasurer determines that the collateral has a market value adequate to cover the deposits under the provisions of the Act. For purposes of the statement of cash flows, KEYS considers all liquid investments (including restricted assets) with a maturity of three months or less when purchased to be cash equivalents. Interest Rate Risk – As a means of limiting its exposure to fair value losses arising from rising interest rates KEYS investment policy limits its portfolio to maturities of no more than five years unless matched to a specific cash flow. Credit Risk – KEYS general investment policy is to apply the prudent person rule: investments are made as a prudent person would be expected to act, with discretion and intelligence, to seek reasonable income, preserve capital and, in general avoid speculative investments. KEYS investment policy allows investments in U. S. Treasury, U. S. Agencies, and any U. S. state, certificates of deposits, repurchase agreements, and units of participation in the State of Florida Local Government Surplus Trust Fund.

UTILITY BOARD OF THE CITY OF KEY WEST, FLORIDA
NOTES TO FINANCIAL STATEMENTS
FOR THE YEARS ENDED SEPTEMBER 30, 2006 AND 2005
18
NOTE 3 – CASH, CASH EQUIVALENTS, AND INVESTMENTS (Continued) In addition to these, KEYS also allows investment in commercial paper which is rated at the time of purchase in the single highest classification by Moody’s and S&P and does not mature more than 270 calendar days after the date of purchase and agreements with a bank or insurance company which has an unsecured, uninsured and unguaranteed obligation (or claims-paying ability) rated “A3” or better by Moody’s and a rating of “A-“ or better by Standard & Poor’s. Deposits Custodial Credit Risk – Custodial credit risk is the risk that in the event of a bank failure, KEYS deposits may be returned. KEYS’ does not have a deposit policy for custodial risk. The carrying amount of KEYS’ deposits with financial institutions, as of September 30, 2006 and 2005, were $19,879,955 and $4,122,521 respectively, and the bank balances were $20,076,767 and $4,686,955, respectively. The bank balances were covered by federal depository insurance and for the amount in excess of such federal depository insurance, by the State of Florida’s Security of Public Deposits Act. The Act requires each qualified public depository to deposit with the State Treasurer eligible collateral equal to or in excess of the required collateral as determined by the provisions of the Act. In the event of a failure by a qualified public depository, losses in excess of federal depository insurance and proceeds from the sale of securities pledged by the depository are assessed against the other qualified public depositories of the same type as the depository in default. In addition, KEYS’ deposits with the Florida State Board of Administration Pooled Investment Fund, as of September 30, 2006 and 2005, were $0 and $13,491,800 respectively. During 2006, KEYS’ transferred all deposits held with the Florida State Board of Administration Pooled Investment Fund to local financial institutions in order to take advantage of more attractive interest rates. NOTE 4 – NON-CURRENT ASSETS Other Receivable – The Key West Steam Plant was decommissioned in 1991. In Fiscal Year 2005 the developer received all the permitting and financing to begin construction, to redevelop the Steam Plant site. The Utility Board executed two 99 year lease agreements in 2005 one with Steam Plant Condominiums, LLC for 19 luxury condominiums and one with Old Town Key West Development, LLC for 38 affordable housing units. Due to the four hurricanes in 2005, the completion date for both housing projects has been extended to late 2007. The sale of the Steam Plant resulted in an extraordinary gain of $4,568,719 in Fiscal Year 2006. The sale also resulted in four long term lease receivables totaling $7,942,212. The leases are as follows: 1) base rent of the luxury units for $6,264,920 due at the end of construction, 2) initial rent of $500,000 due 42 months after execution of lease, 3) percentage rent of luxury units of $1,177,205 with a percentage due after sale and/or occupancy of unit, and 4) affordable rent of $87 due at the end of construction.

UTILITY BOARD OF THE CITY OF KEY WEST, FLORIDA
NOTES TO FINANCIAL STATEMENTS
FOR THE YEARS ENDED SEPTEMBER 30, 2006 AND 2005
19
NOTE 4 – NON-CURRENT ASSETS (Continued) Other Receivable – Summary of Lease Receivable is as follows:
Year Receivable2007 1,871,487$ 2008 95,650 2009 94,670 2010 93,700 Lease Receivable - Current - 2011 92,740
2012 - 2104 5,693,965 Lease Receivable - Long Term 7,942,212 Total Lease Receivable 7,942,212$ Total Lease Receivable 7,942,212$
Summary of Lease Receivable
NOTE 5 – LONG-TERM DEBT Net Revenues, as defined for purposes of bond security, is all income or earnings derived from the operation of KEYS, except Capital Improvement Charges, investment earnings on Construction and Bond Amortization Funds, and transfers to the Rate Stabilization Fund, less costs of operation and maintenance which do not include capital expenditures, extraordinary repairs, amortization of the costs of issuance of debt obligations, payments under Unconditional Output Contracts, or depreciation. See Note 6 for the rate covenant pertaining to revenues.
Summary of Debt Service Funding Requirements to Maturity
Payment 12 mosending October 1, Principal Interest Total
2007 5,755,000$ 2,697,000$ 8,452,000$ 2008 6,005,000 2,382,000 8,387,000 2009 6,340,000 2,052,000 8,392,000 2010 6,695,000 1,689,000 8,384,000 2011 7,090,000 1,305,000 8,395,000
2012 - 2016 20,615,000 23,972,000 44,587,000 2017 - 2018 2,883,000 15,657,000 18,540,000
Total 55,383,000$ 49,754,000$ 105,137,000$
Prior to the due date of each series of revenue bonds, KEYS is required to set aside sufficient funds to retire the matured principal amounts in equal, monthly amounts. Accordingly, the above schedule does not include principal amounts maturing October 1, 2006, as those funding requirements have been fully satisfied.

UTILITY BOARD OF THE CITY OF KEY WEST, FLORIDA
NOTES TO FINANCIAL STATEMENTS
FOR THE YEARS ENDED SEPTEMBER 30, 2006 AND 2005
20
NOTE 5 – LONG-TERM DEBT (Continued) Changes in Long-Term Debt during Fiscal 2006 are as follows:
2005 Additions Retired 2006Series 1991 8,077,785$ -$ -$ 8,077,785$ Series 2000 48,900,000 - 4,370,000 44,530,000 Series 2001, net 8,678,217 - 799,373 7,878,844 FMPA 1,185,000 - 237,000 948,000
Total 66,841,002$ -$ 5,406,373$ 61,434,629$
Revenue Bonds: 2006 2005.
Electric System Refunding Revenue Bonds, Series 1991, collateralized by Net Revenues and certain Reserve Funds, payable October 1, 2006 to October 1, 2018 in installments of various amounts, bearing interest at rates from 7.05% to 7.10%.
$ 8,077,785
$ 8,077,785
Electric System Refunding Revenue Bonds, Series 2000, collateralized by Net Revenues and certain Reserve Funds, payable October 1, 2006 to October 1, 2013 in installments of various amounts, bearing interest at rates from 5.75% to 6.00%.
44,530,000
48,900,000
Electric System Refunding Revenue Bonds, Series 2001, collateralized by Net Revenues and certain Reserve Funds, payable from October 1, 2006 to October 1, 2013 in installments of various amounts, interest at rates from 3.70% to 4.62%.
8,290,000
9,150,000
Deferred Loss on Refunding-net, amortized on the straight line basis over the term of the Series 2001 Revenue Bonds
(411,156)
(471,783)
Loan Payable: Loan from the Florida Municipal Power Agency, collateralized by a lien upon and pledge of the Net Revenues of KEYS subordinate to the claims of KEYS’ bonds on the Net Revenues. The payment date of March 15, 2006 was extended and refunded in Series 2006 bond issuance.
948,000
1,185,000
Total Long-Term Debt 61,434,629 66,841,002 Less Current Portion 5,454,373 5,169,373 Net Long-Term Debt $ 55,980,256 $61,671,629

UTILITY BOARD OF THE CITY OF KEY WEST, FLORIDA
NOTES TO FINANCIAL STATEMENTS
FOR THE YEARS ENDED SEPTEMBER 30, 2006 AND 2005
21
NOTE 6 – PRIOR YEAR DEFEASANCE OF DEBT During 1986, 1987, 1991, 1995, 2000 and 2001, KEYS defeased certain revenue bonds by placing proceeds of new bonds in an irrevocable trust to provide for all future debt service payments of the old bonds. Accordingly, the trust account assets and the liability for the defeased bonds are not included in KEYS’ financial statements. At September 30, 2006, $26,444,468 of bonds outstanding relative to the 1980C, 1983, 1984 and 1980D issues, $15,786,016 relative to the 1985 issue, $11,863,443 relative to the 1987 issue, $14,516,919 relative to the 1988 issue, and $7,480,000 relative to the 1991 issue are considered defeased. NOTE 7 – RATE COVENANT KEYS has agreed to establish and revise rates such that revenues will be sufficient to pay 100% of its costs of operations and maintenance, all required reserve payments, and 125% of the principal and interest becoming due on all outstanding bonds. NOTE 8 – PENSION PLAN Plan Description - The Retirement System for General Employees (the Plan) is a single-employer defined benefit pension plan administered by the Board of Trustees of the Plan. The Plan provides retirement, disability and death benefits to plan members and beneficiaries. Cost of living adjustments are automatically provided to members and beneficiaries. Commencing January 1, 2001, and every year thereafter, the rate will be increased from 2% to 3%. The Plan was created by resolution of the Utility Board, which the Plan by resolution assigns the authority to establish and amend its provisions to the Utility Board. The Plan issues a publicly available financial report that includes financial statements and required supplementary information for the Plan. That report may be obtained by writing to the Retirement System for General Employees, P.O. Drawer 6100, Key West, FL 33041-6100. Basis of Accounting - The financial statements of the Plan are prepared using the accrual basis of accounting. KEYS’ contributions are recognized when due and a formal commitment to provide the contributions has been made. Benefits are recognized when due and payable in accordance with the terms of the Plan. Plan investments are reported at fair value. Short-term investments are reported at cost, which approximates fair value. Securities traded on a national or international exchange are valued at the last reported sales price at current exchange rates. Plan investments do not include any of KEYS’ debt securities. All investments represent less than 5% of Plan net assets. Funding Policy – The contribution requirements of plan members and KEYS are established and may be amended by the Utility Board. Plan members have not been required to contribute to the Plan since October 1, 1985. A former member who takes a refund of accumulated contributions and who is later re-employed by KEYS within three years of his termination of service shall have the right to repay the Plan for amounts received. Upon such re-payment, the member shall receive credit for his years of credited service as of his last termination date. KEYS is required to contribute at a rate based on the annual actuarial valuation, which indicates the minimum required contribution.

UTILITY BOARD OF THE CITY OF KEY WEST, FLORIDA
NOTES TO FINANCIAL STATEMENTS
FOR THE YEARS ENDED SEPTEMBER 30, 2006 AND 2005
22
NOTE 8 – PENSION PLAN (Continued) The minimum required contribution rate of covered payroll would be adjusted to include any benefit changes approved by the Utility Board. Pension overpayment- During Fiscal 2004, KEYS identified benefit calculation errors resulting in overpayment of benefits over several years for a group of retirees. KEYS is currently examining the effects of these miscalculations and determining a plan of action to remedy the overpayments. Effective October 1, 2004, KEYS corrected the benefit calculations to preclude subsequent overpayments. Schedule of Funding Progress – KEYS’ annual contribution for the calendar year 2006 of $2,343,090 (30.7%) was determined as part of the January 1, 2006 actuarial valuation using the entry age normal actuarial cost method. The actuarial also stated another cost method that the Board opted to use with an annual contribution rate of 28.7%. The actuarial assumptions included (a) 8.0% investment rate of return and (b) projected salary increases of 5.5% per year. Both (a) and (b) included an inflation component of 3.0%. The actuarial value of the Plan assets is the fair value of assets as reported in the Plan financial statements. The unfunded actuarial accrued liability is being amortized as a level payment on a closed basis. The remaining amortization period at January 1, 2006 was 30 years. KEYS had an unfunded actuarial accrued liability of $6,737,730 and $4,475,017 as of January 1, 2006 and 2005 respectively. The net pension obligation was $(77,580) at December 31, 2005. KEYS has accepted the negative pension obligation and this will be adjusted through the Annual Required Contribution calculation in the next fiscal year.
(1) (2) (3) (4) (5) (6) (7)Actuarial Entry Age Actuarial UAAL as aValuation Actuarial Accrued Unfunded Percentage
Date Value of Liability AAL Funded Covered of CoveredJanuary 1, Assets (AAL) (UAAL) Ratio Payroll Payroll
1997 34,436$ 33,475$ (961)$ 102.9% 5,866$ -16.4%1998 40,933$ 34,826$ (6,107)$ 117.5% 6,038$ -101.1%1999 48,032$ 40,295$ (7,737)$ 119.2% 6,127$ -126.3%2000 53,398$ 41,776$ (11,622)$ 127.8% 6,168$ -188.4%2001 52,329$ 48,646$ (3,683)$ 107.6% 6,398$ -57.6%2002 49,513$ 50,730$ 1,217$ 97.6% 6,764$ 18.0%2003 50,459$ 52,434$ 1,975$ 96.2% 6,845$ 28.9%2004 51,439$ 55,408$ 3,969$ 92.8% 6,898$ 57.5%2005 53,036$ 57,511$ 4,475$ 92.2% 6,934$ 64.5%2006 54,266$ 61,004$ 6,738$ 89.0% 7,644$ 88.1%

UTILITY BOARD OF THE CITY OF KEY WEST, FLORIDA
NOTES TO FINANCIAL STATEMENTS
FOR THE YEARS ENDED SEPTEMBER 30, 2006 AND 2005
23
NOTE 8 – PENSION PLAN (Continued)
Annual Pension Cost and Net Pension Obligation (NPO)
PercentageCalendar Annul Pension APC Net PensionYear Cost (APC) Contributed Obligation 2005 2006
Annual Required Contribution (ARC) 1,979,201$ 2,343,090$ 1997 673,467$ 132% -$ Interest on NPO (3,406) (6,206) 1998 616,835$ 214% -$ Adjustment to ARC 3,816 6,891 1999 624,849$ 212% -$ APC 1,979,611$ 2,343,775$ 2000 384,057$ 268% -$ Utility Board Contribution (2,014,613) 2001 1,245,998$ 100% -$ Increase (Decrease) in NPO (35,002) 2002 1,673,299$ 102% (26,551)$ NPO (beginning of year) (42,578) 2003 1,644,221$ 101% (42,957)$ NPO (end of year) (77,580) 2004 1,911,019$ 100% (42,578)$ 2005 1,979,611$ 102% (77,580)$
Historical Trend Information
NOTE 9 – LEASES Rent expense under cancelable operating leases related to copiers, mailing equipment and time clocks was $179,882 and $109,443 in 2006 and 2005. NOTE 10 - PURCHASED POWER COMMITMENTS All Requirements Power Supply Project – In July 1997, KEYS agreed to become a member of the Florida Municipal Power Agency (FMPA) All-Requirements Power Supply Project (the “All-Requirements Project”) and began operations as a project participant effective April 1, 1998. Under the contractual arrangement with FMPA, KEYS has assigned all of its generating and firm purchased power resources to FMPA, and FMPA will serve all of KEYS’ requirements (net of up to 2 MW of non-firm capacity when available from the local resource recovery facility). Further, in the event that power cannot be delivered to the KEYS’ service area over the tie line to the mainland, KEYS established a policy to have island generation capability equal to at least 60% of KEYS’ peak load. KEYS and FMPA have agreed to meet these criteria through a combination of KEYS’ 43.4 MW of existing generating resources and three combustion turbine units that are owned by FMPA, which currently total 79.7 MW. As part of the All-Requirements Project contract, the Florida Municipal Power Agency is required to maintain generation assets within KEYS’ Service Area equal to or above 60 percent of the KEYS’ load. Florida Municipal Power Agency purchased a General Electric LM 6000 (CT #4) capable of producing 43 MW that went on line in 2006, allowing KEYS to retire the Big Pine and Cudjoe High Speed Diesels (7 MW). The FMPA All-Requirements Project, the related assignment of resources by KEYS to FMPA, and other matters pertaining to KEYS’ power supply are discussed in the paragraphs following. KEYS has previously entered into several purchased power agreements with other parties including (i) the FMPA Tri-City Project, (ii) the FMPA Stanton 2 Project; and (iii) a long-term purchase agreement with FPL. As a member of the All-Requirements Project, KEYS’ resources and costs under these three contracts have been assigned to FMPA.

UTILITY BOARD OF THE CITY OF KEY WEST, FLORIDA
NOTES TO FINANCIAL STATEMENTS
FOR THE YEARS ENDED SEPTEMBER 30, 2006 AND 2005
24
NOTE 10 - PURCHASED POWER COMMITMENTS (Continued) Other power purchase and sale arrangements include KEYS’ purchases from a small resource recovery unit located on Stock Island, sale of power to FKEC, and interchange service agreements with other Florida utilities and with power marketers. KEYS appoints one representative to FMPA’s Board of Directors, which governs the Agency’s activities. The governance of rates charged to members includes the All-Requirements Project Committee (KEYS has one vote) and the FMPA Board of Directors (KEYS’ vote is weighted based on KEYS’ net energy for load). FMPA Tri-City Project (Stanton 1) – KEYS is a member of the FMPA Tri-City Project (Stanton 1). KEYS and FMPA have entered into a Tri-City Project Power Sales Contract and a Tri-City Project Support Contract wherein KEYS has agreed to purchase 54.546% of FMPA’s Tri-City Project. FMPA’s Tri-City Project consists of a 5.3012% undivided ownership interest in Curtis H. Stanton Energy Center (“Stanton”) unit No. 1, a 425 MW coal-fired generating unit jointly owned by the Orlando Utilities Commission (“OUC”), the Kissimmee Utility Authority, and FMPA, and operated by the OUC. Stanton Unit No. 1 began commercial operation in July 1987. Based upon the unit’s high dispatch rating of 425 MW, the Tri-City Project consists of a 22 MW undivided ownership and KEYS’ power entitlement share is approximately 12 MW at the plant bus bar. FMPA Stanton 2 Project – KEYS is a member of the FMPA Stanton 2 Project. KEYS and FMPA have entered into a Stanton 2 Project Power Sales Contract and a Project Support Contract wherein KEYS has agreed to purchase 9.8932% of FMPA’s Stanton 2 Project. FMPA’s Stanton 2 Project consists of a 23.2367% undivided ownership interest in Stanton Unit No. 2, a 429 MW coal-fired generating unit jointly owned by OUC and FMPA, and operated by OUC. Stanton Unit No. 2 began commercial operation in June 1996. Based on the unit’s 429 MW high dispatch rating, the Stanton 2 Project consists of 100 MW undivided ownership and KEYS’ power entitlement share is approximately 9.9 MW at the plant bus bar. Florida Power & Light (FPL) Long-Term Purchase – KEYS entered into an agreement with FPL on August 15, 1991, entitled the Long-Term Agreement to Provide Capacity and Energy by Florida Power & Light Company to Keys Energy Services, the Utility Board of the City of Key West, Florida (the “FPL Long-Term Agreement”) which became effective on June 1, 1993 after the termination of a short-term purchase agreement with FPL. The FPL Long-Term Agreement will continue in effect for 20 years. The initial purchase amount (the “Initial Contract Demand”) is 45 MW. The contract demand for each year is to be designated by September 1 of each prior year, but the contract demand cannot be less than the initial contract demand during the term of the agreement. In the event KEYS’ peak load during a year is lower than the KEYS peak load in the immediately preceding year, KEYS may decrease the portion of its contract demand in excess of the Initial Contract Demand, subject to certain limitations. NOTE 11 – COMMITMENTS AND CONTINGENCIES Risk Management - KEYS is exposed to various risks of loss related to torts, damage, theft or destruction of assets, errors or omissions, injuries to employees, and natural disasters. KEYS purchases commercial insurance policies from a commercial insurance carrier and other insurance carriers to minimize its risk of loss in these areas.

UTILITY BOARD OF THE CITY OF KEY WEST, FLORIDA
NOTES TO FINANCIAL STATEMENTS
FOR THE YEARS ENDED SEPTEMBER 30, 2006 AND 2005
25
NOTE 11 – COMMITMENTS AND CONTINGENCIES (Continued) KEYS’ has not experienced an insurance settlement in excess of insurance coverage during the past four fiscal years. KEYS’ bears the risk of loss up to the deductible amounts, which are disclosed in the accompanying statistical tables. NOTE 12 - NAVY CONTRACT The United States Navy is the largest customer of KEYS and accounted for approximately 9.2% and 10.4% of kilowatt hours sold in Fiscal 2006 and 2005 respectively. KEYS’ contract with the Navy is for a term of five years with a provision which requires the parties to commence negotiations for a new contract at least two years prior to the end of the current contract. The contract also contains provisions for minimum billing, service reduction and exclusive service provisions. Pursuant to this contract, KEYS has agreed to provide a maximum of 15 megawatts of power at multiple locations. KEYS executed an amendment to the Navy’s service contract on December 8, 1999, which modified the existing rate schedule. The term of the contract was extended to September 1, 2004 subject to certain termination and renegotiation provisions. On February 17, 2004, both parties agreed that this contract shall continue in effect through September 1, 2007. All terms and conditions remain unchanged and in full force and effect. KEYS submitted a proposal on June 18, 2003 in response to the Department of the Navy’s Solicitation No. N62467-00-R-1801 to privatize electric systems at NAS Key West. In January 2005, the Navy notified KEYS that it had been selected as a best value respondent to the Navy’s solicitation. However, after several months of negotiations, the parties were not able to reach agreement on the terms and conditions of the privatization contract between the Navy and KEYS. NOTE 13 – REGULATION According to existing laws of the State of Florida, the five members of the Utility Board act as the regulatory authority for the establishment of electric rates. The Florida Public Service Commission (FPSC) has authority to regulate the electric "rate structures" of municipal utilities in Florida. It is believed that "rate structures" are clearly distinguishable from the total amount of revenues which a particular utility may receive from rates, and that distinction has thus far been carefully made by the FPSC. Prior to implementation of any rate change, KEYS files the proposed tariff with the Florida Public Service Commission and has established the prerequisite of a Public Notice and the holding of a Public Hearing. The Florida Electric Power Plant Siting Act has given the FPSC exclusive authority to approve the construction of new power plants. The FPSC also exercises jurisdiction under the National Energy and the Florida Energy Efficiency and Conservation Acts as related to electric use conservation programs and prescribes conformance to the Federal Energy Regulatory Commission's Uniform System of Accounts.

UTILITY BOARD OF THE CITY OF KEY WEST, FLORIDA
NOTES TO FINANCIAL STATEMENTS
FOR THE YEARS ENDED SEPTEMBER 30, 2006 AND 2005
26
NOTE 13 – REGULATION (Continued) Operations of KEYS are subject to environmental regulation by Federal, State and local authorities and to zoning regulations by local authorities. Federal and State standards and procedures that govern control of the environment can change. These changes can arise from continuing legislative, regulatory, and judicial action respecting the standards and procedures. Therefore, there is no assurance that the electric plant in operation, under construction or contemplated will always remain subject to the regulations currently in effect, or will always comply with future regulations. An inability to comply with environmental standards or deadlines could result in reduced operating levels or complete shutdown of individual electric generating units not in compliance. Furthermore, compliance with environmental standards or deadlines may substantially increase capital and operating costs. NOTE 14 – POST EMPLOYMENT HEALTH CARE BENEFITS In addition to providing pension benefits, KEYS provides life insurance and health care benefits for retired employees. These benefits are provided pursuant to KEYS’ personnel policies as adopted by the Utility Board. KEYS is not required to provide contributions to this benefit by any statutory, contractual or other authority. KEYS employees hired before June 9, 1999 are eligible for these benefits if they qualify for retirement status while working for KEYS. At September 30, 2006, 120 retirees were eligible for and were receiving these benefits. These and similar benefits for active employees are provided through an insurance company whose premiums are based on the benefits paid during the year. KEYS recognizes the cost of providing these benefits on a pay-as-you-go basis by expensing the insurance premiums for retirees, which were $953,344 and $876,797 for 2006 and 2005, respectively. NOTE 15 – PAYMENT TO THE CITY OF KEY WEST KEYS is the successor of the electric public utility once owned by the City. All electric utility property owned by the City of Key West was transferred to KEYS at the time of KEYS’ creation. KEYS pays the City an annual amount as a return on the City’s contribution to KEYS. Paragraph (11) of Section 3.03 (B) of the Original Resolution 532 was amended on September 8, 1999 by Resolution 678 to be effective for the amount paid in 2001. The Board will pay to the City a sum equal to the greater of (a) $200,000 (adjusted annually for changes in the Consumer Price index or (b) one percent (1%) of the Gross Revenues derived from sales of electricity at retail (exclusive of Power Cost Revenues which are defined as (i) revenues determined by reference to the power cost component of base rates, plus or minus (ii) power cost adjustment charges or credits.) The annual payments were $343,341 and $340,548 for 2006 and 2005, respectively.

UTILITY BOARD OF THE CITY OF KEY WEST, FLORIDA
NOTES TO FINANCIAL STATEMENTS
FOR THE YEARS ENDED SEPTEMBER 30, 2006 AND 2005
27
NOTE 16 – SPECIAL ITEMS On October 24, 2005, Hurricane Wilma struck the Florida Keys causing an estimated $3.1 million in damages, most of which was to the transmission and distribution system. Grants were received from the Florida Department of Community Affairs (DCA) and the Federal Emergency Management Agency (FEMA) which will reimburse 87.5% of eligible costs. NOTE 17 – SUBSEQUENT EVENT On October 31, 2006, KEYS issued $42.0 million of Electric System Refunding and Capital Improvement Revenue Bonds, Series 2006. The bonds refunded the FMPA loan of $948,000 and will fund several capital projects, including a pole hardening program, transmission and distribution improvements, a new substation located in Stock Island, installation of new feeders at the Big Pine substation, replace certain substation transformers and install fin fan coolers at the Stock Island Generating Facilities. The issue is rated AAA by Standard & Poor’s (S&P) and Fitch and Aaa by Moody’s and is insured by the MBIA Insurance Company. In addition, KEYS obtained an underlying bond rating of A2 from Moody’s and A- from S&P.

UTILITY BOARD OF THE CITY OF KEY WEST, FLORIDA
SCHEDULE OF REVENUES EARNED
FOR THE YEARS ENDED SEPTEMBER 30, 2006 AND 2005
28
2006 2005
Operating Revenues:Electric Revenues 59,750,375$ 60,954,878$ Power Cost Adjustment 34,217,993 19,451,323 Service Charges 134,068 141,677 Penalty Charges 470,133 482,655 Reserve Capacity 1,804,033 2,029,173 Other 94,525 291,876 Charges for New Service 728,938 127,154
Total 97,200,065 83,478,736
Other Income:Interest 1,047,716 613,525 Grant Revenue - 119,367 Hurricane-Grant Revenue 3,281,600 1,900,702 Hurricane-Insurance Proceeds 273,306 - CT#1 Insurance Proceeds 781,813 - Pole Attachment 368,669 188,516 FKEC Audit Revenue 231,637 - DOE Crude Oil Refund 145,416 - Generating Unit Expense Reimbursement 189,742 22,545 Tree Trimming 92,565 81,573 KW Steam Plant Rental Income 173,348 - Miscellaneous Non-Operating Revenue 271,978 460,988
Total Other Income 6,857,790 3,387,216
Total Revenues 104,057,855$ 86,865,952$
The accompanying notes are an integral part of these financial statements.

UTILITY BOARD OF THE CITY OF KEY WEST
SCHEDULE OF REVENUES AND EXPENDITURES – BUDGET TO ACTUAL
FOR THE YEAR ENDED SEPTEMBER 30, 2006
29
Variance-Year to Date Favorable
Original Current Actual (Unfavorable)
RevenuesOperating Revenues 83,151,423$ 95,890,056$ 93,968,368$ (1,921,688)$ Other Operating Revenues 4,722,805 4,997,805 3,231,697 (1,766,108)Interest Income 559,085 632,841 1,047,716 414,875 Grant Revenue - - - - Hurricane - Grant Revenue - - 3,281,600 3,281,600 Hurricane - Insurance Proceeds 273,306 273,306 Non-Operating Revenues 600,988 958,806 2,255,168 1,296,362
Total Budget Revenue 89,034,301 102,479,508 104,057,855 1,578,347
ExpendituresProduction Expenses - Diesel 1,159,817 1,531,783 1,482,077 49,706 Purchased Power 51,121,682 63,541,863 59,946,424 3,595,439 Transmission Expenses 3,778,672 3,914,606 3,539,845 374,761 Distribution Expenses 4,056,412 3,755,708 3,366,439 389,269 Customer Accounts and Collection Expenses 1,085,996 1,089,361 1,243,322 (153,961) Customer Deposit Interest 118,852 118,852 194,367 (75,515) Administrative and General Expenses 13,708,055 13,467,890 15,153,075 (1,685,185) Hurricane-Expenses - 379,298 3,094,972 (2,715,674) Senior Lien Debt Service 8,451,538 8,451,538 8,511,550 (60,012) Junior Lien Debt Service 836,933 836,933 290,020 546,913 Dividend to City of Key West 320,297 320,297 343,341 (23,044)
Total Expenditures 84,638,254 97,408,129 97,165,432 242,697
Excess of Revenues Over Expenditures 4,396,047$ 5,071,379$ 6,892,423 (1,821,044)$
AdjustmentsDepreciation (6,182,488) Principal Portion of Budgeted Debt Service 5,752,000 Capitalized Overhead 1,232,601 Interest Accrued but Unfunded (1,560,475) Amortization of Issuance Costs (104,508) Capital Contributions 85,983 Amortization of Loss on Refunding (60,627)
Change in Net Assets, GAAP Basis 6,054,909$
Annual Budget
The accompanying notes are an integral part of these financial statements.

30
UTILITY BOARD OF THE CITY OF KEY WEST
STATISTICAL SECTION
This part of the Keys Energy Services’ (KEYS) Comprehensive Annual Financial Report presents detailed information as a context for understanding what the data in the financial statements, note disclosure, and required supplementary information says about KEYS overall financial health.
Financial Trends – These schedules contain trend information to help the reader understand how KEYS financial performance and well being has changed over time.
Revenue Capacity – These schedules contain information to help the reader assess KEYS local revenue source.
Debt Capacity – These schedules present information to help the reader assess KEYS debt burden and its ability to issue additional debt in the future.
Demographic and Economic Information – This schedule offers demographic and economic indicators to help the reader understand the environment in which KEYS financial activities take place.
Operating Information – These schedules contain service and infrastructure data to help the reader understand how the information in KEYS financial report relates to the services KEYS provides and the activities it performs.

UTILITY BOARD OF THE CITY OF KEY WEST, FLORIDA
FINANCIAL TRENDS
CONDENSED BALANCE SHEETS
FISCAL YEARS 2006 - 1997
31
Restated Restated2006 2005 2004 2003 2002 2001 2000 1999 1998 1997
ASSETS
Current AssetsCash and Investments 7,064,406$ 6,657,203$ 5,950,771$ 5,897,131$ 6,094,567$ 1,764,083$ 2,297,708$ 3,650,143$ 499,288$ 461,415$
Accounts Receivable, net 6,152,177 5,729,570 5,252,346 4,317,862 4,514,931 6,723,727 5,890,221 5,573,281 6,529,459 5,113,076
Plant Material and Operating Supplies Inventory 2,722,320 2,454,805 2,659,814 2,496,248 3,408,455 3,282,355 2,938,287 2,470,040 1,846,655 2,341,763
Other Current Assets 9,237,560 10,203,625 1,483,817 1,159,438 809,915 355,942 545,171 529,614 565,305 551,016 Total Unrestricted Current Assets 25,176,463 25,045,203 15,346,748 13,870,679 14,827,868 12,126,107 11,671,387 12,223,078 9,440,707 8,467,270
Cash and Investments-Restricted 12,833,724 11,466,147 19,538,828 19,329,440 22,871,985 26,276,639 31,743,510 34,143,717 29,035,302 27,128,557 Interest Receivable - - - - - 43,320 368,358 287,446 358,881 277,051 Total Restricted Current Assets 12,833,724 11,466,147 19,538,828 19,329,440 22,871,985 26,319,959 32,111,868 34,431,163 29,394,183 27,405,608
Total Current Assets 38,010,187 36,511,350 34,885,576 33,200,119 37,699,853 38,446,066 43,783,255 46,654,241 38,834,890 35,872,878
Non Current AssetsCapital Assets Net Utility Plant 113,676,371$ 111,804,113$ 111,753,669$ 110,314,331$ 110,624,848$ 110,529,716$ 100,127,962$ 99,348,305$ 100,200,302$ 103,184,142$ Construction in Progress 1,156,438 2,307,807 3,278,081 5,021,562 2,336,476 2,158,024 5,994,178 4,116,931 8,645,799 4,752,830 Total Net Capital Assets 114,832,809 114,111,920 115,031,750 115,335,893 112,961,324 112,687,740 106,122,140 103,465,236 108,846,101 107,936,972
Other Property Net Non-Utility Plant - - 3,009,773 3,009,773 3,009,773 3,009,773 3,009,773 3,009,773 3,009,773 3,009,773 Total Other Property - - 3,009,773 3,009,773 3,009,773 3,009,773 3,009,773 3,009,773 3,009,773 3,009,773
Restricted Non-Current Assets Deposits-Restricted 3,243,009 3,243,009 3,243,009 1,621,505 - - - - - - Total Restricted Non-Current Assets 3,243,009 3,243,009 3,243,009 1,621,505 - - - - - -
Unrestricted Non-Current Assets Investments - - 44,075 554,913 1,035,667 4,506,094 3,929,257 - - - Other Accounts Receivable 7,942,212 7,768,864 - - - - - - - - Deferred Charges 804,746 909,254 1,013,762 1,118,270 1,222,778 1,481,546 1,796,124 2,300,242 2,489,749 2,619,118 Total Unrestricted Non-Current Assets 8,746,958 8,678,118 1,057,837 1,673,183 2,258,445 5,987,640 5,725,381 2,300,242 2,489,749 2,619,118
Total Non-Current Assets 126,822,776 126,033,047 122,342,369 121,640,354 118,229,542 121,685,153 114,857,294 108,775,251 114,345,623 113,565,863
Total Assets 164,832,963$ 162,544,397$ 157,227,945$ 154,840,473$ 155,929,395$ 160,131,219$ 158,640,549$ 155,429,492$ 153,180,513$ 149,438,741$
(Continued)
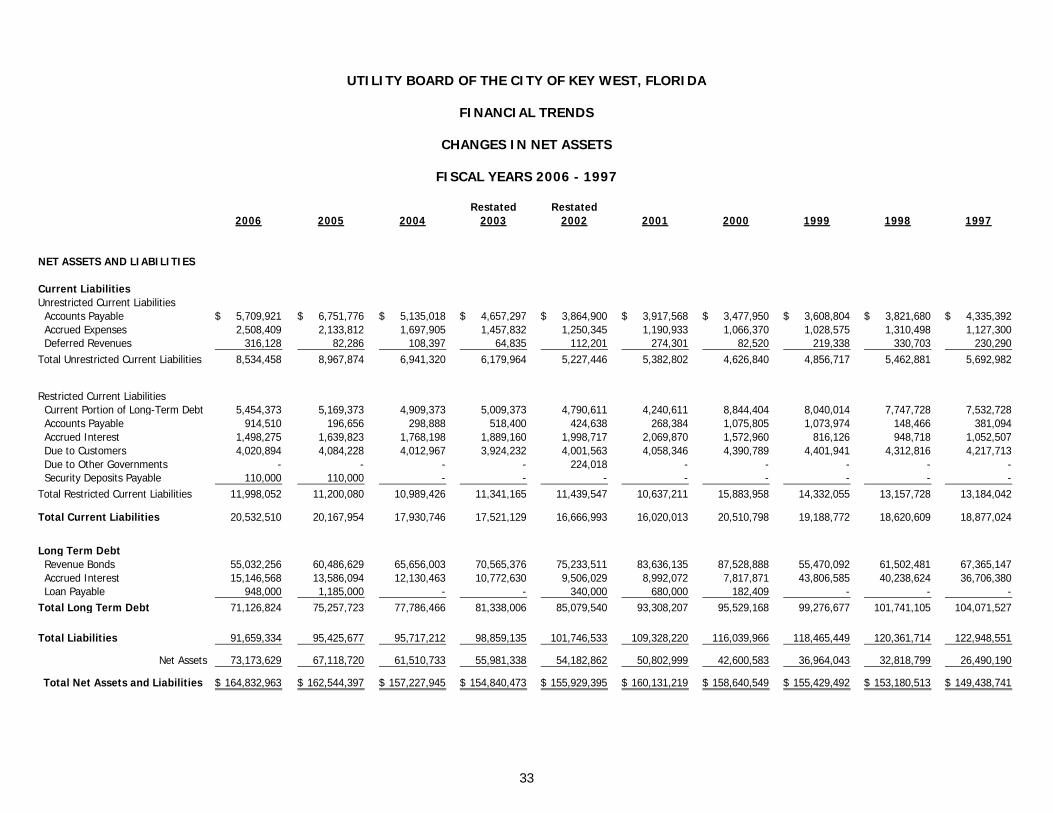
UTILITY BOARD OF THE CITY OF KEY WEST, FLORIDA
FINANCIAL TRENDS
CHANGES IN NET ASSETS
FISCAL YEARS 2006 - 1997
33
Restated Restated2006 2005 2004 2003 2002 2001 2000 1999 1998 1997
NET ASSETS AND LIABILITIES
Current LiabilitiesUnrestricted Current Liabilities Accounts Payable 5,709,921$ 6,751,776$ 5,135,018$ 4,657,297$ 3,864,900$ 3,917,568$ 3,477,950$ 3,608,804$ 3,821,680$ 4,335,392$ Accrued Expenses 2,508,409 2,133,812 1,697,905 1,457,832 1,250,345 1,190,933 1,066,370 1,028,575 1,310,498 1,127,300 Deferred Revenues 316,128 82,286 108,397 64,835 112,201 274,301 82,520 219,338 330,703 230,290 Total Unrestricted Current Liabilities 8,534,458 8,967,874 6,941,320 6,179,964 5,227,446 5,382,802 4,626,840 4,856,717 5,462,881 5,692,982
Restricted Current Liabilities Current Portion of Long-Term Debt 5,454,373 5,169,373 4,909,373 5,009,373 4,790,611 4,240,611 8,844,404 8,040,014 7,747,728 7,532,728 Accounts Payable 914,510 196,656 298,888 518,400 424,638 268,384 1,075,805 1,073,974 148,466 381,094 Accrued Interest 1,498,275 1,639,823 1,768,198 1,889,160 1,998,717 2,069,870 1,572,960 816,126 948,718 1,052,507 Due to Customers 4,020,894 4,084,228 4,012,967 3,924,232 4,001,563 4,058,346 4,390,789 4,401,941 4,312,816 4,217,713 Due to Other Governments - - - - 224,018 - - - - - Security Deposits Payable 110,000 110,000 - - - - - - - - Total Restricted Current Liabilities 11,998,052 11,200,080 10,989,426 11,341,165 11,439,547 10,637,211 15,883,958 14,332,055 13,157,728 13,184,042
Total Current Liabilities 20,532,510 20,167,954 17,930,746 17,521,129 16,666,993 16,020,013 20,510,798 19,188,772 18,620,609 18,877,024
Long Term Debt Revenue Bonds 55,032,256 60,486,629 65,656,003 70,565,376 75,233,511 83,636,135 87,528,888 55,470,092 61,502,481 67,365,147 Accrued Interest 15,146,568 13,586,094 12,130,463 10,772,630 9,506,029 8,992,072 7,817,871 43,806,585 40,238,624 36,706,380 Loan Payable 948,000 1,185,000 - - 340,000 680,000 182,409 - - - Total Long Term Debt 71,126,824 75,257,723 77,786,466 81,338,006 85,079,540 93,308,207 95,529,168 99,276,677 101,741,105 104,071,527
Total Liabilities 91,659,334 95,425,677 95,717,212 98,859,135 101,746,533 109,328,220 116,039,966 118,465,449 120,361,714 122,948,551
Net Assets 73,173,629 67,118,720 61,510,733 55,981,338 54,182,862 50,802,999 42,600,583 36,964,043 32,818,799 26,490,190
Total Net Assets and Liabilities 164,832,963$ 162,544,397$ 157,227,945$ 154,840,473$ 155,929,395$ 160,131,219$ 158,640,549$ 155,429,492$ 153,180,513$ 149,438,741$

UTILITY BOARD OF THE CITY OF KEY WEST, FLORIDA
FINANCIAL TRENDS
CHANGES IN NET ASSETS
FISCAL YEARS 2006 - 1997
33
Restated Restated2006 2005 2004 2003 2002 2001 2000 1999 1998 1997
RevenuesUtility Activities:
Charges for Electric:Customer Charge 2,097,779 2,106,597 2,076,473 2,062,558 2,046,854 2,027,916 1,919,513 1,552,443 1,556,088 1,513,985 Energy 50,721,562 52,074,914 52,842,391 51,946,140 50,539,343 49,849,743 48,867,233 39,521,839 39,614,633 38,542,775 Demand 4,586,551 4,767,462 4,741,167 4,774,887 4,636,591 4,480,583 4,464,433 3,610,631 3,619,107 3,521,184 Power Cost Adjustment 34,217,993 19,451,323 16,695,062 9,892,463 5,624,742 9,751,318 857,080 14,089,541 16,605,847 15,163,158 Gross Receipts 2,344,483 2,005,905 1,929,535 1,782,729 1,607,900 1,691,395 1,432,430 593,394 622,321 594,059 Sales for Resale - - - - - - - - 480,181 514,321
Total Charges for Electric 93,968,368 80,406,201 78,284,628 70,458,777 64,455,430 67,800,955 57,540,689 59,367,848 62,498,177 59,849,482 Charges for Service:
Penalty Charge 470,133 482,655 523,623 457,717 387,600 515,682 354,867 392,166 454,953 403,648 Service Charge 134,068 141,677 132,024 159,050 116,349 118,541 121,100 114,665 108,720 121,470 Initial Permanent Service 31,400 57,800 57,625 35,050 37,575 41,750 61,377 43,253 30,789 47,693 Line Extension 697,538 69,354 195,370 108,115 135,202 4,575 2,465 1,800 6,291 13,624 Contributions in Aid of Construction 85,983 119,347 81,417 146,587 127,323 185,059 287,541 621,384 160,911 211,386
Total Charges for Service 1,419,122 870,833 990,059 906,519 804,049 865,607 827,350 1,173,268 761,664 797,821 Charges for Other Services:
Green Power 3,547 3,601 1,985 - - - - - - - Capacity Credits 1,804,033 2,029,173 1,909,808 1,883,557 1,598,265 1,471,961 1,368,859 1,243,512 444,960 438,480 Other 90,978 288,275 234,374 34,979 99,870 80,883 59,306 82,131 40,653 24,394
Total Charges for Other Services 1,898,558 2,321,049 2,146,167 1,918,536 1,698,135 1,552,844 1,428,165 1,325,643 485,613 462,874 Total Utility Activities 97,286,048 83,598,083 81,420,854 73,283,832 66,957,614 70,219,406 59,796,204 61,866,759 63,745,454 61,110,177
Non-Utility Activities:Rental Income 633,419 402,898 316,060 266,547 247,632 224,991 222,391 248,955 190,526 219,843 Miscellaneous 1,529,184 269,151 129,512 11,032 657,534 854,732 1,656,063 118,110 140,511 40,245 Tree Trimming 92,565 81,573 181,774 175,290 188,974 - 236,691 236,691 216,967 Investment earnings 1,047,716 613,525 301,862 396,649 655,969 1,815,338 1,862,118 1,260,837 1,219,430 1,087,936 Special Item-Hurricane 3,281,600 1,900,702 - - - - 331,832 4,439,834 1,215,691 - Special Item-Insurance Proceeds 273,306 - - - - - - - - - Special Item-SO2 Credits - - - - - 4,285,700 Grant Revenue 119,367 110,937 3,022 6,500 193,019 5,000 - 5,000 14,840 Gain on Disposition of Property - 4,568,719 - - - - - - - -
Total Non-Utility Activities 6,857,790 7,955,935 1,040,145 852,540 1,756,609 3,088,080 4,314,095 10,590,127 2,988,125 1,362,864
Total Revenues 104,143,838$ 91,554,018$ 82,460,999$ 74,136,372$ 68,714,223$ 73,307,486$ 64,110,299$ 72,456,886$ 66,733,579$ 62,473,041$

UTILITY BOARD OF THE CITY OF KEY WEST, FLORIDA
FINANCIAL TRENDS
CHANGES IN NET ASSETS (Continued)
FISCAL YEARS 2006 - 1997
34
Restated Restated
2006 2005 2004 2003 2002 2001 2000 1999 1998 1997ExpensesUtility Activities:
Operating ExpensesProduction - Steam - - - - - - - - 166,385 1,388,706 Production - Diesel 1,482,077 1,074,167 887,371 916,557 779,761 816,946 681,671 841,671 1,036,565 1,727,963 Purchased Power 59,946,424 49,287,046 44,523,179 41,311,655 34,230,472 36,742,561 29,133,085 26,253,614 31,891,585 28,430,580 Transmission 3,539,845 3,646,679 3,298,491 3,711,111 3,485,983 3,589,637 3,673,226 3,575,771 760,025 664,908 Distribution 3,366,439 3,017,736 3,250,018 2,832,211 3,075,612 2,985,558 3,167,390 3,295,190 3,252,971 2,672,478 Customer Service 1,243,322 1,280,590 1,085,522 1,015,116 985,698 1,033,617 1,035,576 1,062,064 1,015,357 990,636 Administrative & General 11,452,519 11,540,112 10,004,675 8,757,455 8,460,644 5,977,699 5,601,023 5,881,170 5,928,275 5,777,256 Depreciation 6,182,488 6,391,999 6,441,587 6,367,595 6,500,687 5,680,618 5,488,771 5,783,556 5,402,133 5,237,831 Gross Receipts Tax 2,348,479 2,010,155 1,932,116 1,786,472 1,611,989 1,695,508 1,432,385 1,533,057 1,515,708 1,476,616 Employer Fica 119,476 116,919 89,107 68,831 65,945 63,034 60,557 55,116 52,260 42,925
Total Utility Activities 89,681,069 78,365,403 71,512,066 66,767,003 59,196,791 58,585,178 50,273,684 48,281,209 51,021,264 48,409,899
Non-Utility ActivitiesDebt Expenses
Interest on Debt 4,670,672 4,811,456 4,959,686 5,116,455 5,468,680 5,788,814 7,107,912 7,424,554 7,517,011 7,635,477 Interest Customer Deposit 194,367 109,429 29,345 31,538 74,701 279,513 252,913 198,347 212,472 196,396 Amortization of Bond Discount 104,508 104,508 104,508 104,508 259,703 127,714 187,707 189,507 190,550 312,340
Payment to City of Key West 343,341 340,548 325,998 318,394 334,485 323,851 317,146 249,644 230,708 217,254 Special Item - Hurricane 3,094,972 2,214,686 - - - - 334,397 5,074,097 1,232,965 - Retirement of Steam Plant - - - - - - - 6,894,284 - -
Total Non-Utility Activities 8,407,860 7,580,627 5,419,537 5,570,895 6,137,569 6,519,892 8,200,075 20,030,433 9,383,706 8,361,467
Total Expenses 98,088,929$ 85,946,030$ 76,931,603$ 72,337,898$ 65,334,360$ 65,105,070$ 58,473,759$ 68,311,642$ 60,404,970$ 56,771,366$
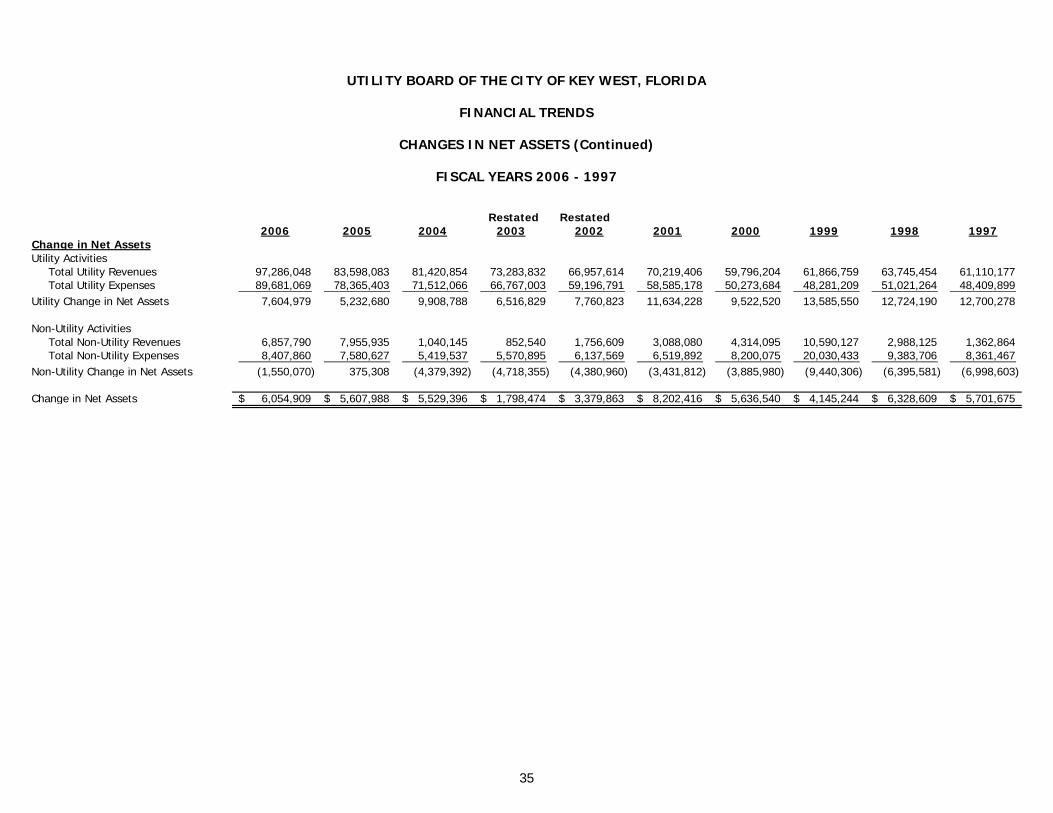
UTILITY BOARD OF THE CITY OF KEY WEST, FLORIDA
FINANCIAL TRENDS
CHANGES IN NET ASSETS (Continued)
FISCAL YEARS 2006 - 1997
35
Restated Restated
2006 2005 2004 2003 2002 2001 2000 1999 1998 1997Change in Net AssetsUtility Activities
Total Utility Revenues 97,286,048 83,598,083 81,420,854 73,283,832 66,957,614 70,219,406 59,796,204 61,866,759 63,745,454 61,110,177 Total Utility Expenses 89,681,069 78,365,403 71,512,066 66,767,003 59,196,791 58,585,178 50,273,684 48,281,209 51,021,264 48,409,899
Utility Change in Net Assets 7,604,979 5,232,680 9,908,788 6,516,829 7,760,823 11,634,228 9,522,520 13,585,550 12,724,190 12,700,278
Non-Utility ActivitiesTotal Non-Utility Revenues 6,857,790 7,955,935 1,040,145 852,540 1,756,609 3,088,080 4,314,095 10,590,127 2,988,125 1,362,864 Total Non-Utility Expenses 8,407,860 7,580,627 5,419,537 5,570,895 6,137,569 6,519,892 8,200,075 20,030,433 9,383,706 8,361,467
Non-Utility Change in Net Assets (1,550,070) 375,308 (4,379,392) (4,718,355) (4,380,960) (3,431,812) (3,885,980) (9,440,306) (6,395,581) (6,998,603)
Change in Net Assets 6,054,909$ 5,607,988$ 5,529,396$ 1,798,474$ 3,379,863$ 8,202,416$ 5,636,540$ 4,145,244$ 6,328,609$ 5,701,675$

UTILITY BOARD OF THE CITY OF KEY WEST, FLORIDA
FINANCIAL TRENDS
NET ASSETS BY COMPONENT
FISCAL YEARS 2006 - 1997
36
Restated Restated2006 2005 2004 2003 2002 2001 2000 1999 1998 1997
Utility Activities
Invested in capital assets,net of related debt 53,995,651$ 48,044,762$ 47,004,365$ 42,238,508$ 34,953,312$ 26,426,478$ 12,568,467$ 36,964,043$ 32,818,797$ 26,490,190$
Restricted for Working Capital 3,243,009 3,243,009 3,243,009 1,621,505 - - - - - -
Unrestricted 15,934,969 15,830,949 11,263,359 12,121,325 17,915,179 24,376,521 30,032,116 - - -
Total Net Assets 73,173,629$ 67,118,720$ 61,510,733$ 55,981,338$ 52,868,491$ 50,802,999$ 42,600,583$ 36,964,043$ 32,818,797$ 26,490,190$

UTILITY BOARD OF THE CITY OF KEY WEST, FLORIDA
REVENUE CAPACITY
REVENUES BY TYPE OF CUSTOMER
FISCAL YEARS 2006 - 1997
37
Restated Restated2006 2005 2004 2003 2002 2001 2000 1999 1998 1997
Residential 44,302,430$ 37,767,031$ 36,658,912$ 33,526,793$ 29,945,374$ 30,573,275$ 25,901,263$ 25,063,159$ 26,316,989$ 24,661,756$
Senior Citizen 452,712 369,301 314,552 229,184 195,524 207,605 149,109 157,444 148,971 139,601
Small Commercial 9,861,649 8,386,852 8,170,521 7,209,746 6,980,914 7,723,758 6,325,532 6,709,550 6,922,672 6,722,568
Large Commercial 28,882,226 24,131,212 23,690,538 20,955,224 18,998,550 20,122,328 17,229,071 18,900,932 19,573,180 19,007,407
Large Commercial-Primary 1,783,289 1,503,875 1,516,123 1,382,608 1,431,486 1,666,483 1,373,286 1,406,978 1,548,294 1,503,540
Industrial - - - 7,313 46,533 25,134 17,809 19,348 - -
Metro - - - - - - - 22,474 - -
Military 7,986,754 7,618,487 7,296,000 6,561,783 6,285,413 6,848,174 5,938,793 6,475,052 6,832,240 6,634,750
Churches 103,375 87,974 94,843 81,599 73,457 77,890 67,855 75,787 84,084 78,638
Recreating Lighting 28,274 28,956 25,102 23,384 22,505 23,827 21,221 19,770 44,606 44,156
Street Lighting 397,735 339,410 327,408 302,405 289,625 345,077 336,963 357,487 355,615 352,034
Area Lights 169,924 173,103 190,629 178,738 186,049 187,404 179,787 159,867 191,345 190,711
Resale Sales - - - - - - - - 480,181 514,321
Total Electric Revenues 93,968,368$ 80,406,201$ 78,284,628$ 70,458,777$ 64,455,430$ 67,800,955$ 57,540,689$ 59,367,848$ 62,498,177$ 59,849,482$

UTILITY BOARD OF THE CITY OF KEY WEST, FLORIDA
REVENUE CAPACITY
ACTUAL NUMBER OF CUSTOMERS BILLED
FISCAL YEARS 2006 - 1997
38
2006 2005 2004 2003 2002 2001 2000 1999 1998 1997
Residential 23,626 23,722 23,485 23,430 23,244 23,002 22,945 22,347 22,119 21,674
Senior Citizen 385 359 328 273 227 266 209 243 215 236
Small Commercial 3,083 3,003 2,981 2,867 2,847 2,885 2,855 2,709 2,642 2,604
Large Commercial 641 689 682 676 663 611 632 662 653 622
Large Commercial-Primary 5 5 5 6 6 9 8 9 7 7
Military 1 1 1 1 1 1 1 1 1 1
Churches 14 14 14 16 14 15 15 15 16 16
Recreating Lighting 4 4 4 4 4 4 4 4 4 4
Street Lighting 5 5 5 5 5 5 4 4 4 4
Area Lights 1,743 1,743 1,743 1,743 1,743 1,743 1,545 1,536 1,536 1,499
Total Per Year 29,507 29,545 29,248 29,021 28,754 28,541 28,218 27,530 27,197 26,667

UTILITY BOARD OF THE CITY OF KEY WEST, FLORIDA
REVENUE CAPACITY
kWh SALES BY TYPE OF CUSTOMER
FISCAL YEARS 2006 - 1997
39
2006 2005 2004 2003 2002 2001 2000 1999 1998 1997
Residential 322,821,261 328,463,571 331,255,087 336,527,072 313,373,473 297,876,406 291,705,894 280,380,410 279,848,803 268,782,127
Senior Citizen 3,433,442 3,367,914 2,990,238 2,421,557 2,162,669 2,132,083 1,800,705 1,930,306 1,694,143 1,624,056
Small Commercial 70,301,646 71,315,388 72,215,876 70,546,836 71,191,876 69,505,253 64,739,573 59,229,157 58,898,327 59,143,707
Large Commercial 223,397,382 225,840,948 232,357,842 229,252,417 217,523,554 204,191,750 201,076,612 193,964,088 194,184,681 190,522,693
Large Commercial-Primary 14,390,129 14,745,675 15,445,343 15,697,282 17,088,655 17,725,220 16,600,701 15,850,316 17,324,352 14,432,773
Industrial - - - 71,760 472,400 250,800 147,120 140,640 - -
Metro - - - - - - - 169,147 233,050 582,580
Military 64,737,435 75,332,040 75,596,527 76,739,131 76,916,836 73,989,067 75,165,609 72,940,692 73,901,898 74,604,534
Churches 671,840 669,595 757,371 743,337 649,482 605,706 590,667 579,606 576,638 566,147
Recreating Lighting 175,760 210,460 188,060 191,100 188,600 188,620 189,900 168,740 182,520 206,600
Street Lighting 2,817,954 2,654,569 2,651,128 2,652,752 2,655,220 2,955,277 3,199,842 3,201,830 3,317,222 3,175,788
Area Lights 1,377,516 1,377,516 1,377,516 1,377,516 1,410,415 1,443,168 1,443,168 1,443,168 1,443,164 1,312,549
Total kWh 704,124,365 723,977,676 734,834,988 736,220,760 703,633,180 670,863,350 656,659,791 629,998,100 631,604,798 614,953,554

UTILITY BOARD OF THE CITY OF KEY WEST, FLORIDA
REVENUE CAPACITY
AVERAGE MONTHLY BILL
FISCAL YEARS 2006 - 2000
40
Average Monthly Residential Bill
$-
$20.00
$40.00
$60.00
$80.00
$100.00
$120.00
$140.00
$160.00
FY 2006 FY 2005 FY 2004 FY 2003 FY 2002 FY 2001 FY 2000 FY 1999 FY 1998 FY 1997
Fiscal Years
Dol
lars
Electric 1000 kWh

UTILITY BOARD OF THE CITY OF KEY WEST, FLORIDA
REVENUE CAPACITY
RESIDENTIAL RATE ANALYSIS
(Month of September)
FISCAL YEARS 2006 - 2000
41
2006 2005 2004 2003 2002 2001 2000 1999 1998 1997
Customer Charge 6.00$ 6.00$ 6.00$ 6.00$ 6.00$ 6.00$ 6.00$ 6.00$ 6.00$ 6.00$ Rate Per kWh 0.0799 0.0799 0.0799 0.0799 0.0799 0.0799 0.0799 0.0799 0.0799 0.0799PCA Per kWh 0.0450 0.0328 0.0244 0.0175 0.0041 0.0170 0.0030 0.0200 0.0280 0.0239

UTILITY BOARD OF THE CITY OF KEY WEST, FLORIDA
REVENUE CAPACITY
RATE INCREASES
FISCAL YEARS 2006 - 1997
42
FISCAL RATE RATEYEAR INCREASES DECREASES
FY 2006 0.0% 0.0%
FY 2005 0.0% 0.0%
FY 2004 0.0% 0.0%
FY 2003 0.0% 0.0%
FY 2002 0.0% 0.0%
FY 2001 0.0% 0.0%
FY 2000 0.0% 14.0% ***
FY 1999 0.0% 0.0%
FY 1998 0.0% 0.0%
FY 1997 0.0% 0.0%
*** Note the decrease in Fiscal Year 2000 was only for commercial customers

UTILITY BOARD OF THE CITY OF KEY WEST, FLORIDA
DEBT CAPACITY
FISCAL YEARS 2006 - 2000
43
2006 2005 2004 2003 2002 2001 2000 1999 1998 1997
Operating Revenue 97,200,065$ 83,478,736$ 81,339,438$ 72,994,080$ 66,657,513$ 69,988,022$ 59,444,821$ 61,245,375$ 63,584,543$ 60,898,791$ Other Income 3,302,844 1,486,514 1,040,145 995,706 1,876,454 3,134,405 4,043,540 6,150,293 2,343,314 1,362,864 Rate Stabilization Transfers (1,000,535) 235,272 (1,020) (617,148) 2,330,599 (2,082,435) 6,335,703 (4,334,726) (787,431) (1,404,405) Bond Amortization Fund Interest - - - (120,475) (120,475) (120,475) (120,475) (120,475) Total Revenues Available 99,502,374 85,200,522 82,378,563 73,372,638 70,864,566 70,919,517 69,703,589 62,940,467 65,019,951 60,736,775
Total Operating Expenses 83,692,856 72,085,736 65,099,824 60,430,945 52,770,804 53,184,073 45,037,826 42,696,000 46,266,447 43,368,464
Net Revenues Available for Coverage 15,809,518$ 13,114,786$ 17,278,739$ 12,941,693$ 16,779,391$ 17,735,444$ 24,665,763$ 20,244,467$ 18,753,504$ 17,368,311$
Annual Debt Service 8,451,538$ 8,509,645$ 8,506,395$ 8,508,320$ 8,493,242$ 9,293,376$ 9,730,135$ 9,726,777$ 9,726,960$ 9,719,540$
Debt Service Coverage Ratio 1.87 1.54 2.03 1.52 1.98 1.91 2.53 2.08 1.93 1.79
COMPUTATION OF DEBT SERVICE COVERAGE
SecurityFiscal Loan Deposits Total PerYear Bonds (1) Payable Payable Government Capita (2)
2006 77,131,472$ 948,000$ 110,000$ 78,189,472$ -$ 2005 80,881,919 1,185,000 110,000 82,176,919 2,308 2004 84,464,037 - - 84,464,037 2,384 2003 88,236,539 - - 88,236,539 2,491 2002 91,528,868 340,000 - 91,868,868 2,738 2001 98,938,688 680,000 - 99,618,688 2,600 2000 105,764,123 182,409 - 105,946,532 2,831 1999 108,132,817 - - 108,132,817 3,138 1998 110,437,551 - - 110,437,551 3,814 1997 112,567,762 - - 112,567,762 5,021
(1) Includes accrued interest and current portion.(2) The 2006 Per Capita Income data for Monroe County is not available.
Ratios of Outstanding by Type

UTILITY BOARD OF THE CITY OF KEY WEST, FLORIDA
DEBT CAPACITY
PRINCIPAL PAYMENTS PAYABLE FOR ALL DEBT ISSUES THROUGH 2031
44
Payments Due Total for all 1991 Series 2000 Series 2001 Series 2006 Seriesfor FY Debt Issues Bond Issue Bond Issue Bond Issue Bond Issue
2007 5,515,000$ -$ 4,615,000$ 900,000$ -$ 2008 5,755,000 - 4,825,000 930,000 - 2009 6,005,000 - 5,040,000 965,000 - 2010 6,340,000 - 5,335,000 1,005,000 - 2011 6,695,000 - 5,645,000 1,050,000 - 2012 7,090,000 - 5,990,000 1,100,000 - 2013 7,495,000 - 6,350,000 1,145,000 - 2014 9,784,840 1,859,840 6,730,000 1,195,000 - 2015 1,735,344 1,735,344 - - - 2016 1,599,539 1,599,539 - - - 2017 1,491,821 1,491,821 - - - 2018 1,391,241 1,391,241 - - - 2019 2,435,000 - - - 2,435,000 2020 2,530,000 - - - 2,530,000 2021 2,660,000 - - - 2,660,000 2022 2,780,000 - - - 2,780,000 2023 2,900,000 - - - 2,900,000 2024 3,045,000 - - - 3,045,000 2025 3,185,000 - - - 3,185,000 2026 3,320,000 - - - 3,320,000 2027 3,465,000 - - - 3,465,000 2028 3,640,000 - - - 3,640,000 2029 3,820,000 - - - 3,820,000 2030 4,010,000 - - - 4,010,000 2031 4,210,000 - - - 4,210,000
102,897,785$ 8,077,785$ 44,530,000$ 8,290,000$ 42,000,000$

UTILITY BOARD OF THE CITY OF KEY WEST, FLORIDA
DEMOGRAPHIC AND ECONOMIC INFORMATION
FISCAL YEARS 2006 - 1997
45
Monroe County Monroe County Monroe CountyKey West Per Capita Median Unemployment
Year Population (1) Income(2) Age (1) Rate (2)
2006 (3) (3) (3) (3)
2005 27,000 35,612$ (3) 3.0%
2004 25,811 35,423$ (3) 2.3%
2003 25,811 35,423$ 43 3.1%
2002 25,853 33,549$ 43 2.6%
2001 25,735 38,309$ 43 2.6%
2000 25,478 37,421$ 40 2.0%
1999 27,698 34,456$ 40 2.0%
1998 27,522 28,959$ 37 2.2%
1997 27,305 22,421$ 34 2.4%
(1) Key West Chamber of Commerce
(2) US Department of Labor Bureau of Labor Statistics
(3) Data not available
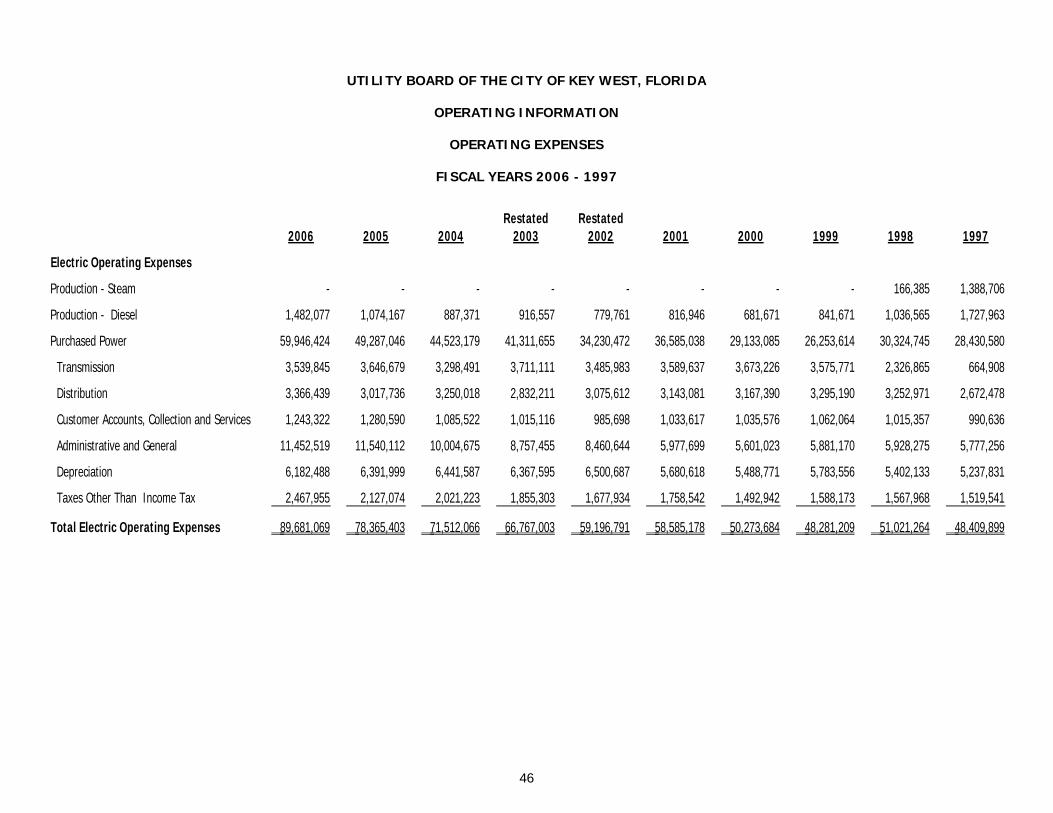
UTILITY BOARD OF THE CITY OF KEY WEST, FLORIDA
OPERATING INFORMATION
OPERATING EXPENSES
FISCAL YEARS 2006 - 1997
46
Restated Restated2006 2005 2004 2003 2002 2001 2000 1999 1998 1997
Electric Operating Expenses
Production - Steam - - - - - - - - 166,385 1,388,706
Production - Diesel 1,482,077 1,074,167 887,371 916,557 779,761 816,946 681,671 841,671 1,036,565 1,727,963
Purchased Power 59,946,424 49,287,046 44,523,179 41,311,655 34,230,472 36,585,038 29,133,085 26,253,614 30,324,745 28,430,580
Transmission 3,539,845 3,646,679 3,298,491 3,711,111 3,485,983 3,589,637 3,673,226 3,575,771 2,326,865 664,908
Distribution 3,366,439 3,017,736 3,250,018 2,832,211 3,075,612 3,143,081 3,167,390 3,295,190 3,252,971 2,672,478
Customer Accounts, Collection and Services 1,243,322 1,280,590 1,085,522 1,015,116 985,698 1,033,617 1,035,576 1,062,064 1,015,357 990,636
Administrative and General 11,452,519 11,540,112 10,004,675 8,757,455 8,460,644 5,977,699 5,601,023 5,881,170 5,928,275 5,777,256
Depreciation 6,182,488 6,391,999 6,441,587 6,367,595 6,500,687 5,680,618 5,488,771 5,783,556 5,402,133 5,237,831
Taxes Other Than Income Tax 2,467,955 2,127,074 2,021,223 1,855,303 1,677,934 1,758,542 1,492,942 1,588,173 1,567,968 1,519,541
Total Electric Operating Expenses 89,681,069 78,365,403 71,512,066 66,767,003 59,196,791 58,585,178 50,273,684 48,281,209 51,021,264 48,409,899

UTILITY BOARD OF THE CITY OF KEY WEST, FLORIDA
OPERATING INFORMATION
ENERGY SOURCES
FISCAL YEARS 2006 - 1997
47
Description 2006 2005 2004 2003 2002 2001 2000 1999 1998 1997
Gross Generation in MW:Diesel and Combustion Turbine 20,338 26,067 20,836 29,708 26,229 19,656 26,632 14,580 5,899 18,863Less: Station Auxiliaries 3,566 3,463 3,372 3,310 3,232 3,063 3,085 3,271 1,687 3,575
Net Generation 16,772 22,604 17,464 26,398 22,997 16,593 23,547 11,309 4,212 15,288Sales To Other Distributors (18,058) (9,445)Net Delivered Purchased Power and Stanton Generation 738,938 758,537 763,799 767,542 734,541 704,034 683,454 681,454 695,287 663,561
Net Energy for Load 755,710 781,141 781,263 793,940 757,538 720,627 707,001 692,763 717,557 688,294Less: Losses (51,586) (57,163) (46,428) (57,719) (53,905) (49,763) (50,341) (62,765) (85,952) (73,294)
Retail Energy Sales 704,124 723,978 734,835 736,221 703,633 670,864 656,660 629,998 631,605 615,000Losses 6.8% 7.3% 5.9% 7.3% 7.1% 6.9% 7.1% 9.1% 12.0% 10.6%
Generation Capacity (kW) - Name Plate Rating (1) 123,100 87,100 87,100 87,100 87,100 87,100 87,100 87,100 87,100 87,100
KEYS 60 Minute Net Peak Demand 135,511 145,500 139,700 138,900 133,800 129,900 131,300 125,400 127,000 119,700
Percentage of On Island Resources for Net Peak Demand (2) 90.8% 59.9% 62.3% 62.7% 65.1% 67.1% 66.3% 69.5% 68.6% 72.8%
Load Factor 63.7% 61.3% 63.8% 65.3% 64.6% 63.3% 61.5% 63.1% 64.5% 65.6%
Delivered Purchased Power and Stanton Resources (kW):FP&L Long - Term Power 45,000 45,000 45,000 45,000 45,000 45,000 45,000 45,000 45,000 45,000FMPA Tri-City Project (Stanton 1) 12,289 12,367 12,289 12,289 12,289 11,633 11,633 12,289 12,289 12,434FMPA Stanton 2 Project 9,770 9,708 9,862 9,862 9,862 9,243 9,243 9,862 9,862 9,885Other Short Term Firm 0 0 0 0 0 0 0 0 0 15,000
Total Purchased 67,059 67,075 67,151 67,151 67,151 65,876 65,876 67,151 67,151 82,319
Total Generating and Purchased Capability 190,159 154,175 154,251 154,251 154,251 152,976 152,976 154,251 154,251 169,419
Net Reserve Margin Including Purchased Power (3) 40.3% 6.0% 10.4% 11.1% 15.3% 17.8% 16.5% 23.0% 21.5% 41.5%
(1) KEYS has a "Capacity and Energy Sales Agreement" with the Florida Keys Electric Cooperative (FKEC) to provide a minimum capacity and energy in the event that the transmission line is interrupted.The minimum is based upon a formula in the contract.(2) The Utility Board has revised the On Island Generation Capacity to meet its annual peak demand from 70% to 60%.(3) Net Reserve Margin represents the amount of capacity in excess of KEYS peak demand, as a percentage of system peak demand. Commencing 2002, this calculation utilizes The Net 60 Minute Peak.
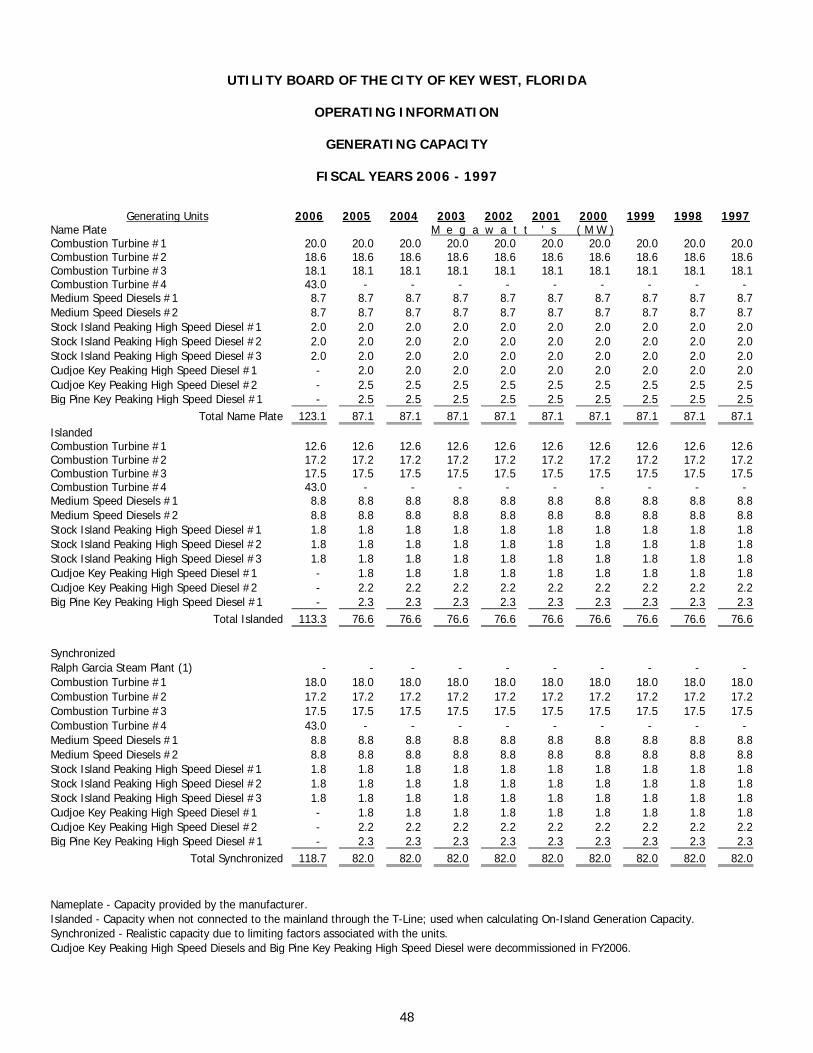
UTILITY BOARD OF THE CITY OF KEY WEST, FLORIDA
OPERATING INFORMATION
GENERATING CAPACITY
FISCAL YEARS 2006 - 1997
48
Generating Units 2006 2005 2004 2003 2002 2001 2000 1999 1998 1997Name Plate M e g a w a t t ' s ( M W )Combustion Turbine #1 20.0 20.0 20.0 20.0 20.0 20.0 20.0 20.0 20.0 20.0 Combustion Turbine #2 18.6 18.6 18.6 18.6 18.6 18.6 18.6 18.6 18.6 18.6 Combustion Turbine #3 18.1 18.1 18.1 18.1 18.1 18.1 18.1 18.1 18.1 18.1 Combustion Turbine #4 43.0 - - - - - - - - - Medium Speed Diesels #1 8.7 8.7 8.7 8.7 8.7 8.7 8.7 8.7 8.7 8.7 Medium Speed Diesels #2 8.7 8.7 8.7 8.7 8.7 8.7 8.7 8.7 8.7 8.7 Stock Island Peaking High Speed Diesel #1 2.0 2.0 2.0 2.0 2.0 2.0 2.0 2.0 2.0 2.0 Stock Island Peaking High Speed Diesel #2 2.0 2.0 2.0 2.0 2.0 2.0 2.0 2.0 2.0 2.0 Stock Island Peaking High Speed Diesel #3 2.0 2.0 2.0 2.0 2.0 2.0 2.0 2.0 2.0 2.0 Cudjoe Key Peaking High Speed Diesel #1 - 2.0 2.0 2.0 2.0 2.0 2.0 2.0 2.0 2.0 Cudjoe Key Peaking High Speed Diesel #2 - 2.5 2.5 2.5 2.5 2.5 2.5 2.5 2.5 2.5 Big Pine Key Peaking High Speed Diesel #1 - 2.5 2.5 2.5 2.5 2.5 2.5 2.5 2.5 2.5
Total Name Plate 123.1 87.1 87.1 87.1 87.1 87.1 87.1 87.1 87.1 87.1 IslandedCombustion Turbine #1 12.6 12.6 12.6 12.6 12.6 12.6 12.6 12.6 12.6 12.6 Combustion Turbine #2 17.2 17.2 17.2 17.2 17.2 17.2 17.2 17.2 17.2 17.2 Combustion Turbine #3 17.5 17.5 17.5 17.5 17.5 17.5 17.5 17.5 17.5 17.5 Combustion Turbine #4 43.0 - - - - - - - - - Medium Speed Diesels #1 8.8 8.8 8.8 8.8 8.8 8.8 8.8 8.8 8.8 8.8 Medium Speed Diesels #2 8.8 8.8 8.8 8.8 8.8 8.8 8.8 8.8 8.8 8.8 Stock Island Peaking High Speed Diesel #1 1.8 1.8 1.8 1.8 1.8 1.8 1.8 1.8 1.8 1.8 Stock Island Peaking High Speed Diesel #2 1.8 1.8 1.8 1.8 1.8 1.8 1.8 1.8 1.8 1.8 Stock Island Peaking High Speed Diesel #3 1.8 1.8 1.8 1.8 1.8 1.8 1.8 1.8 1.8 1.8 Cudjoe Key Peaking High Speed Diesel #1 - 1.8 1.8 1.8 1.8 1.8 1.8 1.8 1.8 1.8 Cudjoe Key Peaking High Speed Diesel #2 - 2.2 2.2 2.2 2.2 2.2 2.2 2.2 2.2 2.2 Big Pine Key Peaking High Speed Diesel #1 - 2.3 2.3 2.3 2.3 2.3 2.3 2.3 2.3 2.3
Total Islanded 113.3 76.6 76.6 76.6 76.6 76.6 76.6 76.6 76.6 76.6
SynchronizedRalph Garcia Steam Plant (1) - - - - - - - - - - Combustion Turbine #1 18.0 18.0 18.0 18.0 18.0 18.0 18.0 18.0 18.0 18.0 Combustion Turbine #2 17.2 17.2 17.2 17.2 17.2 17.2 17.2 17.2 17.2 17.2 Combustion Turbine #3 17.5 17.5 17.5 17.5 17.5 17.5 17.5 17.5 17.5 17.5 Combustion Turbine #4 43.0 - - - - - - - - - Medium Speed Diesels #1 8.8 8.8 8.8 8.8 8.8 8.8 8.8 8.8 8.8 8.8 Medium Speed Diesels #2 8.8 8.8 8.8 8.8 8.8 8.8 8.8 8.8 8.8 8.8 Stock Island Peaking High Speed Diesel #1 1.8 1.8 1.8 1.8 1.8 1.8 1.8 1.8 1.8 1.8 Stock Island Peaking High Speed Diesel #2 1.8 1.8 1.8 1.8 1.8 1.8 1.8 1.8 1.8 1.8 Stock Island Peaking High Speed Diesel #3 1.8 1.8 1.8 1.8 1.8 1.8 1.8 1.8 1.8 1.8 Cudjoe Key Peaking High Speed Diesel #1 - 1.8 1.8 1.8 1.8 1.8 1.8 1.8 1.8 1.8 Cudjoe Key Peaking High Speed Diesel #2 - 2.2 2.2 2.2 2.2 2.2 2.2 2.2 2.2 2.2 Big Pine Key Peaking High Speed Diesel #1 - 2.3 2.3 2.3 2.3 2.3 2.3 2.3 2.3 2.3
Total Synchronized 118.7 82.0 82.0 82.0 82.0 82.0 82.0 82.0 82.0 82.0
Nameplate - Capacity provided by the manufacturer.Islanded - Capacity when not connected to the mainland through the T-Line; used when calculating On-Island Generation Capacity.Synchronized - Realistic capacity due to limiting factors associated with the units.Cudjoe Key Peaking High Speed Diesels and Big Pine Key Peaking High Speed Diesel were decommissioned in FY2006.

UTILITY BOARD OF THE CITY OF KEY WEST, FLORIDA
OPERATING INFORMATION
EMPLOYEE INFORMATION
FISCAL YEARS 2006 - 1997
49
2006 2005 2004 2003 2002 2001 2000 1999 1998 1997
General Manager's Department
17 18 17 17 16 11 11 11 10 10
Engineering & Control 20 19 19 19 20 20 20 20 24 24
Customer Services 32 32 30 31 33 32 31 30 30 30
Finance 10 10 15 13 13 21 21 22 22 21
Transmission & Distribution
36 34 35 38 42 39 39 38 38 39
General Plant 0 0 8 9 9 11 14 12 12 16
Generation 38 39 22 21 18 20 18 24 26 24
Total 153 152 146 148 151 154 154 157 162 164
Notes:The numbers above do not include five (5) Utility Board Members
The approved budgets were used for years 2001 - 1997. Commencing 2002, actual employee head count is used.
Information Technology moved from the Finance Department to the General Manager's Department. The Warehouse, Purchasing & Contract Administration Departments were moved from the Transmission & Distribution Department to theGeneration Department. There were four additional apprentice line persons hired in the Transmission & DistributionDepartment.

UTILITY BOARD OF THE CITY OF KEY WEST, FLORIDA
OPERATING INFORMATION
TEN HIGHEST CONSUMPTION LOCATIONS
FISCAL YEAR 2006
50
Demand EnergyRanking Customer Account KW kWh Dollars
1 U.S. Navy 12,538.6 64,737,439 7,986,755$
2 City of Key West 3,234.7 13,625,640 1,826,751$
3 Monroe County School Board 5,146.8 10,210,123 1,432,375$
4 Monroe County Detention 1,144.5 7,614,600 927,143$
5 Winn Dixie Stores, Inc. 1,116.2 6,929,705 917,937$
6 Key West HMA Inc. 1,139.0 6,691,617 894,617$
7 Tannex Development Corporation 781.0 5,770,672 792,850$
8 Wyndham Casa Marina Hotel 979.5 5,480,655 741,623$
9 US Coast Guard 1,872.0 4,361,400 574,265$
10 Pier House Joint Venture 714.0 3,712,800 498,357$

51
REPORT ON INTERNAL CONTROL OVER FINANCIAL REPORTING AND ON COMPLIANCE AND OTHER MATTERS BASED ON AN AUDIT OF FINANCIAL STATEMENTS PERFORMED IN ACCORDANCE WITH GOVERNMENT AUDITING STANDARDS Utility Board of the City of Key West, Florida “Keys Energy Services” Key West, Florida We have audited the accompanying financial statements of the Utility Board of the City of Key West, Florida, d/b/a Keys Energy Services, ("KEYS") as of and for the year ended September 30, 2006, which collectively comprise KEYS’ basic financial statements and have issued our report thereon dated January 11, 2007. We conducted our audit in accordance with auditing standards generally accepted in the United States of America and the standards applicable to financial audits contained in Government Auditing Standards, issued by the Comptroller General of the United States. Internal Control Over Financial Reporting In planning and performing our audit, we considered KEYS’ internal control over financial reporting in order to determine our auditing procedures for the purpose of expressing our opinions on the financial statements and not to provide an opinion on the internal control over financial reporting. Our consideration of the internal control over financial reporting would not necessarily disclose all matters in the internal control that might be material weaknesses. A material weakness is a reportable condition in which the design or operation of one or more of the internal control components does not reduce to a relatively low level the risk that misstatements caused by error or fraud in amounts that would be material in relation to the financial statements being audited may occur and not be detected within a timely period by employees in the normal course of performing their assigned functions. We noted no matters involving the internal control over financial reporting and its operation that we consider to be material weaknesses.

52
Page Two Utility Board of the City of Key West, Florida “Keys Energy Services” Key West, Florida Compliance and Other Matters As part of obtaining reasonable assurance about whether KEYS’ financial statements are free of material misstatement, we performed tests of its compliance with certain provisions of laws, regulations, contracts and grant agreements, noncompliance with which could have a direct and material effect on the determination of financial statement amounts. However, providing an opinion on compliance with those provisions was not an objective of our audit, and accordingly, we do not express such an opinion. The results of our tests disclosed no instances of noncompliance or other matters that are required to be reported under Government Auditing Standards. We noted certain matters that we reported to management of KEYS, in a separate letter dated January 11, 2007. This report is intended solely for the information and use of the audit committee, management, Utility Board, Florida Auditor General, federal awarding agencies and pass-through entities and is not intended to be and should not be used by anyone other than these specified parties.
January 11, 2007
53
REPORT ON COMPLIANCE WITH REQUIREMENTS APPLICABLE TO EACH MAJOR PROGRAM AND ON INTERNAL CONTROL OVER COMPLIANCE IN ACCORDANCE WITH OMB CIRCULAR A-133 Utility Board of the City of Key West, Florida “Keys Energy Services” Key West, Florida Compliance We have audited the compliance of the Utility Board of the City of Key West, Florida, d/b/a Keys Energy Services, (“KEYS”) with the types of compliance requirements described in the U.S. Office of Management and Budget (OMB) Circular A-133 Compliance Supplement that are applicable to each of its major federal programs for the year ended September 30, 2007. KEYS’ major federal programs are identified in the summary of auditor’s results section of the accompanying schedule of findings and questioned costs. Compliance with the requirements of laws, regulations, contracts and grants applicable to each of its major federal programs is the responsibility of KEYS’ management. Our responsibility is to express an opinion on KEYS’ compliance based on our audit. We conducted our audit in accordance with auditing standards generally accepted in the United States of America; the standards applicable to financial audits contained in Government Auditing Standards, issued by the Comptroller General of the United States; OMB Circular A-133, Audits of States, Local Governments, and Non-Profit Organizations. Those standards and OMB Circular A-133 require that we plan and perform the audit to obtain reasonable assurance about whether noncompliance with the types of compliance requirements referred to above that could have a direct and material effect on a major federal program occurred. An audit includes examining, on a test basis, evidence about KEYS’ compliance with those requirements and performing such other procedures as we considered necessary in the circumstances. We believe that our audit provides a reasonable basis for our opinion. Our audit does not provide a legal determination on KEYS’ compliance with those requirements.
In our opinion, KEYS complied, in all material respects, with the requirements referred to above that are applicable to each of its major federal programs for the year ended September 30, 2007.

54
Page Two Utility Board of the City of Key West, Florida “Keys Energy Services” Key West, Florida Internal Control Over Compliance The management of KEYS is responsible for establishing and maintaining effective internal control over compliance with requirements of laws, regulations, contracts, and grants applicable to federal programs. In planning and performing our audit, we considered KEYS’ internal control over compliance with requirements that could have a direct and material effect on a major federal program in order to determine our auditing procedures for the purpose of expressing our opinion on compliance and to test and report on the internal control over compliance in accordance with OMB Circular A-133. Our consideration of the internal control over compliance would not necessarily disclose all matters in the internal control that might be material weaknesses. A material weakness is a reportable condition in which the design or operation of one or more of the internal control components does not reduce to a relatively low level the risk that noncompliance with applicable requirements of laws, regulations, contracts, and grants caused by error or fraud that would be material in relation to a major federal program being audited may occur and not be detected within a timely period by employees in the normal course of performing their assigned functions. We noted no matters involving the internal control over compliance and its operation that we consider to be material weaknesses. This report is intended solely for the information and use of the audit committee, Board of Directors, management, Florida Auditor General, and federal awarding agencies and pass-through entities and is not intended to be and should not be used by anyone other than these specified parties.
January 11, 2007

UTIILTY BOARD OF THE CITY OF KEY WEST
SCHEDULE OF EXPENDITURES OF FEDERAL AWARDS
FOR THE YEAR ENDED SEPTEMBER 30, 2006
55
GrantCFDA Identification
Number Number Expenditures
Federal Emergency Management Agency (FEMA)Indirect Programs
Passed through the State of Florida, Department of Community Affairs:
Disaster Relief Funding Agreement 97.036 03-WL-&K-11-54-02-508 2,736,029$
Total Federal Awards 2,736,029$

UTIILTY BOARD OF THE CITY OF KEY WEST
NOTES TO SCHEDULE OF EXPENDITURES OF FEDERAL AWARDS
FOR THE YEAR ENDED SEPTEMBER 30, 2006
56
NOTE 1 – SUMMARY OF SIGNIFICANT ACCOUNTING POLICIES Basis of Presentation - The accompanying schedule of expenditures of federal awards includes the federal grant activity of Keys Energy Services (KEYS) and is presented on the accrual basis of accounting. The information in this schedule is presented in accordance with the requirements of Office of Management and Budget (OMB) Circular A-133, “Audits of States, Local Governments, and Non-Profit Organizations.” Therefore, some amounts presented in this schedule may differ from amounts presented in or used in the preparation of the financial statements.

UTILITY BOARD OF THE CITY OF KEY WEST, FLORIDA
SCHEDULE OF FINDINGS AND QUESTIONED COSTS
FOR THE YEAR ENDED SEPTEMBER 30, 2006
57
1. The auditor’s report expresses an unqualified opinion on the financial statements of the Utility Board of the City of Key West, Florida.
2. There were no reportable conditions disclosed during the audit of the financial statements.
3. No instances of noncompliance material to the financial statements of the Utility Board of the
City of Key West, Florida, which would be required to be reported in accordance with Government Auditing Standards, were disclosed during the audit.
4. There were no reportable conditions disclosed during the audit of the major federal award
programs.
5. The auditor’s report on compliance for the major awards programs for the Utility Board of the City of Key West, Florida expresses an unqualified opinion on all major federal programs.
6. There were no audit findings relative to the major federal award programs for the Utility Board
of the City of Key West, Florida.
7. The programs tested as major programs include:
CFDA Award Title Annual Expenditures
97.036 Disaster Relief Funding Agreement 2,736,029$
Total 2,736,029$
8. The threshold used for distinguishing between Type A and Type B programs was $500,000.
9. The Utility Board of the City of Key West, Florida qualifies as a low-risk auditee.
Findings – Financial Statement Audit None Findings and Questioned Costs – Major Federal Award Programs Audit None

UTILITY BOARD OF THE CITY OF KEY WEST, FLORIDA
SUMMARY SCHEDULE OF PRIOR AUDIT FINDINGS
FOR THE YEAR ENDED SEPTEMBER 30, 2006
58
Prior Year Findings and Questioned – Major Federal Awards Programs Finding Number Prior Audit Finding Finding 1 None

UTILITY BOARD OF THE CITY OF KEY WEST, FLORIDA
CORRECTIVE ACTION PLAN
FOR THE YEAR ENDED SEPTEMBER 30, 2006
59
Federal Emergency Management Agency c/o Florida Department of Community Affairs 2555 Shumard Oak Boulevard Tallahassee, FL 32399-2100 Attn: Office of Audit Services RE: Auditor’s Report FEMA Disaster Relief Funding Agreements 06-WL-&K-11-54-02-508 The Utility Board of the City of Key West, Florida respectfully submits the following Corrective Action Plan for the year ended September 30, 2006. Name and address of independent accounting firm: Oropeza & Parks, Certified Public Accountants 815 Peacock Plaza Key West, FL 33040 Audit Period: Year Ended September 30, 2006 The findings from the September 30, 2006 Schedule of Findings and Questioned Costs are discussed below. The findings are numbered consistently with the numbers assigned in the schedule. Section A of the schedule, Summary of Audit Results, does not include findings and is not addressed. B. Findings – Financial Statement Audit
None noted
C. Findings – Federal Award Programs Audit
None noted