Embed Size (px)
Citation preview
Comprehensive Africa Agriculture Development Programme (CAADP)
West Africa Regional CAADP Nutrition Program Development Workshop
Nutrition Country Paper – Liberia
English Version
DRAFT
November 9-12, 2011 Dakar, Senegal
This synthesis has been elaborated for a CAADP workshop on the integration of nutrition in National Agricultural and Food Security
Investment Plan, held in Dakar, Senegal, from the 9th to the 12th November 2011. The purpose of this Nutrition Country Paper is to present key data and information required to improve nutrition in participating countries and scale up nutrition in agricultural strategies and programs. This work document has been initiated and updated by the workshop work team of the country, composed of focal points from different sectors; with the assistance of the technical piloting committee. It will be regularly updated and completed.
2
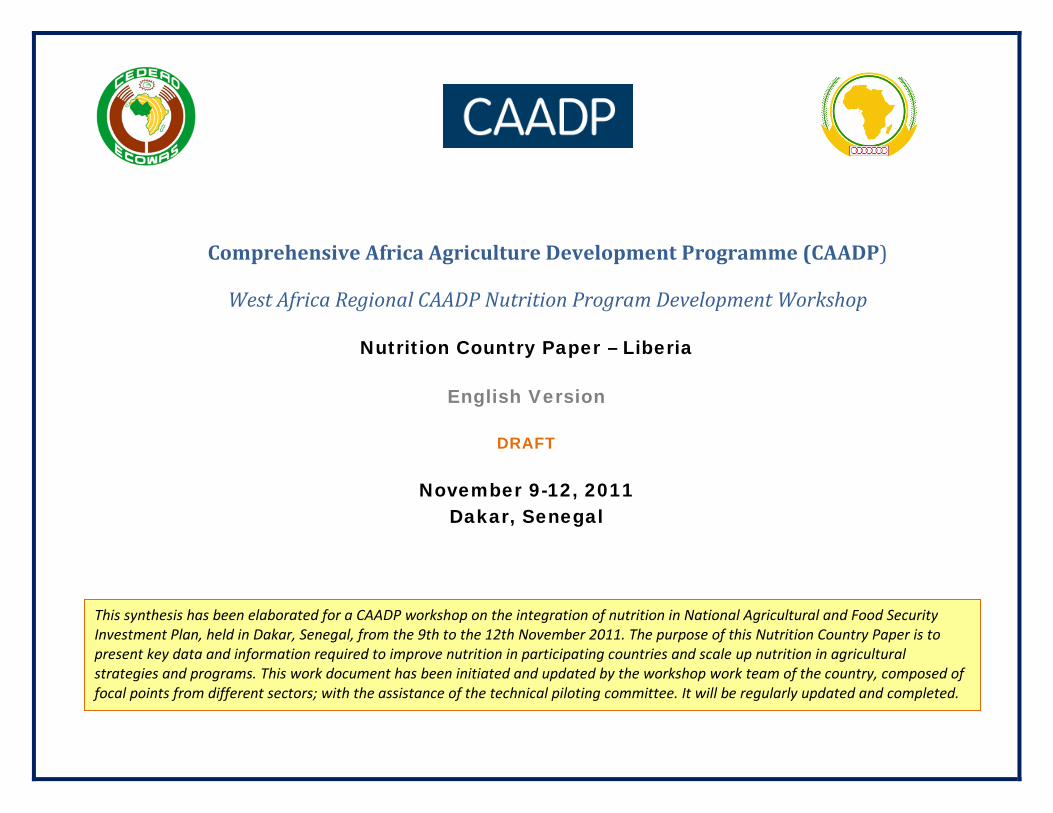
Key policy documents to be consulted Other key documents: Please refer to the workshop material -Lift Liberia Poverty Reduction Strategy (PRS) 2008-2011 -Food and Agriculture Policy and Strategy (FAPS) 2008-2013 -Liberia Agriculture Sector Investment Program (LASIP) 2001-2015 General sources used to produce this document
Sources Information Internet link when available
FAO Nutrition Country Profiles http://www.fao.org/ag/agn/nutrition/profiles_by_country_en.stm FAO Country profiles http://www.fao.org/countries/ FAO STAT country profiles http://faostat.fao.org/site/666/default.aspx
UNICEF Nutrition Country Profiles http://www.childinfo.org/profiles_974.htm MICS: Multiple Indicators Cluster Surveys http://www.childinfo.org/mics_available.html
OCDE / CILLS
Food Security Country Profiles for 9 African Countries : Burkina Faso, Cape Verde, Chad, Gambia, Guinea-Bissau, Mali, Mauritania, Niger, Senegal
http://www.oecd.org/document/6/0,3746,en_38233741_38246823_41638790_1_1_1_1,00.html
DHS DHS Indicators http://www.measuredhs.com/Where-We-Work/Country-List.cfm OMS Nutrition Landscape information system http://apps.who.int/nutrition/landscape/report.aspx
CAADP Signed Compact / Investment plans / Stocktaking documents / Technical Review reports if available
http://www.nepad-caadp.net/library-country-status-updates.php
REACH REACH multi-sectoral review of existing data on the nutrition situation, programmes and policies
When available (Mauritania, Sierra Leone)
SUN Progress Report from countries and their partners in the Movement to Scale Up Nutrition (SUN)
http://www.scalingupnutrition.org/wp-content/uploads/2011/09/compendiurm-of-country-fiches-ROME-VERSION.pdf http://www.scalingupnutrition.org/events/a-year-of-progress/
WFP Food security reports http://www.wfp.org/food-security/reports/search
3
I. Context- food and nutrition situation
General Indicators Source Population below poverty line of US$1.25 per day 87% UNICEF 2011
Under-five mortality rate (per 1,000 live births) 112 UNICEF 2011
Infant mortality rate (per 1,000 live births) 80 UNICEF 2011 Primary cause of under-five deaths
Neonatal death
22%
WHO 2011 Primary school net enrolment or attendance ratio 40% UNESCO 2007
Primary school net enrolment -ratio of females/males 39% f /41% m NS 2007 Agro-nutrition indicators Source Cultivable land area 23.3% FAO 2007
Access to improved drinking water in rural areas 56% UNICEF 2008 Food Availability
Average dietary energy requirement (ADER) 2190 kcal/person/day FAO 2005- 2007
Dietary energy supply (DES) 2160 kcal/person/day FAO 2005-2007
Total protein share in DES / (Animal protein) 6.6% / 1.1% FAO 2005-2007
Fat share in DES 23.6% FAO 2005-2007
Geography, population, and human development The West African country of Liberia has six major rivers, and many short coastal watercourses. The terrain is mostly flat to rolling coastal plains, rising to low mountains, plateaus, and mountains (600 m) parallel to the coast. Children < 14 years comprise 39% of the population (UIS, 2009), 52% of the population is rural and mean years of schooling is 3.9 years. Liberia ranks 162 out of 169 in the human development index (UNDP, 2010). Although an average rate of 68% of the population using improved drinking water is considered to be relatively high, in rural populations this figure drops to 56%. With 87% of the population living in below the poverty line, persistent challenges to improving the nutritional status of the population remain. Liberia has experienced modest recovery from a destructive period of conflict; the country dropped from having nearly middle-income status and self-sufficiency in food in the late 1970s to its present situation of being one of the poorest in the world. Economic development Liberia is a low-income country heavily reliant on foreign assistance for revenue. Many businesses fled the country, taking capital and expertise with them but with the conclusion of fighting, several have returned. Liberia is reviving its production and export sectors, primarily iron ore, raw timber and rubber. Other products
include cocoa, rice, cassava (tapioca), palm oil, sugarcane, bananas, sheep, and goats. Agricultural production accounts for 70% of the labor force, with 22% and 8% working in the service and industry sectors, respectively. Although nearly $5 Billion of international debt was permanently eliminated in 2010 and a low single-digit rate of inflation since 2009 (due to stable community prices), rebuilding infrastructure and raising incomes continue to be on-going challenges. Food security (food availability, access, utilization, and coping mechanisms) In Liberia only 9% of the rural population is food secure and food diversity is extremely low, consisting mainly of rice, roots and tubers (WFP 2010). The production of rice – the most important staple – fell by 76 percent between 1987 and 2005, years characterized by war, mismanagement, and neglect of the agriculture sector. In 2007, Liberia produced only about 40% of its staple food requirement, rice prices increased 60%, and real incomes have declined, further stressing household coping mechanisms. Although agricultural production has increased in recent years as the sector slowly recovers, many challenges remain. Liberia is not only food insecure but also exceedingly vulnerable to high food prices and fluctuations in the global market.
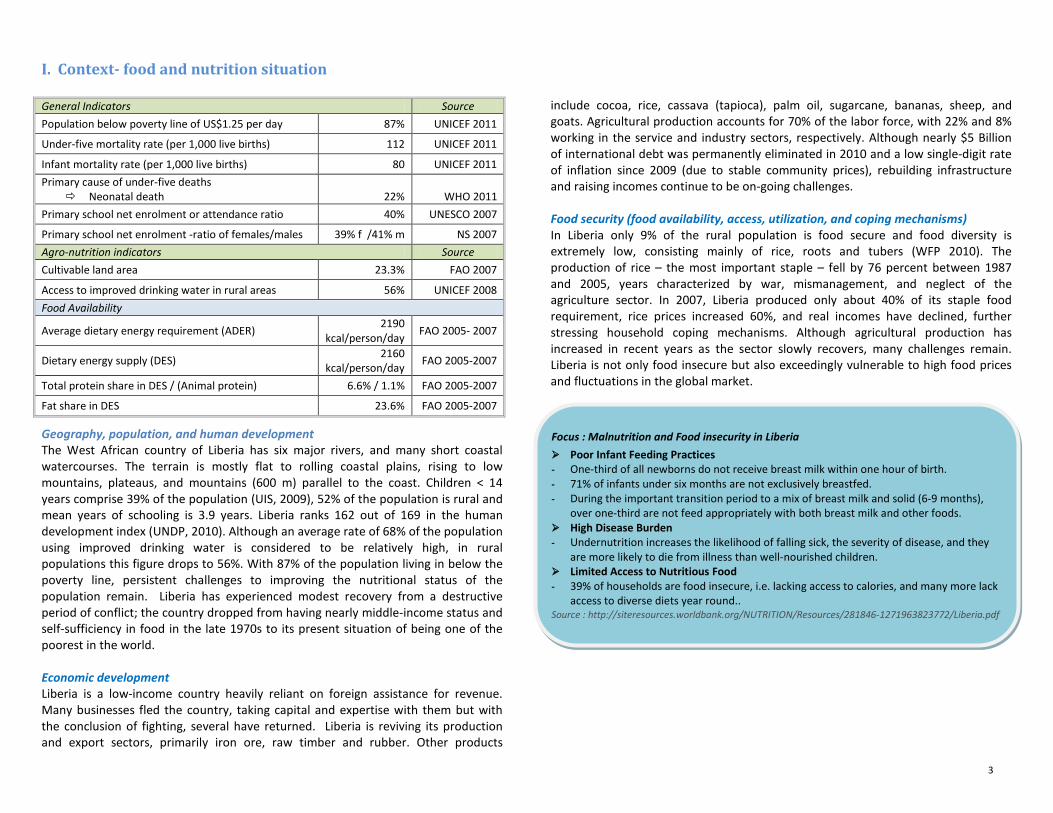
Focus : Malnutrition and Food insecurity in Liberia
Poor Infant Feeding Practices - One-third of all newborns do not receive breast milk within one hour of birth. - 71% of infants under six months are not exclusively breastfed. - During the important transition period to a mix of breast milk and solid (6-9 months),
over one-third are not feed appropriately with both breast milk and other foods. High Disease Burden - Undernutrition increases the likelihood of falling sick, the severity of disease, and they
are more likely to die from illness than well-nourished children. Limited Access to Nutritious Food - 39% of households are food insecure, i.e. lacking access to calories, and many more lack
access to diverse diets year round.. Source : http://siteresources.worldbank.org/NUTRITION/Resources/281846-1271963823772/Liberia.pdf
4
Agro-Nutrition Indicators (continued) Source
Nutritional Anthropometry (WHO Child Growth Standards)
Prevalence of stunting in children < 5 years of age 39 % UNICEF 2011
Prevalence of wasting in children < 5 years of age 8 % UNICEF 2011
Prevalence of underweight children < 5 years of age 19 % UNICEF 2011
% Women (15-49 years) with a BMI < 18.5 kg/m² 10% DHS 2007
Nutritional anthropometryi Stunting levels are above WHO standards for extremely high rates (40%) among Liberian children under age five, with a prevalence rate of 41.8% (CFSNS, 2010). This rate is even higher than reported by DHS in 2007. However, the 14.9% prevalence rate for underweight children <5 years reported by CFSNS in 2010, are lower than those shown in 2007 by the DHS. The highest levels of severe and moderate stunting are found in children between 18 and 29 months while younger children (6-17months) are less stunted. In the latter age group, the rate of Global Acute Malnutrition is much higher (7.1%) than in any other age group. The proportion of overweight or obese women stands at 21 percent, with 6 percent of women considered to be obese (BMI > 30.0), and it is positively correlated with age; women between the ages of 40-49 years have the highest proportion (30%) of overweight or obesity, and the age group 15-19 has the lowest proportion at 8% (DHS, 2007). Women with a BMI<18.5 tend to be in the younger age categories.
Agro-nutrition indicators (continued) Source
Infant feeding by age
Children <6 months who are exclusively breastfed 29% UNICEF 2011 Children (6-9 months) who are fed complementary food timely 62% UNICEF 2011 Children (20-23 months) who are still breastfeeding 47 % UNICEF 2011 Coverage rates for micronutrient supplements
% Households consuming adequately iodized salt (> 15ppm) n/a
Vitamin A supplementation in the last 6 months (6-59 months) 43 % DHS 2007 Vitamin A supplementation coverage rate (<2 months postpartum) 62 % DHS 2007
Prevalence of anemia among pre-school children 62.7% DHS 2007
Prevalence of anemia among pregnant women 62.1% WHO 2000
Iron supplementation coverage among women n/a
Infant feeding Early initiation of breastfeeding within one hour of birth occurs with a 67% prevalence rate. Although the median for exclusive breastfeeding is extremely short (less than one month), the mean duration of any breastfeeding is long (20 months). For almost two-thirds of the children, complementary foods are introduced well before the recommended 6 months of age and a significant number of children do not receive appropriate complementary food up to 10-11 months of age. Overall some progress in mean exclusive breastfeeding and the mean duration of breastfeeding rates can be seen in the CFSNS of Liberia 2010 compared to 2006. The exclusive breastfeeding rates for children < 4 months and up to 6 months of age increased by 18.1% and 12.3% respectively (CFSNS, 2010). Micronutrients Reports suggest that 43% of children between 6-59 months received Vitamin A supplementation and more than 60% of women received a Vitamin A supplementation within 2 months of delivery. The majority of women reported taking iron supplements during pregnancy (DHS, 2007). With over half of the population of Liberia suffering from anemia, it is considered a severe public health concern (WHO 2008), yet since micronutrient studies have not been conducted for over a decade, information is not conclusive.
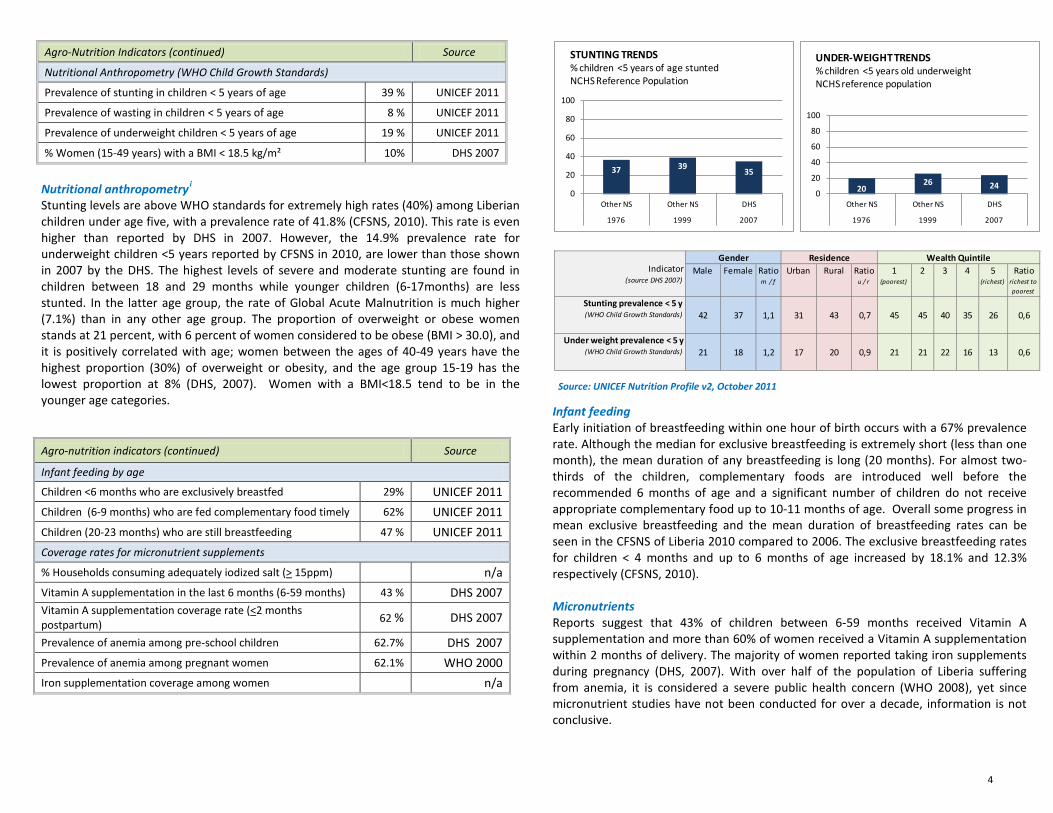
37 39 35
0
20
40
60
80
100
Other NS Other NS DHS
1976 1999 2007
STUNTING TRENDS% children <5 years of age stuntedNCHS Reference Population
2026 24
0
20
40
60
80
100
Other NS Other NS DHS
1976 1999 2007
UNDER-WEIGHT TRENDS% children <5 years old underweightNCHS reference population
Male Female Ratio m / f
Urban Rural Ratio u / r
1 (poorest)
2 3 4 5 (richest)
Ratio richest to poorest
Stunting prevalence < 5 y(WHO Child Growth Standards) 42 37 1,1 31 43 0,7 45 45 40 35 26 0,6
Under weight prevalence < 5 y (WHO Child Growth Standards) 21 18 1,2 17 20 0,9 21 21 22 16 13 0,6
Indicator(source DHS 2007)
Gender Residence Wealth Quintile
Source: UNICEF Nutrition Profile v2, October 2011
5
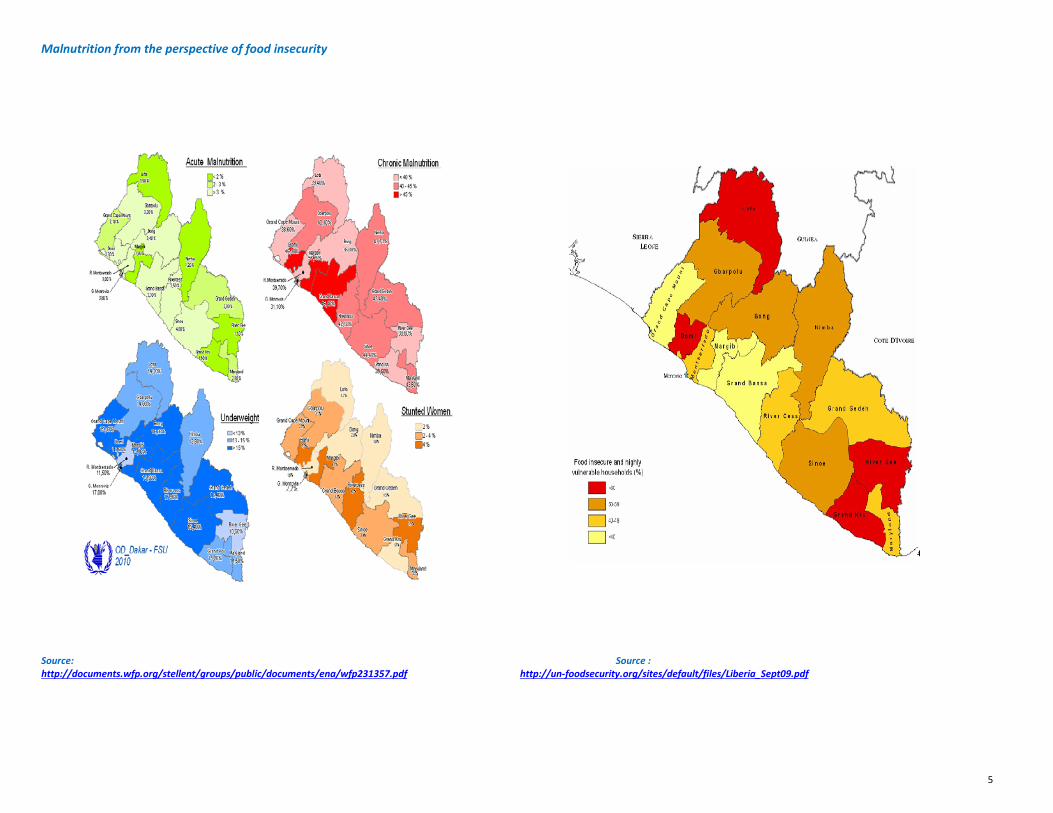
Malnutrition from the perspective of food insecurity Source: Source : http://documents.wfp.org/stellent/groups/public/documents/ena/wfp231357.pdf http://un-foodsecurity.org/sites/default/files/Liberia_Sept09.pdf
6
II. Current nutrition policy framework and implementation mechanisms for improving food security and nutrition Specific strategies and programs currently in place in the food and agriculture sector to improve nutrition
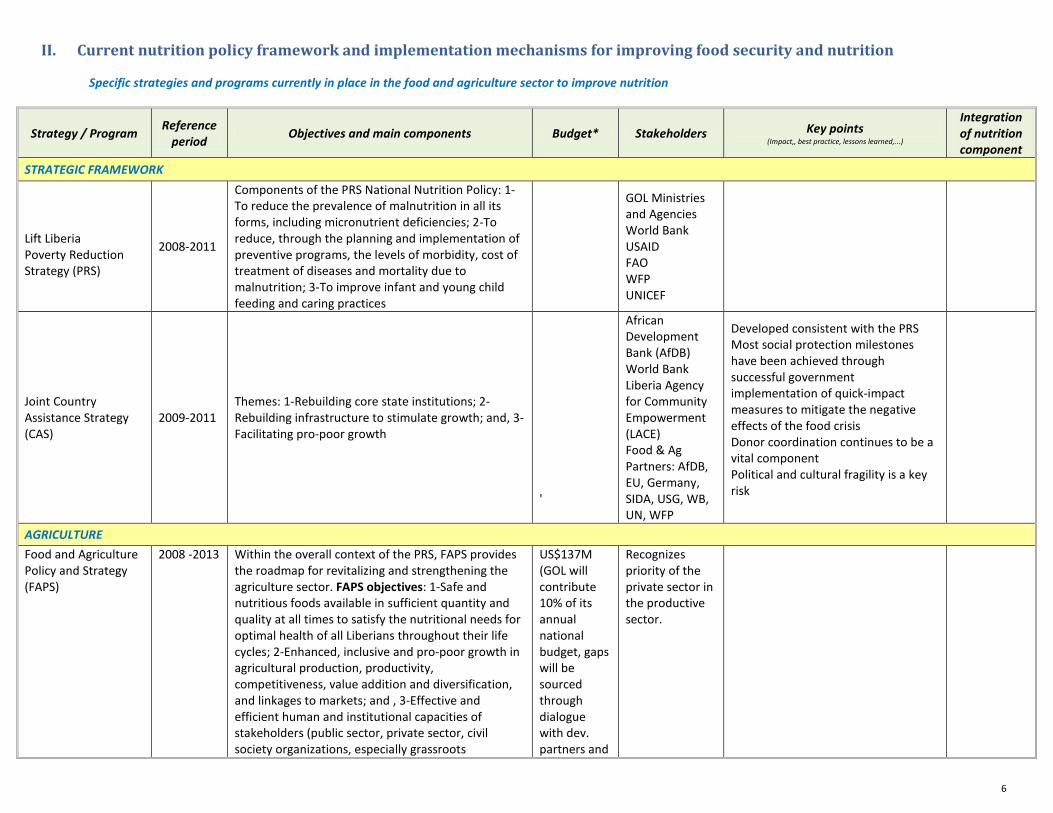
Strategy / Program Reference period Objectives and main components Budget* Stakeholders Key points
(Impact,, best practice, lessons learned,...)
Integration of nutrition component
STRATEGIC FRAMEWORK
Lift Liberia Poverty Reduction Strategy (PRS)
2008-2011
Components of the PRS National Nutrition Policy: 1-To reduce the prevalence of malnutrition in all its forms, including micronutrient deficiencies; 2-To reduce, through the planning and implementation of preventive programs, the levels of morbidity, cost of treatment of diseases and mortality due to malnutrition; 3-To improve infant and young child feeding and caring practices
GOL Ministries and Agencies World Bank USAID FAO WFP UNICEF
Joint Country Assistance Strategy (CAS)
2009-2011 Themes: 1-Rebuilding core state institutions; 2-Rebuilding infrastructure to stimulate growth; and, 3-Facilitating pro-poor growth
'
African Development Bank (AfDB) World Bank Liberia Agency for Community Empowerment (LACE) Food & Ag Partners: AfDB, EU, Germany, SIDA, USG, WB, UN, WFP
Developed consistent with the PRS Most social protection milestones have been achieved through successful government implementation of quick-impact measures to mitigate the negative effects of the food crisis Donor coordination continues to be a vital component Political and cultural fragility is a key risk
AGRICULTURE Food and Agriculture Policy and Strategy (FAPS)
2008 -2013 Within the overall context of the PRS, FAPS provides the roadmap for revitalizing and strengthening the agriculture sector. FAPS objectives: 1-Safe and nutritious foods available in sufficient quantity and quality at all times to satisfy the nutritional needs for optimal health of all Liberians throughout their life cycles; 2-Enhanced, inclusive and pro-poor growth in agricultural production, productivity, competitiveness, value addition and diversification, and linkages to markets; and , 3-Effective and efficient human and institutional capacities of stakeholders (public sector, private sector, civil society organizations, especially grassroots
US$137M (GOL will contribute 10% of its annual national budget, gaps will be sourced through dialogue with dev. partners and
Recognizes priority of the private sector in the productive sector.
7
Strategy / Program Reference period Objectives and main components Budget* Stakeholders Key points
(Impact,, best practice, lessons learned,...)
Integration of nutrition component
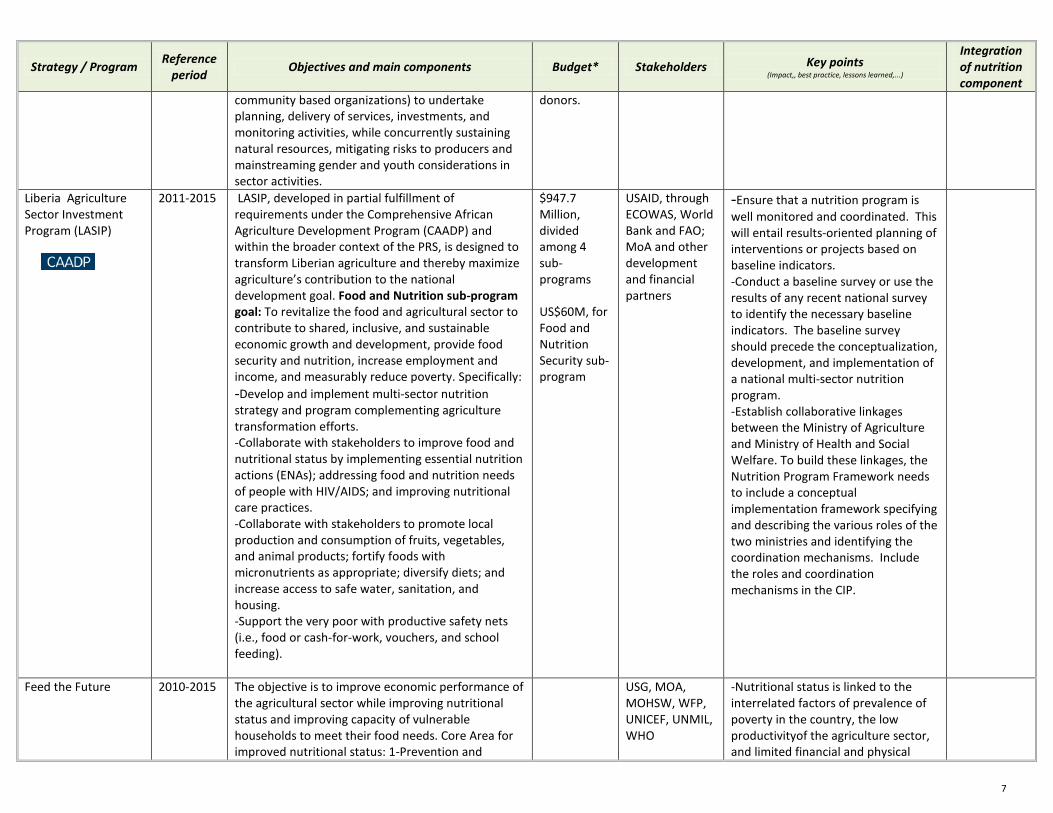
community based organizations) to undertake planning, delivery of services, investments, and monitoring activities, while concurrently sustaining natural resources, mitigating risks to producers and mainstreaming gender and youth considerations in sector activities.
donors.
Liberia Agriculture Sector Investment Program (LASIP)
2011-2015 LASIP, developed in partial fulfillment of requirements under the Comprehensive African Agriculture Development Program (CAADP) and within the broader context of the PRS, is designed to transform Liberian agriculture and thereby maximize agriculture’s contribution to the national development goal. Food and Nutrition sub-program goal: To revitalize the food and agricultural sector to contribute to shared, inclusive, and sustainable economic growth and development, provide food security and nutrition, increase employment and income, and measurably reduce poverty. Specifically: -Develop and implement multi-sector nutrition strategy and program complementing agriculture transformation efforts. -Collaborate with stakeholders to improve food and nutritional status by implementing essential nutrition actions (ENAs); addressing food and nutrition needs of people with HIV/AIDS; and improving nutritional care practices. -Collaborate with stakeholders to promote local production and consumption of fruits, vegetables, and animal products; fortify foods with micronutrients as appropriate; diversify diets; and increase access to safe water, sanitation, and housing. -Support the very poor with productive safety nets (i.e., food or cash-for-work, vouchers, and school feeding).
$947.7 Million, divided among 4 sub-programs US$60M, for Food and Nutrition Security sub-program
USAID, through ECOWAS, World Bank and FAO; MoA and other development and financial partners
-Ensure that a nutrition program is well monitored and coordinated. This will entail results-oriented planning of interventions or projects based on baseline indicators. -Conduct a baseline survey or use the results of any recent national survey to identify the necessary baseline indicators. The baseline survey should precede the conceptualization, development, and implementation of a national multi-sector nutrition program. -Establish collaborative linkages between the Ministry of Agriculture and Ministry of Health and Social Welfare. To build these linkages, the Nutrition Program Framework needs to include a conceptual implementation framework specifying and describing the various roles of the two ministries and identifying the coordination mechanisms. Include the roles and coordination mechanisms in the CIP.
Feed the Future 2010-2015 The objective is to improve economic performance of the agricultural sector while improving nutritional status and improving capacity of vulnerable households to meet their food needs. Core Area for improved nutritional status: 1-Prevention and
USG, MOA, MOHSW, WFP, UNICEF, UNMIL, WHO
-Nutritional status is linked to the interrelated factors of prevalence of poverty in the country, the low productivityof the agriculture sector, and limited financial and physical
8
Strategy / Program Reference period Objectives and main components Budget* Stakeholders Key points
(Impact,, best practice, lessons learned,...)
Integration of nutrition component
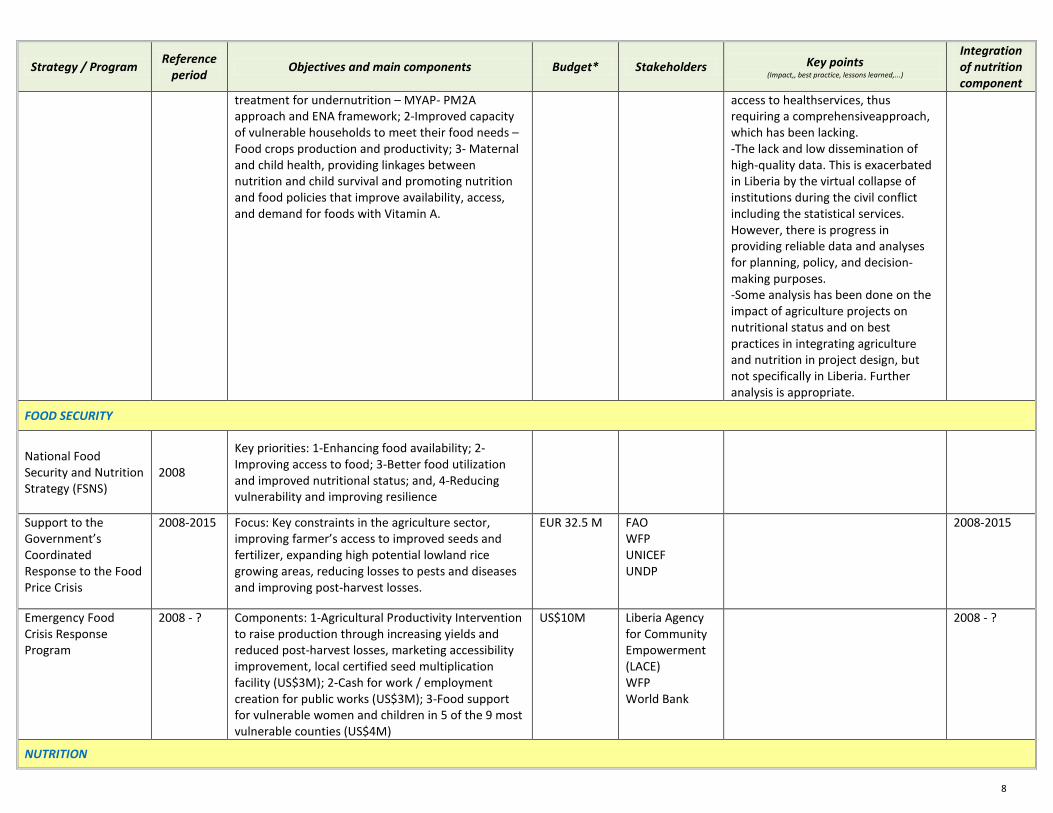
treatment for undernutrition – MYAP- PM2A approach and ENA framework; 2-Improved capacity of vulnerable households to meet their food needs – Food crops production and productivity; 3- Maternal and child health, providing linkages between nutrition and child survival and promoting nutrition and food policies that improve availability, access, and demand for foods with Vitamin A.
access to healthservices, thus requiring a comprehensiveapproach, which has been lacking. -The lack and low dissemination of high-quality data. This is exacerbated in Liberia by the virtual collapse of institutions during the civil conflict including the statistical services. However, there is progress in providing reliable data and analyses for planning, policy, and decision-making purposes. -Some analysis has been done on the impact of agriculture projects on nutritional status and on best practices in integrating agriculture and nutrition in project design, but not specifically in Liberia. Further analysis is appropriate.
FOOD SECURITY
National Food Security and Nutrition Strategy (FSNS)
2008
Key priorities: 1-Enhancing food availability; 2-Improving access to food; 3-Better food utilization and improved nutritional status; and, 4-Reducing vulnerability and improving resilience
Support to the Government’s Coordinated Response to the Food Price Crisis
2008-2015 Focus: Key constraints in the agriculture sector, improving farmer’s access to improved seeds and fertilizer, expanding high potential lowland rice growing areas, reducing losses to pests and diseases and improving post-harvest losses.
EUR 32.5 M FAO WFP UNICEF UNDP
2008-2015
Emergency Food Crisis Response Program
2008 - ? Components: 1-Agricultural Productivity Intervention to raise production through increasing yields and reduced post-harvest losses, marketing accessibility improvement, local certified seed multiplication facility (US$3M); 2-Cash for work / employment creation for public works (US$3M); 3-Food support for vulnerable women and children in 5 of the 9 most vulnerable counties (US$4M)
US$10M Liberia Agency for Community Empowerment (LACE) WFP World Bank
2008 - ?
NUTRITION
9
Strategy / Program Reference period Objectives and main components Budget* Stakeholders Key points
(Impact,, best practice, lessons learned,...)
Integration of nutrition component
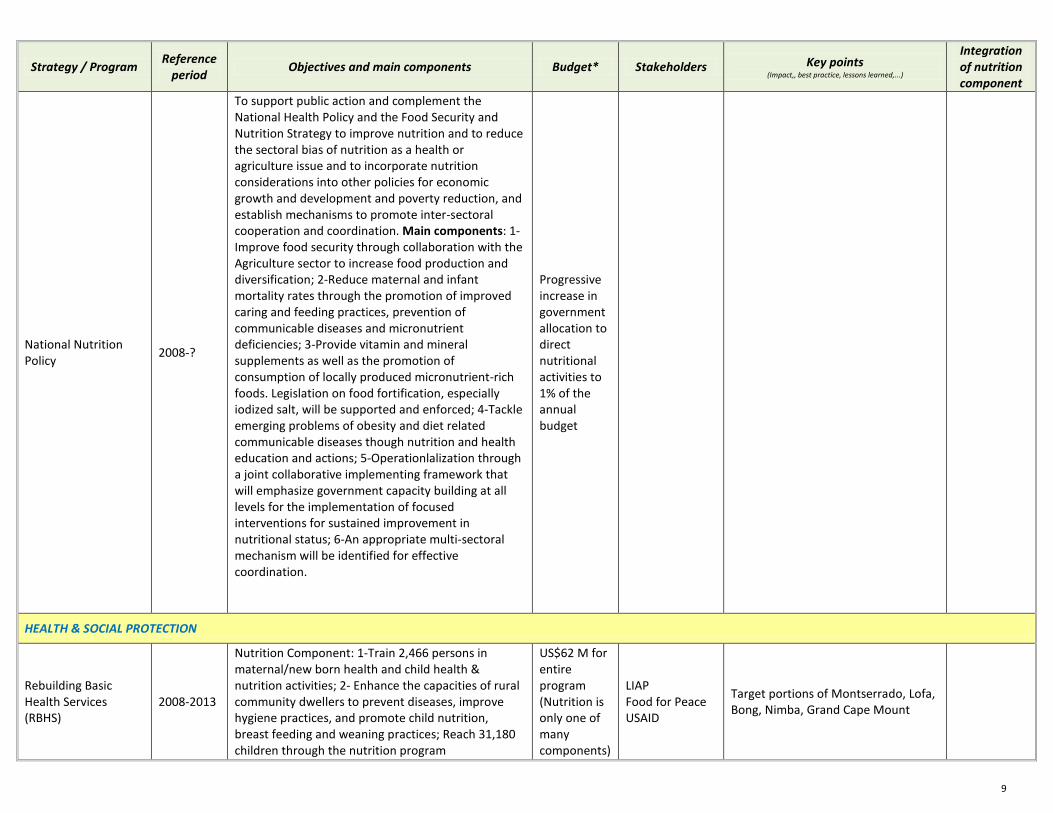
National Nutrition Policy 2008-?
To support public action and complement the National Health Policy and the Food Security and Nutrition Strategy to improve nutrition and to reduce the sectoral bias of nutrition as a health or agriculture issue and to incorporate nutrition considerations into other policies for economic growth and development and poverty reduction, and establish mechanisms to promote inter-sectoral cooperation and coordination. Main components: 1-Improve food security through collaboration with the Agriculture sector to increase food production and diversification; 2-Reduce maternal and infant mortality rates through the promotion of improved caring and feeding practices, prevention of communicable diseases and micronutrient deficiencies; 3-Provide vitamin and mineral supplements as well as the promotion of consumption of locally produced micronutrient-rich foods. Legislation on food fortification, especially iodized salt, will be supported and enforced; 4-Tackle emerging problems of obesity and diet related communicable diseases though nutrition and health education and actions; 5-Operationlalization through a joint collaborative implementing framework that will emphasize government capacity building at all levels for the implementation of focused interventions for sustained improvement in nutritional status; 6-An appropriate multi-sectoral mechanism will be identified for effective coordination.
Progressive increase in government allocation to direct nutritional activities to 1% of the annual budget
HEALTH & SOCIAL PROTECTION
Rebuilding Basic Health Services (RBHS)
2008-2013
Nutrition Component: 1-Train 2,466 persons in maternal/new born health and child health & nutrition activities; 2- Enhance the capacities of rural community dwellers to prevent diseases, improve hygiene practices, and promote child nutrition, breast feeding and weaning practices; Reach 31,180 children through the nutrition program
US$62 M for entire program (Nutrition is only one of many components)
LIAP Food for Peace USAID
Target portions of Montserrado, Lofa, Bong, Nimba, Grand Cape Mount
10
Strategy / Program Reference period Objectives and main components Budget* Stakeholders Key points
(Impact,, best practice, lessons learned,...)
Integration of nutrition component
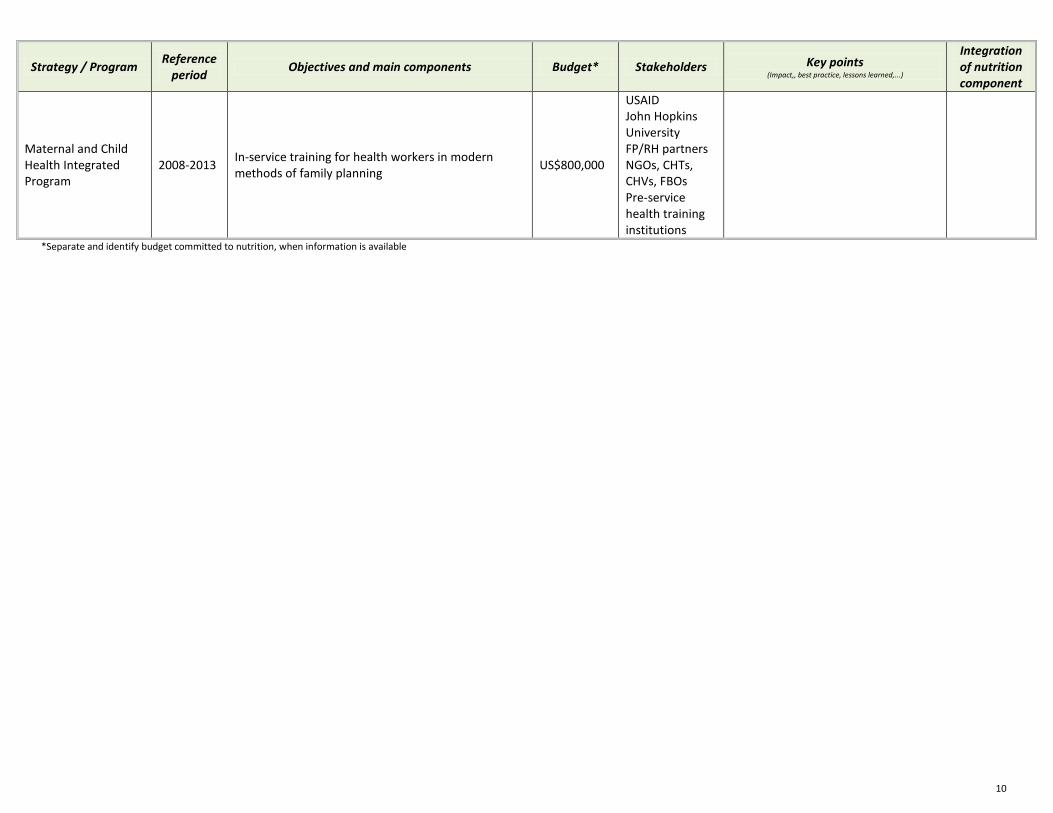
Maternal and Child Health Integrated Program
2008-2013 In-service training for health workers in modern methods of family planning US$800,000
USAID John Hopkins University FP/RH partners NGOs, CHTs, CHVs, FBOs Pre-service health training institutions
*Separate and identify budget committed to nutrition, when information is available
11
Institutional execution framework linked to food security and nutrition Key Points:
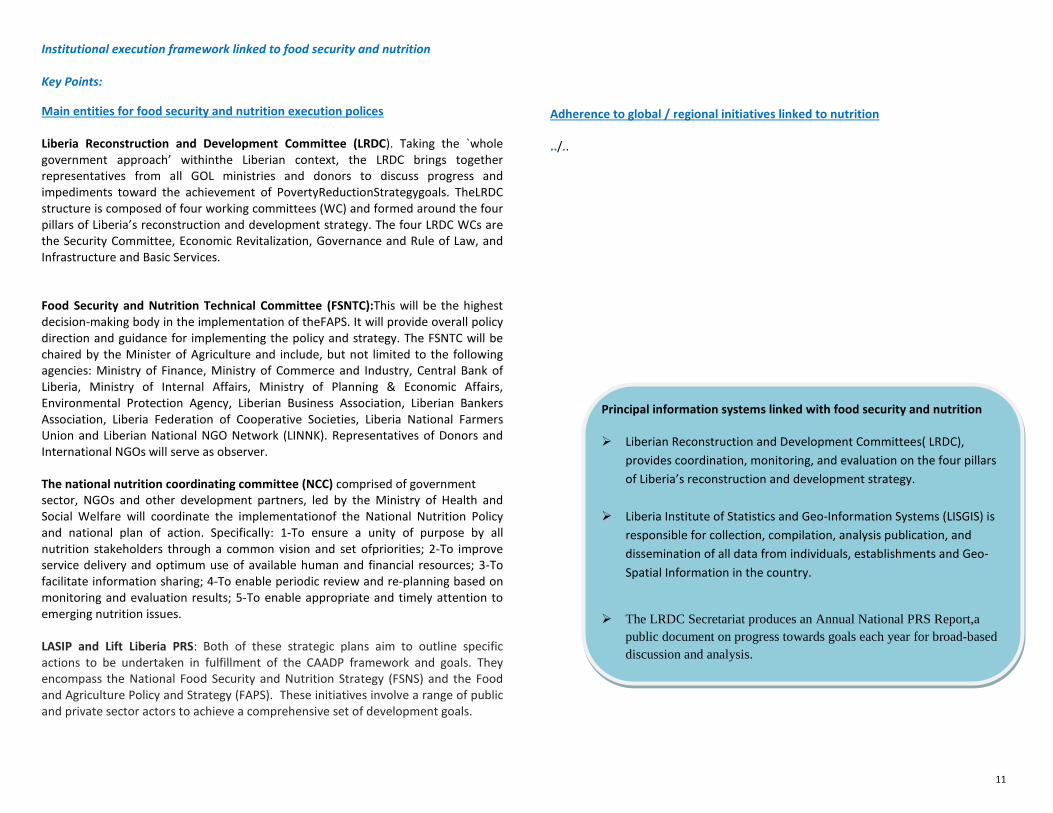
Main entities for food security and nutrition execution polices Liberia Reconstruction and Development Committee (LRDC). Taking the `whole government approach’ withinthe Liberian context, the LRDC brings together representatives from all GOL ministries and donors to discuss progress and impediments toward the achievement of PovertyReductionStrategygoals. TheLRDC structure is composed of four working committees (WC) and formed around the four pillars of Liberia’s reconstruction and development strategy. The four LRDC WCs are the Security Committee, Economic Revitalization, Governance and Rule of Law, and Infrastructure and Basic Services.
Food Security and Nutrition Technical Committee (FSNTC):This will be the highest decision-making body in the implementation of theFAPS. It will provide overall policy direction and guidance for implementing the policy and strategy. The FSNTC will be chaired by the Minister of Agriculture and include, but not limited to the following agencies: Ministry of Finance, Ministry of Commerce and Industry, Central Bank of Liberia, Ministry of Internal Affairs, Ministry of Planning & Economic Affairs, Environmental Protection Agency, Liberian Business Association, Liberian Bankers Association, Liberia Federation of Cooperative Societies, Liberia National Farmers Union and Liberian National NGO Network (LINNK). Representatives of Donors and International NGOs will serve as observer.
The national nutrition coordinating committee (NCC) comprised of government sector, NGOs and other development partners, led by the Ministry of Health and Social Welfare will coordinate the implementationof the National Nutrition Policy and national plan of action. Specifically: 1-To ensure a unity of purpose by all nutrition stakeholders through a common vision and set ofpriorities; 2-To improve service delivery and optimum use of available human and financial resources; 3-To facilitate information sharing; 4-To enable periodic review and re-planning based on monitoring and evaluation results; 5-To enable appropriate and timely attention to emerging nutrition issues. LASIP and Lift Liberia PRS: Both of these strategic plans aim to outline specific actions to be undertaken in fulfillment of the CAADP framework and goals. They encompass the National Food Security and Nutrition Strategy (FSNS) and the Food and Agriculture Policy and Strategy (FAPS). These initiatives involve a range of public and private sector actors to achieve a comprehensive set of development goals.
Adherence to global / regional initiatives linked to nutrition ../..
Principal information systems linked with food security and nutrition Liberian Reconstruction and Development Committees( LRDC),
provides coordination, monitoring, and evaluation on the four pillars of Liberia’s reconstruction and development strategy.
Liberia Institute of Statistics and Geo-Information Systems (LISGIS) is responsible for collection, compilation, analysis publication, and dissemination of all data from individuals, establishments and Geo-Spatial Information in the country.
The LRDC Secretariat produces an Annual National PRS Report,a
public document on progress towards goals each year for broad-based discussion and analysis.
12
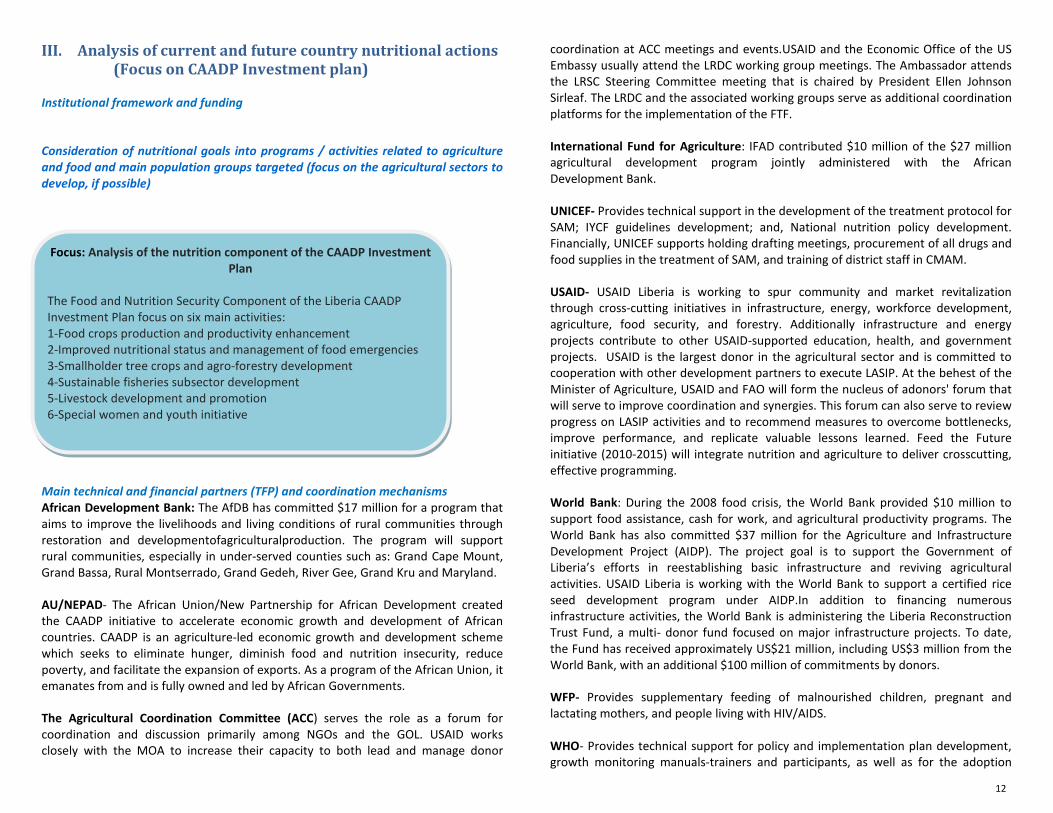
III. Analysis of current and future country nutritional actions (Focus on CAADP Investment plan)
Institutional framework and funding
Consideration of nutritional goals into programs / activities related to agriculture and food and main population groups targeted (focus on the agricultural sectors to develop, if possible)
Main technical and financial partners (TFP) and coordination mechanisms African Development Bank: The AfDB has committed $17 million for a program that aims to improve the livelihoods and living conditions of rural communities through restoration and developmentofagriculturalproduction. The program will support rural communities, especially in under-served counties such as: Grand Cape Mount, Grand Bassa, Rural Montserrado, Grand Gedeh, River Gee, Grand Kru and Maryland.
AU/NEPAD- The African Union/New Partnership for African Development created the CAADP initiative to accelerate economic growth and development of African countries. CAADP is an agriculture-led economic growth and development scheme which seeks to eliminate hunger, diminish food and nutrition insecurity, reduce poverty, and facilitate the expansion of exports. As a program of the African Union, it emanates from and is fully owned and led by African Governments.
The Agricultural Coordination Committee (ACC) serves the role as a forum for coordination and discussion primarily among NGOs and the GOL. USAID works closely with the MOA to increase their capacity to both lead and manage donor
coordination at ACC meetings and events.USAID and the Economic Office of the US Embassy usually attend the LRDC working group meetings. The Ambassador attends the LRSC Steering Committee meeting that is chaired by President Ellen Johnson Sirleaf. The LRDC and the associated working groups serve as additional coordination platforms for the implementation of the FTF.
International Fund for Agriculture: IFAD contributed $10 million of the $27 million agricultural development program jointly administered with the African Development Bank.
UNICEF- Provides technical support in the development of the treatment protocol for SAM; IYCF guidelines development; and, National nutrition policy development. Financially, UNICEF supports holding drafting meetings, procurement of all drugs and food supplies in the treatment of SAM, and training of district staff in CMAM.
USAID- USAID Liberia is working to spur community and market revitalization through cross-cutting initiatives in infrastructure, energy, workforce development, agriculture, food security, and forestry. Additionally infrastructure and energy projects contribute to other USAID-supported education, health, and government projects. USAID is the largest donor in the agricultural sector and is committed to cooperation with other development partners to execute LASIP. At the behest of the Minister of Agriculture, USAID and FAO will form the nucleus of adonors' forum that will serve to improve coordination and synergies. This forum can also serve to review progress on LASIP activities and to recommend measures to overcome bottlenecks, improve performance, and replicate valuable lessons learned. Feed the Future initiative (2010-2015) will integrate nutrition and agriculture to deliver crosscutting, effective programming.
World Bank: During the 2008 food crisis, the World Bank provided $10 million to support food assistance, cash for work, and agricultural productivity programs. The World Bank has also committed $37 million for the Agriculture and Infrastructure Development Project (AIDP). The project goal is to support the Government of Liberia’s efforts in reestablishing basic infrastructure and reviving agricultural activities. USAID Liberia is working with the World Bank to support a certified rice seed development program under AIDP.In addition to financing numerous infrastructure activities, the World Bank is administering the Liberia Reconstruction Trust Fund, a multi- donor fund focused on major infrastructure projects. To date, the Fund has received approximately US$21 million, including US$3 million from the World Bank, with an additional $100 million of commitments by donors.
WFP- Provides supplementary feeding of malnourished children, pregnant and lactating mothers, and people living with HIV/AIDS. WHO- Provides technical support for policy and implementation plan development, growth monitoring manuals-trainers and participants, as well as for the adoption
Focus: Analysis of the nutrition component of the CAADP Investment Plan
The Food and Nutrition Security Component of the Liberia CAADP Investment Plan focus on six main activities: 1-Food crops production and productivity enhancement 2-Improved nutritional status and management of food emergencies 3-Smallholder tree crops and agro-forestry development 4-Sustainable fisheries subsector development 5-Livestock development and promotion 6-Special women and youth initiative
13
process of NGS and training of health staff of the NGS. Financially, WHO provides support for computer training of staff to improve surveillance, training of trainers on NGS, and training for District staff on NGS. Additionally, WHO provides logistical support for vehicles, screening tools, office equipment, computers and accessories.
Monitoring and evaluation mechanisms (M&E) The LRDC Secretariat will be the key institution responsible for reporting on M&E. This will involve consolidating the M&E outputs and outcomes at the national level in close collaboration with LISGIS to ensure the quality and consistency of the data and statistics. The LRDC Secretariat, working in tandem with LISGIS, will produce annual reports on progress towards each of the indicators for review by the Pillars, the Cabinet, and the LRDC Steering Committee. This information will be published as part of an Annual National PRS Progress Report for public dissemination and discussion. To the maximum extent possible, these reports will detail indicators by gender, age, and county, extracting the relevant information from the reports generated by line ministries and agencies. There will be a mid-term evaluation of the PRS as well as a full evaluation of the strategy in 2011 at the conclusion of the implementation period. As Liberia moves towards decentralizing political authority, it is becoming increasingly important for county officials to have quality data at their disposal. This will begin during the PRS period through the generation of county-by-county reports based on county-disaggregated data emerging from line ministries and LISGIS survey instruments. This will be a collaborative effort of the LRDC Secretariat and LISGIS, with support from the UN’s county-based Information Management Offices (IMOs), which will eventually evolve into County Statistics Units (CSUs). CAADP : In the NAFSIP, indicators to measure the performance of the nutrition activities are the following:
- Dietary Diversity Score (DDS) - Proportion of the population below minimum dietary energy consumption - Prevalence of underweight children under 5 years of age - Global Hunger Index
There is a strong need to improve the result base framework to fully address M&E needs, and to strengthen the different data collection, analysis and reporting structures at all levels. The framework should be operational and roles and responsibilities of different actors have to be clarified. Mobilize adequate funding is necessary, including core funding from the government ministries.
Focus on public / private partnerships President JohnsonSirleaf, a Harvard-trained banker and administrator, has taken steps to reduce corruption, build support from international donors, and encourage private investment. Embargos on timber and diamond exports have been lifted, opening new sources of revenue for the government. Liberia shipped its first major timber exports to Europe in 2010. The shift in government policy to rely on the private sector for financing development is therefore central to expanding the resource base to adequately support development activities. As Government takes steps to increase meaningful private sector involvement, it is acutely aware that private sector participation without a good policy and regulatory framework will not improve sector performance. CAADP : The NAFSIP mentioned the role of the private sector in agriculture and a number of opportunities exist for public- private partnership to address food and nutrition security i.e. food fortification, value addition, provision of agric inputs, market linkages Managerial and technical capacities at the institutional level Currently managerial and technical capacities are constrained by collaboration with the agricultural sector. Specifically the nutrition and agricultural sectors plan separately, informational exchanges need to be improved, and collaboration is further constrained by inadequately trained staff proficient at fostering synergistic relationships between nutrition and agriculture. National surveys will be coordinated and in some cases conducted by LISGIS in line with its mandate. To complement these surveys, individual line ministries and agencies will provide other PRS relevant data. Some information will flow from the counties and will be aggregated at the national level. Survey reports by international organizations such as Transparency International will be used to supplement the national data collection effort.
Most data will originate within a given line ministry at either the local or national level (see Figure 13.1 below). LISGIS will then be responsible for ensuring the quality of the data and will eventually forward vetted national data to the LRDC Secretariat. The LRDC Secretariat will share data with the relevant Pillars and produce a National PRS Progress Report annually, which will be broadly distributed throughout Liberia and made available on the internet through a dedicated GoLwebsite.
Sustainability of actions
14
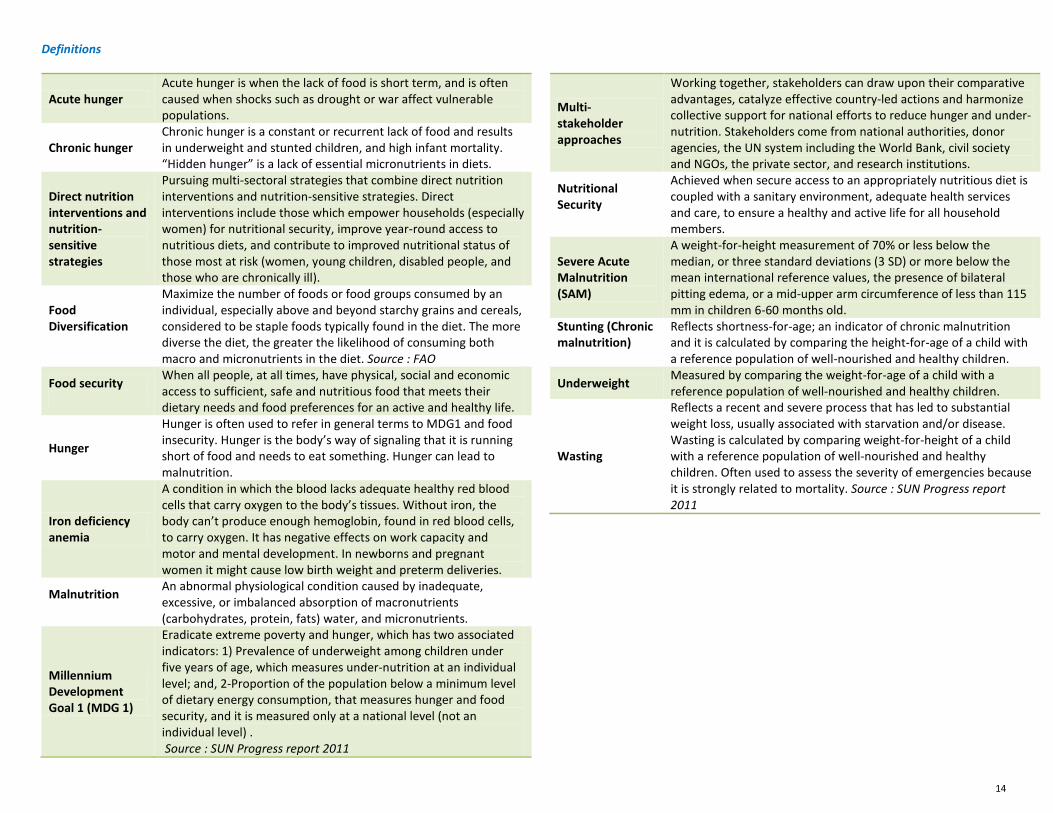
Definitions
Acute hunger Acute hunger is when the lack of food is short term, and is often caused when shocks such as drought or war affect vulnerable populations.
Chronic hunger Chronic hunger is a constant or recurrent lack of food and results in underweight and stunted children, and high infant mortality. “Hidden hunger” is a lack of essential micronutrients in diets.
Direct nutrition interventions and nutrition-sensitive strategies
Pursuing multi-sectoral strategies that combine direct nutrition interventions and nutrition-sensitive strategies. Direct interventions include those which empower households (especially women) for nutritional security, improve year-round access to nutritious diets, and contribute to improved nutritional status of those most at risk (women, young children, disabled people, and those who are chronically ill).
Food Diversification
Maximize the number of foods or food groups consumed by an individual, especially above and beyond starchy grains and cereals, considered to be staple foods typically found in the diet. The more diverse the diet, the greater the likelihood of consuming both macro and micronutrients in the diet. Source : FAO
Food security
When all people, at all times, have physical, social and economic access to sufficient, safe and nutritious food that meets their dietary needs and food preferences for an active and healthy life.
Hunger
Hunger is often used to refer in general terms to MDG1 and food insecurity. Hunger is the body’s way of signaling that it is running short of food and needs to eat something. Hunger can lead to malnutrition.
Iron deficiency anemia
A condition in which the blood lacks adequate healthy red blood cells that carry oxygen to the body’s tissues. Without iron, the body can’t produce enough hemoglobin, found in red blood cells, to carry oxygen. It has negative effects on work capacity and motor and mental development. In newborns and pregnant women it might cause low birth weight and preterm deliveries.
Malnutrition
An abnormal physiological condition caused by inadequate, excessive, or imbalanced absorption of macronutrients (carbohydrates, protein, fats) water, and micronutrients.
Millennium Development Goal 1 (MDG 1)
Eradicate extreme poverty and hunger, which has two associated indicators: 1) Prevalence of underweight among children under five years of age, which measures under-nutrition at an individual level; and, 2-Proportion of the population below a minimum level of dietary energy consumption, that measures hunger and food security, and it is measured only at a national level (not an individual level) . Source : SUN Progress report 2011
Multi-stakeholder approaches
Working together, stakeholders can draw upon their comparative advantages, catalyze effective country-led actions and harmonize collective support for national efforts to reduce hunger and under-nutrition. Stakeholders come from national authorities, donor agencies, the UN system including the World Bank, civil society and NGOs, the private sector, and research institutions.
Nutritional Security
Achieved when secure access to an appropriately nutritious diet is coupled with a sanitary environment, adequate health services and care, to ensure a healthy and active life for all household members.
Severe Acute Malnutrition (SAM)
A weight-for-height measurement of 70% or less below the median, or three standard deviations (3 SD) or more below the mean international reference values, the presence of bilateral pitting edema, or a mid-upper arm circumference of less than 115 mm in children 6-60 months old.
Stunting (Chronic malnutrition)
Reflects shortness-for-age; an indicator of chronic malnutrition and it is calculated by comparing the height-for-age of a child with a reference population of well-nourished and healthy children.
Underweight Measured by comparing the weight-for-age of a child with a reference population of well-nourished and healthy children.
Wasting
Reflects a recent and severe process that has led to substantial weight loss, usually associated with starvation and/or disease. Wasting is calculated by comparing weight-for-height of a child with a reference population of well-nourished and healthy children. Often used to assess the severity of emergencies because it is strongly related to mortality. Source : SUN Progress report 2011
15
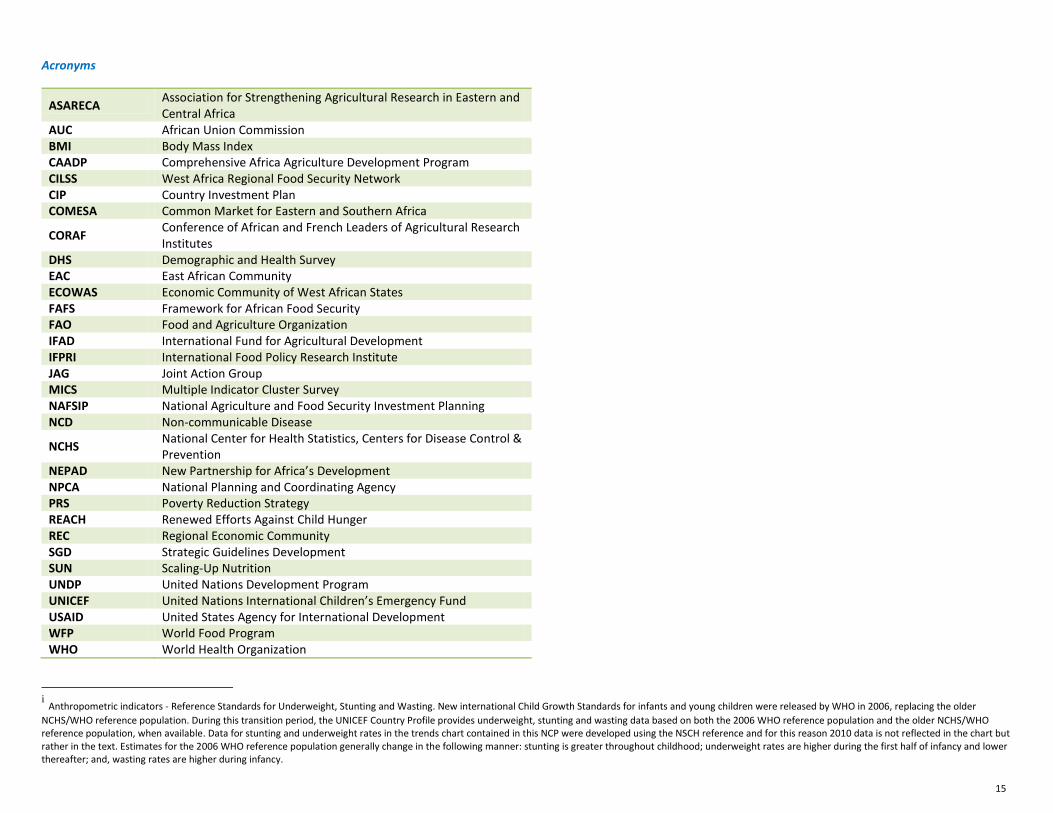
Acronyms
ASARECA Association for Strengthening Agricultural Research in Eastern and Central Africa
AUC African Union Commission BMI Body Mass Index CAADP Comprehensive Africa Agriculture Development Program CILSS West Africa Regional Food Security Network CIP Country Investment Plan COMESA Common Market for Eastern and Southern Africa
CORAF Conference of African and French Leaders of Agricultural Research Institutes
DHS Demographic and Health Survey EAC East African Community ECOWAS Economic Community of West African States FAFS Framework for African Food Security FAO Food and Agriculture Organization IFAD International Fund for Agricultural Development IFPRI International Food Policy Research Institute JAG Joint Action Group MICS Multiple Indicator Cluster Survey NAFSIP National Agriculture and Food Security Investment Planning NCD Non-communicable Disease
NCHS National Center for Health Statistics, Centers for Disease Control & Prevention
NEPAD New Partnership for Africa’s Development NPCA National Planning and Coordinating Agency PRS Poverty Reduction Strategy REACH Renewed Efforts Against Child Hunger REC Regional Economic Community SGD Strategic Guidelines Development SUN Scaling-Up Nutrition UNDP United Nations Development Program UNICEF United Nations International Children’s Emergency Fund USAID United States Agency for International Development WFP World Food Program WHO World Health Organization
i Anthropometric indicators - Reference Standards for Underweight, Stunting and Wasting. New international Child Growth Standards for infants and young children were released by WHO in 2006, replacing the older NCHS/WHO reference population. During this transition period, the UNICEF Country Profile provides underweight, stunting and wasting data based on both the 2006 WHO reference population and the older NCHS/WHO reference population, when available. Data for stunting and underweight rates in the trends chart contained in this NCP were developed using the NSCH reference and for this reason 2010 data is not reflected in the chart but rather in the text. Estimates for the 2006 WHO reference population generally change in the following manner: stunting is greater throughout childhood; underweight rates are higher during the first half of infancy and lower thereafter; and, wasting rates are higher during infancy.