Embed Size (px)
Citation preview

Comprehension of Software Analysis Data Using 3D Visualization
Andrian Marcus, Louis Feng, Jonathan I. Maletic Department of Computer Science
Kent State University Kent Ohio 44242
330 672 9039 [email protected], [email protected], [email protected]
Abstract The paper presents a software visualization
application-framework that utilizes a variety of 3D metaphors to represent large software system and related analysis data. The 3D representation is based on the SeeSoft pixel representation and extends that original metaphor by rendering the visualization in a 3D space. Object-based manipulation methods and simultaneous alternative mappings are available to the user. The visual elements, mappings, and user interactions implemented and used by the framework are described with respect to their support for software understanding tasks. Examples are presented and discussed to demonstrate how the system’s current features support the needs of the user.
1. Introduction
Large-scale software maintenance and development involve a variety of application tasks. These tasks range from coding and debugging, to design and re-engineering. The underlying theme is that all development and maintenance tasks require some level of understanding of the associated software system and documentation. This is the promise of visualization tools – that they can assist the user in (better) understanding an aspect of the software. This can range from uncovering bottlenecks in execution data or identifying poor architecture or design. These two problems are quite orthogonal with respect to the types of understanding necessary for problem solving.
These different software engineering tasks should be addressed by different visual representations. That is, we should use the most appropriate visualization mechanism for the given task.
In [15], Maletic et al defines a set of issues important for software visualization systems. They include the: task – why is the visualization needed; audience – who will use the visualization; target – what is the data source to represent; representation – how to represent it; and medium – where to represent the visualization. In the
work presented here we focus on using different representations to address particular tasks with regards to improving comprehension.
In this paper, we present the sv3D (source viewer 3D) application-framework, which implements a 3D visual metaphor for software visualization. Our 3D visual metaphor is based on the SeeSoft representation [1, 4]. It brings a number of extensions to the original concept. SeeSoft [1, 4], was proposed by Eick et al. in the early 90’s and is one of the most well known software visualization tools. Several attributes of the SeeSoft metaphor warrant its success and usefulness. One of the most important of these attributes is the natural and direct mapping from the visual metaphor to the source code and back. This in turn leads to a natural navigation between the representations. These features make the visual representation easy to understand; yielding high levels of trust on behalf of the user. Color and pixel maps are used to show relationships between elements of a software system (rather than graph-based representations). This supports the visualization of large amounts of source code, the non-trivial relationships, and data on a standard 2D visualization medium (e.g., monitor or screen). Many other software visualization tools use graph-based representations that suffer from scalability, layout, and mapping problems.
Along with the 3D extension to SeeSoft we have added a number of new visualization mechanisms. Our intent is to show that adding new representations, coupled with advanced user interaction facilities, yields a richer tool to support comprehension of the software under examination. In designing sv3D we tried to bring together results from information visualization, human computer interaction, and program comprehension.
The next section presents related work in the field that motivates our approach along with some discussion of 3D visualization. The architecture, implementation, and main features of sv3D are presented in the following sections. Examples and applications of sv3D are shown with respect to the new representations and visualization mechanisms. The paper concludes with a discussion of the aspects of sv3D that are under development and require further research.

2. Related Work
SeeSoft-like representations are used by a number of existing tools: Tarantula [11], The Aspect Browser [8], The Aspect mining Tool [9], Bee/Hive [17], GSEE [6], Advizor [5], etc.
Despite its success, SeeSoft and most of its versions have noted limitations. Namely, use of 2D pixel bars limits the number of attributes that can be visualized. Also, the type of relationships that can be shown, in particular hierarchical relationships, are difficult to represent. Additionally, one of the major strengths of the metaphor (i.e., direct linking to the source code) yields one of the metaphors weaknesses that is, little support for multiple abstraction levels and limited usage of the 2D space.
A number of improvements of the original SeeSoft representation have been made by various researchers. In particular, Tarantula [11] uses brightness to represent an extra attribute (dimension). However as noted by its authors, brightness is confusing and poorly perceived by the user. Bee/Hive [17] introduces the file maps, which make use of texture and the third dimension in the visualization. The file maps form only one view supported by Bee/Hive. By supporting multiple views of the data and multiple data sources, Bee/Hive overcomes many of the limitations of the SeeSoft view. However, the supported user interactions are somewhat limited for the 3D renderings; in particular it supports only space-based manipulation, and as such suffering from some of the problems inherent to 3D visualizations (e.g., occlusion).
sv3D builds on the success of this research, while trying to address some of the inherent limitations of the medium and representation.
3. 2D versus 3D Representations
No visualization method addresses all the needs of the users. A standard approach to address additional user’s needs is to offer multiple views of the data as done by [17, 19]. Using one view of the data limits the number of attributes and the available exploration space. The solution we propose to overcome this problem is the efficient use of a 3D space for visualization.
Visualization in the 2D space has been actively explored. Many techniques for generating diagrams, graphs, and mapping information to the 2D representation have also been studied extensively. Although the question of what benefits 3D representation offer over 2D still remains to be answered, some experiments have given optimistic results. These results further motivate our work presented here.
The work of Hubona, Shirah and Fout [10] suggest that users' understanding of a 3D structure improves
when they can manipulate the structure. Ware and Franck [21] indicate that displaying data in three dimensions instead of two can make it easier for users to understand the data. In addition, the error rate in identifying routes in 3D graphs is much smaller than 2D [22]. The CyberNet system [3] shows that mapping large amount of (dynamic) information to 3D representation is beneficial, regardless of the type of metaphors (real or virtual) used. 3D representations have also been shown to better support spatial memory tasks than 2D [20].
The debate in the information and software visualization fields on the 2D vs. 3D battle is still heated. We support the results that show the advantages of 3D representations. Additionally, the use of 3D representations of software in new mediums, such as virtual reality environments, are starting to be explored [13, 14]. In our view the design of these representations and the underlying mapping to the data is the most important aspect for a successful 3D visualization. The following section describes the design details and rationales behind sv3D.
4. The sv3D Framework
sv3D is a software visualization application-framework that builds on the SeeSoft metaphor. It brings a number of major enhancements over SeeSoft-type representations:
• It creates 3D renderings of the raw data. • Various artifacts of the software system and their
attributes can be mapped to the 3D metaphors, at different abstraction levels.
• It implements improved user interactions and object level manipulation.
• It is independent of the analysis tool and it accepts a simple and flexible input in XML format. The output of various analysis tools can be translated to sv3D input format.
• Its design and implementation are extensible as an application framework.
4.1. Elements of the Visualization
A defined visual language/presentation has to be effective and expressive enough to provide good results in visualization. In other words, the available metaphors have to be simple, yet allow us to represent all the information we desire to visualize. The relationship between data values and visual parameters has to be a univocal; otherwise, if more than one data value is mapped onto the same visual parameter than it will be impossible to distinguish one value’s influence from the other. The power of a visualization is derived from its semantic richness, simplicity, and level of abstraction. The aim is to develop a visual language with few

Figure 1 shows a close-up on a container highlighting the elements that support representation of analysis data. In this view each poly cylinder represents a line of text from the source code associated with the container. The visual components of the container represent values from the associated data file. The diameter of a poly cylinder is adjustable and is defined in the mapping.
metaphors and constructs, but with the ability to represent a variety of elements with no ambiguity or loss of meaning. The visual metaphors in the language should be simple, having a familiar form and straightforward mapping to the target.
We intentionally separated visualization from data collection and sv3D is designed to work with a variety of analysis tools as an independent visualization front-end. Therefore, the input format to sv3D is kept as generic as possible.
Future versions of sv3D will also support container position in the space, relationships between containers, and texture of the poly cylinders. This will allow representation of hierarchical data and other relationships between software elements.
We define a sv3D application P as a quadruple { , , , }P V D S M= :
V defines the visual metaphors to be used. D represents the data resulted from software analysis stored as a set of filesD d , corresponding to a set of source code files . defines the mapping between data and visualization as a set of relations .
1 2{ , ,..., }nd d=
1 2{ , ,S s s=
im D∈
..., }ns
S× ×
1 2,{ ,..., }kM m m m=
VEach source code file is composed of lines of
text . For each source code files there is an associated analysis data filed D . Each is an XML file with elements e d corresponding to a line of text t . Each element
has a set of attributes that contain the analysis data . In the current version of sv3D
each attribute is linked to an element of the visualization , by a mapping m . The number of
elements in the visualization is fixed but the number of the attributes in the data is not. If there are more attributes than visual elements, the user will decide which ones will be represented or the system chooses a subset automatically. The same is true if the number of visual elements exceeds the number of data attributes.
is S∈
i ∈
1 2{ , ,..., }pi i i is t t t=
id
1 2{ , ,..., }qik ik ike a a a
V
i
=
v ∈
i ∈ik i∈
ki s∈
M
i
.
ike
ik
j
Expressiveness and effectiveness were the guiding principles in defining the visual elements and the default mappings. In addition, we must balance two opposing issues with regard to the user namely, the simultaneous display of as much information as possible and the dangers of information overload.
Figure 1. A container, in sv3D, with the elements of the visualization: poly cylinders, height, depth, color and
position.
Currently sv3D supports mapping to the following elements of the visualization, defined in V :
• Poly cylinder - p sv3D provides the user with a set of default mappings and in the current version sv3D maps a container o to a source code file s . Each poly cylinder
i
i j ip o∈ is
mapped to a line of source code ji∈i
i
+
t . The coordinates and of a poly cylinder within in the container are determined by the position in the source code file, with a fixed width of the container. Finally, the first four attributes in every element of d are mapped to cylinder colors (c and c ), height ( z ), and depth ( z ) respectively.
s
xp yp
+ −
−
• Poly cylinder container - o • Poly cylinder position in the container on its o
axis - p x
x
• Poly cylinder position in the container on its o axis - p
y
y
• Poly cylinder height - z +• Poly cylinder depth - z −
• Poly cylinder color on o axis - c z+ +
• Poly cylinder color on o axis - c z− − The user can define, save, or load mappings, as well as define and save views that highlight different elements of the visualization. These views preserve a current state
• Poly cylinder shape - σEvery element v is a nine-tuple: j V∈
- -{ , , , , , , , , }j x yv p o p p z z c c σ+ +=
of the visualization (i.e., the source data, the mapping, and the current manipulations and visual parameters).
The default mapping is not ideally suited for all user needs. When defining custom mappings, the user needs to consider what types of data can be mapped to each visual element. Some elements are better suited for quantitative data, some for categorical data. In different views, certain elements cannot convey information as well as in others. Poly cylinder height, depth, and color are best suited for quantitative data representation. Shape and texture are suited for categorical data representation. Only a very few shapes and textures should be used (2-3 types each). In addition, these attributes of the visualization are less effective at increased zoom levels and loose their effectiveness during overviews. Reducing the diameter of the cylinder to one pixel will of course remove this information from the visualization.
Position within containers and links between containers are best suited for representation of relations.
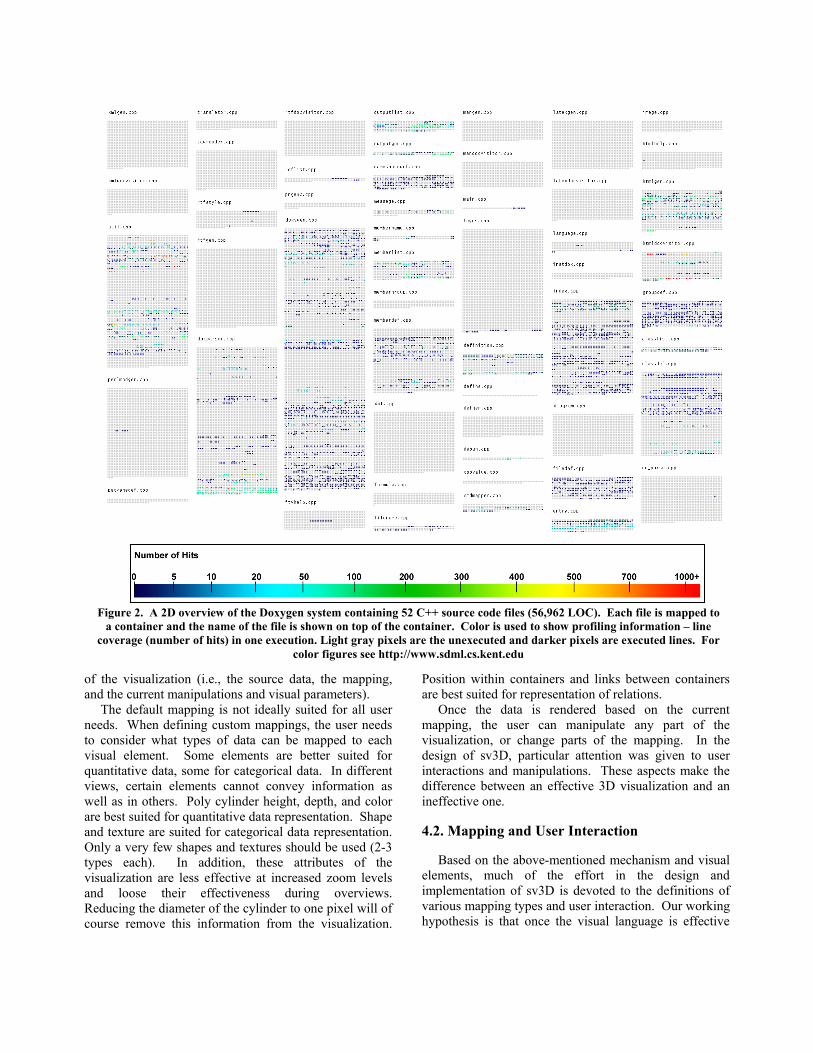
Figure 2. A 2D overview of the Doxygen system containing 52 C++ source code files (56,962 LOC). Each file is mapped to a container and the name of the file is shown on top of the container. Color is used to show profiling information – line
coverage (number of hits) in one execution. Light gray pixels are the unexecuted and darker pixels are executed lines. For color figures see http://www.sdml.cs.kent.edu
Once the data is rendered based on the current mapping, the user can manipulate any part of the visualization, or change parts of the mapping. In the design of sv3D, particular attention was given to user interactions and manipulations. These aspects make the difference between an effective 3D visualization and an ineffective one.
4.2. Mapping and User Interaction
Based on the above-mentioned mechanism and visual elements, much of the effort in the design and implementation of sv3D is devoted to the definitions of various mapping types and user interaction. Our working hypothesis is that once the visual language is effective

and expressive enough, interaction and mapping are the two most important elements that ensure the success of the visualization. By offering a variety of mapping and interaction mechanisms we can ensure that the user will be able to generate a representation that best suits their needs. Our view of the representation and user interactions aspects of a software visualization system subsumes many of the taxonomical categories proposed by Price [16] and Roman [18].
qac2atodccthCcliares1res
cylinder/pixel. This type of mapping allows representation of fairly large systems. The same abstraction mechanism allows definitions of mappings such that a function or a class is represented by a container (see figure 3). By allowing these types of mappings, sv3D can generate multiple views of a software system at different abstraction levels. Different engineering or maintenance tasks require understanding of the system at various granularity levels. When debugging for example, the user needs to see information (e.g., a static or dynamic program slice) at line of code level. For reverse engineering activities a high-level view of the system (e.g., classes and/or files) would typically be more useful.
As discussed previously, by using 3D metaphors we can show more information in the visualization and more complex data. The height of a cylinder is better suited for representation of quantitative data than color. In order to make this mapping even more effective future versions of sv3D will also represent the projection on Ox and Oy axis of the data points from the Oz axis, similar to the way Advizor [5] shows this type of information.
One of the major drawbacks of 3D renderings is occlusion. sv3D allows the user to deal with occlusion in three different ways. One is through direct manipulation of one or more containers (i.e., object and space manipulation). Two types of manipulators are available: handle box (figure 4a) for scaling and stretching, and track ball (figure 4b) for rotation, along each axis. More than that, the visualization can be paned and zoom in or out. Figures 3 through 5 each show a few containers zoomed in and rotated in different angles. The position of the camera and light are fixed. While this is a simple mechanism it is often unpractical to rotate parts of the
Figure 3. A 3D view of three functions from the file
utils.cpp in Doxygen. Both color and height represent the same attribute (i.e., lines of code coverage as in figure 2). The values for the height are normalized.
One of the goals of sv3D is to preserve all the
ualities of the original SeeSoft pixel representation and s such sv3D can present a SeeSoft view by using ylinders with a fixed height (i.e., height as zero). Figure shows the overview of a system with 52 files and pproximately 56,000 lines of code. This view is similar the original SeeSoft metaphor and makes use of a two
imensional space to render the visualization. Each ontainer is mapped to a source code file and each ylinder/pixel to a line of text. File names are present in e view, but they can be discarded if the user chooses. olor is used to represent specific attributes of the source ode (e.g., here color represents profiling information, ne coverage in a particular execution). This feature llows for the overview of large software systems and lationships between different components. On a usual
creen, reducing the width of the pixels to 1, more than 00,000 lines of text with associated data can be presented. The user can choose to map a function (or
ome other meaningful program entity) to a
visualization or find camera angles and zoom levels that suit multiple containers simultaneously.
The second method to deal with occlusion is through transparency. The user can define various transparency levels for elements of the visualization based on the values of their attributes. For example, cylinders of certain colors or height can be shown at a certain transparency level. Figure 5b shows the same file and container as figure 5a. In this view all the colors except brown (medium gray scale) are 85% transparent. By using transparency, the need for excessive direct manipulation of the visualization is reduced. In particular, parts of the visualization can be made 100% transparent.
The third option of the user to handle occlusion is elevation [2]. Figure 5c shows again the same file and container as figure 5a. This time the container is split on five levels. Each levels shows a number of functions separated from the other colors.

apsiv
[7]. In addition, the 3D space allows arranging the containers in any position. We are also exploring ways to use links between the 3D containers and arrange them in a graph layout, much as we proposed in [14].
It has been shown that presenting the user multiple views of the same system fosters better understanding [17, 19]. To support this concept, sv3D allows the user to define custom mappings to display different views of the analyzed system. For example the user may choose to represent attribute a1 with color and attribute a2 with height. In a different mapping the user may want to reverse this mapping (i.e., map a1 to height and a2 to color). Different mappings not only better suit different type of data, but also different types of users. Figures 4a and 4b show such a reversed mapping. Each figure shows the same file and the same attributes, but color and height are mapped differently.
sv3D not only allows the user to define new mappings but allows the display of these mapping in the same space. We call this feature simultaneous alternative mapping. There are two types of simultaneous alternative mappings that we propose. One is depicted in figures 4a and 4b. Both views can be displayed at the same time and each representation can be manipulated separately or together with its alternate.
The second type of simultaneous alternative mapping separates one mapping into two components and shows each sub-mapping in the same view. Figures 6a, 6b, and 6c show such an example. In figure 6a color, height, and depth are used for mapping. Figures 6b and 6c show the same file and attributes but depth is not used in this mapping. Instead, two containers are created, each using height and color only. The height of the cylinders in the figure 6c corresponds to the depth used in figure 6a. Once again, these alternate views can be shown simultaneously, a feature that offers the user a chance to evaluate which view best support their needs.
4.3. Implementation of sv3D
The user needs were the driving factors in the design and implementation of sv3D and a high degree of extensibility, flexibility, and performance is necessary. In order to achieve these goals sv3D is designed as an extensible application-framework using Qt (see www.trolltech.com) for the user interface and Open Inventor [23] for the rendering components. The SoQt Toolkit (see www.coin3d.org) allows sv3D to use Qt and
Figure 4a. A 3D representation of one file from Doxygen (outputlist.cpp). The container represents the file; each cylinder represents a function; the color represents the hit count for each function; the height of the cylinder
represents execution time of the function. A handle box manipulator is active on the container.
Figure 4b. An simultaneous alternative mapping for the file in figure 4a. Color and height mappings are reversed. The container represents the file; each
cylinder represents a function; the height represents the hit count for each function; the color of the cylinder
represents execution time of the function. A track ball manipulator is active on the container.
While the use of color and 3D in the visualization
llow representation of various types of relationships, ixel bar charts [12] and its variations do not directly upport representation of hierarchical data. We are nvestigating a variant representation based on set-based isualizations of overlapping classification hierarchies
Open Inventor together to generate applications. Qt is a well known cross platform GUI framework
(Linux KDE is built using Qt). Qt offers great portability and generates common user interfaces. Since sv3D is intended to be used in concert with other analysis tools on various platforms, Qt was a natural choice for the GUI implementation.

OpenGL has long been the standard cross platform API for high quality, high performance interactive 3D visualizations. However, a higher level toolkit suitable for developing large visualization applications is beneficial. Open Inventor is an open source high level C++ object oriented toolkit originally developed at SGI. The toolkit is system-independent and runs on major platforms, such as Windows, Linux, and UNIX.
The data processing and mapping component is currently implemented in two steps. The processing step converts the value of each entity attribute to an internal representation, normally as integers. The internal representation of the visualization is a scene graph allowing the management of complex visualizations. A scene graph consists of 3D objects, called nodes, arranged in a tree structure. Complex objects are composed of collections of other simpler objects. The visualization is rendered by traversing the tree. Scene graph objects are constructed by creating a new instance of the desired class and are accessed and manipulated using the methods of the class. Nodes can be added or removed from the scene graph dynamically allowing run time user interaction. Open Inventor provides a number of customizable manipulators to handle user interactions. sv3D uses a standard Open Inventor file format to load and store the 3D scene database and exchange with other applications.
The input data for a sv3D application is in XML format and sv3D utilizes the SAX XML parser in Qt to process data files. We partially addressed one of the burning issues in software visualization (i.e., scalability) and all the implementation is in C++ and therefore offers considerably higher efficiency in 3D rendering than Java3D.
Figure 5a. A 3D representation of one file from Doxygen (outputlist.cpp). The container represents the file; each cylinder represents a line of code; the color represents the function to which the line part of; the height of the cylinder represents the hit count for the associated line.
Figure 5b. One function is selected, while the others are represented with 85% transparency.
In addition, sv3D is designed such that the user can
extend its functionality easily. The core components of sv3D are designed as an application framework. A number of hot spots are provided that allow the user to customize the framework and generate applications that best suit its needs. The GUI can be extended and new methods for mapping and new visual elements can be defined. The user can also extend the framework to define collaborations with other tools.
Figure 5c. Several functions are selected (based on
color) and elevated from the container.

5. Using sv3D to Support Comprehension
SeeSoft-like tools have a variety of uses in assisting the user solving software engineering and comprehension tasks. Obviously, sv3D can be used for all these tasks such as: fault localization [11], visualization of execution traces [17], source code browsing [8, 9], impact analysis, evolution, complexity, and slicing [1], etc. In addition, by allowing visualization of additional information (via 3D), sv3D can be used for solving other more complex tasks. For example, in the case of Tarantula [11], using height instead of brightness would improve the visualization and make the user’s task easier.
sasepusppse
Figure 6b. Simultaneous alternative mapping for the view in figure 6a. It shows the same file with height
mapped to the same attribute, no depth, and no color.
Figure 6c. Simultaneous alternative mapping for the
view in figure 6a. It shows the same file (outputlist.cpp)
Figure 6a. A 3D representation of one file from Doxygen (outputlist.cpp). The container represents the file; each
cylinder represents a line of text; the color represents the execution time of the function the lines is part of; the
height of the cylinder represents line hit count; and the depth of the cylinder represents function hit count.
Section 4.2 discussed how the features of sv3D can
upport the user to gain a better understanding of the nalysis data. We revisit some of these views in this ection, explaining the analysis data that is shown. The xample is based on what is described in [1] using rofiling information to identify execution hot spots. We sed a freely available version of Doxygen (a tool for oftware documentation generation). To obtain the rofiling data we used the Microsoft Visual Studio rofiling tool. A simple parsing converts the output into v3D input format. Table 1 shows the statistics of the xecution.
with height mapped to the attribute originally mapped by depth, no current depth, and original color.
Table 1. Profiling data for one execution of Doxygen Number of files: 52 Total functions: 7,944 Function coverage: 31.7% Total function hits: 955,098 Call depth: 47 Total time: 1,351.145 millisecond Time not in funct: 34.168 millisecond Number of lines: 56,962 Line coverage: 18.5% Total line hits: 3,253,792
Figure 2 shows a 2D overview of Doxygen, where each .cpp file is mapped to a container and each pixel to a line of code. The color represents the number of hits on a

particular line of code. The mapping to the color is straightforward using the RGB scheme on a continuous color subset ranging from dark blue to red (seen as gray scale here). Figure 3 shows a different granularity mapping. Each container is mapped to a function from a file (utils.cpp). Color is mapped the same way as in figure 2. Height is mapped the same (normalized) attribute. If the task of the user is to identify the “hot points” in the execution, from this dual mapping, color seems to be a better choice than height, that is it is easier for the user to identify a color in the 3D space than compare the heights.
Of particular interest are the locations in the program where the execution takes a long time or those lines of code and/or function that have a very high hit count. As shown by the figure 2 overview, color is a good choice to map one of these attributes if viewing the system in a 2D space (i.e., one attribute mapped to color). However, if the user needs both types of information, at various granularity levels, use of 3D is an added benefit for comprehension. Figure 4a shows the representation of a single file from the Doxygen system (i.e., outputlist.cpp), rendered in the 3D space. The container represents the file, while each cylinder maps a function from the file. It is a higher level of granularity view than the one in the previous view. As mentioned, choosing a higher granularity level allows representation of data for larger systems. The economy in space yields an easier and more efficient manipulation. For example, the active manipulator in the figure allows the user to stretch or scale the figure 4a along every axis. The color of a cylinder represents the hit count for each function, using the same color conversion as in figure 2. The height of the cylinder represents the normalized execution time of the function in milliseconds.
Figure 4b shows an alternate mapping, where color and height mappings are reversed. The container represents the file. Each cylinder represents a function, the height of the cylinder represents the hit count for each function, and the color of the cylinder shows the normalized execution time of the function. The user can see both mappings at the same time and choose to manipulate them simultaneously with a track ball, a handle box, pan, or zoom. This way the user can decide which mapping offers the best view of the system, thus promoting a better understanding. Such a decision is of course highly subjective and depends on the user. However, some heuristics can be defined so that the default mapping conforms to some rules.
Figures 6a, 6b, and 6c show another simultaneous alternative view. In figure 6a one file from Doxygen is represented (i.e., outputlist.cpp). The container represents the file; each cylinder represents a line of text; the color represents the execution time of the function the lines is part of; the height of the cylinder represents line
hit count; and the depth of the cylinder represents function hit counts. In this example each dimension in the 3D space is used in the representation. While the represented information is dense it can be easily studied through manipulation. Occlusion is very probable when both height and depth are used. If space is no issue and also transparency or elevation is not preferred by the user, an alternative mapping can be defined and displayed. Figures 6b and 6c show the same information as in figure 6a and this time the container is duplicated and one copy (figure 6b) shows the top half of the original, while the other (figure 6c) shows the bottom half of the original (n.b., with no gravity settings, top and bottom are relatively defined with respect to the static image from figure 6a). This type of alternative mapping allows a better distribution of the information across the 3D space and reduces the complexity of the elements. Depending on the user task, a more complex representation could be preferred to a simpler, yet broaden view.
6. Conclusions and Future Work
The paper presents sv3D, an application framework for software visualization. It is based on the SeeSoft [4] pixel representation and 3D File Maps [17]. It brings a number of extensions to these concepts, especially in regard to the manipulation of the 3D structures. Using transparency, elevation, 3D object-based manipulators, and simultaneous alternative mappings sv3D overcomes many of the shortcomings of 3D visualizations such as occlusion. These features offer the user more flexibility in defining views. The presented examples, while simple, show how using 3D allows the representation of multiple attributes and simultaneous alternative mappings in one view.
In the future versions, position of the cylinder within a container will represent some other type of information. In its current version, sv3D only represent poly cylinders with 4 edges and uniform fill. Variable number of edges will be supported and also different textures. We need to define these visual attributes very carefully to ensure their usefulness. As mentioned previously, containers in the 3D space may be connected by edges to form a 3D graph. This will allow representation of hierarchical data and also diagrammatic visualizations such as UML class diagrams.
Several aspects are important to make sure that sv3D fully exploits the advantages of the 3D space. First, a stereoscopic version (sv3Ds) is being implemented. This will be used with passive stereo displays and allow the user to experience depth of the image through stereopsis.
One of the major problems of software visualization tools is scalability. By using the 3D space, sv3D deals with the real estate problem. However, efficiency is the

limiting factor for 3D renderings, in general. In the current version, sv3D performs exceptionally well in representing up to 40-50 KLOC. For larger software systems the performance of the rendering and user interaction is reduced. We are working on making the rendering more efficient. We expect that the next version will be very efficient in representing systems in the 100 KLOC range.
Finally, we need to conduct controlled user studies to better assess the degree of support sv3D offers for various comprehension tasks.
7. Acknowledgement
This work was supported in part by grants from the Office of Naval Research N00014-00-1-0769 and the National Science Foundation CCR-02-04175.
8. References
[1] Ball, T. and Eick, S., "Software Visualization in the Large", Computer, vol. 29, no. 4, April 1996, pp. 33-43.
[2] Chuah, M. C., Roth, S. F., Mattis, J., and Kolojejchick, J., "SDM: Selective Dynamic Manipulation of Visualizations", in Readings in Information Visualization Using Vision to Think, Card, S. K., MacKinlay, J. D., and Shneiderman, B., Eds., San Francisco, CA Morgan Kaufmann, 1999, pp. 263-275.
[3] Dos Santos, C. R., Gros, P., Abel, P., Loisel, D., Trichaud, N., and Paris, J. P., "Mapping Information onto 3D Virtual Worlds", in Proceedings of International Conference on Information Visualization (IV '00), London, England, July 19-21 2000.
[4] Eick, S., Steffen, J. L., and Summer, E. E., "Seesoft - A Tool For Visualizing Line Oriented Software Statistics", IEEE Transactions on Software Engineering, vol. 18, no. 11, November 1992, pp. 957-968.
[5] Eick, S. G., "Visual Discovery and Analysis", IEEE Transaction on Visualization and Computer Graphics, vol. 6, no. 1, January/March 2000, pp. 44-58.
[6] Favre, J.-M., "A Flexible Approach to Visualize Large Software Products", in Proceedings of ICSE'01 Workshop on Software Visualization, Toronto, Ontario, May 12-13 2001.
[7] Graham, M., Kennedy, J. B., and Hand, C., "A Comparison of Set-Based and Graph-Based Visualisations of Overlapping Classification Hierarchies", in Proceedings of AVI 2000, Palermo, Italy, May 23-26 2000.
[8] Griswold, W. G., Yuan, J. J., and Kato, Y., "Exploiting the Map Metaphor in a Tool for Software Evolution", in Proceedings of 23rd IEEE International Conference on Software Engineering (ICSE'01), Toronto, Ontario, May 12-19 2001, pp. 265-274.
[9] Hannemann, J. and Kiczales, G., "Overcoming the Prevalent Decomposition in Legacy Code", in Proceedings of ICSE 2001
Advanced Separation of Concerns Workshop, Toronto, Canada, May 15 2001.
[10] Hubona, G. S., Shirah, G. W., and Fout, D. G., "3D Object Recognition with Motion", in Proceedings of CHI'97, 1997, pp. 345-346.
[11] Jones, J. A., Harrold, M. J., and Stasko, J. T., "Visualization for Fault Localization", in Proceedings of ICSE 2001 Workshop on Software Visualization, Toronto, Ontario, Canada, 2001, pp. 71-75.
[12] Keim, D. A., Hao, M. C., Dayal, U., and Hsu, M., "Pixel bar charts: a visualization technique for very large multi-attribute data sets", Information Visualization, vol. 1, no. 1, March 2002, pp. 20-34.
[13] Knight, C. and Munro, M., "Comprehension with[in] Virtual Environment Visualisations", in Proceedings of Seventh IEEE International Workshop on Program Comprehension (IWPC'99), Pittsburgh, PA, 5-7 May 1999, pp. 4-11.
[14] Maletic, J. I., Leigh, J., Marcus, A., and Dunlap, G., "Visualizing Object Oriented Software in Virtual Reality", in Proceedings of International Workshop on Program Comprehension, Toronto, Canada, May 21-13 2001, pp. 26-35.
[15] Maletic, J. I., Marcus, A., and Collard, M. L., "A Task Oriented View of Software Visualization", in Proceedings of IEEE Workshop of Visualizing Software for Understanding and Analysis, Paris, France, June 26 2002, pp. 32-40.
[16] Price, B. A., Baecker, R. M., and Small, I. S., "A Principled Taxonomy of Software Visualization", Journal of Visual Languages and Computing, vol. 4(2), 1993, pp. 211-266.
[17] Reiss, S. P., "Bee/Hive: A Software Visualization Back End", in Proceedings of ICSE 2001 Workshop on Software Visualization, Toronto, Ontario, Canada, 2001, pp. 44-48.
[18] Roman, G.-C. and Cox, K. C., "A Taxonomy of Program Visualization Systems", IEEE Computer, vol. 26, no. 12, December 1993, pp. 11-24.
[19] Storey, M.-A. D., Best, C., and Michaud, J., "SHriMP Views: An Interactive Environment for Exploring Java Programs", in Proceedings of Ninth International Workshop on Program Comprehension (IWPC'01), Toronto, Ontario, Canada, May 12-13 2001, pp. 111-112.
[20] Tavanti, M. and Lind, M., "2D vs 3D, Implications on Spatial Memory", in Proceedings of IEEE Symposium on Information Visualization (INFOVIS'01), San Diego, CA, October 22-23 2001, pp. 139-148.
[21] Ware, C. and Franck, G., "Viewing a Graph in a Virtual Reality Display is Three Times as Good as a 2D Diagram", in Proceedings of IEEE Visual Languages, 1994, pp. 182-183.
[22] Ware, C., Hui, D., and Franck, G., "Visualizing Object Oriented Software in Three Dimensions", in Proceedings of CASCON'93, Toronto, Ontario, Canada, October 1993, pp. 612-620.
[23] Wernecke, J., The Inventor Mentor, 2nd ed., Addison-Wesley Publishing Company, 1994.