Embed Size (px)
Citation preview
JOURNAL OF SOFTWAREMAINTENANCE AND EVOLUTION: RESEARCH AND PRACTICEJ. Softw. Maint. Evol.: Res. Pract. 2009; 21:189–215Published online 16 April 2009 inWiley InterScience (www.interscience.wiley.com). DOI: 10.1002/smr.408
Research
Comprehend and analyzeknowledge networks toimprove software evolution
Christian Del Rosso∗,†
Nokia Research Center, Itamerenkatu 11-13, 00180 Helsinki, Finland
SUMMARY
When a set of people are connected by a set of meaningful social relationships we talk of a socialnetwork. A social network represents a social structure and the underlying structural patterns can beused to analyze and comprehend how people relate to each other and their emergent behavior as a group.Developing software is fundamentally a human activity. Developers cooperate and exchange knowledgeand information, creating in fact, a particular type of social network that we call knowledge network. Inthis paper we investigate knowledge networks in software development teams by applying social networkanalysis and we use the Apache web server as a case study. By analyzing the structural communicationand coordination patterns in Apache we have been able to identify the Apache knowledge network,highlight potential communication bottlenecks, and find brokers and important coordination points in thesoftware development team. Furthermore, our work enables a software architect to analyze and maintainthe organization and the software architecture aligned during software evolution. An important lessonthat we have is that the analysis of knowledge networks constitutes an additional tool to be added to thetraditional software architecture assessment methods. Copyright © 2009 John Wiley & Sons, Ltd.
Received 28 August 2008; Revised 12 January 2009; Accepted 18 February 2009
KEY WORDS: social network analysis; software development; knowledge management; global softwareengineering
1. INTRODUCTION
Software development is fundamentally a human activity [1]. Software creation requires creativity,technical expertise and a mixture of other combined factors that makes it very hard, if not impossible,to establish the productivity of developers or estimate software project costs. Additionally, given a
∗Correspondence to: Christian Del Rosso, Nokia Research Center, Itamerenkatu 11-13, 00180 Helsinki, Finland.†E-mail: [email protected], [email protected]
Copyright q 2009 John Wiley & Sons, Ltd.
190 C. DEL ROSSO
set of requirements, different software architects will create different software designs. From theaforementioned observations it can be deduced that software development is a knowledge-intensiveactivity.To complicate software development further, software projects nowadays are not made single-
handedly but are the product of the work of different developers often distributed geographically.Offshoring and outsourcing are now common forms of software development and collaboration isfundamental. Improving software development in this context means being able to understand andimprove coordination and communication, often overcoming difficulties arising from culture, timezone, and language differences [2,3].Collaboration and interactions between knowledge-intensive software developers can be repre-
sented by a network where the nodes, the developers, are linked using relationships which are oftencomputer mediated. The developers’ interaction during the software project, which leads to the finalsoftware, is the product of the emergent behavior of the knowledge network. As a consequence,being able to understand these complex relationships would certainly improve the comprehensionof a software project.In this scenario, social network analysis (SNA) can be used to comprehend the software devel-
opment activity. Several properties of software development can be extracted by analyzing thestructural properties of developers’ social network. Furthermore, studying software developmentteams also includes the analysis of the software architecture and the software itself.The contribution of this paper is the use of SNAmetrics and methodology to comprehend software
development and improve software comprehension and evolution. The study has implications in allthe phases of software creation, from the hard part (the software) to the soft part (the organization).The metrics presented are then applied to the Apache web server, a successful and the most knownweb server at the moment. The distributed nature of the Apache software development process andthe related computer-mediated social network is the focus of the case study.In the following section, Section 2, we present the problem statement and the research questions
that we are going to address in this paper. Section 3 presents the SNA approach with the associatedmetrics. In Section 4 we discuss the SNA approach in the context of software engineering. Thediscussion of our contributions and the answers to the research questions are in Section 8. Theconclusions of this work are in Section 9.
2. PROBLEM STATEMENT AND RESEARCH QUESTIONS
Software comprehension is fundamental to ensure software evolution. The complexity of modernsoftware systems can be managed only if software developers and architects have the tools tocomprehend and understand such complexity.Software evaluation and comprehension can be addressed at different abstraction layers [4].
Various distinctions and classifications can be made and below we give a broad overview mainly toclarify where to position this work. Starting from the lowest level, the software source code can beanalyzed. To improve software, source code analysis and refactoring are used at this level. At thehigher level of abstraction, reverse architecting techniques are used to extract the software archi-tecture from the system. At the next higher level of abstraction, we have organizational structuresand developers’ activities can be analyzed.
Copyright q 2009 John Wiley & Sons, Ltd. J. Softw. Maint. Evol.: Res. Pract. 2009; 21:189–215DOI: 10.1002/smr
COMPREHEND AND ANALYZE KNOWLEDGE NETWORKS 191
These abstraction layers are not isolated. At every abstraction layer there are dependenciesbetween the layers at different levels of abstraction as well as dependencies at the same level.For example, at the software architecture level, UML packages have dependencies with otherUML packages. Additionally, UML packages have dependencies with the layers below, whereobjects are represented by functions, classes, and source code. At the abstraction levels abovethe architectural level, UML packages have dependencies with developers and organizationalentities.Dependencies are everywhere and the ability to extract and comprehend them is essential. Various
research questions can be addressed and Conway’s [5] is the reference and starting point for ourinvestigation.The distributed nature of software development and the related communication problems makes
tools and analysis that address these issues necessary to improve software quality and evolution.Being able to understand the social structure of software development can improve the awarenessof responsibilities, roles, and expertise in software development teams. Additionally, the formaland informal social structure shapes the software and vice versa, and these implications should beanalyzed and evaluated.In this paper we analyze the social structure of software development teams and aim at under-
standing the meaning and implications to software and software development. Even though theseconcepts can appear abstract at this stage, in the following sections we will describe both thetheory and the practical implications of this work. Some of the questions this analysis allowsus to answer are:
• Is the software architecture structured with people assigned to well-defined roles and compo-nents, or the roles are not static and people contribute to many different components? Is theorganization flat or hierarchical?
• Who are the persons with a wide understanding of both the software and the people in thesoftware project?
• Who works with whom? How does the works get done in terms of collaboration and coordi-nation?
• Does the software architecture decomposition match the structure of the organization?(Conway’s Law)
• How to improve the software architecture decomposition?• Do the people assigned to different components communicate? And who are the brokers?• Does the geographical distribution of the teamsmatch the software architecture decomposition?• How many people work on each software component? Who are they?• Which are the most complex software components in our project?• Where does the expertise lie in the software development team?
3. SOCIAL NETWORK STRUCTURAL ANALYSIS
The main goal of SNA is to detect and interpret patterns of social ties among actors. SNA has beenintroduced by sociologists [6–8] but interest in the subject has risen among physicists and managers.Applications of SNA have found place in various areas such as knowledge management [9],
Copyright q 2009 John Wiley & Sons, Ltd. J. Softw. Maint. Evol.: Res. Pract. 2009; 21:189–215DOI: 10.1002/smr
192 C. DEL ROSSO
the study of the structure of scientific publications and collaborations, electric grids, computer spam,and natural phenomena [10].From a mathematical point of view, a network is a graph G that is an ordered pair of disjoint
sets (V,E), where V is a non-empty set of elements called vertices, notes, or points, and a subsetE of ordered pairs of distinct elements of V , called directed edges, arcs or links. An edge may joina vertex to itself and an edge can also be undirected [11].Applying SNA to software developers means translating and applying SNA analysis to soft-
ware development teams and their relationships. In this social network, vertices are represented bydevelopers and their social relationships can be extracted using various means, including computer-mediated communications or using questionnaires and interviews. In the context of software devel-opment various social relationships can be used and analyzed, for example, trust, knowledge of acertain domain, department affiliation, and geographical distribution of teams. Once the hypothesisis made and the scope of the analysis decided, the analyst will define the social relationship torepresent the ties in the social network.In the following subsections we introduce definitions and metrics used in SNA and other concepts
needed for the comprehension of the analysis. The main references used are [6–8], additionalreferences are given in the subsections.
3.1. Density, cohesion, and distance
Network density expresses the level of connectivity in a network and it is defined as the number oflines in a network, expressed as a proportion of the maximum possible number of lines. A completenetwork is a network with maximum density and where all the vertices have direct connections.A network with high density has a high number of connections between ties and consequentlyprovides an easy flow of information and represents a flat organization/social network structure.However, this measure is affected by the number of vertices in a network, since it is easier to havea complete network with a few vertices than to have a complete social network made of thousandsof nodes. Therefore, when using the network density metric it is important to compare networks ofsimilar size.Another useful measure to understand a network structure is the cohesion of the network.
Cohesion is defined as the average of the shortest paths between each pair of vertices in the network.A low score for cohesion in a network highlights a flow of information without boundaries. On thepositive side, the information is more democratic and the search for information is facilitated. Onthe negative side, the flow of information might flood the network.In this paper we use the concept of distance and, therefore, the term must be clarified. In our
work, the distance between two vertices is the geodesic distance. A geodesic is the shortest pathbetween two vertices.
3.2. Center and periphery
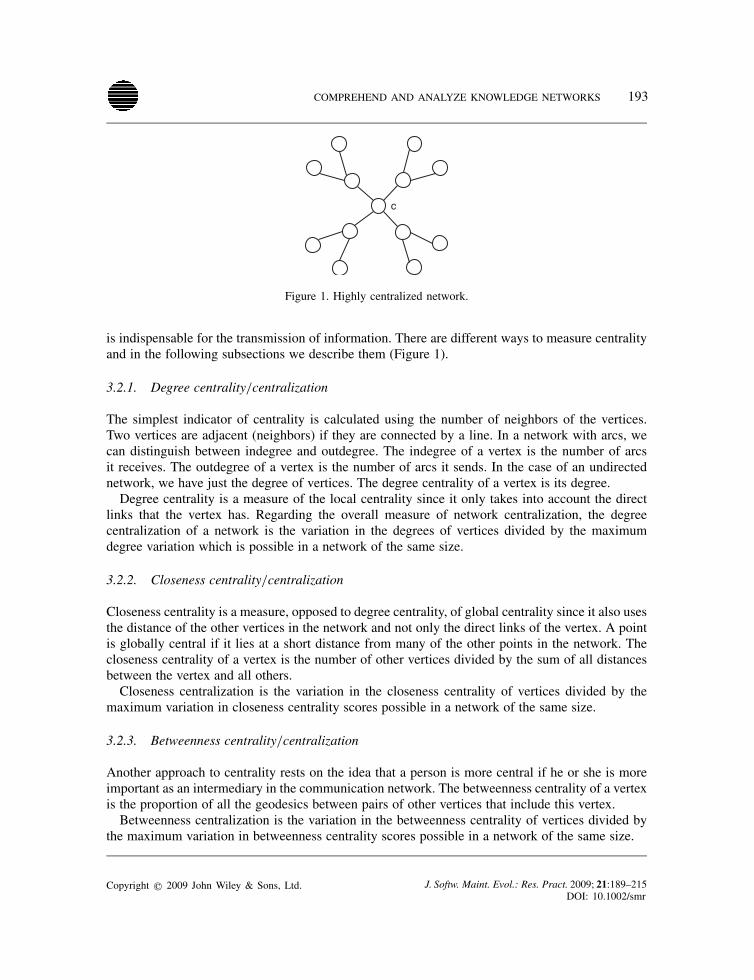
Centrality is used to refer to the position of the individual vertices within a network, whereas weuse centralization to characterize an entire network. Most social networks contain people who arecentral. Because of their position, they have better access to information and better opportunitiesto spread information. A network is highly centralized if there is a clear boundary between thecenter and the periphery. In a highly centralized network, information spreads easily but the center
Copyright q 2009 John Wiley & Sons, Ltd. J. Softw. Maint. Evol.: Res. Pract. 2009; 21:189–215DOI: 10.1002/smr
COMPREHEND AND ANALYZE KNOWLEDGE NETWORKS 193
c
Figure 1. Highly centralized network.
is indispensable for the transmission of information. There are different ways to measure centralityand in the following subsections we describe them (Figure 1).
3.2.1. Degree centrality/centralization
The simplest indicator of centrality is calculated using the number of neighbors of the vertices.Two vertices are adjacent (neighbors) if they are connected by a line. In a network with arcs, wecan distinguish between indegree and outdegree. The indegree of a vertex is the number of arcsit receives. The outdegree of a vertex is the number of arcs it sends. In the case of an undirectednetwork, we have just the degree of vertices. The degree centrality of a vertex is its degree.Degree centrality is a measure of the local centrality since it only takes into account the direct
links that the vertex has. Regarding the overall measure of network centralization, the degreecentralization of a network is the variation in the degrees of vertices divided by the maximumdegree variation which is possible in a network of the same size.
3.2.2. Closeness centrality/centralization
Closeness centrality is a measure, opposed to degree centrality, of global centrality since it also usesthe distance of the other vertices in the network and not only the direct links of the vertex. A pointis globally central if it lies at a short distance from many of the other points in the network. Thecloseness centrality of a vertex is the number of other vertices divided by the sum of all distancesbetween the vertex and all others.Closeness centralization is the variation in the closeness centrality of vertices divided by the
maximum variation in closeness centrality scores possible in a network of the same size.
3.2.3. Betweenness centrality/centralization
Another approach to centrality rests on the idea that a person is more central if he or she is moreimportant as an intermediary in the communication network. The betweenness centrality of a vertexis the proportion of all the geodesics between pairs of other vertices that include this vertex.Betweenness centralization is the variation in the betweenness centrality of vertices divided by
the maximum variation in betweenness centrality scores possible in a network of the same size.
Copyright q 2009 John Wiley & Sons, Ltd. J. Softw. Maint. Evol.: Res. Pract. 2009; 21:189–215DOI: 10.1002/smr
194 C. DEL ROSSO
3.3. Cohesive groups
The tendency to associate with people like yourself is called homophily by sociologists. Essentially,people tend to group and join people with similar tastes and interests. The relation is usuallysymmetric, e.g., friendship, and has a triad closure [12], e.g., my friends are also friends with eachother. In terms of network structure, we have edges (instead of arcs) and triangulation of verticesconnected by edges. These dense parts in the network structure create communities and subgroups.To summarize, a group is made of densely knit nodes (most nodes are directly connected to each
other) and tightly bound (most links stay within the network rather than connecting directly withthe outside).To identify the communities in a network of software developers means being able to identify
expertise and groups of people who work in the same area. For example, people responsible for theoperating system will interact with their ties more often.Identification of groups and communities, therefore, becomes essential if the scope is to under-
stand how the network is structured and how people can be characterized and classified. Clusteringand identifying of social communities have been addressed by various researchers and works. Soci-ologists have created several definitions to identify groups and communities such as components,cores, and cliques [6]. Physicists and computer scientists have also published and presented algo-rithms and methods to extract communities such as Newman [13] and Flake et al. [14]. In thispaper we have used the Newman algorithm to identify communities because it is one of the mostwell-known algorithms in the area of SNA.
3.4. Affiliation and 2-mode networks
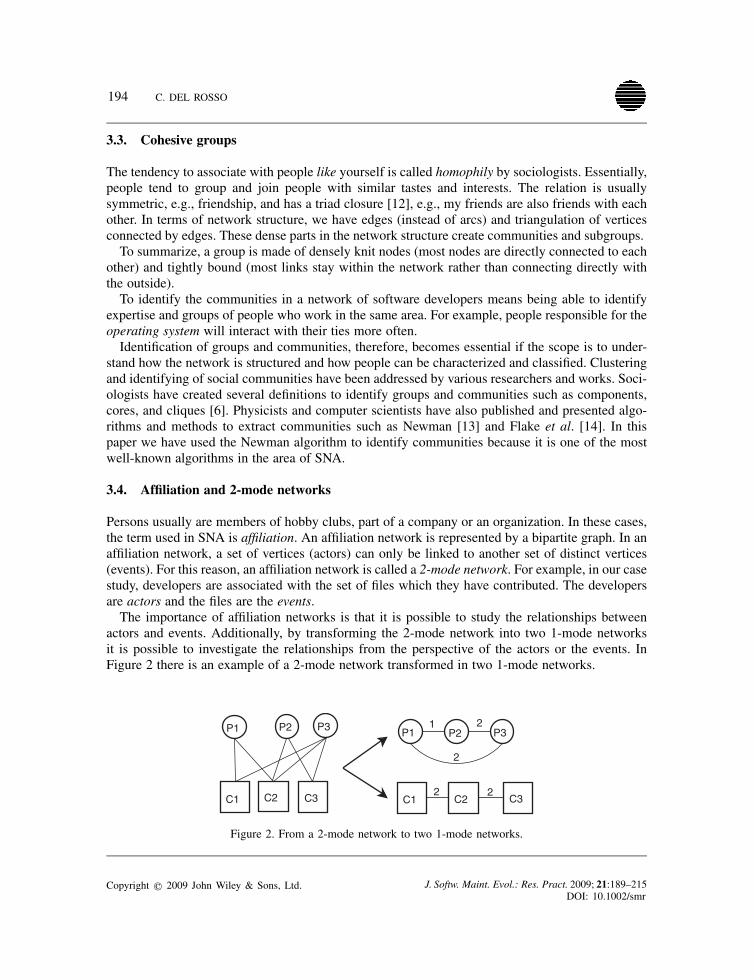
Persons usually are members of hobby clubs, part of a company or an organization. In these cases,the term used in SNA is affiliation. An affiliation network is represented by a bipartite graph. In anaffiliation network, a set of vertices (actors) can only be linked to another set of distinct vertices(events). For this reason, an affiliation network is called a 2-mode network. For example, in our casestudy, developers are associated with the set of files which they have contributed. The developersare actors and the files are the events.The importance of affiliation networks is that it is possible to study the relationships between
actors and events. Additionally, by transforming the 2-mode network into two 1-mode networksit is possible to investigate the relationships from the perspective of the actors or the events. InFigure 2 there is an example of a 2-mode network transformed in two 1-mode networks.
P1 P2 P3
C1 C2 C3
P1 P2 P31 2
2
C1 C2 C32 2
Figure 2. From a 2-mode network to two 1-mode networks.
Copyright q 2009 John Wiley & Sons, Ltd. J. Softw. Maint. Evol.: Res. Pract. 2009; 21:189–215DOI: 10.1002/smr

COMPREHEND AND ANALYZE KNOWLEDGE NETWORKS 195
The 2-mode network highlights the relationships between events and actors. However, for prac-tical reasons, the 2-mode network is transformed in two 1-mode networks that are then analyzed.The actor’s network is a social network and the analysis is performed by using social networkanalysis metrics described in this paper.The events network is a 1 mode-network that does not express relationships between people even
though the relationships are shaped by social relationships. In the case of the events network, thedependencies are used to understand the degree of interlocks between events as created by people.A classical example is the affiliation network made by board directors and their associated compa-nies. A link between two companies in the events network, in this case, exists when a directorsits on the board of both the companies. The common director establishes an interlock betweenthe firms and creates a privileged communication channel between them. Two companies sharingmultiple directors have clearly a strong interlock and connection between them. In this context, theconcept of m-slices [15] (called m-core by John Scott [8]) is used. An m-slice is a sub networkdefined by the multiplicity of lines. In an m-slice, vertices are connected by line of multiplicity mor higher to at least one other vertex.
3.5. Bridges and brokers
A person with many friends and acquaintances has better chances of getting help or information.However, having many ties within a group exposes a person to the same information repeatedly,whereas ties outside one’s group yield more diverse information. Persons who connect groups arealso called weak ties after Granovetter’s influential paper, the strength of weak ties [16]. In termsof network structure a bridge is a line, the removal of which increases the number of componentsin the network.A person who connects two otherwise unconnected persons is in a position to manage or broker
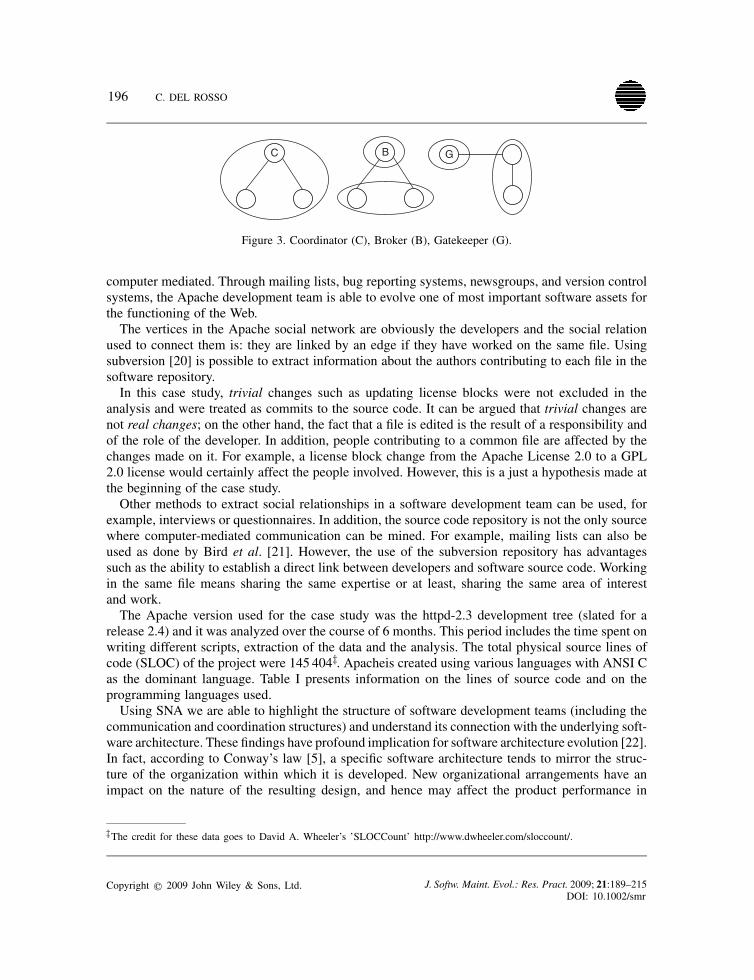
information flow and profit for the mediation. We define here three different brokerage roles, thecoordinator, the itinerant broker, and the gatekeeper, see Figure 3. The coordinator is a member ofthe group and mediates within the group. In the second role, two members of a group use a mediatorfrom outside, and we call this role, itinerant broker. In the third role, we have the gatekeeper whichacts as the mediator for his group.
4. SNA AND SOFTWARE ENGINEERING
The distributed nature of software development and the use of computer-mediated channels tocommunicate are particularly attractive for the use of SNA to investigate software evolution andcomprehension.Driven by this assumption, we have decided to reconstruct the Apache web server social network.
The Apache web server [17] is a successful Open Source Software (OSS). According to Netcraft[18] (an Internet services company providing research data and analysis on many aspects of theInternet) Apache leads the web server market with a 51% share while Microsoft IIS web serveris second with 34% of the market share (December 2008). Apache, as many other OSS projects,is developed in a distributed fashion with a set of rules for collaboration and leadership [19]. Thedistributed nature of its development highlights the need for communication channels which are
Copyright q 2009 John Wiley & Sons, Ltd. J. Softw. Maint. Evol.: Res. Pract. 2009; 21:189–215DOI: 10.1002/smr
196 C. DEL ROSSO
C B G
Figure 3. Coordinator (C), Broker (B), Gatekeeper (G).
computer mediated. Through mailing lists, bug reporting systems, newsgroups, and version controlsystems, the Apache development team is able to evolve one of most important software assets forthe functioning of the Web.The vertices in the Apache social network are obviously the developers and the social relation
used to connect them is: they are linked by an edge if they have worked on the same file. Usingsubversion [20] is possible to extract information about the authors contributing to each file in thesoftware repository.In this case study, trivial changes such as updating license blocks were not excluded in the
analysis and were treated as commits to the source code. It can be argued that trivial changes arenot real changes; on the other hand, the fact that a file is edited is the result of a responsibility andof the role of the developer. In addition, people contributing to a common file are affected by thechanges made on it. For example, a license block change from the Apache License 2.0 to a GPL2.0 license would certainly affect the people involved. However, this is a just a hypothesis made atthe beginning of the case study.Other methods to extract social relationships in a software development team can be used, for
example, interviews or questionnaires. In addition, the source code repository is not the only sourcewhere computer-mediated communication can be mined. For example, mailing lists can also beused as done by Bird et al. [21]. However, the use of the subversion repository has advantagessuch as the ability to establish a direct link between developers and software source code. Workingin the same file means sharing the same expertise or at least, sharing the same area of interestand work.The Apache version used for the case study was the httpd-2.3 development tree (slated for a
release 2.4) and it was analyzed over the course of 6 months. This period includes the time spent onwriting different scripts, extraction of the data and the analysis. The total physical source lines ofcode (SLOC) of the project were 145 404‡. Apacheis created using various languages with ANSI Cas the dominant language. Table I presents information on the lines of source code and on theprogramming languages used.Using SNA we are able to highlight the structure of software development teams (including the
communication and coordination structures) and understand its connection with the underlying soft-ware architecture. These findings have profound implication for software architecture evolution [22].In fact, according to Conway’s law [5], a specific software architecture tends to mirror the struc-ture of the organization within which it is developed. New organizational arrangements have animpact on the nature of the resulting design, and hence may affect the product performance in
‡The credit for these data goes to David A. Wheeler’s ’SLOCCount’ http://www.dwheeler.com/sloccount/.
Copyright q 2009 John Wiley & Sons, Ltd. J. Softw. Maint. Evol.: Res. Pract. 2009; 21:189–215DOI: 10.1002/smr
COMPREHEND AND ANALYZE KNOWLEDGE NETWORKS 197
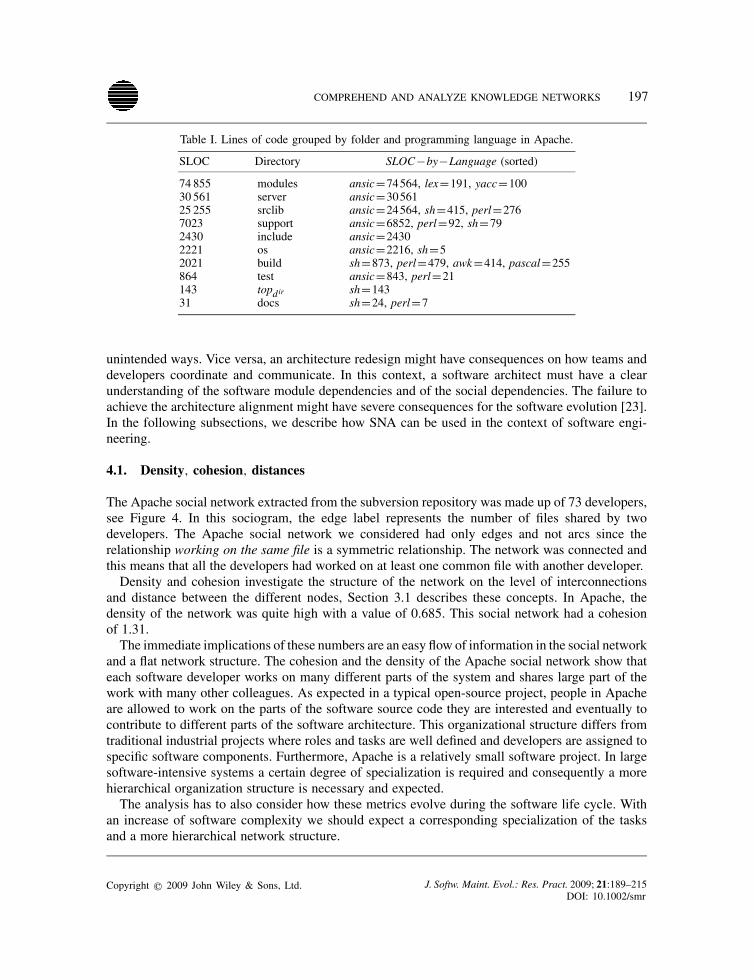
Table I. Lines of code grouped by folder and programming language in Apache.
SLOC Directory SLOC−by−Language (sorted)
74 855 modules ansic=74564, lex=191, yacc=10030 561 server ansic=3056125 255 srclib ansic=24564, sh=415, perl=2767023 support ansic=6852, perl=92, sh=792430 include ansic=24302221 os ansic=2216, sh=52021 build sh=873, perl=479, awk=414, pascal=255864 test ansic=843, perl=21143 topdir sh=14331 docs sh=24, perl=7
unintended ways. Vice versa, an architecture redesign might have consequences on how teams anddevelopers coordinate and communicate. In this context, a software architect must have a clearunderstanding of the software module dependencies and of the social dependencies. The failure toachieve the architecture alignment might have severe consequences for the software evolution [23].In the following subsections, we describe how SNA can be used in the context of software engi-neering.
4.1. Density, cohesion, distances
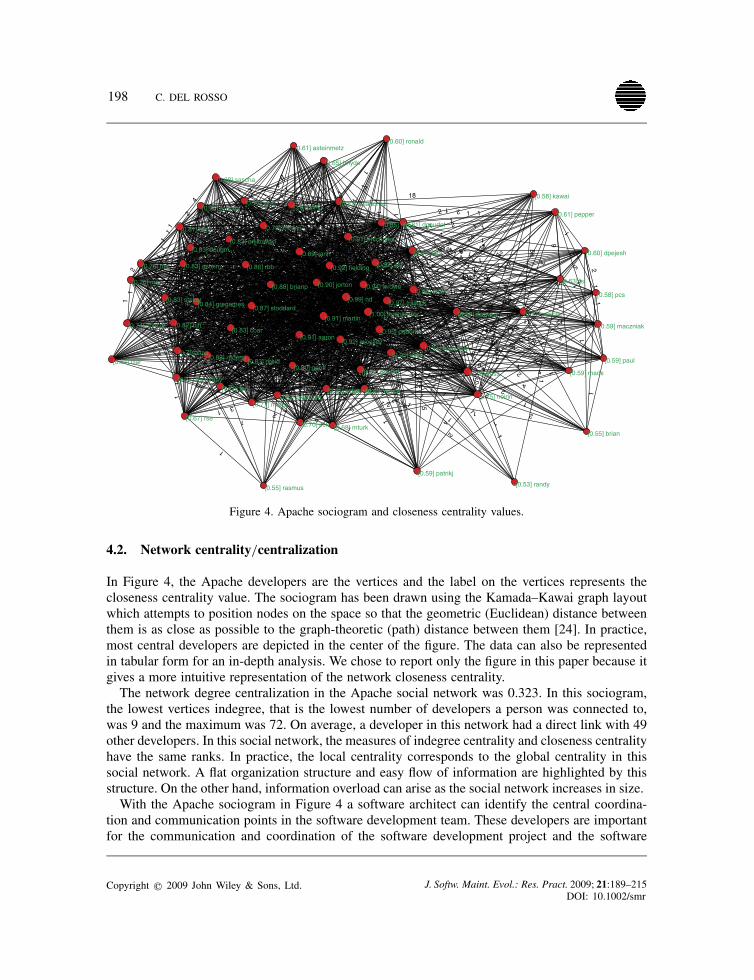
The Apache social network extracted from the subversion repository was made up of 73 developers,see Figure 4. In this sociogram, the edge label represents the number of files shared by twodevelopers. The Apache social network we considered had only edges and not arcs since therelationship working on the same file is a symmetric relationship. The network was connected andthis means that all the developers had worked on at least one common file with another developer.Density and cohesion investigate the structure of the network on the level of interconnections
and distance between the different nodes, Section 3.1 describes these concepts. In Apache, thedensity of the network was quite high with a value of 0.685. This social network had a cohesionof 1.31.The immediate implications of these numbers are an easy flow of information in the social network
and a flat network structure. The cohesion and the density of the Apache social network show thateach software developer works on many different parts of the system and shares large part of thework with many other colleagues. As expected in a typical open-source project, people in Apacheare allowed to work on the parts of the software source code they are interested and eventually tocontribute to different parts of the software architecture. This organizational structure differs fromtraditional industrial projects where roles and tasks are well defined and developers are assigned tospecific software components. Furthermore, Apache is a relatively small software project. In largesoftware-intensive systems a certain degree of specialization is required and consequently a morehierarchical organization structure is necessary and expected.The analysis has to also consider how these metrics evolve during the software life cycle. With
an increase of software complexity we should expect a corresponding specialization of the tasksand a more hierarchical network structure.
Copyright q 2009 John Wiley & Sons, Ltd. J. Softw. Maint. Evol.: Res. Pract. 2009; 21:189–215DOI: 10.1002/smr
198 C. DEL ROSSO
Figure 4. Apache sociogram and closeness centrality values.
4.2. Network centrality/centralization
In Figure 4, the Apache developers are the vertices and the label on the vertices represents thecloseness centrality value. The sociogram has been drawn using the Kamada–Kawai graph layoutwhich attempts to position nodes on the space so that the geometric (Euclidean) distance betweenthem is as close as possible to the graph-theoretic (path) distance between them [24]. In practice,most central developers are depicted in the center of the figure. The data can also be representedin tabular form for an in-depth analysis. We chose to report only the figure in this paper because itgives a more intuitive representation of the network closeness centrality.The network degree centralization in the Apache social network was 0.323. In this sociogram,
the lowest vertices indegree, that is the lowest number of developers a person was connected to,was 9 and the maximum was 72. On average, a developer in this network had a direct link with 49other developers. In this social network, the measures of indegree centrality and closeness centralityhave the same ranks. In practice, the local centrality corresponds to the global centrality in thissocial network. A flat organization structure and easy flow of information are highlighted by thisstructure. On the other hand, information overload can arise as the social network increases in size.With the Apache sociogram in Figure 4 a software architect can identify the central coordina-
tion and communication points in the software development team. These developers are importantfor the communication and coordination of the software development project and the software
Copyright q 2009 John Wiley & Sons, Ltd. J. Softw. Maint. Evol.: Res. Pract. 2009; 21:189–215DOI: 10.1002/smr
COMPREHEND AND ANALYZE KNOWLEDGE NETWORKS 199
architect must manage the team, assign tasks and redesign the architecture taking into considera-tion these patterns.Centrality is an important measure to discover the relative importance of people in the social
network. Importance, in this context, is related to communication and on the social relationshipschosen in the analysis. In this context, central persons have an overall picture of the software projectand are able to find access to information more easily or to find the right person to contact. In fact,the most central developers have the widest overview of the software project and an understandingof the role of the other members in the social network. The same reasoning is valid for the measureof betweenness centrality. People with high betweenness centrality scores connect people who workon different parts of the software architecture and their role is fundamental for coordination andthe flow of information.On the other hand, experts on a specific part of the system might be in the periphery in the social
network. That does not mean that they are not important. Additionally, since central developersare important points for coordination and communication, they may become bottlenecks and itshould be ensured and avoided that these developers do not become problematic for the softwaredevelopment. Centrality measures and their implications are described in Sections 3.2, 3.2.1, 3.2.2,and 3.2.3.A software architect must be aware of how software development teams cooperate and how to
improve the coordination among different groups. This is especially important in large software-intensive systems developed in a distributed manner. Centrality measures help to understand theseissues and allow the improvement of software evolution.
4.3. Communities
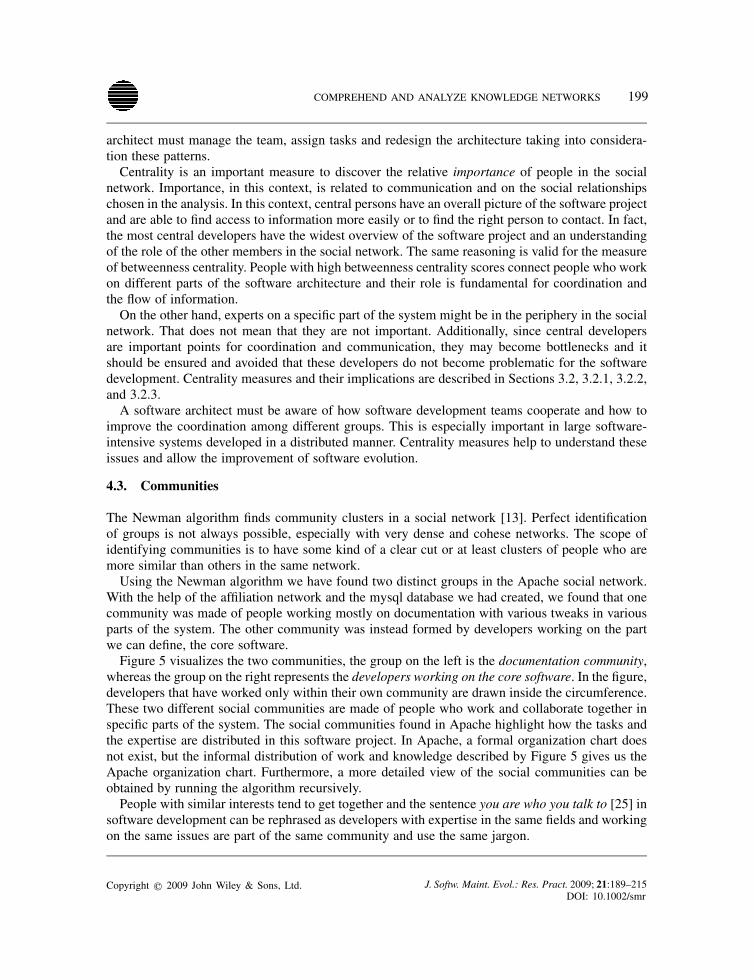
The Newman algorithm finds community clusters in a social network [13]. Perfect identificationof groups is not always possible, especially with very dense and cohese networks. The scope ofidentifying communities is to have some kind of a clear cut or at least clusters of people who aremore similar than others in the same network.Using the Newman algorithm we have found two distinct groups in the Apache social network.
With the help of the affiliation network and the mysql database we had created, we found that onecommunity was made of people working mostly on documentation with various tweaks in variousparts of the system. The other community was instead formed by developers working on the partwe can define, the core software.Figure 5 visualizes the two communities, the group on the left is the documentation community,
whereas the group on the right represents the developers working on the core software. In the figure,developers that have worked only within their own community are drawn inside the circumference.These two different social communities are made of people who work and collaborate together inspecific parts of the system. The social communities found in Apache highlight how the tasks andthe expertise are distributed in this software project. In Apache, a formal organization chart doesnot exist, but the informal distribution of work and knowledge described by Figure 5 gives us theApache organization chart. Furthermore, a more detailed view of the social communities can beobtained by running the algorithm recursively.People with similar interests tend to get together and the sentence you are who you talk to [25] in
software development can be rephrased as developers with expertise in the same fields and workingon the same issues are part of the same community and use the same jargon.
Copyright q 2009 John Wiley & Sons, Ltd. J. Softw. Maint. Evol.: Res. Pract. 2009; 21:189–215DOI: 10.1002/smr
200 C. DEL ROSSO
aaron
ake
asteinmetz
ben
bhyde
bjhbnicholes
brian
brianp
chrisd
chuck
clar
coarcolm
dgaudet dirkx
dougm
dpejesh
dreiderikabele
fanf
fielding
geoff
gregames
gstein
ianh
jerenkrantz
jfclere
jim jorton
jsl
jwoolley
kawai
kess
lars
maczniak
madhum
mads
manoj
marc
martin
minfrin
mjc
mturk
nd
niq
noirin
orlikowski
patrikj
paul
pcs
pepper
pquerna
randy
rasmus
rbb
rbowen
rederpj
ronald
roonegrpluem
rse
sascha
sctemme
slive
stas
stoddard
striker
thommay
trawick
wrowe
wsanchez
yoshiki
Figure 5. Apache communities.
In the industrial setting, the communities discovered should correspond to the different softwaredevelopment teams. To the formal organization charts must correspond the informal distribution ofthe work. In case the discovered social communities are different from the teams as described in theorganization chart, an architecture misalignment exists. Architecture refactoring and organizationre-engineering are continuously performed in a fast-moving world we live in nowadays. However,for a successful software evolution, the software architecture and the organization structure have tobe kept aligned. The ability to highlight social communities in a software development team givesthe architect the ability to verify Conways’s law, improve the software architecture alignment andconsequently software evolution.
5. BROKERAGE ROLES
Finding the brokers in the software development process has important implications. Brokers are thepeople who facilitated the coordination and communication between different software developmentteams and within them.A large software system has typically thousands of dependencies. Software tools have been
created to reverse-engineer a software architecture [26] and discover these dependencies. Thesetools discover only software dependencies. However, software component dependencies are shapedby software and social dependencies.With SNAwe are able to discover also the social dependencies.When software components need a better synchronization, the creation of brokerage roles improvesthe situation. In some circumstances, brokers could become bottlenecks or could be overloaded.In this case, a different distribution of the work could be advised. The software architect, withthe use of SNA, is able to identify the brokers and consequently improve the coordination, thecommunication, and software evolution.
Copyright q 2009 John Wiley & Sons, Ltd. J. Softw. Maint. Evol.: Res. Pract. 2009; 21:189–215DOI: 10.1002/smr
COMPREHEND AND ANALYZE KNOWLEDGE NETWORKS 201
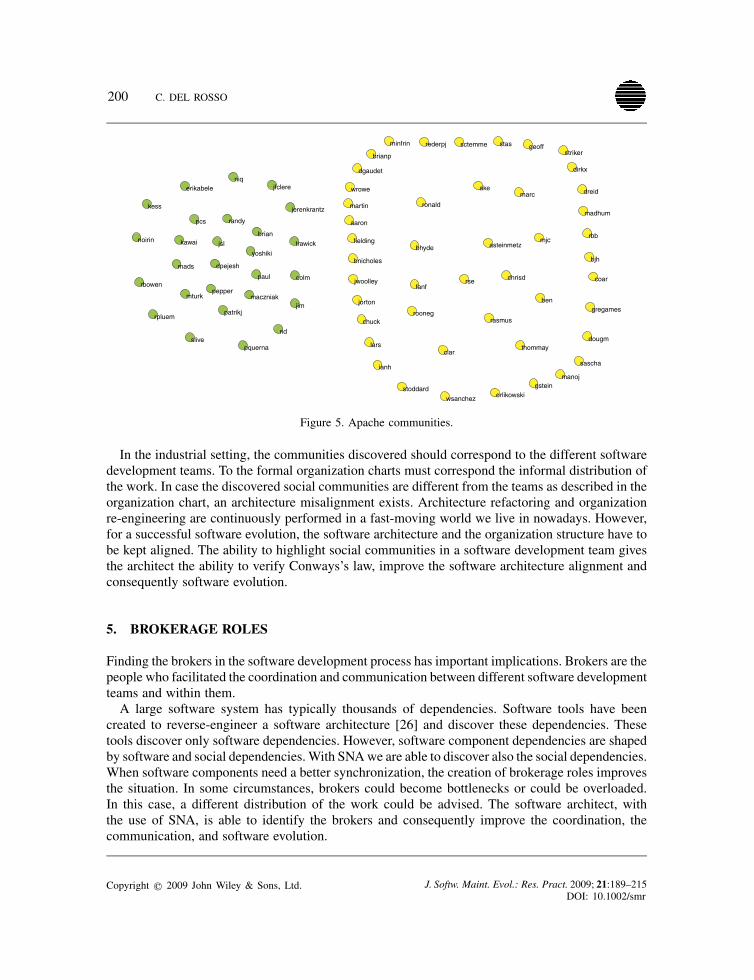
Table II. Brokers, coordinators and gatekeepers in Apache.
Rank Brokers Developer
1 147 trawick2 147 jerenkrantz3 113 nd
Rank Coordinators Developer1 147 jwoolley2 147 wrowe3 147 aaron
Rank Gatekeepers Developer1 595 jerenkrantz2 571 nd3 515 slive
Brokerage roles can be defined only after the communities in the network are identified. Using thecommunities found in the previous section, we have looked into the brokerage roles in the Apachenetwork. The top ranking brokers in Apache are shown in Table II. The values in the table show thenumber of triads in which the developer played that role. To better understand the concept, we havedrawn in Figure 5 the brokers on the circumference of the circles while developers dealing mainlywith members within the community are drawn inside the circles. Please refer to Figure 3 for thegraphical representation of the meaning of the roles of brokers, coordinators, and gatekeepers.
6. AFFILIATION NETWORK
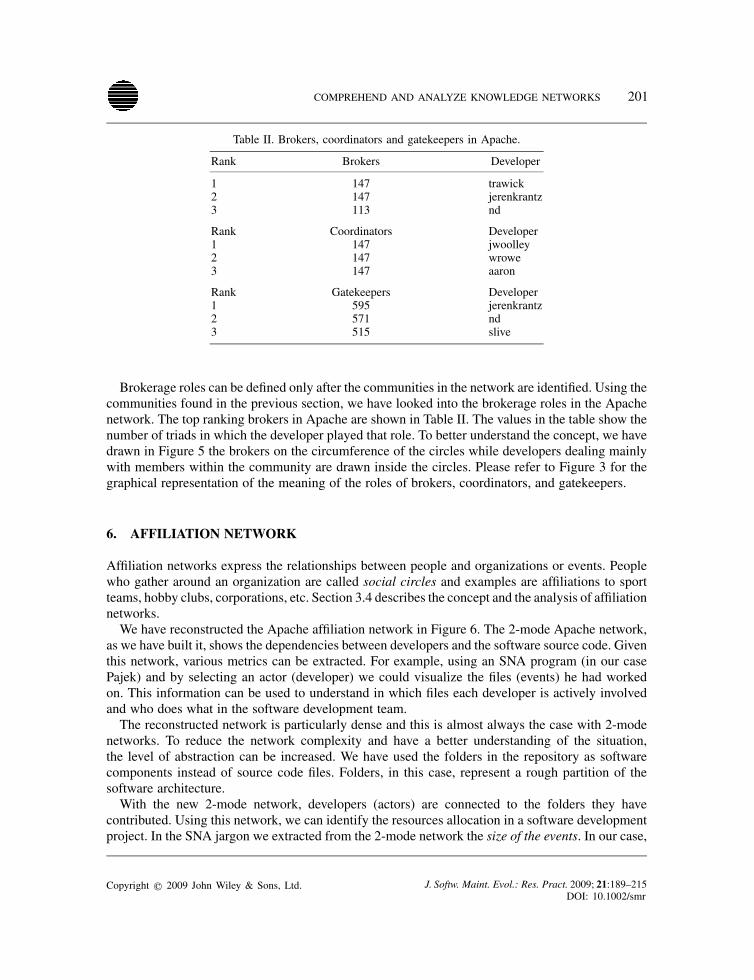
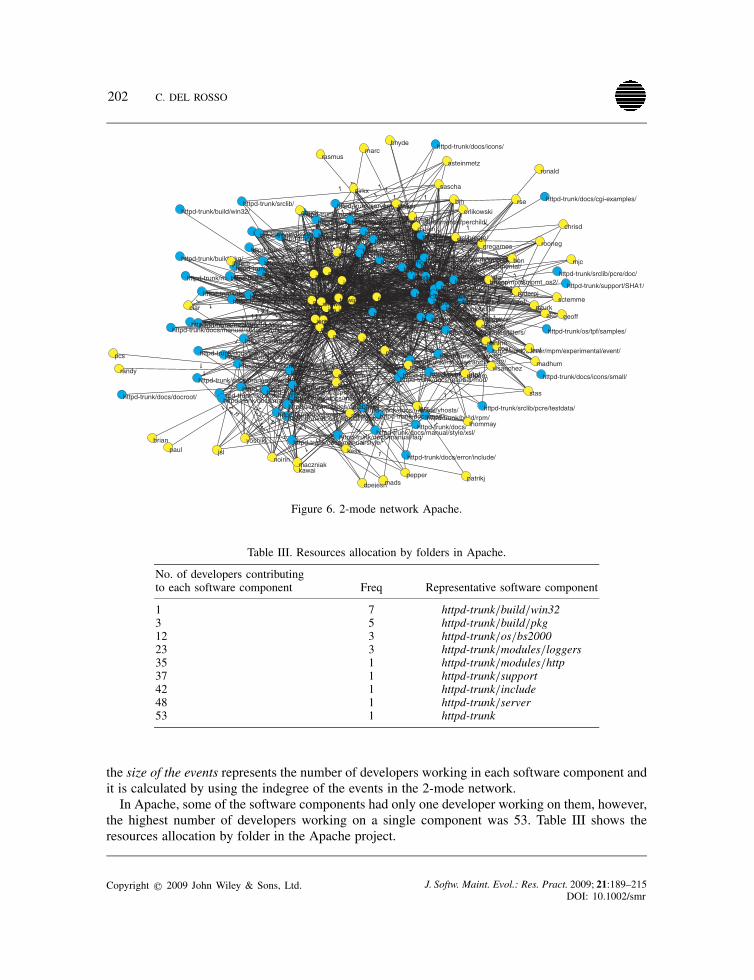
Affiliation networks express the relationships between people and organizations or events. Peoplewho gather around an organization are called social circles and examples are affiliations to sportteams, hobby clubs, corporations, etc. Section 3.4 describes the concept and the analysis of affiliationnetworks.We have reconstructed the Apache affiliation network in Figure 6. The 2-mode Apache network,
as we have built it, shows the dependencies between developers and the software source code. Giventhis network, various metrics can be extracted. For example, using an SNA program (in our casePajek) and by selecting an actor (developer) we could visualize the files (events) he had workedon. This information can be used to understand in which files each developer is actively involvedand who does what in the software development team.The reconstructed network is particularly dense and this is almost always the case with 2-mode
networks. To reduce the network complexity and have a better understanding of the situation,the level of abstraction can be increased. We have used the folders in the repository as softwarecomponents instead of source code files. Folders, in this case, represent a rough partition of thesoftware architecture.With the new 2-mode network, developers (actors) are connected to the folders they have
contributed. Using this network, we can identify the resources allocation in a software developmentproject. In the SNA jargon we extracted from the 2-mode network the size of the events. In our case,
Copyright q 2009 John Wiley & Sons, Ltd. J. Softw. Maint. Evol.: Res. Pract. 2009; 21:189–215DOI: 10.1002/smr
202 C. DEL ROSSO
1
1
1
1
1
1
11
1
1
1
1
1
1
1
1
1
1
1
1
11
1
1
1
11
1
1
1
1
1
1
1
1
1
1
1
1
1
1
1
1
1
1
1 1
1
1
1
11
11
1
11
1
1
1
1
11
1
1
1
11
1
1
1
1
1
1
11
1
1
11
1 11
1
1
1
1
1
1
1 1
11
1
1
1
1
11
1
1
1
1
1
11
1
1
1
1
11
1
1
1
1
1
1
1
1
1
11
1
1
1
1
1
1
1
1
1
1
1
1
1
1
1
1
1
11
1
1
11
1
1
1
1
1
1
1
1
1
1
1
1
1
1
1
1
1
1 1
1
1
1
1
11
1
1
1
1
1
1
1
1
1
1
1
1
11
1
1
1
1
1
1
11
11
1
1
11
1
11
1
1
1
1
1
1
1
11
1
11
11
1
1
1
1
1
11
1
11
1
1
1
1
1
1
1
1
1
1
1
1
1
1
1 1
1
1
1
1
1
1
11
11
1
1
1
1
1
1
11
1
1
1
1
1
11
1
1
1
1
1
11
1
1
1
1
1
1
11
1
1
1
1
1
1
1 1
1
11
1
11
1
11
1
1
1
1
1
1
1
1
1
1
1
1
1
1
1
1 1
1
1
1
1
1
1
1
1
1
11
1
1
1
1
1
11
1
1
1
1
1
1
1
1
1
111
1
1
1
1
11
1
1
1
111
1
1
11
1
1
1
11 1
1
111
1
1
1
1
1
1
11
1
1
1
1
1
1
1
1
1
11
1
1
1
1
1
1
1 1
1
1
1
1
1
1
1
1
1
1
1
1
1
1
1
1
1
1
1
1
11
1
1
1
1
1
1
1
1
1
1
1
1
1
1
1
11
1
1
1
11
1
1
1
11
1
1
1
1
1
1
1
1
1
1
1
1
1
1
11
1
1
1
1
1
11
1
1
1
1
1
1
11
11
11
1
1
11
11
1
11
1
1
1
1
1
1
11
1
1
1
1
1
11
1
11
1
1
1
1
1
1
11
1
1
1
1
11
1
11
1
1
1
1
1
1
11
111
11
1
1
1
1
11
1
1
11
1
11
1
11
1
1
1
1
11
111
11
1
1
1
11
1
1
1
1
11
1
11
1
1
1
1
1
11
111
1
1
1
1
1
1
1
1
1
11
1
1
1
111
1
1
1
1
1
1
1
1
1
1
11
1
11
1
1
1
1
11
1
1
1
1
1
1
1
1
1
11
1
1
11
1
11
1
1
1
1
11
1
1
1
1
1
1
1
1
1
1
1
1
1
1
11
1
11
1
1
1
1
1
1
1
1
1
1
1
111
1
1
1
1
1
1
1
1
1
1
1
1
1
1
1
11
1
1
11
1
1
1
1
1
1
1
1
1
1
1
11
11
1
1
1
11
1 1
1
1 1
1
1
1
1 1
1
1
1
11
1
11
1
1
1
1
1
1
1
11
1
1
1
1
1
1
1
1
1
1
1
1
1
1
1
1
11
1
1
1
1
1
1
1
1
1
1
1
1
1
1
1
1
1
1
1
11
1
1
1
1
1
1
1
1
1
1
1
1
1
1
11
1
1
1
1
1
1 1
1
1
1
1
1
1
1
11
1
1
1
1
1
1
1
1
11
1
1
1
11
1
1
1
1
1
1
1
1
1
1
1
11
1
1
11
1
1
11
1
1
1
1
1
1
1
11
1
1
1
1
1
11
1
1
1
1
1
11
111 1
1
1
1
1 1
1
1
1 1
1
1
1
1
1
1
1
1
1
1111
1
1
1
1
11
1
1
1
11
111
11
1
1
1
1
1
1
1
1
1
11
1
1
1
1
1
11
1
1
1
11
1
1
1
1
1 1
1
1
1
11
1
1
1
1
1
1
1
1
1
1
1
11
1
1
1
1
1
11
1
1
1
1
1
1
1
1
1
1
1
1
1
1
1
1
1
1
1
1
1
1
1
1
11
1
1
1
1
1
1
1
1
1
1
1
1
1
1
1
1
1
1
1
1
1 1
1
1
11
1
1
1
1
1
11
11
1
1
11
1
1
11
1
1
11
1
1
1
1
1
1
1
1
11
1
1
1
1
11
1
11
1
1
1
11
11
1
1
1
1
1
1
1
1
1
1
1
11
1
11
11
1
1
1
1
1
1
11
1
1
1
11
11
1
1
1
1
11
1
1
111
11
1
1
1
1
1
1
11
1
11
11
11
1
1
1
1
1
11
1
1
1
1
1
1
1
1
1
1
1
11
1
1
1
1
1
1
1
1
1
1
1
11
1
111
1
1
1
1
11
1
11
1
1
1
1
11
1
1
1
1
1
1
1
11
1
11
11
1
1
1
1
11
1
11
1
1
1
1
1
1
1
1
1
1
1
1
1
1
111
1
1
1
1
1
1
1
1
1
1
1
1
1
1
1
1
1
1
11
1
1
1
1
1
1
1
1
1
1
1
1
1
1
1
1
1
11
1
1
1
11
11
1
11
111
1
1
1
1
11
1
1
1
1
11 httpd-trunk/
httpd-trunk/build/
httpd-trunk/build/pkg/
httpd-trunk/build/rpm/
httpd-trunk/build/win32/
httpd-trunk/docs/
httpd-trunk/docs/cgi-examples/
httpd-trunk/docs/conf/
httpd-trunk/docs/conf/extra/
httpd-trunk/docs/docroot/
httpd-trunk/docs/error/
httpd-trunk/docs/error/include/
httpd-trunk/docs/icons/
httpd-trunk/docs/icons/small/
httpd-trunk/docs/man/
httpd-trunk/docs/manual/httpd-trunk/docs/manual/developer/
httpd-trunk/docs/manual/faq/
httpd-trunk/docs/manual/howto/
httpd-trunk/docs/manual/misc/
httpd-trunk/docs/manual/mod/httpd-trunk/docs/manual/platform/httpd-trunk/docs/manual/programs/
httpd-trunk/docs/manual/rewrite/
httpd-trunk/docs/manual/ssl/
httpd-trunk/docs/manual/style/
httpd-trunk/docs/manual/style/css/
httpd-trunk/docs/manual/style/lang/httpd-trunk/docs/manual/style/latex/
httpd-trunk/docs/manual/style/xsl/
httpd-trunk/docs/manual/style/xsl/util/
httpd-trunk/docs/manual/vhosts/
httpd-trunk/include/
httpd-trunk/modules/
httpd-trunk/modules/aaa/httpd-trunk/modules/arch/netware/
httpd-trunk/modules/arch/win32/
httpd-trunk/modules/cache/
httpd-trunk/modules/database/
httpd-trunk/modules/dav/fs/
httpd-trunk/modules/dav/lock/
httpd-trunk/modules/dav/main/
httpd-trunk/modules/debug/
httpd-trunk/modules/echo/
httpd-trunk/modules/experimental/
httpd-trunk/modules/filters/
httpd-trunk/modules/generators/
httpd-trunk/modules/http/
httpd-trunk/modules/ldap/
httpd-trunk/modules/loggers/
httpd-trunk/modules/mappers/
httpd-trunk/modules/metadata/httpd-trunk/modules/proxy/
httpd-trunk/modules/ssl/
httpd-trunk/modules/test/
httpd-trunk/os/
httpd-trunk/os/beos/
httpd-trunk/os/bs2000/
httpd-trunk/os/netware/
httpd-trunk/os/os2/
httpd-trunk/os/tpf/
httpd-trunk/os/tpf/samples/
httpd-trunk/os/unix/
httpd-trunk/os/win32/
httpd-trunk/server/
httpd-trunk/server/mpm/
httpd-trunk/server/mpm/beos/
httpd-trunk/server/mpm/experimental/event/
httpd-trunk/server/mpm/experimental/leader/
httpd-trunk/server/mpm/experimental/perchild/
httpd-trunk/server/mpm/experimental/threadpool/ httpd-trunk/server/mpm/mpmt_os2/
httpd-trunk/server/mpm/netware/
httpd-trunk/server/mpm/prefork/
httpd-trunk/server/mpm/winnt/httpd-trunk/server/mpm/worker/
httpd-trunk/srclib/
httpd-trunk/srclib/pcre/
httpd-trunk/srclib/pcre/doc/
httpd-trunk/srclib/pcre/testdata/
httpd-trunk/support/httpd-trunk/support/SHA1/
httpd-trunk/support/win32/
httpd-trunk/test/
aaron
ake
asteinmetz
ben
bhyde
bjh
bnicholes
brian
brianp
chrisd
chuck
clar
coar
colm dgaudet
dirkx
dougm
dpejesh
dreid
erikabele
fanf
fielding
geoff
gregames
gstein
ianh
jerenkrantz
jfclere
jim
jorton
jsl
jwoolley
kawai
kess
lars
maczniak
madhum
mads
manoj
marc
martin
minfrin
mjc
mturk
nd
niq
noirin
orlikowski
patrikj
paul
pcs
pepper
pquerna
randy
rasmus
rbb
rbowen
rederpj
ronald
rooneg
rpluem
rse
sascha
sctemme
slivestas
stoddard
striker
thommay
trawickwrowe
wsanchez
yoshiki
Figure 6. 2-mode network Apache.
Table III. Resources allocation by folders in Apache.
No. of developers contributingto each software component Freq Representative software component
1 7 httpd-trunk/build/win323 5 httpd-trunk/build/pkg12 3 httpd-trunk/os/bs200023 3 httpd-trunk/modules/loggers35 1 httpd-trunk/modules/http37 1 httpd-trunk/support42 1 httpd-trunk/include48 1 httpd-trunk/server53 1 httpd-trunk
the size of the events represents the number of developers working in each software component andit is calculated by using the indegree of the events in the 2-mode network.In Apache, some of the software components had only one developer working on them, however,
the highest number of developers working on a single component was 53. Table III shows theresources allocation by folder in the Apache project.
Copyright q 2009 John Wiley & Sons, Ltd. J. Softw. Maint. Evol.: Res. Pract. 2009; 21:189–215DOI: 10.1002/smr
COMPREHEND AND ANALYZE KNOWLEDGE NETWORKS 203
When a large number of developers work on the same software component, synchronizationand collaboration are more challenging and it must be ensured that communication barriers areeliminated. Eventually, a better distribution of the task assignments or changes in the software archi-tecture could be advised. Furthermore, software components developed by a large number of peoplerequire particular attention since these components are usually the most complex in the system.
6.1. Events network and coordination
The Apache events network is derived from the 2-mode network in Figure 6. The events networkis made of software components and the Apache events network was made of 84 components afterincreasing the level of abstraction from the file to the folder level. In this network, two nodes areconnected if the same developer has worked on both the components. The line multiplicity betweentwo nodes expresses the number of developers working simultaneously in these two softwarecomponents.One of the principles of software development advises to partition a system into software compo-
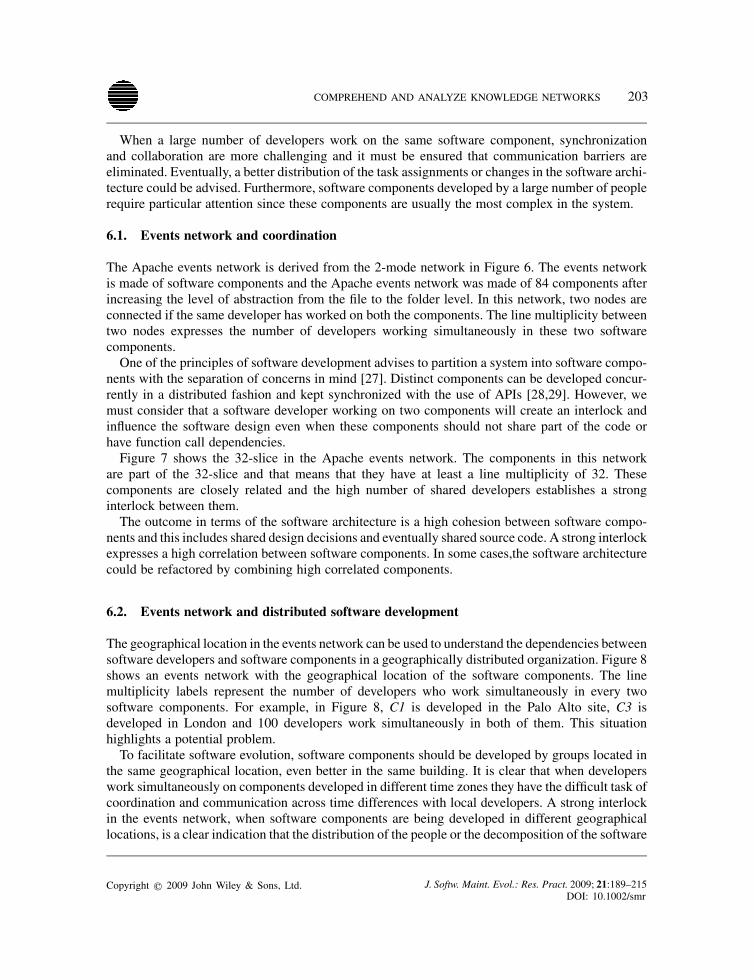
nents with the separation of concerns in mind [27]. Distinct components can be developed concur-rently in a distributed fashion and kept synchronized with the use of APIs [28,29]. However, wemust consider that a software developer working on two components will create an interlock andinfluence the software design even when these components should not share part of the code orhave function call dependencies.Figure 7 shows the 32-slice in the Apache events network. The components in this network
are part of the 32-slice and that means that they have at least a line multiplicity of 32. Thesecomponents are closely related and the high number of shared developers establishes a stronginterlock between them.The outcome in terms of the software architecture is a high cohesion between software compo-
nents and this includes shared design decisions and eventually shared source code. A strong interlockexpresses a high correlation between software components. In some cases,the software architecturecould be refactored by combining high correlated components.
6.2. Events network and distributed software development
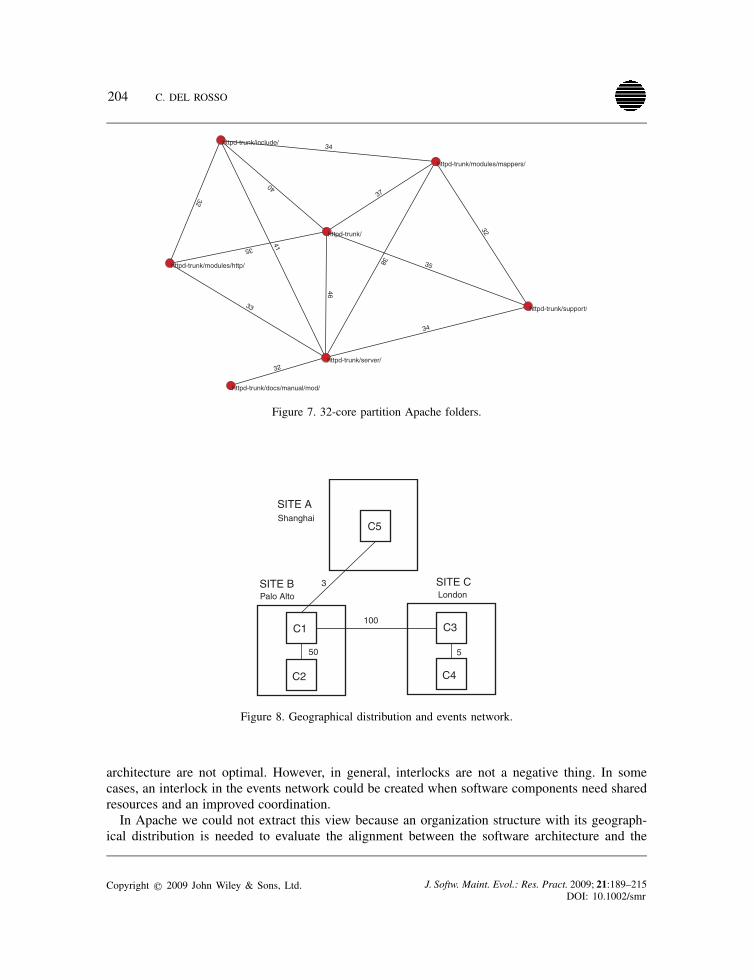
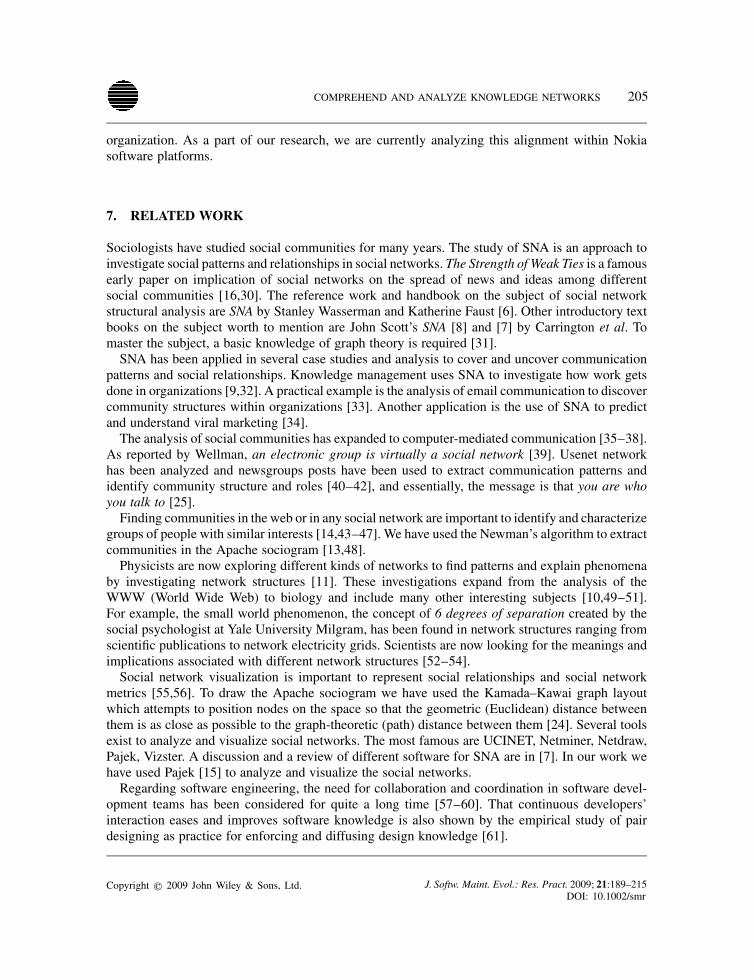
The geographical location in the events network can be used to understand the dependencies betweensoftware developers and software components in a geographically distributed organization. Figure 8shows an events network with the geographical location of the software components. The linemultiplicity labels represent the number of developers who work simultaneously in every twosoftware components. For example, in Figure 8, C1 is developed in the Palo Alto site, C3 isdeveloped in London and 100 developers work simultaneously in both of them. This situationhighlights a potential problem.To facilitate software evolution, software components should be developed by groups located in
the same geographical location, even better in the same building. It is clear that when developerswork simultaneously on components developed in different time zones they have the difficult task ofcoordination and communication across time differences with local developers. A strong interlockin the events network, when software components are being developed in different geographicallocations, is a clear indication that the distribution of the people or the decomposition of the software
Copyright q 2009 John Wiley & Sons, Ltd. J. Softw. Maint. Evol.: Res. Pract. 2009; 21:189–215DOI: 10.1002/smr
204 C. DEL ROSSO
3532
34
40
35
37
46
32
32
34
41
33
38
httpd-trunk/
httpd-trunk/docs/manual/mod/
httpd-trunk/include/
httpd-trunk/modules/http/
httpd-trunk/modules/mappers/
httpd-trunk/server/
httpd-trunk/support/
Figure 7. 32-core partition Apache folders.
C1
C2
C3
C4
C5
SITE AShanghai
SITE B SITE CLondonPalo Alto
100
550
3
Figure 8. Geographical distribution and events network.
architecture are not optimal. However, in general, interlocks are not a negative thing. In somecases, an interlock in the events network could be created when software components need sharedresources and an improved coordination.In Apache we could not extract this view because an organization structure with its geograph-
ical distribution is needed to evaluate the alignment between the software architecture and the
Copyright q 2009 John Wiley & Sons, Ltd. J. Softw. Maint. Evol.: Res. Pract. 2009; 21:189–215DOI: 10.1002/smr
COMPREHEND AND ANALYZE KNOWLEDGE NETWORKS 205
organization. As a part of our research, we are currently analyzing this alignment within Nokiasoftware platforms.
7. RELATED WORK
Sociologists have studied social communities for many years. The study of SNA is an approach toinvestigate social patterns and relationships in social networks. The Strength of Weak Ties is a famousearly paper on implication of social networks on the spread of news and ideas among differentsocial communities [16,30]. The reference work and handbook on the subject of social networkstructural analysis are SNA by Stanley Wasserman and Katherine Faust [6]. Other introductory textbooks on the subject worth to mention are John Scott’s SNA [8] and [7] by Carrington et al. Tomaster the subject, a basic knowledge of graph theory is required [31].SNA has been applied in several case studies and analysis to cover and uncover communication
patterns and social relationships. Knowledge management uses SNA to investigate how work getsdone in organizations [9,32]. A practical example is the analysis of email communication to discovercommunity structures within organizations [33]. Another application is the use of SNA to predictand understand viral marketing [34].The analysis of social communities has expanded to computer-mediated communication [35–38].
As reported by Wellman, an electronic group is virtually a social network [39]. Usenet networkhas been analyzed and newsgroups posts have been used to extract communication patterns andidentify community structure and roles [40–42], and essentially, the message is that you are whoyou talk to [25].Finding communities in the web or in any social network are important to identify and characterize
groups of people with similar interests [14,43–47]. We have used the Newman’s algorithm to extractcommunities in the Apache sociogram [13,48].Physicists are now exploring different kinds of networks to find patterns and explain phenomena
by investigating network structures [11]. These investigations expand from the analysis of theWWW (World Wide Web) to biology and include many other interesting subjects [10,49–51].For example, the small world phenomenon, the concept of 6 degrees of separation created by thesocial psychologist at Yale University Milgram, has been found in network structures ranging fromscientific publications to network electricity grids. Scientists are now looking for the meanings andimplications associated with different network structures [52–54].Social network visualization is important to represent social relationships and social network
metrics [55,56]. To draw the Apache sociogram we have used the Kamada–Kawai graph layoutwhich attempts to position nodes on the space so that the geometric (Euclidean) distance betweenthem is as close as possible to the graph-theoretic (path) distance between them [24]. Several toolsexist to analyze and visualize social networks. The most famous are UCINET, Netminer, Netdraw,Pajek, Vizster. A discussion and a review of different software for SNA are in [7]. In our work wehave used Pajek [15] to analyze and visualize the social networks.Regarding software engineering, the need for collaboration and coordination in software devel-
opment teams has been considered for quite a long time [57–60]. That continuous developers’interaction eases and improves software knowledge is also shown by the empirical study of pairdesigning as practice for enforcing and diffusing design knowledge [61].
Copyright q 2009 John Wiley & Sons, Ltd. J. Softw. Maint. Evol.: Res. Pract. 2009; 21:189–215DOI: 10.1002/smr
206 C. DEL ROSSO
A seminal work by Parnas recognizes the need to structure software systems into modules [62]to improve software development including concurrent development. Using API to access softwarecomponents is the key to preserve separation of concerns and to ensure an easier evolution of largesoftware-intensive systems. However, it is important to take into account the concept of publicversus published interfaces [28] and that the distributed nature of software development affects theuse of APIs [63].That a link between software architecture and the organization structure exists is known as
Conway’s law [5,22,64]. Software is a human activity [65] and there is the need to link the gapbetween social and software dependencies [66,67] to improve software evolution [68,69] and findexpertise in teams [70,71]. The importance of these studies comes also from the fact that softwaredevelopment is more and more geographically distributed and language, time zone, and culturedifferences create barriers which negatively influence communication and coordination. Relevantstudies on global software engineering include [2,3,23,72–76].Software quality can be improved by enhancing collaboration and coordination [77–79]. Some
of the following studies have used software repositories or e-mail networks to reconstruct socialdependencies from software artifact. The international workshop on Mining Software Repositoriesworkshop (MSR) is one of the main events on the subject. Interesting studies on the informa-tion that can be extracted from mining e-mails and software repositories are [32,63,80,81]. Anin-depth study using developer mailing lists, CVS and error reporting systems have focused onthe open-source projects of Apache and Mozilla [82] mainly investigating the software develop-ment process. Developers’ social networks have been extracted and analyzed from e-mail networks[21,83] and CVS [84,85]. Mining emails to reconstruct a social network is a viable approach;however, the disadvantage is the inability to (automatically) establish a clear link between softwareand developers. The e-mail approach has also the disadvantages when dealing with e-mail aliases[83], however, it seems that the same social network can be used to discover e-mail aliases [86].The use of software repositories overcomes some of these problems.We have used the Apache subversion repository to reconstruct the developers’ social network
and our work is an in-depth structural SNA when compared with previous works where only basicmetrics were used. Additionally, none of the related works have focused on affiliation networks andhave explicitly targeted the impact of social networks on the software architecture. We have focusedour case study on Apache, a collaborative and distributed open-source project which produces themost successful HTTP server according to Netcraft [18]. How the shared leadership is managed inApache is described by Fielding, one of its founders in [19].
8. DISCUSSION
Communication and coordination are important in the context of large organizations and whenpeople are distributed geographically. Culture, language, time zone differences, and a high numberof management layers impede a smooth flow of information. The former Intel CEO, Andy Grove,highlighted some of these problems in his book, only the paranoid survive. He described how, inone organization, bad news did not flow up to the management layer: bad news was eliminated, bitby bit, data point by data point, as information was advanced along the management chain[87, p. 119].
Copyright q 2009 John Wiley & Sons, Ltd. J. Softw. Maint. Evol.: Res. Pract. 2009; 21:189–215DOI: 10.1002/smr
COMPREHEND AND ANALYZE KNOWLEDGE NETWORKS 207
Nowadays work is shared and having the right set of connections is fundamental. In a collaborativeworking environment it is important to have the right tools and a social environment for effectiveand timely knowledge sharing.SNA can be used to reveal collaboration patterns that go beyond the organization charts. In fact,
organization charts are not the best indicator of how things get done and senior people do notalways are central. For example, who do you turn to get things done? The concepts of bottlenecks,centers, and groups are important to pinpoint cross-boundary breakdowns in information flow andcollaboration. The barriers can be functional, for example, between the marketing and the financedepartments, geographical, hierarchical, or organizational.SNA helps in finding the knowledge in the social network, improving the communication, and
enhancing productivity and efficiency. Examples of problems existing in organizations are bound-aries created by distinct groups that do not collaborate, bottlenecks created by bridges and centralpeople and the power gained by individuals who act in brokerage roles (control points) in thenetwork. Various metrics can be extracted by analyzing the structure of social networks. In this paperwe have explored the concepts of affiliation networks, centrality, betweenness, density, cohesion,communities, and brokerage roles.Given the importance of communication and coordination in large organizations and software
projects, we have applied SNA to software development. Creating software is a human activity andunderstanding formal and informal communication patterns and relationships in a software projector in an organization is as important as analyzing the software architecture and the software sourcecode [61]. Actually, all the various elements are just intertwined and cannot be kept isolated. Peoplecreate the software architecture which shapes the source code, and vice versa [5,64].In our analysis we have reconstructed the affiliation network of software developers in Apache
using software repositories. The assumption was that people working on the same file are relatedbecause they need to coordinate and communicate for their shared work. Mining developers’ e-mailsocial networks presents problems related to aliases [21], additionally, it is not possible to createan affiliation network which establishes a clear link between developers and software source code(at least not automatically).We want to highlight in this discussion that, even though we have used software repositories in our
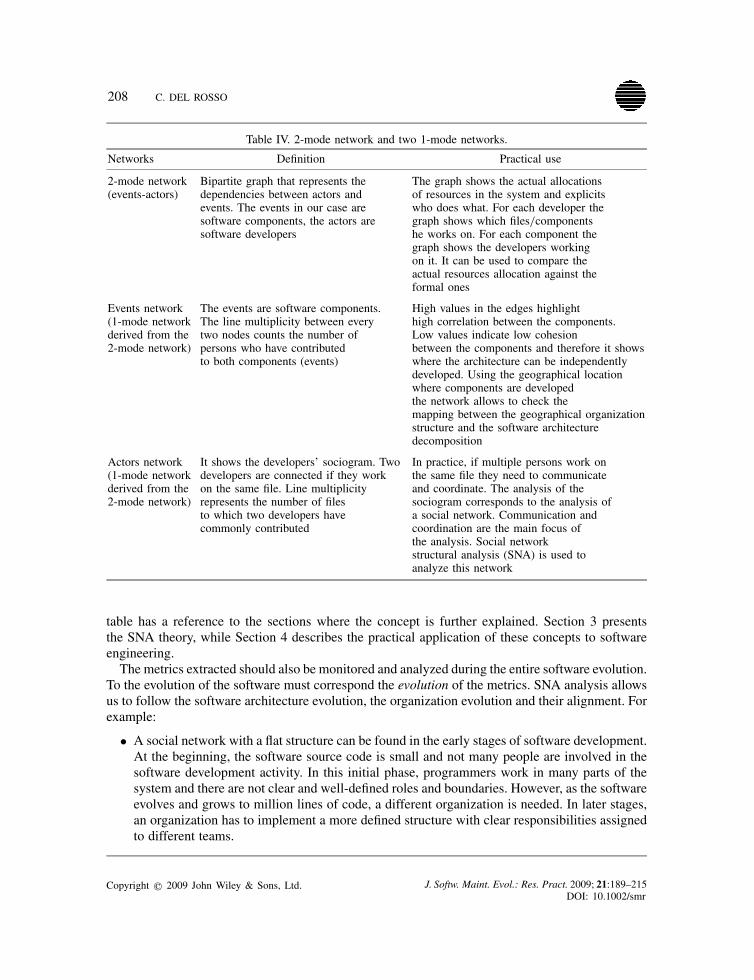
case study, they are not and should not the only source of information that can be used. The intentionsof our work are to show how to apply and why to use an SNA approach in the context of softwareengineering. The metrics we have described are valid for any social network. For the analysis, it isimportant to establish a meaningful social relationship. Computer-mediated conversations such ase-mails [33], newsgroups [25], IMs, can be used to extract social relationships [39,88]. Computer-mediated communication represents an important source of information, however, it is not theonly one and it cannot be. Face-to-face communication still plays a major role in the softwaredevelopment. For a better understanding of interactions and evaluation of knowledge networks,additional methods such as questionnaires and interviews should be used.Table IV shows the networks we have reconstructed, summarizes their definition and their prac-
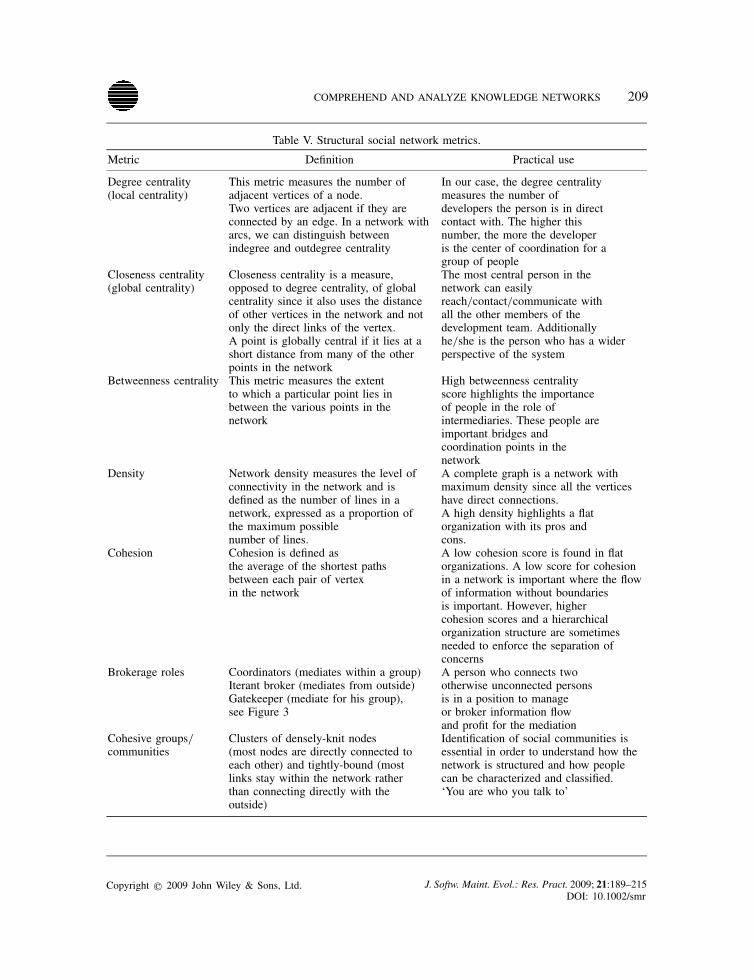
tical use in the context of our study.Table V summarizes the metrics we have used, their definitions and their practical use and benefits
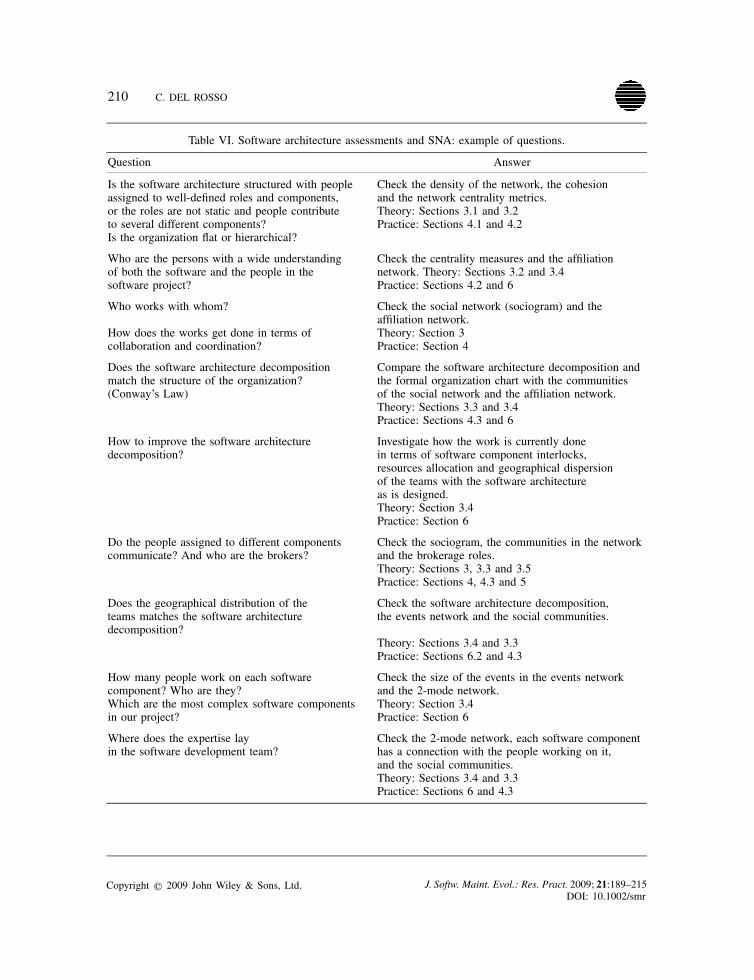
in the context of our analysis.Table VI illustrates the practical use of SNA and the questions are examples of an analysis that
can be performed to support software evolution and software comprehension. Each answer in the
Copyright q 2009 John Wiley & Sons, Ltd. J. Softw. Maint. Evol.: Res. Pract. 2009; 21:189–215DOI: 10.1002/smr
208 C. DEL ROSSO
Table IV. 2-mode network and two 1-mode networks.
Networks Definition Practical use
2-mode network Bipartite graph that represents the The graph shows the actual allocations(events-actors) dependencies between actors and of resources in the system and explicits
events. The events in our case are who does what. For each developer thesoftware components, the actors are graph shows which files/componentssoftware developers he works on. For each component the
graph shows the developers workingon it. It can be used to compare theactual resources allocation against theformal ones
Events network The events are software components. High values in the edges highlight(1-mode network The line multiplicity between every high correlation between the components.derived from the two nodes counts the number of Low values indicate low cohesion2-mode network) persons who have contributed between the components and therefore it shows
to both components (events) where the architecture can be independentlydeveloped. Using the geographical locationwhere components are developedthe network allows to check themapping between the geographical organizationstructure and the software architecturedecomposition
Actors network It shows the developers’ sociogram. Two In practice, if multiple persons work on(1-mode network developers are connected if they work the same file they need to communicatederived from the on the same file. Line multiplicity and coordinate. The analysis of the2-mode network) represents the number of files sociogram corresponds to the analysis of
to which two developers have a social network. Communication andcommonly contributed coordination are the main focus of
the analysis. Social networkstructural analysis (SNA) is used toanalyze this network
table has a reference to the sections where the concept is further explained. Section 3 presentsthe SNA theory, while Section 4 describes the practical application of these concepts to softwareengineering.The metrics extracted should also be monitored and analyzed during the entire software evolution.
To the evolution of the software must correspond the evolution of the metrics. SNA analysis allowsus to follow the software architecture evolution, the organization evolution and their alignment. Forexample:
• A social network with a flat structure can be found in the early stages of software development.At the beginning, the software source code is small and not many people are involved in thesoftware development activity. In this initial phase, programmers work in many parts of thesystem and there are not clear and well-defined roles and boundaries. However, as the softwareevolves and grows to million lines of code, a different organization is needed. In later stages,an organization has to implement a more defined structure with clear responsibilities assignedto different teams.
Copyright q 2009 John Wiley & Sons, Ltd. J. Softw. Maint. Evol.: Res. Pract. 2009; 21:189–215DOI: 10.1002/smr
COMPREHEND AND ANALYZE KNOWLEDGE NETWORKS 209
Table V. Structural social network metrics.
Metric Definition Practical use
Degree centrality This metric measures the number of In our case, the degree centrality(local centrality) adjacent vertices of a node. measures the number of
Two vertices are adjacent if they are developers the person is in directconnected by an edge. In a network with contact with. The higher thisarcs, we can distinguish between number, the more the developerindegree and outdegree centrality is the center of coordination for a
group of peopleCloseness centrality Closeness centrality is a measure, The most central person in the(global centrality) opposed to degree centrality, of global network can easily
centrality since it also uses the distance reach/contact/communicate withof other vertices in the network and not all the other members of theonly the direct links of the vertex. development team. AdditionallyA point is globally central if it lies at a he/she is the person who has a widershort distance from many of the other perspective of the systempoints in the network
Betweenness centrality This metric measures the extent High betweenness centralityto which a particular point lies in score highlights the importancebetween the various points in the of people in the role ofnetwork intermediaries. These people are
important bridges andcoordination points in thenetwork
Density Network density measures the level of A complete graph is a network withconnectivity in the network and is maximum density since all the verticesdefined as the number of lines in a have direct connections.network, expressed as a proportion of A high density highlights a flatthe maximum possible organization with its pros andnumber of lines. cons.
Cohesion Cohesion is defined as A low cohesion score is found in flatthe average of the shortest paths organizations. A low score for cohesionbetween each pair of vertex in a network is important where the flowin the network of information without boundaries
is important. However, highercohesion scores and a hierarchicalorganization structure are sometimesneeded to enforce the separation ofconcerns
Brokerage roles Coordinators (mediates within a group) A person who connects twoIterant broker (mediates from outside) otherwise unconnected personsGatekeeper (mediate for his group), is in a position to managesee Figure 3 or broker information flow
and profit for the mediationCohesive groups/ Clusters of densely-knit nodes Identification of social communities iscommunities (most nodes are directly connected to essential in order to understand how the
each other) and tightly-bound (most network is structured and how peoplelinks stay within the network rather can be characterized and classified.than connecting directly with the ‘You are who you talk to’outside)
Copyright q 2009 John Wiley & Sons, Ltd. J. Softw. Maint. Evol.: Res. Pract. 2009; 21:189–215DOI: 10.1002/smr
210 C. DEL ROSSO
Table VI. Software architecture assessments and SNA: example of questions.
Question Answer
Is the software architecture structured with people Check the density of the network, the cohesionassigned to well-defined roles and components, and the network centrality metrics.or the roles are not static and people contribute Theory: Sections 3.1 and 3.2to several different components? Practice: Sections 4.1 and 4.2Is the organization flat or hierarchical?
Who are the persons with a wide understanding Check the centrality measures and the affiliationof both the software and the people in the network. Theory: Sections 3.2 and 3.4software project? Practice: Sections 4.2 and 6
Who works with whom? Check the social network (sociogram) and theaffiliation network.
How does the works get done in terms of Theory: Section 3collaboration and coordination? Practice: Section 4
Does the software architecture decomposition Compare the software architecture decomposition andmatch the structure of the organization? the formal organization chart with the communities(Conway’s Law) of the social network and the affiliation network.
Theory: Sections 3.3 and 3.4Practice: Sections 4.3 and 6
How to improve the software architecture Investigate how the work is currently donedecomposition? in terms of software component interlocks,
resources allocation and geographical dispersionof the teams with the software architectureas is designed.Theory: Section 3.4Practice: Section 6
Do the people assigned to different components Check the sociogram, the communities in the networkcommunicate? And who are the brokers? and the brokerage roles.
Theory: Sections 3, 3.3 and 3.5Practice: Sections 4, 4.3 and 5
Does the geographical distribution of the Check the software architecture decomposition,teams matches the software architecture the events network and the social communities.decomposition?
Theory: Sections 3.4 and 3.3Practice: Sections 6.2 and 4.3
How many people work on each software Check the size of the events in the events networkcomponent? Who are they? and the 2-mode network.Which are the most complex software components Theory: Section 3.4in our project? Practice: Section 6
Where does the expertise lay Check the 2-mode network, each software componentin the software development team? has a connection with the people working on it,
and the social communities.Theory: Sections 3.4 and 3.3Practice: Sections 6 and 4.3
Copyright q 2009 John Wiley & Sons, Ltd. J. Softw. Maint. Evol.: Res. Pract. 2009; 21:189–215DOI: 10.1002/smr
COMPREHEND AND ANALYZE KNOWLEDGE NETWORKS 211
• In the initial phases of the software life cycle, the software architecture mirrors the organizationstructure in which it is created [5]. Consequently, software modularity reflects the underlyingorganization structure [22]. For example, if you have four groups working in a compiler,the result would most probably be a 4-pass compiler. However, as an organization evolves,changes are made to its organizational structure. The changes in the organization have animpact on the software development process, in the communication and organization within theteams and indirectly on the software architecture design. Vice versa, a software architect musttake into account the underlying organization structure and consider the implication of socialdependencies and not only technical dependencies when refactoring a software architecture.To improve software evolution, the alignment between the organization and the softwarearchitecture must be ensured.
In modern times, the distributed nature of software creation makes necessary tools and methodsto improve and address the coordination and communication in software development teams. Withthis paper we have shown how to analyze and improve software development with the use ofSNA. SNA facilitates the understanding of the patterns of information flow and interactions amongdevelopers [78]. Software architects and developers should have the tools to understand their socialnetworks which make them aware of the scope and the roles of people within their organization andsoftware development team [69,77,84]. Finding the person who has the right expertise [70,71,77]or who can help to fix a software bug is fundamental in large, complex software projects weare now facing.
9. CONCLUSION AND FUTURE WORK
Software comprehension and evolution include the understanding of various levels of abstraction andtheir interdependencies. In our work, we have focused on the analysis of knowledge networks andon how they relate to the other underlying layers. We have used SNA to analyze the communicationand coordination patterns in software development teams and Apache was used as a case study.From SNA, we have taken the concepts of affiliation networks, centrality, betweenness, density,cohesion, communities, and brokerage roles. These metrics allow a software architect to understandand improve the coordination and communication in large and distributed software developmentteams. Furthermore, the comprehension of the different views, the organizational structure, theknowledge network, and the software architecture are essential to enable software maintenance andevolution. In fact, their alignment must be ensured and our research allows the knowledge networkstructure to be taken into account in this process.In practice, our work helps an architect to understand and manage how software developers
interact and coordinates, to point out who are the developers working on the various softwarecomponents, to find the central coordination and communication points, the brokers in the softwaredevelopment team and to identify the relationships between the software architecture and the orga-nization. Re-engineering of the organizational structure and refactoring of the software architectureare some of the actions that can be undertaken after the analysis. For example, Apache has a flatorganizational structure, with high cohesion and high density. Given the relatively small size of theproject, this structure is effective and works well at the moment. However, as the software evolvesand the complexity increases, more specialization is required and a more hierarchical organizationstructure would be more suitable and expected.
Copyright q 2009 John Wiley & Sons, Ltd. J. Softw. Maint. Evol.: Res. Pract. 2009; 21:189–215DOI: 10.1002/smr
212 C. DEL ROSSO
In the analysis of the Apache web server we did not include issues such as the programminglanguages used in the project which can be used, for example, to determine where this specificexpertise lies in the software development team; a person’s position in the organizational charts, i.e.,manager; geographical locations and department affiliations. In general, any additional informationenhances the analysis.Our future work aims to better understand the connections between people, organizations and soft-
ware and ensure the software architecture alignment, known as Conway’s Law [5]. At the moment,the use of subversion repositories guarantees a strong and clear approach to ensure the traceabilityperson-source code. However, several interesting new areas should be tackled by the research;for example, in this work we have only considered the social network static structure. Addition-ally, further studies on different software systems can help us understand better how software isdeveloped and consequently how to improve the software quality. In this paper, we have inves-tigated open-source software. In future work we will also focus on proprietary software systemsand on software developed within large corporations (e.g., Nokia mobile phone software). Further-more, with the popularity of the use of OSS also in the context of corporations, it is important toanalyze how this hybrid software development process, with the use of closed and OSS, affects theorganization. An example is the Maemo platform§ in the Nokia N800 tablet PC, developed usingOSS components with the addition of Nokia proprietary software. Our initial work on Maemo,indeed, supports our approach and expected results. For example, in Maemo we have found a morehierarchical organizational structure with developers assigned to well-defined roles.To aim at software comprehension and to improve software evolution, different assessment
methods should be used in order to address the whole software development stack [4]. The analysisshould start by analyzing the source code and go up to function calls, classes, components, featuresmodeling, people, and vice versa. The use of SNA and the investigation presented in this paper isanother analysis tool that should be available to software architects.
REFERENCES
1. Brooks FP. The Mythical Man-Month. Anniversary Edition, Addison-Wesley: Reading, MA, 1995.2. Herbsleb J, Mockus A. An empirical study of speed and communication in globally distributed software development.
IEEE Transactions on Software Engineering 2003; 29(6):481–494.3. Global software development. IEEE Software 2001; 18(2). Special issue.4. Del Rosso C. Continuous evolution through software architecture evaluation. Journal of Software Maintenance and
Evolution: Research and Practice 2006; 18(5):351–383.5. Conway M. How do committees invent. Datamation 1968; 14(4):28–31.6. Wasserman S, Faust K. Social Network Analysis. Cambridge University Press: Cambridge, 1994.7. Carrington PJ, Scott J, Wasserman S. Models and Methods in Social Network Analysis. Cambridge University Press:
Cambridge, 2005.8. Scott J. Social Network Analysis ( 2nd edn). Sage Publications: Beverley Hills, CA, 2000.9. Cross RL, Parker A. The Hidden Power of Social Networks: Understanding How Work Really Gets Done in Organizations.
Harvard Business School Press: Boston, MA, 2004.10. Dorogovtsev SN, Mendes JFF. Evolution of Networks: From Biological Nets to the Internet and WWW. Oxford University
Press: Oxford, 2003.11. Boccara N. Modeling Complex Systems. Springer: Berlin, 2006.12. Foster CC, Rapoport A, Orwant CJ. A study of a large sociogram: Elimination of free parameters. Behavioral Science
1963; 8:56–65.
§http://maemo.org/.
Copyright q 2009 John Wiley & Sons, Ltd. J. Softw. Maint. Evol.: Res. Pract. 2009; 21:189–215DOI: 10.1002/smr
COMPREHEND AND ANALYZE KNOWLEDGE NETWORKS 213
13. Clauset A, Newman MEJ, Moore C. Finding community structure in very large networks. Physical Review E 2004;70(6):066111.
14. Flake G, Lawrence S, Giles C, Coetzee F. Self-organization and identification of web communities. IEEE Computer2002; 35(3):66–70.
15. de Nooy W, Mrvar A, Batagelj V. Exploratory Social Network Analysis with Pajek. Cambridge University Press:Cambridge, 2005.
16. Granovetter M. The strength of weak ties: A network theory revisited. Sociological Theory 1983; 1:201–233.17. Apache Foundation. Apache Web Server, 2006. Available at: http://www.apache.org [17 March].18. Netcraft web server survey. Available at: http://survey.netcraft.com/archive.html [30 December].19. Fielding RT. Shared leadership in the apache project. Communications of the ACM 1999; 42(4):42–43.20. Subversion. Subversion Version Control System. Available at: http://subversion.tigris.org/ [17 March].21. Bird C, Gourley A, Devanbu P, Gertz M, Swaminathan A. Mining email social networks in postgres. MSR ’06:
Proceedings of the 2006 International Workshop on Mining Software Repositories. ACM Press: New York NY, U.S.A.,2006; 185–186.
22. Alan CYB, MacCormack D, Rusnak J. Exploring the duality between product and organizational architectures: A testof the mirroring hypothesis. Working Papers, Harvard Business School, March 2008.
23. Bass M, Mikulovic V, Bass L, Herbsleb J, Cataldo M. Architectural misalignment: An experience report. Proceedingsof the Sixth Working IEEE/IFIP Conference on Software Architecture (WICSA ’07), January 2007.
24. Kamada T, Kawai S. An algorithm for drawing general undirected graphs. Information Processing Letters 1989; 31(1):7–15.
25. Fisher D, Smith M, Welser H. You are who you talk to: Detecting roles in usenet newsgroups. Proceedings of the 39thAnnual Hawaii International Conference on System Sciences, vol. 3, 2006; 59b–59b.
26. Riva C. Reverse architecting: An industrial experience report. Proceedings of the 7th Working Conference on ReverseEngineering (WCRE2000), 23–25 November 2000.
27. Parnas D. Designing software for ease of extension and contraction. IEEE Transactions on Software Engineering 1979;SE-5(2):128–138.
28. Fowler M. Public versus published interfaces. IEEE Software 2002; 19(2):18–19.29. de Souza CRB, Redmiles D, Cheng L-T, Millen D, Patterson J. How a good software practice thwarts collaboration:
The multiple roles of apis in software development. SIGSOFT ’04/FSE-12:4 Proceedings of the 12th ACM SIGSOFTTwelfth International Symposium on Foundations of Software Engineering. ACM Press: New York NY, U.S.A., 2004;221–230.
30. Granovetter M. The strength of weak ties. American Journal of Sociology 1973; 78:1360–1380.31. Diestel R. Graph Theory. Springer: Berlin, 2006.32. McDonald DW. Recommending collaboration with social networks: A comparative evaluation. CHI ’03: Proceedings of
the SIGCHI Conference on Human Factors in Computing Systems. ACM Press: New York NY, U.S.A., 2003; 593–600.33. Tyler JR, Wilkinson DM, Huberman BA. Email as Spectroscopy: Automated Discovery of Community Structure within
Organizations. 2003; 81–96.34. Leskovec J, Adamic LA, Huberman BA. The dynamics of viral marketing. EC ’06: Proceedings of the 7th ACM
Conference on Electronic Commerce. ACM Press: New York NY, U.S.A., 2006; 228–237.35. Licoppea C, Smoreda Z. Are social networks technologically embedded? how networks are changing today with changes
in communication technology. Social Networks 2005; 27(4):317–335.36. Wellman B. For a social network analysis of computer networks: A sociological perspective on collaborative work and
virtual community. SIGCPR ’96: Proceedings of the 1996 ACM SIGCPR/SIGMIS Conference on Computer PersonnelResearch. ACM Press: New York NY, U.S.A., 1996; 1–11.
37. Gloor PA. Capturing team dynamics through temporal social surfaces. Proceedings of Ninth International Conferenceon Information Visualisation, 2005; 939–944.
38. Churchill E, Halverson C. Guest editors’ introduction: Social networks and social networking. IEEE Internet Computing2005; 9(5):14–19.
39. Wellman B. An Electronic Group is Virtually a Social Network, 1997.40. Turner TC, Smith MA, Fisher D, Welser HT. Picturing usenet: Mapping computer-mediated collective action. Journal of
Computer-mediated Communication 2005; 10(4), article 7. Available at: http://jcmc.indiana.edu/vol10/issue4/turner.html.41. Fisher D. Using egocentric networks to understand communication. IEEE Internet Computing 2005; 9(5):20–28.42. Fisher D, Dourish P. Social and temporal structures in everyday collaboration. CHI ’04: Proceedings of the SIGCHI
Conference on Human Factors in Computing Systems. ACM Press: New York NY, U.S.A., 2004; 551–558.43. Radicchi F, Castellano C, Cecconi F, Loreto V, Parisi D. Defining and identifying communities in networks. Proceedings
of the National Academy of Sciences of United State of America 2004; 101(9):2658–2663.44. Adamic LA, Adar E. Friends and neighbors on the web. Social Networks 2003; 25(3):211–230.45. Holme P, Edling CR, Liljeros F. Structure and time evolution of an internet dating community. Social Networks 2004;
26(2):155–174.
Copyright q 2009 John Wiley & Sons, Ltd. J. Softw. Maint. Evol.: Res. Pract. 2009; 21:189–215DOI: 10.1002/smr
214 C. DEL ROSSO
46. Newman MEJ. Community structure in social and biological networks. Proceedings of the National Academy of Sciencesof United State of America 2002; 99:7821–7826.
47. Watts DJ, Dodds PS, Newman MEJ. Identity and search in social networks. Science 2002; 296:1302–1305.48. Newman MEJ, Girvan M. Finding and evaluating community structure in networks. Physics Review E 2004; 69(2):026113.49. Newman MEJ. The structure and function of complex networks. SIAM Review Journal 2003; 45(2):167–256.50. Albert R, Barabasi A. Statistical mechanics of complex networks. Reviews of Modern Physics 2002; 74(1):47–97.51. Ebel H, Mielsch L-I, Bornholdt S. Scale-free topology of e-mail networks. Physics Review E 2002; 66(3):035103.52. Newman MEJ. Small worlds: The structure of social networks. cond-mat/0001118, 1999.53. Adamic LA, Lukose RM, Puniyani AR, Huberman BA. Search in power-law networks. Physics Review E 2001; 64:046135.54. Newman MEJ. Who is the best connected scientist? A study of scientific coauthorship networks. Complex Networks.
Springer: Berlin, 2004; 337–370.55. Freeman L. Visualizing social networks. Journal of Social Structure 2000; 1(1). Available at: http://www.cmu.edu/joss/
content/articles/volume1/Freeman.html.56. Heer J, Boyd D. Vizster: Visualizing online social networks. Proceedings 2005 IEEE Symposium on Information
Visualization, 2005; 33–40.57. Agile Manifesto. Manifesto for Agile Software Development, 2006. Available at: http://agilemanifesto.org/ [17 March].58. Beck K, Andres C. Extreme Programming Explained: Embrace Change. Addison-Wesley Professional: Indianapolis, IN,
2004.59. Cockburn A. Agile Software Development. Addison-Wesley Professional: Indianapolis, IN, 2001.60. Schwaber K, Beedle M. Agile Software Development with SCRUM. Prentice-Hall: Englewood Cliffs, NJ, 2001.61. Bellini E, Canfora G, Garcia F, Piattini M, Visaggio CA. Pair designing as practice for enforcing and diffusion design
knowledge. Journal of Software Maintenance and Evolution: Research and Practice 2005; 17(6):401–423.62. Parnas DL. On the criteria to be used in decomposing systems into modules. Communications of the ACM 1972;
15(12):1053–1058.63. Svahnberg M, Van Gurp J, Bosch J. A taxonomy of variability realization techniques. Software: Practice and Experience
2005; 35:705–754.64. Cockburn A. The interaction of social issues and software architecture. Communications of the ACM 1996; 39(10):40–46.65. Fisher G. Software engineering—a human activity. Automated Software Engineering 2002; 10:233–237.66. Trainer E, Quirk S, de Souza C, Redmiles D. Bridging the gap between technical and social dependencies with ariadne.
Eclipse ’05: Proceedings of the 2005 OOPSLA Workshop on Eclipse Technology eXchange. ACM Press: New York NY,U.S.A., 2005; 26–30.
67. de Souza C, Froehlich J, Dourish P. Seeking the source: Software source code as a social and technical artifact. GROUP’05: Proceedings of the 2005 International ACM SIGGROUP Conference on Supporting Group Work. ACM Press:New York NY, U.S.A., 2005; 197–206.
68. Anvik J, Hiew L, Murphy GC. Who should fix this bug? ICSE ’06: Proceedings of the 28th International Conferenceon Software Engineering. ACM Press: New York NY, U.S.A., 2006; 361–370.
69. Safayeni F, Duimering PR, Zheng K, Derbentseva N, Poile C, Ran B. Requirements engineering in new productdevelopment. Communications of the ACM 2008; 51(3):77–82.
70. Mockus A, Herbsleb JD. Expertise browser: A quantitative approach to identifying expertise. ICSE ’02: Proceedings ofthe 24th International Conference on Software Engineering. ACM Press: New York NY, U.S.A., 2002; 503–512.
71. Sarma A, Noroozi Z, van der Hoek A. Palantır: Raising awareness among configuration management workspaces. ICSE’03: Proceedings of the 25th International Conference on Software Engineering. IEEE Computer Society: WashingtonDC, U.S.A., 2003; 444–454.
72. Herbsleb JD, Grinter RE. Splitting the organization and integrating the code: Conway’s law revisited. ICSE ’99:Proceedings of the 21st International Conference on Software Engineering. IEEE Computer Society Press: Los AlamitosCA, U.S.A., 1999; 85–95.
73. Amrit C. Coordination in software development: The problem of task allocation. SIGSOFT Software Engineering Notes2005; 30(4):1–7.
74. Grinter RE, Herbsleb JD, Perry DE. The geography of coordination: dealing with distance in r&d work. GROUP ’99:Proceedings of the International ACM SIGGROUP Conference on Supporting Group Work. ACM Press: New York NY,U.S.A., 1999; 306–315.
75. Grinter RE. Recomposition: Putting it all back together again. CSCW ’98: Proceedings of the 1998 ACM Conference onComputer Supported Cooperative Work. ACM Press: New York NY, U.S.A., 1998; 393–402.
76. Herbsleb JD, Mockus A, Finholt TA, Grinter RE. An empirical study of global software development: Distance andspeed. ICSE ’01: Proceedings of the 23rd International Conference on Software Engineering. IEEE Computer Society:Washington DC, U.S.A., 2001; 81–90.
77. Ye Y. Supporting software development as knowledge-intensive and collaborative activity. WISER ’06: Proceedings of the2006 International Workshop on Interdisciplinary Software Engineering Research. ACM Press: New York NY, U.S.A.,2006; 15–22.
Copyright q 2009 John Wiley & Sons, Ltd. J. Softw. Maint. Evol.: Res. Pract. 2009; 21:189–215DOI: 10.1002/smr
COMPREHEND AND ANALYZE KNOWLEDGE NETWORKS 215
78. Herbsleb JD. Global software engineering: The future of socio-technical coordination. FOSE ’07: 2007 Future of SoftwareEngineering. IEEE Computer Society: Washington DC, U.S.A., 2007; 188–198.
79. Herbsleb JD. Beyond computer science. ICSE ’05: Proceedings of the 27th International Conference on SoftwareEngineering. ACM: New York NY, U.S.A., 2005; 23–27.
80. Voinea L, Telea A. An open framework for cvs repository querying, analysis and visualization. MSR ’06: Proceedingsof the 2006 International Workshop on Mining Software Repositories. ACM Press: New York NY, U.S.A., 2006; 33–39.
81. Eick S, Graves T, Karr A, Marron J, Mockus A. Does code decay? Assessing the evidence from change managementdata. IEEE Transactions on Software Engineering 2001; 27(1):1–12.
82. Two case studies of open source software development: Apache and mozilla. ACM Transactions on Software Engineeringand Methodology 2002; 11(3):309–346.
83. Bird C, Gourley A, Devanbu P, Gertz M, Swaminathan A. Mining email social networks. MSR ’06: Proceedings of the2006 International Workshop on Mining Software Repositories. ACM Press: New York NY, U.S.A., 2006; 137–143.
84. de Souza C, Froehlich J, Dourish P. Seeking the source: Software source code as a social and technical artifact. GROUP’05: Proceedings of the 2005 International ACM SIGGROUP Conference on Supporting Group Work. ACM Press:New York NY, U.S.A., 2005; 197–206.
85. Lopez L, Gonzalez-Barahona JM, Robles G. Applying social network analysis to the information in cvs repositories.Proceedings of the International Workshop on Mining Software Repositories, 2004; 101–105.
86. Holzer R, Malin B, Sweeney L. Email alias detection using social network analysis. LinkKDD ’05: Proceedings of the3rd International Workshop on Link Discovery. ACM Press: New York NY, U.S.A., 2005; 52–57.
87. Grove AS. Only the Paranoid Survive. Profile Business: London, 1998.88. Wellman B. For a social network analysis of computer networks: A sociological perspective on collaborative work and
virtual community. SIGCPR ’96: Proceedings of the 1996 ACM SIGCPR/SIGMIS Conference on Computer PersonnelResearch. ACM Press: New York NY, U.S.A., 1996; 1–11.
AUTHOR’S BIOGRAPHY
Christian Del Rosso received his MSc degree in Computer Science from the Universityof Bologna in 2001 and an MBA from the IE Business School Madrid Spain in 2008. Heis a researcher at the Nokia Research Center in Helsinki and his main research interestsare software architecture design and evolution, Internet services and digital convergence.
Copyright q 2009 John Wiley & Sons, Ltd. J. Softw. Maint. Evol.: Res. Pract. 2009; 21:189–215DOI: 10.1002/smr