Embed Size (px)
Citation preview
C
Wat
Compr
terTre
3
rehens
eatmen
Pr
City
Dece
Pr
AN3900 Ambass
Ancho
siveEnForntPlan
repared For
y of Gambell
ember 4, 2012
epared By:
NTHC‐DEHE sador Drive, Srage, AK 995
nergyA
nt‐Wa
2
Suite 301 508
Audit
sheter
ria
1

2
TableofContents 1. EXECUTIVE SUMMARY .............................................................................................................................. 3 2. AUDIT AND ANALYSIS BACKGROUND ....................................................................................................... 4 2.1 Program Description ........................................................................................................................... 4 2.2 Audit Description ................................................................................................................................ 5 2.3. Method of Analysis ............................................................................................................................ 5 2.4 Limitations of Study ............................................................................................................................ 7
3. Water Treatment Plant ‐ Washeteria ....................................................................................................... 7 3.1. Building Description ........................................................................................................................... 7 3.2 Predicted Energy Use .......................................................................................................................... 9 3.2.1 Energy Usage / Tariffs .................................................................................................................. 9 3.2.2 Energy Use Index (EUI) .............................................................................................................. 12
3.3 AkWarm© Building Simulation ......................................................................................................... 13 4. ENERGY COST SAVING MEASURES ......................................................................................................... 14 4.1 Summary of Results .......................................................................................................................... 14 4.2 Interactive Effects of Projects ........................................................................................................... 14
Appendix A – Listing of Energy Conservation and Renewable Energy Websites ........................................ 17 Appendix B – Direct Vent Oil Heater Programming .................................................................................... 18
PREFACE
The Energy Projects Group at the Alaska Native Tribal Health Consortium (ANTHC) prepared this document for the Native Village of Gambell. The authors of this report are Carl Remley, Certified Energy Auditor (CEA) and Gavin Dixon. The purpose of this report is to provide a comprehensive document that summarizes the findings and analysis that resulted from an energy audit conducted over the past couple months by the Energy Projects Group of ANTHC. This report analyzes historical energy use and identifies costs and savings of recommended energy efficiency measures. Discussions of site specific concerns and an Energy Efficiency Action Plan are also included in this report. ACKNOWLEDGMENTS The Energy Projects Group gratefully acknowledges the assistance of the staff of the water plant.

3
1.EXECUTIVESUMMARY This report was prepared for the City of Gambell. The scope of the audit focused on Water Treatment Plant ‐ Washeteria. The scope of this report is a comprehensive energy study, which included an analysis of building shell, interior and exterior lighting systems, HVAC systems, and plug loads. Based on electricity and fuel oil prices in effect at the time of the audit, the annual predicted energy costs for the buildings analyzed are $16,127 for Electricity and $73,684 for #1 Oil, with total energy costs of $89,811 per year. It should be noted that this facility received the power cost equalization (PCE) subsidy from the State of Alaska last year. If this facility had not received PCE, total electrical costs would have been $51,606. Table 1.1 below summarizes the energy efficiency measures analyzed for the Water Treatment Plant ‐ Washeteria. Listed are the estimates of the annual savings, installed costs, and two different financial measures of investment return.
Table 1.1PRIORITY LIST – ENERGY EFFICIENCY MEASURES
Rank
Feature
Improvement Description
Annual Energy Savings
Installed Cost
Savings to Investment Ratio, SIR1
Simple Payback (Years)2
1 Other Electrical - Controls Retrofit: Electric Heat Trace WTP to Tanks
Electric heat tape should be shut off and used only for recovery, as the circulation pump should prevent freezing.
$3,696 $25 915.09 0.0
2 HVAC And DHW Replace hot water controls $1,856 $500 64.57 0.3 3 Cooking and Clothes
Drying - ClothesDryer Convert to Electric dryers, repair AHU #1, repair mens room exhaust fan, and repair heating zones in rest rooms.
$6,973 $4,000 23.66 0.6
4 Lighting - Controls Retrofit: Plumbiing Chase Lighting
Turn off lighting except when in use.
$126 $75 9.81 0.6
5 Air Tightening: All Doors including Garage Doors
Perform air sealing to reduce air leakage by 1500 cfm at 50 Pascals.
$1,435 $1,500 8.87 1.0
TOTAL, cost-effective measures
$14,085 $6,100 26.86 0.4
The following measures were not found to be cost-effective: 6 Window/Skylight:
Broken Windows Replace existing window with U-0.22 vinyl window
$69 $2,619 0.45 38.2
TOTAL, all measures $14,154 $8,719 18.93 0.6 Table Notes:

4
1 Savings to Investment Ratio (SIR) is a life‐cycle cost measure calculated by dividing the total savings over the life of a project (expressed in today’s dollars) by its investment costs. The SIR is an indication of the profitability of a measure; the higher the SIR, the more profitable the project. An SIR greater than 1.0 indicates a cost‐effective project (i.e. more savings than cost). Remember that this profitability is based on the position of that Energy Efficiency Measure (EEM) in the overall list and assumes that the measures above it are implemented first.
2 Simple Payback (SP) is a measure of the length of time required for the savings from an EEM to payback the investment cost, not counting interest on the investment and any future changes in energy prices. It is calculated by dividing the investment cost by the expected first‐year savings of the EEM.
With all of these energy efficiency measures in place, the annual utility cost can be reduced by $14,154 per year, or 15.8% of the buildings’ total energy costs. These measures are estimated to cost $8,719, for an overall simple payback period of 0.6 years. If only the cost‐effective measures are implemented, the annual utility cost can be reduced by $14,085 per year, or 15.7% of the buildings’ total energy costs. These measures are estimated to cost $6,100, for an overall simple payback period of 0.4 years. Table 1.2 below is a breakdown of the annual energy cost across various energy end use types, such as Space Heating and Water Heating. The first row in the table shows the breakdown for the building as it is now. The second row shows the expected breakdown of energy cost for the building assuming all of the retrofits in this report are implemented. Finally, the last row shows the annual energy savings that will be achieved from the retrofits.
Table 1.2 Annual Energy Cost Estimate
Description Space Heating
Space Cooling
Water Heating
Lighting Other
Electrical Circulation Loops and
Water Tank Clothes Drying
Ventilation Fans
Total Cost
Existing Building
$15,711 $0 $3,548 $2,139 $12,236 $47,200 $8,976 $0 $89,811
With All Proposed Retrofits
$13,034 $0 $2,974 $1,904 $8,541 $47,200 $2,004 $0 $75,657
SAVINGS $2,677 $0 $574 $235 $3,696 $0 $6,973 $0 $14,154
2.AUDITANDANALYSISBACKGROUND
2.1ProgramDescription This audit included services to identify, develop, and evaluate energy efficiency measures at the Water Treatment Plant ‐ Washeteria. The scope of this project included evaluating building shell, lighting and other electrical systems, and HVAC equipment, motors and pumps. Measures were analyzed based on life‐cycle‐cost techniques, which include the initial cost of the equipment, life of the equipment, annual energy cost, annual maintenance cost, and a discount rate of 3.0%/year in excess of general inflation.

5
2.2AuditDescription Preliminary audit information was gathered in preparation for the site survey. The site survey provides critical information in deciphering where energy is used and what opportunities exist within a building. The entire site was surveyed to inventory the following to gain an understanding of how each building operates:
• Building envelope (roof, windows, etc.) • Heating, ventilation, and air conditioning equipment (HVAC) • Lighting systems and controls • Building‐specific equipment
Water consumption, treatment (optional) & disposal
The building site visit was performed to survey all major building components and systems. The site visit included detailed inspection of energy consuming components. Summary of building occupancy schedules, operating and maintenance practices, and energy management programs provided by the building manager were collected along with the system and components to determine a more accurate impact on energy consumption. Details collected from Water Treatment Plant ‐ Washeteria enable a model of the building’s energy usage to be developed, highlighting the building’s total energy consumption, energy consumption by specific building component, and equivalent energy cost. The analysis involves distinguishing the different fuels used on site, and analyzing their consumption in different activity areas of the building. Water Treatment Plant ‐ Washeteria is classified as being made up of the following activity areas: 1) Water Treatment Plant: 1,200 square feet 2) Washeteria: 1,440 square feet 3) Garage: 2,024 square feet In addition, the methodology involves taking into account a wide range of factors specific to the building. These factors are used in the construction of the model of energy used. The factors include: • Occupancy hours • Local climate conditions • Prices paid for energy
2.3.MethodofAnalysisData collected was processed using AkWarm© Energy Use Software to estimate energy savings for each of the proposed energy efficiency measures (EEMs). The recommendations focus on the building envelope; HVAC; lighting, plug load, and other electrical improvements; and motor and pump systems that will reduce annual energy consumption.

6
EEMs are evaluated based on building use and processes, local climate conditions, building construction type, function, operational schedule, existing conditions, and foreseen future plans. Energy savings are calculated based on industry standard methods and engineering estimations. Our analysis provides a number of tools for assessing the cost effectiveness of various improvement options. These tools utilize Life‐Cycle Costing, which is defined in this context as a method of cost analysis that estimates the total cost of a project over the period of time that includes both the construction cost and ongoing maintenance and operating costs. Savings to Investment Ratio (SIR) = Savings divided by Investment Savings includes the total discounted dollar savings considered over the life of the improvement. When these savings are added up, changes in future fuel prices as projected by the Department of Energy are included. Future savings are discounted to the present to account for the time‐value of money (i.e. money’s ability to earn interest over time). The Investment in the SIR calculation includes the labor and materials required to install the measure. An SIR value of at least 1.0 indicates that the project is cost‐effective—total savings exceed the investment costs. Simple payback is a cost analysis method whereby the investment cost of a project is divided by the first year’s savings of the project to give the number of years required to recover the cost of the investment. This may be compared to the expected time before replacement of the system or component will be required. For example, if a boiler costs $12,000 and results in a savings of $1,000 in the first year, the payback time is 12 years. If the boiler has an expected life to replacement of 10 years, it would not be financially viable to make the investment since the payback period of 12 years is greater than the project life. The Simple Payback calculation does not consider likely increases in future annual savings due to energy price increases. As an offsetting simplification, simple payback does not consider the need to earn interest on the investment (i.e. it does not consider the time‐value of money). Because of these simplifications, the SIR figure is considered to be a better financial investment indicator than the Simple Payback measure. Measures are implemented in order of cost‐effectiveness. The program first calculates individual SIRs, and ranks all measures by SIR, higher SIRs at the top of the list. An individual measure must have an individual SIR>=1 to make the cut. Next the building is modified and re‐simulated with the highest ranked measure included. Now all remaining measures are re‐evaluated and ranked, and the next most cost‐effective measure is implemented. AkWarm goes through this iterative process until all appropriate measures have been evaluated and installed. It is important to note that the savings for each recommendation is calculated based on implementing the most cost effective measure first, and then cycling through the list to find the next most cost effective measure. Implementation of more than one EEM often affects the savings of other EEMs. The savings may in some cases be relatively higher if an individual EEM is implemented in lieu of multiple recommended EEMs. For example implementing a reduced

7
operating schedule for inefficient lighting will result in relatively high savings. Implementing a reduced operating schedule for newly installed efficient lighting will result in lower relative savings, because the efficient lighting system uses less energy during each hour of operation. If multiple EEM’s are recommended to be implemented, AkWarm calculates the combined savings appropriately. Cost savings are calculated based on estimated initial costs for each measure. Installation costs include labor and equipment to estimate the full up‐front investment required to implement a change. Costs are derived from Means Cost Data, industry publications, and local contractors and equipment suppliers.
2.4LimitationsofStudyAll results are dependent on the quality of input data provided, and can only act as an approximation. In some instances, several methods may achieve the identified savings. This report is not intended as a final design document. The design professional or other persons following the recommendations shall accept responsibility and liability for the results.
3.WaterTreatmentPlant‐Washeteria
3.1.BuildingDescription The 4,664 square foot Water Treatment Plant ‐ Washeteria was constructed in 1980, with a normal occupancy of 4 people. The water plant is open 8‐5 Monday through Friday, and 10 a.m. to noon on Saturday and Sunday. The washeteria is open 9‐5 one week a month.
(Description of Water Plant services to town, system type and such) Description of Building Shell The exterior walls are constructed with six inch structurally insulated panels with five inches of polyurethane insulation. The garage is 2x4 metal insulated walls with R‐15 fiberglass insulation. The roof of the building is a warm roof with 5.5 inches of polyurethane insulation. The floor of the building is built on grade with 4 inches of blue boardstock insulation. Typical windows throughout the building are double paned glass windows with vinyl frames. Doors are metal with urethane insulation. There is a sectional polyurethane insulation garage door. Description of Heating Plants The Heating Plants used in the building are:
8
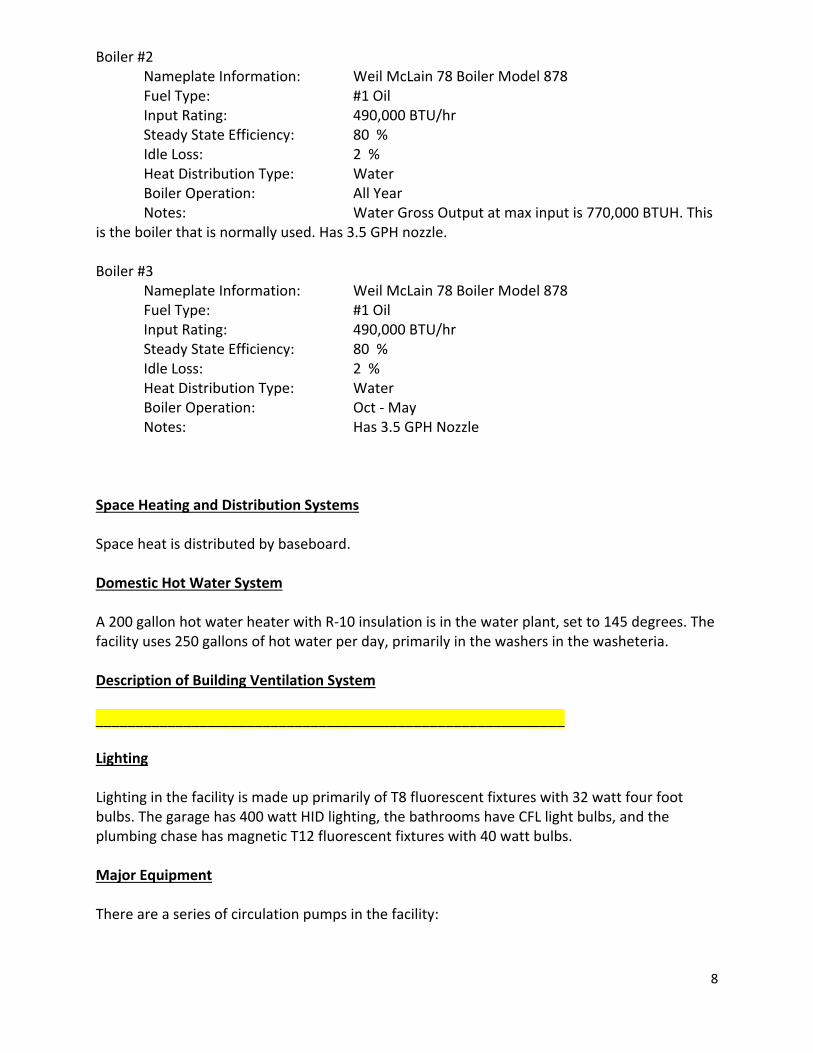
Boiler #2 Nameplate Information: Weil McLain 78 Boiler Model 878 Fuel Type: #1 Oil Input Rating: 490,000 BTU/hr Steady State Efficiency: 80 % Idle Loss: 2 % Heat Distribution Type: Water Boiler Operation: All Year Notes: Water Gross Output at max input is 770,000 BTUH. This is the boiler that is normally used. Has 3.5 GPH nozzle. Boiler #3 Nameplate Information: Weil McLain 78 Boiler Model 878 Fuel Type: #1 Oil Input Rating: 490,000 BTU/hr Steady State Efficiency: 80 % Idle Loss: 2 % Heat Distribution Type: Water Boiler Operation: Oct ‐ May Notes: Has 3.5 GPH Nozzle Space Heating and Distribution Systems Space heat is distributed by baseboard. Domestic Hot Water System A 200 gallon hot water heater with R‐10 insulation is in the water plant, set to 145 degrees. The facility uses 250 gallons of hot water per day, primarily in the washers in the washeteria. Description of Building Ventilation System ___________________________________________________________ Lighting Lighting in the facility is made up primarily of T8 fluorescent fixtures with 32 watt four foot bulbs. The garage has 400 watt HID lighting, the bathrooms have CFL light bulbs, and the plumbing chase has magnetic T12 fluorescent fixtures with 40 watt bulbs. Major Equipment There are a series of circulation pumps in the facility:

9
A 190 watt raw water circulation pump circulates water through the heat add heat exchanger throughout the winter. Loop A is a 1200 watt circulation pump that runs all winter long. Loop B is a 2800 watt circulation pump that runs all winter long. The school loop is a 200 watt circulation pump that runs all winter long. Four small circulation pumps circulate water to the water storage tanks and the watering point. There is a large backwash pump, several chemical feed and treatment pumps for the water treatment systems. A 4,800 watt pressure pump maintains pressure in the system. A large electric heat tape is on the line to the water storage tanks. There are two clothes washers, which pull about 400 watts each. CP1A and CP1B are a pair of Grundfos UPS 75‐69F Model C circulation pumps which circulate glycol around the facility.
3.2PredictedEnergyUse
3.2.1EnergyUsage/Tariffs
The electric usage profile charts (below) represents the predicted electrical usage for the building. If actual electricity usage records were available, the model used to predict usage was calibrated to approximately match actual usage. The electric utility measures consumption in kilowatt‐hours (kWh) and maximum demand in kilowatts (kW). One kWh usage is equivalent to 1,000 watts running for one hour. The fuel oil usage profile shows the fuel oil usage for the building. Fuel oil consumption is measured in gallons. One gallon of #1 Fuel Oil provides approximately 132,000 BTUs of energy. The following is a list of the utility companies providing energy to the building and the class of service provided: Electricity: AVEC‐Gambell ‐ Commercial ‐ Sm The average cost for each type of fuel used in this building is shown below in Table 3.1. This figure includes all surcharges, subsidies, and utility customer charges:
Table 3.1 – Average Energy Cost Description Average Energy Cost
Electricity $ 0.15/kWh

10
#1 Oil $ 3.78/gallons
3.2.1.1 Total Energy Use and Cost Breakdown
At current rates, City of Gambell pays approximately $89,811 annually for electricity and other fuel costs for the Water Treatment Plant ‐ Washeteria. Figure 3.1 below reflects the estimated distribution of costs across the primary end uses of energy based on the AkWarm© computer simulation. Comparing the “Retrofit” bar in the figure to the “Existing” bar shows the potential savings from implementing all of the energy efficiency measures shown in this report.
Figure 3.1 Annual Energy Costs by End Use
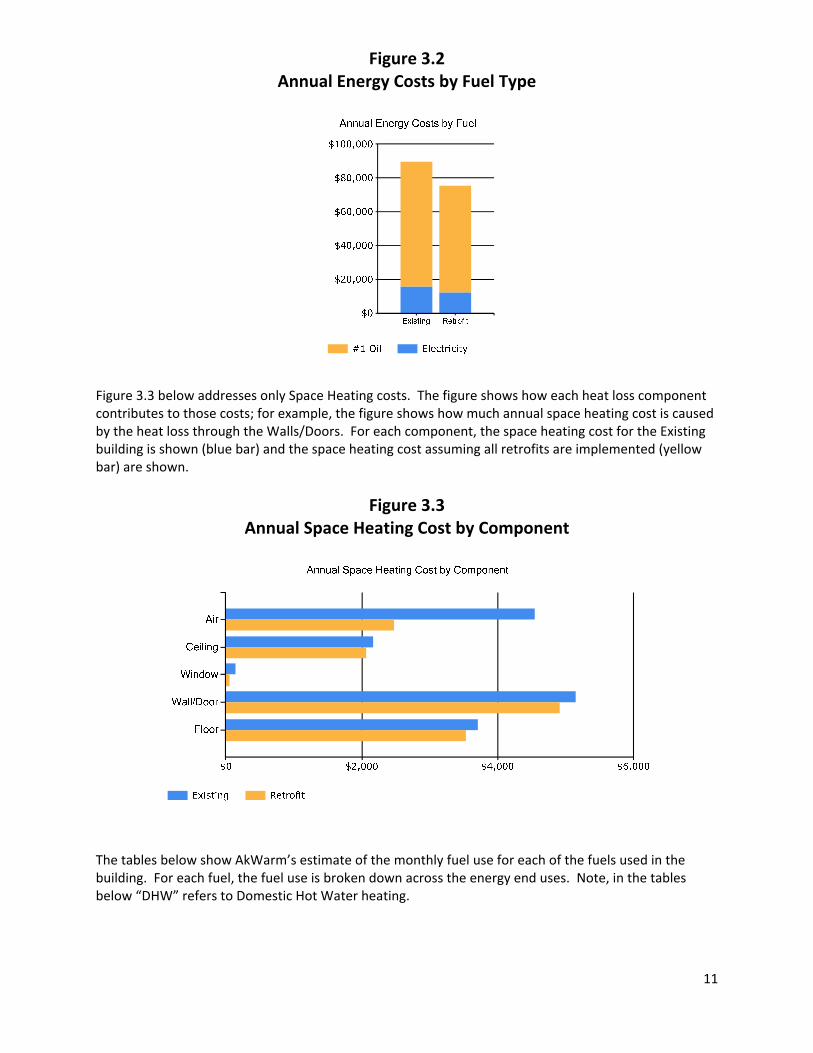
Figure 3.2 below shows how the annual energy cost of the building splits between the different fuels used by the building. The “Existing” bar shows the breakdown for the building as it is now; the “Retrofit” bar shows the predicted costs if all of the energy efficiency measures in this report are implemented.
$0
$20,000
$40,000
$60,000
$80,000
$100,000
Existing Retrofit
Space HeatingOther ElectricalLightingDomestic Hot WaterCookingClothes Drying
Annual Energy Costs by End Use
Space HeatingOther Electrical Lighting Domestic Hot Water Circulation Lines and Water Storage Tanks Clothes Drying
11
Figure 3.2 Annual Energy Costs by Fuel Type
Figure 3.3 below addresses only Space Heating costs. The figure shows how each heat loss component contributes to those costs; for example, the figure shows how much annual space heating cost is caused by the heat loss through the Walls/Doors. For each component, the space heating cost for the Existing building is shown (blue bar) and the space heating cost assuming all retrofits are implemented (yellow bar) are shown.
Figure 3.3 Annual Space Heating Cost by Component
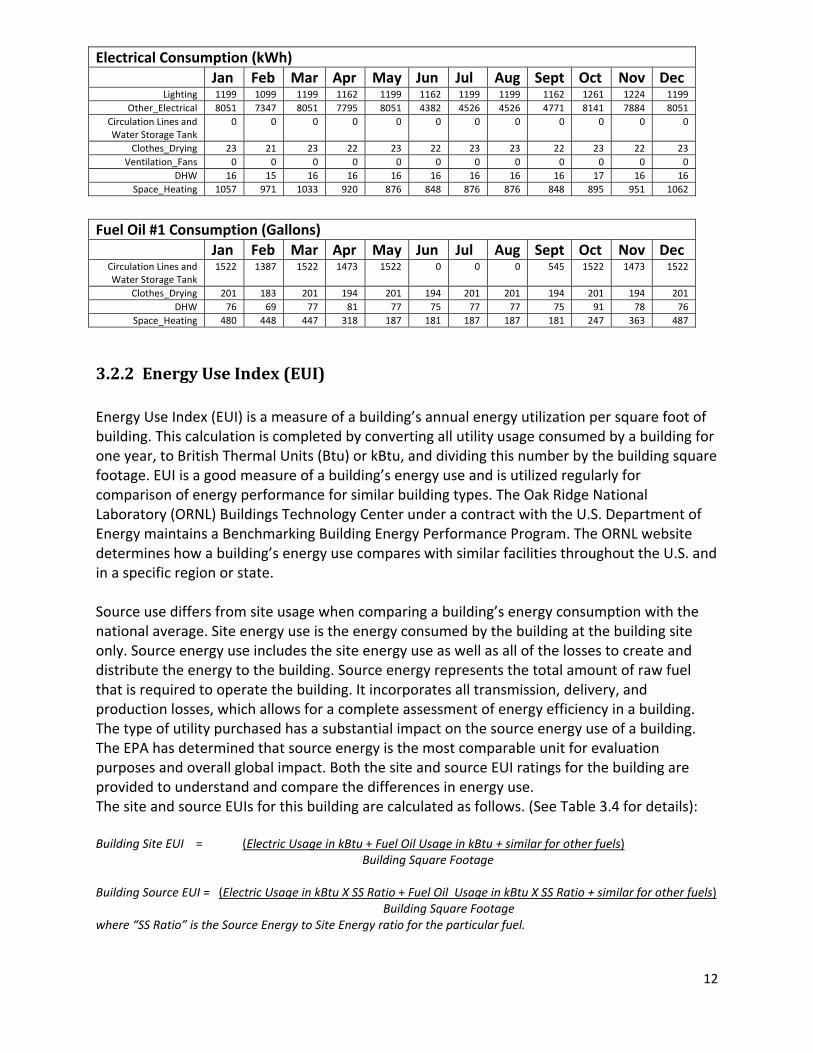
The tables below show AkWarm’s estimate of the monthly fuel use for each of the fuels used in the building. For each fuel, the fuel use is broken down across the energy end uses. Note, in the tables below “DHW” refers to Domestic Hot Water heating.
12
Electrical Consumption (kWh)
Jan Feb Mar Apr May Jun Jul Aug Sept Oct Nov Dec Lighting 1199 1099 1199 1162 1199 1162 1199 1199 1162 1261 1224 1199
Other_Electrical 8051 7347 8051 7795 8051 4382 4526 4526 4771 8141 7884 8051
Circulation Lines and Water Storage Tank
0 0 0 0 0 0 0 0 0 0 0 0
Clothes_Drying 23 21 23 22 23 22 23 23 22 23 22 23
Ventilation_Fans 0 0 0 0 0 0 0 0 0 0 0 0
DHW 16 15 16 16 16 16 16 16 16 17 16 16
Space_Heating 1057 971 1033 920 876 848 876 876 848 895 951 1062
Fuel Oil #1 Consumption (Gallons)
Jan Feb Mar Apr May Jun Jul Aug Sept Oct Nov Dec Circulation Lines and Water Storage Tank
1522 1387 1522 1473 1522 0 0 0 545 1522 1473 1522
Clothes_Drying 201 183 201 194 201 194 201 201 194 201 194 201
DHW 76 69 77 81 77 75 77 77 75 91 78 76
Space_Heating 480 448 447 318 187 181 187 187 181 247 363 487
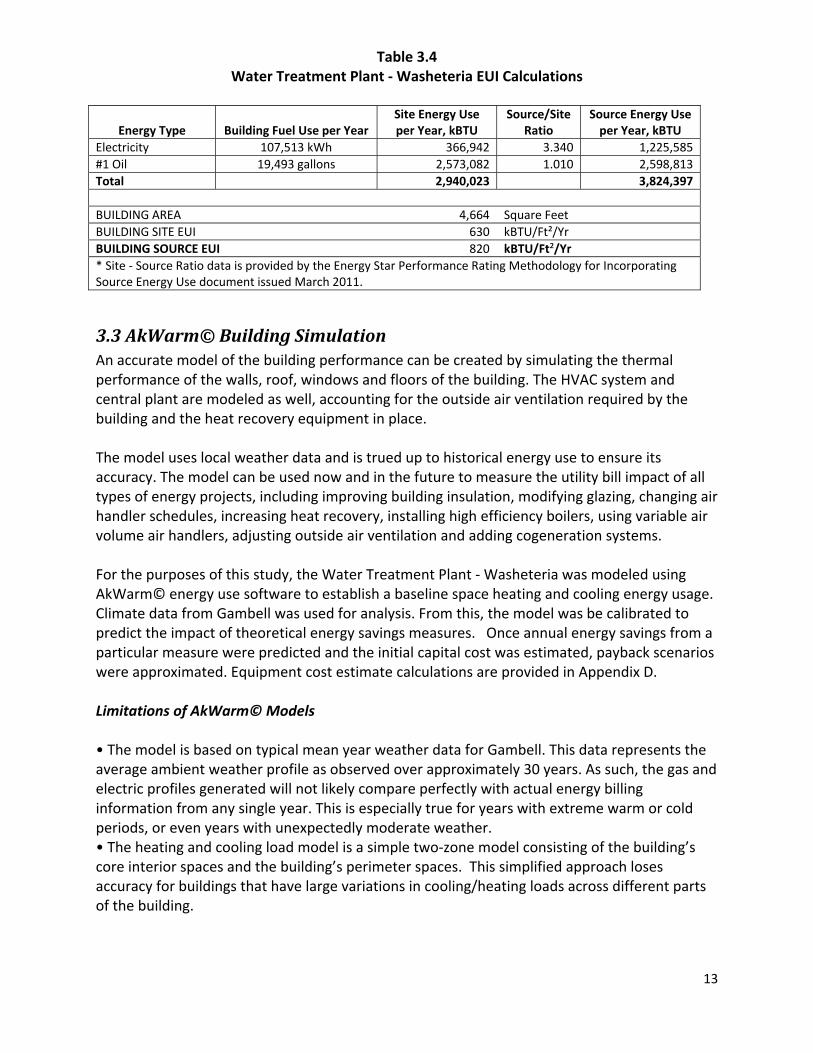
3.2.2EnergyUseIndex(EUI) Energy Use Index (EUI) is a measure of a building’s annual energy utilization per square foot of building. This calculation is completed by converting all utility usage consumed by a building for one year, to British Thermal Units (Btu) or kBtu, and dividing this number by the building square footage. EUI is a good measure of a building’s energy use and is utilized regularly for comparison of energy performance for similar building types. The Oak Ridge National Laboratory (ORNL) Buildings Technology Center under a contract with the U.S. Department of Energy maintains a Benchmarking Building Energy Performance Program. The ORNL website determines how a building’s energy use compares with similar facilities throughout the U.S. and in a specific region or state. Source use differs from site usage when comparing a building’s energy consumption with the national average. Site energy use is the energy consumed by the building at the building site only. Source energy use includes the site energy use as well as all of the losses to create and distribute the energy to the building. Source energy represents the total amount of raw fuel that is required to operate the building. It incorporates all transmission, delivery, and production losses, which allows for a complete assessment of energy efficiency in a building. The type of utility purchased has a substantial impact on the source energy use of a building. The EPA has determined that source energy is the most comparable unit for evaluation purposes and overall global impact. Both the site and source EUI ratings for the building are provided to understand and compare the differences in energy use. The site and source EUIs for this building are calculated as follows. (See Table 3.4 for details): Building Site EUI = (Electric Usage in kBtu + Fuel Oil Usage in kBtu + similar for other fuels) Building Square Footage Building Source EUI = (Electric Usage in kBtu X SS Ratio + Fuel Oil Usage in kBtu X SS Ratio + similar for other fuels) Building Square Footage where “SS Ratio” is the Source Energy to Site Energy ratio for the particular fuel.
13
Table 3.4 Water Treatment Plant ‐ Washeteria EUI Calculations
Energy Type Building Fuel Use per Year Site Energy Use per Year, kBTU
Source/Site Ratio
Source Energy Use per Year, kBTU
Electricity 107,513 kWh 366,942 3.340 1,225,585
#1 Oil 19,493 gallons 2,573,082 1.010 2,598,813
Total 2,940,023 3,824,397
BUILDING AREA 4,664 Square Feet
BUILDING SITE EUI 630 kBTU/Ft²/Yr
BUILDING SOURCE EUI 820 kBTU/Ft²/Yr
* Site ‐ Source Ratio data is provided by the Energy Star Performance Rating Methodology for IncorporatingSource Energy Use document issued March 2011.
3.3AkWarm©BuildingSimulationAn accurate model of the building performance can be created by simulating the thermal performance of the walls, roof, windows and floors of the building. The HVAC system and central plant are modeled as well, accounting for the outside air ventilation required by the building and the heat recovery equipment in place. The model uses local weather data and is trued up to historical energy use to ensure its accuracy. The model can be used now and in the future to measure the utility bill impact of all types of energy projects, including improving building insulation, modifying glazing, changing air handler schedules, increasing heat recovery, installing high efficiency boilers, using variable air volume air handlers, adjusting outside air ventilation and adding cogeneration systems. For the purposes of this study, the Water Treatment Plant ‐ Washeteria was modeled using AkWarm© energy use software to establish a baseline space heating and cooling energy usage. Climate data from Gambell was used for analysis. From this, the model was be calibrated to predict the impact of theoretical energy savings measures. Once annual energy savings from a particular measure were predicted and the initial capital cost was estimated, payback scenarios were approximated. Equipment cost estimate calculations are provided in Appendix D. Limitations of AkWarm© Models • The model is based on typical mean year weather data for Gambell. This data represents the average ambient weather profile as observed over approximately 30 years. As such, the gas and electric profiles generated will not likely compare perfectly with actual energy billing information from any single year. This is especially true for years with extreme warm or cold periods, or even years with unexpectedly moderate weather. • The heating and cooling load model is a simple two‐zone model consisting of the building’s core interior spaces and the building’s perimeter spaces. This simplified approach loses accuracy for buildings that have large variations in cooling/heating loads across different parts of the building.

14
• The model does not model HVAC systems that simultaneously provide both heating and cooling to the same building space (typically done as a means of providing temperature control in the space). The energy balances shown in Section 3.1 were derived from the output generated by the AkWarm© simulations.
4.ENERGYCOSTSAVINGMEASURES
4.1SummaryofResultsThe energy saving measures are summarized in Table 4.1. Please refer to the individual measure descriptions later in this report for more detail. Calculations and cost estimates for analyzed measures are provided in Appendix C.
Table 4.1Water Treatment Plant ‐ Washeteria, Gambell, Alaska
PRIORITY LIST – ENERGY EFFICIENCY MEASURES Rank
Feature
Improvement Description
Annual Energy Savings
Installed Cost
Savings to Investment Ratio, SIR
Simple Payback (Years)
1 Other Electrical - Controls Retrofit: Electric Heat Trace WTP to Tanks
Electric heat tape should be shut off and used only for recovery, as the circulation pump should prevent freezing.
$3,696 $25 915.09 0.0
2 HVAC And DHW Replace hot water controls $1,856 $500 64.57 0.3 3 Cooking and Clothes
Drying - ClothesDryer Convert to Electric dryers, repair AHU #1, repair mens room exhaust fan, and repair heating zones in rest rooms.
$6,973 $4,000 23.66 0.6
4 Lighting - Controls Retrofit: Plumbiing Chase Lighting
Turn off lighting except when in use.
$126 $75 9.81 0.6
5 Air Tightening: All Doors including Garage Doors
Perform air sealing to reduce air leakage by 1500 cfm at 50 Pascals.
$1,435 $1,500 8.87 1.0
TOTAL, cost-effective measures
$14,085 $6,100 26.86 0.4
The following measures were not found to be cost-effective: 6 Window/Skylight:
Broken Windows Replace existing window with U-0.22 vinyl window
$69 $2,619 0.45 38.2
TOTAL, all measures $14,154 $8,719 18.93 0.6
4.2InteractiveEffectsofProjectsThe savings for a particular measure are calculated assuming all recommended EEMs coming before that measure in the list are implemented. If some EEMs are not implemented, savings for the remaining EEMs will be affected. For example, if ceiling insulation is not added, then savings from a project to

15
replace the heating system will be increased, because the heating system for the building supplies a larger load. In general, all projects are evaluated sequentially so energy savings associated with one EEM would not also be attributed to another EEM. By modeling the recommended project sequentially, the analysis accounts for interactive affects among the EEMs and does not “double count” savings. Interior lighting, plug loads, facility equipment, and occupants generate heat within the building. When the building is in cooling mode, these items contribute to the overall cooling demands of the building; therefore, lighting efficiency improvements will reduce cooling requirements in air‐conditioned buildings. Conversely, lighting‐efficiency improvements are anticipated to slightly increase heating requirements. Heating penalties and cooling benefits were included in the lighting project analysis.
4.3BuildingShellMeasures4.3.2WindowMeasures
4.3.2AirSealingMeasures
4.4MechanicalEquipmentMeasures
4.4.1Heating/Cooling/DomesticHotWaterMeasure
Rank Location Size/Type, Condition Recommendation
6 Window/Skylight: Broken Windows
Glass: Double, glass Frame: Wood\Vinyl Spacing Between Layers: Half Inch Gas Fill Type: Air Modeled U‐Value: 0.51 Solar Heat Gain Coefficient including Window Coverings: 0.46
Replace existing window with U‐0.22 vinyl window
Installation Cost $2,619 Estimated Life of Measure (yrs) 20 Energy Savings (/yr) $69
Breakeven Cost $1,188 Savings‐to‐Investment Ratio 0.5 Simple Payback yrs 38
Auditors Notes: Though this does not payback within the life expectancy of the new windows, we evaluated the replacement costs of the new window at the request of the staff.
Rank Location Existing Air Leakage Level (cfm@50/75 Pa) Recommended Air Leakage Reduction (cfm@50/75 Pa)
5 All Doors including Garage Doors
Air Tightness estimated as: 3500 cfm at 50 Pascals Perform air sealing to reduce air leakage by 1500 cfm at 50 Pascals.
Installation Cost $1,500 Estimated Life of Measure (yrs) 10 Energy Savings (/yr) $1,435
Breakeven Cost $13,306 Savings‐to‐Investment Ratio 8.9 Simple Payback yrs 1
Auditors Notes: Weather strip especially at bottom of doors, primarily the garage door.

16
4.5Electrical&ApplianceMeasures4.5.1LightingMeasures The goal of this section is to present any lighting energy conservation measures that may also be cost beneficial. It should be noted that replacing current bulbs with more energy‐efficient equivalents will have a small effect on the building heating and cooling loads. The building cooling load will see a small decrease from an upgrade to more efficient bulbs and the heating load will see a small increase, as the more energy efficient bulbs give off less heat.
4.5.1aLightingMeasures–LightingControls
4.5.2OtherElectricalMeasures
4.5.3ClothesDryingMeasures
Rank Recommendation
2 Replace hot water controls
Installation Cost $500 Estimated Life of Measure (yrs) 20 Energy Savings (/yr) $1,856
Breakeven Cost $32,283 Savings‐to‐Investment Ratio 64.6 Simple Payback yrs 0
Auditors Notes: The entire hydronic heat distribution system is combined at present and is hot whenever pumps CP1A or B are operating. The system should be separated so all of the washeteria except the baseboard is separate. The controls for the hot water should specifically be replaced and the hot water temperature turned down to 120 degrees.
Rank Location Existing Condition Recommendation
4 Plumbiing Chase Lighting 3 FLUOR (2) T12 4' F40T12 34W Energy‐Saver StdElectronic with Manual Switching
Improve Manual Switching
Installation Cost $75 Estimated Life of Measure (yrs) 7 Energy Savings (/yr) $126
Breakeven Cost $736 Savings‐to‐Investment Ratio 9.8 Simple Payback yrs 1
Auditors Notes: Add a separate switch for these three lights just inside the plumbing chase door.
Rank Location Description of Existing Efficiency Recommendation
1 Electric Heat Trace WTP to Tanks
Electric Heat Tape with Manual Switching Improve Manual Switching
Installation Cost $25 Estimated Life of Measure (yrs) 7 Energy Savings (/yr) $3,696
Breakeven Cost $22,877 Savings‐to‐Investment Ratio 915.1 Simple Payback yrs 0
Auditors Notes: Shut off electric heat tape except when tank circulation pumps are shut down during winter months. This can be accomplished with a sign.

17
5.ENERGYEFFICIENCYACTIONPLAN
Through inspection of the energy‐using equipment on‐site and discussions with site facilities personnel, this energy audit has identified several energy‐saving measures. The measures will reduce the amount of fuel burned and electricity used at the site. The projects will not degrade the performance of the building and, in some cases, will improve it. Several types of EEMs can be implemented immediately by building staff, and others will require various amounts of lead time for engineering and equipment acquisition. In some cases, there are logical advantages to implementing EEMs concurrently. For example, if the same electrical contractor is used to install both lighting equipment and motors, implementation of these measures should be scheduled to occur simultaneously.
AppendixA–ListingofEnergyConservationandRenewableEnergyWebsites Lighting Illumination Engineering Society ‐ http://www.iesna.org/ Energy Star Compact Fluorescent Lighting Program ‐ www.energystar.gov/index.cfm?c=cfls.pr_cfls DOE Solid State Lighting Program ‐ http://www1.eere.energy.gov/buildings/ssl/ DOE office of Energy Efficiency and Renewable Energy ‐ http://apps1.eere.energy.gov/consumer/your_workplace/ Energy Star – http://www.energystar.gov/index.cfm?c=lighting.pr_lighting Hot Water Heaters Heat Pump Water Heaters ‐ http://apps1.eere.energy.gov/consumer/your_home/water_heating/index.cfm/mytopic=12840 Solar Water Heating FEMP Federal Technology Alerts – http://www.eere.energy.gov/femp/pdfs/FTA_solwat_heat.pdf Solar Radiation Data Manual – http://rredc.nrel.gov/solar/pubs/redbook Plug Loads DOE office of Energy Efficiency and Renewable Energy – http:apps1.eere.energy.gov/consumer/your_workplace/
Rank Location Description of Existing Efficiency Recommendation
3 Convert to Electric dryers, repair AHU #1, repair mens room exhaust fan, and repair heating zones in rest rooms.
Installation Cost $4,000 Estimated Life of Measure (yrs) 15 Energy Savings (/yr) $6,973
Breakeven Cost $94,645 Savings‐to‐Investment Ratio 23.7 Simple Payback yrs 1
Auditors Notes:

18
Energy Star – http://www.energystar.gov/index.cfm?fuseaction=find_a_product The Greenest Desktop Computers of 2008 ‐ http://www.metaefficient.com/computers/the‐greenest‐pcs‐of‐2008.html Wind AWEA Web Site – http://www.awea.org National Wind Coordinating Collaborative – http:www.nationalwind.org Utility Wind Interest Group site: http://www.uwig.org WPA Web Site – http://www.windpoweringamerica.gov Homepower Web Site: http://homepower.com Windustry Project: http://www.windustry.com Solar NREL – http://www.nrel.gov/rredc/ Firstlook – http://firstlook.3tiergroup.com TMY or Weather Data – http://rredc.nrel.gov/solar/old_data/nsrdb/1991‐2005/tmy3/ State and Utility Incentives and Utility Policies ‐ http://www.dsireusa.org
AppendixB–DirectVentOilHeaterProgramming Using the temperature setbacks built into most direct vent oil heaters, such as Toyotomi Lasers and Monitor MPIs is a simple, cost effective way to save energy. We recommend setback temperatures of 60 degrees for nights and weekends in offices and other frequently occupied facilities. In buildings that are occupied intermittently, such as Bingo Halls, we recommend a setback of 50 or 55 degrees. Facilities that are never occupied, such as lift stations and well houses, should be setback to 40 degrees, to prevent freezeups. Check the following websites for tips on programming the built in temperature setback capabilities of your specific direct vent oil heater. http://www.toyotomiusa.com/ownersManuals_ventedHeaters.php http://www.monitorproducts.com/customer‐support/manuals