Embed Size (px)
Citation preview

Composition of Trade Australia 2016-17


Statistics Section Office of Economic Analysis
Investment and Economic Division
January 2018
COMPOSITION OF TRADE AUSTRALIA 2016-17

i
ISSN 1320-7547 (Print) ISSN 2200-6095 (Online)
ISBN 978-1-74322-425-0 (Book – softcover) ISBN 978-1-74322-424-3 (PDF format)
With the exception of the Commonwealth Coat of Arms and where otherwise noted, this report is licenced under a Creative Commons Attribution 3.0 Australia licence http://creativecommons.org/licenses/by/3.0/au/.
You are free to reuse, modify, remix and distribute this material. The entire publication may be included as an appendix in your work for reference if you wish. Under the terms of the licence, you are required to attribute DFAT material in the manner specified (but not in any way that suggests that DFAT endorses you or your use of the work).
DFAT material used ‘as supplied’
Provided you have not modified/remixed the material in this publication in any way it may be reused provided the following attribution is given:
Source: DFAT publication ‘Composition of Trade Australia 2016-17’.
Derivative material
If you have modified/remixed the material in this publication, or derived new material from it in any way, the following attribution must be used:
Based on the DFAT publication ‘Composition of Trade Australia 2016-17’.
Use of the Coat of Arms
The terms under which the Coat of Arms can be used are detailed on the It’s an Honour website http://www.itsanhonour.gov.au/coat-arms/index.cfm.
The Department of Foreign Affairs and Trade (DFAT) has taken great care to ensure the information contained in this publication is as correct and accurate as possible.
However, DFAT does not guarantee, and accepts no legal liability whatsoever arising from or connected to, the accuracy, reliability, currency or completeness of any material contained in the publication.
DFAT recommends that users exercise their own skill and care with respect to their use of the material contained in the publication and that users carefully evaluate the accuracy, currency, completeness and relevance of the material for their purposes.
Unless otherwise specified, all amounts are in Australian dollars.

ii
UP-TO-DATE TRADE STATISTICS SERVICES TAILORED TO YOUR NEEDS FROM AUSTRALIA’S PREMIER SOURCE
In so many industries, knowledge is the key to success. And it’s the quality of that information that’s paramount.
Now you can access Australian trade statistics gathered and held by Australia’s leading expert in the field, the Department of Foreign Affairs and Trade (DFAT). Better still, this information can be customised and prepared to suit your specific needs.
The Statistics Section (STA) provides statistics used in research, including measures such as detailed classifications of exports and imports. STA’s data holdings include a substantial amount of economic and social information about Australia and the rest of the world.
Trade data is available in any of the following combinations:
Trade time series
DFAT has created a range of time series products to complement its statistical trade publications. These products include:
i) Trade statistical pivot tables:
• Australia's exports and imports by all countries, all State and Territories and selected country groups by the Standard International Trade Classification (SITC) at the 3-digit level; and
• Australia's exports and imports by all countries, all State and Territories and selected country groups by DFAT's Trade Import and Export Classification (TRIEC) at the 1-, 2-, 3- and 4-digit levels.
These two pivot tables are published on a calendar and financial year basis. ii) Australia’s direction of goods and services trade:
Time series spreadsheets covering Australia’s trade in goods and services (exports, imports & two-way trade). Data on goods, services and goods and services is published for all Australia’s trading partners, as well as data by broad geographic groups and selected country groups.
The spreadsheets are published on a calendar year basis (back to 1987) and a financial year basis (back to 1986-87).
iii) Historical trade and economic data:
The first spreadsheet, Australia’s trade and economic indicators, contains time series data for a range of trade and economic indicators back to 1901 (and for total merchandise trade back to 1826). The second time series spreadsheet, Australia’s direction of trade, contains time series data for around 60 of Australia’s major merchandise trading partners back to 1901 (and in some cases to 1885).
A WORLD OF TRADE DATA AT YOUR
FINGERTIPS

iii
Market information service STA provides accurate and timely, high-level statistical support for research and analysis. The consultancy service also draws on international sources to compile the most comprehensive coverage available, so you can have a world of trade information individually prepared to your requirements and delivered quickly, accurately and at a very competitive price. ● Reports can be “tailor-made” according to requirements – by country and by commodity – monthly, quarterly and for calendar or financial years. ● STA prepares general profiles of economic and social indicators for Australia’s trading partners – country economic factsheets (190 countries currently available).
For more information about our services email [email protected] or visit the website http://dfat.gov.au/trade/resources/trade-statistics/Pages/trade-statistics.aspx; or visit http://dfat.gov.au/trade/resources/Pages/trade-and-economic-fact-sheets-for-countries-and-regions.aspx for the fact sheets.
Interactive website Explore Australia’s Trade at a Glance interactive website which complements the annual Trade at a Glance publication, allowing users to investigate Australia’s trade profile. It brings together information from a range of DFAT publications in the one location for the first time. It includes data on Australia’s top trading partners, Australia’s trade by state and territory, Australia’s trade with APEC, the G20 and ASEAN.
Trade statistical publications Each year STA produces a range of publications containing detailed information on all aspects of Australia’s trade in goods and services and investment with the rest of the world. These are available as accessible PDFs at http://dfat.gov.au/trade/resources/Pages/trade-statistical-publications.aspx.
Releases in the series include:
• Composition of Trade Australia – biannual on a calendar and financial year basis; • Trade in Services Australia – biannual on a calendar and financial year basis; • Australia’s trade by State and Territory – annual on a financial year basis; • International Investment Australia – annual on a calendar year basis.

Page 1
CONTENTS
INTRODUCTION 4
AUSTRALIA’S TRADE: KEY POINTS, 2016-17 5
Australia’s trade in goods and services ............................................................................................................ 5 Australia’s direction of trade ............................................................................................................................ 5 Australia’s composition of trade ...................................................................................................................... 5
AUSTRALIA’S MERCHANDISE TRADE BY LEVEL OF PROCESSING 6
Exports ............................................................................................................................................................... 6 Imports .............................................................................................................................................................. 6
COMMODITY FORECASTS 7
AUSTRALIA’S TRADE IN SERVICES WITH CHINA 8
Long term trends in trade in services with China ............................................................................................ 8 Major services sectors ...................................................................................................................................... 9 Travel services .............................................................................................................................................. 9 Education-related travel services exports ............................................................................................ 10 Business and Other personal travel services exports .......................................................................... 11 Travel services imports .......................................................................................................................... 12 Transport services ...................................................................................................................................... 12 Box A: Passenger services exports and imports ............................................................................................ 13 Business services ........................................................................................................................................ 14 Financial and Insurance services ........................................................................................................... 15 Telecommunication, computer & information services ...................................................................... 15 Professional services ............................................................................................................................. 16 Technical & other business services ..................................................................................................... 16 Personal, cultural & recreation services ................................................................................................... 16 Box B: Services provided by Australia’s foreign affiliates located in China .................................................. 17 Conclusion ....................................................................................................................................................... 18 Attachment A: Australia’s services exports to China by type of activity ...................................................... 19 Attachment B: Australia’s services imports from China by type of activity ................................................. 22
LOW VALUE THRESHOLD GOODS 25

Page 2
AUSTRALIA’S TRADE ON A BALANCE OF PAYMENTS BASIS 27
Section 1 - Australia's trade in goods and services Table 1: Australia’s trade in goods and services, balance of payments basis ............................................. 28 Table 2: Australia’s trade in goods and services, current price ................................................................... 29 Table 3: Australia’s trade in goods and services, chain volume measures ................................................. 30 Table 4: Australia’s top 25 goods and services exports ............................................................................... 31 Table 5: Australia’s top 25 goods and services imports ............................................................................... 32 Table 6: Australia’s exports of goods and services by State and Territory, balance of payments basis ... 33 Table 7: Australia’s imports of goods and services by State and Territory, balance of payments basis ... 34
Section 2 - Direction of Australia’s trade in goods and services Table 8: Australia’s rank in world goods and services exports and imports ................................................ 36 Table 9: Australia’s trade in goods and services by top 15 partners ............................................................ 37 Table 10: Australia’s total trade in goods and services by selected countries and regions ........................ 39 Table 11: Australia’s exports of goods and services by selected countries and regions ............................. 40 Table 12: Australia’s imports of goods and services by selected countries and regions ............................ 41
Section 3 - Australia’s trade in services Table 13: Australia’s exports of services, by type of activity ........................................................................ 44 Graphs: Australia’s exports and imports of services ..................................................................... 45 Table 14: Australia’s imports of services, by type of activity ........................................................................ 46 Table 15: Australia’s trade in services by top 15 partners ............................................................................ 47 Table 16: Australia’s total trade in services by selected countries and regions .......................................... 49 Table 17: Australia’s exports of services by selected countries and regions ............................................... 50 Table 18: Australia’s imports of services by selected countries and regions .............................................. 51
AUSTRALIA’S MERCHANDISE TRADE ON A RECORDED TRADE BASIS 53
Section 4 - Australia’s merchandise trade by level of processing Table 19: Australia's merchandise trade by broad category, total exports and imports ............................ 55 Table 20: Australia's merchandise exports by broad category, Australian produced exports ................... 56 Table 21: Australia's total merchandise exports by broad level of processing............................................ 57 Table 22: Australia's total merchandise imports by broad level of processing ........................................... 58 Table 23: Australian produced exports by broad level of processing .......................................................... 59 Table 24: Australia's total merchandise exports by level of processing ...................................................... 60 Table 25: Australia's total merchandise imports by level of processing ...................................................... 62 Table 26: Australian produced exports by level of processing ..................................................................... 64
Section 5 - Australia’s merchandise commodity ranking Table 27: Australia's major merchandise exports – rank, value and growth ............................................... 68 Table 28: Australia's major merchandise imports – rank, value and growth .............................................. 70
Section 6 - Direction of Australia’s merchandise trade ranking tables Table 29: Australia's merchandise trade by country, 2016-17 ..................................................................... 74 Table 30: Australia's merchandise export markets ....................................................................................... 79 Table 31: Australia's merchandise import sources ....................................................................................... 84 Table 32: Australia's merchandise trade by country and regional groups................................................... 89 Table 33: Australia's merchandise exports by country and regional groups ............................................... 90 Table 34: Australia's merchandise imports by country and regional groups ............................................... 91

Page 3
Section 7 - Australia's major merchandise trading partners, top 20 exports and imports Country tables
Table 35: Australia's merchandise trade with Belgium ................................................................................. 94 Table 36: Australia's merchandise trade with Canada .................................................................................. 95 Table 37: Australia's merchandise trade with China ..................................................................................... 96 Table 38: Australia's merchandise trade with France ................................................................................... 97 Table 39: Australia's merchandise trade with Germany ............................................................................... 98 Table 40: Australia's merchandise trade with Hong Kong (SAR of China).................................................... 99 Table 41: Australia's merchandise trade with India .................................................................................... 100 Table 42: Australia's merchandise trade with Indonesia ............................................................................ 101 Table 43: Australia's merchandise trade with Italy ..................................................................................... 102 Table 44: Australia's merchandise trade with Japan ................................................................................... 103 Table 45: Australia's merchandise trade with Malaysia .............................................................................. 104 Table 46: Australia's merchandise trade with Mexico ................................................................................ 105 Table 47: Australia's merchandise trade with Netherlands ........................................................................ 106 Table 48: Australia's merchandise trade with New Zealand....................................................................... 107 Table 49: Australia's merchandise trade with Papua New Guinea............................................................. 108 Table 50: Australia's merchandise trade with the Philippines .................................................................... 109 Table 51: Australia's merchandise trade with the Republic of Korea ........................................................ 110 Table 52: Australia's merchandise trade with Singapore ............................................................................ 111 Table 53: Australia's merchandise trade with Switzerland ......................................................................... 112 Table 54: Australia's merchandise trade with Taiwan ................................................................................ 113 Table 55: Australia's merchandise trade with Thailand .............................................................................. 114 Table 56: Australia's merchandise trade with the United Arab Emirates .................................................. 115 Table 57: Australia's merchandise trade with the United Kingdom ........................................................... 116 Table 58: Australia's merchandise trade with the United States ............................................................... 117 Table 59: Australia's merchandise trade with Vietnam .............................................................................. 118
Country group tables Table 60: Australia's merchandise trade with Africa ................................................................................... 119 Table 61: Australia's merchandise trade with Americas ............................................................................. 120 Table 62: Australia's merchandise trade with APEC.................................................................................... 121 Table 63: Australia's merchandise trade with ASEAN ................................................................................. 122 Table 64: Australia's merchandise trade with Asia ..................................................................................... 123 Table 65: Australia's merchandise trade with Europe ................................................................................ 124 Table 66: Australia's merchandise trade with the European Union ........................................................... 125 Table 67: Australia's merchandise trade with Oceania & Antarctica ......................................................... 126 Table 68: Australia's merchandise trade with the OECD ............................................................................ 127 Table 69: Australia's merchandise trade with All countries........................................................................ 128
TECHNICAL APPENDICES 129 Appendix A – Explanatory notes .................................................................................................................. 130 Appendix B – Composition of regions & country groups ............................................................................ 140 Appendix C – Abbreviations and symbols used in all DFAT trade statistical publications ........................ 144 Appendix D – Confidential exports in the SITC 988 ..................................................................................... 147 Appendix E – ABS trade commodities classified to TRIEC 3041 – confidential trade ................................ 149 Appendix F – Goods and services rankings .................................................................................................. 151 Appendix G – DFAT adjustments to ABS official trade data ....................................................................... 153 Appendix H – TRIEC classification................................................................................................................. 172

Page 4
INTRODUCTION
Composition of Trade, Australia concentrates on the major trends in Australia’s trade statistics, looking at trends in goods and services (on a balance of payments basis) and merchandise trade (on a recorded trade basis), including trade data by DFAT’s own trade classification - Trade Import Export Classification (TRIEC) and the United Nations’ Standard International Trade Classification (SITC).
The publication is divided into two major segments:
Australia’s trade on a balance of payments basis
Section 1 provides summary data on Australia’s goods and services showing current price values, chain volume measures, movements in export and import prices and the terms of trade.
Section 2 shows the direction of Australia’s trade in goods and services to selected countries and regions, including Australia’s rank in world goods and services exports and imports.
Section 3 presents Australia’s composition of services trade by type of activity and the direction of services trade to selected countries and regions.
Australia’s merchandise trade on a recorded trade basis
Section 4 details Australia's merchandise trade by broad category and level of processing, including data on Australian produced exports.
Section 5 provides commodity rankings for Australia’s major merchandise exports and imports.
Section 6 shows the direction of Australia’s merchandise trade by country by rank and selected groups.
Section 7 gives a detailed commodity breakdown of Australia’s top 25 trading partners by the top 20 merchandise exports and imports as well as by selected regions and economies (e.g. APEC, Europe).
This publication is designed to be used in conjunction with DFAT’s trade data products available on the DFAT website which includes more detail by all countries and longer time series.
The website contains the following products. • Three MS Excel time series spreadsheets covering
o Australia’s trade in goods and services by all countries and selected country groups;
o Australia’s trade and economic indicators – historical data; and
o Australia’s direction of merchandise trade – historical data.
• Two MS Excel Pivot tables
o Australia's merchandise exports and imports with all countries, all State and Territories and selected country groups by SITC at the 3-digit level; and
o Australia's merchandise exports and imports with all countries, all State and Territories and selected country groups by DFAT's TRIEC at the 1-, 2-, 3- and 4-digit levels.

Page 5
AUSTRALIA’S TRADE: KEY POINTS, 2016-17
Australia’s trade in goods and services In 2016-17, the value of Australia’s exports of goods and services rose 16.8 per cent to $373.2 billion. Minerals & fuels, Gold, Services and Rural goods rose while Manufactures declined.
Australia’s imports of goods and services grew 1.4 per cent to $362.2 billion in 2016-17. Rises occurred in Intermediate & other goods, Capital goods, Gold and Consumption goods while Services decreased.
Australia’s export volumes rose 5.4 per cent in 2016-17, with volumes of Minerals & fuels up 5.3 per cent, Rural goods up 11.7 per cent and Services up 7.5 per cent. Import volumes increased 4.8 per cent with Gold up 18.6 per cent, Consumption goods up 3.6 per cent and Capital goods up 11.6 per cent.
In 2016-17, Australia’s terms of trade1 rose 14.5 per cent; export prices rose 10.8 per cent while import prices declined 3.2 per cent.
Australia’s direction of trade China was Australia’s largest individual two-way goods and services trading partner in 2016-17, accounting for 23.8 per cent ($174.7 billion) of total trade. Japan was the second largest trading partner accounting for 9.3 per cent ($68.6 billion) followed by the United States, accounting for 9.0 per cent ($66.5 billion).
APEC members accounted for 71.9 per cent of Australia’s total trade; ASEAN members accounted for 13.7 per cent; members of the European Union accounted for 13.5 per cent; G20 members accounted for 69.8 per cent and OECD countries accounted for 43.7 per cent.
China was Australia’s largest export destination (valued at $110.4 billion) and import source (valued at $64.3 billion).
Australia’s composition of trade In 2016-17 Australia’s top five goods and services exports were: Iron ore & concentrates ($62.8 billion); Coal ($54.3 billion); Education-related travel services – which includes foreign student expenditure on tuition fees and living expenses in Australia – ($28.0 billion); Natural gas ($22.3 billion) and Personal travel (excl education) services – which includes short term visitors’ expenditure in Australia mainly for recreational purposes – ($21.7 billion).
Australia’s top five goods and services imports in 2016-17 were: Personal travel (excl education) services – which includes Australian short term visitors’ expenditure abroad mainly for recreational purposes – ($37.6 billion); Passenger motor vehicles ($21.8 billion); Refined petroleum ($17.4 billion); Telecommunication equipment & parts ($12.0 billion) and Crude petroleum ($8.6 billion).
1 The terms of trade are calculated as the ratio of the prices we receive for our exports to the prices we pay for our imports.

Page 6
AUSTRALIA’S MERCHANDISE TRADE BY LEVEL OF PROCESSING
Exports In 2016-17, exports of Unprocessed primary products increased 31.1 per cent to $165.6 billion and Processed primary products rose 13.1 per cent to $55.9 billion.
Exports of Manufactures fell 1.1 per cent to $44.0 billion, with Simply transformed manufactures (STM) (excl nickel) exports declining 3.4 per cent to $13.7 billion and Elaborately transformed manufactures (ETM) exports falling 0.1 per cent to $30.3 billion.
Other goods (mainly Gold and confidential trade items) exports increased 10.0 per cent to $25.5 billion.
Merchandise exports by level of processing: 2011-12 and 2016-17
Merchandise imports by level of processing: 2011-12 and 2016-17
Based on ABS trade data on the DFAT STARS database.
Imports In 2016-17, imports of Unprocessed primary products rose 10.3 per cent to $12.7 billion and Processed primary products increased 3.1 per cent to $35.5 billion.
Imports of Manufactures fell 0.8 per cent to $204.4 billion, with both STM and ETM imports declining 0.8 per cent to $15.6 billion and $188.8 billion respectively.
Other goods (mainly Gold and Confidential items of trade) increased 1.1 per cent to $11.4 billion.
0% 20% 40% 60% 80% 100%
2011-12
2016-17
Unprocessedprimary
Processedprimary
STM(excl nickel)
ETM Other goods(incl gold)
0% 20% 40% 60% 80% 100%
2011-12
2016-17
Unprocessedprimary
Processedprimary
STM ETM Other goods(incl gold)

Page 7
COMMODITY FORECASTS
The Australian Bureau of Agricultural and Resource Economics and Sciences (ABARES) and the Department of Industry, Innovation and Science (DIIS) have forecast the value of Australia’s commodity exports to rise by 3.3 per cent in 2017-18. See Table A for more details.
Table A: Forecasts for major commodity exports
2015-16 2016-17 2017-18 2015-16 to
2016-17 2016-17 to
2017-18 $m $m $m % change % change
Forecast Agricultural & fisheries (a)
Wheat 5,120 6,094 4,992 19.0 -18.1 Wine 2,184 2,366 2,639 8.4 11.5 Beef & veal 8,495 7,087 7,355 -16.6 3.8 Wool (b) 3,283 3,617 4,339 10.2 19.9
Total agricultural & fisheries exports 46,335 50,130 48,475 8.2 -3.3
Resources & energy (c)
Metalliferous minerals & metals Aluminium 10,228 10,863 12,009 6.2 10.5
Bauxite (d) 992 1,042 1,020 5.1 -2.1 Alumina 5,995 6,655 7,199 11.0 8.2 Aluminium (ingot metal) 3,241 3,165 3,790 -2.3 19.7
Copper 8,110 7,540 8,346 -7.0 10.7 Gold 15,687 18,013 16,641 14.8 -7.6 Iron ores 47,799 62,689 62,039 31.2 -1.0 Nickel (d) 2,935 2,199 2,081 -25.1 -5.4 Zinc 2,628 2,688 2,991 2.3 11.3 Energy Crude petroleum 5,444 5,476 6,046 0.6 10.4 LNG 16,576 22,299 29,911 34.5 34.1 Coal 34,541 54,266 55,627 57.1 2.5
Metallurgical 19,790 35,363 35,266 78.7 -0.3 Thermal 14,751 18,903 20,360 28.1 7.7
Total resources & energy exports 160,767 204,117 214,112 27.0 4.9 Total commodity exports (b) (d) 207,102 254,248 262,587 22.8 3.3
(a) Based on ABARES commodity groups for farm, forest & fisheries products. (b) Balance of payments basis. (c) Based on DIIS commodity groups for
resources and energy. (d) DIIS estimates.
Sources: ABARES Agricultural commodities, December quarter 2017 and DIIS Resources & Energy, December quarter 2017.

Page 8
AUSTRALIA’S TRADE IN SERVICES WITH CHINA
China was Australia’s second largest two-way trade in services partner in 2016. Australia’s two-way trade in services with China was valued at $13.9 billion. Two-way trade in services has grown by an average 10.8 per cent per annum over the past ten years, above the average for Australia’s total services trade with the world of 4.6 per cent per annum. Australia became a net exporter of services to China from 1999 onwards. Growth in services has been dominated by growth in travel services, particularly exports of education and other personal travel services. China was Australia’s largest services export market in 2016 and Australia’s ninth largest source of services imports.
Long term trends in trade in services with China The value of Australia’s exports of services to China increased by an average 18.6 per cent per annum since 1996 to be valued at $11.3 billion in 2016 (Chart 1). The growth rate has been fairly consistent with growth dominated by travel services which have risen from just $187 million in 1996 to $10.1 billion in 2016. Non-travel services have grown from $170 million to $1.2 billion. The growth in travel services has been dominated by Education-related travel service and Other personal travel services (mainly travel for recreational purposes).
Chart 1: Australia’s trade in services with China
Based on ABS catalogue 5368.0.55.004.
Australia’s imports of services from China increased by an average 8.6 per cent per annum since 1996 to be valued at $2.6 billion in 2016. Compared to exports, imports have grown at a much slower rate. Unlike exports the growth in imports has been more broadly based with travel services growing from $140 million
0
2
4
6
8
10
12
0
2
4
6
8
10
12
1996 1998 2000 2002 2004 2006 2008 2010 2012 2014 2016
A$b
Exports Imports
A$b
Page 9
in 1996 to just under $1.3 billion in 2016, while non-travel services have grown from $316 million to be valued at just over $1.3 billion.
Australia became a net exporter of services to China from 1999, with the surplus on trade in services valued at $8.6 billion in 2016.
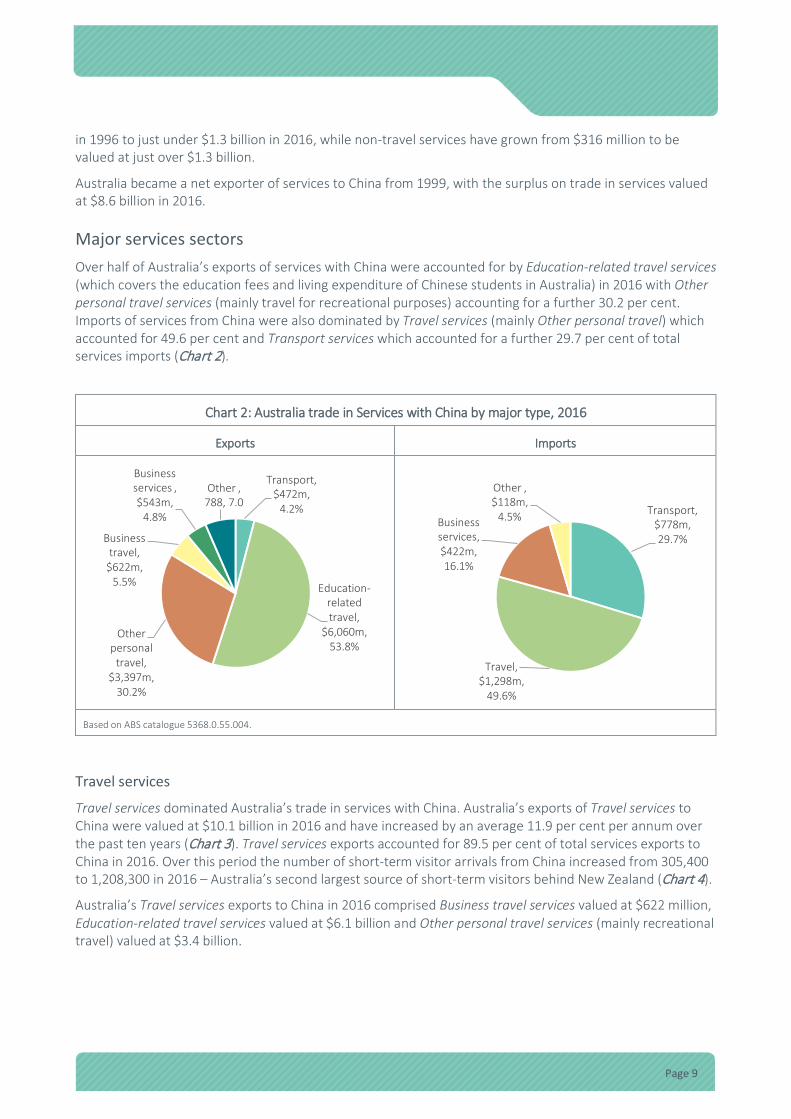
Major services sectors Over half of Australia’s exports of services with China were accounted for by Education-related travel services (which covers the education fees and living expenditure of Chinese students in Australia) in 2016 with Other personal travel services (mainly travel for recreational purposes) accounting for a further 30.2 per cent. Imports of services from China were also dominated by Travel services (mainly Other personal travel) which accounted for 49.6 per cent and Transport services which accounted for a further 29.7 per cent of total services imports (Chart 2).
Chart 2: Australia trade in Services with China by major type, 2016
Exports Imports
Based on ABS catalogue 5368.0.55.004.
Travel services
Travel services dominated Australia’s trade in services with China. Australia’s exports of Travel services to China were valued at $10.1 billion in 2016 and have increased by an average 11.9 per cent per annum over the past ten years (Chart 3). Travel services exports accounted for 89.5 per cent of total services exports to China in 2016. Over this period the number of short-term visitor arrivals from China increased from 305,400 to 1,208,300 in 2016 – Australia’s second largest source of short-term visitors behind New Zealand (Chart 4).
Australia’s Travel services exports to China in 2016 comprised Business travel services valued at $622 million, Education-related travel services valued at $6.1 billion and Other personal travel services (mainly recreational travel) valued at $3.4 billion.
Transport, $472m,
4.2%
Education-related travel,
$6,060m, 53.8%
Other personal
travel, $3,397m,
30.2%
Business travel,
$622m, 5.5%
Businessservices , $543m,
4.8%
Other , 788, 7.0
Transport, $778m, 29.7%
Travel, $1,298m,
49.6%
Business services, $422m, 16.1%
Other , $118m,
4.5%

Page 10
Chart 3: Australia's trade in Travel services with China
Based on ABS catalogue 536.0.55.004.
Education-related travel services exports
Education-related travel services are the most important Australian services export to China and accounted for 53.8 per cent of total services exports in 2016 (Chart 5). China is Australia’s largest market for these services. However, growth in exports has not been consistent over this period. Strong growth in Education-related travel services occurred between 2006 and 2010, up from $2.3 billion to $4.0 billion in 2010. Student numbers subsequently declined from 123,234 to 110,700 between 2010 and 2013.
Chart 4: Short-term China visitors and Australian resident departures
Chart 5: Exports of Education-related travel services
Based on ABS catalogue 3401.0. Student numbers only available from 2008 onwards.
Based on ABS catalogue 5368.0.55.004 & Department of Education & Training.
0
2
4
6
8
10
12
2006 2008 2010 2012 2014 2016
A$b
Exports Imports
0
200
400
600
800
1,000
1,200
1,400
2006 2008 2010 2012 2014 2016
000's
Arrivals Departures
0
40
80
120
160
0
2
4
6
8
2006 2008 2010 2012 2014 2016
A$b
Exports (A$b) LHSStudent numbers (000's) RHS
000's

Page 11
This fall between 2010 and 2013 was due to a range of issues, including concerns with the quality of some vocational education institutions in Australia, changes to student visa criteria, the high Australian exchange rate (making the cost of education in Australia more expensive) and concerns for the personal security of international students in Australia.
Since 2013 Education-related travel services has rebounded quickly with exports growing from $4.1 billion to $6.1 billion in 2016 with most of the concerns that drove the fall having abated or been addressed. Student numbers increased strongly from 110,700 to 157,000 over the same period.
The majority of Chinese student enrolments are in the Higher education sector with 57.5 per cent of enrolment in 2016 (Chart 6) followed by English Language Intensive Courses for Overseas Students (ELICOS) with 21.4 per cent and Vocational education with 7.0 per cent.
Student visa grants show that the growth in Chinese students studying in Australia will continue to grow strongly over the year ahead, with visa grants increasing by 14.1 per cent to 80,423 in 2016-17, with the Higher Education sector accounting for 83.8 per cent of all grants2.
Chart 6: China student enrolments by sector
ELICOS – English Language Intensive Courses for Overseas Students.
Source: Department of Education & Training - International student enrolment data.
Business and Other personal travel services exports
Exports of the Business and Other personal travel services to China have also grown strongly over the period 2006 to 2016 on the back of the strong rise in the number of Chinese visiting Australia. Exports of Business travel services have grown four fold from $161 million in 2006 to $622 million in 2016, while exports of Other personal travel services increased from $442 million to $3.4 billion. Together these components accounted for 35.7 per cent of total services exports to China in 2016.
Travel services exports to China are expected to continue to grow strongly over the decade ahead. Tourism Research Australia has forecast growth of 11.9 per cent per annum on average in the number of visitor arrivals from China, to reach 3.9 million visitors by 2026-27. The value of real tourism exports to China (in
2 Source: Department of Immigration and Border Protection - Student visa and Temporary Graduate visa programme bi-annual report ending at 30 June.
0
40
80
120
160
200
2006 2007 2008 2009 2010 2011 2012 2013 2014 2015 2016
000's
Higher education Vocational ELICOS Other

Page 12
2015-16 dollars) are expected to grow from $9.8 billion in 2016-17 to be valued at $26.2 billion in 2026-27 3. Chinese business travellers will grow by 3.2 per cent per annum on average while Chinese visitors here for holiday will increase by 14.1 per cent per annum over the same time period4.
Travel services imports
Australia’s imports of Travel services from China increased by an average 3.8 per cent per annum over the past ten years to be valued at $1.3 billion in 2016. Travel services imports accounted for 49.6 per cent of Australia’s imports of services from China. Over this period the number of short-term Australian resident departures to China increased from 250,900 to 455,000 in 2016.
Australia’s Travel services imports from China in 2016 comprised Business travel services valued at $261 million, Education-related travel services valued at $103 million and Other personal travel services valued at $934 million.
Other personal travel services dominated imports of Travel services from China (accounting for 72.0 per cent of total Travel services imports). This series has grown by an average 5.2 per over the past ten years.
Transport services
Australia’s exports of Transport services to China increased from $207 million in 2006 to $472 million in 2016 (Chart 7). Exports of Transport services accounted for 4.2 per cent of Australia’s total services exports to China.
Within Transport services, Freight and Passenger transport services were valued at $112 million in 2016, Other transport services (which covers a range of services provided in Australian airports and ports, including Cargo & baggage handling services, Agents fees associated with freight transportation and Airport & port charges) valued at $267 million and Postal & courier services valued at $93 million.
Australia’s imports of Transport services from China rose 12.7 per cent per annum on average over the past ten years to be valued at $778 million in 2016 and accounted for 29.7 per cent of Australia’s total imports of services. The main import was Freight transport services valued at $538 million in 2016 (up from $140 million in 2009). Passenger transport and Postal & courier services were valued at $232 million.
Chart 7: Australia trade in Transport services with China
Based on ABS catalogue 5368.0.55.004.
3 Tourism export would include a range of services types including passenger transport services, related commissions and all travel services (excluding long term student expenditure). 4 Source: Tourism Research Australia - Tourism Forecasts August 2017.
0
200
400
600
800
2006 2008 2010 2012 2014 2016
A$m
Exports Imports

Page 13
Box A: Passenger services exports and import
The Australian Bureau of Statistics (ABS) does not publish a breakdown of Passenger transport services exports and imports with China5. Using data sourced from the Department of Immigration and Border Protection (DIBP) overseas arrivals and departure statistics, more information can be obtained on the trends in Australia’s Passenger services exports and imports with China.
Before analysing this data it is necessary to clarify what the ABS defines as an export and import of Passenger services in Australia’s Balance of Payments statistics. Exports are defined as non-residents flying internationally on Australian resident carriers (e.g. a foreign traveller flying on Qantas from China to Australia) while imports are defined as Australian residents flying internationally on non-resident carriers (e.g. an Australian flying on China Eastern Airlines from China to Australia). Australian residents flying internationally on resident carriers are not an Australian export (Australian domestic transaction) while non-residents flying internationally on non-resident carriers are not an Australian import (rest of the world transaction).
Chart A shows the number of travellers flying on Australia’s resident airlines between Australia and China between 2007 and 2016. In 2007, 228,900 people travelled between Australia and China on Australian resident carriers, of which 54.1 per cent were foreign travellers (123,800) – i.e. an export. By 2016 the number of travellers on Australian resident airlines had increased to 612,000. However the share of foreign travellers had risen to 72.7 per cent (or 445,000). Foreign travellers on Australian resident airlines have grown by an average of 19.2 per cent per annum over this period (compared to an average increase of only 6.6 per cent per annum for resident travellers) - which represents strong growth in passenger services exports. The rising share of foreign travellers on resident airlines has been one of the main reasons behind the rise in Australian exports of Transport services to the China over this period.
Chart B shows the number of travellers flying on Chinese airlines between 2007 and 2016. In 2007, 590,300 people travelled between Australia and China on Chinese carriers, of which 38.0 per cent were Australian travellers (224,500) – i.e. an import. By 2016 the number of travellers on Chinese airlines had increased to 2,225,000. However the share of Australian travellers had fallen to 29.6 per cent (or 659,000). Australian travellers on Chinese airlines have only grown by an average of 13.9 per cent per annum over this period (compared to an average increase of 18.0 per cent per annum for Chinese travellers to over 1.5 million). Therefore the growth in imports of Passenger services has made up only a small component of the overall growth in imports of Transport services from China over the period.
The tripling in airline capacity (both resident and non-resident airlines) over the period (from 819,200 movements in 2007 to 2,837,000 in 2016) has been critical to supporting the recent Chinese tourist boom to Australia.
5 Data is suppressed due to business confidentiality.

Page 14
Business services6
Australia’s exports of Business services to China were valued at $543 million in 2016 and accounted for just 4.8 per cent of total service exports to China (Chart 8). Exports of Business services rose by an average 13.5 per cent per annum over the past ten years, though exports fell by 14.4 per cent in 2016.
Chart 8: Australia’s trade in Business services with China
Chart 9: Australia’s trade in Financial & insurance services with China
Based on ABS catalogue 5368.0.55.004.
6 Business services includes: Construction services; Financial & insurance services; Charges for the use of intellectual property nie; Telecommunication, computer & information services and Other business services.
0
200
400
600
800
2006 2008 2010 2012 2014 2016
A$m
Exports Imports
0
100
200
300
400
500
2006 2008 2010 2012 2014 2016
A$m
Exports Imports
Box A: Passenger services exports and import – cont’d
Chart A: Australian airlines – International passenger movements between Australia & China
Chart B: Chinese airlines – International passenger movements between Australia & China
Based on DIBP Overseas & Arrivals data. Based on DIBP Overseas & Arrivals data.
0
100
200
300
400
500
2007 2009 2011 2013 2015
000's
Non-residents (export) Residents
0
300
600
900
1,200
1,500
1,800
2007 2009 2011 2013 2015
000's
Non-residents Residents (import)

Page 15
Imports of Business services from China were valued at $422 million and accounted for 16.1 per cent of total service imports from China in 2016. Imports of Business services have increased by an average 15.4 per cent per annum over the past ten years but as with exports, fell in 2016 by 12.8 per cent. Within Business services the major services were:
Financial and Insurance services
Exports of Financial and Insurance services to China increased by an average 43.5 per cent per annum over the past ten years to be valued at $353 million in 2016. Chart 9 shows that these services rose strongly from 2010 to 2015, up from $47 million to $408 million before falling in 2016. The main reason for the strong growth was Financial services (up from $13 million in 2010 to $317 million in 2016). China was Australia’s third largest market for Financial services in 2016. Imports of Financial and Insurance services from China also follow a similar growth pattern. Imports grew strongly from 2010 to 2014, up from $34 million to $167 million before falling to $51 million in 2016.
Telecommunication, computer & information services
Australia’s exports of Telecommunication, computer & information services China have grown from $19 million in 2006 to $51 million in 2016 (Chart 10). Telecommunication services were valued at $10 million, while Computer & information services were valued at $41 million. The major export was Hardware & software consultancy services valued at $31 million in 2016.
Chart 10: : Australia’s trade in Telecommunication, computer & information services
with China
Chart 11: Australia’s trade in Professional services with China
Based on ABS catalogue 5368.0.55.004 & unpublished data.
Australia’s imports of Telecommunication, computer & information services from China have risen from $17 million to $31 million in 2016. Telecommunication services were valued at $13 million, while Computer & information services imports were valued at $18 million in 2016. The major imports within Computer & information services were Hardware & software consultancy services valued at $8 million and Data processing services valued at $7 million.
0
10
20
30
40
50
60
2006 2008 2010 2012 2014 2016
A$m
Exports Imports
0
40
80
120
160
200
2009 2010 2011 2012 2013 2014 2015 2016
A$m
Exports Imports

Page 16
Professional services7
Australia’s exports of Professional services to China have grown from $46 million in 2009 to $103 million in 2016. (Chart 11). The major professional services exports to China in 2016 were Management fees8 valued at $42 million and Legal services valued at $26 million.
Imports of Professional services from China have grown from $15 million in 2009 to $143 million in 2016. The major Professional services imported from China in 2016 were Management fees valued at $81 million and Advertising services valued at $44 million.
Technical & other business services9
Australia’s exports of Technical & other business services to China have fallen from $102 million in 2009 to $23 million in 2016 (Chart 12). The major components which accounted for this decline were Engineering services (down from $32 million in 2009 to $4 million in 2016) and Scientific and other technical services (down from $36 million in 2009 to $2 million in 2016).
Imports of Technical & other business services from China have increased from $80 million in 2009 to $191 million in 2016. The major component was Trade related services (up from $35 million in 2009 to $119 million in 2016) and Engineering services valued at $31 million in 2016.
Chart 12: Australia’s trade in Technical & other business services with China
Chart 13: Australia’s trade in Personal, cultural & recreation services with China
Based on ABS catalogue 5368.0.55.004 & unpublished data.
Personal, cultural & recreation services
Exports of Personal, cultural & recreation services to China (Chart 13) was valued at $84 million in 2016 up from $39 million in 2006. The major component was Services provided through education institutions (valued at $65 million in 2016).
Imports of Personal, cultural & recreation services from China were fairly small valued at just $10 million in 2016. The largest component was imports of Services provided through education institutions (valued at $5 million).
7 Data for Professional services is only available from 2009 to 2016. 8 Management fees are charges between related enterprises representing a contribution to general management costs such as corporate computer systems, and accounting that cannot be split to a specific service category. 9 Data for Technical & Other business services is only available from 2009 to 2016.
0
50
100
150
200
250
2009 2010 2011 2012 2013 2014 2015 2016
A$m
Exports Imports
0
20
40
60
80
100
2006 2008 2010 2012 2014 2016
A$m
Exports Imports

Page 17
Box B: Services provided by Australia’s foreign affiliates located in China
Most Australian services (and some goods) are delivered though Australian foreign affiliates in the host country10 rather than through exports and are therefore not included in ABS trade in services data. Though the ABS does not compile data on foreign affiliates trade in services, ABS international investment data shows that the stock of direct investment between China and Australia has been growing strongly, with Australian direct investment in China valued at $13.3 billion in 2016 (up from $2.4 billion in 2009)11. Direct income flows earned on this investment (which can be used as a proxy indicator for foreign affiliates trade) was valued at $645 million in 2016 (up from just $13 million in 2009)12.
Income yields on income earned can be used as an overarching indicator of the performance of Australia’s Foreign Affiliates Trade. The income yield is calculated as the income earned on direct investment divided by the stock of direct investment. An increasing yield indicates improved performance, while a decreasing yield indicates a fall in performance. The income yield on Australia direct investment with China has recorded a rapid increase over recent years from just 0.5 per cent in 2009 to 4.8 per cent in 2016. The growth has been particularly strong since 2013.
This is a typical yield pattern for new direct investment which sees businesses interested in the medium to long term performance of their investment rather than short-term returns and this is the case for Australian direct investment in China over recent years. It also indicates that the provision of Australian goods and services to China through Australian affiliates in China (or commercial presence) is becoming an important and growing means to deliver Australian goods and services to China.
Australia’s direct investment in China13
Source: ABS Catalogue 5352.0
10 A one-off ABS survey showed that around two-thirds of Australian services are delivered through Australian foreign affiliates abroad. 11 The ABS does not publish direct investment data by country by industry, so the exact value of Australia’s direct investment in services industries in China is not known. At the Australian level over 40 per cent direct investment stock was in services industries at the end of 2016. 12 Direct equity only for 2012. 13 Direct equity only for 2013 for direct investment stock and 2009, 2011 and 2012 for income earned.
0
1
2
3
4
5
6
0
2
4
6
8
10
12
14
16
2009 2010 2011 2012 2013 2014 2015 2016
Australia direct investment in China - Stock (LHS) Income yield
A$b Per cent

Page 18
Conclusion China is a key services trading partner for Australia and trade has grown from $4.6 billion in 2006 to $13.9 billion in 2016. China is Australia’s largest services export market.
Australia’s export profile is dominated by Education-related travel services which accounted for nearly 54 per cent of all services exports to China in 2016. The other major service export is Other personal travel services which accounted for 30.2 per cent of all exports to China. The strong growth in these services have been supported by the increase in both Chinese students and Chinese tourists coming to Australia. The strong growth in these visitors has also supported the growth in exports of Transport services.
Official statistics of exports of Business services remain small in comparison. However many of these services are not included in ABS trade in services statistics but are supplied through Australian affiliates located in China.
Travel and Transport services dominated imports accounting for almost 80 per cent of total services imports from China.
Author: Frank Bingham Statistics Section Office of Economic Analysis [email protected]

Page 19
ATTACHMENT A AUSTRALIA'S SERVICES EXPORTS TO CHINA
BY TYPE OF ACTIVITY (a) (A$ million)
Services - Type of activity 2009 2011 2013 2015 2016
Manufacturing services on physical inputs owned by others
0 0 0 0 0
Maintenance & repair services nie 3 1 1 1 10
Transport services 215 240 305 441 472
Passenger (b) np np np np np Freight np np np np np Other transport 109 133 159 254 267 Postal & courier (c) 51 52 68 115 93 Travel services 4,696 5,518 6,143 8,477 10,079
Business 216 403 449 621 622 Personal 4,480 5,115 5,694 7,856 9,457 Education-related 3,674 4,052 4,068 4,932 6,060 Other personal travel (d) 806 1,063 1,626 2,924 3,397 Construction services 3 4 1 0 0
Insurance & pension services 24 36 47 40 36
Direct insurance 23 35 46 38 35 Freight 21 35 46 38 35 Life 0 0 0 0 0 Other direct 2 0 0 0 0 Reinsurance 0 0 0 0 0 Auxiliary 0 0 0 0 0 Pension 1 1 2 2 2 Standardised guarantee 0 0 0 0 0 Financial services 12 49 194 368 317
Charges for the use of intellectual property nie 14 25 15 15 6
Licences to reproduce and/or distribute computer services
6 np 9 3 1
Software 6 np 9 3 1 Hardware & design 0 np 0 0 0 Licences to produce and/or distribute
audiovisual & related services 0 0 0 0 0
Outcomes of research & development 3 np 5 2 3 Franchise & trademarks licensing fees 0 0 0 9 0 Other charges 4 7 2 1 2 Royalties on education services 4 3 1 1 2 Royalties on telecommunication
services 0 0 0 0 0
Music 0 0 0 0 0 Other charges nie 0 4 1 1 1

Page 20
AUSTRALIA'S SERVICES EXPORTS TO CHINA BY TYPE OF ACTIVITY (a) (cont'd)
(A$ million)
Services - Type of activity 2009 2011 2013 2015 2016
Telecommunications, computer & information services
42 24 19 53 51
Telecommunication 4 3 2 8 10 Telephone 4 3 2 3 3 Other telecommunication 0 0 0 6 7 Computer & information 38 21 17 45 41 Computer 31 18 13 38 33 Hardware & software
consultancy 22 8 3 36 31
Data processing 9 10 10 3 2 Information services 3 0 2 0 0 Database services 2 0 0 0 0 News agency subscription 1 0 2 0 0 Other computer & information 5 3 3 6 7 Other business services 150 148 145 158 133
Research & development 2 15 4 8 7 Professional & management consulting 46 55 67 90 103 Legal, accounting, management
consulting, public relations 46 55 64 79 94
Legal 23 9 19 17 26 Accounting auditing 5 25 11 17 10 Business & management
consultancy 0 1 0 2 2
Other professional 12 16 11 35 14 Management fees nie 5 4 23 9 42 Advertising, market research & public
opinion polling 0 1 2 11 9
Technical, trade-related & other business 102 78 75 60 23 Architectural, engineering & other
technical 80 53 52 27 9
Architectural 12 10 13 4 3 Engineering 32 39 24 19 4 Surveying 0 0 0 0 0 Scientific & other technical 36 4 14 4 2 Waste treatment & de-pollution,
agricultural & mining 1 3 1 1 2
Waste treatment & depollution
0 0 0 0 0
Services incidental to agriculture, forestry & fishing
0 0 0 0 0
Services incidental to mining, and oil & gas extraction
1 3 1 0 2
Other on-site processing 0 0 0 0 0

Page 21
AUSTRALIA'S SERVICES EXPORTS TO CHINA BY TYPE OF ACTIVITY (a) (cont'd)
(A$ million)
Services - Type of activity 2009 2011 2013 2015 2016
Operational leasing 8 4 2 2 2 Air operational leasing 0 0 0 0 0 Sea operational leasing 0 0 2 2 2 Other operational leasing 8 4 0 0 0 Trade-related services 2 4 0 4 0 Other business services nie 12 14 20 27 11 Personal, cultural & recreational services 43 50 65 76 84
Audiovisual & related services 0 0 2 2 3 Royalties on film, television, home
entertainment & other audiovisual 0 0 2 2 3
Film 0 0 0 0 0 Television 0 0 0 0 0 Home entertainment 0 0 0 0 0 Other audiovisual 0 0 0 0 0 Other film, TV and
multimedia 0 0 2 2 3
Other audiovisual nie 0 0 0 0 0 Other personal, cultural & recreational
services 43 50 63 74 81
Health 0 0 0 0 0 Education 43 50 61 74 81 Consultancy 10 16 19 8 6 Correspondence courses 2 3 2 1 2 Services through
educational institutions 12 16 25 51 65
Other educational services 18 15 15 14 8 Other recreational 0 0 3 0 0 Sporting & entertainment 0 0 0 0 0 Off-shore gambling 0 0 0 0 0 Other recreational nie 0 0 3 0 0 Government services nie 35 43 60 71 72
Total services exports 5,237 6,138 6,996 9,700 11,260
(a) Cells in this table may have been perturbed to protect confidentiality. (b) Passenger services includes Agency fees and Commissions for air transport. (c) Postal & courier services includes Indirect sea transport. Source: ABS catalogue 5368.0.55.004 and unpublished data.

Page 22
ATTACHMENT B AUSTRALIA'S SERVICES IMPORTS FROM CHINA
BY TYPE OF ACTIVITY (a) (A$ million)
Services - Type of activity 2009 2011 2013 2015 2016
Manufacturing services on physical inputs owned by others
0 0 0 0 0
Maintenance & repair services nie 1 1 2 32 30
Transport services 229 334 488 720 778
Passenger (b) np np np np np Freight 140 238 398 519 538 Other transportation 12 np np 8 8 Postal & courier (c) np np np np np Travel services 1,000 1,135 1,240 1,138 1,298
Business 271 240 313 272 261 Personal 729 896 927 866 1,037 Education-related 59 59 68 90 103 Other personal travel (d) 670 837 860 776 934 Construction services 0 0 0 0 0
Insurance & pension services 30 29 33 41 35
Direct insurance 19 20 24 31 26 Freight 19 20 24 31 26 Life 0 0 0 0 0 Other direct 0 0 0 0 0 Reinsurance 0 0 0 0 0 Auxiliary 0 0 0 0 0 Pension 11 9 10 10 9 Standardised guarantee 0 0 0 0 0 Financial services 0 2 43 20 16
Charges for the use of intellectual property nie 1 0 0 6 0
Licences to reproduce and/or distribute computer services
0 0 0 2 0
Software 0 0 0 0 0 Hardware & design 0 0 0 2 0 Licences to produce and/or distribute
audiovisual & related services 0 0 0 0 0
Outcomes of research & development 0 0 0 0 0 Franchise & trademarks licensing fees 0 0 0 0 0 Other charges 0 0 0 4 0 Royalties on education services 0 0 0 0 0 Royalties on telecommunication
services 0 0 0 0 0
Music 0 0 0 0 0 Other charges nie 0 0 0 4 0

Page 23
AUSTRALIA'S SERVICES IMPORTS FROM CHINA BY TYPE OF ACTIVITY (a) (cont'd)
(A$ million)
Services - Type of activity 2009 2011 2013 2015 2016
Telecommunications, computer & information services
43 21 14 25 31
Telecommunication 15 np 7 13 13 Telephone 15 np 6 9 9 Other telecommunication 0 0 0 4 4 Computer & information 29 np 7 12 18 Computer 28 np 6 11 15 Hardware & software
consultancy 26 np 4 6 8
Data processing 3 2 3 5 7 Information services 0 np 0 0 0 Database services 0 0 0 0 0 News agency subscription 0 np 0 0 0 Other computer & information 0 0 0 1 3 Other business services 97 169 211 392 340
Research & development 2 4 1 5 6 Professional & management consulting 15 54 57 187 143 Legal, accounting, management
consulting, public relations 14 53 52 114 99
Legal 3 3 2 4 4 Accounting auditing 2 3 1 3 4 Business & management
consultancy 1 4 3 4 6
Other professional 6 35 9 22 3 Management fees nie 2 8 38 81 81 Advertising, market research & public
opinion polling 1 0 5 73 44
Technical, trade-related & other business 80 111 152 200 191 Architectural, engineering & other
technical 16 21 45 43 33
Architectural 0 0 0 0 0 Engineering 10 17 37 39 31 Surveying 0 0 0 0 0 Scientific & other technical 6 4 9 5 2 Waste treatment & de-pollution,
agricultural & mining 0 2 7 18 2
Waste treatment & depollution
0 0 0 0 0
Services incidental to agriculture, forestry & fishing
0 2 7 0 0
Services incidental to mining, and oil & gas extraction
0 0 0 18 2
Other on-site processing 0 0 0 0 0
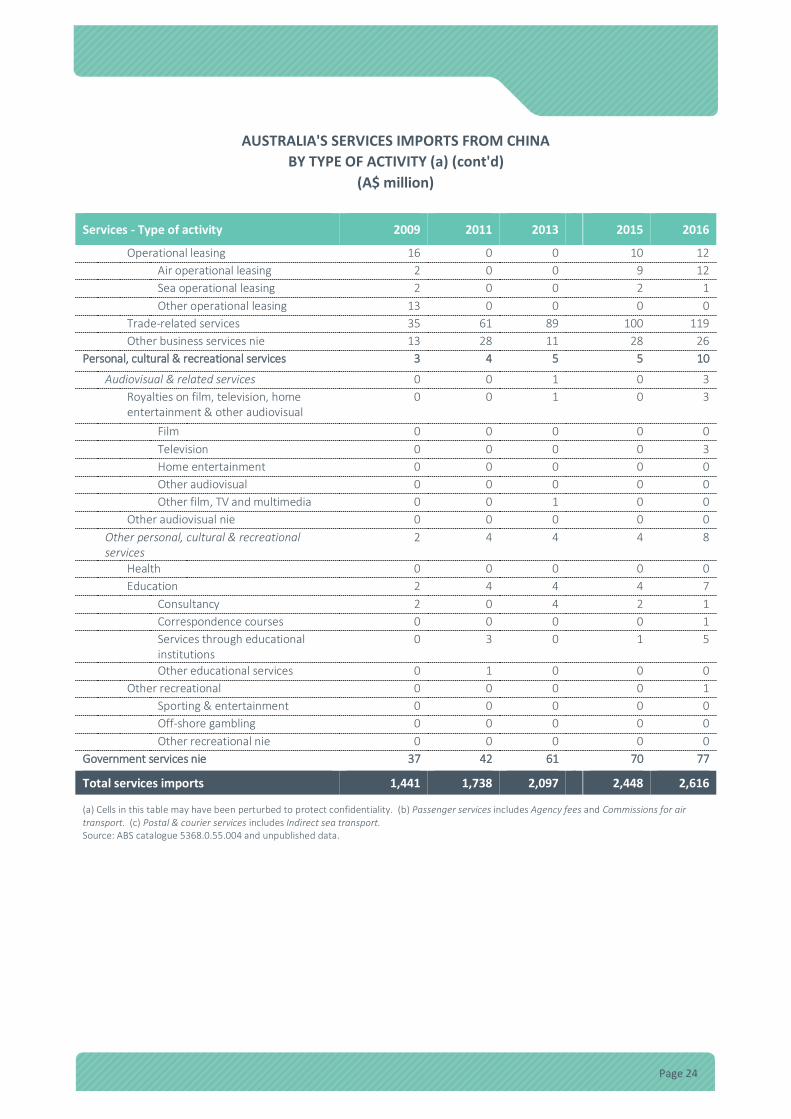
Page 24
AUSTRALIA'S SERVICES IMPORTS FROM CHINA BY TYPE OF ACTIVITY (a) (cont'd)
(A$ million)
Services - Type of activity 2009 2011 2013 2015 2016
Operational leasing 16 0 0 10 12 Air operational leasing 2 0 0 9 12 Sea operational leasing 2 0 0 2 1 Other operational leasing 13 0 0 0 0 Trade-related services 35 61 89 100 119 Other business services nie 13 28 11 28 26 Personal, cultural & recreational services 3 4 5 5 10
Audiovisual & related services 0 0 1 0 3 Royalties on film, television, home
entertainment & other audiovisual 0 0 1 0 3
Film 0 0 0 0 0 Television 0 0 0 0 3 Home entertainment 0 0 0 0 0 Other audiovisual 0 0 0 0 0 Other film, TV and multimedia 0 0 1 0 0 Other audiovisual nie 0 0 0 0 0 Other personal, cultural & recreational
services 2 4 4 4 8
Health 0 0 0 0 0 Education 2 4 4 4 7 Consultancy 2 0 4 2 1 Correspondence courses 0 0 0 0 1 Services through educational
institutions 0 3 0 1 5
Other educational services 0 1 0 0 0 Other recreational 0 0 0 0 1 Sporting & entertainment 0 0 0 0 0 Off-shore gambling 0 0 0 0 0 Other recreational nie 0 0 0 0 0 Government services nie 37 42 61 70 77
Total services imports 1,441 1,738 2,097 2,448 2,616
(a) Cells in this table may have been perturbed to protect confidentiality. (b) Passenger services includes Agency fees and Commissions for air transport. (c) Postal & courier services includes Indirect sea transport. Source: ABS catalogue 5368.0.55.004 and unpublished data.

Page 25
LOW VALUE THRESHOLD GOODS
Introduction In August 2013 the Australian Bureau of Statistics (ABS) commenced including estimates for the value of ‘low value threshold’ (LVT) goods imports into Australia’s official balance of payments statistics, with revisions back to September quarter 1998. In August 2014 methodological changes were announced, arising from three additional data sources, resulting in further revisions to the series.
What are LVT goods? Broadly, goods imported to Australia with a value below $1,000 (the LVT) do not require full import declaration (FID) to the Department of Immigration & Border Protection (DIBP). As such these imports are excluded from Australia’s merchandise trade statistics, and before August 2013, were also excluded from Australia’s Balance of Payments statistics14. LVT goods can be characterised in particular by the large range of ‘small’ purchases made via on-line retail.
Estimating LVT goods imports Investigations undertaken by the ABS together with DIBP revealed there had been a significant increase in the number of parcels being imported under the LVT – driven by the growth in on-line trade. A decision was taken to include estimates for these goods in Australia’s macroeconomic statistics. The estimates commenced with the August 2013 edition of International Trade in Goods in Services (ABS catalogue 5368.0) with revisions back to September 1998. The estimates have also been included in the Balance of Payments and International Investment Position (ABS catalogue 5302.0) from September 2013 release (including revisions) as well as other ABS outputs that include an international trade dimension.
Updates to LVT adjustments for official goods debits estimates LVT adjustments are applied only to balance of payments goods debits estimates, hence pushing the balance of payments debits series higher by the value of the LVT estimate relative to the corresponding merchandise imports series15. They were well below $1 billion in 1998-99 and around $9.3 billion in 2016-17, which represents 3.3 per cent of the ‘goods debits’ series in that year.
Impact on macroeconomic aggregates By default, the balance (on goods and services) is also affected. And because the balance is a ‘net’ series the differences between balance of payments and merchandise trade estimates will vary more widely and, at times, will be at odds as to whether Australia’s trade is in surplus or deficit. The table below displays
14 To date exports have been excluded from the process, even though conceptually they are in scope. When the ABS identifies reliable data sources, they will be considered for inclusion. 15 Note there are other adjustments applied to the balance of payments goods debits series which cause it to differ from merchandise imports.

Page 26
Australia’s goods trade balances for 1998-99 (when the LVT adjustment commences) as well as the period 2011 to 2016-17.
Goods Trade Balances Balance of payments versus Merchandise trade (A$ billion)
1998-99 2011-12 2012-13 2013-14 2014 2015-16 2016-17 Balance of payments -12.5 -3.7 -19.9 -6.8 -24.7 -37.6 11.0 Merchandise trade -11.6 24.3 10.5 20.6 -2.4 -19.9 27.0 Difference -0.9 -28.0 -30.4 -27.4 -22.2 -17.7 -16.0 Source: ABS catalogues 5302.0 and 5368.0.
In 1998-99 the difference between the goods trade balance was just $0.9 billion. However over time, helped by the inclusion of LVT16 goods imports, the difference lifted to $30.4 billion by 2012-13. In 2016-17, the difference had eased to $16.0 billion.
From the user perspective balance of payments is the preferred series as the adjustments incorporated by the ABS fill in gaps that exist in the merchandise trade statistics as well as providing a more realistic account of change of ownership. However, balance of payments data is only available for broad aggregates, so users must still use the merchandise trade series where finer levels of detail are required.
More information For a more detailed description of inclusion of LVT estimates into Australia’s macroeconomic estimates see the explanatory notes of International Trade in Goods and Services, August 2013 (ABS catalogue 5368.0) as well as the information paper: Measurement of online Retail Trade in Macroeconomic Statistics, 2013 (ABS catalogue 8501.0.5.007). The August 2014 edition of International Trade in Goods and Services, (ABS catalogue 5368.0) provides details of the refinements in the technical note starting on page 45.
Author: Julie-Anne Andrew Office of Economic Analysis [email protected]
16 Balance of payments goods debits are also adjusted for transactions other than LVT goods imports. See the Explanatory notes in ABS catalogue 5368.0.

Page 27
AUSTRALIA'STRADE ON A BALANCE OF
PAYMENTS BASIS
Section 1
Australia's tradein goods and services

Page 28
2015-16 to 5 year2011-12 2012-13 2013-14 2014-15 2015-16 2016-17 2016-17 trend
Exports Goods 265,747 248,880 273,820 255,524 244,147 291,598 19.4 1.0Services 56,349 57,708 62,502 68,967 75,377 81,642 8.3 8.2Total goods & services 322,096 306,588 336,322 324,491 319,524 373,240 16.8 2.4
ImportsGoods 256,670 251,327 263,785 268,719 271,476 277,900 2.4 1.9Services 69,155 75,173 79,372 80,441 85,645 84,344 -1.5 4.1Total goods & services 325,825 326,500 343,157 349,160 357,121 362,244 1.4 2.4
Total two-way tradeGoods 522,417 500,207 537,605 524,243 515,623 569,498 10.4 1.4Services 125,504 132,881 141,874 149,408 161,022 165,986 3.1 6.0Total goods & services 647,921 633,088 679,479 673,651 676,645 735,484 8.7 2.4
Goods 9,077 -2,447 10,035 -13,195 -27,329 13,698 .. ..Services -12,806 -17,465 -16,870 -11,474 -10,268 -2,702 .. ..Total goods & services -3,729 -19,912 -6,835 -24,669 -37,597 10,996 .. ..
2015-16 to 5 year2011-12 2012-13 2013-14 2014-15 2015-16 2016-17 2016-17 trend
Export volumesGoods 191,027 203,141 215,437 229,235 244,147 255,778 4.8 6.1Services 60,637 60,885 64,246 69,665 75,378 81,030 7.5 6.4Total goods & services 250,966 264,275 280,008 298,998 319,524 336,808 5.4 6.2
Import volumesGoods 274,028 269,604 264,910 271,029 271,477 286,185 5.4 0.7Services 87,762 94,154 90,095 86,628 85,646 88,032 2.8 -0.9Total goods & services 361,937 362,929 354,463 357,603 357,121 374,218 4.8 0.4
Total two-way trade volumesGoods 465,055 472,745 480,347 500,264 515,624 541,963 5.1 3.1Services 148,399 155,039 154,341 156,293 161,024 169,062 5.0 2.2Total goods & services 612,903 627,204 634,471 656,601 676,645 711,026 5.1 2.9
Goods & servicesTotal exports IPD 128.3 116.0 120.1 108.5 100.0 110.8 10.8 -3.6Total imports IPD 90.0 90.0 96.8 97.6 100.0 96.8 -3.2 2.0
Goods & services 142.6 129.0 124.1 111.2 100.0 114.5 14.5 -5.5(a) For the differences in measuring trade under balance of payments basis vs recorded trade basis refer to this section in the Explanatory notes .(b) Reference year for chain volume measures is 2015-16.Based on ABS catalogue 5302.0.
TABLE 1: AUSTRALIA'S TRADE IN GOODS AND SERVICESBALANCE OF PAYMENTS BASIS (a)
(A$ million)
Current prices% growth
Balance on trade
Chain volume measures and indices (b)% growth
Implicit price deflators
Terms of trade

Page 29
2015-16 to 5 year2014-15 2015-16 2016-17 2016-17 trend
Total goods & services exports 324,491 319,524 373,240 16.8 2.4Goods exports 255,524 244,147 291,598 19.4 1.0
General merchandise 240,904 225,845 271,370 20.2 0.8Rural goods 42,608 43,155 46,532 7.8 6.0
Meat & meat preparations 12,975 12,256 11,062 -9.7 11.8Cereal grains & cereal preparations 8,888 7,986 9,345 17.0 -1.0Wool & sheepskins 3,154 3,283 3,617 10.2 3.6Other rural 17,591 19,630 22,508 14.7 7.1
Non-rural goods 198,296 182,690 224,838 23.1 -0.2Minerals and fuels 142,803 126,648 168,396 33.0 -0.8
Metal ores & minerals 77,989 69,235 85,195 23.1 -1.8Coal, coke & briquettes 38,040 34,543 54,267 57.1 0.5Other mineral fuels 26,774 22,870 28,934 26.5 0.2
Manufactures 43,499 44,611 44,121 -1.1 2.0Metals (excl non-monetary gold) 11,025 10,182 10,243 0.6 -2.2Machinery 9,932 10,491 9,954 -5.1 3.6Transport equipment 5,640 5,436 4,948 -9.0 4.7Other manufactures 16,902 18,502 18,976 2.6 2.9
Other non-rural (incl sugar & beverages) 10,332 9,933 10,690 7.6 -1.4Goods procured in ports by carriers 1,662 1,498 1,631 8.9 -1.4
Net exports of goods under merchanting 431 406 416 2.5 15.9Non-monetary gold 14,189 17,896 19,812 10.7 3.4
Services exports 68,967 75,377 81,642 8.3 8.2Manufacturing services on physical inputs owned by others 10 17 21 23.5 25.6Maintenance & repair services nie 64 72 61 -15.3 5.3Transport 6,634 6,931 7,533 8.7 3.7Travel 42,531 47,730 52,745 10.5 9.6Other 19,728 20,627 21,282 3.2 6.6
2015-16 to 5 year2014-15 2015-16 2016-17 2016-17 trend
Total goods & services imports 349,160 357,121 362,244 1.4 2.4Goods imports 268,719 271,476 277,900 2.4 1.9
General merchandise 264,983 266,503 271,769 2.0 2.0Consumption goods 86,704 96,638 97,204 0.6 6.8Capital goods 63,746 64,184 68,073 6.1 0.2Intermediate & other goods 114,533 105,681 106,492 0.8 -0.6Non-monetary gold 3,736 4,973 6,131 23.3 -1.9
Services imports 80,441 85,645 84,344 -1.5 4.1Manufacturing services on physical inputs owned by others 0 0 0 .. ..Maintenance & repair services nie 424 554 741 33.8 7.2Transport 16,952 17,406 16,357 -6.0 0.5Travel 37,389 40,552 42,083 3.8 5.1Other 25,676 27,133 25,163 -7.3 4.9
(a) Balance of payments basis.Based on ABS catalogue 5302.0.
% growth
TABLE 2: AUSTRALIA'S TRADE IN GOODS AND SERVICES (a)CURRENT PRICE
(A$ million)
Exports% growth
Imports

Page 30
2015-16 to 5 year2014-15 2015-16 2016-17 2016-17 trend
Total goods & services exports 298,998 319,524 336,808 5.4 6.2Goods exports 229,235 244,147 255,778 4.8 6.1
General merchandise 213,794 225,846 236,344 4.6 6.1Rural goods 43,405 43,155 48,204 11.7 3.2
Meat & meat preparations 13,276 12,256 10,672 -12.9 2.8Cereal grains & cereal preparations 8,678 7,986 11,310 41.6 0.6Wool & sheepskins 3,745 3,283 3,581 9.1 1.3Other rural 17,763 19,630 22,640 15.3 5.8
Non-rural goods 170,784 182,690 188,141 3.0 6.6Minerals and fuels 118,212 126,650 133,347 5.3 8.4
Metal ores & minerals 64,669 69,236 70,172 1.4 10.3Coal, coke & briquettes 34,430 34,544 34,192 -1.0 6.3Other mineral fuels 19,113 22,870 28,983 26.7 6.6
Manufactures 42,712 44,611 43,689 -2.1 -0.0Metals (excl non-monetary gold) 9,189 10,181 9,133 -10.3 -2.2Machinery 10,722 10,491 9,936 -5.3 -1.9Transport equipment 5,509 5,436 5,316 -2.2 4.8Other manufactures 17,292 18,503 19,304 4.3 1.0
Other non-rural (incl sugar & beverages) 9,335 9,933 9,540 -4.0 -0.1Goods procured in ports by carriers 1,350 1,498 1,564 4.4 5.5
Net exports of goods under merchanting 378 406 370 -8.9 26.1Non-monetary gold 14,762 17,896 19,064 6.5 5.6
Services exports 69,665 75,378 81,030 7.5 6.4Manufacturing services on physical inputs owned by others 10 17 21 23.5 25.6Maintenance & repair services nie 64 72 61 -15.3 4.2Transport 6,727 6,931 7,601 9.7 2.0Travel 43,081 47,729 52,081 9.1 7.7Other 19,778 20,627 21,266 3.1 5.2
2015-16 to 5 year2014-15 2015-16 2016-17 2016-17 trend
Total goods & services imports 357,603 357,121 374,218 4.8 0.4Goods imports 271,029 271,477 286,185 5.4 0.7
General merchandise 267,189 266,502 280,286 5.2 0.8Consumption goods 92,099 96,637 100,163 3.6 3.4Capital goods 68,710 64,183 71,644 11.6 -3.5Intermediate & other goods 106,384 105,682 108,479 2.6 1.2Non-monetary gold 3,822 4,973 5,900 18.6 1.8
Services imports 86,628 85,646 88,032 2.8 -0.9Manufacturing services on physical inputs owned by others 0 0 0 .. ..Maintenance & repair services nie 470 554 773 39.5 0.4Transport 17,248 17,406 16,787 -3.6 -1.0Travel 40,414 40,552 43,952 8.4 -0.4Other 28,545 27,133 26,518 -2.3 -1.5
(a) Balance of payments basis. (b) Reference year for chain volume measures is 2015-16.Based on ABS catalogue 5302.0.
% growth
TABLE 3: AUSTRALIA'S TRADE IN GOODS AND SERVICES (a)CHAIN VOLUME MEASURES (b)
(A$ million)
Exports% growth
Imports

Page 31
% growth% share 2015-16 to 5 year
Rank Commodity 2014-15 2015-16 2016-17 2016-17 2016-17 trendTotal (b) 324,491 319,524 373,240 16.8 2.4
1 Iron ores & concentrates 54,519 47,799 62,799 16.8 31.4 -2.42 Coal 37,882 34,541 54,267 14.5 57.1 0.73 Education-related travel services (c) 21,258 24,145 28,035 7.5 16.1 11.04 Natural gas 16,895 16,576 22,299 6.0 34.5 10.85 Personal travel (excl education) services 18,238 20,669 21,651 5.8 4.8 9.3
6 Gold 13,506 16,585 18,979 5.1 14.4 3.47 Aluminium ores & conc (incl alumina) 7,106 6,790 7,529 2.0 10.9 7.58 Beef, f.c.f. 9,040 8,495 7,115 1.9 -16.2 12.19 Wheat 5,528 5,096 6,073 1.6 19.2 -3.3
10 Crude petroleum 8,154 5,184 5,150 1.4 -0.7 -15.8
11 Professional services 4,967 5,018 4,840 1.3 -3.5 4.112 Copper ores & concentrates 5,242 4,664 4,551 1.2 -2.4 -3.513 Technical & other business services 3,369 3,805 4,194 1.1 10.2 1.914 Financial services 3,960 3,907 3,994 1.1 2.2 12.215 Meat (excl beef), f.c.f. 3,840 3,649 3,832 1.0 5.0 11.1
16 Telecom, computer & information services 2,890 3,243 3,282 0.9 1.2 10.717 Vegetables, f.c.f. 1,236 1,936 3,270 0.9 68.9 22.518 Aluminium 4,159 3,420 3,268 0.9 -4.4 -3.519 Wool & other animal hair (incl tops) 2,782 2,872 3,263 0.9 13.6 4.520 Copper 3,370 3,567 3,128 0.8 -12.3 -1.4
21 Business travel services 3,035 2,916 3,059 0.8 4.9 1.722 Other transport services (e) 2,657 2,694 2,884 0.8 7.1 5.223 Passenger transport services (f) 2,442 2,742 2,833 0.8 3.3 2.424 Alcoholic beverages 2,186 2,389 2,612 0.7 9.3 5.525 Other ores & concentrates (d) 4,845 3,455 2,594 0.7 -24.9 -8.4
Memorandum items
Education (g) 21,863 24,655 28,556 7.7 15.8 10.9
Tourism Satellite Account 30,949 34,561 37,200 10.0 7.6 7.5
(a) Goods trade is on a recorded trade basis, Services trade is on a balance of payments basis. (b) Balance of payments basis. (c) Includes student
expenditure on tuition fees and living expenses. (d) Other ores & concentrates - mainly of Lead, Zinc and Manganese ores & concentrates.
(e) Other transport services exports covers a range of services provided in Australian airports and ports, including Cargo & baggage handling services,
Agents fees associated with freight transportation and Airport & port charges. (f) Includes Related agency fees & commissions. (g) Education
includes Education-related travel services, Royalties on education services and Other education services.
nes - not elsewhere specified.
Based on ABS trade data on DFAT STARS database and ABS catalogue 5302.0 & 5429.0
TABLE 4: AUSTRALIA'S TOP 25 EXPORTS, GOODS & SERVICES (a)(A$ million)

Page 32
% growth% share 2015-16 to 5 year
Rank Commodity 2014-15 2015-16 2016-17 2016-17 2016-17 trendTotal (b) 349,160 357,121 362,244 1.4 2.4
1 Personal travel (excl education) services 33,291 36,426 37,582 10.4 3.2 5.62 Passenger motor vehicles 18,708 21,542 21,782 6.0 1.1 6.63 Refined petroleum 18,078 16,228 17,392 4.8 7.2 1.14 Telecom equipment & parts 11,041 11,781 11,967 3.3 1.6 7.75 Crude petroleum 14,710 7,625 8,583 2.4 12.6 -19.9
6 Freight transportation services 9,906 9,866 8,430 2.3 -14.6 -0.17 Goods vehicles 6,123 7,353 8,004 2.2 8.9 0.38 Computers 8,045 7,820 7,855 2.2 0.5 3.79 Medicaments (incl veterinary) 7,076 7,712 7,340 2.0 -4.8 -2.7
10 Gold 3,772 6,045 7,240 2.0 19.8 1.4
11 Passenger transport services (c) 6,320 6,453 6,789 1.9 5.2 -0.612 Professional services 5,243 5,784 5,716 1.6 -1.2 6.713 Ships, boats & floating structures (d) 968 922 4,801 1.3 420.6 6.514 Technical & other business services 5,828 5,829 4,644 1.3 -20.3 -1.815 Charges for intellectual property 4,489 4,759 4,297 1.2 -9.7 2.7
16 Furniture, mattresses & cushions 3,932 4,456 4,203 1.2 -5.7 9.817 Business travel services 3,789 3,781 4,118 1.1 8.9 1.018 Pharm products (excl medicaments) 2,718 3,340 3,931 1.1 17.7 12.919 Telecom, computer & information services 3,148 3,587 3,553 1.0 -0.9 13.120 Electrical machinery & parts, nes 3,186 3,364 3,382 0.9 0.5 6.5
21 Household-type equipment, nes 2,824 3,293 3,330 0.9 1.1 9.922 Plastic articles, nes 2,893 3,317 3,292 0.9 -0.7 10.823 Heating & cooling equipment & parts 4,578 5,089 3,232 0.9 -36.5 10.824 Prams, toys, games & sporting goods 2,880 3,188 3,207 0.9 0.6 7.625 Aircraft, spacecraft & parts (e) np 2,226 3,184 0.9 43.0 ..
Memorandum items
Education (f) 423 455 505 0.1 11.0 3.4
Tourism Satellite Account 43,487 46,766 48,610 13.4 3.9 4.2
(a) Goods trade is on a recorded trade basis, Services trade is on a balance of payments basis. (b) Balance of payments basis. (c) Includes
Related agency fees & commissions. (d) DFAT estimate for 2016-17 only. (e) Excludes imports of large aircraft which are confidential in ABS statistics.
Imports of aircraft would rank higher in Australia's top 25 imports. DFAT estimates that aircraft imports were valued at around $3.9 billion in 2016.
(f) Education includes Education-related travel services, Royalties on education services and Other education services.
nes - not elsewhere specified.
Based on ABS trade data on DFAT STARS database and ABS catalogue 5302.0 & 5429.0
TABLE 5: AUSTRALIA'S TOP 25 IMPORTS, GOODS & SERVICES (a)(A$ million)

Page 33
% growth% share 2015-16 to 5 year
2014-15 2015-16 2016-17 2016-17 2016-17 trend
New South Wales 70,539 73,662 83,312 22.3 13.1 4.1Victoria 43,729 44,824 48,305 12.9 7.8 6.1Queensland 61,737 64,126 83,646 22.4 30.4 5.5South Australia 14,086 14,812 14,921 4.0 0.7 2.2Western Australia 121,369 110,443 130,879 35.1 18.5 -0.9Tasmania 3,609 3,914 4,149 1.1 6.0 2.4Northern Territory 7,811 5,893 6,055 1.6 2.7 -7.5Australian Capital Territory 1,611 1,850 1,969 0.5 6.4 7.6Unallocated 0 0 4 .. .. ..
Total exports (b) 324,491 319,524 373,240 100.0 16.8 2.4
% growth% share 2015-16 to 5 year
2014-15 2015-16 2016-17 2016-17 2016-17 trend
New South Wales 69,053 73,662 75,872 22.5 3.0 5.3Victoria 43,577 44,824 48,340 14.4 7.8 5.0Queensland 56,655 64,126 68,488 20.3 6.8 9.4South Australia 13,336 14,812 14,935 4.4 0.8 3.8Western Australia 105,065 110,443 117,874 35.0 6.7 6.4Tasmania 3,295 3,914 3,898 1.2 -0.4 3.7Northern Territory 6,353 5,893 5,663 1.7 -3.9 -3.7Australian Capital Territory 1,628 1,850 1,953 0.6 5.6 5.8Unallocated 36 0 -215 .. .. ..
Total exports (b) 298,998 319,524 336,808 100.0 5.4 6.2
% growth2015-16 to 5 year
2014-15 2015-16 2016-17 2016-17 trend
New South Wales 102.2 100.0 109.8 9.8 -1.1Victoria 100.3 100.0 99.9 -0.1 1.1Queensland 109.0 100.0 122.1 22.1 -3.5South Australia 105.6 100.0 99.9 -0.1 -1.5Western Australia 115.5 100.0 111.0 11.0 -6.9Tasmania 109.5 100.0 106.4 6.4 -1.3Northern Territory 122.9 100.0 106.9 6.9 -4.0Australian Capital Territory 99.0 100.0 100.8 0.8 1.7
Total exports (b) 108.5 100.0 110.8 10.8 -3.6(a) Total exports (includes Australian produced goods and re-exports) for each State/Territory. (b) Includes some confidential and miscellaneousitems not included in State and Territory totals. (c) Reference year for chain volume measures is 2015-16.Based on ABS catalogue 5220.0
Implicit price deflators (IPDs)
TABLE 6: AUSTRALIA'S EXPORTS OF GOODS AND SERVICESSTATE AND TERRITORY (a)
BALANCE OF PAYMENTS BASIS(A$ million)
Current prices
Chain volume measures (b)

Page 34
% growth% share 2015-16 to 5 year
2014-15 2015-16 2016-17 2016-17 2016-17 trend
New South Wales 133,463 142,679 145,638 40.2 2.1 4.8Victoria 90,162 95,317 95,546 26.4 0.2 4.2Queensland 51,203 51,679 53,784 14.8 4.1 -2.3South Australia 11,828 12,362 13,196 3.6 6.7 4.1Western Australia 53,615 47,504 45,021 12.4 -5.2 -2.0Tasmania 1,477 1,486 1,700 0.5 14.4 1.6Northern Territory (b) 5,272 3,804 4,482 1.2 17.8 -3.4Australian Capital Territory 2,140 2,290 2,503 0.7 9.3 5.8Unallocated 0 0 374 .. .. ..
Total imports (a) 349,160 357,121 362,244 100.0 1.4 2.4
% growth% share 2015-16 to 5 year
2014-15 2015-16 2016-17 2016-17 2016-17 trend
New South Wales 138,502 142,679 151,735 40.5 6.3 2.2Victoria 93,560 95,317 98,692 26.4 3.5 1.4Queensland 51,317 51,679 54,954 14.7 6.3 -3.2South Australia 12,038 12,362 13,562 3.6 9.7 2.1Western Australia 53,411 47,504 45,736 12.2 -3.7 -2.8Tasmania 1,465 1,486 1,747 0.5 17.6 -0.1Northern Territory (b) 4,645 3,804 4,798 1.3 26.1 -0.0Australian Capital Territory 2,297 2,290 2,615 0.7 14.2 1.0Unallocated 368 0 379 .. .. ..
Total imports (a) 357,603 357,121 374,218 100.0 4.8 0.4
% growth2015-16 to 5 year
2014-15 2015-16 2016-17 2016-17 trend
New South Wales 96.4 100.0 96.0 -4.0 2.5Victoria 96.4 100.0 96.8 -3.2 2.7Queensland 99.8 100.0 97.9 -2.1 1.0South Australia 98.3 100.0 97.3 -2.7 2.0Western Australia 100.4 100.0 98.4 -1.6 0.8Tasmania 100.8 100.0 97.3 -2.7 1.7Northern Territory (b) 113.5 100.0 93.4 -6.6 -3.4Australian Capital Territory 93.2 100.0 95.7 -4.3 4.8
Total imports (a) 97.6 100.0 96.8 -3.2 2.0(a) Includes some confidential and miscellaneous items not included in State and Territory totals. (b) Excludes imports of Natural gas fromDecember 2013 onwards. (c) Reference year for chain volume measures is 2015-16.Based on ABS catalogue 5220.0
Implicit price deflators (IPDs)
TABLE 7: AUSTRALIA'S IMPORTS OF GOODS AND SERVICESSTATE AND TERRITORY (a)
BALANCE OF PAYMENTS BASIS(A$ million)
Current prices
Chain volume measures (b)

Page 35
Section 2
Direction of Australia's tradein goods and services

Page 36
Country 1996 Rank % share 2006 Rank % share 2016 Rank % share
World 6,723,310 15,125,780 20,864,300China 171,649 11 2.6 1,063,049 3 7.0 2,306,120 1 11.1United States 864,564 1 12.9 1,442,705 1 9.5 2,203,422 2 10.6Germany 610,225 2 9.1 1,289,636 2 8.5 1,610,591 3 7.7Japan 478,614 3 7.1 756,112 4 5.0 818,721 4 3.9Netherlands 259,006 7 3.9 463,629 8 3.1 751,211 5 3.6France 389,047 4 5.8 661,288 6 4.4 737,980 6 3.5United Kingdom 347,102 5 5.2 719,766 5 4.8 737,009 7 3.5Hong Kong (SAR of China) 217,813 9 3.2 377,114 12 2.5 615,166 8 2.9Republic of Korea 153,932 13 2.3 382,678 11 2.5 588,254 9 2.8Italy 322,333 6 4.8 519,305 7 3.4 563,065 10 2.7Belgium - - - 429,115 10 2.8 509,051 11 2.4Singapore 153,998 12 2.3 331,022 14 2.2 487,724 12 2.3Canada 230,876 8 3.4 454,486 9 3.0 471,258 13 2.3India 40,343 31 0.6 191,248 20 1.3 426,247 14 2.0Switzerland 106,491 17 1.6 219,187 19 1.4 417,257 15 2.0Spain 151,666 14 2.3 317,167 15 2.1 415,883 16 2.0Mexico 106,723 16 1.6 265,869 16 1.8 398,027 17 1.9Russian Federation 103,235 18 1.5 339,270 13 2.2 332,355 18 1.6United Arab Emirates 38,652 32 0.6 152,435 29 1.0 329,317 19 1.6Taiwan 133,591 15 2.0 242,797 17 1.6 321,764 20 1.5Thailand 72,728 23 1.1 154,333 27 1.0 281,837 21 1.4Ireland 54,086 28 0.8 175,074 24 1.2 275,650 22 1.3Poland 34,184 35 0.5 133,352 31 0.9 251,537 23 1.2Australia 79,830 22 1.2 159,886 25 1.1 250,644 24 1.2Malaysia 93,462 20 1.4 181,830 23 1.2 223,339 25 1.1
World 6,862,630 15,381,300 21,026,410United States 974,578 1 14.2 2,070,630 1 13.5 2,753,207 1 13.1China 161,418 12 2.4 814,046 3 5.3 2,040,939 2 9.7Germany 588,919 2 8.6 1,036,504 2 6.7 1,367,565 3 6.5United Kingdom 359,881 5 5.2 685,220 5 4.5 835,062 4 4.0France 361,825 4 5.3 609,184 6 4.0 808,635 5 3.8Japan 476,905 3 6.9 706,817 4 4.6 792,313 6 3.8Netherlands 237,055 7 3.5 462,964 8 3.0 674,525 7 3.2Hong Kong (SAR of China) 225,818 8 3.3 360,288 10 2.3 621,797 8 3.0Republic of Korea 180,120 10 2.6 339,164 13 2.2 516,628 9 2.5Canada 211,064 9 3.1 394,906 9 2.6 513,980 10 2.4Italy 276,272 6 4.0 510,564 7 3.3 508,650 11 2.4India 49,113 29 0.7 189,581 17 1.2 493,484 12 2.3Belgium - - - 351,635 12 2.3 480,054 13 2.3Singapore 153,810 13 2.2 261,182 15 1.7 447,489 14 2.1Mexico 102,797 16 1.5 274,294 14 1.8 429,441 15 2.0Spain 145,212 14 2.1 352,687 11 2.3 382,288 16 1.8Switzerland 90,942 19 1.3 154,118 21 1.0 365,320 17 1.7United Arab Emirates 37,693 36 0.5 107,188 28 0.7 308,213 18 1.5Taiwan 127,460 15 1.9 227,079 16 1.5 282,975 19 1.3Ireland 47,745 31 0.7 86,543 33 0.6 270,727 20 1.3Russian Federation 87,466 21 1.3 183,655 18 1.2 265,967 21 1.3Australia 80,474 23 1.2 156,121 20 1.0 260,831 22 1.2Thailand 91,917 18 1.3 148,358 22 1.0 236,384 23 1.1Poland 43,476 32 0.6 133,330 26 0.9 231,147 24 1.1Turkey 50,054 28 0.7 146,002 25 0.9 220,833 25 1.1Sources: World Trade Organization online statistics database and ABS data on dX database.
TABLE 8: AUSTRALIA'S RANK INWORLD GOODS AND SERVICES EXPORTS AND IMPORTS
(US$ million)
Exports
Imports

Page 37
% growth% share 2015-16 to 5 year
Rank 2014-15 2015-16 2016-17 of total 2016-17 trend1 China 144,953 152,445 174,714 23.8 14.6 6.32 Japan 67,929 60,748 68,608 9.3 12.9 -2.83 United States (c) 66,173 70,833 66,490 9.0 -6.1 3.94 Republic of Korea 35,776 34,172 38,766 5.3 13.4 2.95 United Kingdom 22,820 28,270 27,462 3.7 -2.9 2.96 New Zealand 24,452 25,289 26,810 3.6 6.0 4.37 India 18,448 19,969 25,690 3.5 28.6 6.18 Singapore 28,246 23,204 24,693 3.4 6.4 -4.19 Thailand 20,489 21,540 21,805 3.0 1.2 3.5
10 Germany 17,798 19,997 20,599 2.8 3.0 4.911 Malaysia 20,070 18,383 19,661 2.7 7.0 2.212 Hong Kong (SAR of China) 15,563 15,680 19,579 2.7 24.9 9.913 Indonesia 15,581 16,111 16,390 2.2 1.7 1.214 Taiwan 13,009 12,453 14,685 2.0 17.9 1.415 Vietnam 10,579 10,512 11,846 1.6 12.7 11.9
Total all countries 673,651 676,645 735,484 8.7 2.4 of which: APEC (c) 487,326 485,105 528,666 71.9 9.0 2.9
ASEAN 100,871 95,343 100,560 13.7 5.5 1.4European Union (d)(e) 88,411 98,235 99,555 13.5 1.3 2.7G20 459,725 475,172 513,225 69.8 8.0 3.2OECD (c)(e) 301,622 309,754 321,067 43.7 3.7 1.7
% growth% share 2015-16 to 5 year
Rank 2014-15 2015-16 2016-17 of total 2016-17 trend1 China 85,438 88,213 110,427 29.6 25.2 5.02 Japan 46,633 38,172 44,613 12.0 16.9 -4.83 Republic of Korea 20,660 20,013 22,769 6.1 13.8 -1.54 United States 20,665 22,065 20,758 5.6 -5.9 8.15 India 12,933 13,344 19,214 5.1 44.0 3.56 Hong Kong (SAR of China) 11,454 11,534 15,792 4.2 36.9 11.97 New Zealand 12,570 13,018 14,038 3.8 7.8 5.08 United Kingdom 8,985 12,557 12,616 3.4 0.5 2.59 Singapore 12,321 9,992 11,216 3.0 12.3 2.0
10 Taiwan 7,883 7,649 9,961 2.7 30.2 0.011 Malaysia 8,367 7,583 8,313 2.2 9.6 3.812 Indonesia 7,034 7,003 8,225 2.2 17.5 4.513 Vietnam 4,647 5,005 5,712 1.5 14.1 15.314 Thailand 6,123 4,693 5,119 1.4 9.1 -5.215 Germany 2,940 3,707 4,300 1.2 16.0 4.9
Total all countries 324,491 319,524 373,240 16.8 2.4 of which: APEC 253,129 244,437 286,918 76.9 17.4 2.3
ASEAN 41,378 37,284 42,305 11.3 13.5 3.5European Union (d) 23,643 27,781 30,540 8.2 9.9 1.6G20 227,631 227,053 267,375 71.6 17.8 1.8OECD 130,109 128,101 140,251 37.6 9.5 -0.1
TABLE 9: AUSTRALIA'S TRADE IN GOODS AND SERVICES (a) (b) BY TOP 15 PARTNERS
(A$ million)
Australia's top two-way trading partners
Australia's top export markets

Page 38
% growth% share 2015-16 to 5 year
Rank 2014-15 2015-16 2016-17 of total 2016-17 trend1 China 59,515 64,232 64,287 17.7 0.1 8.52 United States (c) 45,508 48,768 45,732 12.6 -6.2 2.33 Japan 21,297 22,575 23,994 6.6 6.3 1.64 Thailand 14,366 16,847 16,686 4.6 -1.0 7.35 Germany 14,858 16,290 16,300 4.5 0.1 4.96 Republic of Korea 15,116 14,159 15,996 4.4 13.0 11.37 United Kingdom 13,834 15,713 14,846 4.1 -5.5 3.38 Singapore 15,925 13,212 13,477 3.7 2.0 -7.99 New Zealand 11,882 12,271 12,772 3.5 4.1 3.6
10 Malaysia 11,703 10,800 11,347 3.1 5.1 1.111 Indonesia 8,547 9,109 8,165 2.3 -10.4 -1.412 Italy 7,645 7,802 7,980 2.2 2.3 3.713 France (c) 6,418 6,985 6,640 1.8 -4.9 0.914 India 5,514 6,625 6,477 1.8 -2.2 14.915 Vietnam 5,932 5,507 6,134 1.7 11.4 9.3
Total all countries 349,160 357,121 362,244 1.4 2.4 of which: APEC (c) 234,197 240,668 241,749 66.7 0.4 3.5
ASEAN 59,493 58,059 58,255 16.1 0.3 0.1European Union (d)(e) 64,768 70,454 69,015 19.1 -2.0 3.2G20 232,093 248,119 245,850 67.9 -0.9 4.6OECD (c)(e) 171,513 181,653 180,815 49.9 -0.5 3.2
(a) All data is on a balance of payments basis, except for goods by country which are on a recorded trade basis. (b) May exclude selectedconfidential export or import commodities from partner country totals as well as for the country groups. Refer to the DFAT website(http://dfat.gov.au/about-us/publications/trade-investment/Pages/dfat-adjustments-to-abs-official-trade-data.aspx) for more informationand a list of the commodities excluded. (c) Includes DFAT estimate for the United States for 2016-17. (d) Services data is EU27 to August 2013,EU28 from September 2013. (e) Includes DFAT estimate for France from 2010-11 to 2016-17.Based on DFAT STARS database, ABS catalogues 5302.0 & 536830.55.003/4 and unpublished ABS data.
BY TOP 15 PARTNERS (cont'd)(A$ million)
Australia's top import sources
TABLE 9: AUSTRALIA'S TRADE IN GOODS AND SERVICES (a) (b)

Page 39
% share 2015-16 to 5 yearSelected countries 2014-15 2015-16 2016-17 of total 2016-17 trendArgentina 1,146 1,223 1,211 0.2 0.3 1.7Belgium & Luxembourg 3,106 3,038 3,583 0.5 0.1 -1.8Brazil 2,731 2,570 3,313 0.5 0.2 6.6Brunei 932 467 432 0.1 0.7 -22.5Canada 6,082 6,612 6,769 0.9 0.1 3.1Chile 1,626 1,362 1,425 0.2 0.2 -9.2China 144,953 152,445 174,714 23.8 0.0 6.3Fiji 2,023 2,118 2,138 0.3 0.2 4.6France 8,437 9,081 8,977 1.2 0.0 1.6Germany 17,798 19,997 20,599 2.8 0.0 4.9Greece 1,335 1,221 992 0.1 0.3 -0.3Hong Kong (SAR of China) 15,563 15,680 19,579 2.7 0.0 9.9India 18,448 19,969 25,690 3.5 0.0 6.1Indonesia 15,581 16,111 16,390 2.2 0.0 1.2Ireland 3,609 4,235 3,880 0.5 0.1 1.9Italy 8,996 9,176 9,380 1.3 0.0 3.0Japan 67,929 60,748 68,608 9.3 0.0 -2.8Malaysia 20,070 18,383 19,661 2.7 0.0 2.2Mexico 2,978 3,291 3,135 0.4 0.0 1.6Netherlands 6,254 6,147 7,063 1.0 0.1 -0.5New Zealand 24,452 25,289 26,810 3.6 0.1 4.3Norway 1,281 1,213 1,043 0.1 0.0 -3.3Papua New Guinea 6,461 5,894 6,062 0.8 0.3 -3.6Peru 456 543 646 0.1 0.1 9.4Philippines 4,114 4,167 4,843 0.7 1.0 8.2Republic of Korea 35,776 34,172 38,766 5.3 0.1 2.9Russian Federation 1,525 990 985 0.1 0.4 -16.7Saudi Arabia 2,958 2,887 2,395 0.3 0.1 -1.0Singapore 28,246 23,204 24,693 3.4 0.0 -4.1South Africa 3,350 3,288 3,266 0.4 0.1 -1.1Sweden 2,741 3,056 3,222 0.4 0.1 -0.2Switzerland 5,343 5,974 6,102 0.8 0.1 3.3Taiwan 13,009 12,453 14,685 2.0 0.0 1.4Thailand 20,489 21,540 21,805 3.0 0.0 3.5Turkey 1,683 1,798 1,939 0.3 0.2 4.0United Arab Emirates 9,193 8,012 7,972 1.1 0.0 -1.0United Kingdom 22,820 28,270 27,462 3.7 0.0 2.9United States 66,173 70,833 66,490 9.0 0.0 3.9Vietnam 10,579 10,512 11,846 1.6 0.0 11.9Country Groups (c)APEC 487,326 485,105 528,666 71.9 0.0 2.9ASEAN 100,871 95,343 100,560 13.7 0.0 1.4European Union (d) 88,411 98,235 99,555 13.5 0.0 2.7G20 459,725 475,172 513,225 69.8 0.0 3.2OECD 301,622 309,754 321,067 43.7 0.0 1.7Geographic Regions (c)Africa 8,813 7,676 8,504 1.2 0.0 -9.5Americas 83,822 89,102 85,674 11.6 0.0 3.6Asia 422,041 415,963 468,076 63.6 0.0 3.1Europe 99,077 109,150 110,522 15.0 0.0 2.3Oceania & Antarctica 35,228 35,499 36,986 5.0 0.0 2.4Other (e) 24,669 19,255 25,722 3.5 -0.0 -6.6World 673,651 676,645 735,484 0.0 2.4(a) All data is on a balance of payments basis, except for goods by country which are on a recorded trade basis. (b) May exclude selectedconfidential export/import commodities from partner country totals as well as for the country groups. Therefore movements in theconfidentialised country totals may not reflect the true pattern of trade. Refer to Appendix G for details on all DFAT adjustments to ABSofficial trade data. (c) Refer to the Explanatory notes for country group definitions. (d) Services data is EU27 to August 2013, EU28 fromSeptember 2013. (e) Includes unallocated and confidential trade.Based on ABS catalogues 5368.0 & 5368.0.55.003/4 and unpublished ABS data.
TABLE 10: AUSTRALIA'S TOTAL TRADE IN GOODS AND SERVICES (a) (b)BY SELECTED COUNTRIES AND REGIONS
(A$ million)
% growth

Page 40
% share 2015-16 to 5 yearSelected countries 2014-15 2015-16 2016-17 of total 2016-17 trendArgentina 266 325 356 0.1 9.4 -0.1Belgium & Luxembourg 1,282 1,183 1,473 0.4 24.5 -6.3Brazil 1,963 1,718 2,375 0.6 38.2 8.5Brunei 100 109 103 0.0 -5.6 3.0Canada 2,394 2,665 2,732 0.7 2.5 2.3Chile 458 581 674 0.2 15.9 -0.2China 85,438 88,213 110,427 29.6 25.2 5.0Fiji 523 594 625 0.2 5.2 7.8France 2,019 2,096 2,337 0.6 11.5 4.2Germany 2,940 3,707 4,300 1.2 16.0 4.9Greece 98 101 115 0.0 14.2 2.7Hong Kong (SAR of China) 11,454 11,534 15,792 4.2 36.9 11.9India 12,933 13,344 19,214 5.1 44.0 3.5Indonesia 7,034 7,003 8,225 2.2 17.5 4.5Ireland 605 636 595 0.2 -6.5 -5.6Italy 1,351 1,374 1,400 0.4 1.9 -0.0Japan 46,633 38,172 44,613 12.0 16.9 -4.8Malaysia 8,367 7,583 8,313 2.2 9.6 3.8Mexico 570 711 407 0.1 -42.7 -12.8Netherlands 2,821 2,654 3,658 1.0 37.8 -1.8New Zealand 12,570 13,018 14,038 3.8 7.8 5.0Norway 455 323 337 0.1 4.4 -5.0Papua New Guinea 2,608 2,144 2,204 0.6 2.8 -8.4Peru 157 144 122 0.0 -15.7 -11.3Philippines 2,377 2,464 3,165 0.8 28.4 8.0Republic of Korea 20,660 20,013 22,769 6.1 13.8 -1.5Russian Federation 668 678 566 0.2 -16.4 -11.5Saudi Arabia 2,520 2,350 1,878 0.5 -20.1 -1.8Singapore 12,321 9,992 11,216 3.0 12.3 2.0South Africa 1,658 1,428 1,513 0.4 6.0 -6.9Sweden 555 596 629 0.2 5.4 0.4Switzerland 1,538 1,998 2,142 0.6 7.2 7.2Taiwan 7,883 7,649 9,961 2.7 30.2 0.0Thailand 6,123 4,693 5,119 1.4 9.1 -5.2Turkey 586 589 1,003 0.3 70.2 -1.3United Arab Emirates 3,961 3,772 3,833 1.0 1.6 8.3United Kingdom 8,985 12,557 12,616 3.4 0.5 2.5United States 20,665 22,065 20,758 5.6 -5.9 8.1Vietnam 4,647 5,005 5,712 1.5 14.1 15.3Country Groups (c)APEC 253,129 244,437 286,918 76.9 17.4 2.3ASEAN 41,378 37,284 42,305 11.3 13.5 3.5European Union (d) 23,643 27,781 30,540 8.2 9.9 1.6G20 227,631 227,053 267,375 71.6 17.8 1.8OECD 130,109 128,101 140,251 37.6 9.5 -0.1Geographic Regions (c)Africa 4,309 3,944 4,151 1.1 5.2 -4.0Americas 27,661 29,428 28,761 7.7 -2.3 6.7Asia 241,524 231,454 280,544 75.2 21.2 2.3Europe 27,209 31,745 35,083 9.4 10.5 1.5Oceania & Antarctica 16,944 17,046 18,061 4.8 6.0 2.6Other (e) 6,843 5,907 6,640 1.8 12.4 -0.7World 324,491 319,524 373,240 16.8 2.4(a) All data is on a balance of payments basis, except for goods by country which are on a recorded trade basis. (b) May exclude selectedconfidential export commodities from partner country totals as well as for the country groups. Therefore movements in the confidentialisedcountry totals may not reflect the true pattern of trade. Refer to Appendix G for details on all DFAT adjustments to ABS official trade data.(c) Refer to the Explanatory notes for country group definitions. (d) Services data is EU27 to August 2013, EU28 from September 2013.(e) Includes unallocated and confidential trade.Based on ABS catalogues 5368.0 & 5368.0.55.003/4 and unpublished ABS data.
TABLE 11: AUSTRALIA'S EXPORTS OF GOODS AND SERVICES (a) (b)BY SELECTED COUNTRIES AND REGIONS
(A$ million)
% growth

Page 41
% share 2015-16 to 5 yearSelected countries 2014-15 2015-16 2016-17 of total 2016-17 trendArgentina 880 898 855 0.2 -4.8 2.7Belgium & Luxembourg 1,824 1,855 2,111 0.6 13.7 2.1Brazil 767 852 938 0.3 10.1 2.6Brunei 832 358 329 0.1 -8.0 -26.0Canada 3,688 3,947 4,037 1.1 2.3 3.6Chile 1,167 781 751 0.2 -3.8 -14.2China 59,515 64,232 64,287 17.7 0.1 8.5Fiji 1,500 1,524 1,513 0.4 -0.7 3.4France 6,418 6,985 6,640 1.8 -4.9 0.9Germany 14,858 16,290 16,300 4.5 0.1 4.9Greece 1,237 1,120 877 0.2 -21.7 -0.6Hong Kong (SAR of China) 4,109 4,146 3,788 1.0 -8.6 3.8India 5,514 6,625 6,477 1.8 -2.2 14.9Indonesia 8,547 9,109 8,165 2.3 -10.4 -1.4Ireland 3,004 3,599 3,286 0.9 -8.7 3.7Italy 7,645 7,802 7,980 2.2 2.3 3.7Japan 21,297 22,575 23,994 6.6 6.3 1.6Malaysia 11,703 10,800 11,347 3.1 5.1 1.1Mexico 2,408 2,581 2,728 0.8 5.7 6.3Netherlands 3,433 3,492 3,405 0.9 -2.5 0.7New Zealand 11,882 12,271 12,772 3.5 4.1 3.6Norway 825 890 706 0.2 -20.7 -2.5Papua New Guinea 3,853 3,750 3,858 1.1 2.9 -0.1Peru 299 399 525 0.1 31.4 23.2Philippines 1,736 1,702 1,678 0.5 -1.4 8.6Republic of Korea 15,116 14,159 15,996 4.4 13.0 11.3Russian Federation 857 312 419 0.1 34.3 -22.7Saudi Arabia 438 538 517 0.1 -3.9 2.4Singapore 15,925 13,212 13,477 3.7 2.0 -7.9South Africa 1,692 1,860 1,753 0.5 -5.7 5.5Sweden 2,185 2,460 2,593 0.7 5.4 -0.3Switzerland 3,805 3,976 3,960 1.1 -0.4 1.6Taiwan 5,126 4,804 4,725 1.3 -1.7 4.0Thailand 14,366 16,847 16,686 4.6 -1.0 7.3Turkey 1,097 1,209 937 0.3 -22.5 8.2United Arab Emirates 5,232 4,240 4,139 1.1 -2.4 -6.8United Kingdom 13,834 15,713 14,846 4.1 -5.5 3.3United States 45,508 48,768 45,732 12.6 -6.2 2.3Vietnam 5,932 5,507 6,134 1.7 11.4 9.3Country Groups (c)APEC 234,197 240,668 241,749 66.7 0.4 3.5ASEAN 59,493 58,059 58,255 16.1 0.3 0.1European Union (d) 64,768 70,454 69,015 19.1 -2.0 3.2G20 232,093 248,119 245,850 67.9 -0.9 4.6OECD 171,513 181,653 180,815 49.9 -0.5 3.2Geographic Regions (c)Africa 4,504 3,732 4,353 1.2 16.7 -13.6Americas 56,161 59,674 56,913 15.7 -4.6 2.2Asia 180,517 184,509 187,531 51.8 1.6 4.2Europe 71,869 77,405 75,440 20.8 -2.5 2.8Oceania & Antarctica 18,283 18,453 18,925 5.2 2.6 2.3Other (e) 17,826 13,348 19,082 5.3 43.0 -8.5World 349,160 357,121 362,244 1.4 2.4(a) All data is on a balance of payments basis, except for goods by country which are on a recorded trade basis. (b) May exclude selectedconfidential import commodities from partner country totals as well as for the country groups. Therefore movements in the confidentialisedcountry totals may not reflect the true pattern of trade. Refer to Appendix G for details on all DFAT adjustments to ABS official trade data.(c) Refer to the Explanatory notes for country group definitions. (d) Services data is EU27 to August 2013, EU28 from September 2013.(e) Includes unallocated and confidential trade.Based on ABS catalogues 5368.0 & 5368.0.55.003/4 and unpublished ABS data.
TABLE 12: AUSTRALIA'S IMPORTS OF GOODS AND SERVICES (a) (b)BY SELECTED COUNTRIES AND REGIONS
(A$ million)
% growth

Page 42

Page 43
Section 3
Australia's trade in services

Page 44
TABLE 13: AUSTRALIA'S EXPORTS OF SERVICESBY TYPE OF ACTIVITY
2015-16 to 5 yearServices - Type of activity 2014-15 2015-16 2016-17 2016-17 trend
10 17 21 23.5 25.6Maintenance & repair services nie 64 72 61 -15.3 5.3Transport services 6,634 6,931 7,533 8.7 3.7
Passenger (a) 2,442 2,742 2,833 3.3 2.4Freight 241 285 296 3.9 -6.4Other transport 2,657 2,694 2,884 7.1 5.2Postal & courier services (b) 1,294 1,210 1,520 25.6 6.5
Travel services 42,531 47,730 52,745 10.5 9.6Business 3,035 2,916 3,059 4.9 1.7Personal 39,496 44,814 49,686 10.9 10.2
Education-related 21,258 24,145 28,035 16.1 11.0Other personal travel (c) 18,238 20,669 21,651 4.8 9.3
Construction services 170 162 393 142.6 45.0Insurance & pension services 535 556 516 -7.2 3.4Financial services 3,960 3,907 3,994 2.2 12.2Charges for the use of intellectual property nie 1,021 1,064 1,247 17.2 8.6Telecom, computer & information services 2,890 3,243 3,282 1.2 10.7
Telecommunication 391 461 400 -13.2 8.3Computer & information 2,499 2,782 2,882 3.6 11.2
Computer 2,042 2,207 2,297 4.1 9.3Information 106 194 253 30.4 30.6Other computer & information 351 381 332 -12.9 15.3
Other business services 9,142 9,735 9,927 2.0 3.6Research & development 806 912 893 -2.1 9.2Professional & management consulting 4,967 5,018 4,840 -3.5 4.1
public relations & other professional 4,167 4,214 4,336 2.9 5.0 opinion polling 800 804 504 -37.3 -1.9
Technical, trade-related & other business 3369 3805 4,194 10.2 1.9Architectural, engineering & other technical 1552 1552 1,333 -14.1 -6.4 & mining 209 137 98 -28.5 -17.4Operational leasing 202 156 165 5.8 -11.6Trade-related 644 706 814 15.3 2.8Other business nie 762 1254 1,784 42.3 24.1
Personal, cultural & recreational services 998 940 861 -8.4 4.9Audiovisual & related 222 225 187 -16.9 2.6Other personal, cultural & recreational 776 715 674 -5.7 5.5
Government services nie 1012 1020 1,062 4.1 3.5Total Services 68,967 75,377 81,642 8.3 8.2(a) Passenger services includes Agency fees & commissions for air transport. (b) Postal & courier services includes Indirect commisions for seatransport. (c) Other personal travel includes Health-related travel.Based on ABS catalogue 5302.0. Refer to the section on data sources in the Explanatory notes .
(A$ million)
% growth
Manufacturing services on physical inputs owned by others
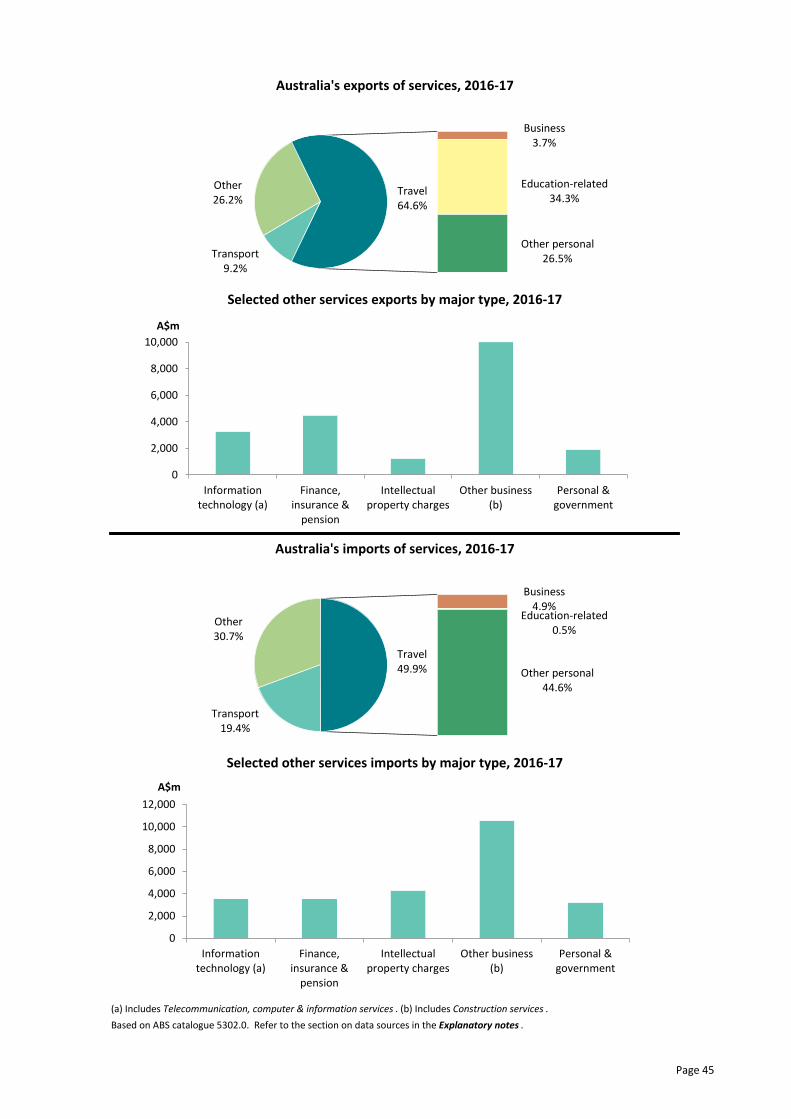
Page 45
Australia's exports of services, 2016-17
Selected other services exports by major type, 2016-17
Australia's imports of services, 2016-17
Selected other services imports by major type, 2016-17
(a) Includes Telecommunication, computer & information services . (b) Includes Construction services .Based on ABS catalogue 5302.0. Refer to the section on data sources in the Explanatory notes .
0
2000
4000
6000
8000
10000A$m
0
2000
4000
6000
8000
10000
12000
14000A$m
100.0%Other
100.0%
100.0%Other
100.0%
0
2,000
4,000
6,000
8,000
10,000
Informationtechnology (a)
Finance,insurance &
pension
Intellectualproperty charges
Other business(b)
Personal &government
A$m
0
2,000
4,000
6,000
8,000
10,000
12,000
14,000
Informationtechnology (a)
Finance,insurance &
pension
Intellectualproperty charges
Other business(b)
Personal &government
A$m
Transport19.4%
Other30.7%
Business4.9%
Education-related0.5%
Other personal44.6%
Travel44.4%
Transport9.2%
Other26.2%
Business3.7%
Education-related34.3%
Other personal26.5%
Travel61.1%
0
2000
4000
6000
8000
10000A$m
0
2000
4000
6000
8000
10000
12000
14000A$m
100.0%Other
100.0%
100.0%Other
100.0%
0
2,000
4,000
6,000
8,000
10,000
Informationtechnology (a)
Finance,insurance &
pension
Intellectualproperty charges
Other business(b)
Personal &government
A$m
0
2,000
4,000
6,000
8,000
10,000
12,000
Informationtechnology (a)
Finance,insurance &
pension
Intellectualproperty charges
Other business(b)
Personal &government
A$m
Transport19.4%
Other30.7%
Business4.9%
Education-related0.5%
Other personal44.6%
Travel49.9%
Transport9.2%
Other26.2%
Business3.7%
Education-related34.3%
Other personal26.5%
Travel64.6%

Page 46
TABLE 14: AUSTRALIA'S IMPORTS OF SERVICESBY TYPE OF ACTIVITY
2015-16 to 5 yearServices - Type of activity 2014-15 2015-16 2016-17 2016-17 trend
0 0 0 .. ..Maintenance & repair services nie 424 554 741 33.8 7.2Transport services 16952 17406 16,357 -6.0 0.5
Passenger (a) 6320 6453 6,789 5.2 -0.6Freight 9906 9866 8,430 -14.6 -0.1Other transport 632 985 1,028 4.4 21.8Postal & courier services (b) 94 102 110 7.8 1.2
Travel services 37389 40552 42,083 3.8 5.1Business 3789 3781 4,118 8.9 1.0Personal 33600 36771 37,965 3.2 5.6
Education-related 309 345 383 11.0 5.6Other personal travel (c) 33291 36426 37,582 3.2 5.6
Construction services 0 0 0 .. ..Insurance & pension services 742 771 701 -9.1 1.3Financial services 2866 2805 2,835 1.1 15.2Charges for the use of intellectual property nie 4489 4759 4,297 -9.7 2.7Telecom, computer & information services 3148 3587 3,553 -0.9 13.1
Telecommunication 559 706 799 13.2 22.6Computer & information 2589 2881 2,754 -4.4 11.1
Computer 2040 2190 2,075 -5.3 8.9Information 204 283 302 6.7 30.3Other computer & information 345 408 377 -7.6 14.3
Other business services 11301 11812 10,555 -10.6 2.0Research & development 230 199 195 -2.0 -9.6Professional & management consulting 5243 5784 5,716 -1.2 6.7
public relations & other professional 4845 5262 5,318 1.1 6.5 opinion polling 398 522 398 -23.8 9.4
Technical, trade-related & other business 5828 5829 4,644 -20.3 -1.8Architectural, engineering & other technical 3007 2869 2,099 -26.8 -4.6 & mining 523 361 128 -64.5 -15.5Operational leasing 328 421 406 -3.6 -10.7Trade-related 405 434 226 -47.9 1.8Other business nie 1565 1744 1,785 2.4 9.0
Personal, cultural & recreational services 1892 2042 1,839 -9.9 3.2Audiovisual & related 1542 1749 1,564 -10.6 4.6Other personal, cultural & recreational 350 293 275 -6.1 -3.0
Government services nie 1238 1357 1,383 1.9 8.5Total Services 80,441 85,645 84,344 -1.5 4.1(a) Passenger services includes Agency fees & commissions for air transport. (b) Postal & courier services includes Indirect commisions for seatransport. (c) Other personal travel includes Health-related travel.Based on ABS catalogue 5302.0. Refer to the section on data sources in the Explanatory notes .
(A$ million)
% growth
Manufacturing services on physical inputs owned by others

Page 47
% growth% share 2015-16 to 5 year
Rank 2014-15 2015-16 2016-17 of total 2016-17 trend1 United States 22,434 24,600 23,790 14.3 -3.3 6.02 China 12,450 15,639 17,492 10.5 11.8 15.43 United Kingdom 12,805 13,526 13,483 8.1 -0.3 5.24 Singapore 9,089 10,035 10,545 6.4 5.1 7.25 New Zealand 8,378 8,938 10,329 6.2 15.6 8.06 India 4,895 5,505 6,096 3.7 10.7 12.97 Hong Kong (SAR of China) 5,213 5,756 5,795 3.5 0.7 8.68 Japan 5,173 5,648 5,728 3.5 1.4 4.99 Indonesia 4,611 4,917 5,267 3.2 7.1 5.5
10 Germany 4,238 4,557 4,382 2.6 -3.8 6.911 Thailand 3,344 3,414 3,777 2.3 10.6 -1.112 Malaysia 3,609 3,165 3,337 2.0 5.4 0.413 Republic of Korea 2,823 3,163 3,257 2.0 3.0 5.214 Canada 2,413 2,628 3,012 1.8 14.6 5.515 France 2,746 3,248 2,976 1.8 -8.4 8.2
Total all countries 149,408 161,022 165,986 3.1 6.0 of which: APEC 87,113 95,812 100,564 60.6 5.0 7.1
ASEAN 25,196 26,379 27,901 16.8 5.8 4.7European Union (b) 31,553 32,997 31,566 19.0 -4.3 4.3G20 89,727 98,434 99,635 60.0 1.2 6.8OECD 75,825 81,166 80,881 48.7 -0.4 5.2
% growth% share 2015-16 to 5 year
Rank 2014-15 2015-16 2016-17 of total 2016-17 trend1 China 10,037 12,881 14,697 18.0 14.1 17.42 United States 7,308 8,353 8,456 10.4 1.2 8.73 Singapore 3,973 4,574 5,367 6.6 17.3 9.04 United Kingdom 5,303 5,397 5,315 6.5 -1.5 4.95 New Zealand 4,272 4,353 5,190 6.4 19.2 7.36 India 3,185 3,636 4,087 5.0 12.4 13.57 Hong Kong (SAR of China) 2,319 2,663 2,866 3.5 7.6 9.58 Japan 2,179 2,264 2,461 3.0 8.7 0.99 Malaysia 2,314 2,219 2,430 3.0 9.5 6.9
10 Republic of Korea 1,885 2,179 2,256 2.8 3.5 2.211 Germany 1,336 1,505 1,641 2.0 9.0 6.512 Indonesia 1,406 1,469 1,632 2.0 11.1 4.813 Vietnam 1,378 1,409 1,442 1.8 2.3 8.214 Taiwan 1,014 1,203 1,327 1.6 10.3 15.015 Thailand 1,113 1,122 1,215 1.5 8.3 6.8
Total all countries 68,967 75,377 81,642 8.3 8.2 of which: APEC 42,088 47,479 52,180 63.9 9.9 9.3
ASEAN 11,186 11,814 13,145 16.1 11.3 7.9European Union (b) 11,167 11,488 11,558 14.2 0.6 4.3G20 40,074 45,082 48,145 59.0 6.8 8.5OECD 29,471 31,205 32,516 39.8 4.2 5.2
TABLE 15: AUSTRALIA'S TRADE IN SERVICES (a)BY TOP 15 PARTNERS
(A$ million)
Australia's top services two-way trading partners
Australia's top services export markets

Page 48
% growth% share 2015-16 to 5 year
Rank 2014-15 2015-16 2016-17 of total 2016-17 trend1 United States 15,126 16,247 15,334 18.2 -5.6 4.62 United Kingdom 7,502 8,129 8,168 9.7 0.5 5.43 Singapore 5,116 5,461 5,178 6.1 -5.2 5.64 New Zealand 4,106 4,585 5,139 6.1 12.1 8.75 Indonesia 3,205 3,448 3,635 4.3 5.4 5.86 Japan 2,994 3,384 3,267 3.9 -3.5 8.57 Hong Kong (SAR of China) 2,894 3,093 2,929 3.5 -5.3 7.88 China 2,413 2,758 2,795 3.3 1.3 7.59 Germany 2,902 3,052 2,741 3.2 -10.2 7.0
10 Thailand 2,231 2,292 2,562 3.0 11.8 -4.011 United Arab Emirates 2,114 2,368 2,244 2.7 -5.2 1.912 France 1,817 2,282 2,064 2.4 -9.6 8.913 India 1,710 1,869 2,009 2.4 7.5 12.414 Canada 1,424 1,664 2,000 2.4 20.2 7.515 Italy 1,662 1,793 1,972 2.3 10.0 6.9
Total all countries 80,441 85,645 84,344 -1.5 4.1 of which: APEC 45,025 48,333 48,384 57.4 0.1 5.0
ASEAN 14,010 14,565 14,756 17.5 1.3 2.3European Union (b) 20,386 21,509 20,008 23.7 -7.0 4.4G20 49,653 53,352 51,490 61.0 -3.5 5.3OECD 46,354 49,961 48,365 57.3 -3.2 5.2
(a) Cells in this table may have been perturbed to protect confidentiality. (b) EU27 to August 2013, EU28 from September 2013.Based on ABS catalogue 5368.0.55.003/4 and unpublished ABS data.
BY TOP 15 PARTNERS (cont'd)(A$ million)
Australia's top services import sources
TABLE 15: AUSTRALIA'S TRADE IN SERVICES (a)

Page 49
% share 2015-16 to 5 yearSelected countries 2014-15 2015-16 2016-17 of total 2016-17 trendArgentina 142 173 195 0.1 12.7 -4.5Belgium & Luxembourg 280 343 444 0.3 29.4 4.9Brazil 895 886 1,036 0.6 16.9 11.9Brunei 116 138 109 0.1 -21.0 -1.6Canada 2,413 2,628 3,012 1.8 14.6 5.5Chile 439 483 475 0.3 -1.7 0.6China 12,450 15,639 17,492 10.5 11.8 15.4Fiji 1,517 1,512 1,545 0.9 2.2 4.3France 2,746 3,248 2,976 1.8 -8.4 8.2Germany 4,238 4,557 4,382 2.6 -3.8 6.9Greece 1,118 1,005 753 0.5 -25.1 -1.7Hong Kong (SAR of China) 5,213 5,756 5,795 3.5 0.7 8.6India 4,895 5,505 6,096 3.7 10.7 12.9Indonesia 4,611 4,917 5,267 3.2 7.1 5.5Ireland 1,731 1,780 1,468 0.9 -17.5 -3.9Italy 2,298 2,433 2,613 1.6 7.4 7.6Japan 5,173 5,648 5,728 3.5 1.4 4.9Malaysia 3,609 3,165 3,337 2.0 5.4 0.4Mexico 250 256 287 0.2 12.1 12.6Netherlands 1,849 1,753 1,541 0.9 -12.1 -4.7New Zealand 8,378 8,938 10,329 6.2 15.6 8.0Norway 738 801 662 0.4 -17.4 -2.7Papua New Guinea 1,057 941 874 0.5 -7.1 -4.0Peru 202 206 211 0.1 2.4 4.3Philippines 1,538 1,706 1,674 1.0 -1.9 8.8Republic of Korea 2,823 3,163 3,257 2.0 3.0 5.2Russian Federation 277 223 204 0.1 -8.5 -5.8Saudi Arabia 462 440 422 0.3 -4.1 -1.1Singapore 9,089 10,035 10,545 6.4 5.1 7.2South Africa 961 1,046 1,047 0.6 0.1 0.0Sweden 556 683 752 0.5 10.1 15.6Switzerland 1,869 1,730 1,817 1.1 5.0 4.5Taiwan 1,287 1,455 1,614 1.0 10.9 12.9Thailand 3,344 3,414 3,777 2.3 10.6 -1.1Turkey 388 313 236 0.1 -24.6 -6.1United Arab Emirates 2,796 3,057 2,965 1.8 -3.0 3.4United Kingdom 12,805 13,526 13,483 8.1 -0.3 5.2United States 22,434 24,600 23,790 14.3 -3.3 6.0Vietnam 2,412 2,502 2,787 1.7 11.4 7.5Country Groups (b)APEC 87,113 95,812 100,564 60.6 5.0 7.1ASEAN 25,196 26,379 27,901 16.8 5.8 4.7European Union (c) 31,553 32,997 31,566 19.0 -4.3 4.3G20 89,727 98,434 99,635 60.0 1.2 6.8OECD 75,825 81,166 80,881 48.7 -0.4 5.2Geographic Regions (b)Africa 2,298 2,576 2,707 1.6 5.1 2.2Americas 28,291 30,776 30,628 18.5 -0.5 6.3Asia 65,482 72,803 77,672 46.8 6.7 7.9Europe 35,413 36,682 34,923 21.0 -4.8 3.7Oceania & Antartica 12,092 12,533 13,815 8.3 10.2 5.8Other (d) 5,832 5,652 6,241 3.8 10.4 -1.2World 149,408 161,022 165,986 3.1 6.0(a) Cells in this table may have been perturbed to protect confidentiality. (b) Refer to the Explanatory notes for country groupings.(c) EU27 to August 2013, EU28 from September 2013. (d) Includes unallocated and confidential trade.Based on ABS catalogue 5368.0.55.003/4.
(A$ million)
% growth
TABLE 16: AUSTRALIA'S TOTAL TRADE IN SERVICES (a)BY SELECTED COUNTRIES AND REGIONS

Page 50
% share 2015-16 to 5 yearSelected countries 2014-15 2015-16 2016-17 of total 2016-17 trendArgentina 43 64 84 0.1 31.3 3.6Belgium & Luxembourg 139 144 210 0.3 45.8 -1.9Brazil 741 738 851 1.0 15.3 13.8Brunei 54 63 62 0.1 -1.6 3.9Canada 989 964 1,012 1.2 5.0 2.3Chile 179 201 205 0.3 2.0 1.0China 10,037 12,881 14,697 18.0 14.1 17.4Fiji 192 176 211 0.3 19.9 7.9France 929 966 912 1.1 -5.6 6.6Germany 1,336 1,505 1,641 2.0 9.0 6.5Greece 85 86 94 0.1 9.3 4.6Hong Kong (SAR of China) 2,319 2,663 2,866 3.5 7.6 9.5India 3,185 3,636 4,087 5.0 12.4 13.5Indonesia 1,406 1,469 1,632 2.0 11.1 4.8Ireland 550 565 494 0.6 -12.6 -6.7Italy 636 640 641 0.8 0.2 9.8Japan 2,179 2,264 2,461 3.0 8.7 0.9Malaysia 2,314 2,219 2,430 3.0 9.5 6.9Mexico 98 102 114 0.1 11.8 13.1Netherlands 460 439 511 0.6 16.4 3.1New Zealand 4,272 4,353 5,190 6.4 19.2 7.3Norway 284 264 264 0.3 0.0 0.4Papua New Guinea 606 504 487 0.6 -3.4 -3.1Peru 69 62 64 0.1 3.2 -6.0Philippines 739 763 767 0.9 0.5 11.3Republic of Korea 1,885 2,179 2,256 2.8 3.5 2.2Russian Federation 158 132 130 0.2 -1.5 -4.4Saudi Arabia 410 374 362 0.4 -3.2 -1.8Singapore 3,973 4,574 5,367 6.6 17.3 9.0South Africa 356 342 346 0.4 1.2 -5.7Sweden 295 322 310 0.4 -3.7 4.1Switzerland 1,071 1,008 954 1.2 -5.4 6.0Taiwan 1,014 1,203 1,327 1.6 10.3 15.0Thailand 1,113 1,122 1,215 1.5 8.3 6.8Turkey 112 96 99 0.1 3.1 -2.5United Arab Emirates 682 689 721 0.9 4.6 9.5United Kingdom 5,303 5,397 5,315 6.5 -1.5 4.9United States 7,308 8,353 8,456 10.4 1.2 8.7Vietnam 1,378 1,409 1,442 1.8 2.3 8.2Country Groups (b)APEC 42,088 47,479 52,180 63.9 9.9 9.3ASEAN 11,186 11,814 13,145 16.1 11.3 7.9European Union (c) 11,167 11,488 11,558 14.2 0.6 4.3G20 40,074 45,082 48,145 59.0 6.8 8.5OECD 29,471 31,205 32,516 39.8 4.2 5.2Geographic Regions (b)Africa 1,101 1,137 1,239 1.5 9.0 1.1Americas 10,334 11,466 11,860 14.5 3.4 9.0Asia 36,223 41,311 45,925 56.3 11.2 10.3Europe 12,968 13,166 13,178 16.1 0.1 4.0Oceania & Antartica 5,456 5,420 6,265 7.7 15.6 6.0Other (d) 2,885 2,877 3,175 3.9 10.4 4.1World 68,967 75,377 81,642 8.3 8.2(a) Cells in this table may have been perturbed to protect confidentiality. (b) Refer to the Explanatory notes for country groupings.(c) EU27 to August 2013, EU28 from September 2013. (d) Includes unallocated and confidential trade.Based on ABS catalogue 5368.0.55.003/4.
(A$ million)
% growth
TABLE 17: AUSTRALIA'S EXPORTS OF SERVICES (a)BY SELECTED COUNTRIES AND REGIONS

Page 51
% share 2015-16 to 5 yearSelected countries 2014-15 2015-16 2016-17 of total 2016-17 trendArgentina 99 109 111 0.1 1.8 -8.5Belgium & Luxembourg 141 199 234 0.3 17.6 13.5Brazil 154 148 185 0.2 25.0 4.7Brunei 62 75 47 0.1 -37.3 -6.5Canada 1,424 1,664 2,000 2.4 20.2 7.5Chile 260 282 270 0.3 -4.3 0.3China 2,413 2,758 2,795 3.3 1.3 7.5Fiji 1,325 1,336 1,334 1.6 -0.1 3.8France 1,817 2,282 2,064 2.4 -9.6 8.9Germany 2,902 3,052 2,741 3.2 -10.2 7.0Greece 1,033 919 659 0.8 -28.3 -2.4Hong Kong (SAR of China) 2,894 3,093 2,929 3.5 -5.3 7.8India 1,710 1,869 2,009 2.4 7.5 12.4Indonesia 3,205 3,448 3,635 4.3 5.4 5.8Ireland 1,181 1,215 974 1.2 -19.8 -2.4Italy 1,662 1,793 1,972 2.3 10.0 6.9Japan 2,994 3,384 3,267 3.9 -3.5 8.5Malaysia 1,295 946 907 1.1 -4.1 -10.1Mexico 152 154 173 0.2 12.3 12.5Netherlands 1,389 1,314 1,030 1.2 -21.6 -7.3New Zealand 4,106 4,585 5,139 6.1 12.1 8.7Norway 454 537 398 0.5 -25.9 -4.4Papua New Guinea 451 437 387 0.5 -11.4 -5.2Peru 133 144 147 0.2 2.1 11.3Philippines 799 943 907 1.1 -3.8 6.9Republic of Korea 938 984 1,001 1.2 1.7 14.6Russian Federation 119 91 74 0.1 -18.7 -8.0Saudi Arabia 52 66 60 0.1 -9.1 3.3Singapore 5,116 5,461 5,178 6.1 -5.2 5.6South Africa 605 704 701 0.8 -0.4 3.6Sweden 261 361 442 0.5 22.4 31.7Switzerland 798 722 863 1.0 19.5 2.8Taiwan 273 252 287 0.3 13.9 5.5Thailand 2,231 2,292 2,562 3.0 11.8 -4.0Turkey 276 217 137 0.2 -36.9 -8.2United Arab Emirates 2,114 2,368 2,244 2.7 -5.2 1.9United Kingdom 7,502 8,129 8,168 9.7 0.5 5.4United States 15,126 16,247 15,334 18.2 -5.6 4.6Vietnam 1,034 1,093 1,345 1.6 23.1 6.6Country Groups (b)APEC 45,025 48,333 48,384 57.4 0.1 5.0ASEAN 14,010 14,565 14,756 17.5 1.3 2.3European Union (c) 20,386 21,509 20,008 23.7 -7.0 4.4G20 49,653 53,352 51,490 61.0 -3.5 5.3OECD 46,354 49,961 48,365 57.3 -3.2 5.2Geographic Regions (b)Africa 1,197 1,439 1,468 1.7 2.0 3.1Americas 17,957 19,310 18,768 22.3 -2.8 4.8Asia 29,259 31,492 31,747 37.6 0.8 4.9Europe 22,445 23,516 21,745 25.8 -7.5 3.5Oceania & Antartica 6,636 7,113 7,550 9.0 6.1 5.6Other (d) 2,947 2,775 3,066 3.6 10.5 -5.5World 80,441 85,645 84,344 -1.5 4.1(a) Cells in this table may have been perturbed to protect confidentiality. (b) Refer to the Explanatory notes for country groupings.(c) EU27 to August 2013, EU28 from September 2013. (d) Includes unallocated and confidential trade.Based on ABS catalogue 5368.0.55.003/4.
(A$ million)
% growth
TABLE 18: AUSTRALIA'S IMPORTS OF SERVICES (a)BY SELECTED COUNTRIES AND REGIONS

Page 52

Page 53
AUSTRALIA'SMERCHANDISE TRADE ON A
RECORDED TRADE BASIS
Section 4
Australia's merchandise tradeby level of processing

Page 54

Page 55
2015-16 to 5 yearTRIEC 2014-15 2015-16 2016-17 % share 2016-17 trendPrimary products 191,171 175,757 221,576 76.0 26.1 0.7
Unprocessed food 15,269 15,731 19,161 6.6 21.8 5.2 Processed food 23,889 24,325 23,988 8.2 -1.4 8.7 Minerals 78,041 69,313 85,188 29.2 22.9 -1.8Fuels 66,468 58,850 84,754 29.1 44.0 0.3 Other primary 7,504 7,537 8,486 2.9 12.6 1.2
Manufactured products 43,367 44,511 44,006 15.1 -1.1 1.8 STM (excl Nickel) 14,116 14,169 13,683 4.7 -3.4 1.0 ETM 29,251 30,342 30,323 10.4 -0.1 2.2
Other 20,015 23,157 25,480 8.7 10.0 2.6 Gold 13,505 16,585 18,978 6.5 14.4 3.4
Total merchandise exports (b) 255,524 244,147 291,598 19.4 1.0
2015-16 to 5 yearTRIEC 2014-15 2015-16 2016-17 % share 2016-17 trendPrimary products 53,678 46,028 48,266 17.4 4.9 -3.7
Unprocessed food 2,014 2,180 2,264 0.8 3.9 9.3 Processed food 14,314 15,990 15,913 5.7 -0.5 9.8 Minerals 1,258 1,223 1,343 0.5 9.8 4.9 Fuels 34,319 24,835 27,027 9.7 8.8 -10.0Other primary 1,773 1,800 1,719 0.6 -4.5 6.7
Manufactured products 192,235 205,985 204,377 73.5 -0.8 4.4 STM 15,381 15,709 15,589 5.6 -0.8 1.3 ETM 176,854 190,276 188,788 67.9 -0.8 4.7
Other 11,070 11,271 11,400 4.1 1.1 -1.9Gold 3,772 6,045 7,240 2.6 19.8 1.4
Total merchandise imports (b) 268,719 271,476 277,900 2.4 1.9
(a) Recorded trade basis. (b) Balance of payments basis.Source: DFAT STARS database.
% growth
TABLE 19: AUSTRALIA'S MERCHANDISE TRADE BY BROAD CATEGORYTOTAL EXPORTS AND IMPORTS (a)
(A$ million)
Merchandise exports % growth
Merchandise imports
0
50
100
150
200
250
2014-15 2015-16 2016-17
Exports
Primary products Manufactured products Other
0
50
100
150
200
250
2014-15 2015-16 2016-17
Imports
Primary products Manufactured products Other

Page 56
2015-16 to 5 yearTRIEC 2014-15 2015-16 2016-17 % share 2016-17 trend
Primary products 190,575 175,076 220,915 78.6 26.2 0.7
Unprocessed food 15,179 15,621 19,102 6.8 22.3 5.1 Processed food 23,460 23,825 23,471 8.3 -1.5 8.4 Minerals 78,027 69,289 85,166 30.3 22.9 -1.8Fuels 66,435 58,830 84,714 30.1 44.0 0.3 Other primary 7,475 7,512 8,462 3.0 12.7 1.1
Manufactured products 34,193 34,519 35,584 12.7 3.1 0.8
STM (excl Nickel) 13,758 13,711 13,429 4.8 -2.1 0.7 ETM 20,435 20,807 22,155 7.9 6.5 0.9
Other 19,360 22,360 24,595 8.7 10.0 2.5
Gold 13,451 16,572 18,971 6.7 14.5 3.4
Australian produced exports (a) 244,127 231,955 281,095 100.0 21.2 0.9
Re-exports 11,397 12,192 10,503 .. -13.9 3.3
Total merchandise exports (b) 255,524 244,147 291,598 .. 19.4 1.0
(a) Australian produced exports excludes re-exports (see the Explanatory notes ). (b) Balance of payments basis.Source: DFAT STARS database.
TABLE 20: AUSTRALIA'S MERCHANDISE EXPORTS BY BROAD CATEGORYAUSTRALIAN PRODUCED EXPORTS
(A$ million)
% growth
0
50
100
150
200
250
300
350
2006-07 2007-08 2008-09 2009-10 2010-11 2011-12 2012-13 2013-14 2014-15 2015-16 2016-17
A$b Total merchandise exports
Re-exports
Australianproduced exports

Page 57
2015-16 to 5 yearTRIEC 2014-15 2015-16 2016-17 % share 2016-17 trend
Primary products (a) 191,171 175,757 221,576 76.0 26.1 0.7
11 Unprocessed 140,421 126,322 165,644 56.8 31.1 -1.2 111 Food 15,269 15,731 19,161 6.6 21.8 5.2 112 Minerals 71,739 63,443 78,700 27.0 24.0 -2.3113 Fuels 46,036 39,725 59,417 20.4 49.6 -1.8114 Other primary products 7,377 7,422 8,366 2.9 12.7 1.2
12 Processed 50,750 49,435 55,933 19.2 13.1 7.2 121 Food 23,889 24,325 23,988 8.2 -1.4 8.7 122 Minerals 6,303 5,870 6,488 2.2 10.5 4.3 123 Fuels 20,432 19,125 25,337 8.7 32.5 6.6 124 Other primary products 127 115 120 0.0 4.6 0.6
Manufactured products (a) 43,367 44,511 44,006 15.1 -1.1 1.8
23 Simply transformed (excl Nickel) 14,116 14,169 13,683 4.7 -3.4 1.0 231 Mineral manufactures & metals 10,520 10,448 10,317 3.5 -1.3 0.6 232 Chemicals & other semi-manuf 3,573 3,694 3,336 1.1 -9.7 2.2 233 Other manufactures 23 26 30 0.0 16.5 -1.4
24 Elaborately transformed 29,251 30,342 30,323 10.4 -0.1 2.2 241 Mineral manufactures & metals 1,537 856 905 0.3 5.7 -17.7242 Chemicals & other semi-manuf 5,108 5,822 6,567 2.3 12.8 -0.5243 Engineering products 18,637 19,186 18,261 6.3 -4.8 4.2 244 Other manufactures 3,970 4,478 4,590 1.6 2.5 5.3
Other goods 20,015 23,157 25,480 8.7 10.0 2.6 302 Gold 13,505 16,585 18,978 6.5 14.4 3.4
Other 6,509 6,572 6,502 2.2 -1.1 0.7
Total merchandise exports (b) 255,524 244,147 291,598 19.4 1.0
(a) Excludes commodities subject to a confidentiality restriction. (b) Balance of payments basis.Source: DFAT STARS database.
TABLE 21: AUSTRALIA'S TOTAL MERCHANDISE EXPORTSBY BROAD LEVEL OF PROCESSING
(A$ million)
% growth
0
25
50
75
100
125
150
175
2014-15 2015-16 2016-17
A$bTotal merchandise exports
Unprocessed Processed STM (excl Nickel) ETM Other goods

Page 58
2015-16 to 5 yearTRIEC 2014-15 2015-16 2016-17 % share 2016-17 trend
Primary products (a) 53,678 46,028 48,266 17.4 4.9 -3.7
11 Unprocessed 18,339 11,542 12,727 4.6 10.3 -16.5 111 Food 2,014 2,180 2,264 0.8 3.9 9.3 112 Minerals 1,036 1,125 1,269 0.5 12.8 5.8 113 Fuels 14,735 7,636 8,609 3.1 12.8 -21.8114 Other primary products 554 602 584 0.2 -3.0 9.4
12 Processed 35,338 34,486 35,539 12.8 3.1 4.4 121 Food 14,314 15,990 15,913 5.7 -0.5 9.8 122 Minerals 222 99 74 0.0 -25.1 -3.9123 Fuels 19,584 17,200 18,418 6.6 7.1 0.5 124 Other primary products 1,219 1,197 1,134 0.4 -5.2 5.5
Manufactured products (a) 192,235 205,985 204,377 73.5 -0.8 4.4
23 Simply transformed 15,381 15,709 15,589 5.6 -0.8 1.3 231 Mineral manufactures & metals 3,767 3,598 3,385 1.2 -5.9 -1.7232 Chemicals & other semi-manuf 11,145 11,593 11,717 4.2 1.1 2.0 233 Other manufactures 469 517 486 0.2 -6.1 6.8
24 Elaborately transformed 176,854 190,276 188,788 67.9 -0.8 4.7 241 Mineral manufactures & metals 7,120 5,942 5,255 1.9 -11.6 1.5 242 Chemicals & other semi-manuf 21,738 24,124 24,327 8.8 0.8 3.4 243 Engineering products 107,713 114,664 114,929 41.4 0.2 3.8 244 Other manufactures 40,284 45,546 44,276 15.9 -2.8 8.6
Other goods 11,070 11,271 11,400 4.1 1.1 -1.9 302 Gold 3,772 6,045 7,240 2.6 19.8 1.4
Other 7,298 5,227 4,160 1.5 -20.4 -6.3
Total merchandise imports (b) 268,719 271,476 277,900 2.4 1.9
(a) Excludes commodities subject to a confidentiality restriction. (b) Balance of payments basis.Source: DFAT STARS database.
TABLE 22: AUSTRALIA'S TOTAL MERCHANDISE IMPORTSBY BROAD LEVEL OF PROCESSING
(A$ million)
% growth
0
25
50
75
100
125
150
175
2014-15 2015-16 2016-17
A$bTotal merchandise imports
Unprocessed Processed STM ETM Other goods

Page 59
2015-16 to 5 yearTRIEC 2014-15 2015-16 2016-17 % share 2016-17 trend
Primary products (a) 190,575 175,076 220,915 78.6 26.2 0.7
11 Unprocessed 140,291 126,166 165,542 58.9 31.2 -1.2 111 Food 15,179 15,621 19,102 6.8 22.3 5.1 112 Minerals 71,724 63,418 78,678 28.0 24.1 -2.3113 Fuels 46,036 39,725 59,417 21.1 49.6 -1.8114 Other primary products 7,352 7,401 8,345 3.0 12.8 1.1
12 Processed 50,284 48,911 55,374 19.7 13.2 7.1 121 Food 23,460 23,825 23,471 8.3 -1.5 8.4 122 Minerals 6,303 5,870 6,488 2.3 10.5 4.3 123 Fuels 20,399 19,105 25,297 9.0 32.4 6.6 124 Other primary products 123 111 118 0.0 6.2 0.4
Manufactured products (a) 34,193 34,519 35,584 12.7 3.1 0.8
23 Simply transformed (excl Nickel) 13,758 13,711 13,429 4.8 -2.1 0.7 231 Mineral manufactures & metals 10,382 10,239 10,215 3.6 -0.2 0.5 232 Chemicals & other semi-manuf 3,358 3,453 3,191 1.1 -7.6 1.5 233 Other manufactures 18 19 24 0.0 25.3 -3.9
24 Elaborately transformed 20,435 20,807 22,155 7.9 6.5 0.9 241 Mineral manufactures & metals 1,466 753 860 0.3 14.2 -18.8242 Chemicals & other semi-manuf 3,898 4,962 5,926 2.1 19.4 6.0 243 Engineering products 12,328 11,944 12,164 4.3 1.8 0.9 244 Other manufactures 2,743 3,149 3,205 1.1 1.8 2.5
Other goods 19,360 22,360 24,595 8.7 10.0 2.5 302 Gold 13,451 16,572 18,971 6.7 14.5 3.4
Other 5,909 5,788 5,624 2.0 -2.8 -0.2
Total Australian produced exports 244,127 231,955 281,095 21.2 0.9
(a) Excludes commodities subject to a confidentiality restriction.Source: DFAT STARS database.
TABLE 23: AUSTRALIAN PRODUCED EXPORTSBY BROAD LEVEL OF PROCESSING
(A$ million)
% growth
0
25
50
75
100
125
150
175
2014-15 2015-16 2016-17
A$bAustralian produced exports
Unprocessed Processed STM (excl Nickel) ETM Other goods

Page 60
2015-16 to 5 yearTRIEC 2014-15 2015-16 2016-17 2016-17 trend
1 Primary products (a) 191,171 175,757 221,576 26.1 0.7
11 Unprocessed 140,421 126,322 165,644 31.1 -1.2
111 Food & live animals 15,269 15,731 19,161 21.8 5.21111 Live animals, chiefly for food 1,783 2,002 1,648 -17.7 12.91112 Seafood, fresh, chilled, dried, smoked, salted 865 938 880 -6.2 11.21113 Vegetables, fruit & nuts, fresh, chilled, or
provisionally preserved 2,574 3,774 5,013 32.8 23.81114 Cereal grains 7,758 6,925 8,460 22.2 -0.91119 Unprocessed food nes 2,289 2,091 3,160 51.1 -0.1
112 Minerals 71,739 63,443 78,700 24.0 -2.31121 Iron ore & concentrates 54,519 47,799 62,799 31.4 -2.41122 Other metalliferous ores & concentrates 14,698 13,415 13,073 -2.5 -2.61129 Unprocessed minerals nes 2,522 2,229 2,827 26.8 2.0
113 Fuels 46,036 39,725 59,417 49.6 -1.81131 Coal, anthracite & bituminous 37,882 34,541 54,267 57.1 0.71132 Crude petroleum 8,154 5,184 5,150 -0.7 -15.81133 Petroleum gases & gaseous hydrocarbons nes,
unprocessed 0 0 0 .. ..
114 Other primary products 7,377 7,422 8,366 12.7 1.21141 Hides, skins & furskins, raw 1,044 940 777 -17.3 -0.61142 Cork & wood 1,510 1,789 2,005 12.1 14.31143 Textile fibres, unprocessed & waste 4,402 4,218 5,123 21.4 -3.11149 Crude materials nes 421 475 460 -3.1 17.1
12 Processed 50,750 49,435 55,933 13.1 7.2
121 Food 23,889 24,325 23,988 -1.4 8.71211 Meat & meat preparations 12,972 12,256 11,062 -9.7 11.81212 Seafood, frozen or processed 399 451 422 -6.3 2.61213 Dairy products 2,205 2,024 1,946 -3.8 -0.81214 Vegetables, fruit & nuts preparations 171 174 180 3.7 -1.61215 Cereal preparations 867 782 568 -27.3 -4.91216 Animal & vegetable oils, fats & waxes 735 762 808 6.0 4.21217 Sugars, honey, cocoa & confectionery 2,036 2,270 2,720 19.8 7.71219 Preparations of food, beverages & tobacco nes 4,504 5,605 6,281 12.1 11.0
122 Minerals 6,303 5,870 6,488 10.5 4.31221 Non-metallic minerals, processed 0 1 1 .. ..1222 Metallic minerals, processed 6,303 5,870 6,488 10.5 4.3
123 Fuels 20,432 19,125 25,337 32.5 6.61231 Refined petroleum 2,511 1,950 2,347 20.3 -7.91232 Petroleum gases & other gaseous hydrocarbons,
processed 17,702 17,128 22,944 34.0 9.61239 Other processed fuels nes 218 47 46 -1.0 -37.4
124 Other primary products 127 115 120 4.6 0.61241 Rubber (natural, synthetic & reclaimed) 13 8 5 -41.1 -25.71242 Wood, simply worked & pulp 112 105 112 6.5 4.01243 Textile fibres, processed 2 2 4 79.6 3.3
TABLE 24: AUSTRALIA'S TOTAL MERCHANDISE EXPORTS BY LEVEL OF PROCESSING
(A$ million)
% growth

Page 61
2015-16 to 5 yearTRIEC 2014-15 2015-16 2016-17 2016-17 trend2 Manufactured products (a) 43,367 44,511 44,006 -1.1 1.823 Simply transformed (excl Nickel) 14,116 14,169 13,683 -3.4 1.0231 Mineral manufactures & metals 10,520 10,448 10,317 -1.3 0.62311 Non-metallic mineral manufactures, simply
transformed 1,097 1,078 1,097 1.8 -0.42312 Iron & steel, simply transformed 371 247 421 70.6 -4.32313 Non-ferrous metals, simply transformed (excl Nickel) 9,051 9,124 8,799 -3.6 1.0232 Chemicals & other semi-manufactures 3,573 3,694 3,336 -9.7 2.22321 Organic chemicals 177 164 150 -8.8 4.82322 Inorganic chemicals 829 747 580 -22.4 -1.92323 Other chemical & chemical preparations, simply
transformed 1,319 1,539 1,397 -9.2 2.32324 Other semi-manufactures, simply transformed 1,248 1,244 1,209 -2.8 4.2233 Other manufactures 23 26 30 16.5 -1.42339 Other simply transformed manufactures nes 23 26 30 16.5 -1.424 Elaborately transformed 29,251 30,342 30,323 -0.1 2.2241 Mineral manufactures & metals 1,537 856 905 5.7 -17.72411 Non-metallic mineral manufactures, elaborately
transformed 126 147 75 -48.7 -2.32412 Iron & steel, elaborately transformed 386 381 494 29.5 -4.62413 Non-ferrous metals, elaborately transformed 1,024 328 335 2.2 -28.3242 Chemicals & other semi-manufactures 5,108 5,822 6,567 12.8 -0.52421 Pharmaceutical products 2,379 2,760 3,222 16.7 -6.52422 Essential oils, perfume & cosmetic products 593 709 844 19.0 11.02423 Plastics & articles of plastic 681 763 757 -0.8 4.72424 Other chemical & chemical preparations, elaborately
transformed 1,099 1,261 1,381 9.5 9.02425 Other semi-manufactures, elaborately transformed 356 329 364 10.6 1.3243 Engineering products 18,637 19,186 18,261 -4.8 4.22431 Machinery for specialised industries 4,430 4,442 4,275 -3.8 1.02432 Office & telecommunication equipment & parts 2,671 3,122 2,901 -7.1 10.32433 Road motor vehicles & parts 2,993 2,901 2,577 -11.2 0.72434 Other transport equipment & parts 2,678 2,692 2,478 -8.0 8.82435 Professional, scientific & controlling instruments &
apparatus 2,586 2,647 2,839 7.2 8.12439 Other engineering products nes 3,279 3,381 3,191 -5.6 1.4244 Other manufactures 3,970 4,478 4,590 2.5 5.32441 Household equipment 972 1,077 1,034 -4.0 6.52442 Textiles, clothing & footwear 538 601 597 -0.6 4.22449 Other miscellaneous manufactured articles nes 2,459 2,801 2,959 5.7 5.13 Other goods 20,015 23,157 25,480 10.0 2.6301 Miscellaneous trade 1,962 2,527 2,497 -1.2 4.63011 Armoured fighting vehicles, arms of war etc & parts,
nes 101 97 56 -41.7 1.63012 Gold coins & other coins that are legal tender 689 1,001 833 -16.8 -0.13019 Miscellaneous merchandise trade nes 1,172 1,429 1,608 12.5 8.2302 Gold 13,505 16,585 18,978 14.4 3.4303 Unclassified trade & invalid items 0 0 0 .. ..304 Confidential trade 4,547 4,044 4,005 -1.0 -1.4
Total merchandise exports (b) 255,524 244,147 291,598 19.4 1.0(a) Excludes commodities subject to a confidentiality restriction. (b) Balance of payments basis.Source: DFAT STARS database.
(A$ million)
% growth
TABLE 24: AUSTRALIA'S TOTAL MERCHANDISE EXPORTS BY LEVEL OF PROCESSING (cont'd)

Page 62
2015-16 to 5 yearTRIEC 2014-15 2015-16 2016-17 2016-17 trend
1 Primary products (a) 53,678 46,028 48,266 4.9 -3.7
11 Unprocessed 18,339 11,542 12,727 10.3 -16.5
111 Food & live animals 2,014 2,180 2,264 3.9 9.31111 Live animals, chiefly for food 102 114 152 33.4 6.71112 Seafood, fresh, chilled, dried, smoked, salted 186 184 216 17.0 8.61113 Vegetables, fruit & nuts, fresh, chilled, or
provisionally preserved 973 1,028 1,072 4.3 10.21114 Cereal grains 27 19 19 3.5 20.31119 Unprocessed food nes 726 835 806 -3.5 8.8
112 Minerals 1,036 1,125 1,269 12.8 5.81121 Iron ore & concentrates 96 55 31 -43.8 -19.01122 Other metalliferous ores & concentrates 556 705 928 31.6 10.91129 Unprocessed minerals nes 384 364 310 -14.9 1.5
113 Fuels 14,735 7,636 8,609 12.8 -21.81131 Coal, anthracite & bituminous 22 8 24 201.7 7.81132 Crude petroleum 14,710 7,625 8,583 12.6 -19.91133 Petroleum gases & gaseous hydrocarbons nes,
unprocessed 3 3 3 -0.5 -81.5
114 Other primary products 554 602 584 -3.0 9.41141 Hides, skins & furskins, raw 6 6 5 -19.5 17.31142 Cork & wood 16 18 26 44.3 17.71143 Textile fibres, unprocessed & waste 29 31 31 -0.2 12.41149 Crude materials nes 504 547 522 -4.5 8.8
12 Processed 35,338 34,486 35,539 3.1 4.4
121 Food 14,314 15,990 15,913 -0.5 9.81211 Meat & meat preparations 790 790 806 2.1 7.21212 Seafood, frozen or processed 1,583 1,616 1,697 5.0 6.71213 Dairy products 803 910 1,109 21.9 12.61214 Vegetables, fruit & nuts preparations 1,412 1,537 1,560 1.5 7.51215 Cereal preparations 256 267 249 -7.0 7.71216 Animal & vegetable oils, fats & waxes 660 775 737 -5.0 6.41217 Sugars, honey, cocoa & confectionery 1,314 1,464 1,376 -6.0 10.41219 Preparations of food, beverages & tobacco nes 7,496 8,631 8,379 -2.9 11.3
122 Minerals 222 99 74 -25.1 -3.91221 Non-metallic minerals, processed 5 5 4 -18.8 11.71222 Metallic minerals, processed 216 94 70 -25.5 -4.4
123 Fuels 19,584 17,200 18,418 7.1 0.51231 Refined petroleum 18,078 16,228 17,392 7.2 1.11232 Petroleum gases & other gaseous hydrocarbons,
processed 316 257 285 11.2 -11.61239 Other processed fuels nes 1,190 715 740 3.5 -5.0
124 Other primary products 1,219 1,197 1,134 -5.2 5.51241 Rubber (natural, synthetic & reclaimed) 66 67 74 11.3 1.21242 Wood, simply worked & pulp 1,081 1,064 999 -6.1 6.51243 Textile fibres, processed 71 67 61 -7.9 -2.9
TABLE 25: AUSTRALIA'S TOTAL MERCHANDISE IMPORTS BY LEVEL OF PROCESSING
(A$ million)
% growth

Page 63
2015-16 to 5 yearTRIEC 2014-15 2015-16 2016-17 2016-17 trend2 Manufactured products (a) 192,235 205,985 204,377 -0.8 4.423 Simply transformed 15,381 15,709 15,589 -0.8 1.3231 Mineral manufactures & metals 3,767 3,598 3,385 -5.9 -1.72311 Non-metallic mineral manufactures, simply
transformed 2,772 3,095 2,837 -8.3 4.52312 Iron & steel, simply transformed 175 138 125 -9.3 -11.72313 Non-ferrous metals, simply transformed 820 365 424 16.1 -20.3232 Chemicals & other semi-manufactures 11,145 11,593 11,717 1.1 2.02321 Organic chemicals 2,429 2,433 2,351 -3.4 -2.62322 Inorganic chemicals 1,532 1,679 1,802 7.3 2.62323 Other chemical & chemical preparations, simply
transformed 4,407 4,563 4,769 4.5 4.92324 Other semi-manufactures, simply transformed 2,777 2,919 2,795 -4.2 1.7233 Other manufactures 469 517 486 -6.1 6.82339 Other simply transformed manufactures nes 469 517 486 -6.1 6.824 Elaborately transformed 176,854 190,276 188,788 -0.8 4.7241 Mineral manufactures & metals 7,120 5,942 5,255 -11.6 1.52411 Non-metallic mineral manufactures, elaborately
transformed 542 623 608 -2.5 11.42412 Iron & steel, elaborately transformed 4,896 3,585 2,789 -22.2 -4.62413 Non-ferrous metals, elaborately transformed 1,682 1,734 1,859 7.2 14.4242 Chemicals & other semi-manufactures 21,738 24,124 24,327 0.8 3.42421 Pharmaceutical products 9,191 10,235 10,458 2.2 0.62422 Essential oils, perfume & cosmetic products 1,868 2,242 2,222 -0.9 11.22423 Plastics & articles of plastic 3,718 4,037 3,985 -1.3 6.82424 Other chemical & chemical preparations, elaborately
transformed 2,139 2,634 2,641 0.2 11.22425 Other semi-manufactures, elaborately transformed 4,822 4,976 5,021 0.9 1.2243 Engineering products 107,713 114,664 114,929 0.2 3.82431 Machinery for specialised industries 26,877 26,602 22,968 -13.7 -0.02432 Office & telecommunication equipment & parts 20,630 20,881 21,311 2.1 5.32433 Road motor vehicles & parts 27,952 32,217 33,054 2.6 4.42434 Other transport equipment & parts (b) 4,947 6,863 11,464 67.0 12.22435 Professional, scientific & controlling instruments &
apparatus 7,501 7,866 7,663 -2.6 6.42439 Other engineering products nes 19,804 20,235 18,470 -8.7 1.8244 Other manufactures 40,284 45,546 44,276 -2.8 8.62441 Household equipment 11,410 12,818 12,634 -1.4 7.12442 Textiles, clothing & footwear 12,580 14,488 13,925 -3.9 9.92449 Other miscellaneous manufactured articles nes 16,294 18,240 17,717 -2.9 8.63 Other goods 11,070 11,271 11,400 1.1 -1.9301 Miscellaneous trade 349 539 612 13.4 3.53011 Armoured fighting vehicles, arms of war etc & parts,
nes 285 483 557 15.3 5.73012 Gold coins & other coins that are legal tender 54 48 40 -16.5 -0.53019 Miscellaneous merchandise trade nes 10 8 14 85.0 -25.6302 Gold 3,772 6,045 7,240 19.8 1.4303 Unclassified trade & invalid items 0 0 0 .. ..304 Confidential trade 6,949 4,687 3,548 -24.3 -7.5
Total merchandise imports (c) 268,719 271,476 277,900 2.4 1.9(a) Excludes commodities subject to a confidentiality restriction. (b) Excludes aircraft imports from Sep 2008 onwards. These are now includedin confidential trade. (c) Balance of payments basis.Source: DFAT STARS database.
(A$ million)
% growth
TABLE 25: AUSTRALIA'S TOTAL MERCHANDISE IMPORTS BY LEVEL OF PROCESSING (cont'd)

Page 64
2015-16 to 5 yearTRIEC 2014-15 2015-16 2016-17 2016-17 trend
1 Primary products (a) 190,575 175,076 220,915 26.2 0.7
11 Unprocessed 140,291 126,166 165,542 31.2 -1.2
111 Food & live animals 15,179 15,621 19,102 22.3 5.11111 Live animals, chiefly for food 1,775 1,990 1,635 -17.8 12.71112 Seafood, fresh, chilled, dried, smoked, salted 841 904 874 -3.3 10.71113 Vegetables, fruit & nuts, fresh, chilled, or
provisionally preserved 2,532 3,733 4,985 33.5 23.61114 Cereal grains 7,757 6,925 8,460 22.2 -0.91119 Unprocessed food nes 2,274 2,069 3,149 52.2 -0.1
112 Minerals 71,724 63,418 78,678 24.1 -2.31121 Iron ore & concentrates 54,519 47,799 62,799 31.4 -2.41122 Other metalliferous ores & concentrates 14,698 13,415 13,073 -2.5 -2.61129 Unprocessed minerals nes 2,507 2,204 2,805 27.2 1.9
113 Fuels 46,036 39,725 59,417 49.6 -1.81131 Coal, anthracite & bituminous 37,882 34,541 54,267 57.1 0.71132 Crude petroleum 8,154 5,184 5,150 -0.7 -15.81133 Petroleum gases & gaseous hydrocarbons nes,
unprocessed 0 0 0 .. ..
114 Other primary products 7,352 7,401 8,345 12.8 1.11141 Hides, skins & furskins, raw 1,042 937 776 -17.1 -0.71142 Cork & wood 1,508 1,788 2,005 12.1 14.31143 Textile fibres, unprocessed & waste 4,399 4,215 5,121 21.5 -3.11149 Crude materials nes 402 460 442 -3.9 16.6
12 Processed 50,284 48,911 55,374 13.2 7.1
121 Food 23,460 23,825 23,471 -1.5 8.41211 Meat & meat preparations 12,941 12,194 11,009 -9.7 11.61212 Seafood, frozen or processed 366 426 372 -12.7 1.21213 Dairy products 2,193 1,991 1,908 -4.2 -1.21214 Vegetables, fruit & nuts preparations 164 165 174 5.3 -1.81215 Cereal preparations 865 781 568 -27.3 -4.91216 Animal & vegetable oils, fats & waxes 727 756 801 6.0 4.11217 Sugars, honey, cocoa & confectionery 2,000 2,226 2,703 21.5 7.81219 Preparations of food, beverages & tobacco nes 4,205 5,286 5,936 12.3 10.5
122 Minerals 6,303 5,870 6,488 10.5 4.31221 Non-metallic minerals, processed 0 0 1 .. ..1222 Metallic minerals, processed 6,303 5,870 6,488 10.5 4.3
123 Fuels 20,399 19,105 25,297 32.4 6.61231 Refined petroleum 2,488 1,934 2,330 20.4 -7.91232 Petroleum gases & other gaseous hydrocarbons,
processed 17,701 17,128 22,925 33.8 9.61239 Other processed fuels nes 210 42 42 -0.1 -38.6
124 Other primary products 123 111 118 6.2 0.41241 Rubber (natural, synthetic & reclaimed) 12 6 4 -32.2 -28.51242 Wood, simply worked & pulp 110 103 110 6.9 3.91243 Textile fibres, processed 2 2 3 77.9 4.3
TABLE 26: AUSTRALIAN PRODUCED EXPORTS BY LEVEL OF PROCESSING
(A$ million)
% growth

Page 65
2015-16 to 5 yearTRIEC 2014-15 2015-16 2016-17 2016-17 trend2 Manufactured products (a) 34,193 34,519 35,584 3.1 0.823 Simply transformed (excl Nickel) 13,758 13,711 13,429 -2.1 0.7231 Mineral manufactures & metals 10,382 10,239 10,215 -0.2 0.52311 Non-metallic mineral manufactures, simply
transformed 971 978 1,001 2.3 -0.52312 Iron & steel, simply transformed 370 246 420 70.7 -4.32313 Non-ferrous metals, simply transformed (excl Nickel) 9,040 9,015 8,794 -2.5 0.9232 Chemicals & other semi-manufactures 3,358 3,453 3,191 -7.6 1.52321 Organic chemicals 124 121 134 10.9 2.52322 Inorganic chemicals 797 712 566 -20.5 -2.52323 Other chemical & chemical preparations, simply
transformed 1,211 1,399 1,297 -7.3 1.22324 Other semi-manufactures, simply transformed 1,227 1,221 1,193 -2.3 4.3233 Other manufactures 18 19 24 25.3 -3.92339 Other simply transformed manufactures nes 18 19 24 25.3 -3.924 Elaborately transformed 20,435 20,807 22,155 6.5 0.9241 Mineral manufactures & metals 1,466 753 860 14.2 -18.82411 Non-metallic mineral manufactures, elaborately
transformed 118 120 68 -42.9 -4.62412 Iron & steel, elaborately transformed 337 314 462 46.8 -5.72413 Non-ferrous metals, elaborately transformed 1,011 319 330 3.5 -28.6242 Chemicals & other semi-manufactures 3,898 4,962 5,926 19.4 6.02421 Pharmaceutical products 1,467 2,316 2,935 26.7 5.72422 Essential oils, perfume & cosmetic products 475 572 717 25.3 10.22423 Plastics & articles of plastic 639 697 698 0.1 3.42424 Other chemical & chemical preparations, elaborately
transformed 1,016 1,114 1,275 14.5 8.02425 Other semi-manufactures, elaborately transformed 301 263 301 14.7 0.1243 Engineering products 12,328 11,944 12,164 1.8 0.92431 Machinery for specialised industries 3,107 3,088 3,155 2.1 -1.92432 Office & telecommunication equipment & parts 979 1,073 1,145 6.7 6.02433 Road motor vehicles & parts 2,660 2,558 2,197 -14.1 -0.52434 Other transport equipment & parts (b) 1,496 1,338 1,451 8.5 7.82435 Professional, scientific & controlling instruments &
apparatus 1,910 1,726 2,003 16.1 4.82439 Other engineering products nes 2,175 2,161 2,213 2.4 -2.0244 Other manufactures 2,743 3,149 3,205 1.8 2.52441 Household equipment 613 701 673 -4.1 3.52442 Textiles, clothing & footwear 345 391 397 1.5 4.52449 Other miscellaneous manufactured articles nes 1,786 2,057 2,135 3.8 1.83 Other goods 19,360 22,360 24,595 10.0 2.5301 Miscellaneous trade 1,525 1,892 1,782 -5.8 3.73011 Armoured fighting vehicles, arms of war etc & parts,
nes 92 88 47 -46.6 4.53012 Gold coins & other coins that are legal tender 688 997 832 -16.6 -0.23019 Miscellaneous merchandise trade nes 745 807 903 11.9 8.2302 Gold 13,451 16,572 18,971 14.5 3.4303 Unclassified trade & invalid items 0 0 0 .. ..304 Confidential trade 4,385 3,896 3,843 -1.4 -1.8
Total Australian produced exports 244,127 231,955 281,095 21.2 0.9(a) Excludes commodities subject to a confidentiality restriction.Source: DFAT STARS database.
(A$ million)
% growth
TABLE 26: AUSTRALIAN PRODUCED EXPORTS BY LEVEL OF PROCESSING (cont'd)

Page 66

Page 67
Section 5
Australia's merchandise commodityranking tables

Page 68
2015-16 to 5 yearRank SITC Commodity 2014-15 2015-16 2016-17 % share 2016-17 trend
Total commodities (c) 255,524 244,147 291,598 19.4 1.0
1 281 Iron ores & concentrates 54,519 47,799 62,799 21.5 31.4 -2.42 321 Coal 37,882 34,541 54,267 18.6 57.1 0.7 3 343 Natural gas 16,895 16,576 22,299 7.6 34.5 10.8 4 971 Gold 13,506 16,585 18,979 6.5 14.4 3.4 5 285 Aluminium ores & conc (incl alumina) 7,106 6,790 7,529 2.6 10.9 7.5
6 011 Beef, f.c.f. 9,040 8,495 7,115 2.4 -16.2 12.1 7 041 Wheat 5,528 5,096 6,073 2.1 19.2 -3.38 333 Crude petroleum 8,154 5,184 5,150 1.8 -0.7 -15.89 283 Copper ores & concentrates 5,242 4,664 4,551 1.6 -2.4 -3.5
10 012 Meat (excl beef), f.c.f. 3,840 3,649 3,832 1.3 5.0 11.1
11 054 Vegetables, f.c.f. 1,236 1,936 3,270 1.1 68.9 22.5 12 684 Aluminium 4,159 3,420 3,268 1.1 -4.4 -3.513 268 Wool & other animal hair (incl tops) 2,782 2,872 3,263 1.1 13.6 4.5 14 682 Copper 3,370 3,567 3,128 1.1 -12.3 -1.415 112 Alcoholic beverages 2,186 2,389 2,612 0.9 9.3 5.5
16 287 Other ores & concentrates (d) 4,845 3,455 2,601 0.9 -24.7 -8.317 098 Edible products & preparations, nes 1,214 2,119 2,524 0.9 19.1 27.3 18 061 Sugars, molasses & honey 1,751 1,960 2,409 0.8 22.9 8.1 19 334 Refined petroleum 2,511 1,950 2,347 0.8 20.3 -7.920 222 Oil-seeds & oleaginous fruits, soft 1,433 1,183 2,278 0.8 92.6 -1.3
21 542 Medicaments (incl veterinary) 1,913 1,962 2,183 0.7 11.3 -12.322 043 Barley 1,758 1,445 2,106 0.7 45.8 5.8 23 792 Aircraft, spacecraft & parts 1,686 2,037 1,802 0.6 -11.6 11.9 24 263 Cotton 1,547 1,270 1,787 0.6 40.8 -12.825 057 Fruit & nuts 1,353 1,862 1,769 0.6 -5.0 25.2
26 764 Telecom equipment & parts 1,360 1,702 1,750 0.6 2.9 15.5 27 289 Precious metal ores & conc (excl gold) 1,376 1,623 1,673 0.6 3.1 7.0 28 001 Live animals (excl seafood) 1,756 1,976 1,618 0.6 -18.1 13.2 29 872 Medical instruments (incl veterinary) 1,353 1,397 1,601 0.5 14.6 13.1 30 781 Passenger motor vehicles 1,989 1,958 1,590 0.5 -18.8 2.2
31 541 Pharm products (excl medicaments) 583 1,033 1,317 0.5 27.5 25.9 32 686 Zinc 897 1,233 1,267 0.4 2.7 8.2 33 685 Lead 901 1,062 1,260 0.4 18.6 4.7 34 022 Milk, cream, whey & yoghurt 1,411 1,273 1,239 0.4 -2.7 0.5 35 081 Animal feed 1,223 1,182 1,148 0.4 -2.9 -0.6
36 288 Non-ferrous waste & scrap 1,036 994 1,110 0.4 11.7 2.4 37 246 Wood in chips or particles 955 1,097 1,085 0.4 -1.1 11.9 38 899 Misc manufactured articles, nes 818 1,005 1,001 0.3 -0.3 11.5 39 036 Crustaceans, f.c.f. 983 1,023 988 0.3 -3.5 10.2 40 874 Measuring & analysing instruments 964 946 935 0.3 -1.2 1.5
(a) Recorded trade basis. (b) Excludes confidential items of trade. (c) Balance of payments basis. (d) Mainly Zinc ores & concentrates , Manganese ores& concentrates and Lead ores & concentrates .
TABLE 27: AUSTRALIA'S MAJOR MERCHANDISE EXPORTSRANK, VALUE AND GROWTH (a) (b)
(A$ million)
% growth

Page 69
2015-16 to 5 yearRank SITC Commodity 2014-15 2015-16 2016-17 % share 2016-17 trend
41 641 Paper & paperboard 856 873 889 0.3 1.8 6.3 42 533 Pigments, paints & varnishes 796 775 856 0.3 10.4 4.7 43 024 Cheese & curd 823 859 848 0.3 -1.3 2.8 44 951 Gold coin & legal tender coin 685 998 832 0.3 -16.6 -0.245 728 Specialised machinery & parts 735 726 805 0.3 10.9 -1.1
46 211 Hides & skins, raw (excl furskins) 1,043 939 777 0.3 -17.3 -0.647 752 Computers 589 628 773 0.3 23.0 16.5 48 784 Vehicle parts & accessories 757 748 754 0.3 0.7 0.6 49 278 Crude minerals, nes 384 402 739 0.3 83.8 22.2 50 667 Pearls & gems 775 835 733 0.3 -12.3 4.5
51 048 Cereal preparations 730 716 728 0.2 1.8 1.8 52 723 Civil engineering equipment & parts 903 817 723 0.2 -11.5 -5.253 553 Perfumery & cosmetics (excl soap) 474 569 694 0.2 22.0 11.3 54 282 Ferrous waste & scrap 863 548 675 0.2 23.2 -9.455 342 Liquefied propane & butane 807 547 630 0.2 15.1 -12.5
56 247 Wood, rough 313 438 598 0.2 36.5 30.5 57 592 Starches, inulin & wheat gluten 532 526 517 0.2 -1.8 1.8 58 897 Jewellery 393 465 515 0.2 10.8 -5.259 778 Electrical machinery & parts, nes 447 461 493 0.2 6.9 3.2 60 772 Electrical circuits equipment 473 485 492 0.2 1.4 -1.4
61 522 Inorganic chemical elements 750 655 475 0.2 -27.5 -3.862 744 Mechanical handling equip & parts 437 549 465 0.2 -15.2 8.3 63 894 Prams, toys, games & sporting goods 320 346 442 0.2 27.5 12.5 64 673 Uncoated flat-rolled iron & steel 356 187 427 0.1 128.4 -5.465 411 Animal oils & fats 415 388 420 0.1 8.4 2.2
66 699 Manufactures of base metal, nes 399 423 418 0.1 -1.2 -0.167 759 Computer parts & accessories 706 782 405 0.1 -48.3 -2.568 742 Pumps for liquids & parts 309 309 357 0.1 15.6 -2.469 713 Internal combustion piston engines 438 493 354 0.1 -28.3 -3.370 893 Plastic articles, nes 297 325 330 0.1 1.5 2.0
71 743 Pumps (excl liquid pumps) & parts 294 288 319 0.1 11.0 3.3 72 892 Printed matter 256 306 305 0.1 -0.5 1.9 73 291 Crude animal matter, nes 233 279 297 0.1 6.5 24.0 74 034 Fish, f.c.f. 259 340 291 0.1 -14.3 4.5 75 741 Heating & cooling equipment & parts 255 274 287 0.1 4.8 4.7
76 793 Ships, boats & floating structures 575 287 287 0.1 -0.1 7.0 77 582 Plastic plates, sheets & film 192 263 270 0.1 2.8 9.6 78 562 Fertilisers (excl crude) 307 409 269 0.1 -34.3 -0.279 251 Pulp & waste paper 241 249 261 0.1 4.7 1.8 80 747 Taps, cocks & valves 260 253 249 0.1 -1.5 5.7
(a) Recorded trade basis. (b) Excludes confidential items of trade.Based on ABS trade data on the DFAT STARS database (ABS catalogue 5368.0).
(A$ million)
% growth
TABLE 27: AUSTRALIA'S MAJOR MERCHANDISE EXPORTSRANK, VALUE AND GROWTH (a) (b) (cont'd)

Page 70
2015-16 to 5 yearRank SITC Commodity 2014-15 2015-16 2016-17 % share 2016-17 trend
Total commodities (c) 268,719 271,476 277,900 2.4 1.9
1 781 Passenger motor vehicles 18,708 21,542 21,782 7.8 1.1 6.6 2 334 Refined petroleum 18,078 16,228 17,392 6.3 7.2 1.1 3 764 Telecom equipment & parts 11,041 11,781 11,967 4.3 1.6 7.7 4 333 Crude petroleum 14,710 7,625 8,583 3.1 12.6 -19.9 5 782 Goods vehicles 6,123 7,353 8,004 2.9 8.9 0.3
6 752 Computers 8,045 7,820 7,855 2.8 0.5 3.7 7 542 Medicaments (incl veterinary) 7,076 7,712 7,340 2.6 -4.8 -2.7 8 971 Gold 3,772 6,045 7,240 2.6 19.8 1.4 9 793 Ships, boats & floating structures 968 922 4,801 1.7 420.6 6.5
10 821 Furniture, mattresses & cushions 3,932 4,456 4,203 1.5 -5.7 9.8
11 541 Pharm products (excl medicaments) 2,718 3,340 3,931 1.4 17.7 12.9 12 778 Electrical machinery & parts, nes 3,186 3,364 3,382 1.2 0.5 6.5 13 775 Household-type equipment, nes 2,824 3,293 3,330 1.2 1.1 9.9 14 893 Plastic articles, nes 2,893 3,317 3,292 1.2 -0.7 10.8 15 741 Heating & cooling equipment & parts 4,578 5,089 3,232 1.2 -36.5 10.8
16 894 Prams, toys, games & sporting goods 2,880 3,188 3,207 1.2 0.6 7.6 17 792 Aircraft, spacecraft & parts 336 2,226 3,184 1.1 43.0 72.3 18 874 Measuring & analysing instruments 3,317 3,190 3,038 1.1 -4.8 2.4 19 784 Vehicle parts & accessories 2,839 3,083 3,031 1.1 .. ..20 872 Medical instruments (incl veterinary) 2,611 2,934 2,946 1.1 0.4 10.8
21 723 Civil engineering equipment & parts 3,740 2,532 2,879 1.0 13.7 -15.1 22 845 Other textile clothing 2,501 2,941 2,853 1.0 -3.0 11.1 23 699 Manufactures of base metal, nes 2,558 2,743 2,697 1.0 -1.7 7.3 24 098 Edible products & preparations, nes 2,366 2,827 2,681 1.0 -5.2 10.5 25 899 Misc manufactured articles, nes 2,237 2,486 2,573 0.9 3.5 9.5
26 625 Rubber tyres, treads & tubes 2,505 2,431 2,540 0.9 4.5 -3.8 27 744 Mechanical handling equip & parts 2,633 2,327 2,380 0.9 2.2 -0.7 28 743 Pumps (excl liquid pumps) & parts 3,362 3,178 2,354 0.8 -25.9 3.0 29 761 Monitors, projectors & TVs 2,055 2,218 2,345 0.8 5.7 3.3 30 851 Footwear 1,958 2,282 2,191 0.8 -4.0 10.9
31 728 Specialised machinery & parts 2,490 2,942 2,161 0.8 -26.6 2.3 32 553 Perfumery & cosmetics (excl soap) 1,668 1,998 1,953 0.7 -2.3 10.9 33 772 Electrical circuits equipment 1,914 1,958 1,933 0.7 -1.3 2.3 34 112 Alcoholic beverages 1,743 1,930 1,906 0.7 -1.2 7.2 35 842 Women's clothing (excl knitted) 1,739 1,974 1,889 0.7 -4.3 8.6
36 658 Made-up textile articles, nes 1,502 1,747 1,724 0.6 -1.3 11.6 37 562 Fertilisers (excl crude) 1,868 1,748 1,711 0.6 -2.1 1.0 38 751 Office machines 2,000 1,976 1,708 0.6 -13.5 -0.6 39 641 Paper & paperboard 1,737 1,780 1,642 0.6 -7.7 -0.8 40 747 Taps, cocks & valves 1,879 2,008 1,521 0.5 -24.2 6.5
(a) Recorded trade basis. (b) Excludes confidential items of trade. (c) Balance of payments basis.
TABLE 28: AUSTRALIA'S MAJOR MERCHANDISE IMPORTSRANK, VALUE AND GROWTH (a) (b)
(A$ million)
% growth

Page 71
2015-16 to 5 yearRank SITC Commodity 2014-15 2015-16 2016-17 % share 2016-17 trend
41 691 Iron, steel, aluminium structures 2,891 2,608 1,508 0.5 -42.2 -0.542 582 Plastic plates, sheets & film 1,377 1,529 1,506 0.5 -1.5 7.7 43 831 Travel goods, bags & like containers 1,288 1,480 1,487 0.5 0.5 12.5 44 713 Internal combustion piston engines 1,472 1,489 1,466 0.5 -1.6 -0.845 776 Electronic integrated circuits 1,443 1,199 1,464 0.5 22.1 -0.6
46 897 Jewellery 1,267 1,481 1,450 0.5 -2.1 9.2 47 745 Non-electrical machinery & parts 1,293 1,441 1,429 0.5 -0.8 5.6 48 721 Agric machinery (excl tractors) & parts 1,021 1,260 1,419 0.5 12.6 5.9 49 773 Electrical distributing equipment 1,581 1,576 1,369 0.5 -13.1 2.5 50 841 Men's clothing (excl knitted) 1,263 1,438 1,367 0.5 -4.9 8.7
51 642 Paper & paperboard, cut to size 1,218 1,353 1,322 0.5 -2.3 10.9 52 522 Inorganic chemical elements 1,059 1,155 1,321 0.5 14.3 0.7 53 714 Non-electric engines & motors 1,343 1,657 1,284 0.5 -22.5 3.0 54 813 Lighting fixtures & fittings 1,203 1,357 1,277 0.5 -5.9 14.1 55 785 Motorcycles & cycles 1,121 1,222 1,183 0.4 -3.2 4.3
56 684 Aluminium 1,010 1,084 1,180 0.4 8.9 11.8 57 591 Insecticides, herbicides, disinfectants 800 909 1,142 0.4 25.7 13.5 58 716 Rotating electric plant & parts 1,129 1,090 1,137 0.4 4.3 -8.559 515 Organo-inorganic compounds 1,024 1,113 1,108 0.4 -0.4 -4.460 771 Electric power machinery & parts 1,117 1,085 1,107 0.4 2.0 0.9
61 598 Miscellaneous chemical products, nes 1,293 1,113 1,105 0.4 -0.7 5.0 62 892 Printed matter 1,057 1,122 1,048 0.4 -6.6 1.6 63 048 Cereal preparations 933 1,071 1,007 0.4 -6.0 10.6 64 742 Pumps for liquids & parts 1,078 1,032 980 0.4 -5.0 2.2 65 081 Animal feed 860 877 979 0.4 11.6 11.4
66 122 Tobacco, manufactured 801 1,052 959 0.3 -8.8 36.9 67 898 Musical instruments & parts 997 1,003 944 0.3 -5.9 -0.268 057 Fruit & nuts 861 902 934 0.3 3.6 10.3 69 682 Copper 1,303 860 931 0.3 8.2 -6.970 844 Women's clothing, knitted 853 1,028 925 0.3 -10.0 10.2
71 679 Tubes & pipes of iron or steel 3,055 1,894 918 0.3 -51.5 -7.672 697 Household equip of base metal, nes 850 947 911 0.3 -3.8 7.4 73 533 Pigments, paints & varnishes 661 874 908 0.3 3.9 12.5 74 287 Other ores & concentrates 463 543 890 0.3 63.8 11.8 75 884 Optical goods, nes 908 932 888 0.3 -4.7 7.5
76 695 Hand or machine tools 832 857 858 0.3 0.1 2.9 77 774 Medical electrodiagnostic apparatus 801 929 855 0.3 -8.0 6.9 78 748 Transmission shafts & parts 878 891 852 0.3 -4.5 -0.579 037 Seafood, prepared or preserved 718 714 810 0.3 13.4 5.2 80 575 Other primary plastics 775 833 801 0.3 -3.9 7.5
(a) Recorded trade basis. (b) Excludes confidential items of trade.Based on ABS trade data on the DFAT STARS database (ABS catalogue 5368.0).
(A$ million)
% growth
TABLE 28: AUSTRALIA'S MAJOR MERCHANDISE IMPORTSRANK, VALUE AND GROWTH (a) (b) (cont'd)

Page 72

Page 73
Section 6
Direction of Australia'smerchandise trade
ranking tables

Page 74
Exports Imports Balance (b)
Country (c) A$'000%
shareA$'000
%share
A$'000 A$'000%
shareRank in
2016-17
World (d) 291,598,000 277,900,000 13,698,000 569,498,000
China 95,729,886 32.8 61,491,991 22.1 34,237,895 157,221,876 27.6 1Japan 42,152,153 14.5 20,727,463 7.5 21,424,689 62,879,616 11.0 2United States 12,301,597 4.2 30,397,937 10.9 -18,096,341 42,699,534 7.5 3Republic of Korea 20,513,247 7.0 14,995,271 5.4 5,517,976 35,508,518 6.2 4India 15,126,647 5.2 4,467,641 1.6 10,659,006 19,594,289 3.4 5
Thailand 3,903,517 1.3 14,124,240 5.1 -10,220,722 18,027,757 3.2 6New Zealand 8,848,393 3.0 7,632,772 2.7 1,215,621 16,481,165 2.9 7Malaysia 5,883,466 2.0 10,440,044 3.8 -4,556,578 16,323,510 2.9 8Germany 2,658,560 0.9 13,558,524 4.9 -10,899,963 16,217,084 2.8 9Singapore 5,848,920 2.0 8,299,252 3.0 -2,450,332 14,148,172 2.5 10
United Kingdom 7,300,904 2.5 6,677,733 2.4 623,171 13,978,637 2.5 11Hong Kong (SAR of China) 12,925,770 4.4 858,652 0.3 12,067,118 13,784,422 2.4 12Taiwan 8,633,798 3.0 4,437,512 1.6 4,196,286 13,071,310 2.3 13Indonesia 6,593,307 2.3 4,529,672 1.6 2,063,635 11,122,978 2.0 14Vietnam 4,269,995 1.5 4,788,536 1.7 -518,541 9,058,531 1.6 15
Italy 758,951 0.3 6,008,421 2.2 -5,249,470 6,767,372 1.2 16France 1,424,835 0.5 4,575,881 1.6 -3,151,046 6,000,716 1.1 17Netherlands 3,146,789 1.1 2,374,858 0.9 771,931 5,521,648 1.0 18Papua New Guinea 1,716,582 0.6 3,471,159 1.2 -1,754,578 5,187,741 0.9 19United Arab Emirates 3,111,956 1.1 1,895,056 0.7 1,216,900 5,007,012 0.9 20
Switzerland 1,188,087 0.4 3,097,092 1.1 -1,909,005 4,285,179 0.8 21Canada 1,719,533 0.6 2,037,217 0.7 -317,684 3,756,750 0.7 22Philippines 2,397,811 0.8 770,900 0.3 1,626,911 3,168,711 0.6 23Belgium 1,259,219 0.4 1,849,883 0.7 -590,664 3,109,102 0.5 24Mexico 293,193 0.1 2,554,538 0.9 -2,261,345 2,847,731 0.5 25
Spain 696,530 0.2 2,042,538 0.7 -1,346,007 2,739,068 0.5 26Sweden 318,933 0.1 2,150,754 0.8 -1,831,821 2,469,688 0.4 27Ireland 100,669 - 2,311,713 0.8 -2,211,043 2,412,382 0.4 28Brazil 1,524,116 0.5 753,250 0.3 770,866 2,277,365 0.4 29South Africa 1,166,641 0.4 1,052,295 0.4 114,346 2,218,936 0.4 30
Saudi Arabia 1,516,429 0.5 456,747 0.2 1,059,682 1,973,175 0.3 31Bangladesh 1,006,406 0.3 859,299 0.3 147,107 1,865,705 0.3 32Turkey 903,780 0.3 799,633 0.3 104,147 1,703,412 0.3 33Austria 47,007 - 1,579,538 0.6 -1,532,531 1,626,544 0.3 34Denmark 183,546 0.1 1,312,550 0.5 -1,129,004 1,496,095 0.3 35
Poland 481,542 0.2 982,435 0.4 -500,893 1,463,976 0.3 36Pakistan 799,084 0.3 335,913 0.1 463,172 1,134,997 0.2 37Argentina 271,548 0.1 744,098 0.3 -472,550 1,015,645 0.2 38Israel 223,682 0.1 789,476 0.3 -565,794 1,013,158 0.2 39Bahrain 899,168 0.3 58,016 - 841,152 957,184 0.2 40
Chile 468,536 0.2 481,385 0.2 -12,850 949,921 0.2 41Qatar 571,706 0.2 375,135 0.1 196,571 946,840 0.2 42Czech Republic 137,428 - 771,118 0.3 -633,690 908,546 0.2 43Finland 72,308 - 775,711 0.3 -703,403 848,019 0.1 44Russian Federation 436,155 0.1 345,075 0.1 91,080 781,229 0.1 45(a) Recorded trade basis. (b) Balance on merchandise trade. (c) May exclude selected confidential export/import commodities. Refer toAppendix G - DFAT adjustments to official ABS trade data - for more information and a list of the commodities excluded. (d) Balance ofpayments basis.
TABLE 29: AUSTRALIA'S MERCHANDISE TRADE BY COUNTRY (a), 2016-17
Total

Page 75
Exports Imports Balance (b)
Country (c) A$'000%
share A$'000
%share
A$'000 A$'000%
shareRank in
2016-17
Kuwait 650,215 0.2 52,944 - 597,272 703,159 0.1 46Gabon 1,291 - 652,426 0.2 -651,135 653,717 0.1 47Hungary 30,250 - 622,783 0.2 -592,533 653,033 0.1 48Oman 509,249 0.2 94,569 - 414,680 603,819 0.1 49Fiji 413,880 0.1 179,345 0.1 234,535 593,224 0.1 50
Algeria 16,901 - 479,445 0.2 -462,544 496,346 0.1 51Sri Lanka 247,594 0.1 231,438 0.1 16,156 479,033 0.1 52Egypt 408,080 0.1 42,656 - 365,424 450,736 0.1 53Peru 57,614 - 377,521 0.1 -319,907 435,135 0.1 54Mozambique 431,849 0.1 2,225 - 429,624 434,075 0.1 55
Norway 73,159 - 308,174 0.1 -235,015 381,333 0.1 56New Caledonia 356,637 0.1 16,935 - 339,702 373,572 0.1 57Slovak Republic 6,799 - 339,598 0.1 -332,799 346,397 0.1 58Puerto Rico 3,640 - 320,803 0.1 -317,163 324,443 0.1 59Brunei 40,536 - 282,333 0.1 -241,798 322,869 0.1 60
Yemen 292,031 0.1 24 - 292,006 292,055 0.1 61Portugal 53,482 - 210,903 0.1 -157,422 264,385 - 62Iceland 242,157 0.1 12,196 - 229,961 254,353 - 63Cambodia 38,702 - 211,733 0.1 -173,032 250,435 - 64Republic of Congo 1,004 - 247,598 0.1 -246,594 248,602 - 65
Slovenia 94,477 - 152,167 0.1 -57,690 246,645 - 66Romania 86,855 - 157,469 0.1 -70,614 244,323 - 67Greece 21,347 - 218,112 0.1 -196,765 239,458 - 68Myanmar 161,151 0.1 37,789 - 123,362 198,940 - 69Nigeria 188,068 0.1 1,310 - 186,758 189,378 - 70
Jordan 130,821 - 27,909 - 102,912 158,730 - 71Iran 86,672 - 69,616 - 17,056 156,288 - 72Colombia 61,670 - 89,370 - -27,700 151,040 - 73Kenya 101,838 - 29,830 - 72,008 131,669 - 74Ghana 117,996 - 8,602 - 109,394 126,599 - 75
Bulgaria 53,692 - 70,182 - -16,490 123,873 - 76Mauritius 98,819 - 23,996 - 74,823 122,816 - 77Costa Rica 7,344 - 109,268 - -101,924 116,612 - 78Solomon Islands 96,846 - 15,080 - 81,766 111,927 - 79Equatorial Guinea 225 - 108,024 - -107,799 108,250 - 80
Ukraine 71,149 - 34,902 - 36,247 106,051 - 81Morocco 41,516 - 64,350 - -22,835 105,866 - 82Macau (SAR of China) 76,398 - 14,920 - 61,478 91,319 - 83Estonia 10,269 - 75,393 - -65,124 85,662 - 84Vanuatu 72,908 - 1,522 - 71,386 74,430 - 85
Lithuania 8,095 - 63,850 - -55,754 71,945 - 86Lebanon 47,552 - 19,723 - 27,829 67,275 - 87Panama 58,603 - 4,242 - 54,361 62,845 - 88Samoa 30,939 - 31,354 - -415 62,293 - 89Cote d'Ivoire 40,172 - 21,540 - 18,632 61,712 - 90(a) Recorded trade basis. (b) Balance on merchandise trade. (c) May exclude selected confidential export/import commodities. Refer toAppendix G - DFAT adjustments to official ABS trade data - for more information and a list of the commodities excluded.
Total
TABLE 29: AUSTRALIA'S MERCHANDISE TRADE BY COUNTRY (a), 2016-17 (cont'd)

Page 76
Exports Imports Balance (b)
Country (c) A$'000%
share A$'000
%share
A$'000 A$'000%
shareRank in
2016-17
Dominican Republic 9,431 - 52,209 - -42,778 61,639 - 91Nepal 49,797 - 7,519 - 42,278 57,315 - 92French Polynesia 52,039 - 2,216 - 49,822 54,255 - 93Tanzania 47,221 - 6,263 - 40,958 53,484 - 94Serbia 3,728 - 47,042 - -43,313 50,770 - 95
Ecuador 15,609 - 31,690 - -16,082 47,299 - 96Nauru 41,210 - 5,665 - 35,545 46,875 - 97Senegal 44,172 - 1,717 - 42,455 45,890 - 98Maldives 38,406 - 2,272 - 36,134 40,678 - 99Tunisia 7,973 - 32,004 - -24,031 39,978 - 100
Christmas Island 38,605 - 16 - 38,589 38,621 - 101Croatia 6,730 - 31,343 - -24,613 38,074 - 102Laos 22,779 - 14,384 - 8,395 37,163 - 103Uruguay 7,580 - 27,184 - -19,604 34,764 - 104Timor-Leste 32,193 - 2,255 - 29,938 34,448 - 105
Cyprus 4,313 - 27,469 - -23,157 31,782 - 106Luxembourg 3,737 - 26,643 - -22,907 30,380 - 107El Salvador 18,005 - 11,071 - 6,934 29,076 - 108Latvia 10,225 - 18,523 - -8,297 28,748 - 109Honduras 772 - 27,594 - -26,822 28,365 - 110
Trinidad & Tobago 20,906 - 7,034 - 13,872 27,940 - 111Ethiopia 3,139 - 24,216 - -21,077 27,355 - 112Madagascar 16,390 - 10,907 - 5,482 27,297 - 113Bosnia-Herzegovina 471 - 25,918 - -25,446 26,389 - 114Iraq 26,251 - 108 - 26,143 26,360 - 115
Netherlands Antilles 2,118 - 23,653 - -21,536 25,771 - 116Malta 4,466 - 21,014 - -16,549 25,480 - 117Kiribati 24,482 - 496 - 23,986 24,979 - 118Zambia 23,771 - 626 - 23,145 24,397 - 119Guatemala 5,963 - 17,730 - -11,766 23,693 - 120
American Samoa 10,045 - 13,576 - -3,531 23,621 - 121Nicaragua 1,698 - 21,665 - -19,966 23,363 - 122Togo 3,304 - 18,654 - -15,350 21,959 - 123Mongolia 21,131 - 734 - 20,396 21,865 - 124Uganda 19,583 - 1,563 - 18,020 21,145 - 125
Namibia 10,783 - 8,409 - 2,373 19,192 - 126Tonga 15,810 - 2,446 - 13,364 18,257 - 127Bolivia 2,828 - 15,235 - -12,407 18,063 - 128Burkina Faso 17,411 - 248 - 17,163 17,659 - 129Sierra Leone 2,400 - 14,666 - -12,266 17,065 - 130
Jamaica 14,338 - 1,938 - 12,400 16,276 - 131Venezuela 13,945 - 1,231 - 12,713 15,176 - 132Norfolk Island 14,893 - 116 - 14,777 15,009 - 133Kazakhstan 12,170 - 2,300 - 9,870 14,470 - 134Mauritania 13,962 - 193 - 13,768 14,155 - 135(a) Recorded trade basis. (b) Balance on merchandise trade. (c) May exclude selected confidential export/import commodities. Refer toAppendix G - DFAT adjustments to official ABS trade data - for more information and a list of the commodities excluded.
TABLE 29: AUSTRALIA'S MERCHANDISE TRADE BY COUNTRY (a), 2016-17 (cont'd)
Total

Page 77
Exports Imports Balance (b)
Country (c) A$'000%
share A$'000
%share
A$'000 A$'000%
shareRank in
2016-17
Guam 13,209 - 257 - 12,952 13,466 - 136Malawi 12,649 - 458 - 12,191 13,108 - 137Mali 11,982 - 969 - 11,013 12,951 - 138Cuba 1,203 - 11,373 - -10,170 12,576 - 139Afghanistan 11,084 - 232 - 10,851 11,316 - 140
Georgia 6,040 - 5,269 - 771 11,309 - 141Botswana 2,360 - 8,580 - -6,221 10,940 - 142Seychelles 7,885 - 2,772 - 5,112 10,657 - 143Sudan 8,919 - 718 - 8,201 9,637 - 144FYR Macedonia 1,174 - 8,441 - -7,268 9,615 - 145
Federated States of Micronesia 9,476 - 20 - 9,457 9,496 - 146Cocos Keeling Islands 8,584 - 83 - 8,501 8,667 - 147Cook Islands 8,238 - 269 - 7,969 8,507 - 148Angola 6,152 - 600 - 5,552 6,753 - 149Antarctica 6,526 - 96 - 6,430 6,622 - 150
Djibouti 5,091 - 1,453 - 3,638 6,544 - 151Bahamas 3,142 - 3,203 - -61 6,345 - 152Cameroon 5,402 - 864 - 4,537 6,266 - 153Paraguay 1,769 - 4,362 - -2,592 6,131 - 154Azerbaijan 5,712 - 266 - 5,447 5,978 - 155
Reunion 5,099 - 714 - 4,385 5,812 - 156Swaziland 67 - 5,690 - -5,623 5,757 - 157Albania 2,124 - 3,091 - -968 5,215 - 158UK Virgin Islands 166 - 4,663 - -4,496 4,829 - 159Guinea 4,629 - 146 - 4,483 4,775 - 160
Barbados 2,052 - 2,408 - -356 4,460 - 161Belarus 476 - 3,883 - -3,407 4,359 - 162Dem. Republic of the Congo 3,502 - 435 - 3,066 3,937 - 163Northern Mariana Islands 3,828 - 0 - 3,828 3,828 - 164Wallis & Futuna Island 3,728 - 1 - 3,727 3,729 - 165
Marshall Islands 3,128 - 589 - 2,539 3,718 - 166Tuvalu 3,482 - 156 - 3,327 3,638 - 167Antigua & Barbuda 716 - 2,849 - -2,133 3,565 - 168Guyana 2,829 - 479 - 2,350 3,307 - 169Turkmenistan 1,079 - 2,201 - -1,123 3,280 - 170
Haiti 441 - 2,835 - -2,394 3,276 - 171Suriname 2,666 - 531 - 2,135 3,197 - 172Rwanda 1,563 - 1,471 - 92 3,034 - 173Somalia 2,641 - 189 - 2,452 2,829 - 174St Helena 554 - 2,098 - -1,544 2,652 - 175
Palau 2,070 - 473 - 1,597 2,544 - 176Kyrgyzstan 2,082 - 28 - 2,054 2,109 - 177Syria 700 - 1,330 - -630 2,029 - 178Liberia 1,594 - 429 - 1,165 2,023 - 179Armenia 1,441 - 507 - 933 1,948 - 180(a) Recorded trade basis. (b) Balance on merchandise trade. (c) May exclude selected confidential export/import commodities. Refer toAppendix G - DFAT adjustments to official ABS trade data - for more information and a list of the commodities excluded.
TABLE 29: AUSTRALIA'S MERCHANDISE TRADE BY COUNTRY (a), 2016-17 (cont'd)
Total
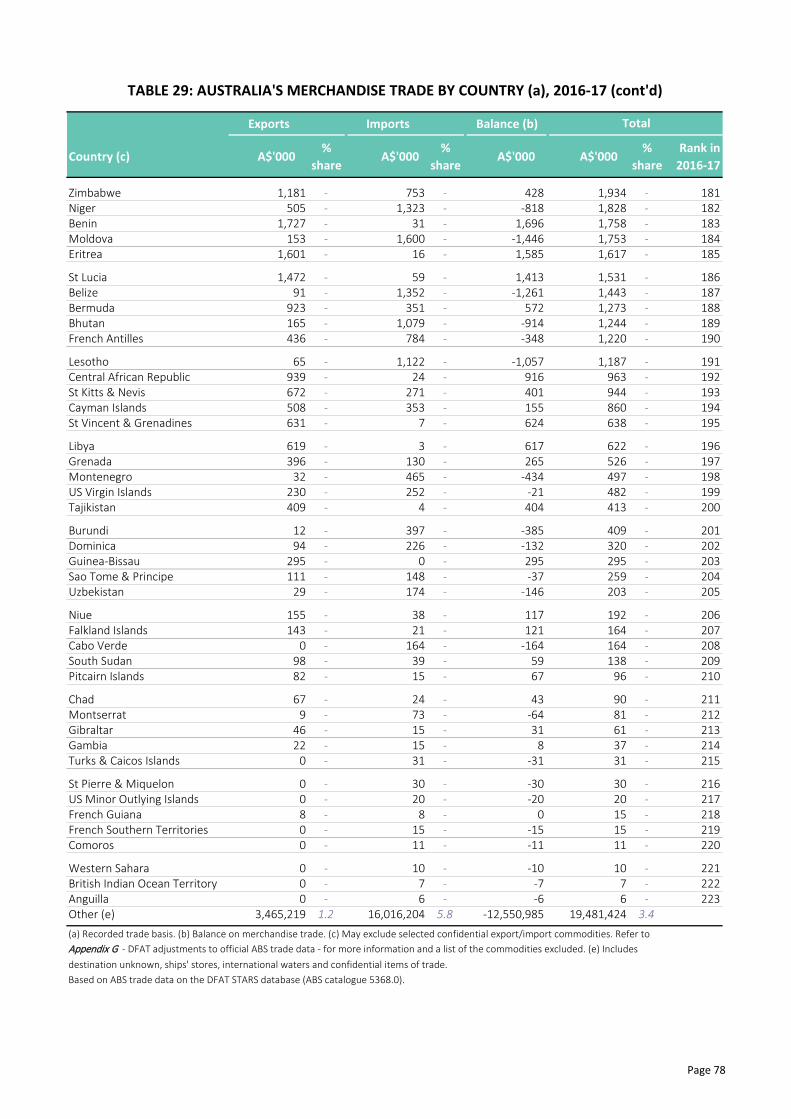
Page 78
Exports Imports Balance (b)
Country (c) A$'000%
share A$'000
%share
A$'000 A$'000%
shareRank in
2016-17
Zimbabwe 1,181 - 753 - 428 1,934 - 181Niger 505 - 1,323 - -818 1,828 - 182Benin 1,727 - 31 - 1,696 1,758 - 183Moldova 153 - 1,600 - -1,446 1,753 - 184Eritrea 1,601 - 16 - 1,585 1,617 - 185
St Lucia 1,472 - 59 - 1,413 1,531 - 186Belize 91 - 1,352 - -1,261 1,443 - 187Bermuda 923 - 351 - 572 1,273 - 188Bhutan 165 - 1,079 - -914 1,244 - 189French Antilles 436 - 784 - -348 1,220 - 190
Lesotho 65 - 1,122 - -1,057 1,187 - 191Central African Republic 939 - 24 - 916 963 - 192St Kitts & Nevis 672 - 271 - 401 944 - 193Cayman Islands 508 - 353 - 155 860 - 194St Vincent & Grenadines 631 - 7 - 624 638 - 195
Libya 619 - 3 - 617 622 - 196Grenada 396 - 130 - 265 526 - 197Montenegro 32 - 465 - -434 497 - 198US Virgin Islands 230 - 252 - -21 482 - 199Tajikistan 409 - 4 - 404 413 - 200
Burundi 12 - 397 - -385 409 - 201Dominica 94 - 226 - -132 320 - 202Guinea-Bissau 295 - 0 - 295 295 - 203Sao Tome & Principe 111 - 148 - -37 259 - 204Uzbekistan 29 - 174 - -146 203 - 205
Niue 155 - 38 - 117 192 - 206Falkland Islands 143 - 21 - 121 164 - 207Cabo Verde 0 - 164 - -164 164 - 208South Sudan 98 - 39 - 59 138 - 209Pitcairn Islands 82 - 15 - 67 96 - 210
Chad 67 - 24 - 43 90 - 211Montserrat 9 - 73 - -64 81 - 212Gibraltar 46 - 15 - 31 61 - 213Gambia 22 - 15 - 8 37 - 214Turks & Caicos Islands 0 - 31 - -31 31 - 215
St Pierre & Miquelon 0 - 30 - -30 30 - 216US Minor Outlying Islands 0 - 20 - -20 20 - 217French Guiana 8 - 8 - 0 15 - 218French Southern Territories 0 - 15 - -15 15 - 219Comoros 0 - 11 - -11 11 - 220
Western Sahara 0 - 10 - -10 10 - 221British Indian Ocean Territory 0 - 7 - -7 7 - 222Anguilla 0 - 6 - -6 6 - 223Other (e) 3,465,219 1.2 16,016,204 5.8 -12,550,985 19,481,424 3.4(a) Recorded trade basis. (b) Balance on merchandise trade. (c) May exclude selected confidential export/import commodities. Refer toAppendix G - DFAT adjustments to official ABS trade data - for more information and a list of the commodities excluded. (e) Includesdestination unknown, ships' stores, international waters and confidential items of trade.Based on ABS trade data on the DFAT STARS database (ABS catalogue 5368.0).
TABLE 29: AUSTRALIA'S MERCHANDISE TRADE BY COUNTRY (a), 2016-17 (cont'd)
Total

Page 79
Rank in 2015-16 to 5 yearCountry (b) 2014-15 2015-16 2016-17 2016-17 2016-17 trend
World (c) 255,524,000 244,147,000 291,598,000 19.4 1.0
China 75,401,360 75,332,073 95,729,886 1 27.1 3.6Japan 44,453,690 35,908,171 42,152,153 2 17.4 -5.1Republic of Korea 18,775,394 17,833,718 20,513,247 3 15.0 -1.9India 9,748,379 9,708,059 15,126,647 4 55.8 1.1Hong Kong (SAR of China) 9,134,780 8,871,331 12,925,770 5 45.7 12.6
United States 13,356,519 13,712,239 12,301,597 6 -10.3 7.6New Zealand 8,298,404 8,665,302 8,848,393 7 2.1 3.8Taiwan 6,868,739 6,445,593 8,633,798 8 33.9 -1.7United Kingdom 3,682,185 7,160,408 7,300,904 9 2.0 0.9Indonesia 5,627,960 5,533,610 6,593,307 10 19.2 4.4
Malaysia 6,053,180 5,363,733 5,883,466 11 9.7 2.7Singapore 8,348,158 5,417,866 5,848,920 12 8.0 -2.7Vietnam 3,269,306 3,596,297 4,269,995 13 18.7 18.5Thailand 5,010,279 3,570,976 3,903,517 14 9.3 -7.8Netherlands 2,361,160 2,215,372 3,146,789 15 42.0 -2.4
United Arab Emirates 3,279,203 3,083,346 3,111,956 16 0.9 8.1Germany 1,604,169 2,201,987 2,658,560 17 20.7 3.9Philippines 1,638,351 1,701,366 2,397,811 18 40.9 6.8Canada 1,404,902 1,700,843 1,719,533 19 1.1 2.3Papua New Guinea 2,002,217 1,640,485 1,716,582 20 4.6 -9.7
Brazil 1,222,316 980,020 1,524,116 21 55.5 6.1Saudi Arabia 2,109,784 1,975,626 1,516,429 22 -23.2 -1.8France 1,089,789 1,129,524 1,424,835 23 26.1 2.5Belgium 1,136,073 1,033,169 1,259,219 24 21.9 -7.0Switzerland 466,742 990,025 1,188,087 25 20.0 7.8
South Africa 1,301,817 1,085,629 1,166,641 26 7.5 -7.2Bangladesh 708,036 724,425 1,006,406 27 38.9 12.8Turkey 473,847 493,005 903,780 28 83.3 -1.3Bahrain 883,690 771,065 899,168 29 16.6 36.6Pakistan 454,767 649,804 799,084 30 23.0 6.7
Italy 714,916 734,035 758,951 31 3.4 -5.4Spain 597,950 516,295 696,530 32 34.9 -1.2Kuwait 715,459 780,607 650,215 33 -16.7 6.5Qatar 596,510 545,514 571,706 34 4.8 3.0Oman 456,366 479,909 509,249 35 6.1 3.2
Poland 295,595 278,313 481,542 36 73.0 56.2Chile 279,285 379,988 468,536 37 23.3 -0.8Russian Federation 509,676 545,518 436,155 38 -20.0 -13.0Mozambique 451,050 403,959 431,849 39 6.9 3.1Fiji 331,045 418,176 413,880 40 -1.0 7.7
Egypt 514,644 523,977 408,080 41 -22.1 -3.3New Caledonia 352,478 342,205 356,637 42 4.2 2.2Sweden 260,476 274,459 318,933 43 16.2 -2.7Mexico 472,349 608,527 293,193 44 -51.8 -16.5Yemen 339,667 306,884 292,031 45 -4.8 2.4(a) Recorded trade basis. (b) May exclude selected confidential export commodities. Refer to Appendix G - DFAT adjustments to officialABS trade data - for more information and a list of the commodities excluded. (c) Balance of payments basis.
TABLE 30: AUSTRALIA'S MERCHANDISE EXPORT MARKETS (a)(A$'000)
% growth

Page 80
Rank in 2015-16 to 5 yearCountry (b) 2014-15 2015-16 2016-17 2016-17 2016-17 trend
Argentina 223,373 260,923 271,548 46 4.1 -0.6Sri Lanka 294,666 251,002 247,594 47 -1.4 4.8Iceland 2,471 107,085 242,157 48 126.1 149.0Israel 237,825 306,370 223,682 49 -27.0 0.8Nigeria 207,511 251,512 188,068 50 -25.2 25.2
Denmark 116,353 122,380 183,546 51 50.0 -2.3Myanmar 125,254 164,242 161,151 52 -1.9 15.7Czech Republic 139,438 142,742 137,428 53 -3.7 7.9Jordan 210,046 274,288 130,821 54 -52.3 -2.9Ghana 59,435 75,681 117,996 55 55.9 -14.2
Kenya 63,061 60,716 101,838 56 67.7 3.7Ireland 54,960 70,925 100,669 57 41.9 1.7Mauritius 106,250 94,808 98,819 58 4.2 -0.9Solomon Islands 146,914 136,996 96,846 59 -29.3 -3.7Slovenia 11,655 48,127 94,477 60 96.3 29.1
Romania 58,089 39,802 86,855 61 118.2 28.4Iran 114,667 92,466 86,672 62 -6.3 -26.3Macau (SAR of China) 47,987 69,752 76,398 63 9.5 18.3Norway 171,227 58,964 73,159 64 24.1 -16.9Vanuatu 77,874 92,032 72,908 65 -20.8 5.2
Finland 35,768 33,379 72,308 66 116.6 -28.3Ukraine 132,169 84,197 71,149 67 -15.5 6.7Colombia 33,279 39,209 61,670 68 57.3 8.5Panama 48,061 44,787 58,603 69 30.8 17.3Peru 87,590 82,300 57,614 70 -30.0 -15.1
Bulgaria 146,526 89,693 53,692 71 -40.1 30.5Portugal 17,159 14,660 53,482 72 264.8 24.6French Polynesia 46,905 48,979 52,039 73 6.2 0.6Nepal 25,617 42,020 49,797 74 18.5 27.1Lebanon 44,756 47,843 47,552 75 -0.6 6.4
Tanzania 103,969 46,116 47,221 76 2.4 -16.3Austria 76,526 76,210 47,007 77 -38.3 -12.9Senegal 16,048 22,946 44,172 78 92.5 -13.0Morocco 33,466 15,440 41,516 79 168.9 5.8Nauru 64,747 82,265 41,210 80 -49.9 12.6
Brunei 46,056 45,603 40,536 81 -11.1 1.7Cote d'Ivoire 12,286 17,326 40,172 82 131.9 18.5Cambodia 42,738 51,496 38,702 83 -24.8 11.2Christmas Island 29,919 30,846 38,605 84 25.2 -3.8Maldives 35,494 36,973 38,406 85 3.9 8.3
Timor-Leste 34,507 30,783 32,193 86 4.6 5.8Samoa 29,406 32,588 30,939 87 -5.1 3.7Hungary 24,395 25,975 30,250 88 16.5 13.7Iraq 74,432 36,618 26,251 89 -28.3 -42.3Kiribati 22,912 28,830 24,482 90 -15.1 3.6(a) Recorded trade basis. (b) May exclude selected confidential export commodities. Refer to Appendix G - DFAT adjustments to officialABS trade data - for more information and a list of the commodities excluded.
% growth
TABLE 30: AUSTRALIA'S MERCHANDISE EXPORT MARKETS (a) (cont'd)(A$'000)

Page 81
Rank in 2015-16 to 5 yearCountry (b) 2014-15 2015-16 2016-17 2016-17 2016-17 trend
Zambia 24,431 11,747 23,771 91 102.4 -3.2Laos 31,012 24,612 22,779 92 -7.4 -7.5Greece 12,691 15,000 21,347 93 42.3 -1.4Mongolia 9,010 11,246 21,131 94 87.9 -18.9Trinidad & Tobago 25,494 15,161 20,906 95 37.9 2.9
Uganda 10,707 4,174 19,583 96 369.2 3.7El Salvador 23,697 19,287 18,005 97 -6.6 -4.9Burkina Faso 12,394 15,740 17,411 98 10.6 2.5Algeria 8,515 13,815 16,901 99 22.3 18.3Madagascar 12,065 6,756 16,390 100 142.6 -3.1
Tonga 11,522 18,324 15,810 101 -13.7 24.5Ecuador 17,530 14,752 15,609 102 5.8 2.5Norfolk Island 8,053 11,502 14,893 103 29.5 9.0Jamaica 25,019 25,246 14,338 104 -43.2 12.5Mauritania 5,528 8,165 13,962 105 71.0 -20.5
Venezuela 29,834 10,167 13,945 106 37.1 7.8Guam 12,172 9,890 13,209 107 33.6 -5.4Malawi 9,701 20,480 12,649 108 -38.2 0.4Kazakhstan 18,494 21,046 12,170 109 -42.2 -14.7Mali 15,445 13,355 11,982 110 -10.3 -15.4
Afghanistan 6,519 17,624 11,084 111 -37.1 10.5Namibia 14,063 9,126 10,783 112 18.1 -2.0Estonia 5,074 11,972 10,269 113 -14.2 -14.4Latvia 8,428 5,684 10,225 114 79.9 -1.2American Samoa 7,714 11,189 10,045 115 -10.2 14.7
Federated States of Micronesia 6,437 6,651 9,476 116 42.5 -0.6Dominican Republic 8,423 9,421 9,431 117 0.1 -2.8Sudan 104,494 7,811 8,919 118 14.2 ..Cocos Keeling Islands 6,065 10,289 8,584 119 -16.6 -9.8Cook Islands 9,532 7,890 8,238 120 4.4 5.3
Lithuania 7,795 7,894 8,095 121 2.5 9.1Tunisia 7,438 7,579 7,973 122 5.2 15.7Seychelles 6,236 9,938 7,885 123 -20.7 7.3Uruguay 11,340 10,316 7,580 124 -26.5 -3.1Costa Rica 3,463 8,250 7,344 125 -11.0 4.1
Slovak Republic 2,406 21,079 6,799 126 -67.7 41.7Croatia 2,781 11,024 6,730 127 -38.9 44.9Antarctica 7,590 8,714 6,526 128 -25.1 4.1Angola 11,239 5,611 6,152 129 9.6 -5.6Georgia 7,009 4,484 6,040 130 34.7 -30.5
Guatemala 12,159 8,308 5,963 131 -28.2 -19.8Azerbaijan 12,651 4,882 5,712 132 17.0 -17.6Cameroon 2,608 6,396 5,402 133 -15.5 20.3Reunion 5,244 5,408 5,099 134 -5.7 -6.3Djibouti 2,372 2,569 5,091 135 98.1 6.4(a) Recorded trade basis. (b) May exclude selected confidential export commodities. Refer to Appendix G - DFAT adjustments to officialABS trade data - for more information and a list of the commodities excluded.
TABLE 30: AUSTRALIA'S MERCHANDISE EXPORT MARKETS (a) (cont'd)(A$'000)
% growth

Page 82
Rank in 2015-16 to 5 yearCountry (b) 2014-15 2015-16 2016-17 2016-17 2016-17 trend
Guinea 2,840 5,193 4,629 136 -10.9 -28.2Malta 4,865 3,251 4,466 137 37.4 -7.5Cyprus 2,099 3,524 4,313 138 22.4 -9.8Northern Mariana Islands 1,693 3,680 3,828 139 4.0 22.9Luxembourg 6,745 5,772 3,737 140 -35.3 29.3
Serbia 2,266 2,789 3,728 141 33.7 -9.2Wallis & Futuna Island 4,180 3,993 3,728 142 -6.6 -2.8Puerto Rico 2,217 2,283 3,640 143 59.4 -12.7Dem. Republic of the Congo 12,464 4,495 3,502 144 -22.1 -17.9Tuvalu 5,177 4,380 3,482 145 -20.5 26.4
Togo 2,500 5,028 3,304 146 -34.3 -2.5Bahamas 4,130 5,172 3,142 147 -39.3 17.4Ethiopia 3,721 3,994 3,139 148 -21.4 11.6Marshall Islands 3,618 6,253 3,128 149 -50.0 -1.8Guyana 9,576 1,892 2,829 150 49.5 6.2
Bolivia 1,062 1,849 2,828 151 52.9 18.9Suriname 2,668 2,047 2,666 152 30.2 -9.5Somalia 239 528 2,641 153 400.0 27.6Sierra Leone 3,696 4,838 2,400 154 -50.4 -26.4Botswana 5,522 5,120 2,360 155 -53.9 -18.0
Albania 2,014 2,780 2,124 156 -23.6 4.9Netherlands Antilles 1,021 744 2,118 157 184.7 4.7Kyrgyzstan 2,377 2,164 2,082 158 -3.8 -4.6Palau 1,608 3,949 2,070 159 -47.6 20.9Barbados 3,353 3,032 2,052 160 -32.3 0.9
Paraguay 876 929 1,769 161 90.5 -18.7Benin 1,650 1,483 1,727 162 16.5 -2.0Nicaragua 3,695 1,778 1,698 163 -4.5 9.6Eritrea 5,275 5,966 1,601 164 -73.2 13.6Liberia 5,813 2,067 1,594 165 -22.9 -11.8
Rwanda 2,510 1,091 1,563 166 43.2 -31.9St Lucia 593 1,283 1,472 167 14.7 5.9Armenia 1,058 1,465 1,441 168 -1.6 -16.9Gabon 5,717 2,074 1,291 169 -37.8 -15.2Cuba 3,939 865 1,203 170 39.2 -33.7
Zimbabwe 1,286 2,570 1,181 171 -54.1 -31.0FYR Macedonia 366 906 1,174 172 29.6 12.3Turkmenistan 1,151 1,042 1,079 173 3.5 17.4Republic of Congo 5,644 1,726 1,004 174 -41.8 -28.0Central African Republic 1,752 3,450 939 175 -72.8 130.5
Bermuda 728 776 923 176 18.9 4.2Honduras 1,190 670 772 177 15.2 -19.4Antigua & Barbuda 345 402 716 178 78.2 -14.0Syria 2,180 2,943 700 179 -76.2 -37.9St Kitts & Nevis 631 614 672 180 9.5 38.0(a) Recorded trade basis. (b) May exclude selected confidential export commodities. Refer to Appendix G - DFAT adjustments to officialABS trade data - for more information and a list of the commodities excluded.
TABLE 30: AUSTRALIA'S MERCHANDISE EXPORT MARKETS (a) (cont'd)(A$'000)
% growth
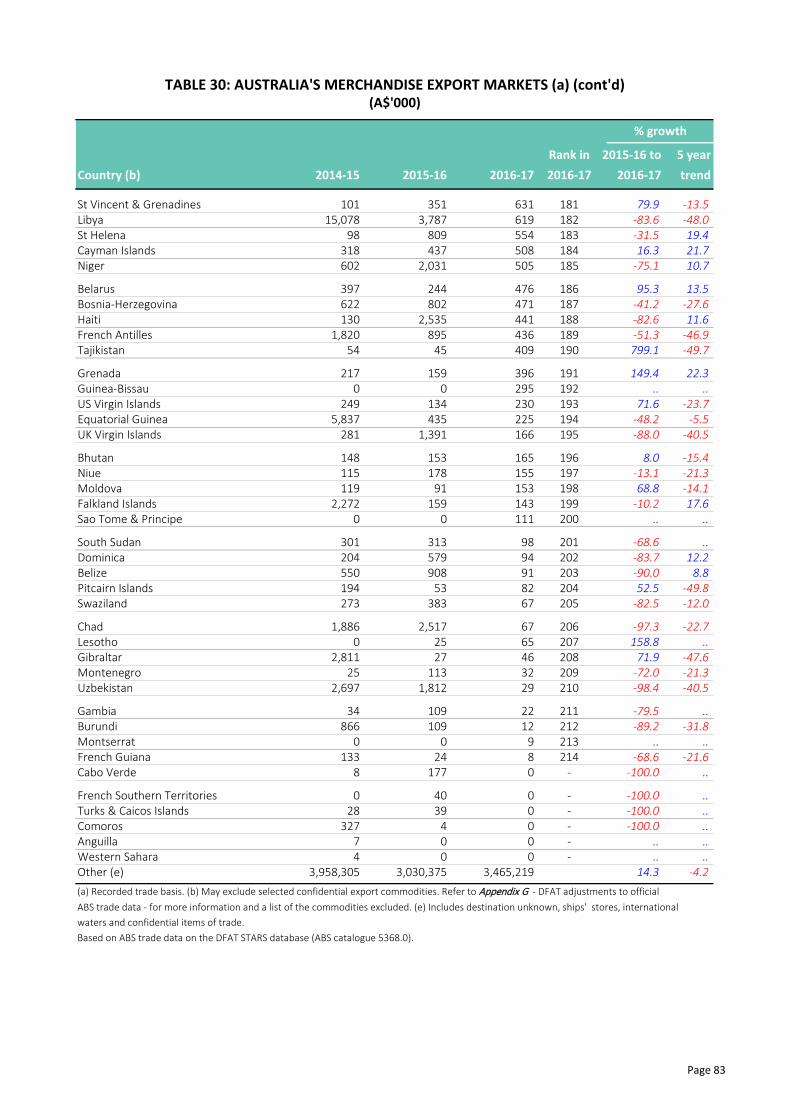
Page 83
Rank in 2015-16 to 5 yearCountry (b) 2014-15 2015-16 2016-17 2016-17 2016-17 trend
St Vincent & Grenadines 101 351 631 181 79.9 -13.5Libya 15,078 3,787 619 182 -83.6 -48.0St Helena 98 809 554 183 -31.5 19.4Cayman Islands 318 437 508 184 16.3 21.7Niger 602 2,031 505 185 -75.1 10.7
Belarus 397 244 476 186 95.3 13.5Bosnia-Herzegovina 622 802 471 187 -41.2 -27.6Haiti 130 2,535 441 188 -82.6 11.6French Antilles 1,820 895 436 189 -51.3 -46.9Tajikistan 54 45 409 190 799.1 -49.7
Grenada 217 159 396 191 149.4 22.3Guinea-Bissau 0 0 295 192 .. ..US Virgin Islands 249 134 230 193 71.6 -23.7Equatorial Guinea 5,837 435 225 194 -48.2 -5.5UK Virgin Islands 281 1,391 166 195 -88.0 -40.5
Bhutan 148 153 165 196 8.0 -15.4Niue 115 178 155 197 -13.1 -21.3Moldova 119 91 153 198 68.8 -14.1Falkland Islands 2,272 159 143 199 -10.2 17.6Sao Tome & Principe 0 0 111 200 .. ..
South Sudan 301 313 98 201 -68.6 ..Dominica 204 579 94 202 -83.7 12.2Belize 550 908 91 203 -90.0 8.8Pitcairn Islands 194 53 82 204 52.5 -49.8Swaziland 273 383 67 205 -82.5 -12.0
Chad 1,886 2,517 67 206 -97.3 -22.7Lesotho 0 25 65 207 158.8 ..Gibraltar 2,811 27 46 208 71.9 -47.6Montenegro 25 113 32 209 -72.0 -21.3Uzbekistan 2,697 1,812 29 210 -98.4 -40.5
Gambia 34 109 22 211 -79.5 ..Burundi 866 109 12 212 -89.2 -31.8Montserrat 0 0 9 213 .. ..French Guiana 133 24 8 214 -68.6 -21.6Cabo Verde 8 177 0 - -100.0 ..
French Southern Territories 0 40 0 - -100.0 ..Turks & Caicos Islands 28 39 0 - -100.0 ..Comoros 327 4 0 - -100.0 ..Anguilla 7 0 0 - .. ..Western Sahara 4 0 0 - .. ..Other (e) 3,958,305 3,030,375 3,465,219 14.3 -4.2(a) Recorded trade basis. (b) May exclude selected confidential export commodities. Refer to Appendix G - DFAT adjustments to officialABS trade data - for more information and a list of the commodities excluded. (e) Includes destination unknown, ships' stores, internationalwaters and confidential items of trade.Based on ABS trade data on the DFAT STARS database (ABS catalogue 5368.0).
TABLE 30: AUSTRALIA'S MERCHANDISE EXPORT MARKETS (a) (cont'd)(A$'000)
% growth

Page 84
Rank in 2015-16 to 5 yearCountry (b) 2014-15 2015-16 2016-17 2016-17 2016-17 trend
World (c) 268,719,000 271,476,000 277,900,000 2.4 1.9
China 57,101,992 61,473,537 61,491,991 1 0.0 8.5United States 30,382,490 32,520,689 30,397,937 2 -6.5 1.2Japan 18,302,698 19,191,437 20,727,463 3 8.0 0.7Republic of Korea 14,177,586 13,175,013 14,995,271 4 13.8 11.1Thailand 12,134,917 14,555,432 14,124,240 5 -3.0 10.1
Germany 11,955,753 13,237,775 13,558,524 6 2.4 4.5Malaysia 10,408,078 9,854,079 10,440,044 7 5.9 2.6Singapore 10,808,708 7,751,302 8,299,252 8 7.1 -13.2New Zealand 7,775,948 7,686,080 7,632,772 9 -0.7 0.9United Kingdom 6,332,459 7,583,516 6,677,733 10 -11.9 1.0
Italy 5,983,405 6,009,361 6,008,421 11 -0.0 2.8Vietnam 4,897,550 4,414,061 4,788,536 12 8.5 10.0France 4,601,372 4,703,216 4,575,881 13 -2.7 -2.0Indonesia 5,342,201 5,660,866 4,529,672 14 -20.0 -5.4India 3,804,474 4,756,123 4,467,641 15 -6.1 16.3
Taiwan 4,853,411 4,552,164 4,437,512 16 -2.5 3.9Papua New Guinea 3,402,129 3,312,699 3,471,159 17 4.8 0.6Switzerland 3,006,762 3,253,709 3,097,092 18 -4.8 1.3Mexico 2,256,014 2,426,754 2,554,538 19 5.3 6.0Netherlands 2,043,737 2,178,349 2,374,858 20 9.0 6.3
Ireland 1,822,906 2,383,976 2,311,713 21 -3.0 7.3Sweden 1,924,274 2,098,628 2,150,754 22 2.5 -3.3Spain 2,013,275 2,157,497 2,042,538 23 -5.3 -4.9Canada 2,264,441 2,283,289 2,037,217 24 -10.8 0.7United Arab Emirates 3,117,791 1,872,023 1,895,056 25 1.2 -13.6
Belgium 1,663,202 1,631,671 1,849,883 26 13.4 1.2Austria 1,062,551 1,196,459 1,579,538 27 32.0 12.8Denmark 1,090,577 1,223,084 1,312,550 28 7.3 3.7South Africa 1,086,844 1,156,147 1,052,295 29 -9.0 6.9Poland 764,659 838,158 982,435 30 17.2 17.3
Bangladesh 674,095 930,678 859,299 31 -7.7 25.1Hong Kong (SAR of China) 1,215,484 1,052,510 858,652 32 -18.4 -5.2Turkey 821,398 991,794 799,633 33 -19.4 13.7Israel 789,536 800,548 789,476 34 -1.4 4.6Finland 733,941 762,917 775,711 35 1.7 -4.4
Czech Republic 665,349 836,591 771,118 36 -7.8 13.0Philippines 937,362 759,150 770,900 37 1.5 10.9Brazil 613,458 704,126 753,250 38 7.0 2.4Argentina 781,072 789,384 744,098 39 -5.7 5.0Gabon 998,645 387,420 652,426 40 68.4 -12.7
Hungary 490,828 595,989 622,783 41 4.5 14.3Chile 907,403 498,729 481,385 42 -3.5 -18.9Algeria 41 68,252 479,445 43 602.5 131.9Saudi Arabia 385,930 471,787 456,747 44 -3.2 2.3Peru 166,005 255,111 377,521 45 48.0 31.6(a) Recorded trade basis. (b) May exclude selected confidential export commodities. Refer to Appendix G - DFAT adjustments to officialABS trade data - for more information and a list of the commodities excluded. (c) Balance of payments basis.
TABLE 31: AUSTRALIA'S MERCHANDISE IMPORT SOURCES (a)(A$'000)
% growth

Page 85
Rank in 2015-16 to 5 yearCountry (b) 2014-15 2015-16 2016-17 2016-17 2016-17 trend
Qatar 611,332 453,076 375,135 46 -17.2 -8.5Russian Federation 738,317 221,100 345,075 47 56.1 -25.2Slovak Republic 382,412 427,556 339,598 48 -20.6 13.3Pakistan 239,008 306,919 335,913 49 9.4 15.2Puerto Rico 329,293 406,235 320,803 50 -21.0 -13.1
Norway 371,370 353,203 308,174 51 -12.7 0.6Brunei 769,911 283,003 282,333 52 -0.2 -28.0Republic of Congo 184,366 273,830 247,598 53 -9.6 -23.6Sri Lanka 191,605 226,059 231,438 54 2.4 14.5Greece 203,878 201,287 218,112 55 8.4 6.5
Cambodia 131,992 182,231 211,733 56 16.2 37.2Portugal 163,866 201,542 210,903 57 4.6 7.4Fiji 175,035 188,033 179,345 58 -4.6 0.7Romania 114,460 247,947 157,469 59 -36.5 25.6Slovenia 116,637 130,423 152,167 60 16.7 20.8
Costa Rica 115,472 110,367 109,268 61 -1.0 -6.2Equatorial Guinea 20,534 31,649 108,024 62 241.3 381.4Oman 86,550 22,863 94,569 63 313.6 6.2Colombia 74,422 77,567 89,370 64 15.2 14.5Estonia 46,371 72,564 75,393 65 3.9 14.2
Bulgaria 55,423 61,913 70,182 66 13.4 13.1Iran 34,471 60,188 69,616 67 15.7 9.2Morocco 34,202 63,867 64,350 68 0.8 3.0Lithuania 40,640 45,072 63,850 69 41.7 1.0Bahrain 91,503 67,812 58,016 70 -14.4 -6.8
Kuwait 1,172 12,586 52,944 71 320.6 -54.1Dominican Republic 33,148 67,080 52,209 72 -22.2 22.8Serbia 28,407 40,998 47,042 73 14.7 30.0Egypt 32,691 34,936 42,656 74 22.1 -2.4Myanmar 48,064 28,383 37,789 75 33.1 24.1
Ukraine 32,011 35,800 34,902 76 -2.5 -5.6Tunisia 25,213 29,952 32,004 77 6.8 15.1Ecuador 26,354 33,650 31,690 78 -5.8 14.2Samoa 30,786 33,123 31,354 79 -5.3 -1.4Croatia 24,763 29,254 31,343 80 7.1 0.6
Kenya 38,579 38,520 29,830 81 -22.6 18.6Jordan 35,643 31,655 27,909 82 -11.8 37.9Honduras 67,483 35,515 27,594 83 -22.3 10.5Cyprus 22,717 24,032 27,469 84 14.3 18.5Uruguay 29,862 19,176 27,184 85 41.8 9.3
Luxembourg 19,549 24,749 26,643 86 7.7 -2.8Bosnia-Herzegovina 7,401 17,177 25,918 87 50.9 62.8Ethiopia 22,697 27,753 24,216 88 -12.7 13.1Mauritius 18,070 25,016 23,996 89 -4.1 18.2Netherlands Antilles 793 476 23,653 90 .. 36.7(a) Recorded trade basis. (b) May exclude selected confidential export commodities. Refer to Appendix G - DFAT adjustments to officialABS trade data - for more information and a list of the commodities excluded.
% growth
TABLE 31: AUSTRALIA'S MERCHANDISE IMPORT SOURCES (a) (cont'd)(A$'000)
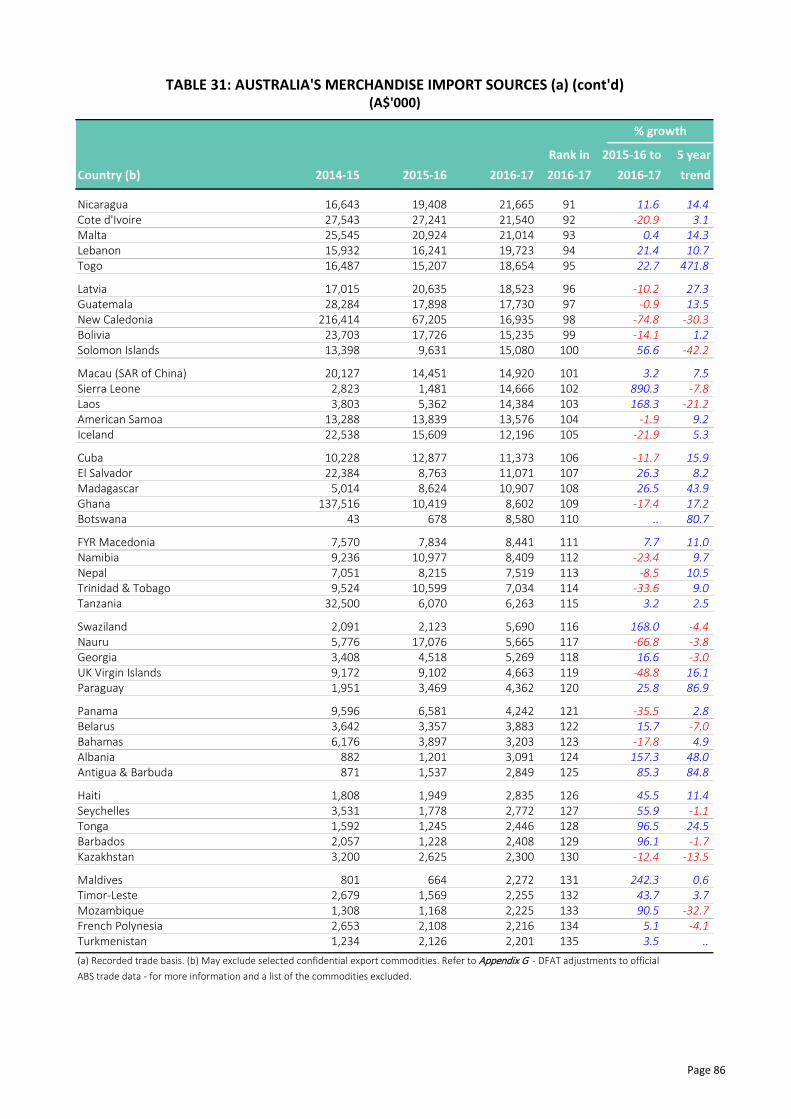
Page 86
Rank in 2015-16 to 5 yearCountry (b) 2014-15 2015-16 2016-17 2016-17 2016-17 trend
Nicaragua 16,643 19,408 21,665 91 11.6 14.4Cote d'Ivoire 27,543 27,241 21,540 92 -20.9 3.1Malta 25,545 20,924 21,014 93 0.4 14.3Lebanon 15,932 16,241 19,723 94 21.4 10.7Togo 16,487 15,207 18,654 95 22.7 471.8
Latvia 17,015 20,635 18,523 96 -10.2 27.3Guatemala 28,284 17,898 17,730 97 -0.9 13.5New Caledonia 216,414 67,205 16,935 98 -74.8 -30.3Bolivia 23,703 17,726 15,235 99 -14.1 1.2Solomon Islands 13,398 9,631 15,080 100 56.6 -42.2
Macau (SAR of China) 20,127 14,451 14,920 101 3.2 7.5Sierra Leone 2,823 1,481 14,666 102 890.3 -7.8Laos 3,803 5,362 14,384 103 168.3 -21.2American Samoa 13,288 13,839 13,576 104 -1.9 9.2Iceland 22,538 15,609 12,196 105 -21.9 5.3
Cuba 10,228 12,877 11,373 106 -11.7 15.9El Salvador 22,384 8,763 11,071 107 26.3 8.2Madagascar 5,014 8,624 10,907 108 26.5 43.9Ghana 137,516 10,419 8,602 109 -17.4 17.2Botswana 43 678 8,580 110 .. 80.7
FYR Macedonia 7,570 7,834 8,441 111 7.7 11.0Namibia 9,236 10,977 8,409 112 -23.4 9.7Nepal 7,051 8,215 7,519 113 -8.5 10.5Trinidad & Tobago 9,524 10,599 7,034 114 -33.6 9.0Tanzania 32,500 6,070 6,263 115 3.2 2.5
Swaziland 2,091 2,123 5,690 116 168.0 -4.4Nauru 5,776 17,076 5,665 117 -66.8 -3.8Georgia 3,408 4,518 5,269 118 16.6 -3.0UK Virgin Islands 9,172 9,102 4,663 119 -48.8 16.1Paraguay 1,951 3,469 4,362 120 25.8 86.9
Panama 9,596 6,581 4,242 121 -35.5 2.8Belarus 3,642 3,357 3,883 122 15.7 -7.0Bahamas 6,176 3,897 3,203 123 -17.8 4.9Albania 882 1,201 3,091 124 157.3 48.0Antigua & Barbuda 871 1,537 2,849 125 85.3 84.8
Haiti 1,808 1,949 2,835 126 45.5 11.4Seychelles 3,531 1,778 2,772 127 55.9 -1.1Tonga 1,592 1,245 2,446 128 96.5 24.5Barbados 2,057 1,228 2,408 129 96.1 -1.7Kazakhstan 3,200 2,625 2,300 130 -12.4 -13.5
Maldives 801 664 2,272 131 242.3 0.6Timor-Leste 2,679 1,569 2,255 132 43.7 3.7Mozambique 1,308 1,168 2,225 133 90.5 -32.7French Polynesia 2,653 2,108 2,216 134 5.1 -4.1Turkmenistan 1,234 2,126 2,201 135 3.5 ..(a) Recorded trade basis. (b) May exclude selected confidential export commodities. Refer to Appendix G - DFAT adjustments to officialABS trade data - for more information and a list of the commodities excluded.
TABLE 31: AUSTRALIA'S MERCHANDISE IMPORT SOURCES (a) (cont'd)(A$'000)
% growth

Page 87
Rank in 2015-16 to 5 yearCountry (b) 2014-15 2015-16 2016-17 2016-17 2016-17 trend
St Helena 566 2,304 2,098 136 -8.9 37.7Jamaica 1,758 1,822 1,938 137 6.4 10.6Senegal 609 2,271 1,717 138 -24.4 45.4Moldova 1,420 1,351 1,600 139 18.4 3.0Uganda 2,233 3,997 1,563 140 -60.9 -15.4
Vanuatu 2,225 2,210 1,522 141 -31.1 3.2Rwanda 1,252 1,856 1,471 142 -20.7 21.1Djibouti 482 886 1,453 143 64.1 23.1Belize 2,229 1,497 1,352 144 -9.7 -15.9Syria 1,207 1,761 1,330 145 -24.5 2.5
Niger 1,135 1,847 1,323 146 -28.3 -12.3Nigeria 531,684 1,240 1,310 147 5.6 -82.9Venezuela 2,033 1,202 1,231 148 2.5 9.0Lesotho 2,902 1,269 1,122 149 -11.6 -12.5Bhutan 229 791 1,079 150 36.3 35.0
Mali 21,719 9,297 969 151 -89.6 9.3Cameroon 702 861 864 152 0.3 -13.1French Antilles 782 1,391 784 153 -43.6 28.1Zimbabwe 379 1,274 753 154 -40.9 -5.4Mongolia 323 10,860 734 155 -93.2 26.8
Sudan 216 917 718 156 -21.7 ..Reunion 161 66 714 157 977.2 124.9Zambia 3,217 593 626 158 5.5 29.4Angola 37,565 38,592 600 159 -98.4 44.2Marshall Islands 611 265 589 160 122.1 -7.5
Suriname 356 558 531 161 -4.8 14.3Armenia 270 348 507 162 45.8 -0.6Kiribati 170 333 496 163 49.0 4.8Guyana 348 325 479 164 47.3 -8.1Palau 10 7 473 165 .. ..
Montenegro 243 817 465 166 -43.0 -6.3Malawi 150 410 458 167 11.8 8.0Dem. Republic of the Congo 255 41 435 168 953.7 -19.0Liberia 23 70 429 169 508.9 13.8Burundi 708 379 397 170 4.7 27.3
Cayman Islands 753 11,207 353 171 -96.9 -1.3Bermuda 4,835 1,116 351 172 -68.6 -68.1St Kitts & Nevis 120 61 271 173 345.9 32.0Cook Islands 565 1,397 269 174 -80.8 40.4Azerbaijan 143 262 266 175 1.3 -78.5
Guam 3,196 130 257 176 98.2 14.4US Virgin Islands 182 1,445 252 177 -82.6 11.4Burkina Faso 44 52 248 178 379.5 8.3Afghanistan 1,925 988 232 179 -76.5 -25.0Dominica 291 356 226 180 -36.5 -8.6(a) Recorded trade basis. (b) May exclude selected confidential export commodities. Refer to Appendix G - DFAT adjustments to officialABS trade data - for more information and a list of the commodities excluded.
TABLE 31: AUSTRALIA'S MERCHANDISE IMPORT SOURCES (a) (cont'd)(A$'000)
% growth

Page 88
Rank in 2015-16 to 5 yearCountry (b) 2014-15 2015-16 2016-17 2016-17 2016-17 trend
Mauritania 49 65 193 181 198.0 22.6Somalia 31 332 189 182 -43.2 28.6Uzbekistan 1,635 990 174 183 -82.4 -36.2Cabo Verde 156 274 164 184 -40.3 -22.3Tuvalu 288 446 156 185 -65.1 -10.0
Sao Tome & Principe 344 70 148 186 110.0 59.6Guinea 280 95 146 187 53.8 -29.7Grenada 155 90 130 188 44.6 ..Norfolk Island 41 99 116 189 16.8 22.8Iraq 323 31 108 190 249.4 46.3
Antarctica 2 2 96 191 .. 32.7Cocos Keeling Islands 287 111 83 192 -25.3 -15.5Montserrat 48 87 73 193 -16.4 17.5St Lucia 63 9 59 194 578.4 -3.8South Sudan 17 10 39 195 292.7 ..
Niue 7 72 38 196 -47.6 41.8Turks & Caicos Islands 169 18 31 197 70.4 34.8Benin 32 8 31 198 275.4 ..St Pierre & Miquelon 0 0 30 199 .. ..Kyrgyzstan 252 95 28 200 -70.8 -16.2
Yemen 207 28 24 201 -12.5 ..Chad 108 128 24 202 -81.5 ..Central African Republic 183 4 24 203 454.0 15.6Falkland Islands 95 35 21 204 -38.3 49.2US Minor Outlying Islands 3 20 20 205 3.3 ..
Federated States of Micronesia 33 8 20 206 161.4 -24.5Christmas Island 2,649 2,980 16 207 -99.5 -59.5Eritrea 7 226 16 208 -92.9 ..Gibraltar 25 9 15 209 64.1 -64.7Pitcairn Islands 10 780 15 210 -98.1 -14.9
French Southern Territories 5 0 15 211 .. ..Gambia 50 3 15 212 460.6 -33.0Comoros 31 44 11 213 -75.6 ..Western Sahara 0 5 10 214 97.6 ..French Guiana 1 0 8 215 .. ..
British Indian Ocean Territory 2 13 7 216 -45.3 -1.5St Vincent & Grenadines 0 6 7 217 14.6 ..Anguilla 88 51 6 218 -88.5 -5.1Tajikistan 3 20 4 219 -79.2 -57.4Libya 65 1 3 220 165.7 -94.6
Wallis & Futuna Island 0 0 1 221 .. ..Northern Mariana Islands 4 6 0 - -100.0 ..Guinea-Bissau 0 1 0 - -100.0 ..Other (e) 14,878,768 10,572,551 16,016,204 51.5 -9.1(a) Recorded trade basis. (b) May exclude selected confidential export commodities. Refer to Appendix G - DFAT adjustments to officialABS trade data - for more information and a list of the commodities excluded. (e) Includes destination unknown, ships' stores, internationalwaters and confidential items of trade.Based on ABS trade data on the DFAT STARS database (ABS catalogue 5368.0).
TABLE 31: AUSTRALIA'S MERCHANDISE IMPORT SOURCES (a) (cont'd)(A$'000)
% growth

Page 89
2015-16 to 5 year2014-15 2015-16 2016-17 % share 2016-17 trend
Economic/Country GroupsAPEC 400,213 389,293 428,102 75.2 10.0 2.0ASEAN 75,675 68,964 72,659 12.8 5.4 0.3East Asia 326,075 312,938 355,272 62.4 13.5 2.2European Union 56,858 65,238 67,989 11.9 4.2 2.0Gulf Cooperation Council 12,335 10,536 10,191 1.8 -3.3 -1.3G20 369,998 376,738 413,590 72.6 9.8 2.3Indian Ocean Rim Association 89,815 83,168 90,622 15.9 9.0 0.0OECD 225,797 228,588 240,186 42.2 5.1 0.7Pacific Islands Forum Countries 22,420 22,397 22,629 4.0 1.0 0.8
Geographic Regions
Africa 6,515 5,100 5,797 1.0 13.7 -13.2Central & West Africa 2,327 1,210 1,540 0.3 27.3 -25.6North Africa 776 771 1,103 0.2 43.2 -14.7Southern & East Africa 3,412 3,119 3,154 0.6 1.1 -0.9
Americas 55,531 58,326 55,046 9.7 -5.6 2.3Caribbean 492 604 499 0.1 -17.4 -10.3Central America 3,083 3,319 3,133 0.6 -5.6 0.7North America 47,408 50,217 46,456 8.2 -7.5 2.8South America 4,548 4,186 4,957 0.9 18.4 -0.0
Asia 356,559 343,160 390,404 68.6 13.8 2.2Central Asia 64 67 51 0.0 -23.3 -27.9North Asia 250,363 243,942 282,579 49.6 15.8 2.7South East Asia 75,712 68,996 72,694 12.8 5.4 0.3Southern Asia 16,184 17,642 23,173 4.1 31.4 5.5Middle East 14,236 12,514 11,907 2.1 -4.9 -1.7
Europe 63,664 72,468 75,599 13.3 4.3 1.7Eastern Europe 4,307 4,220 4,450 0.8 5.4 3.1Northern Europe 16,622 22,249 21,841 3.8 -1.8 0.8South Eastern Europe 2,118 2,464 2,722 0.5 10.5 9.3Southern Europe 9,524 9,658 9,796 1.7 1.4 -0.2Western Europe 31,094 33,878 36,791 6.5 8.6 2.3
Oceania & Antarctica 23,136 22,966 23,171 4.1 0.9 0.7Antarctica 8 9 7 0.0 -24.0 4.1Pacific Islands 23,089 22,913 23,117 4.1 0.9 0.8Other Oceania 39 44 47 0.0 6.9 -7.2
Other 0.0 .. ..
Total (c) 524,243 515,623 569,498 10.4 1.4(a) Recorded trade basis. (b) May exclude selected confidential export/import commodities. Refer to Appendix G - DFAT adjustments to officialABS trade data - for more information and a list of the commodities excluded. (c) Balance of payments basis.Based on ABS trade data on DFAT STARS database (ABS catalogue 5368.0).
TABLE 32: AUSTRALIA'S MERCHANDISE TRADE BY ECONOMIC/COUNTRYAND REGIONAL GROUPS (a) (b)
(A$ million)
% growth

Page 90
2015-16 to 5 year2014-15 2015-16 2016-17 % share 2016-17 trend
Economic/Country RegionsAPEC 211,041 196,958 234,738 80.5 19.2 1.0ASEAN 30,192 25,470 29,160 10.0 14.5 1.8East Asia 184,918 169,972 209,245 71.8 23.1 0.8European Union 12,476 16,293 18,982 6.5 16.5 0.1Gulf Cooperation Council 8,041 7,636 7,259 2.5 -4.9 6.1G20 187,557 181,971 219,230 75.2 20.5 0.5Indian Ocean Rim Association 42,026 36,241 44,483 15.3 22.7 0.4OECD 100,638 96,896 107,735 36.9 11.2 -1.5Pacific Islands Forum Countries 11,012 11,144 11,288 3.9 1.3 1.1
Geographic Regions
Africa 3,208 2,807 2,912 1.0 3.7 -5.8Central & West Africa 382 447 461 0.2 3.1 -1.7North Africa 684 573 484 0.2 -15.5 -11.6Southern & East Africa 2,142 1,788 1,967 0.7 10.0 -4.9
Americas 17,327 17,962 16,901 5.8 -5.9 5.3Caribbean 79 72 64 0.0 -11.2 -7.0Central America 565 693 386 0.1 -44.3 -14.2North America 14,761 15,413 14,021 4.8 -9.0 6.9South America 1,921 1,785 2,431 0.8 36.2 2.6
Asia 205,301 190,143 234,619 80.5 23.4 0.9Central Asia 52 55 40 0.0 -26.6 -14.6North Asia 154,691 144,472 180,052 61.7 24.6 0.6South East Asia 30,227 25,501 29,192 10.0 14.5 1.8Southern Asia 11,267 11,412 17,268 5.9 51.3 2.0Middle East 9,065 8,703 8,066 2.8 -7.3 3.4
Europe 14,241 18,579 21,905 7.5 17.9 0.0Eastern Europe 1,125 1,124 1,192 0.4 6.1 0.6Northern Europe 4,323 7,828 8,292 2.8 5.9 0.5South Eastern Europe 713 708 1,179 0.4 66.6 1.9Southern Europe 1,338 1,268 1,513 0.5 19.3 -3.2Western Europe 6,741 7,652 9,728 3.3 27.1 0.0
Oceania & Antarctica 11,488 11,626 11,796 4.0 1.5 1.1Antarctica 8 9 7 0.0 -25.1 4.1Pacific Islands 11,445 11,576 11,742 4.0 1.4 1.2Other Oceania 36 41 47 0.0 14.6 -5.6
Other 3,958 3,030 3,465 1.2 14.3 -4.2
Total (c) 255,524 244,147 291,598 19.4 1.0(a) Recorded trade basis. (b) May exclude selected confidential export commodities. Refer to Appendix G - DFAT adjustments to officialABS trade data - for more information and a list of the commodities excluded. (c) Balance of payments basis.Based on ABS trade data on DFAT STARS database (ABS catalogue 5368.0).
TABLE 33: AUSTRALIA'S MERCHANDISE EXPORTS BY ECONOMIC/COUNTRYAND REGIONAL GROUPS (a) (b)
(A$ million)
% growth

Page 91
2015-16 to 5 year2014-15 2015-16 2016-17 % share 2016-17 trend
Economic/Country RegionsAPEC 189,172 192,335 193,365 69.6 0.5 3.2ASEAN 45,483 43,494 43,499 15.7 0.0 -0.6East Asia 141,157 142,965 146,028 52.5 2.1 4.2European Union 44,382 48,945 49,007 17.6 0.1 2.8Gulf Cooperation Council 4,294 2,900 2,932 1.1 1.1 -12.4G20 182,440 194,767 194,360 69.9 -0.2 4.4Indian Ocean Rim Association 47,789 46,927 46,139 16.6 -1.7 -0.3OECD 125,159 131,692 132,450 47.7 0.6 2.6Pacific Islands Forum Countries 11,409 11,253 11,341 4.1 0.8 0.6
Geographic Regions
Africa 3,307 2,293 2,885 1.0 25.9 -18.7Central & West Africa 1,945 764 1,080 0.4 41.4 -30.5North Africa 92 198 619 0.2 212.8 -20.5Southern & East Africa 1,270 1,331 1,187 0.4 -10.9 7.5
Americas 38,204 40,364 38,145 13.7 -5.5 1.1Caribbean 412 533 436 0.2 -18.2 -10.8Central America 2,518 2,627 2,747 1.0 4.6 5.4North America 32,647 34,804 32,435 11.7 -6.8 1.2South America 2,627 2,401 2,526 0.9 5.2 -1.9
Asia 151,258 153,017 155,784 56.1 1.8 4.0Central Asia 12 12 11 0.0 -8.3 -44.8North Asia 95,672 99,470 102,527 36.9 3.1 6.7South East Asia 45,485 43,496 43,501 15.7 0.0 -0.6Southern Asia 4,917 6,229 5,905 2.1 -5.2 17.2Middle East 5,172 3,811 3,841 1.4 0.8 -9.5
Europe 49,424 53,889 53,695 19.3 -0.4 2.4Eastern Europe 3,181 3,097 3,258 1.2 5.2 4.1Northern Europe 12,298 14,421 13,549 4.9 -6.0 1.1South Eastern Europe 1,405 1,756 1,543 0.6 -12.1 14.6Southern Europe 8,186 8,389 8,283 3.0 -1.3 0.6Western Europe 24,353 26,226 27,062 9.7 3.2 3.1
Oceania & Antarctica 11,647 11,340 11,375 4.1 0.3 0.4Antarctica 0 0 0 0.0 .. 32.7Pacific Islands 11,644 11,337 11,375 4.1 0.3 0.4Other Oceania 3 3 0 0.0 -95.7 -45.4
Other 14,879 10,573 16,016 5.8 51.5 -9.1
Total (c) 268,719 271,476 277,900 2.4 1.9(a) Recorded trade basis. (b) May exclude selected confidential export commodities. Refer to Appendix G - DFAT adjustments to officialABS trade data - for more information and a list of the commodities excluded. (c) Balance of payments basis.Based on ABS trade data on DFAT STARS database (ABS catalogue 5368.0).
TABLE 34: AUSTRALIA'S MERCHANDISE IMPORTS BY ECONOMIC/COUNTRYAND REGIONAL GROUPS (a) (b)
(A$ million)
% growth

Page 92

Page 93
Section 7
Australia's major merchandisetrading partners
Top 20 exports and imports

Page 94
% growth2015-16 to 5 year
Rank Commodity 2014-15 2015-16 2016-17 2016-17 trendTop merchandise exports
Total merchandise exports 1,136,073 1,033,169 1,259,219 21.9 -7.01 222 Oil-seeds & oleaginous fruits, soft 253,222 350,595 515,962 47.2 0.72 321 Coal 104,064 84,246 132,025 56.7 -9.93 792 Aircraft, spacecraft & parts 1,109 1,405 49,861 .. 67.24 287 Other ores & concentrates (c) 286,038 55,077 43,095 -21.8 -30.35 542 Medicaments (incl veterinary) 16,181 27,075 41,311 52.6 1.96 278 Crude minerals, nes 34,009 35,867 32,929 -8.2 9.47 685 Lead 34,005 33,057 32,437 -1.9 ..8 288 Non-ferrous waste & scrap 18,404 43,019 24,938 -42.0 23.39 112 Alcoholic beverages 13,022 18,931 20,868 10.2 -1.7
10 689 Other non-ferrous metals 58,224 46,150 17,464 -62.2 4.811 057 Fruit & nuts 9,528 22,237 15,793 -29.0 42.612 674 Coated flat-rolled iron & steel 0 0 15,578 .. ..13 744 Mechanical handling equip & parts 2,695 1,472 15,258 936.4 66.314 012 Meat (excl beef), f.c.f. 16,025 16,757 11,790 -29.6 -0.615 625 Rubber tyres, treads & tubes 7,647 9,037 9,680 7.1 99.816 723 Civil engineering equipment & parts 8,951 16,625 9,656 -41.9 2.017 663 Mineral manufactures, nes 6,233 4,381 9,005 105.5 228.318 011 Beef, f.c.f. 11,077 8,490 8,675 2.2 14.319 714 Non-electric engines & motors 0 0 8,347 .. ..20 575 Other primary plastics 4,053 6,886 6,718 -2.4 4.0
988 Confidential items of trade 47,377 127,675 119,422 .. ..Top merchandise imports
Total merchandise imports 1,663,202 1,631,671 1,849,883 13.4 1.21 781 Passenger motor vehicles 204,314 161,618 318,974 97.4 -7.52 542 Medicaments (incl veterinary) 308,177 258,527 291,434 12.7 2.73 541 Pharm products (excl medicaments) 234,893 192,011 187,296 -2.5 2.04 651 Textile yarn 48,174 66,893 55,035 -17.7 10.85 792 Aircraft, spacecraft & parts 1,370 525 50,680 .. ..6 721 Agric machinery (excl tractors) & parts 29,275 46,378 48,650 4.9 57.07 073 Chocolate & preparations of cocoa 35,844 50,436 44,073 -12.6 7.88 642 Paper & paperboard, cut to size 51,414 54,781 43,056 -21.4 11.99 562 Fertilisers (excl crude) 30,307 37,019 34,840 -5.9 11.2
10 893 Plastic articles, nes 23,271 30,325 27,332 -9.9 8.611 582 Plastic plates, sheets & film 19,971 25,652 25,631 -0.1 9.412 553 Perfumery & cosmetics (excl soap) 19,180 24,676 24,901 0.9 11.213 056 Vegetables, prepared or preserved 14,408 20,574 22,274 8.3 12.714 048 Cereal preparations 19,308 22,273 21,753 -2.3 13.915 743 Pumps (excl liquid pumps) & parts 29,936 21,769 19,799 -9.0 -15.316 287 Other ores & concentrates 0 12,729 18,388 44.5 ..17 112 Alcoholic beverages 9,311 9,323 18,260 95.9 15.318 597 Prepared additives for mineral oils 15,193 15,236 18,059 18.5 11.019 591 Insecticides, herbicides, disinfectants 8,774 18,546 17,134 -7.6 10.720 054 Vegetables, f.c.f. 13,247 15,800 17,108 8.3 21.6
988 Confidential items of trade 7,374 7,192 15,148 .. ..
(a) Rank based on 2016-17. (b) May exclude selected confidential export and import commodities. Refer to the DFAT website(http://dfat.gov.au/about-us/publications/trade-investment/Pages/dfat-adjustments-to-abs-official-trade-data.aspx)for more information and a list of the commodities excluded.(c) Mainly Manganese and Zinc ores & concentrates .Based on ABS trade data on DFAT STARS database (ABS catalogue 5368.0) and unpublished ABS data.
TABLE 35: AUSTRALIA'S MERCHANDISE TRADE WITH BELGIUM (a)(b)(A$'000)
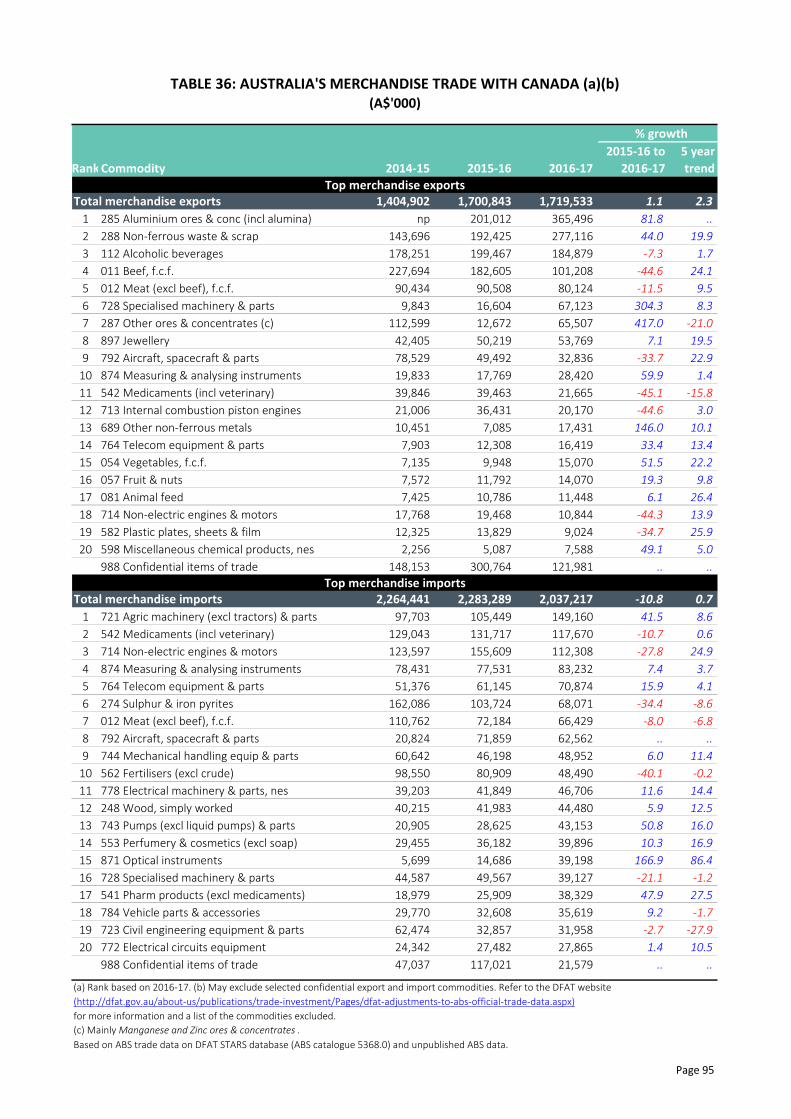
Page 95
% growth2015-16 to 5 year
Rank Commodity 2014-15 2015-16 2016-17 2016-17 trendTop merchandise exports
Total merchandise exports 1,404,902 1,700,843 1,719,533 1.1 2.31 285 Aluminium ores & conc (incl alumina) np 201,012 365,496 81.8 ..2 288 Non-ferrous waste & scrap 143,696 192,425 277,116 44.0 19.93 112 Alcoholic beverages 178,251 199,467 184,879 -7.3 1.74 011 Beef, f.c.f. 227,694 182,605 101,208 -44.6 24.15 012 Meat (excl beef), f.c.f. 90,434 90,508 80,124 -11.5 9.56 728 Specialised machinery & parts 9,843 16,604 67,123 304.3 8.37 287 Other ores & concentrates (c) 112,599 12,672 65,507 417.0 -21.08 897 Jewellery 42,405 50,219 53,769 7.1 19.59 792 Aircraft, spacecraft & parts 78,529 49,492 32,836 -33.7 22.9
10 874 Measuring & analysing instruments 19,833 17,769 28,420 59.9 1.411 542 Medicaments (incl veterinary) 39,846 39,463 21,665 -45.1 -15.812 713 Internal combustion piston engines 21,006 36,431 20,170 -44.6 3.013 689 Other non-ferrous metals 10,451 7,085 17,431 146.0 10.114 764 Telecom equipment & parts 7,903 12,308 16,419 33.4 13.415 054 Vegetables, f.c.f. 7,135 9,948 15,070 51.5 22.216 057 Fruit & nuts 7,572 11,792 14,070 19.3 9.817 081 Animal feed 7,425 10,786 11,448 6.1 26.418 714 Non-electric engines & motors 17,768 19,468 10,844 -44.3 13.919 582 Plastic plates, sheets & film 12,325 13,829 9,024 -34.7 25.920 598 Miscellaneous chemical products, nes 2,256 5,087 7,588 49.1 5.0
988 Confidential items of trade 148,153 300,764 121,981 .. ..Top merchandise imports
Total merchandise imports 2,264,441 2,283,289 2,037,217 -10.8 0.71 721 Agric machinery (excl tractors) & parts 97,703 105,449 149,160 41.5 8.62 542 Medicaments (incl veterinary) 129,043 131,717 117,670 -10.7 0.63 714 Non-electric engines & motors 123,597 155,609 112,308 -27.8 24.94 874 Measuring & analysing instruments 78,431 77,531 83,232 7.4 3.75 764 Telecom equipment & parts 51,376 61,145 70,874 15.9 4.16 274 Sulphur & iron pyrites 162,086 103,724 68,071 -34.4 -8.67 012 Meat (excl beef), f.c.f. 110,762 72,184 66,429 -8.0 -6.88 792 Aircraft, spacecraft & parts 20,824 71,859 62,562 .. ..9 744 Mechanical handling equip & parts 60,642 46,198 48,952 6.0 11.4
10 562 Fertilisers (excl crude) 98,550 80,909 48,490 -40.1 -0.211 778 Electrical machinery & parts, nes 39,203 41,849 46,706 11.6 14.412 248 Wood, simply worked 40,215 41,983 44,480 5.9 12.513 743 Pumps (excl liquid pumps) & parts 20,905 28,625 43,153 50.8 16.014 553 Perfumery & cosmetics (excl soap) 29,455 36,182 39,896 10.3 16.915 871 Optical instruments 5,699 14,686 39,198 166.9 86.416 728 Specialised machinery & parts 44,587 49,567 39,127 -21.1 -1.217 541 Pharm products (excl medicaments) 18,979 25,909 38,329 47.9 27.518 784 Vehicle parts & accessories 29,770 32,608 35,619 9.2 -1.719 723 Civil engineering equipment & parts 62,474 32,857 31,958 -2.7 -27.920 772 Electrical circuits equipment 24,342 27,482 27,865 1.4 10.5
988 Confidential items of trade 47,037 117,021 21,579 .. ..
(a) Rank based on 2016-17. (b) May exclude selected confidential export and import commodities. Refer to the DFAT website(http://dfat.gov.au/about-us/publications/trade-investment/Pages/dfat-adjustments-to-abs-official-trade-data.aspx)for more information and a list of the commodities excluded.(c) Mainly Manganese and Zinc ores & concentrates .Based on ABS trade data on DFAT STARS database (ABS catalogue 5368.0) and unpublished ABS data.
TABLE 36: AUSTRALIA'S MERCHANDISE TRADE WITH CANADA (a)(b)(A$'000)

Page 96
% growth2015-16 to 5 year
Rank Commodity 2014-15 2015-16 2016-17 2016-17 trendTop merchandise exports
Total merchandise exports 75,401,360 75,332,073 95,729,886 27.1 3.61 281 Iron ores & concentrates 42,103,334 38,775,777 51,708,295 33.4 0.92 321 Coal 7,510,506 5,607,752 11,160,274 99.0 5.03 268 Wool & other animal hair (incl tops) 2,018,196 2,032,188 2,439,761 20.1 4.54 971 Gold 868,892 3,542,790 2,319,486 -34.5 175.55 283 Copper ores & concentrates 1,764,971 1,598,408 1,476,775 -7.6 0.36 098 Edible products & preparations, nes 297,700 966,097 1,336,609 38.4 63.47 682 Copper 1,893,899 1,992,101 1,221,445 -38.7 3.78 043 Barley (c) 1,463,824 834,167 1,044,329 25.2 18.99 285 Aluminium ores & conc (incl alumina) 900,680 969,299 1,018,962 5.1 35.0
10 542 Medicaments (incl veterinary) 232,096 602,173 804,028 33.5 2.511 011 Beef, f.c.f. 758,311 866,522 746,648 -13.8 53.112 287 Other ores & concentrates (d) 1,794,031 954,796 688,202 -27.9 -16.813 333 Crude petroleum np 985,380 678,008 .. ..14 211 Hides & skins, raw (excl furskins) 884,913 820,584 677,718 -17.4 1.815 246 Wood in chips or particles 262,767 626,564 671,303 7.1 ..16 112 Alcoholic beverages 271,135 417,649 600,942 43.9 22.817 278 Crude minerals, nes 187,849 220,168 559,502 154.1 33.718 247 Wood, rough 280,261 394,104 555,909 41.1 35.019 041 Wheat 322,058 425,066 491,837 15.7 1.420 263 Cotton 850,539 635,802 463,822 -27.0 -26.1
988 Confidential items of trade 5,057,823 5,612,350 8,941,911 .. ..Top merchandise imports
Total merchandise imports 57,101,992 61,473,537 61,491,991 0.0 8.51 764 Telecom equipment & parts 6,353,414 6,862,628 7,003,202 2.0 10.62 752 Computers 5,201,961 5,042,569 5,072,001 0.6 3.33 821 Furniture, mattresses & cushions 2,483,159 2,837,955 2,615,156 -7.9 10.14 894 Prams, toys, games & sporting goods 1,959,570 2,085,213 2,261,226 8.4 7.05 845 Other textile clothing 1,715,798 1,947,746 1,882,964 -3.3 7.66 893 Plastic articles, nes 1,434,987 1,722,171 1,746,359 1.4 15.27 775 Household-type equipment, nes 1,185,194 1,386,749 1,348,962 -2.7 11.48 334 Refined petroleum 856,832 997,121 1,292,587 29.6 193.79 699 Manufactures of base metal, nes 1,129,484 1,275,292 1,288,039 1.0 10.5
10 842 Women's clothing (excl knitted) 1,248,079 1,371,162 1,285,930 -6.2 5.011 778 Electrical machinery & parts, nes 1,080,779 1,220,611 1,244,724 2.0 11.012 851 Footwear 1,197,460 1,348,514 1,217,232 -9.7 6.113 761 Monitors, projectors & TVs 854,828 1,160,874 1,161,779 0.1 6.714 658 Made-up textile articles, nes 945,824 1,115,308 1,115,332 0.0 12.215 813 Lighting fixtures & fittings 844,667 995,508 949,421 -4.6 18.516 691 Iron, steel, aluminium structures 1,549,762 1,278,380 897,050 -29.8 8.617 831 Travel goods, bags & like containers 808,544 879,567 840,902 -4.4 8.718 841 Men's clothing (excl knitted) 794,423 866,225 807,968 -6.7 5.219 776 Electronic integrated circuits 635,363 516,490 715,161 38.5 -3.520 773 Electrical distributing equipment 733,333 705,787 709,843 0.6 10.3
988 Confidential items of trade 796,401 778,544 1,484,670 .. ..
(a) Rank based on 2016-17. (b) May exclude selected confidential export and import commodities. Refer to the DFAT website(http://dfat.gov.au/about-us/publications/trade-investment/Pages/dfat-adjustments-to-abs-official-trade-data.aspx)for more information and a list of the commodities excluded. (c) Only includes data up to March 2017. (d) Mainly Manganese and Zinc ores & concentrates.Based on ABS trade data on DFAT STARS database (ABS catalogue 5368.0) and unpublished ABS data.
TABLE 37: AUSTRALIA'S MERCHANDISE TRADE WITH CHINA (a)(b)(A$'000)

Page 97
% growth2015-16 to 5 year
Rank Commodity 2014-15 2015-16 2016-17 2016-17 trendTop merchandise exports
Total merchandise exports 1,089,789 1,129,524 1,424,835 26.1 2.51 321 Coal 447,182 431,843 716,939 66.0 2.82 222 Oil-seeds & oleaginous fruits, soft 109,246 132,153 242,786 83.7 32.13 792 Aircraft, spacecraft & parts 116,576 149,496 89,515 -40.1 -0.24 012 Meat (excl beef), f.c.f. 19,795 21,813 19,765 -9.4 20.15 874 Measuring & analysing instruments 37,555 25,847 17,875 -30.8 10.46 211 Hides & skins, raw (excl furskins) 22,637 20,353 16,778 -17.6 -5.07 542 Medicaments (incl veterinary) 24,890 8,882 15,820 78.1 -10.68 772 Electrical circuits equipment 10,582 11,330 13,241 16.9 10.29 764 Telecom equipment & parts 9,341 9,191 9,940 8.2 5.0
10 522 Inorganic chemical elements 4,505 6,160 9,617 56.1 21.511 112 Alcoholic beverages 4,548 8,144 9,238 13.4 -0.212 057 Fruit & nuts 9,926 14,224 8,192 -42.4 28.513 292 Crude vegetable matter, nes 10,511 7,183 7,076 -1.5 16.414 778 Electrical machinery & parts, nes 5,818 7,623 6,640 -12.9 -17.315 752 Computers 4,142 1,762 6,250 254.7 -3.316 728 Specialised machinery & parts 6,179 5,811 6,105 5.1 22.117 872 Medical instruments (incl veterinary) 5,684 5,976 6,012 0.6 1.118 791 Railway vehicles (incl hovertrains) 7,789 5,525 5,984 8.3 114.719 743 Pumps (excl liquid pumps) & parts 6,850 7,165 5,811 -18.9 4.820 551 Essential oils & perfumes 3,417 4,970 4,698 -5.5 16.6
988 Confidential items of trade 93,271 128,152 105,015 .. ..Top merchandise imports
Total merchandise imports 4,601,372 4,703,216 4,575,881 -2.7 -2.01 542 Medicaments (incl veterinary) 486,174 480,376 481,066 0.1 -5.92 553 Perfumery & cosmetics (excl soap) 291,953 341,643 358,363 4.9 9.73 112 Alcoholic beverages 350,746 385,081 353,645 -8.2 9.24 792 Aircraft, spacecraft & parts 39,859 163,383 177,008 .. ..5 723 Civil engineering equipment & parts 86,707 71,634 141,465 97.5 -17.06 831 Travel goods, bags & like containers 89,776 126,185 139,961 10.9 17.47 874 Measuring & analysing instruments 171,315 174,507 115,412 -33.9 6.08 744 Mechanical handling equip & parts 73,513 99,139 105,650 6.6 8.79 782 Goods vehicles 81,366 123,657 104,048 -15.9 37.6
10 897 Jewellery 28,769 59,722 100,024 67.5 41.111 899 Misc manufactured articles, nes 78,018 78,170 88,385 13.1 7.612 764 Telecom equipment & parts 80,051 103,516 87,538 -15.4 10.713 772 Electrical circuits equipment 97,040 74,652 86,773 16.2 -5.114 714 Non-electric engines & motors 168,253 132,051 86,444 -34.5 11.315 784 Vehicle parts & accessories 67,200 56,071 65,326 16.5 -2.416 515 Organo-inorganic compounds 7,052 45,673 60,125 31.6 37.217 541 Pharm products (excl medicaments) 66,501 49,944 54,709 9.5 -6.618 741 Heating & cooling equipment & parts 48,148 84,324 52,002 -38.3 28.519 635 Wood manufactures, nes 43,354 48,216 51,929 7.7 7.020 722 Tractors 45,637 63,047 50,312 -20.2 5.9
988 Confidential items of trade 494,379 36,172 111,264 .. ..
(a) Rank based on 2016-17. (b) May exclude selected confidential export and import commodities. Refer to the DFAT website(http://dfat.gov.au/about-us/publications/trade-investment/Pages/dfat-adjustments-to-abs-official-trade-data.aspx)for more information and a list of the commodities excluded.Based on ABS trade data on DFAT STARS database (ABS catalogue 5368.0) and unpublished ABS data.
TABLE 38: AUSTRALIA'S MERCHANDISE TRADE WITH FRANCE (a)(b)(A$'000)

Page 98
% growth2015-16 to 5 year
Rank Commodity 2014-15 2015-16 2016-17 2016-17 trendTop merchandise exports
Total merchandise exports 1,604,169 2,201,987 2,658,560 20.7 3.91 222 Oil-seeds & oleaginous fruits, soft 61,183 332,407 895,307 169.3 36.92 951 Gold coin & legal tender coin 304,556 506,917 436,981 -13.8 3.13 289 Precious metal ores & conc (excl gold) 263,012 212,392 294,341 38.6 2.24 321 Coal 92,263 151,992 107,588 -29.2 -9.15 541 Pharm products (excl medicaments) 62,115 121,489 101,706 -16.3 14.46 971 Gold 35,945 65,739 68,413 4.1 -11.07 287 Other ores & concentrates (c) 42,787 49,219 60,638 23.2 0.88 057 Fruit & nuts 46,764 73,148 54,576 -25.4 31.39 874 Measuring & analysing instruments 43,908 35,005 48,921 39.8 -14.8
10 872 Medical instruments (incl veterinary) 58,833 41,393 42,093 1.7 -0.211 792 Aircraft, spacecraft & parts 32,655 55,881 35,939 -35.7 21.212 112 Alcoholic beverages 24,929 27,342 32,832 20.1 4.613 522 Inorganic chemical elements 43,335 41,048 28,422 -30.8 4.614 764 Telecom equipment & parts 24,669 27,154 27,862 2.6 10.015 728 Specialised machinery & parts 12,362 18,464 23,761 28.7 6.916 772 Electrical circuits equipment 12,841 12,141 21,245 75.0 -2.817 899 Misc manufactured articles, nes 15,163 19,075 20,192 5.9 19.318 897 Jewellery 38,466 28,195 17,955 -36.3 -13.119 542 Medicaments (incl veterinary) 15,199 19,477 13,658 -29.9 -5.520 012 Meat (excl beef), f.c.f. 12,917 17,675 13,310 -24.7 -6.6
988 Confidential items of trade 25,266 19,519 13,692 .. ..Top merchandise imports
Total merchandise imports 11,955,753 13,237,775 13,558,524 2.4 4.51 781 Passenger motor vehicles 2,842,975 3,486,262 3,353,369 -3.8 8.82 542 Medicaments (incl veterinary) 1,132,969 1,276,523 1,147,950 -10.1 8.43 541 Pharm products (excl medicaments) 237,453 446,190 466,536 4.6 25.54 782 Goods vehicles 206,403 334,718 398,568 19.1 6.85 728 Specialised machinery & parts 235,211 267,687 301,705 12.7 -9.16 874 Measuring & analysing instruments 324,732 285,619 276,529 -3.2 -3.37 744 Mechanical handling equip & parts 236,483 224,189 249,486 11.3 -1.88 743 Pumps (excl liquid pumps) & parts 300,748 232,014 248,472 7.1 1.19 784 Vehicle parts & accessories 217,200 239,311 240,779 0.6 -1.2
10 774 Medical electrodiagnostic apparatus 175,184 238,952 219,038 -8.3 13.711 775 Household-type equipment, nes 170,441 197,774 214,763 8.6 4.812 745 Non-electrical machinery & parts 199,593 170,149 205,088 20.5 5.313 721 Agric machinery (excl tractors) & parts 66,493 124,408 204,837 64.6 30.714 872 Medical instruments (incl veterinary) 188,871 222,899 191,929 -13.9 7.415 793 Ships, boats & floating structures 10,010 12,020 185,630 .. 57.516 792 Aircraft, spacecraft & parts 10,436 67,689 167,740 .. ..17 778 Electrical machinery & parts, nes 160,446 163,823 164,005 0.1 1.918 723 Civil engineering equipment & parts 156,096 117,235 158,783 35.4 -24.919 772 Electrical circuits equipment 147,593 167,154 147,825 -11.6 -1.820 971 Gold 8,883 11,730 146,971 .. 46.9
988 Confidential items of trade 268,341 66,778 102,325 .. ..
(a) Rank based on 2016-17. (b) May exclude selected confidential export and import commodities. Refer to the DFAT website(http://dfat.gov.au/about-us/publications/trade-investment/Pages/dfat-adjustments-to-abs-official-trade-data.aspx)for more information and a list of the commodities excluded.(c) Mainly Manganese and Zinc ores & concentrates .Based on ABS trade data on DFAT STARS database (ABS catalogue 5368.0) and unpublished ABS data.
TABLE 39: AUSTRALIA'S MERCHANDISE TRADE WITH GERMANY (a)(b)(A$'000)

Page 99
% growth2015-16 to 5 year
Rank Commodity 2014-15 2015-16 2016-17 2016-17 trendTop merchandise exports
Total merchandise exports 9,134,780 8,871,331 12,925,770 45.7 12.61 971 Gold 6,317,927 5,586,589 9,614,772 72.1 16.62 098 Edible products & preparations, nes 161,644 366,637 425,310 16.0 95.13 764 Telecom equipment & parts 218,421 328,404 287,386 -12.5 10.64 057 Fruit & nuts 191,525 198,167 191,244 -3.5 12.45 112 Alcoholic beverages 140,433 148,682 153,850 3.5 15.96 036 Crustaceans, f.c.f. 142,357 172,576 153,329 -11.2 -15.57 667 Pearls & gems 166,422 163,451 134,751 -17.6 1.78 012 Meat (excl beef), f.c.f. 205,415 132,129 113,273 -14.3 -0.59 541 Pharm products (excl medicaments) 26,596 115,803 112,465 -2.9 50.4
10 542 Medicaments (incl veterinary) 52,473 36,755 101,909 177.3 -11.611 553 Perfumery & cosmetics (excl soap) 61,455 81,137 90,397 11.4 25.712 686 Zinc 120,139 55,035 81,353 47.8 -8.013 884 Optical goods, nes 26,925 64,250 80,435 25.2 53.314 011 Beef, f.c.f. 125,618 77,324 77,386 0.1 3.915 022 Milk, cream, whey & yoghurt 45,054 59,796 62,661 4.8 8.416 291 Crude animal matter, nes 27,677 57,275 58,381 1.9 77.717 752 Computers 39,269 61,798 56,526 -8.5 17.118 001 Live animals (excl seafood) 44,620 64,394 53,883 -16.3 17.319 951 Gold coin & legal tender coin 34,132 29,404 46,366 57.7 -6.220 897 Jewellery 39,724 52,514 43,081 -18.0 5.9
988 Confidential items of trade 69,613 79,895 155,979 .. ..Top merchandise imports
Total merchandise imports 1,215,484 1,052,510 858,652 -18.4 -5.21 764 Telecom equipment & parts 83,458 96,522 148,587 53.9 7.82 971 Gold 11,607 43,156 110,695 156.5 4.63 667 Pearls & gems 39,378 36,100 44,840 24.2 1.14 897 Jewellery 47,953 50,138 41,619 -17.0 -4.95 892 Printed matter 74,533 65,259 33,371 -48.9 -8.96 098 Edible products & preparations, nes 33,665 29,550 26,262 -11.1 5.57 885 Watches & clocks 30,552 29,468 24,069 -18.3 0.68 894 Prams, toys, games & sporting goods 41,709 39,935 20,658 -48.3 -2.19 681 Silver & platinum 12,359 22,739 19,108 -16.0 26.8
10 778 Electrical machinery & parts, nes 32,232 28,283 16,257 -42.5 -3.611 122 Tobacco, manufactured 13,141 14,680 15,035 2.4 11.212 772 Electrical circuits equipment 22,845 22,717 13,326 -41.3 -0.913 699 Manufactures of base metal, nes 25,938 22,121 13,195 -40.4 -11.914 334 Refined petroleum 6,162 7,924 12,435 56.9 73.515 541 Pharm products (excl medicaments) 5,136 10,428 12,184 16.8 26.616 831 Travel goods, bags & like containers 29,096 19,837 11,833 -40.3 -11.417 751 Office machines 5,186 18,514 11,583 -37.4 18.818 775 Household-type equipment, nes 16,413 11,601 11,553 -0.4 -8.519 792 Aircraft, spacecraft & parts 3,582 3,141 11,183 256.1 6.120 893 Plastic articles, nes 32,572 25,864 10,829 -58.1 -16.4
988 Confidential items of trade 4,627 1,531 3,890 .. ..
(a) Rank based on 2016-17. (b) May exclude selected confidential export and import commodities. Refer to the DFAT website(http://dfat.gov.au/about-us/publications/trade-investment/Pages/dfat-adjustments-to-abs-official-trade-data.aspx)for more information and a list of the commodities excluded.Based on ABS trade data on DFAT STARS database (ABS catalogue 5368.0) and unpublished ABS data.
TABLE 40: AUSTRALIA'S MERCHANDISE TRADE WITH HONG KONG (SAR OF CHINA) (a)(b)(A$'000)

Page 100
% growth2015-16 to 5 year
Rank Commodity 2014-15 2015-16 2016-17 2016-17 trendTop merchandise exports
Total merchandise exports 9,748,379 9,708,059 15,126,647 55.8 1.11 321 Coal 5,516,364 5,010,019 8,749,582 74.6 5.02 054 Vegetables, f.c.f. 252,751 744,370 1,429,786 92.1 41.03 041 Wheat 79,957 72,851 743,322 920.3 300.74 283 Copper ores & concentrates 801,652 511,071 682,071 33.5 -16.45 971 Gold 898,660 685,504 409,597 -40.2 -31.06 263 Cotton 51,663 62,813 394,002 527.3 87.17 268 Wool & other animal hair (incl tops) 183,744 215,275 222,831 3.5 4.78 057 Fruit & nuts 175,938 122,410 145,676 19.0 22.39 288 Non-ferrous waste & scrap 109,055 127,846 122,514 -4.2 22.6
10 685 Lead 111,912 110,800 116,907 5.5 10.711 282 Ferrous waste & scrap 137,007 96,493 86,898 -9.9 7.512 533 Pigments, paints & varnishes 79,945 62,810 83,958 33.7 9.713 684 Aluminium 46,430 48,296 79,730 65.1 21.914 641 Paper & paperboard 28,926 19,546 74,485 281.1 18.515 287 Other ores & concentrates (c) 142,885 123,521 44,001 -64.4 -22.316 333 Crude petroleum np 41,607 23,752 -42.9 ..17 899 Misc manufactured articles, nes 17,089 15,444 23,568 52.6 11.518 284 Nickel ores & concentrates 31,493 37,839 21,859 -42.2 26.819 686 Zinc 26,308 20,211 20,354 0.7 16.120 542 Medicaments (incl veterinary) 38,280 21,292 19,307 -9.3 -4.4
988 Confidential items of trade 509,521 1,051,985 1,289,274 .. ..Top merchandise imports
Total merchandise imports 3,804,474 4,756,123 4,467,641 -6.1 16.31 334 Refined petroleum 909,911 1,573,010 1,081,099 -31.3 78.22 542 Medicaments (incl veterinary) 246,572 320,971 343,270 6.9 17.73 667 Pearls & gems 239,022 271,661 268,054 -1.3 12.24 658 Made-up textile articles, nes 145,922 165,543 176,356 6.5 11.85 897 Jewellery 148,921 175,455 172,273 -1.8 6.56 791 Railway vehicles (incl hovertrains) 11,502 33,330 123,560 270.7 110.77 515 Organo-inorganic compounds 87,091 79,509 120,282 51.3 10.88 842 Women's clothing (excl knitted) 72,385 88,484 95,009 7.4 22.29 659 Floor coverings 70,673 91,001 88,560 -2.7 15.8
10 845 Other textile clothing 56,678 73,362 79,908 8.9 25.111 781 Passenger motor vehicles 170,036 85,134 63,979 -24.8 -17.112 831 Travel goods, bags & like containers 46,111 60,485 63,169 4.4 19.113 821 Furniture, mattresses & cushions 49,763 58,871 58,039 -1.4 22.214 699 Manufactures of base metal, nes 47,900 52,442 56,041 6.9 7.215 591 Insecticides, herbicides, disinfectants 18,814 31,569 51,949 64.6 34.116 042 Rice 56,235 54,004 51,262 -5.1 17.317 772 Electrical circuits equipment 43,811 45,902 46,908 2.2 4.318 728 Specialised machinery & parts 29,785 49,185 42,124 -14.4 34.319 292 Crude vegetable matter, nes 37,490 40,190 39,073 -2.8 -7.020 851 Footwear 32,333 40,904 39,024 -4.6 14.6
988 Confidential items of trade 51,035 27,215 33,904 .. ..
(a) Rank based on 2016-17. (b) May exclude selected confidential export and import commodities. Refer to the DFAT website(http://dfat.gov.au/about-us/publications/trade-investment/Pages/dfat-adjustments-to-abs-official-trade-data.aspx)for more information and a list of the commodities excluded.(c) Mainly Manganese and Zinc ores & concentrates .Based on ABS trade data on DFAT STARS database (ABS catalogue 5368.0) and unpublished ABS data.
TABLE 41: AUSTRALIA'S MERCHANDISE TRADE WITH INDIA (a)(b)(A$'000)

Page 101
% growth2015-16 to 5 year
Rank Commodity 2014-15 2015-16 2016-17 2016-17 trendTop merchandise exports
Total merchandise exports 5,627,960 5,533,610 6,593,307 19.2 4.41 041 Wheat 1,402,753 1,127,079 1,263,146 12.1 -0.02 333 Crude petroleum 0 353,395 916,919 159.5 ..3 001 Live animals (excl seafood) 600,054 585,940 635,963 8.5 27.34 061 Sugars, molasses & honey 521,731 479,003 506,775 5.8 11.65 321 Coal 252,885 207,225 391,695 89.0 422.76 281 Iron ores & concentrates 213,280 180,836 292,348 61.7 ..7 011 Beef, f.c.f. 247,156 314,670 292,287 -7.1 16.18 263 Cotton 136,223 129,918 182,647 40.6 -10.89 684 Aluminium 156,552 95,124 152,938 60.8 -19.2
10 022 Milk, cream, whey & yoghurt 189,249 137,573 128,565 -6.5 3.711 686 Zinc 58,399 63,476 84,404 33.0 20.412 728 Specialised machinery & parts 67,114 91,113 78,095 -14.3 1.813 057 Fruit & nuts 59,286 91,608 77,316 -15.6 22.614 081 Animal feed 99,067 86,688 76,984 -11.2 -0.515 012 Meat (excl beef), f.c.f. 47,204 35,373 68,727 94.3 19.916 694 Nails, screws, nuts, bolts & rivets 45,385 52,592 66,523 26.5 50.217 282 Ferrous waste & scrap 72,855 53,190 58,928 10.8 -19.418 251 Pulp & waste paper 62,109 42,086 57,714 37.1 1.719 682 Copper 125,722 123,712 54,679 -55.8 -20.220 742 Pumps for liquids & parts 43,530 45,218 51,533 14.0 -7.6
988 Confidential items of trade 280,412 279,405 196,855 .. ..Top merchandise imports
Total merchandise imports 5,342,201 5,660,866 4,529,672 -20.0 -5.41 333 Crude petroleum 1,441,082 1,276,123 801,974 -37.2 -19.72 334 Refined petroleum 151,546 56,679 344,854 508.4 -11.73 741 Heating & cooling equipment & parts 288,519 97,175 311,448 220.5 74.44 248 Wood, simply worked 206,746 205,623 185,096 -10.0 3.75 728 Specialised machinery & parts 424,904 736,122 165,662 -77.5 60.96 851 Footwear 123,955 165,701 139,580 -15.8 20.77 641 Paper & paperboard 81,173 119,917 108,815 -9.3 16.38 761 Monitors, projectors & TVs 131,255 120,914 97,450 -19.4 11.09 699 Manufactures of base metal, nes 47,907 52,240 95,175 82.2 24.5
10 845 Other textile clothing 48,357 79,951 92,877 16.2 32.511 821 Furniture, mattresses & cushions 83,385 93,783 86,047 -8.2 6.512 562 Fertilisers (excl crude) 103,713 52,517 83,930 59.8 -1.613 625 Rubber tyres, treads & tubes 112,948 89,068 81,556 -8.4 -6.614 642 Paper & paperboard, cut to size 65,539 84,821 75,467 -11.0 18.715 842 Women's clothing (excl knitted) 44,864 59,907 64,512 7.7 25.816 841 Men's clothing (excl knitted) 48,640 65,867 63,283 -3.9 21.817 542 Medicaments (incl veterinary) 44,554 75,327 62,915 -16.5 37.218 072 Cocoa 58,620 78,410 58,898 -24.9 25.519 634 Veneers, plywood & particle board 46,500 56,910 56,098 -1.4 12.720 582 Plastic plates, sheets & film 51,599 50,066 53,861 7.6 11.1
988 Confidential items of trade 70,170 84,944 139,423 .. ..
(a) Rank based on 2016-17. (b) May exclude selected confidential export and import commodities. Refer to the DFAT website(http://dfat.gov.au/about-us/publications/trade-investment/Pages/dfat-adjustments-to-abs-official-trade-data.aspx)for more information and a list of the commodities excluded.Based on ABS trade data on DFAT STARS database (ABS catalogue 5368.0) and unpublished ABS data.
TABLE 42: AUSTRALIA'S MERCHANDISE TRADE WITH INDONESIA (a)(b)(A$'000)

Page 102
% growth2015-16 to 5 year
Rank Commodity 2014-15 2015-16 2016-17 2016-17 trendTop merchandise exports
Total merchandise exports 714,916 734,035 758,951 3.4 -5.41 268 Wool & other animal hair (incl tops) 143,099 159,143 184,804 16.1 1.52 321 Coal 90,152 105,644 162,932 54.2 -18.13 041 Wheat 60,252 73,161 61,143 -16.4 -9.64 011 Beef, f.c.f. 61,682 73,951 36,726 -50.3 16.65 673 Uncoated flat-rolled iron & steel 31,612 0 32,798 .. ..6 611 Leather 54,127 43,775 31,412 -28.2 -7.37 112 Alcoholic beverages 26,317 20,251 24,693 21.9 125.38 057 Fruit & nuts 31,935 39,681 23,973 -39.6 24.39 792 Aircraft, spacecraft & parts 9,122 9,054 11,301 24.8 23.4
10 211 Hides & skins, raw (excl furskins) 15,799 12,582 8,113 -35.5 -14.511 784 Vehicle parts & accessories 1,487 6,409 7,343 14.6 45.312 874 Measuring & analysing instruments 6,986 4,922 7,253 47.4 8.113 522 Inorganic chemical elements 4,869 4,415 7,152 62.0 10.814 034 Fish, f.c.f. 3,312 5,419 7,148 31.9 52.815 641 Paper & paperboard 8,462 14,842 5,573 -62.5 55.816 764 Telecom equipment & parts 8,431 7,940 5,358 -32.5 -2.817 513 Carboxylic acids & derivatives 5,053 3,201 4,846 51.4 -3.718 684 Aluminium 8,110 71 4,715 .. 136.619 897 Jewellery 2,180 2,084 4,304 106.5 12.620 542 Medicaments (incl veterinary) 2,048 2,578 4,234 64.2 -23.7
988 Confidential items of trade 40,745 31,262 28,095 .. ..Top merchandise imports
Total merchandise imports 5,983,405 6,009,361 6,008,421 0.0 2.81 542 Medicaments (incl veterinary) 271,151 336,732 331,593 -1.5 -15.12 781 Passenger motor vehicles 171,391 263,455 246,564 -6.4 19.83 792 Aircraft, spacecraft & parts 3,215 234,920 239,410 .. ..4 831 Travel goods, bags & like containers 126,989 168,142 203,357 20.9 27.35 741 Heating & cooling equipment & parts 177,052 193,590 202,880 4.8 10.26 541 Pharm products (excl medicaments) 117,302 99,016 183,563 85.4 11.77 744 Mechanical handling equip & parts 145,922 160,490 175,828 9.6 6.58 728 Specialised machinery & parts 134,142 136,982 150,542 9.9 9.39 775 Household-type equipment, nes 141,586 171,047 146,010 -14.6 5.4
10 821 Furniture, mattresses & cushions 129,221 154,863 140,848 -9.0 9.711 851 Footwear 112,397 127,068 140,353 10.5 10.312 897 Jewellery 119,248 128,357 132,415 3.2 10.413 747 Taps, cocks & valves 169,054 186,121 130,318 -30.0 3.714 745 Non-electrical machinery & parts 127,190 137,779 118,441 -14.0 3.315 056 Vegetables, prepared or preserved 118,339 134,793 117,818 -12.6 7.116 112 Alcoholic beverages 86,346 98,943 102,784 3.9 15.417 662 Clay construction materials 83,504 100,739 99,100 -1.6 18.618 553 Perfumery & cosmetics (excl soap) 71,807 86,713 98,703 13.8 15.819 723 Civil engineering equipment & parts 67,684 69,966 97,170 38.9 -3.620 884 Optical goods, nes 109,205 105,178 85,296 -18.9 0.3
988 Confidential items of trade 108,249 81,489 96,297 .. ..
(a) Rank based on 2016-17. (b) May exclude selected confidential export and import commodities. Refer to the DFAT website(http://dfat.gov.au/about-us/publications/trade-investment/Pages/dfat-adjustments-to-abs-official-trade-data.aspx)for more information and a list of the commodities excluded.Based on ABS trade data on DFAT STARS database (ABS catalogue 5368.0) and unpublished ABS data.
TABLE 43: AUSTRALIA'S MERCHANDISE TRADE WITH ITALY (a)(b)(A$'000)

Page 103
% growth2015-16 to 5 year
Rank Commodity 2014-15 2015-16 2016-17 2016-17 trendTop merchandise exports
Total merchandise exports 44,453,690 35,908,171 42,152,153 17.4 -5.11 321 Coal 11,713,729 11,202,678 15,173,472 35.4 -3.62 281 Iron ores & concentrates 6,696,084 4,682,084 5,376,892 14.8 -15.13 011 Beef, f.c.f. 1,857,757 1,813,293 1,910,154 5.3 5.44 283 Copper ores & concentrates 1,714,435 1,424,731 1,335,504 -6.3 -1.75 684 Aluminium 1,460,631 701,811 936,866 33.5 -7.06 061 Sugars, molasses & honey 165,317 234,559 396,947 69.2 9.77 024 Cheese & curd 407,367 409,812 374,450 -8.6 -1.38 012 Meat (excl beef), f.c.f. 292,297 344,428 355,915 3.3 8.39 287 Other ores & concentrates (c) 358,303 356,422 349,533 -1.9 -6.0
10 246 Wood in chips or particles 294,359 403,934 346,040 -14.3 24.311 041 Wheat 304,956 324,055 300,522 -7.3 -5.412 081 Animal feed 259,994 282,048 272,983 -3.2 -12.713 342 Liquefied propane & butane 482,870 214,006 262,767 22.8 -21.314 333 Crude petroleum np 284,250 232,676 .. ..15 043 Barley (d) 130,480 168,347 206,983 23.0 -7.316 034 Fish, f.c.f. 150,117 154,271 139,270 -9.7 -4.417 057 Fruit & nuts 64,557 107,409 128,087 19.3 19.718 872 Medical instruments (incl veterinary) 89,029 101,654 124,147 22.1 14.119 334 Refined petroleum 23,499 41,623 123,300 196.2 -13.220 289 Precious metal ores & conc (excl gold) 140,774 81,973 109,336 33.4 -2.5
988 Confidential items of trade 15,801,357 10,947,692 11,998,615 .. ..Top merchandise imports
Total merchandise imports 18,302,698 19,191,437 20,727,463 8.0 0.71 781 Passenger motor vehicles 6,100,959 6,625,253 7,447,070 12.4 0.22 971 Gold 293,026 1,132,076 2,587,135 128.5 28.23 334 Refined petroleum 3,059,694 2,587,144 2,521,233 -2.5 3.74 782 Goods vehicles 1,226,532 1,372,807 1,429,798 4.2 -1.35 723 Civil engineering equipment & parts 469,703 617,770 719,414 16.5 -6.66 625 Rubber tyres, treads & tubes 538,814 531,555 551,212 3.7 -6.77 784 Vehicle parts & accessories 369,818 424,195 458,311 8.0 -0.18 751 Office machines 411,153 337,632 310,750 -8.0 -4.39 778 Electrical machinery & parts, nes 221,577 224,327 224,820 0.2 -1.2
10 741 Heating & cooling equipment & parts 210,932 230,435 209,199 -9.2 -0.711 713 Internal combustion piston engines 200,915 204,793 196,069 -4.3 -9.312 764 Telecom equipment & parts 175,681 180,781 180,551 -0.1 -7.813 785 Motorcycles & cycles 173,847 175,706 173,853 -1.1 -3.214 783 Road motor vehicles, nes 168,056 144,504 159,522 10.4 -3.015 744 Mechanical handling equip & parts 136,969 142,944 138,439 -3.2 -12.916 874 Measuring & analysing instruments 132,230 143,359 137,777 -3.9 -0.417 743 Pumps (excl liquid pumps) & parts 169,741 132,310 124,844 -5.6 -3.218 884 Optical goods, nes 99,178 122,440 118,051 -3.6 13.119 872 Medical instruments (incl veterinary) 110,549 123,215 116,699 -5.3 7.820 898 Musical instruments & parts 103,946 94,850 110,860 16.9 0.3
988 Confidential items of trade 306,037 339,217 294,160 .. ..
(a) Rank based on 2016-17. (b) May exclude selected confidential export and import commodities. Refer to the DFAT website(http://dfat.gov.au/about-us/publications/trade-investment/Pages/dfat-adjustments-to-abs-official-trade-data.aspx)for more information and a list of the commodities excluded.(c) Mainly Manganese and Zinc ores & concentrates . (d) Only includes data up to March 2017.Based on ABS trade data on DFAT STARS database (ABS catalogue 5368.0) and unpublished ABS data.
TABLE 44: AUSTRALIA'S MERCHANDISE TRADE WITH JAPAN (a)(b)(A$'000)

Page 104
% growth2015-16 to 5 year
Rank Commodity 2014-15 2015-16 2016-17 2016-17 trendTop merchandise exports
Total merchandise exports 6,053,180 5,363,733 5,883,466 9.7 2.71 682 Copper 518,458 606,510 812,351 33.9 0.52 321 Coal 617,166 505,721 677,658 34.0 17.63 333 Crude petroleum np 281,350 422,955 .. ..4 041 Wheat 293,259 261,607 285,348 9.1 1.05 012 Meat (excl beef), f.c.f. 149,545 131,456 144,896 10.2 17.56 287 Other ores & concentrates (c) 108,282 120,258 112,482 -6.5 0.67 278 Crude minerals, nes 109,688 94,283 98,112 4.1 85.88 022 Milk, cream, whey & yoghurt 103,192 87,653 92,787 5.9 6.09 792 Aircraft, spacecraft & parts 17,420 36,847 87,369 137.1 41.0
10 282 Ferrous waste & scrap 70,961 13,874 82,503 494.7 -21.211 061 Sugars, molasses & honey 124,202 147,597 82,103 -44.4 -5.212 011 Beef, f.c.f. 80,520 74,031 75,590 2.1 4.113 684 Aluminium 177,369 152,310 66,694 -56.2 -15.514 334 Refined petroleum 93,434 25,770 64,843 151.6 -25.715 112 Alcoholic beverages 47,745 56,540 57,538 1.8 17.416 686 Zinc 52,360 50,833 55,481 9.1 5.317 283 Copper ores & concentrates 12,150 14,850 51,343 245.7 ..18 024 Cheese & curd 43,565 46,003 47,458 3.2 10.219 685 Lead 110,470 71,062 47,196 -33.6 -11.620 001 Live animals (excl seafood) 62,961 68,979 47,131 -31.7 13.8
988 Confidential items of trade 1,654,328 1,457,443 1,396,345 .. ..Top merchandise imports
Total merchandise imports 10,408,078 9,854,079 10,440,044 5.9 2.61 333 Crude petroleum 3,580,513 2,229,392 2,936,025 31.7 -8.32 334 Refined petroleum 814,901 1,242,494 1,919,667 54.5 34.53 752 Computers 464,251 511,396 533,182 4.3 -0.34 764 Telecom equipment & parts 365,258 400,501 356,867 -10.9 4.45 775 Household-type equipment, nes 190,239 225,922 303,105 34.2 22.46 761 Monitors, projectors & TVs 481,720 299,069 223,170 -25.4 -16.07 821 Furniture, mattresses & cushions 201,201 222,913 202,865 -9.0 4.68 893 Plastic articles, nes 140,376 169,582 171,469 1.1 16.89 582 Plastic plates, sheets & film 160,861 171,116 171,095 -0.0 11.7
10 776 Electronic integrated circuits 301,539 155,279 154,740 -0.3 2.611 422 Fixed vegetable oils & fats, hard 128,375 143,667 154,216 7.3 4.212 872 Medical instruments (incl veterinary) 90,572 108,865 141,185 29.7 45.913 682 Copper 169,725 119,578 139,319 16.5 36.314 741 Heating & cooling equipment & parts 184,632 436,990 123,119 -71.8 22.815 533 Pigments, paints & varnishes 17,662 62,908 98,299 56.3 42.716 848 Clothing accessories, nes 82,943 92,368 95,286 3.2 4.417 421 Fixed vegetable oils & fats, soft 84,170 90,563 85,708 -5.4 12.418 873 Meters & counters 16,294 39,483 85,087 115.5 89.619 562 Fertilisers (excl crude) 71,145 41,452 84,358 103.5 19.020 728 Specialised machinery & parts 109,298 182,759 77,704 -57.5 20.5
988 Confidential items of trade 372,648 349,894 157,869 .. ..
(a) Rank based on 2016-17. (b) May exclude selected confidential export and import commodities. Refer to the DFAT website(http://dfat.gov.au/about-us/publications/trade-investment/Pages/dfat-adjustments-to-abs-official-trade-data.aspx)for more information and a list of the commodities excluded.(c) Mainly Manganese and Zinc ores & concentrates .Based on ABS trade data on DFAT STARS database (ABS catalogue 5368.0) and unpublished ABS data.
TABLE 45: AUSTRALIA'S MERCHANDISE TRADE WITH MALAYSIA (a)(b)(A$'000)

Page 105
% growth2015-16 to 5 year
Rank Commodity 2014-15 2015-16 2016-17 2016-17 trendTop merchandise exports
Total merchandise exports 472,349 608,527 293,193 -51.8 -16.51 321 Coal 156,541 322,398 58,697 -81.8 -29.22 684 Aluminium 58,093 34,027 16,503 -51.5 -1.43 012 Meat (excl beef), f.c.f. 32,203 24,154 15,767 -34.7 21.54 287 Other ores & concentrates (c) 12,864 21,391 15,711 -26.6 12.65 745 Non-electrical machinery & parts 4,822 8,564 14,223 66.1 16.16 582 Plastic plates, sheets & film 15,262 12,283 11,125 -9.4 -18.17 045 Other cereals 0 130 8,728 .. ..8 562 Fertilisers (excl crude) 15,603 19,272 8,096 -58.0 96.69 772 Electrical circuits equipment 10,704 5,561 7,021 26.3 4.4
10 874 Measuring & analysing instruments 2,244 2,854 6,894 141.6 10.711 023 Butter 4,205 4,653 4,176 -10.3 -7.812 728 Specialised machinery & parts 2,327 3,710 3,793 2.2 -25.613 641 Paper & paperboard 6,981 1,521 3,085 102.9 -4.314 778 Electrical machinery & parts, nes 846 1,110 2,997 170.1 18.515 721 Agric machinery (excl tractors) & parts 304 78 2,989 .. 49.516 268 Wool & other animal hair (incl tops) 2,710 3,055 2,887 -5.5 3.917 741 Heating & cooling equipment & parts 1,191 839 2,380 183.9 19.418 723 Civil engineering equipment & parts 1,331 3,192 2,372 -25.7 -18.019 592 Starches, inulin & wheat gluten 2,958 2,078 2,358 13.5 -17.920 727 Food processing machines & parts 277 89 2,159 .. -14.2
988 Confidential items of trade 59,308 80,848 65,194 .. ..Top merchandise imports
Total merchandise imports 2,256,014 2,426,754 2,554,538 5.3 6.01 764 Telecom equipment & parts 237,175 357,228 439,724 23.1 8.22 872 Medical instruments (incl veterinary) 174,437 213,247 217,560 2.0 26.73 112 Alcoholic beverages 192,118 213,236 207,928 -2.5 16.04 287 Other ores & concentrates 188,817 197,898 198,332 0.2 0.15 752 Computers 105,614 134,792 141,284 4.8 12.56 713 Internal combustion piston engines 117,903 131,604 122,091 -7.2 7.47 781 Passenger motor vehicles 150,392 92,081 84,898 -7.8 -11.58 784 Vehicle parts & accessories 82,810 97,497 80,826 -17.1 -6.19 899 Misc manufactured articles, nes 39,953 57,107 69,232 21.2 35.2
10 743 Pumps (excl liquid pumps) & parts 60,531 54,657 67,236 23.0 10.811 874 Measuring & analysing instruments 59,926 64,372 62,718 -2.6 5.212 778 Electrical machinery & parts, nes 66,612 62,768 62,175 -0.9 10.813 772 Electrical circuits equipment 38,935 46,393 48,562 4.7 12.814 776 Electronic integrated circuits 2,547 2,503 37,418 .. 23.215 793 Ships, boats & floating structures 13,089 31,279 31,884 1.9 76.516 773 Electrical distributing equipment 65,154 56,569 28,201 -50.1 -0.917 742 Pumps for liquids & parts 22,206 22,828 26,405 15.7 8.618 542 Medicaments (incl veterinary) 27,109 20,909 25,726 23.0 1.819 782 Goods vehicles 8,755 29,854 25,722 -13.8 47.420 771 Electric power machinery & parts 6,954 7,449 25,475 242.0 38.9
988 Confidential items of trade 1,735 513 52,231 .. ..
(a) Rank based on 2016-17. (b) May exclude selected confidential export and import commodities. Refer to the DFAT website(http://dfat.gov.au/about-us/publications/trade-investment/Pages/dfat-adjustments-to-abs-official-trade-data.aspx)for more information and a list of the commodities excluded.(c) Mainly Manganese and Zinc ores & concentrates .Based on ABS trade data on DFAT STARS database (ABS catalogue 5368.0) and unpublished ABS data.
TABLE 46: AUSTRALIA'S MERCHANDISE TRADE WITH MEXICO (a)(b)(A$'000)

Page 106
% growth2015-16 to 5 year
Rank Commodity 2014-15 2015-16 2016-17 2016-17 trendTop merchandise exports
Total merchandise exports 2,361,160 2,215,372 3,146,789 42.0 -2.41 321 Coal 851,012 914,765 1,934,117 111.4 5.22 872 Medical instruments (incl veterinary) 240,887 226,165 250,014 10.5 20.23 011 Beef, f.c.f. 66,838 93,860 82,432 -12.2 36.64 222 Oil-seeds & oleaginous fruits, soft 126,604 162,754 75,049 -53.9 -29.05 112 Alcoholic beverages 74,159 60,168 66,941 11.3 -6.06 081 Animal feed 32,107 39,977 47,401 18.6 31.97 533 Pigments, paints & varnishes 17,357 18,124 37,300 105.8 85.78 792 Aircraft, spacecraft & parts 9,347 23,619 35,261 49.3 46.49 292 Crude vegetable matter, nes 26,338 30,724 24,252 -21.1 5.4
10 764 Telecom equipment & parts 16,245 15,928 22,716 42.6 25.011 012 Meat (excl beef), f.c.f. 7,133 14,356 22,182 54.5 5.512 541 Pharm products (excl medicaments) 34,065 29,287 21,815 -25.5 51.013 891 Arms & ammunition 19,642 33,967 21,276 -37.4 155.414 625 Rubber tyres, treads & tubes 8,864 15,295 20,513 34.1 101.015 057 Fruit & nuts 23,998 30,954 19,863 -35.8 18.116 752 Computers 5,419 8,802 13,872 57.6 67.217 277 Natural abrasives 5,543 9,836 13,305 35.3 ..18 684 Aluminium 5,894 793 12,703 .. 319.419 874 Measuring & analysing instruments 13,866 9,545 12,407 30.0 6.320 598 Miscellaneous chemical products, nes 7,217 20,104 12,234 -39.1 77.2
988 Confidential items of trade 266,181 147,753 199,738 .. ..Top merchandise imports
Total merchandise imports 2,043,737 2,178,349 2,374,858 9.0 6.31 541 Pharm products (excl medicaments) 118,808 147,069 212,897 44.8 25.02 542 Medicaments (incl veterinary) 176,887 180,717 202,385 12.0 -1.73 071 Coffee & substitutes 86,992 122,981 127,052 3.3 15.24 783 Road motor vehicles, nes 13 51,070 97,325 90.6 ..5 744 Mechanical handling equip & parts 97,718 65,644 80,214 22.2 5.06 122 Tobacco, manufactured 56,117 79,421 78,028 -1.8 19.57 012 Meat (excl beef), f.c.f. 68,161 45,869 77,836 69.7 10.08 098 Edible products & preparations, nes 45,778 85,998 69,859 -18.8 29.19 721 Agric machinery (excl tractors) & parts 30,350 34,465 47,936 39.1 10.1
10 112 Alcoholic beverages 41,957 49,057 45,642 -7.0 8.611 874 Measuring & analysing instruments 49,564 47,196 42,395 -10.2 3.712 745 Non-electrical machinery & parts 28,769 44,607 41,231 -7.6 15.813 056 Vegetables, prepared or preserved 43,658 32,923 40,092 21.8 6.714 727 Food processing machines & parts 38,759 30,884 39,272 27.2 5.415 691 Iron, steel, aluminium structures 23,793 12,451 37,693 202.7 18.216 764 Telecom equipment & parts 38,200 35,391 34,882 -1.4 14.117 292 Crude vegetable matter, nes 34,275 34,087 33,955 -0.4 -0.418 743 Pumps (excl liquid pumps) & parts 22,339 32,573 33,508 2.9 -10.519 728 Specialised machinery & parts 38,813 28,099 32,179 14.5 13.320 782 Goods vehicles 8,001 14,614 31,336 114.4 1.2
988 Confidential items of trade 80,067 12,163 31,410 .. ..
(a) Rank based on 2016-17. (b) May exclude selected confidential export and import commodities. Refer to the DFAT website(http://dfat.gov.au/about-us/publications/trade-investment/Pages/dfat-adjustments-to-abs-official-trade-data.aspx)for more information and a list of the commodities excluded.Based on ABS trade data on DFAT STARS database (ABS catalogue 5368.0) and unpublished ABS data.
TABLE 47: AUSTRALIA'S MERCHANDISE TRADE WITH NETHERLANDS (a)(b)(A$'000)

Page 107
% growth2015-16 to 5 year
Rank Commodity 2014-15 2015-16 2016-17 2016-17 trendTop merchandise exports
Total merchandise exports 8,298,404 8,665,302 8,848,393 2.1 3.81 872 Medical instruments (incl veterinary) 224,994 280,148 331,736 18.4 16.32 752 Computers 220,056 183,997 317,901 72.8 18.33 542 Medicaments (incl veterinary) 246,012 258,382 276,736 7.1 -0.54 781 Passenger motor vehicles 274,775 235,874 245,865 4.2 0.15 285 Aluminium ores & conc (incl alumina) np 153,648 228,088 48.4 ..6 764 Telecom equipment & parts 177,998 265,366 219,412 -17.3 24.47 098 Edible products & preparations, nes 212,033 280,129 216,319 -22.8 2.68 553 Perfumery & cosmetics (excl soap) 157,285 181,844 209,944 15.5 8.29 641 Paper & paperboard 167,775 200,845 195,668 -2.6 4.8
10 892 Printed matter 149,060 179,760 170,935 -4.9 1.211 048 Cereal preparations 154,704 144,156 160,445 11.3 2.312 334 Refined petroleum 63,726 49,316 152,394 209.0 -7.513 744 Mechanical handling equip & parts 87,249 101,847 150,455 47.7 11.314 784 Vehicle parts & accessories 111,552 134,140 145,596 8.5 8.215 081 Animal feed 133,926 113,468 140,678 24.0 -0.616 041 Wheat 174,897 156,597 137,043 -12.5 -0.717 893 Plastic articles, nes 119,645 120,819 128,914 6.7 6.518 073 Chocolate & preparations of cocoa 117,646 125,500 125,307 -0.2 4.019 112 Alcoholic beverages 104,585 117,017 124,772 6.6 3.520 699 Manufactures of base metal, nes 117,497 115,453 116,795 1.2 4.5
988 Confidential items of trade 364,499 230,429 169,236 .. ..Top merchandise imports
Total merchandise imports 7,775,948 7,686,080 7,632,772 -0.7 0.91 098 Edible products & preparations, nes 463,883 758,127 741,712 -2.2 24.22 333 Crude petroleum 1,102,582 769,043 572,098 -25.6 -17.63 971 Gold 577,807 574,193 518,477 -9.7 -1.44 122 Tobacco, manufactured 467,241 546,518 515,244 -5.7 76.55 112 Alcoholic beverages 380,442 376,978 400,776 6.3 1.76 024 Cheese & curd 225,427 259,901 306,777 18.0 10.87 057 Fruit & nuts 151,813 142,759 193,474 35.5 12.68 248 Wood, simply worked 203,993 201,249 179,485 -10.8 -0.49 048 Cereal preparations 169,307 171,312 176,055 2.8 4.6
10 023 Butter 88,443 90,934 158,553 74.4 15.111 034 Fish, f.c.f. 140,254 146,602 152,089 3.7 3.212 893 Plastic articles, nes 151,519 149,481 138,678 -7.2 -0.813 641 Paper & paperboard 115,509 132,569 133,218 0.5 -1.014 741 Heating & cooling equipment & parts 109,556 111,410 115,800 3.9 -1.415 022 Milk, cream, whey & yoghurt 92,051 82,158 115,344 40.4 1.216 659 Floor coverings 104,158 121,806 109,231 -10.3 4.417 056 Vegetables, prepared or preserved 111,973 99,407 107,185 7.8 3.618 111 Non-alcoholic beverages, nes 90,092 94,185 105,585 12.1 3.319 542 Medicaments (incl veterinary) 91,097 101,186 102,140 0.9 4.620 017 Meat, prepared or preserved 88,292 102,495 101,472 -1.0 12.2
988 Confidential items of trade 202,583 67,670 148,478 .. ..
(a) Rank based on 2016-17. (b) May exclude selected confidential export and import commodities. Refer to the DFAT website(http://dfat.gov.au/about-us/publications/trade-investment/Pages/dfat-adjustments-to-abs-official-trade-data.aspx)for more information and a list of the commodities excluded.Based on ABS trade data on DFAT STARS database (ABS catalogue 5368.0) and unpublished ABS data.
TABLE 48: AUSTRALIA'S MERCHANDISE TRADE WITH NEW ZEALAND (a)(b)(A$'000)

Page 108
% growth2015-16 to 5 year
Rank Commodity 2014-15 2015-16 2016-17 2016-17 trendTop merchandise exports
Total merchandise exports 2,002,217 1,640,485 1,716,582 4.6 -9.71 012 Meat (excl beef), f.c.f. 103,203 93,524 116,656 24.7 5.92 333 Crude petroleum 193,018 116,685 111,218 -4.7 -29.43 723 Civil engineering equipment & parts 106,799 97,945 79,635 -18.7 -14.84 041 Wheat 70,276 77,791 65,307 -16.0 8.05 728 Specialised machinery & parts 61,896 58,393 55,487 -5.0 -3.86 742 Pumps for liquids & parts 32,355 32,678 46,777 43.1 1.37 784 Vehicle parts & accessories 57,434 40,373 46,238 14.5 -8.98 744 Mechanical handling equip & parts 35,358 40,781 41,150 0.9 -4.89 747 Taps, cocks & valves 22,835 30,983 38,950 25.7 13.6
10 699 Manufactures of base metal, nes 28,038 28,001 38,650 38.0 -6.111 782 Goods vehicles 14,432 8,205 37,392 355.7 -29.812 792 Aircraft, spacecraft & parts 19,733 19,429 30,929 59.2 -1.613 718 Power generating machinery & parts 48,799 44,167 28,337 -35.8 -5.514 772 Electrical circuits equipment 26,107 26,362 24,646 -6.5 -13.815 752 Computers 19,648 22,774 24,409 7.2 10.616 679 Tubes & pipes of iron or steel 13,806 12,740 24,407 91.6 -6.517 748 Transmission shafts & parts 19,755 24,630 23,596 -4.2 24.618 334 Refined petroleum 21,409 13,908 23,349 67.9 -0.019 098 Edible products & preparations, nes 23,436 20,944 22,686 8.3 5.720 081 Animal feed 28,428 31,857 22,638 -28.9 -4.4
988 Confidential items of trade 132,865 40,264 23,750 .. ..Top merchandise imports
Total merchandise imports 3,402,129 3,312,699 3,471,159 4.8 0.61 971 Gold 1,996,382 2,509,277 2,647,999 5.5 6.72 333 Crude petroleum 980,899 404,423 545,756 34.9 -13.33 681 Silver & platinum 323,664 295,775 176,565 -40.3 -9.94 071 Coffee & substitutes 30,806 40,460 33,821 -16.4 -3.75 334 Refined petroleum 561 16,003 26,117 63.2 104.96 634 Veneers, plywood & particle board 6,951 6,265 7,175 14.5 -2.27 081 Animal feed 6,733 6,511 6,509 -0.0 13.98 075 Spices 1,769 3,151 4,084 29.6 30.99 036 Crustaceans, f.c.f. 4,114 5,646 3,473 -38.5 19.9
10 288 Non-ferrous waste & scrap 3,977 3,284 2,271 -30.9 -3.411 248 Wood, simply worked 1,981 2,123 1,907 -10.2 -11.712 786 Trailers, semi-trailers & containers 157 215 1,775 726.8 -10.613 714 Non-electric engines & motors 92 588 1,603 172.5 62.314 723 Civil engineering equipment & parts 1,774 1,502 1,220 -18.8 -17.315 896 Artwork & antiques 280 253 1,111 339.0 -14.716 792 Aircraft, spacecraft & parts 312 1,162 765 -34.1 173.417 692 Metal containers 1 0 758 .. ..18 784 Vehicle parts & accessories 891 920 714 -22.4 -29.819 713 Internal combustion piston engines 320 1,362 671 -50.7 -29.020 523 Salts of inorganic acids & metals 10 54 596 998.0 ..
988 Confidential items of trade 244 416 70 .. ..
(a) Rank based on 2016-17. (b) May exclude selected confidential export and import commodities. Refer to the DFAT website(http://dfat.gov.au/about-us/publications/trade-investment/Pages/dfat-adjustments-to-abs-official-trade-data.aspx)for more information and a list of the commodities excluded.Based on ABS trade data on DFAT STARS database (ABS catalogue 5368.0) and unpublished ABS data.
TABLE 49: AUSTRALIA'S MERCHANDISE TRADE WITH PAPUA NEW GUINEA (a)(b)(A$'000)

Page 109
% growth2015-16 to 5 year
Rank Commodity 2014-15 2015-16 2016-17 2016-17 trendTop merchandise exports
Total merchandise exports 1,638,351 1,701,366 2,397,811 40.9 6.81 041 Wheat 225,007 245,870 521,285 112.0 5.52 289 Precious metal ores & conc (excl gold) 239,007 326,160 447,273 37.1 13.03 283 Copper ores & concentrates 250,774 219,859 385,890 75.5 60.94 321 Coal 42,804 82,803 168,650 103.7 28.85 011 Beef, f.c.f. 151,976 120,595 140,331 16.4 14.96 333 Crude petroleum 0 0 65,650 .. ..7 048 Cereal preparations 16,013 27,304 43,788 60.4 -4.08 022 Milk, cream, whey & yoghurt 75,779 49,067 41,359 -15.7 -7.19 542 Medicaments (incl veterinary) 47,083 25,252 32,144 27.3 -25.1
10 533 Pigments, paints & varnishes 41,978 37,270 31,535 -15.4 -1.611 024 Cheese & curd 20,994 29,063 26,584 -8.5 20.212 098 Edible products & preparations, nes 21,405 21,271 23,955 12.6 0.513 641 Paper & paperboard 45,376 40,594 23,716 -41.6 -4.114 081 Animal feed 19,154 19,031 22,680 19.2 13.215 894 Prams, toys, games & sporting goods 14,428 20,064 22,502 12.1 0.916 792 Aircraft, spacecraft & parts 26,310 24,683 22,465 -9.0 41.117 057 Fruit & nuts 13,240 20,841 19,241 -7.7 148.218 012 Meat (excl beef), f.c.f. 26,475 21,540 19,090 -11.4 3.219 512 Alcohols, phenols & derivatives 90 14,460 13,674 -5.4 48.120 686 Zinc 2,594 2,617 11,623 344.2 78.9
988 Confidential items of trade 29,206 32,592 38,218 .. ..Top merchandise imports
Total merchandise imports 937,362 759,150 770,900 1.5 10.91 971 Gold 34,088 56,461 93,054 64.8 ..2 682 Copper 2 0 86,193 .. ..3 778 Electrical machinery & parts, nes 79,064 86,768 82,127 -5.3 17.54 771 Electric power machinery & parts 27,510 39,939 37,492 -6.1 20.65 761 Monitors, projectors & TVs 10,965 30,626 31,884 4.1 9.36 752 Computers 40,824 19,706 23,881 21.2 1.67 776 Electronic integrated circuits 21,906 20,621 23,230 12.7 10.98 057 Fruit & nuts 24,844 25,228 22,631 -10.3 10.59 593 Explosives & pyrotechnics 8,950 13,067 18,995 45.4 29.5
10 058 Fruit, prepared or preserved 13,384 15,479 18,038 16.5 22.011 751 Office machines 5,230 12,565 16,456 31.0 8.712 772 Electrical circuits equipment 8,169 9,178 14,329 56.1 20.813 553 Perfumery & cosmetics (excl soap) 13,183 13,932 12,985 -6.8 5.514 098 Edible products & preparations, nes 12,790 16,154 12,804 -20.7 34.315 533 Pigments, paints & varnishes 4,345 10,926 12,181 11.5 100.216 699 Manufactures of base metal, nes 10,639 12,083 11,973 -0.9 19.417 625 Rubber tyres, treads & tubes 10,359 8,111 10,882 34.2 -0.118 872 Medical instruments (incl veterinary) 4,041 8,356 9,087 8.7 0.919 894 Prams, toys, games & sporting goods 7,254 8,639 8,512 -1.5 -9.420 893 Plastic articles, nes 6,500 8,356 8,073 -3.4 11.2
988 Confidential items of trade 24,924 24,928 14,214 .. ..
(a) Rank based on 2016-17. (b) May exclude selected confidential export and import commodities. Refer to the DFAT website(http://dfat.gov.au/about-us/publications/trade-investment/Pages/dfat-adjustments-to-abs-official-trade-data.aspx)for more information and a list of the commodities excluded.Based on ABS trade data on DFAT STARS database (ABS catalogue 5368.0) and unpublished ABS data.
TABLE 50: AUSTRALIA'S MERCHANDISE TRADE WITH PHILIPPINES (a)(b)(A$'000)

Page 110
% growth2015-16 to 5 year
Rank Commodity 2014-15 2015-16 2016-17 2016-17 trendTop merchandise exports
Total merchandise exports 18,775,394 17,833,718 20,513,247 15.0 -1.91 321 Coal 5,049,559 4,609,191 6,252,859 35.7 -1.62 281 Iron ores & concentrates 4,047,074 3,052,872 3,921,262 28.4 -11.73 011 Beef, f.c.f. 1,067,663 1,324,050 1,227,944 -7.3 16.14 061 Sugars, molasses & honey 526,449 649,702 997,710 53.6 14.35 684 Aluminium 773,223 1,122,923 748,291 -33.4 8.46 287 Other ores & concentrates (c) 718,800 684,927 692,869 1.2 -3.87 333 Crude petroleum np 651,896 449,559 .. ..8 289 Precious metal ores & conc (excl gold) 452,924 467,908 436,299 -6.8 8.49 283 Copper ores & concentrates 358,351 463,918 368,810 -20.5 -12.0
10 041 Wheat 352,250 406,651 296,605 -27.1 -10.611 012 Meat (excl beef), f.c.f. 174,775 185,024 248,052 34.1 24.012 971 Gold 235,990 282,003 210,629 -25.3 0.813 288 Non-ferrous waste & scrap 197,298 145,537 160,983 10.6 8.414 081 Animal feed 151,382 127,885 136,290 6.6 2.515 268 Wool & other animal hair (incl tops) 81,174 127,484 107,775 -15.5 26.016 533 Pigments, paints & varnishes 66,108 70,256 83,345 18.6 31.017 682 Copper 8,765 27,193 77,686 185.7 35.818 048 Cereal preparations 108,225 79,403 73,755 -7.1 -2.119 342 Liquefied propane & butane 129,618 21,523 55,537 158.0 -27.720 673 Uncoated flat-rolled iron & steel 7,499 3 54,356 .. -12.6
988 Confidential items of trade 2,570,473 2,093,803 2,896,329 .. ..Top merchandise imports
Total merchandise imports 14,177,586 13,175,013 14,995,271 13.8 11.11 334 Refined petroleum 4,917,995 4,947,482 4,798,605 -3.0 19.32 793 Ships, boats & floating structures (d) 97,825 12,080 3,900,160 .. 537.63 781 Passenger motor vehicles 1,944,308 2,512,796 2,397,606 -4.6 3.94 778 Electrical machinery & parts, nes 183,845 199,107 227,971 14.5 9.05 761 Monitors, projectors & TVs 164,153 209,509 213,034 1.7 -2.16 775 Household-type equipment, nes 129,322 153,200 154,351 0.8 9.67 784 Vehicle parts & accessories 181,525 177,374 121,376 -31.6 -11.68 641 Paper & paperboard 104,732 134,262 119,660 -10.9 5.29 122 Tobacco, manufactured 72,693 154,946 118,556 -23.5 168.4
10 723 Civil engineering equipment & parts 1,370,503 104,092 115,202 10.7 -25.611 335 Residual petroleum products, nes 127,319 95,060 113,696 19.6 20.212 684 Aluminium 69,575 86,115 109,911 27.6 34.913 682 Copper 101,594 104,004 97,707 -6.1 13.214 625 Rubber tyres, treads & tubes 108,006 104,162 93,802 -9.9 -6.815 776 Electronic integrated circuits 67,895 64,746 86,556 33.7 15.016 893 Plastic articles, nes 45,357 60,854 82,849 36.1 26.017 782 Goods vehicles 102,933 156,366 82,478 -47.3 -2.018 764 Telecom equipment & parts 135,061 95,464 73,815 -22.7 -20.419 773 Electrical distributing equipment 81,845 70,096 68,384 -2.4 -4.320 575 Other primary plastics 61,073 60,001 65,009 8.3 8.1
988 Confidential items of trade 671,928 398,350 431,139 .. ..
(a) Rank based on 2016-17. (b) May exclude selected confidential export and import commodities. Refer to the DFAT website(http://dfat.gov.au/about-us/publications/trade-investment/Pages/dfat-adjustments-to-abs-official-trade-data.aspx)for more information and a list of the commodities excluded.(c) Mainly Manganese and Zinc ores & concentrates . (d) For 2016-17, includes a DFAT estimate for the import of a LNG floating platform.Based on ABS trade data on DFAT STARS database (ABS catalogue 5368.0) and unpublished ABS data.
TABLE 51: AUSTRALIA'S MERCHANDISE TRADE WITH REPUBLIC OF KOREA (a)(b)(A$'000)

Page 111
% growth2015-16 to 5 year
Rank Commodity 2014-15 2015-16 2016-17 2016-17 trendTop merchandise exports
Total merchandise exports 8,348,158 5,417,866 5,848,920 8.0 -2.71 333 Crude petroleum 1,573,516 533,017 934,624 75.3 -17.52 334 Refined petroleum 496,282 293,772 322,371 9.7 -20.63 411 Animal oils & fats 218,433 264,695 315,487 19.2 20.74 971 Gold 3,115,827 1,195,934 305,435 -74.5 -14.55 792 Aircraft, spacecraft & parts 185,224 176,060 186,386 5.9 15.26 012 Meat (excl beef), f.c.f. 139,913 173,178 165,743 -4.3 14.97 022 Milk, cream, whey & yoghurt 171,794 130,746 136,831 4.7 -4.58 897 Jewellery 31,139 76,764 98,626 28.5 32.19 342 Liquefied propane & butane 74,962 48,843 88,475 81.1 -11.1
10 061 Sugars, molasses & honey 67,291 60,389 83,288 37.9 -5.511 011 Beef, f.c.f. 75,839 82,322 81,872 -0.5 0.512 764 Telecom equipment & parts 76,260 76,044 77,431 1.8 -5.413 112 Alcoholic beverages 66,567 66,360 74,885 12.8 8.614 057 Fruit & nuts 61,961 83,047 69,815 -15.9 15.615 874 Measuring & analysing instruments 96,984 76,656 67,204 -12.3 8.416 793 Ships, boats & floating structures 92,247 22,624 57,698 155.0 3.217 872 Medical instruments (incl veterinary) 47,951 47,865 49,615 3.7 4.718 054 Vegetables, f.c.f. 33,645 43,459 48,537 11.7 18.319 667 Pearls & gems 33,257 45,573 48,340 6.1 17.120 752 Computers 46,626 59,601 46,247 -22.4 20.8
988 Confidential items of trade 267,574 389,834 1,431,132 .. ..Top merchandise imports
Total merchandise imports 10,808,708 7,751,302 8,299,252 7.1 -13.21 334 Refined petroleum 6,181,785 3,943,989 4,833,843 22.6 -15.72 098 Edible products & preparations, nes 646,424 613,170 540,447 -11.9 -2.33 752 Computers 397,722 505,822 389,904 -22.9 4.44 793 Ships, boats & floating structures 175,931 2,555 195,763 .. -48.45 072 Cocoa 96,680 126,372 114,391 -9.5 8.56 122 Tobacco, manufactured 64,326 115,346 98,601 -14.5 38.27 597 Prepared additives for mineral oils 104,689 90,005 90,203 0.2 -0.38 898 Musical instruments & parts 153,811 134,751 84,563 -37.2 -17.29 899 Misc manufactured articles, nes 74,222 64,636 77,702 20.2 6.2
10 764 Telecom equipment & parts 107,394 104,827 73,239 -30.1 -0.511 892 Printed matter 76,222 68,251 65,654 -3.8 -8.712 874 Measuring & analysing instruments 103,479 87,054 64,784 -25.6 -3.113 542 Medicaments (incl veterinary) 162,392 42,899 63,586 48.2 -36.214 335 Residual petroleum products, nes 138,599 61,816 62,942 1.8 -22.515 776 Electronic integrated circuits 48,593 50,254 61,624 22.6 -6.716 872 Medical instruments (incl veterinary) 50,785 53,677 51,921 -3.3 -2.417 778 Electrical machinery & parts, nes 44,957 52,340 48,087 -8.1 2.418 728 Specialised machinery & parts 143,313 71,975 43,828 -39.1 5.419 641 Paper & paperboard 67,661 55,487 40,172 -27.6 -4.120 073 Chocolate & preparations of cocoa 34,337 41,227 36,962 -10.3 17.9
988 Confidential items of trade 277,904 297,563 266,062 .. ..
(a) Rank based on 2016-17. (b) May exclude selected confidential export and import commodities. Refer to the DFAT website(http://dfat.gov.au/about-us/publications/trade-investment/Pages/dfat-adjustments-to-abs-official-trade-data.aspx)for more information and a list of the commodities excluded.Based on ABS trade data on DFAT STARS database (ABS catalogue 5368.0) and unpublished ABS data.
TABLE 52: AUSTRALIA'S MERCHANDISE TRADE WITH SINGAPORE (a)(b)(A$'000)
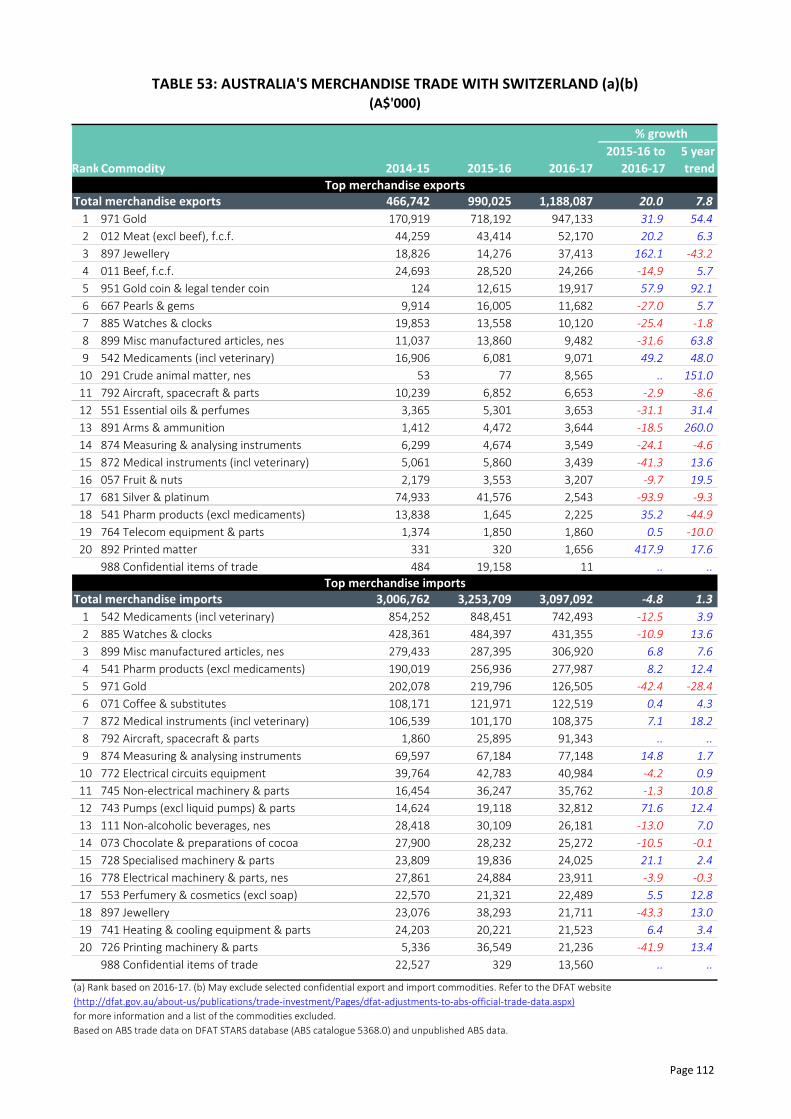
Page 112
% growth2015-16 to 5 year
Rank Commodity 2014-15 2015-16 2016-17 2016-17 trendTop merchandise exports
Total merchandise exports 466,742 990,025 1,188,087 20.0 7.81 971 Gold 170,919 718,192 947,133 31.9 54.42 012 Meat (excl beef), f.c.f. 44,259 43,414 52,170 20.2 6.33 897 Jewellery 18,826 14,276 37,413 162.1 -43.24 011 Beef, f.c.f. 24,693 28,520 24,266 -14.9 5.75 951 Gold coin & legal tender coin 124 12,615 19,917 57.9 92.16 667 Pearls & gems 9,914 16,005 11,682 -27.0 5.77 885 Watches & clocks 19,853 13,558 10,120 -25.4 -1.88 899 Misc manufactured articles, nes 11,037 13,860 9,482 -31.6 63.89 542 Medicaments (incl veterinary) 16,906 6,081 9,071 49.2 48.0
10 291 Crude animal matter, nes 53 77 8,565 .. 151.011 792 Aircraft, spacecraft & parts 10,239 6,852 6,653 -2.9 -8.612 551 Essential oils & perfumes 3,365 5,301 3,653 -31.1 31.413 891 Arms & ammunition 1,412 4,472 3,644 -18.5 260.014 874 Measuring & analysing instruments 6,299 4,674 3,549 -24.1 -4.615 872 Medical instruments (incl veterinary) 5,061 5,860 3,439 -41.3 13.616 057 Fruit & nuts 2,179 3,553 3,207 -9.7 19.517 681 Silver & platinum 74,933 41,576 2,543 -93.9 -9.318 541 Pharm products (excl medicaments) 13,838 1,645 2,225 35.2 -44.919 764 Telecom equipment & parts 1,374 1,850 1,860 0.5 -10.020 892 Printed matter 331 320 1,656 417.9 17.6
988 Confidential items of trade 484 19,158 11 .. ..Top merchandise imports
Total merchandise imports 3,006,762 3,253,709 3,097,092 -4.8 1.31 542 Medicaments (incl veterinary) 854,252 848,451 742,493 -12.5 3.92 885 Watches & clocks 428,361 484,397 431,355 -10.9 13.63 899 Misc manufactured articles, nes 279,433 287,395 306,920 6.8 7.64 541 Pharm products (excl medicaments) 190,019 256,936 277,987 8.2 12.45 971 Gold 202,078 219,796 126,505 -42.4 -28.46 071 Coffee & substitutes 108,171 121,971 122,519 0.4 4.37 872 Medical instruments (incl veterinary) 106,539 101,170 108,375 7.1 18.28 792 Aircraft, spacecraft & parts 1,860 25,895 91,343 .. ..9 874 Measuring & analysing instruments 69,597 67,184 77,148 14.8 1.7
10 772 Electrical circuits equipment 39,764 42,783 40,984 -4.2 0.911 745 Non-electrical machinery & parts 16,454 36,247 35,762 -1.3 10.812 743 Pumps (excl liquid pumps) & parts 14,624 19,118 32,812 71.6 12.413 111 Non-alcoholic beverages, nes 28,418 30,109 26,181 -13.0 7.014 073 Chocolate & preparations of cocoa 27,900 28,232 25,272 -10.5 -0.115 728 Specialised machinery & parts 23,809 19,836 24,025 21.1 2.416 778 Electrical machinery & parts, nes 27,861 24,884 23,911 -3.9 -0.317 553 Perfumery & cosmetics (excl soap) 22,570 21,321 22,489 5.5 12.818 897 Jewellery 23,076 38,293 21,711 -43.3 13.019 741 Heating & cooling equipment & parts 24,203 20,221 21,523 6.4 3.420 726 Printing machinery & parts 5,336 36,549 21,236 -41.9 13.4
988 Confidential items of trade 22,527 329 13,560 .. ..
(a) Rank based on 2016-17. (b) May exclude selected confidential export and import commodities. Refer to the DFAT website(http://dfat.gov.au/about-us/publications/trade-investment/Pages/dfat-adjustments-to-abs-official-trade-data.aspx)for more information and a list of the commodities excluded.Based on ABS trade data on DFAT STARS database (ABS catalogue 5368.0) and unpublished ABS data.
TABLE 53: AUSTRALIA'S MERCHANDISE TRADE WITH SWITZERLAND (a)(b)(A$'000)

Page 113
% growth2015-16 to 5 year
Rank Commodity 2014-15 2015-16 2016-17 2016-17 trendTop merchandise exports
Total merchandise exports 6,868,739 6,445,593 8,633,798 33.9 -1.71 321 Coal 2,907,686 2,547,327 4,083,668 60.3 0.82 281 Iron ores & concentrates 1,297,266 1,021,498 1,435,548 40.5 -7.03 682 Copper 77,395 272,161 401,847 47.7 -0.34 011 Beef, f.c.f. 211,224 226,477 244,961 8.2 3.05 686 Zinc 144,675 128,898 221,691 72.0 9.86 684 Aluminium 497,501 299,494 203,523 -32.0 -12.37 283 Copper ores & concentrates 121,340 334,030 159,584 -52.2 40.08 012 Meat (excl beef), f.c.f. 94,083 66,976 81,707 22.0 7.69 081 Animal feed 86,671 84,795 81,613 -3.8 8.3
10 041 Wheat 87,199 71,475 79,485 11.2 -2.011 022 Milk, cream, whey & yoghurt 40,076 50,958 64,839 27.2 6.412 282 Ferrous waste & scrap 57,172 40,263 63,398 57.5 -11.313 246 Wood in chips or particles 26,415 63,850 58,041 -9.1 42.014 542 Medicaments (incl veterinary) 64,479 26,238 45,845 74.7 -42.715 061 Sugars, molasses & honey 37,643 21,491 41,159 91.5 -5.516 685 Lead 23,353 27,272 34,512 26.5 12.617 522 Inorganic chemical elements 41,135 59,345 33,617 -43.4 22.418 287 Other ores & concentrates (c) 18,284 12,723 32,024 151.7 18.419 689 Other non-ferrous metals 17,887 18,119 30,551 68.6 7.320 289 Precious metal ores & conc (excl gold) 3,192 55,873 29,600 -47.0 158.3
988 Confidential items of trade 289,211 398,680 661,707 .. ..Top merchandise imports
Total merchandise imports 4,853,411 4,552,164 4,437,512 -2.5 3.91 764 Telecom equipment & parts 314,208 278,310 419,672 50.8 -6.02 334 Refined petroleum 866,660 532,237 252,475 -52.6 6.43 752 Computers 203,475 175,827 167,163 -4.9 9.94 785 Motorcycles & cycles 146,685 161,478 158,702 -1.7 4.65 894 Prams, toys, games & sporting goods 121,074 135,609 123,043 -9.3 6.66 699 Manufactures of base metal, nes 113,930 122,493 110,783 -9.6 6.67 893 Plastic articles, nes 102,881 112,615 108,129 -4.0 6.98 695 Hand or machine tools 103,032 100,131 104,697 4.6 5.79 694 Nails, screws, nuts, bolts & rivets 113,713 117,777 104,181 -11.5 7.0
10 778 Electrical machinery & parts, nes 103,898 114,490 100,619 -12.1 6.011 784 Vehicle parts & accessories 92,907 104,939 94,880 -9.6 5.612 898 Musical instruments & parts 87,166 86,519 94,387 9.1 1.413 776 Electronic integrated circuits 98,689 98,723 92,125 -6.7 8.314 675 Flat-rolled alloy steel 110,901 73,370 72,035 -1.8 -0.715 582 Plastic plates, sheets & film 69,902 75,391 70,889 -6.0 2.016 682 Copper 7,058 31,097 65,539 110.8 56.117 751 Office machines 44,118 74,934 61,349 -18.1 66.418 821 Furniture, mattresses & cushions 62,461 66,497 59,581 -10.4 3.419 674 Coated flat-rolled iron & steel 59,090 34,477 55,840 62.0 -0.220 759 Computer parts & accessories 55,499 58,738 53,955 -8.1 -4.6
988 Confidential items of trade 430,078 475,123 565,979 .. ..
(a) Rank based on 2016-17. (b) May exclude selected confidential export and import commodities. Refer to the DFAT website(http://dfat.gov.au/about-us/publications/trade-investment/Pages/dfat-adjustments-to-abs-official-trade-data.aspx)for more information and a list of the commodities excluded.(c) Mainly Manganese and Zinc ores & concentrates .Based on ABS trade data on DFAT STARS database (ABS catalogue 5368.0) and unpublished ABS data.
TABLE 54: AUSTRALIA'S MERCHANDISE TRADE WITH TAIWAN (a)(b)(A$'000)

Page 114
% growth2015-16 to 5 year
Rank Commodity 2014-15 2015-16 2016-17 2016-17 trendTop merchandise exports
Total merchandise exports 5,010,279 3,570,976 3,903,517 9.3 -7.81 333 Crude petroleum 1,260,109 693,942 561,950 .. ..2 971 Gold 897,246 254,553 532,873 109.3 -24.13 684 Aluminium 341,438 271,193 308,633 13.8 -7.94 321 Coal 284,992 314,121 290,879 -7.4 10.55 682 Copper 211,818 271,740 190,150 -30.0 -9.26 041 Wheat 161,625 129,933 123,656 -4.8 -15.37 685 Lead 39,414 70,208 107,991 53.8 26.58 263 Cotton 99,720 78,515 101,341 29.1 -17.69 673 Uncoated flat-rolled iron & steel 55,120 52,572 73,060 39.0 -6.6
10 533 Pigments, paints & varnishes 64,721 53,941 71,445 32.5 9.011 057 Fruit & nuts 48,318 63,877 59,412 -7.0 21.012 011 Beef, f.c.f. 54,359 52,747 56,496 7.1 18.313 287 Other ores & concentrates (c) 115,094 63,803 51,757 -18.9 18.514 022 Milk, cream, whey & yoghurt 61,601 42,251 50,516 19.6 -3.915 048 Cereal preparations 89,801 73,831 45,867 -37.9 -8.716 562 Fertilisers (excl crude) 23,828 28,904 39,050 35.1 49.917 542 Medicaments (incl veterinary) 53,520 16,914 38,550 127.9 -37.518 522 Inorganic chemical elements 75,659 30,237 38,226 26.4 14.919 686 Zinc 41,955 20,970 34,849 66.2 11.320 268 Wool & other animal hair (incl tops) 31,368 20,074 32,145 60.1 28.5
988 Confidential items of trade 77,854 90,814 244,797 .. ..Top merchandise imports
Total merchandise imports 12,134,917 14,555,432 14,124,240 -3.0 10.11 782 Goods vehicles 3,300,785 4,192,830 4,787,747 14.2 16.42 781 Passenger motor vehicles 1,863,739 2,255,655 2,298,249 1.9 26.13 741 Heating & cooling equipment & parts 592,108 760,051 702,589 -7.6 12.24 775 Household-type equipment, nes 373,529 458,969 457,870 -0.2 12.45 037 Seafood, prepared or preserved 330,948 327,868 376,595 14.9 3.56 784 Vehicle parts & accessories 293,504 347,024 338,843 -2.4 8.37 897 Jewellery 249,540 326,760 289,048 -11.5 13.78 971 Gold 9,796 461,322 288,744 -37.4 -18.89 625 Rubber tyres, treads & tubes 274,464 250,731 254,450 1.5 1.7
10 764 Telecom equipment & parts 180,066 217,281 209,525 -3.6 6.211 691 Iron, steel, aluminium structures 508,703 729,902 190,509 -73.9 13.212 893 Plastic articles, nes 200,457 213,529 188,681 -11.6 8.013 553 Perfumery & cosmetics (excl soap) 159,675 174,068 181,191 4.1 10.514 752 Computers 225,367 171,026 155,338 -9.2 -3.015 098 Edible products & preparations, nes 132,492 141,788 139,119 -1.9 7.716 884 Optical goods, nes 158,424 172,512 128,902 -25.3 13.517 048 Cereal preparations 80,438 105,379 97,954 -7.0 25.718 743 Pumps (excl liquid pumps) & parts 76,759 65,169 97,862 50.2 2.519 081 Animal feed 81,330 92,169 90,824 -1.5 11.720 642 Paper & paperboard, cut to size 83,994 87,719 86,227 -1.7 7.8
988 Confidential items of trade 401,402 333,943 329,433 .. ..
(a) Rank based on 2016-17. (b) May exclude selected confidential export and import commodities. Refer to the DFAT website(http://dfat.gov.au/about-us/publications/trade-investment/Pages/dfat-adjustments-to-abs-official-trade-data.aspx)for more information and a list of the commodities excluded.(c) Mainly Manganese and Zinc ores & concentrates .Based on ABS trade data on DFAT STARS database (ABS catalogue 5368.0) and unpublished ABS data.
TABLE 55: AUSTRALIA'S MERCHANDISE TRADE WITH THAILAND (a)(b)(A$'000)

Page 115
% growth2015-16 to 5 year
Rank Commodity 2014-15 2015-16 2016-17 2016-17 trendTop merchandise exports
Total merchandise exports 3,279,203 3,083,346 3,111,956 0.9 8.11 012 Meat (excl beef), f.c.f. 199,098 207,438 225,000 8.5 12.32 054 Vegetables, f.c.f. 86,259 110,467 183,130 65.8 13.93 781 Passenger motor vehicles 242,477 188,411 168,009 -10.8 -3.04 784 Vehicle parts & accessories 77,990 60,756 100,735 65.8 19.05 011 Beef, f.c.f. 91,175 96,859 93,392 -3.6 14.26 041 Wheat 34,381 50,818 92,839 82.7 10.97 057 Fruit & nuts 100,146 116,493 77,607 -33.4 18.88 764 Telecom equipment & parts 127,805 109,371 65,640 -40.0 16.29 098 Edible products & preparations, nes 81,704 69,107 63,501 -8.1 -0.3
10 269 Worn clothing & rags 24,281 28,407 32,770 15.4 17.311 673 Uncoated flat-rolled iron & steel 11,759 19,632 32,694 66.5 ..12 043 Barley (c) 45,491 94,765 32,069 -66.2 -5.813 752 Computers 44,297 61,318 26,892 -56.1 19.614 542 Medicaments (incl veterinary) 29,043 27,249 26,780 -1.7 11.015 971 Gold 54,574 9,742 25,694 163.7 28.916 001 Live animals (excl seafood) 35,480 26,695 25,189 -5.6 17.917 112 Alcoholic beverages 16,024 17,903 20,699 15.6 10.618 667 Pearls & gems 12,963 2,578 18,060 600.5 42.919 897 Jewellery 4,975 7,332 16,322 122.6 13.820 321 Coal 5,211 4,903 15,732 220.9 ..
988 Confidential items of trade 1,080,014 1,153,659 1,405,708 .. ..Top merchandise imports
Total merchandise imports 3,117,791 1,872,023 1,895,056 1.2 -13.61 333 Crude petroleum 2,597,131 1,297,459 1,328,093 2.4 -17.92 562 Fertilisers (excl crude) 76,096 69,471 87,530 26.0 ..3 334 Refined petroleum 953 465 85,813 .. 73.64 665 Glassware 43,054 55,316 49,867 -9.8 52.85 897 Jewellery 11,795 14,616 16,797 14.9 15.16 074 Tea & mate 13,775 17,035 16,695 -2.0 38.07 659 Floor coverings 21,537 25,796 15,987 -38.0 2.68 679 Tubes & pipes of iron or steel 67,060 109,006 14,613 -86.6 24.49 691 Iron, steel, aluminium structures 13,443 14,657 14,598 -0.4 15.8
10 793 Ships, boats & floating structures 959 733 14,416 .. 79.711 682 Copper 0 0 13,343 .. ..12 662 Clay construction materials 4,766 5,519 6,741 22.1 22.213 778 Electrical machinery & parts, nes 9,401 9,852 6,624 -32.8 44.714 667 Pearls & gems 16,178 8,693 5,965 -31.4 -12.015 784 Vehicle parts & accessories 3,918 4,230 5,834 37.9 9.516 664 Glass 6,092 6,850 5,686 -17.0 13.617 782 Goods vehicles 389 0 5,040 .. ..18 684 Aluminium 1,534 1,521 4,844 218.5 90.119 625 Rubber tyres, treads & tubes 2,812 1,875 4,658 148.5 -17.020 728 Specialised machinery & parts 5,915 7,839 4,139 -47.2 7.2
988 Confidential items of trade 73,589 116,333 102,918 .. ..
(a) Rank based on 2016-17. (b) May exclude selected confidential export and import commodities. Refer to the DFAT website(http://dfat.gov.au/about-us/publications/trade-investment/Pages/dfat-adjustments-to-abs-official-trade-data.aspx)for more information and a list of the commodities excluded.(c) Only includes data up to March 2017.Based on ABS trade data on DFAT STARS database (ABS catalogue 5368.0) and unpublished ABS data.
TABLE 56: AUSTRALIA'S MERCHANDISE TRADE WITH UNITED ARAB EMIRATES (a)(b)(A$'000)

Page 116
% growth2015-16 to 5 year
Rank Commodity 2014-15 2015-16 2016-17 2016-17 trendTop merchandise exports
Total merchandise exports 3,682,185 7,160,408 7,300,904 2.0 0.91 971 Gold 582,840 3,938,604 3,912,764 -0.7 1.22 685 Lead 310,991 486,480 558,403 14.8 1.53 112 Alcoholic beverages 375,543 373,983 341,039 -8.8 -2.94 667 Pearls & gems 294,255 364,721 269,645 -26.1 16.65 681 Silver & platinum 126,360 1,297 220,907 .. -30.06 321 Coal 231,623 119,309 205,507 72.2 -25.47 899 Misc manufactured articles, nes 271,602 293,854 199,255 -32.2 3.88 792 Aircraft, spacecraft & parts 66,727 78,479 119,544 52.3 20.89 012 Meat (excl beef), f.c.f. 109,681 85,999 88,166 2.5 3.5
10 541 Pharm products (excl medicaments) 57,569 70,625 81,373 15.2 19.511 011 Beef, f.c.f. 115,045 121,097 77,047 -36.4 6.012 874 Measuring & analysing instruments 61,303 65,473 59,756 -8.7 6.813 764 Telecom equipment & parts 55,772 64,095 53,308 -16.8 15.014 582 Plastic plates, sheets & film 4,330 41,960 44,599 6.3 110.415 553 Perfumery & cosmetics (excl soap) 32,923 34,925 42,023 20.3 16.516 778 Electrical machinery & parts, nes 28,831 33,562 40,088 19.4 6.317 896 Artwork & antiques 37,041 26,776 36,804 37.4 7.918 542 Medicaments (incl veterinary) 37,640 62,070 33,385 -46.2 -6.119 222 Oil-seeds & oleaginous fruits, soft 0 49 32,174 .. ..20 054 Vegetables, f.c.f. 14,561 24,307 27,581 13.5 17.0
988 Confidential items of trade 154,233 200,301 213,967 .. ..Top merchandise imports
Total merchandise imports 6,332,459 7,583,516 6,677,733 -11.9 1.01 781 Passenger motor vehicles 1,006,829 1,514,063 1,343,498 -11.3 13.12 542 Medicaments (incl veterinary) 552,408 447,634 437,173 -2.3 -13.13 541 Pharm products (excl medicaments) 332,061 246,926 291,610 18.1 17.54 112 Alcoholic beverages 234,582 287,600 262,654 -8.7 6.45 892 Printed matter 274,668 274,335 248,942 -9.3 -2.86 874 Measuring & analysing instruments 250,523 245,765 203,369 -17.3 0.67 792 Aircraft, spacecraft & parts 26,000 86,414 143,953 .. ..8 728 Specialised machinery & parts 131,438 258,392 133,374 -48.4 -14.09 743 Pumps (excl liquid pumps) & parts 97,877 60,768 132,431 117.9 12.5
10 971 Gold 97,517 115,451 124,401 7.8 48.911 714 Non-electric engines & motors 42,174 251,487 121,201 -51.8 3.812 553 Perfumery & cosmetics (excl soap) 114,864 117,518 105,633 -10.1 5.913 744 Mechanical handling equip & parts 106,137 122,416 105,003 -14.2 0.514 764 Telecom equipment & parts 114,616 181,064 101,759 -43.8 5.615 747 Taps, cocks & valves 103,492 154,779 100,072 -35.3 7.216 048 Cereal preparations 76,188 96,074 90,857 -5.4 15.517 778 Electrical machinery & parts, nes 101,309 112,745 89,125 -20.9 2.518 894 Prams, toys, games & sporting goods 43,953 186,110 88,070 -52.7 38.619 872 Medical instruments (incl veterinary) 78,845 78,407 72,105 -8.0 6.120 893 Plastic articles, nes 66,187 73,400 71,811 -2.2 5.3
988 Confidential items of trade 116,632 52,527 44,479 .. ..
(a) Rank based on 2016-17. (b) May exclude selected confidential export and import commodities. Refer to the DFAT website(http://dfat.gov.au/about-us/publications/trade-investment/Pages/dfat-adjustments-to-abs-official-trade-data.aspx)for more information and a list of the commodities excluded.Based on ABS trade data on DFAT STARS database (ABS catalogue 5368.0) and unpublished ABS data.
TABLE 57: AUSTRALIA'S MERCHANDISE TRADE WITH UNITED KINGDOM (a)(b)(A$'000)

Page 117
% growth2015-16 to 5 year
Rank Commodity 2014-15 2015-16 2016-17 2016-17 trendTop merchandise exports
Total merchandise exports 13,356,519 13,712,239 12,301,597 -10.3 7.61 011 Beef, f.c.f. 3,233,417 2,488,029 1,493,923 -40.0 19.62 012 Meat (excl beef), f.c.f. 790,883 902,009 934,918 3.6 22.03 792 Aircraft, spacecraft & parts 913,372 1,118,201 855,683 -23.5 8.94 541 Pharm products (excl medicaments) 103,557 369,509 658,874 78.3 81.95 112 Alcoholic beverages 464,612 480,679 485,189 0.9 -0.46 872 Medical instruments (incl veterinary) 459,240 379,999 410,925 8.1 3.97 899 Misc manufactured articles, nes 226,177 308,786 358,230 16.0 14.58 764 Telecom equipment & parts 272,531 296,159 269,994 -8.8 13.09 592 Starches, inulin & wheat gluten 263,156 297,566 267,911 -10.0 7.6
10 874 Measuring & analysing instruments 214,858 203,240 234,969 15.6 1.611 951 Gold coin & legal tender coin 247,349 332,431 232,129 -30.2 0.412 673 Uncoated flat-rolled iron & steel 214,606 83,886 170,574 103.3 0.413 684 Aluminium 127,789 78,251 165,082 111.0 9.014 542 Medicaments (incl veterinary) 140,489 167,224 151,567 -9.4 -5.115 784 Vehicle parts & accessories 155,844 181,887 147,934 -18.7 10.316 971 Gold 101,975 147,128 146,867 -0.2 -16.017 686 Zinc 181,598 188,120 144,191 -23.4 -4.518 641 Paper & paperboard 183,219 136,395 128,818 -5.6 8.419 667 Pearls & gems 72,724 99,786 110,913 11.2 20.320 781 Passenger motor vehicles 183,234 132,323 101,836 -23.0 5.4
988 Confidential items of trade 1,427,738 1,399,539 975,388 .. ..Top merchandise imports
Total merchandise imports 30,382,490 32,520,689 30,397,937 -6.5 1.21 781 Passenger motor vehicles 2,431,159 2,406,845 2,247,705 -6.6 17.72 792 Aircraft, spacecraft & parts 189,669 1,388,660 2,013,898 .. ..3 872 Medical instruments (incl veterinary) 935,949 1,070,624 1,076,583 0.6 8.54 874 Measuring & analysing instruments 1,149,542 1,050,404 1,054,927 0.4 2.05 764 Telecom equipment & parts 1,153,095 1,079,774 990,859 -8.2 5.26 541 Pharm products (excl medicaments) 408,482 669,882 829,604 23.8 13.07 542 Medicaments (incl veterinary) 824,779 870,730 764,898 -12.2 -4.88 899 Misc manufactured articles, nes 606,654 732,481 744,842 1.7 10.69 752 Computers 729,179 566,338 691,162 22.0 9.8
10 714 Non-electric engines & motors 573,442 808,506 612,667 -24.2 -2.211 723 Civil engineering equipment & parts 737,343 679,878 603,956 -11.2 -21.712 784 Vehicle parts & accessories 543,746 552,192 573,691 3.9 2.013 713 Internal combustion piston engines 591,525 563,334 566,356 0.5 0.614 721 Agric machinery (excl tractors) & parts 487,672 567,778 557,074 -1.9 -2.915 553 Perfumery & cosmetics (excl soap) 489,516 634,362 556,395 -12.3 12.116 778 Electrical machinery & parts, nes 559,031 528,951 550,587 4.1 6.217 743 Pumps (excl liquid pumps) & parts 490,984 620,054 451,390 -27.2 -2.318 971 Gold 46,288 360,082 396,766 10.2 -0.119 598 Miscellaneous chemical products, nes 338,047 393,750 394,666 0.2 7.120 625 Rubber tyres, treads & tubes 364,946 348,967 387,597 11.1 -1.1
988 Confidential items of trade 3,327,585 2,971,403 1,354,545 .. ..
(a) Rank based on 2016-17. (b) May exclude selected confidential export and import commodities. Refer to the DFAT website(http://dfat.gov.au/about-us/publications/trade-investment/Pages/dfat-adjustments-to-abs-official-trade-data.aspx)for more information and a list of the commodities excluded.Based on ABS trade data on DFAT STARS database (ABS catalogue 5368.0) and unpublished ABS data.
TABLE 58: AUSTRALIA'S MERCHANDISE TRADE WITH UNITED STATES (a)(b)(A$'000)
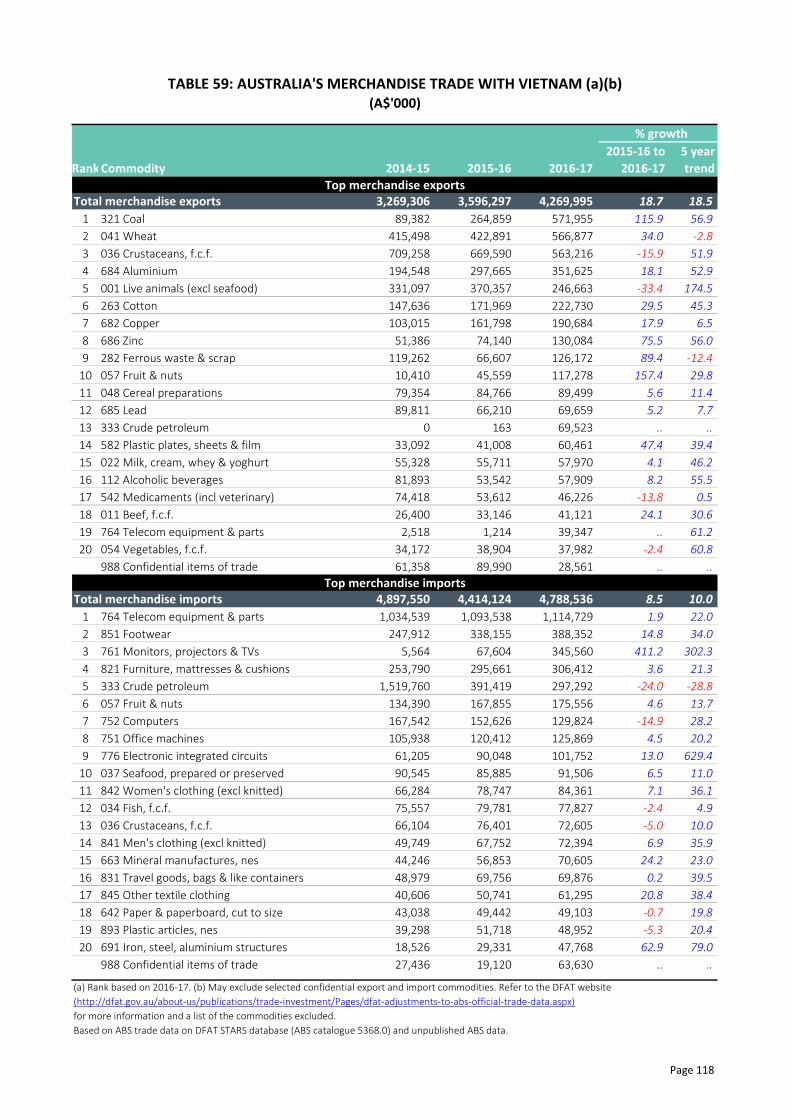
Page 118
% growth2015-16 to 5 year
Rank Commodity 2014-15 2015-16 2016-17 2016-17 trendTop merchandise exports
Total merchandise exports 3,269,306 3,596,297 4,269,995 18.7 18.51 321 Coal 89,382 264,859 571,955 115.9 56.92 041 Wheat 415,498 422,891 566,877 34.0 -2.83 036 Crustaceans, f.c.f. 709,258 669,590 563,216 -15.9 51.94 684 Aluminium 194,548 297,665 351,625 18.1 52.95 001 Live animals (excl seafood) 331,097 370,357 246,663 -33.4 174.56 263 Cotton 147,636 171,969 222,730 29.5 45.37 682 Copper 103,015 161,798 190,684 17.9 6.58 686 Zinc 51,386 74,140 130,084 75.5 56.09 282 Ferrous waste & scrap 119,262 66,607 126,172 89.4 -12.4
10 057 Fruit & nuts 10,410 45,559 117,278 157.4 29.811 048 Cereal preparations 79,354 84,766 89,499 5.6 11.412 685 Lead 89,811 66,210 69,659 5.2 7.713 333 Crude petroleum 0 163 69,523 .. ..14 582 Plastic plates, sheets & film 33,092 41,008 60,461 47.4 39.415 022 Milk, cream, whey & yoghurt 55,328 55,711 57,970 4.1 46.216 112 Alcoholic beverages 81,893 53,542 57,909 8.2 55.517 542 Medicaments (incl veterinary) 74,418 53,612 46,226 -13.8 0.518 011 Beef, f.c.f. 26,400 33,146 41,121 24.1 30.619 764 Telecom equipment & parts 2,518 1,214 39,347 .. 61.220 054 Vegetables, f.c.f. 34,172 38,904 37,982 -2.4 60.8
988 Confidential items of trade 61,358 89,990 28,561 .. ..Top merchandise imports
Total merchandise imports 4,897,550 4,414,124 4,788,536 8.5 10.01 764 Telecom equipment & parts 1,034,539 1,093,538 1,114,729 1.9 22.02 851 Footwear 247,912 338,155 388,352 14.8 34.03 761 Monitors, projectors & TVs 5,564 67,604 345,560 411.2 302.34 821 Furniture, mattresses & cushions 253,790 295,661 306,412 3.6 21.35 333 Crude petroleum 1,519,760 391,419 297,292 -24.0 -28.86 057 Fruit & nuts 134,390 167,855 175,556 4.6 13.77 752 Computers 167,542 152,626 129,824 -14.9 28.28 751 Office machines 105,938 120,412 125,869 4.5 20.29 776 Electronic integrated circuits 61,205 90,048 101,752 13.0 629.4
10 037 Seafood, prepared or preserved 90,545 85,885 91,506 6.5 11.011 842 Women's clothing (excl knitted) 66,284 78,747 84,361 7.1 36.112 034 Fish, f.c.f. 75,557 79,781 77,827 -2.4 4.913 036 Crustaceans, f.c.f. 66,104 76,401 72,605 -5.0 10.014 841 Men's clothing (excl knitted) 49,749 67,752 72,394 6.9 35.915 663 Mineral manufactures, nes 44,246 56,853 70,605 24.2 23.016 831 Travel goods, bags & like containers 48,979 69,756 69,876 0.2 39.517 845 Other textile clothing 40,606 50,741 61,295 20.8 38.418 642 Paper & paperboard, cut to size 43,038 49,442 49,103 -0.7 19.819 893 Plastic articles, nes 39,298 51,718 48,952 -5.3 20.420 691 Iron, steel, aluminium structures 18,526 29,331 47,768 62.9 79.0
988 Confidential items of trade 27,436 19,120 63,630 .. ..
(a) Rank based on 2016-17. (b) May exclude selected confidential export and import commodities. Refer to the DFAT website(http://dfat.gov.au/about-us/publications/trade-investment/Pages/dfat-adjustments-to-abs-official-trade-data.aspx)for more information and a list of the commodities excluded.Based on ABS trade data on DFAT STARS database (ABS catalogue 5368.0) and unpublished ABS data.
TABLE 59: AUSTRALIA'S MERCHANDISE TRADE WITH VIETNAM (a)(b)(A$'000)

Page 119
% growth2015-16 to 5 year
Rank Commodity 2014-15 2015-16 2016-17 2016-17 trendTop merchandise exports
Total merchandise exports 3,207,958 2,807,103 2,911,842 3.7 -5.81 285 Aluminium ores & conc (incl alumina) np 557,989 831,796 49.1 ..2 041 Wheat 582,273 327,451 265,094 -19.0 -19.73 321 Coal 131,099 119,537 227,220 90.1 -6.34 723 Civil engineering equipment & parts 99,762 113,023 134,439 18.9 -1.45 054 Vegetables, f.c.f. 128,512 121,477 127,392 4.9 -0.46 728 Specialised machinery & parts 88,166 68,130 86,571 27.1 -11.27 012 Meat (excl beef), f.c.f. 129,215 100,430 69,724 -30.6 -1.78 268 Wool & other animal hair (incl tops) 37,868 46,078 50,392 9.4 15.79 641 Paper & paperboard 48,702 39,164 39,486 0.8 -2.3
10 098 Edible products & preparations, nes 5,687 24,494 37,548 53.3 59.411 874 Measuring & analysing instruments 28,699 29,392 36,356 23.7 -0.412 289 Precious metal ores & conc (excl gold) 19,700 6,868 33,413 386.5 -2.413 782 Goods vehicles 17,538 14,218 28,508 100.5 -1.414 011 Beef, f.c.f. 40,261 34,997 24,877 -28.9 -10.115 685 Lead 16,399 17,960 24,563 36.8 -1.116 744 Mechanical handling equip & parts 16,137 21,228 24,315 14.5 -4.917 784 Vehicle parts & accessories 20,943 19,098 21,831 14.3 -5.818 764 Telecom equipment & parts 22,851 16,156 20,787 28.7 10.119 024 Cheese & curd 18,410 21,005 19,206 -8.6 0.920 748 Transmission shafts & parts 17,538 18,204 18,030 -1.0 -1.0
988 Confidential items of trade 1,000,612 432,614 171,385 .. ..Top merchandise imports
Total merchandise imports 3,307,331 2,292,610 2,885,438 25.9 -18.71 333 Crude petroleum 1,699,744 726,248 1,378,488 89.8 -31.42 781 Passenger motor vehicles 472,496 524,774 437,745 -16.6 29.23 342 Liquefied propane & butane 57,316 70,181 108,463 54.5 ..4 287 Other ores & concentrates 30,028 12,374 70,724 471.6 -0.85 071 Coffee & substitutes 34,799 42,324 39,293 -7.2 12.86 272 Crude fertilisers 27,380 34,133 32,508 -4.8 -0.37 684 Aluminium 10,100 23,091 30,289 31.2 47.58 034 Fish, f.c.f. 29,759 31,148 28,199 -9.5 0.49 728 Specialised machinery & parts 25,049 22,835 27,247 19.3 -9.1
10 072 Cocoa 27,068 33,943 25,409 -25.1 20.111 741 Heating & cooling equipment & parts 7,797 14,482 25,351 75.1 24.812 292 Crude vegetable matter, nes 33,250 30,446 24,995 -17.9 16.113 842 Women's clothing (excl knitted) 14,554 22,383 23,792 6.3 27.014 058 Fruit, prepared or preserved 10,407 13,292 21,165 59.2 0.815 057 Fruit & nuts 6,012 9,781 19,883 103.3 20.116 841 Men's clothing (excl knitted) 16,047 18,924 19,213 1.5 16.117 562 Fertilisers (excl crude) 1,112 20,338 16,479 -19.0 -5.918 845 Other textile clothing 10,683 16,148 14,688 -9.0 13.219 553 Perfumery & cosmetics (excl soap) 18,511 16,693 13,572 -18.7 0.920 659 Floor coverings 12,008 15,392 12,492 -18.8 7.5
988 Confidential items of trade 22,803 15,981 9,029 .. ..
(a) Rank based on 2016-17. (b) May exclude selected confidential export and import commodities. Refer to the DFAT website(http://dfat.gov.au/about-us/publications/trade-investment/Pages/dfat-adjustments-to-abs-official-trade-data.aspx)for more information and a list of the commodities excluded.Based on ABS trade data on DFAT STARS database (ABS catalogue 5368.0) and unpublished ABS data.
TABLE 60: AUSTRALIA'S MERCHANDISE TRADE WITH AFRICA (a)(b)(A$'000)
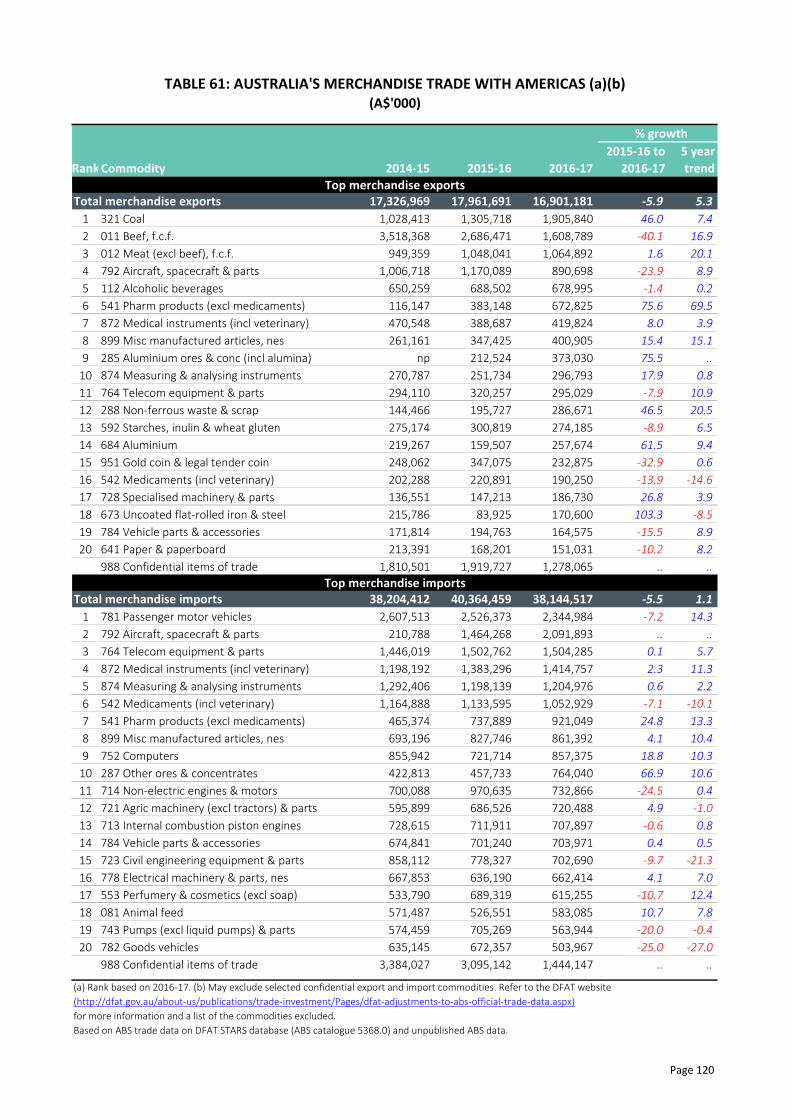
Page 120
% growth2015-16 to 5 year
Rank Commodity 2014-15 2015-16 2016-17 2016-17 trendTop merchandise exports
Total merchandise exports 17,326,969 17,961,691 16,901,181 -5.9 5.31 321 Coal 1,028,413 1,305,718 1,905,840 46.0 7.42 011 Beef, f.c.f. 3,518,368 2,686,471 1,608,789 -40.1 16.93 012 Meat (excl beef), f.c.f. 949,359 1,048,041 1,064,892 1.6 20.14 792 Aircraft, spacecraft & parts 1,006,718 1,170,089 890,698 -23.9 8.95 112 Alcoholic beverages 650,259 688,502 678,995 -1.4 0.26 541 Pharm products (excl medicaments) 116,147 383,148 672,825 75.6 69.57 872 Medical instruments (incl veterinary) 470,548 388,687 419,824 8.0 3.98 899 Misc manufactured articles, nes 261,161 347,425 400,905 15.4 15.19 285 Aluminium ores & conc (incl alumina) np 212,524 373,030 75.5 ..
10 874 Measuring & analysing instruments 270,787 251,734 296,793 17.9 0.811 764 Telecom equipment & parts 294,110 320,257 295,029 -7.9 10.912 288 Non-ferrous waste & scrap 144,466 195,727 286,671 46.5 20.513 592 Starches, inulin & wheat gluten 275,174 300,819 274,185 -8.9 6.514 684 Aluminium 219,267 159,507 257,674 61.5 9.415 951 Gold coin & legal tender coin 248,062 347,075 232,875 -32.9 0.616 542 Medicaments (incl veterinary) 202,288 220,891 190,250 -13.9 -14.617 728 Specialised machinery & parts 136,551 147,213 186,730 26.8 3.918 673 Uncoated flat-rolled iron & steel 215,786 83,925 170,600 103.3 -8.519 784 Vehicle parts & accessories 171,814 194,763 164,575 -15.5 8.920 641 Paper & paperboard 213,391 168,201 151,031 -10.2 8.2
988 Confidential items of trade 1,810,501 1,919,727 1,278,065 .. ..Top merchandise imports
Total merchandise imports 38,204,412 40,364,459 38,144,517 -5.5 1.11 781 Passenger motor vehicles 2,607,513 2,526,373 2,344,984 -7.2 14.32 792 Aircraft, spacecraft & parts 210,788 1,464,268 2,091,893 .. ..3 764 Telecom equipment & parts 1,446,019 1,502,762 1,504,285 0.1 5.74 872 Medical instruments (incl veterinary) 1,198,192 1,383,296 1,414,757 2.3 11.35 874 Measuring & analysing instruments 1,292,406 1,198,139 1,204,976 0.6 2.26 542 Medicaments (incl veterinary) 1,164,888 1,133,595 1,052,929 -7.1 -10.17 541 Pharm products (excl medicaments) 465,374 737,889 921,049 24.8 13.38 899 Misc manufactured articles, nes 693,196 827,746 861,392 4.1 10.49 752 Computers 855,942 721,714 857,375 18.8 10.3
10 287 Other ores & concentrates 422,813 457,733 764,040 66.9 10.611 714 Non-electric engines & motors 700,088 970,635 732,866 -24.5 0.412 721 Agric machinery (excl tractors) & parts 595,899 686,526 720,488 4.9 -1.013 713 Internal combustion piston engines 728,615 711,911 707,897 -0.6 0.814 784 Vehicle parts & accessories 674,841 701,240 703,971 0.4 0.515 723 Civil engineering equipment & parts 858,112 778,327 702,690 -9.7 -21.316 778 Electrical machinery & parts, nes 667,853 636,190 662,414 4.1 7.017 553 Perfumery & cosmetics (excl soap) 533,790 689,319 615,255 -10.7 12.418 081 Animal feed 571,487 526,551 583,085 10.7 7.819 743 Pumps (excl liquid pumps) & parts 574,459 705,269 563,944 -20.0 -0.420 782 Goods vehicles 635,145 672,357 503,967 -25.0 -27.0
988 Confidential items of trade 3,384,027 3,095,142 1,444,147 .. ..
(a) Rank based on 2016-17. (b) May exclude selected confidential export and import commodities. Refer to the DFAT website(http://dfat.gov.au/about-us/publications/trade-investment/Pages/dfat-adjustments-to-abs-official-trade-data.aspx)for more information and a list of the commodities excluded.Based on ABS trade data on DFAT STARS database (ABS catalogue 5368.0) and unpublished ABS data.
TABLE 61: AUSTRALIA'S MERCHANDISE TRADE WITH AMERICAS (a)(b)(A$'000)

Page 121
% growth2015-16 to 5 year
Rank Commodity 2014-15 2015-16 2016-17 2016-17 trendTop merchandise exports
Total merchandise exports 211,040,661 196,957,956 234,737,878 19.2 1.01 281 Iron ores & concentrates 54,410,125 47,792,559 62,766,737 31.3 -2.32 321 Coal 28,786,887 25,948,514 39,298,028 51.4 0.03 971 Gold 11,605,737 11,115,290 13,208,310 18.8 9.54 011 Beef, f.c.f. 8,225,608 7,721,057 6,545,510 -15.2 12.45 333 Crude petroleum 3,450,852 4,331,089 4,528,871 4.6 -18.36 041 Wheat 3,842,318 3,687,584 4,163,565 12.9 -2.17 283 Copper ores & concentrates 4,252,857 4,056,292 3,777,914 -6.9 -0.38 682 Copper 3,326,612 3,559,552 3,080,007 -13.5 -0.79 684 Aluminium 3,953,464 3,263,540 3,046,469 -6.7 -4.0
10 012 Meat (excl beef), f.c.f. 2,696,720 2,565,657 2,757,995 7.5 12.511 268 Wool & other animal hair (incl tops) 2,248,880 2,280,483 2,640,660 15.8 4.512 061 Sugars, molasses & honey 1,727,239 1,925,316 2,417,076 25.5 8.713 098 Edible products & preparations, nes 1,077,752 1,972,115 2,378,202 20.6 29.614 287 Other ores & concentrates (c) 3,320,912 2,278,780 2,025,356 -11.1 -9.715 112 Alcoholic beverages 1,489,605 1,678,164 1,890,169 12.6 8.716 542 Medicaments (incl veterinary) 1,480,857 1,538,796 1,758,053 14.2 -13.017 285 Aluminium ores & conc (incl alumina) 925,420 1,346,525 1,635,640 21.5 45.518 792 Aircraft, spacecraft & parts 1,343,862 1,575,421 1,382,450 -12.2 11.419 289 Precious metal ores & conc (excl gold) 1,075,068 1,392,271 1,313,850 -5.6 10.520 043 Barley (d) 1,651,125 1,052,299 1,300,991 23.6 11.3
988 Confidential items of trade 28,679,405 23,922,870 29,688,547 .. ..Top merchandise imports
Total merchandise imports 189,172,120 192,334,749 193,364,527 0.5 3.21 334 Refined petroleum 17,060,215 14,562,306 16,121,610 10.7 1.02 781 Passenger motor vehicles 12,568,680 13,982,647 14,585,540 4.3 5.13 764 Telecom equipment & parts 10,265,932 10,902,604 11,155,884 2.3 8.34 752 Computers 7,664,071 7,416,745 7,434,953 0.2 3.75 782 Goods vehicles 5,156,437 6,238,547 6,740,988 8.1 1.66 971 Gold 3,124,555 5,391,522 6,720,174 24.6 3.47 333 Crude petroleum 10,050,463 5,462,014 5,780,221 5.8 -16.78 793 Ships, boats & floating structures (e) 702,571 557,379 4,432,343 .. 12.19 821 Furniture, mattresses & cushions 3,401,054 3,855,152 3,547,794 -8.0 9.5
10 894 Prams, toys, games & sporting goods 2,586,615 2,720,848 2,877,481 5.8 6.911 893 Plastic articles, nes 2,468,879 2,843,285 2,828,276 -0.5 11.712 778 Electrical machinery & parts, nes 2,571,681 2,738,232 2,792,293 2.0 7.713 741 Heating & cooling equipment & parts 3,761,810 4,082,421 2,513,920 -38.4 10.514 775 Household-type equipment, nes 2,061,377 2,416,505 2,438,388 0.9 10.915 761 Monitors, projectors & TVs 1,983,804 2,139,872 2,250,385 5.2 3.416 784 Vehicle parts & accessories 2,104,994 2,305,599 2,245,845 -2.6 1.817 792 Aircraft, spacecraft & parts 229,517 1,565,357 2,194,930 40.2 71.018 098 Edible products & preparations, nes 1,917,293 2,266,904 2,165,166 -4.5 10.319 845 Other textile clothing 1,947,814 2,223,824 2,154,267 -3.1 8.620 625 Rubber tyres, treads & tubes 2,169,552 2,089,875 2,134,400 2.1 -3.2
988 Confidential items of trade 6,964,088 6,262,036 5,327,857 .. ..
(a) Rank based on 2016-17. (b) May exclude selected confidential export and import commodities. Refer to the DFAT website(http://dfat.gov.au/about-us/publications/trade-investment/Pages/dfat-adjustments-to-abs-official-trade-data.aspx)for more information and a list of the commodities excluded.(c) Mainly Manganese and Zinc ores & concentrates . (d) Only includes data up to March 2017. (e) For 2016-17, includes a DFAT estimate forBased on ABS trade data on DFAT STARS database (ABS catalogue 5368.0) and unpublished ABS data.
TABLE 62: AUSTRALIA'S MERCHANDISE TRADE WITH APEC (a)(b)(A$'000)

Page 122
% growth2015-16 to 5 year
Rank Commodity 2014-15 2015-16 2016-17 2016-17 trendTop merchandise exports
Total merchandise exports 30,192,293 25,469,801 29,160,184 14.5 1.81 333 Crude petroleum 2,833,624 1,861,867 2,971,621 59.6 -11.12 041 Wheat 2,627,800 2,370,333 2,912,259 22.9 -0.63 321 Coal 1,287,229 1,381,455 2,108,143 52.6 28.64 682 Copper 978,421 1,177,048 1,258,875 7.0 -5.35 001 Live animals (excl seafood) 1,041,620 1,082,551 963,499 -11.0 31.16 684 Aluminium 902,428 891,044 889,039 -0.2 -3.77 971 Gold 4,031,085 1,477,208 863,099 -41.6 -18.48 061 Sugars, molasses & honey 717,872 711,927 711,012 -0.1 6.59 011 Beef, f.c.f. 644,173 688,455 696,847 1.2 12.4
10 036 Crustaceans, f.c.f. 750,031 700,914 605,731 -13.6 41.011 263 Cotton 429,231 406,994 527,640 29.6 -2.612 022 Milk, cream, whey & yoghurt 666,571 508,251 514,831 1.3 1.513 289 Precious metal ores & conc (excl gold) 244,256 328,669 452,742 37.7 13.214 012 Meat (excl beef), f.c.f. 425,376 409,220 445,334 8.8 15.015 283 Copper ores & concentrates 293,056 234,709 437,233 86.3 26.016 334 Refined petroleum 641,523 341,384 402,276 17.8 -20.617 057 Fruit & nuts 231,492 350,263 388,017 10.8 23.018 281 Iron ores & concentrates 266,365 243,984 324,739 33.1 632.919 411 Animal oils & fats 234,608 272,245 322,827 18.6 20.020 686 Zinc 219,188 220,328 320,591 45.5 20.7
988 Confidential items of trade 2,371,033 2,340,650 3,337,121 .. ..Top merchandise imports
Total merchandise imports 45,482,585 43,493,931 43,498,884 0.0 -0.61 334 Refined petroleum 7,223,831 5,351,921 7,141,940 33.4 -10.12 782 Goods vehicles 3,316,480 4,202,742 4,804,031 14.3 16.23 333 Crude petroleum 7,327,049 4,178,810 4,316,611 3.3 -16.24 781 Passenger motor vehicles 1,864,807 2,257,514 2,299,566 1.9 23.95 764 Telecom equipment & parts 1,731,540 1,858,095 1,799,743 -3.1 13.26 752 Computers 1,299,629 1,364,135 1,236,750 -9.3 2.57 741 Heating & cooling equipment & parts 1,265,086 1,317,016 1,150,547 -12.6 19.28 098 Edible products & preparations, nes 909,256 905,045 824,526 -8.9 1.39 775 Household-type equipment, nes 589,205 722,610 810,418 12.2 15.1
10 761 Monitors, projectors & TVs 790,847 600,577 749,391 24.8 0.611 821 Furniture, mattresses & cushions 646,760 722,568 694,060 -3.9 10.112 851 Footwear 412,832 557,647 589,053 5.6 29.213 037 Seafood, prepared or preserved 510,914 499,737 569,833 14.0 5.914 971 Gold 199,023 769,805 482,481 -37.3 -22.115 893 Plastic articles, nes 422,003 481,248 451,267 -6.2 11.016 784 Vehicle parts & accessories 356,623 415,855 410,044 -1.4 8.217 625 Rubber tyres, treads & tubes 461,588 396,707 396,418 -0.1 -0.718 682 Copper 359,086 309,722 385,616 24.5 47.819 897 Jewellery 303,911 401,841 365,236 -9.1 13.320 776 Electronic integrated circuits 445,605 329,044 359,058 9.1 9.2
988 Confidential items of trade 1,174,487 1,110,433 970,687 .. ..
(a) Rank based on 2016-17. (b) May exclude selected confidential export and import commodities. Refer to the DFAT website(http://dfat.gov.au/about-us/publications/trade-investment/Pages/dfat-adjustments-to-abs-official-trade-data.aspx)for more information and a list of the commodities excluded.Based on ABS trade data on DFAT STARS database (ABS catalogue 5368.0) and unpublished ABS data.
TABLE 63: AUSTRALIA'S MERCHANDISE TRADE WITH ASEAN (a)(b)(A$'000)

Page 123
% growth2015-16 to 5 year
Rank Commodity 2014-15 2015-16 2016-17 2016-17 trendTop merchandise exports
Total merchandise exports 205,301,463 190,142,951 234,619,335 23.4 0.91 281 Iron ores & concentrates 54,518,932 47,798,823 62,771,993 31.3 -2.32 321 Coal 34,078,579 30,410,348 47,595,839 56.5 0.83 971 Gold 12,433,469 11,621,836 13,465,831 15.9 3.74 041 Wheat 4,565,895 4,377,670 5,475,532 25.1 -1.85 011 Beef, f.c.f. 5,062,920 5,349,886 5,164,020 -3.5 11.76 283 Copper ores & concentrates 5,053,806 4,567,359 4,459,977 -2.4 -3.47 333 Crude petroleum 2,909,549 3,896,051 4,355,617 11.8 -18.58 682 Copper 3,257,005 3,487,971 3,028,356 -13.2 -0.99 054 Vegetables, f.c.f. 1,012,976 1,712,673 2,957,081 72.7 25.5
10 684 Aluminium 3,863,785 3,215,591 2,941,374 -8.5 -3.911 268 Wool & other animal hair (incl tops) 2,431,237 2,492,234 2,869,113 15.1 4.512 012 Meat (excl beef), f.c.f. 2,365,296 2,129,141 2,302,001 8.1 10.113 061 Sugars, molasses & honey 1,604,278 1,775,612 2,278,961 28.3 11.114 098 Edible products & preparations, nes 911,410 1,712,964 2,161,431 26.2 34.315 287 Other ores & concentrates (c) 3,329,570 2,347,567 1,976,905 -15.8 -10.416 263 Cotton 1,539,279 1,244,113 1,715,982 37.9 -13.417 043 Barley (d) 1,706,785 1,431,567 1,498,575 4.7 0.918 001 Live animals (excl seafood) 1,599,587 1,761,950 1,490,712 -15.4 16.019 542 Medicaments (incl veterinary) 1,175,141 1,167,327 1,408,285 20.6 -13.920 057 Fruit & nuts 922,494 1,234,749 1,342,518 8.7 25.6
988 Confidential items of trade 29,581,857 25,126,301 31,988,768 .. ..Top merchandise imports
Total merchandise imports 151,257,815 153,017,493 155,784,479 1.8 4.01 334 Refined petroleum 17,876,976 16,016,694 17,218,838 7.5 2.82 781 Passenger motor vehicles 10,124,938 11,537,746 12,295,963 6.6 3.43 764 Telecom equipment & parts 8,858,137 9,429,207 9,691,347 2.8 8.84 752 Computers 6,818,350 6,699,515 6,578,341 -1.8 3.05 782 Goods vehicles 4,695,883 5,782,568 6,392,114 10.5 9.86 333 Crude petroleum 10,008,447 5,560,756 5,740,440 3.2 -16.67 793 Ships, boats & floating structures (e) 475,338 398,510 4,275,167 .. 13.98 821 Furniture, mattresses & cushions 3,309,166 3,744,169 3,469,273 -7.3 9.89 971 Gold 510,364 1,952,395 3,188,852 63.3 2.4
10 894 Prams, toys, games & sporting goods 2,341,881 2,502,386 2,664,359 6.5 7.011 845 Other textile clothing 2,339,867 2,749,484 2,657,736 -3.3 11.012 893 Plastic articles, nes 2,098,147 2,468,010 2,465,998 -0.1 13.313 775 Household-type equipment, nes 1,953,653 2,308,934 2,358,836 2.2 12.114 761 Monitors, projectors & TVs 1,893,458 2,071,521 2,174,026 4.9 3.215 778 Electrical machinery & parts, nes 1,907,347 2,107,458 2,127,695 1.0 7.816 741 Heating & cooling equipment & parts 3,205,763 3,598,530 2,105,861 -41.5 12.517 851 Footwear 1,691,901 1,985,285 1,870,688 -5.8 10.818 699 Manufactures of base metal, nes 1,700,151 1,858,200 1,820,763 -2.0 8.519 625 Rubber tyres, treads & tubes 1,859,981 1,788,958 1,800,122 0.6 -3.520 842 Women's clothing (excl knitted) 1,568,095 1,769,737 1,681,522 -5.0 8.0
988 Confidential items of trade 3,680,545 3,429,480 4,118,929 .. ..
(a) Rank based on 2016-17. (b) May exclude selected confidential export and import commodities. Refer to the DFAT website(http://dfat.gov.au/about-us/publications/trade-investment/Pages/dfat-adjustments-to-abs-official-trade-data.aspx)for more information and a list of the commodities excluded.(c) Mainly Manganese and Zinc ores & concentrates . (d) Only includes data up to March 2017. (e) For 2016-17, includes a DFAT estimate forBased on ABS trade data on DFAT STARS database (ABS catalogue 5368.0) and unpublished ABS data.
TABLE 64: AUSTRALIA'S MERCHANDISE TRADE WITH ASIA (a)(b)(A$'000)

Page 124
% growth2015-16 to 5 year
Rank Commodity 2014-15 2015-16 2016-17 2016-17 trendTop merchandise exports
Total merchandise exports 14,240,814 18,579,201 21,904,648 17.9 0.01 971 Gold 946,659 4,771,866 5,335,150 11.8 2.92 321 Coal 2,567,202 2,610,425 4,424,790 69.5 -1.33 222 Oil-seeds & oleaginous fruits, soft 550,397 977,961 1,874,477 91.7 4.64 112 Alcoholic beverages 607,760 598,775 597,911 -0.1 -2.15 685 Lead 345,481 523,325 596,694 14.0 3.16 951 Gold coin & legal tender coin 318,198 548,924 486,921 -11.3 2.07 792 Aircraft, spacecraft & parts 274,051 362,755 369,717 1.9 13.18 872 Medical instruments (incl veterinary) 339,474 316,534 336,389 6.3 13.09 268 Wool & other animal hair (incl tops) 297,763 316,775 332,948 5.1 3.2
10 289 Precious metal ores & conc (excl gold) 276,774 220,710 324,725 47.1 -3.811 287 Other ores & concentrates (c) 806,770 276,511 305,976 10.7 -15.712 667 Pearls & gems 372,914 398,317 288,845 -27.5 2.713 899 Misc manufactured articles, nes 335,980 374,966 283,089 -24.5 5.214 542 Medicaments (incl veterinary) 253,218 285,390 277,693 -2.7 -9.415 057 Fruit & nuts 235,044 338,211 258,549 -23.6 31.316 011 Beef, f.c.f. 312,178 354,644 253,419 -28.5 -4.317 285 Aluminium ores & conc (incl alumina) 10 105,244 240,511 128.5 ..18 541 Pharm products (excl medicaments) 178,269 244,590 226,552 -7.4 12.219 681 Silver & platinum 201,339 42,906 225,174 424.8 -18.620 012 Meat (excl beef), f.c.f. 237,710 220,730 219,447 -0.6 -1.4
988 Confidential items of trade 1,042,752 1,159,048 1,085,976 .. ..Top merchandise imports
Total merchandise imports 49,423,549 53,889,045 53,694,630 -0.4 2.41 781 Passenger motor vehicles 5,492,143 6,943,301 6,688,303 -3.7 9.82 542 Medicaments (incl veterinary) 5,157,834 5,772,484 5,467,802 -5.3 -1.03 541 Pharm products (excl medicaments) 2,018,557 2,324,421 2,714,448 16.8 16.04 782 Goods vehicles 761,101 878,949 1,093,331 24.4 -5.45 744 Mechanical handling equip & parts 986,298 1,011,398 1,032,981 2.1 2.16 874 Measuring & analysing instruments 1,200,029 1,138,001 1,015,519 -10.8 0.67 899 Misc manufactured articles, nes 926,693 957,322 973,165 1.7 6.98 112 Alcoholic beverages 897,226 1,014,971 958,170 -5.6 7.79 792 Aircraft, spacecraft & parts 93,537 626,388 918,397 .. ..
10 728 Specialised machinery & parts 767,964 922,595 865,857 -6.1 -5.311 723 Civil engineering equipment & parts 642,940 627,492 862,997 37.5 -15.112 553 Perfumery & cosmetics (excl soap) 687,805 768,414 792,438 3.1 9.213 872 Medical instruments (incl veterinary) 735,157 820,293 766,559 -6.6 7.014 784 Vehicle parts & accessories 672,289 710,749 724,138 1.9 1.215 743 Pumps (excl liquid pumps) & parts 1,164,768 645,571 719,901 11.5 -2.316 764 Telecom equipment & parts 682,358 780,698 691,090 -11.5 0.517 775 Household-type equipment, nes 593,739 700,580 651,823 -7.0 8.218 745 Non-electrical machinery & parts 521,854 565,987 583,996 3.2 6.719 741 Heating & cooling equipment & parts 562,368 696,301 572,700 -17.8 7.520 772 Electrical circuits equipment 621,680 599,021 563,905 -5.9 -2.3
988 Confidential items of trade 1,315,051 437,131 626,379 .. ..
(a) Rank based on 2016-17. (b) May exclude selected confidential export and import commodities. Refer to the DFAT website(http://dfat.gov.au/about-us/publications/trade-investment/Pages/dfat-adjustments-to-abs-official-trade-data.aspx)for more information and a list of the commodities excluded.(c) Mainly Manganese and Zinc ores & concentrates .Based on ABS trade data on DFAT STARS database (ABS catalogue 5368.0) and unpublished ABS data.
TABLE 65: AUSTRALIA'S MERCHANDISE TRADE WITH EUROPE (a)(b)(A$'000)
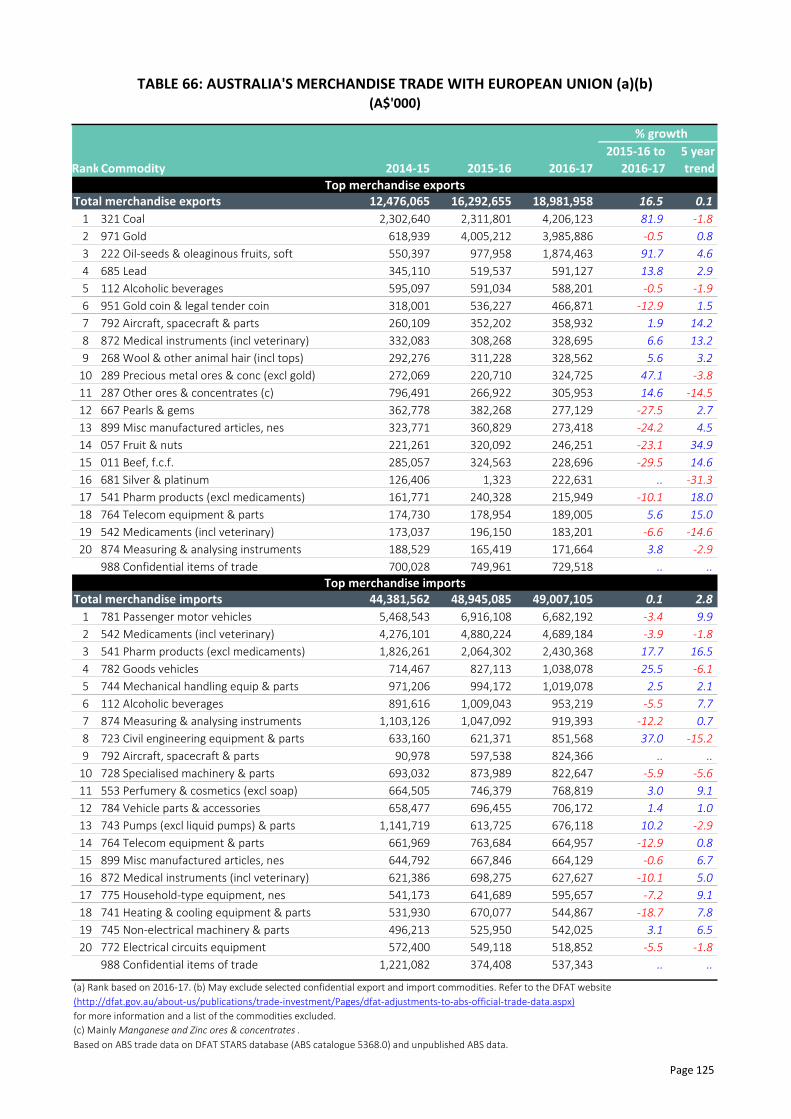
Page 125
% growth2015-16 to 5 year
Rank Commodity 2014-15 2015-16 2016-17 2016-17 trendTop merchandise exports
Total merchandise exports 12,476,065 16,292,655 18,981,958 16.5 0.11 321 Coal 2,302,640 2,311,801 4,206,123 81.9 -1.82 971 Gold 618,939 4,005,212 3,985,886 -0.5 0.83 222 Oil-seeds & oleaginous fruits, soft 550,397 977,958 1,874,463 91.7 4.64 685 Lead 345,110 519,537 591,127 13.8 2.95 112 Alcoholic beverages 595,097 591,034 588,201 -0.5 -1.96 951 Gold coin & legal tender coin 318,001 536,227 466,871 -12.9 1.57 792 Aircraft, spacecraft & parts 260,109 352,202 358,932 1.9 14.28 872 Medical instruments (incl veterinary) 332,083 308,268 328,695 6.6 13.29 268 Wool & other animal hair (incl tops) 292,276 311,228 328,562 5.6 3.2
10 289 Precious metal ores & conc (excl gold) 272,069 220,710 324,725 47.1 -3.811 287 Other ores & concentrates (c) 796,491 266,922 305,953 14.6 -14.512 667 Pearls & gems 362,778 382,268 277,129 -27.5 2.713 899 Misc manufactured articles, nes 323,771 360,829 273,418 -24.2 4.514 057 Fruit & nuts 221,261 320,092 246,251 -23.1 34.915 011 Beef, f.c.f. 285,057 324,563 228,696 -29.5 14.616 681 Silver & platinum 126,406 1,323 222,631 .. -31.317 541 Pharm products (excl medicaments) 161,771 240,328 215,949 -10.1 18.018 764 Telecom equipment & parts 174,730 178,954 189,005 5.6 15.019 542 Medicaments (incl veterinary) 173,037 196,150 183,201 -6.6 -14.620 874 Measuring & analysing instruments 188,529 165,419 171,664 3.8 -2.9
988 Confidential items of trade 700,028 749,961 729,518 .. ..Top merchandise imports
Total merchandise imports 44,381,562 48,945,085 49,007,105 0.1 2.81 781 Passenger motor vehicles 5,468,543 6,916,108 6,682,192 -3.4 9.92 542 Medicaments (incl veterinary) 4,276,101 4,880,224 4,689,184 -3.9 -1.83 541 Pharm products (excl medicaments) 1,826,261 2,064,302 2,430,368 17.7 16.54 782 Goods vehicles 714,467 827,113 1,038,078 25.5 -6.15 744 Mechanical handling equip & parts 971,206 994,172 1,019,078 2.5 2.16 112 Alcoholic beverages 891,616 1,009,043 953,219 -5.5 7.77 874 Measuring & analysing instruments 1,103,126 1,047,092 919,393 -12.2 0.78 723 Civil engineering equipment & parts 633,160 621,371 851,568 37.0 -15.29 792 Aircraft, spacecraft & parts 90,978 597,538 824,366 .. ..
10 728 Specialised machinery & parts 693,032 873,989 822,647 -5.9 -5.611 553 Perfumery & cosmetics (excl soap) 664,505 746,379 768,819 3.0 9.112 784 Vehicle parts & accessories 658,477 696,455 706,172 1.4 1.013 743 Pumps (excl liquid pumps) & parts 1,141,719 613,725 676,118 10.2 -2.914 764 Telecom equipment & parts 661,969 763,684 664,957 -12.9 0.815 899 Misc manufactured articles, nes 644,792 667,846 664,129 -0.6 6.716 872 Medical instruments (incl veterinary) 621,386 698,275 627,627 -10.1 5.017 775 Household-type equipment, nes 541,173 641,689 595,657 -7.2 9.118 741 Heating & cooling equipment & parts 531,930 670,077 544,867 -18.7 7.819 745 Non-electrical machinery & parts 496,213 525,950 542,025 3.1 6.520 772 Electrical circuits equipment 572,400 549,118 518,852 -5.5 -1.8
988 Confidential items of trade 1,221,082 374,408 537,343 .. ..
(a) Rank based on 2016-17. (b) May exclude selected confidential export and import commodities. Refer to the DFAT website(http://dfat.gov.au/about-us/publications/trade-investment/Pages/dfat-adjustments-to-abs-official-trade-data.aspx)for more information and a list of the commodities excluded.(c) Mainly Manganese and Zinc ores & concentrates .Based on ABS trade data on DFAT STARS database (ABS catalogue 5368.0) and unpublished ABS data.
TABLE 66: AUSTRALIA'S MERCHANDISE TRADE WITH EUROPEAN UNION (a)(b)(A$'000)

Page 126
% growth2015-16 to 5 year
Rank Commodity 2014-15 2015-16 2016-17 2016-17 trendTop merchandise exports
Total merchandise exports 11,488,491 11,625,679 11,795,776 1.5 1.11 752 Computers 249,914 218,258 354,900 62.6 17.32 872 Medical instruments (incl veterinary) 242,377 299,698 352,696 17.7 16.43 542 Medicaments (incl veterinary) 269,904 277,090 297,649 7.4 -0.54 041 Wheat 318,944 317,543 270,430 -14.8 2.15 781 Passenger motor vehicles 285,737 246,266 256,928 4.3 0.46 098 Edible products & preparations, nes 245,652 312,077 249,622 -20.0 2.97 764 Telecom equipment & parts 206,357 291,274 246,662 -15.3 19.98 285 Aluminium ores & conc (incl alumina) 1,885 153,656 228,091 48.4 ..9 553 Perfumery & cosmetics (excl soap) 164,786 191,645 222,357 16.0 8.2
10 641 Paper & paperboard 184,278 223,187 220,517 -1.2 5.711 784 Vehicle parts & accessories 179,885 186,687 206,166 10.4 2.612 334 Refined petroleum 120,118 87,575 201,725 130.3 -3.913 744 Mechanical handling equip & parts 133,830 159,441 200,259 25.6 6.814 048 Cereal preparations 190,769 177,981 189,928 6.7 1.115 723 Civil engineering equipment & parts 224,544 202,821 184,430 -9.1 -5.016 892 Printed matter 164,287 192,903 182,776 -5.2 0.517 081 Animal feed 174,398 159,757 177,020 10.8 -0.518 012 Meat (excl beef), f.c.f. 158,666 151,152 175,508 16.1 8.719 699 Manufactures of base metal, nes 156,152 152,565 164,512 7.8 1.220 893 Plastic articles, nes 149,183 152,712 158,121 3.5 4.2
988 Confidential items of trade 605,752 367,027 220,023 .. ..Top merchandise imports
Total merchandise imports 11,647,126 11,339,905 11,374,732 0.3 0.41 971 Gold 2,642,027 3,152,595 3,242,435 2.8 3.82 333 Crude petroleum 2,083,481 1,173,466 1,117,854 -4.7 -15.73 098 Edible products & preparations, nes 464,340 758,550 742,258 -2.1 24.24 122 Tobacco, manufactured 467,354 546,726 515,285 -5.8 76.55 112 Alcoholic beverages 381,484 377,434 401,634 6.4 1.76 024 Cheese & curd 225,427 259,901 306,777 18.0 10.87 057 Fruit & nuts 153,356 143,954 194,617 35.2 12.68 248 Wood, simply worked 211,897 209,270 186,574 -10.8 -0.69 048 Cereal preparations 178,762 180,110 182,693 1.4 3.1
10 681 Silver & platinum 325,514 297,674 179,039 -39.9 -10.011 023 Butter 88,570 91,049 158,655 74.3 15.112 034 Fish, f.c.f. 141,908 148,548 153,077 3.0 3.413 893 Plastic articles, nes 151,769 149,572 138,954 -7.1 -0.814 641 Paper & paperboard 115,509 132,569 133,218 0.5 -1.015 741 Heating & cooling equipment & parts 109,833 111,589 115,950 3.9 -1.516 022 Milk, cream, whey & yoghurt 92,051 82,158 115,344 40.4 1.217 659 Floor coverings 104,171 121,820 109,231 -10.3 4.418 056 Vegetables, prepared or preserved 112,120 99,569 107,344 7.8 3.619 111 Non-alcoholic beverages, nes 91,417 95,258 107,068 12.4 3.420 542 Medicaments (incl veterinary) 91,609 102,068 102,815 0.7 4.3
988 Confidential items of trade 207,647 68,086 148,633 .. ..
(a) Rank based on 2016-17. (b) May exclude selected confidential export and import commodities. Refer to the DFAT website(http://dfat.gov.au/about-us/publications/trade-investment/Pages/dfat-adjustments-to-abs-official-trade-data.aspx)for more information and a list of the commodities excluded.Based on ABS trade data on DFAT STARS database (ABS catalogue 5368.0) and unpublished ABS data.
TABLE 67: AUSTRALIA'S MERCHANDISE TRADE WITH OCEANIA & ANTARCTICA (a)(b)(A$'000)

Page 127
% growth2015-16 to 5 year
Rank Commodity 2014-15 2015-16 2016-17 2016-17 trendTop merchandise exports
Total merchandise exports 100,638,136 96,896,021 107,735,099 11.2 -1.51 321 Coal 19,506,771 18,913,726 26,242,127 38.7 -3.02 281 Iron ores & concentrates 10,743,160 7,735,006 9,322,237 20.5 -13.83 971 Gold 1,334,467 5,280,339 5,746,067 8.8 2.34 011 Beef, f.c.f. 6,785,423 6,212,687 5,032,159 -19.0 12.45 222 Oil-seeds & oleaginous fruits, soft 791,377 1,101,816 2,025,358 83.8 4.16 684 Aluminium 2,513,031 1,982,042 1,924,603 -2.9 -0.97 012 Meat (excl beef), f.c.f. 1,629,932 1,780,677 1,869,322 5.0 15.28 283 Copper ores & concentrates 2,124,407 1,906,274 1,759,986 -7.7 -4.99 061 Sugars, molasses & honey 827,395 1,033,957 1,536,008 48.6 7.9
10 112 Alcoholic beverages 1,418,373 1,467,767 1,461,339 -0.4 -0.311 287 Other ores & concentrates (c) 2,037,602 1,377,007 1,442,055 4.7 -7.412 792 Aircraft, spacecraft & parts 1,334,019 1,637,127 1,355,413 -17.2 10.313 872 Medical instruments (incl veterinary) 1,125,982 1,094,017 1,220,577 11.6 10.214 541 Pharm products (excl medicaments) 388,381 733,058 999,291 36.3 31.415 289 Precious metal ores & conc (excl gold) 884,985 795,787 879,023 10.5 2.016 285 Aluminium ores & conc (incl alumina) np 482,449 857,141 77.7 ..17 542 Medicaments (incl veterinary) 1,062,896 922,994 855,800 -7.3 -13.318 899 Misc manufactured articles, nes 678,331 824,177 803,477 -2.5 10.519 041 Wheat 893,068 960,981 796,406 -17.1 -7.520 333 Crude petroleum 348,284 1,296,106 768,023 -40.7 -23.6
988 Confidential items of trade 21,137,554 15,892,619 17,017,062 .. ..Top merchandise imports
Total merchandise imports 125,159,183 131,692,163 132,450,410 0.6 2.61 781 Passenger motor vehicles 16,153,402 18,613,140 18,890,337 1.5 5.32 334 Refined petroleum 8,165,798 7,720,040 7,461,750 -3.3 11.83 542 Medicaments (incl veterinary) 6,273,355 6,977,416 6,539,234 -6.3 -1.64 793 Ships, boats & floating structures 567,473 408,846 4,410,312 978.7 21.45 971 Gold 1,277,534 2,584,093 3,907,669 51.2 6.66 541 Pharm products (excl medicaments) 2,506,493 3,083,266 3,668,898 19.0 15.17 792 Aircraft, spacecraft & parts 309,874 2,124,245 3,025,287 .. ..8 782 Goods vehicles 2,545,724 2,868,635 2,969,630 3.5 -11.29 764 Telecom equipment & parts 2,510,341 2,621,076 2,515,122 -4.0 1.0
10 874 Measuring & analysing instruments 2,663,351 2,524,037 2,395,777 -5.1 1.311 723 Civil engineering equipment & parts 3,312,343 2,094,329 2,365,856 13.0 -16.612 872 Medical instruments (incl veterinary) 2,025,815 2,298,083 2,243,841 -2.4 9.213 784 Vehicle parts & accessories 1,902,077 2,014,920 2,012,891 -0.1 -0.714 899 Misc manufactured articles, nes 1,600,406 1,780,116 1,821,514 2.3 9.015 112 Alcoholic beverages 1,664,765 1,823,044 1,784,548 -2.1 6.716 778 Electrical machinery & parts, nes 1,670,310 1,657,783 1,686,569 1.7 3.917 098 Edible products & preparations, nes 1,223,786 1,650,312 1,579,616 -4.3 17.318 744 Mechanical handling equip & parts 1,570,814 1,560,131 1,542,555 -1.1 -3.219 553 Perfumery & cosmetics (excl soap) 1,294,572 1,564,917 1,523,109 -2.7 11.420 743 Pumps (excl liquid pumps) & parts 2,544,522 2,237,599 1,453,012 -35.1 -0.2
988 Confidential items of trade 5,876,962 4,335,936 2,935,214 .. ..
(a) Rank based on 2016-17. (b) May exclude selected confidential export and import commodities. Refer to the DFAT website(http://dfat.gov.au/about-us/publications/trade-investment/Pages/dfat-adjustments-to-abs-official-trade-data.aspx)for more information and a list of the commodities excluded.(c) Mainly Manganese and Zinc ores & concentrates .Based on ABS trade data on DFAT STARS database (ABS catalogue 5368.0) and unpublished ABS data.
TABLE 68: AUSTRALIA'S MERCHANDISE TRADE WITH OECD (a)(b)(A$'000)

Page 128
% growth2015-16 to 5 year
Rank Commodity 2014-15 2015-16 2016-17 2016-17 trendTop merchandise exports
Total merchandise exports (c) 255,524,000 244,147,000 291,598,000 19.4 1.01 281 Iron ores & concentrates 54,518,991 47,798,926 62,799,495 31.4 -2.42 321 Coal 37,882,372 34,541,191 54,266,835 57.1 0.73 343 Natural gas 16,894,768 16,575,582 22,299,200 34.5 10.84 971 Gold 13,505,844 16,585,176 18,978,819 14.4 3.45 285 Aluminium ores & conc (incl alumina) 7,106,382 6,789,681 7,529,116 10.9 7.56 011 Beef, f.c.f. 9,039,531 8,494,648 7,114,840 -16.2 12.17 041 Wheat 5,528,077 5,096,342 6,073,292 19.2 -3.38 333 Crude petroleum 8,153,866 5,184,027 5,150,102 -0.7 -15.89 283 Copper ores & concentrates 5,242,345 4,664,019 4,550,839 -2.4 -3.5
10 012 Meat (excl beef), f.c.f. 3,840,247 3,649,494 3,831,573 5.0 11.111 054 Vegetables, f.c.f. 1,235,757 1,935,930 3,270,149 68.9 22.512 684 Aluminium 4,158,705 3,420,003 3,268,396 -4.4 -3.513 268 Wool & other animal hair (incl tops) 2,781,756 2,872,428 3,262,575 13.6 4.514 682 Copper 3,370,009 3,566,842 3,127,841 -12.3 -1.415 280 Confidential mineral ores 1,637,584 2,177,161 3,053,603 40.3 0.416 112 Alcoholic beverages 2,186,353 2,389,132 2,612,292 9.3 5.517 287 Other ores & concentrates (d) 4,845,305 3,455,252 2,601,274 -24.7 -8.318 098 Edible products & preparations, nes 1,214,264 2,119,329 2,523,676 19.1 27.319 061 Sugars, molasses & honey 1,751,187 1,959,759 2,408,551 22.9 8.120 334 Refined petroleum 2,511,049 1,950,383 2,346,972 20.3 -7.9
988 Confidential items of trade 4,547,081 4,044,359 4,005,037 .. ..Top merchandise imports
Total merchandise imports (c) 268,719,000 271,476,000 277,900,000 2.4 1.91 781 Passenger motor vehicles 18,707,803 21,541,778 21,781,826 1.1 6.62 334 Refined petroleum 18,078,151 16,227,992 17,391,778 7.2 1.13 764 Telecom equipment & parts 11,041,129 11,781,035 11,967,242 1.6 7.74 333 Crude petroleum 14,710,495 7,624,600 8,582,538 12.6 -19.95 782 Goods vehicles 6,122,712 7,353,034 8,003,983 8.9 0.36 752 Computers 8,044,973 7,819,856 7,855,382 0.5 3.77 542 Medicaments (incl veterinary) 7,076,467 7,711,649 7,339,784 -4.8 -2.78 971 Gold 3,772,052 6,044,777 7,240,007 19.8 1.49 793 Ships, boats & floating structures (e) 967,652 922,264 4,801,027 .. 6.5
10 821 Furniture, mattresses & cushions 3,931,768 4,455,963 4,203,459 -5.7 9.811 541 Pharm products (excl medicaments) 2,718,008 3,339,510 3,930,569 17.7 12.912 778 Electrical machinery & parts, nes 3,186,200 3,364,180 3,381,921 0.5 6.513 775 Household-type equipment, nes 2,823,595 3,293,213 3,330,398 1.1 9.914 893 Plastic articles, nes 2,893,131 3,316,555 3,292,052 -0.7 10.815 741 Heating & cooling equipment & parts 4,577,841 5,088,638 3,232,329 -36.5 10.816 894 Prams, toys, games & sporting goods 2,879,906 3,187,970 3,206,713 0.6 7.617 792 Aircraft, spacecraft & parts 336,369 2,226,154 3,183,680 43.0 72.318 874 Measuring & analysing instruments 3,316,671 3,190,325 3,038,070 -4.8 2.419 784 Vehicle parts & accessories 2,838,777 3,082,550 3,031,429 -1.7 1.620 872 Medical instruments (incl veterinary) 2,611,031 2,933,808 2,945,732 0.4 10.8
988 Confidential items of trade 6,949,067 4,687,448 3,548,274 .. ..
(a) Rank based on 2016-17. (b) May exclude selected confidential export and import commodities. Refer to the DFAT website(http://dfat.gov.au/about-us/publications/trade-investment/Pages/dfat-adjustments-to-abs-official-trade-data.aspx)for more information and a list of the commodities excluded. (c) Balance of payments basis.(d) Mainly Manganese and Zinc ores & concentrates . (e) For 2016-17, includes a DFAT estimate for the import of a LNG floating platform.Based on ABS trade data on DFAT STARS database (ABS catalogue 5368.0) and unpublished ABS data.
TABLE 69: AUSTRALIA'S MERCHANDISE TRADE WITH ALL COUNTRIES (a)(b)(A$'000)

Page 129
Technical appendices

Page 130
APPENDIX A – EXPLANATORY NOTES
Introduction Composition of Trade 2016-17 provides details of Australia's goods and services trade, export markets, and sources of imports for the years 2014-15 to 2016-17 and in selected tables from 2011-12.
This publication is divided into two major segments. The first part examines Australia’s trade in goods and services on a balance of payments basis. It consists of three sections – Section 1 provides summary data on Australia's trade in goods and services showing current price values, chain volume measures, movements in export and import prices and the terms of trade. Also included is a commodity ranking for goods and services. Section 2 shows Australia's direction of goods and services trade, including ranking tables. Section 3 provides Australia’s composition of services trade by type of activity and direction of services trade.
Part two examines Australia’s merchandise trade on a recorded trade basis. It consists of four sections – Section 4 shows Australia’s merchandise trade by level of processing, including data on Australian produced exports. Section 5 provides commodity rankings for Australia's merchandise trade, exports and imports. Section 6 provides a ranking of Australia's merchandise trade by country and data on selected country groups. Section 7 gives the top 20 commodity exports and imports details for Australia’s top 25 merchandise trading partners, regions and selected economic groups.
This publication should be used in conjunction with DFAT’S time series trade data products available on the DFAT website in Microsoft Excel format. The website contains the following products. i) Three MS Excel time series spreadsheets covering:
a. Australia’s trade in goods and services with all countries and country groups
b. Australia’s trade and economic indicators – historical data
c. Australia’s direction of merchandise trade – historical data
ii) Two MS Excel Pivot tables:
• Australia's merchandise exports and imports by all countries, all State and Territories and selected country groups by SITC at the 3-digit level and;
• Australia's merchandise exports and imports by all countries, all State and Territories and selected country groups by DFAT's TRIEC at the 1-, 2-, 3- and 4-digit levels.
Data sources The trade data on a balance of payments basis in Sections 1, 2, and 3 and the chain volume and price index data has been sourced from the Balance of Payments and International Investment Position Australia, September quarter 2017 (ABS catalogue 5302.0). The partner country services data was sourced from the International Trade: Supplementary Information, calendar year, 2016-17 (ABS catalogue 5368.0.55.003/4).
The merchandise trade statistics used to compile this publication are derived by the Australian Bureau of Statistics (ABS) from information provided to the Department of Immigration and Border Protection by exporters and importers. ABS editing procedures frequently lead to revisions of previously published trade

Page 131
data and may occur for up to seven months after the reference period. Most of these revisions occur in the first month after the reference period.
DFAT uses merchandise trade data published three months after the reference period as a close proxy for final trade data for this period. ABS monthly merchandise trade data as at September 2017 have been used for the 2016-17 financial reference year.
This allows DFAT to release its trade publications (and associated country/economic fact sheets) in a more timely fashion, and on a more consistent basis, than awaiting the release of the final trade data for 2016-17, seven months after the reference period. The minor revisions to the current reference period published after this point will be incorporated in the next financial year issue of this publication.
DFAT adjustment to official ABS merchandise trade statistics DFAT has made a number of adjustments to the official trade statistics as published by the ABS. Please refer to Appendix G in this publication for more information.
Confidential data in ABS trade statistics Merchandise trade
To avoid divulging commercially sensitive details of individual firms, the ABS restricts release of statistics on certain commodities. Such details are aggregated into a ‘dump’ item (SITC code 988) or (TRIEC code 3041) in most tables. Appendices D and E list the restrictions applied to confidential export items and the countries most affected. It is worth noting that commodities are frequently added to the confidential list, e.g. as live cattle was in October 2015. In such cases the value shown for trade in aggregates containing these items will show a decrease.
Alumina exports – Bahrain, Egypt and Iceland
The partner country total value for exports up to 2012 will be correct except for total exports to Bahrain, Egypt and Iceland (from March 1992 to December 2012) which exclude alumina exports. These exports are coded to a ‘confidential country’ category and cannot be separately identified. As a result, the values of exports to these countries are understated in aggregate by the following amounts: $513 million in 2011-12 and $172 million in 2012-13.
Exports June 2013 to present
The ABS announced that it had changed the method used in confidentialising data for merchandise exports from the month of June 2013 onwards. Export data commodities that have the confidentiality restrictions of "No commodity details" or "No value details" are now aggregated into a single confidential country code.
For export data prior to June 2013, these data are added back into the appropriate country totals (i.e. these totals show the correct level of trade). From June 2013 the confidential data are not being added back into the appropriate country totals. Instead they are published as "No country details" in total Australian export data.
As a result, the values of exports by partner country are understated in aggregate by the following amounts: $596 million in 2012-13, $5.7 billion in in 2013-14; $6.2 billion in 2014-15, $5.8 billion in 2015-16 and $6.2 billion in 2016-17.
Given the importance of accurate trade data, DFAT has been working with the ABS to find a solution which will allow accurate partner country export/import totals on a financial and calendar year basis to be published while maintaining business confidentiality. As a result, the ABS was able to provide calendar and financial year export and import totals to DFAT for selected trading partners for the periods affected as an unpublished dataset.

Page 132
However, the ABS was not able to provide actual export and import totals for all countries (refer to Appendix G for a list of countries that were provided by the ABS). As a result, the values of exports to selected partner countries are understated in aggregate from June 2013 onwards.
Imports September 2008 to present
The ABS announced that it had changed the method used in confidentialising data for merchandise imports from the month of September 2008 onwards. Import data commodities that have the confidentiality restrictions of "No commodity details" or "No value details" are now aggregated into a single confidential country code.
For import data prior to September 2008, these data are added back into the appropriate country totals (i.e. these totals show the correct level of trade). From September 2008 the confidential data are not being added back into the appropriate country totals. Instead they are published as "No country details" in total Australian import data. Of the commodity codes affected by this change, Aircraft, spacecraft & related parts and Natural gas and would make up the most significant component.
As a result, the values of imports by partner country are understated in aggregate by the following amounts: $6.7 billion in 2011-12; $4.3 billion in 2012-13; $5.8 billion in 2013-14; $6.9 billion in 2014-15; $4.9 billion in 2015-16 and $7.7 billion in 2016-17.
As with exports above the ABS has been able to release selected country actual total imports as an unpublished dataset (refer to Appendix G for a list of countries that were provided by the ABS). As a result, the values of imports to selected partner countries are understated in aggregate from September 2008 onwards.
Bulk wheat exports by partner country
The value of Bulk wheat exports by partner country was confidential in ABS merchandise trade statistics up to April 2009 and was included in confidential item (SITC 988), however the quantity data by partner was published.
From this date, the ABS removed this restriction for Bulk wheat exports. Users should be particularly careful in interpreting movements in wheat exports values by partner country between 2008-09 and 2009-10 (and 2009-10 and 2010-11) as the reported value of Wheat exports will include Bulk wheat from April 2009 onwards.
Barley and Lupins exports by partner country
The value of Barley and Lupins exports by partner country is released by the ABS after a six-month lag. The data is automatically incorporated into the ABS merchandise trade data after this period. In this publication, Barley exports for 2016-17 include only exports up to March 2017. Exports of Barley for the period April to June 2017 are included in confidential items.
For further information
To assist users of Australian trade data, the ABS publishes a monthly list of all Australian Harmonized Export Commodity Classification (AHECC) and Harmonized Tariff Item Statistical Code (HTISC) commodities with confidential restrictions in place in the publication International Merchandise Trade: Confidential Commodities List (ABS catalogue 5372.0.55.001). This publication is an essential reference guide for users of ABS merchandise export statistics to ensure they are interpreting the trade statistics correctly.
DFAT has also written a number of articles on confidential in ABS merchandise trade statistics. A number of these articles are updated on a regular basis. The most useful articles include:
• Confidentiality in Australian merchandise export statistics • Impact of ABS confidential restrictions on exports of Nickel (updated annually) • Australia's imports of aircraft & parts (updated annually)
The articles are available on the DFAT website.

Page 133
Services
To avoid divulging commercially-sensitive details of individual firms, the ABS restricts release of statistics on certain services activities.
The ABS uses perturbation to confidentialise trade in services statistics. Using the perturbation methodology, the data will be perturbed, that is, have noise added to protect the confidential cells. For example, if a cell was deemed to be confidential the ABS would subtract a small amount from another cell or cells, to add to the confidential cell, to ensure that confidentiality was not breached. In most cases the level of perturbation is not significant and should have minimal impact on the analysis of trade in services data.
However, for Transport services the perturbation methodology could not be applied due to the small number of businesses in this sector. As a result, only a limited number of series can be published.
Recorded trade basis vs BOP basis The data on merchandise trade in this publication are measured on a recorded trade basis, based upon quantities and values of goods measured as they cross the Australian customs frontier. They can differ from data presented under the balance of payments (BOP) basis in terms of coverage, valuation and timing. The following table shows the differences between goods data on a BOP basis and merchandise trade data on a recorded trade basis.
Australia’s goods trade Recorded trade basis vs Balance of payments (BOP) basis
Exports 2014-15 2015-16 2016-17 A$m A$m A$m
Recorded trade basis 254,552 243,424 291,063
BOP adjustments 972 723 535
Balance of payments basis 255,524 244,147 291,598
Imports 2014-15 2015-16 2016-17 A$m A$m A$m
Recorded trade basis 256,982 263,284 264,042
BOP adjustments 11,737 8,192 13,858
Balance of payments basis 268,719 271,476 277,900
Balance on goods trade 2014-15 2015-16 2016-17 A$m A$m A$m
Recorded trade basis -2,431 -19,860 27,021
BOP adjustments -10,764 -7,469 -13,323
Balance of payments basis -13,195 -27,329 13,698
Based on ABS trade data on DFAT STARS database & ABS catalogue 5368.0.
The large differences for imports is mainly caused by low-valued imports (refer to DFAT’s Low value threshold goods article in this publication for more information) and an ABS adjustment to capital goods which Australia has taken ownership of but have not yet crossed the customs frontier.
Please note that in this publication total exports and imports of goods are shown on a BOP basis, while the accompany time series trade pivot tables are shown on a recorded trade basis. This means that share data calculated from the pivot tables will be different to those published in this publication.

Page 134
Commodity classification Balance of payments – goods
Australia’s BOP statistics are compiled in accordance with the latest international standards determined by the International Monetary Fund, and published in Balance of Payments and International Investment Position Manual, Sixth edition, 2008 (BPM6).
Exports of goods in Australia’s BOP are classified into three major components: General merchandise, Net exports of goods under merchanting and Non-monetary gold. For the General merchandise component, the underlying classification scheme for exports is the United Nations’ Standard International Trade - Classification (SITC Rev4). The classification is broken down into Rural goods (with four underlying series) and Non-rural goods (with nine underlying series).
Imports of goods in Australia’s BOP are classified into two major components: General merchandise and Non-monetary gold. For General merchandise imports are broken into three ‘end use’ categories – Consumption goods, Capital goods and Intermediate and other goods, in accordance with the United Nations’ Classification by Broad Economic Categories (BEC).
Balance of payments – Services
Australia's BOP defines services as comprising services provided between Australian residents and non-residents, together with some transactions in goods where, by international agreement, it is not practical to separate the goods and services components (e.g. goods purchased by travellers are classified as services).
Services delivered to non-residents through a foreign branch or subsidiary, for example, services rendered to an Asian company by a branch office of an Australian legal firm in Bangkok, are not defined as a BOP transaction. However, services delivered by a parent company to a foreign-resident subsidiary are defined as international services. Any profits or dividends remitted between an enterprise in Australia and a related enterprise abroad are regarded as an income transaction, not as a service in Australia’s BOP.
The ABS Extended Balance of Payments services classification (EBOP) is based on the UN publication Manual on Statistics of International Trade in Services. This is an extended services classification that is fully compatible with the BPM6.
In this classification, services commodities are broken down into 12 major groups: Manufacturing services on physical inputs owned by others; Maintenance & repair; Transport; Travel; Construction; Insurance & pension; Financial; Charges for the use of intellectual property; Telecommunication, computer & information; Other business; Personal, cultural & recreational; and Government services and around 60 detailed services commodities.
For a more detailed explanation of ABS trade in services methodology and classifications please refer to the DFAT publication, Trade in Services Australia.
United Nation’s Standard International Trade Classification
In this publication, trade is disaggregated by two classifications: the merchandise Trade Import and Export Classification (TRIEC); and the United Nation’s (UN) Standard International Trade Classification, Revision 4 (SITCr4). The United Nations SITC is a hierarchical trade commodity classification with five different levels, with the 5-digit codes aggregating to the 4-digit level and so on to the 1-digit level. SITC does not include services.
Data in this publication which have been classified according to SITCr4 are shown at the Group (3-digit) level. There are 264 categories at this level.
For more information on the UN SITCr4 classification please refer to the UN Statistics Division website.

Page 135
DFAT’s Trade Import and Export Classification
TRIEC was developed by DFAT’s Economic Diplomacy & Trade Advocacy and Statistics Section (EDS) to provide information on Australia’s merchandise trade by level of processing to meet specific analytical needs of the Department.
TRIEC is a secondary classification created from the Australian Bureau of Statistics (ABS) Australian Harmonized Export Commodity Classification (AHECC) at the 4-digit level (with some 6-digit codes) for exports and the Harmonized Tariff Item Statistical Code (HTISC) at the 4-digit level (with some 6-digit codes) for imports.
TRIEC is fully compatible with the International Harmonized Commodity Description and Coding System (HS) and as a result can be used to interrogate partner country merchandise trade statistics.
TRIEC broadly classifies merchandise trade into Primary products, Manufactured products and Other goods (mainly Non-monetary gold and Confidential trade). Appendix H lists the TRIEC classification codes and descriptors Primary products
Primary products in most cases are used as inputs into other products (with the exception of some refined fuels and processed foods and beverages).
Primary products are further classified as those that have no additional processing (such as mineral ores) and those that undergo some further processing in Australia (i.e. such as beverages, frozen and preserved food products and refined minerals and fuels). Manufactured products
Manufactured products are further classified as either ‘Simply transformed’ (STM) or ‘Elaborately transformed’ (ETM): • STM consist mainly of basic metal manufactures, chemicals and other intermediate manufactured
goods which will be used as inputs into other goods; and
• ETM are defined as products with unique features which permit their identification as differentiated products on world markets, i.e. ‘finished goods’. ETM comprise the bulk of world trade in manufactures.
Although there are inevitably some items for which the distinction between STM and ETM may seem rather arbitrary, the overall distinction between STM and ETM provides an important basis for analysing the performance of Australia's manufactured trade.
With the update to HS2017 DFAT has been able to better split unprocessed and processed seafood (TRIEC codes 1112 & 1212). However the changes could only be applied back to January 2012. As a result there is a time series break in the data between December 2011 and January 2012.
The changes resulted in a reduction in both Australian exports and imports of unprocessed seafood and an increase in processed seafood.
Between 2011 and 2012 the time series break for Australian exports is valued at around -$75 million for unprocessed seafood (code 1112) and +$75 million for processed seafood (code 1212). For imports the time series break is around -$140 million for unprocessed seafood (code 1112) and +$140 million for processed seafood (code 1212).
More information on the TRIEC classification can be found on the DFAT website.
Ranking of goods and services
See Appendix F for the methodology and issues with ranking combined ABS goods and services data.
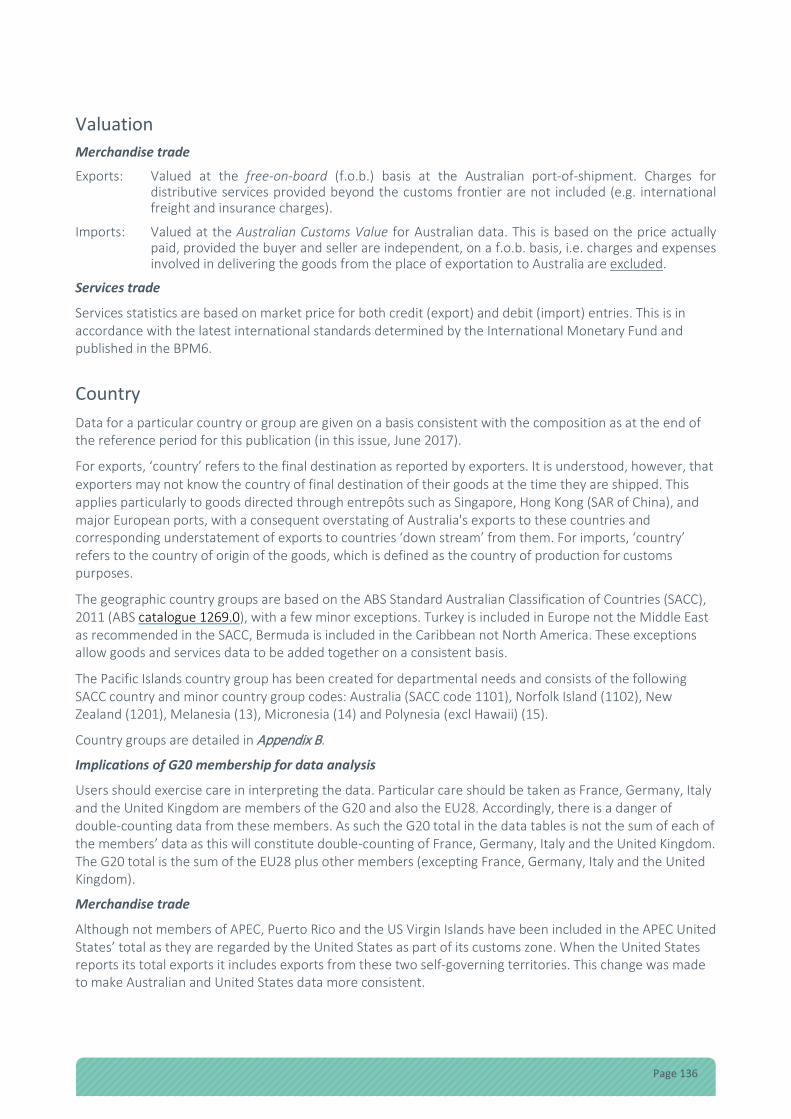
Page 136
Valuation Merchandise trade
Exports: Valued at the free-on-board (f.o.b.) basis at the Australian port-of-shipment. Charges for distributive services provided beyond the customs frontier are not included (e.g. international freight and insurance charges).
Imports: Valued at the Australian Customs Value for Australian data. This is based on the price actually paid, provided the buyer and seller are independent, on a f.o.b. basis, i.e. charges and expenses involved in delivering the goods from the place of exportation to Australia are excluded.
Services trade
Services statistics are based on market price for both credit (export) and debit (import) entries. This is in accordance with the latest international standards determined by the International Monetary Fund and published in the BPM6.
Country Data for a particular country or group are given on a basis consistent with the composition as at the end of the reference period for this publication (in this issue, June 2017).
For exports, ‘country’ refers to the final destination as reported by exporters. It is understood, however, that exporters may not know the country of final destination of their goods at the time they are shipped. This applies particularly to goods directed through entrepôts such as Singapore, Hong Kong (SAR of China), and major European ports, with a consequent overstating of Australia's exports to these countries and corresponding understatement of exports to countries ‘down stream’ from them. For imports, ‘country’ refers to the country of origin of the goods, which is defined as the country of production for customs purposes.
The geographic country groups are based on the ABS Standard Australian Classification of Countries (SACC), 2011 (ABS catalogue 1269.0), with a few minor exceptions. Turkey is included in Europe not the Middle East as recommended in the SACC, Bermuda is included in the Caribbean not North America. These exceptions allow goods and services data to be added together on a consistent basis.
The Pacific Islands country group has been created for departmental needs and consists of the following SACC country and minor country group codes: Australia (SACC code 1101), Norfolk Island (1102), New Zealand (1201), Melanesia (13), Micronesia (14) and Polynesia (excl Hawaii) (15).
Country groups are detailed in Appendix B.
Implications of G20 membership for data analysis
Users should exercise care in interpreting the data. Particular care should be taken as France, Germany, Italy and the United Kingdom are members of the G20 and also the EU28. Accordingly, there is a danger of double-counting data from these members. As such the G20 total in the data tables is not the sum of each of the members’ data as this will constitute double-counting of France, Germany, Italy and the United Kingdom. The G20 total is the sum of the EU28 plus other members (excepting France, Germany, Italy and the United Kingdom).
Merchandise trade
Although not members of APEC, Puerto Rico and the US Virgin Islands have been included in the APEC United States’ total as they are regarded by the United States as part of its customs zone. When the United States reports its total exports it includes exports from these two self-governing territories. This change was made to make Australian and United States data more consistent.

Page 137
Services trade
Data from 2009 to August 2013 refers to the European Union 27. From September 2013 data refers to the European Union 28.
The OECD includes Chile from March 2010; Israel and Slovenia from July 2010 and Estonia from October 2010.
Australian produced exports In line with UN recommendations total exports are defined to include re-exports, which are ‘goods, materials or articles originally imported and then exported in the same condition or after having undergone only minor operations that leave them essentially unchanged’. The remainder of total exports is Australian produced. The distinction between the two categories has most relevance in the analysis of Elaborately Transformed Manufactures (ETM), where re-exports represent a significant proportion of total exports.
In this publication, data for Total exports and Australian produced exports have been included in Section 4 Australia merchandise trade by level of processing.
Forecasts of cane sugar exports For many years, export trade data for Raw cane sugar and Non-industrial diamonds has been excluded from the monthly merchandise trade data set published by the Australian Bureau of Statistics (ABS), and only separately released on a quarterly basis. The diamond data is available up to the most recent quarter, although the Raw cane sugar data is released after a six month lag. In this publication ABS actual Raw cane sugar data was available up to the September quarter 2016.
DFAT statistical products now incorporate the export data for Raw cane sugar and Non-industrial diamonds into its calendar and financial year tables. This provides a more complete trade data set for enhancing trade data analysis.
To overcome the data lag for Raw cane sugar exports, DFAT has estimated data for the December quarter 2016 for these exports using data from the Australian Bureau for Agricultural and Resources Economics and Sciences (ABARES) and partner-country import data from Australia’s major Raw cane sugar export markets.
Tourism Satellite Account A satellite account provides an expansion of Australia’s national accounts for a selected area of interest, in this case tourism. The Tourism Satellite Account (TSA) provides a means by which the economic aspects of tourism (including cross border activity) can be analysed separately from the main national accounts
The concepts used in Australia’s TSA are based on international standards set out in the United Nations World Tourism Organization – The Tourism Satellite Account Recommended Methodological Framework 2008.
The term ‘tourism’ in these international standards is not restricted to leisure activity. It also includes travel for business, education and other reasons. The central statistical entity in these tourism statistics is the ‘visitor’. The standards define a visitor as a traveller taking a trip to a destination outside their usual environment for less than one year for any purpose other than to be employed by the resident country or place visited.
For more information regarding the TSA please refer to the ABS publication: Tourism Satellite Account, Australian National Accounts (ABS catalogue 5249.0).

Page 138
ABS Chain volume measures To enable analysis of the movements of goods and services in ‘real’ terms, estimates of chain volume measures are presented in Table 1 and 3 in this publication.
Estimates of ‘real’ growth are compiled by the ABS, using chain volume measures. Chain volume measures are derived by deflating the original current price series by specifically compiled measures of price change. The reference year for chain volume measures is the year prior to the latest complete financial year incorporated into the publication. The reference year is updated with the completion of estimates for each financial year.
Prior to the reference year, chain volume measures are not additive, in that the component chain volume measures of an aggregate will not add through to the chain volume measure of the total aggregate. For further information on chain volume measures refer to the ABS publication: Information paper, Australian National Accounts, Introduction of Chain Volume and Price Indexes (ABS catalogue 5248.0).
Implicit price deflator (IPD) The IPDs used in this publication are derived by dividing current price series by the corresponding chain volume measure.
Terms of trade The terms of trade shows a country's export prices relative to its import prices. A rise in the index implies an improvement in a country’s terms of trade, enabling it to purchase more imports from the same amount of exports. A fall in the index implies deterioration in a country’s terms of trade, requiring it to export more to purchase the same amount of imports. Movements in the terms of trade are used in assessing the changing purchasing power of exports over imports, analysing real income, and evaluating the level of consumption that can be sustained in the domestic economy.
The terms of trade are measured using the following index:
Implicit price deflator (IPD) for the export (credit) item divided by the IPD for the import (debit) item, multiplied by 100.
The IPDs are derived by dividing current price series by the corresponding chain volume measure for exports and imports.
Trend growth rates Trend growth is derived by log-linear regression using the least squares method. It is a more robust measure than the ‘average’ annual growth rate as it takes account of all observations and, as such, is less likely to be affected by the end points of a given period.
Total trade Total trade is the sum of exports and imports. This is a useful measurement of the overall trading relationship between Australia and its trading partners. Total trade data is useful in ranking Australia’s major trading partners, without a bias towards ranking only the larger export markets, or the larger import sources.

Page 139
Balance of trade The balance of trade is the difference between exports and imports. When exports exceed imports this is referred to as a trade surplus, when imports exceed exports this is referred to as a trade deficit.
This publication was compiled by Julie-Anne Andrew and Olivier Brunet.
If you would like to know more about these statistics or about other trade and economic publications produced by DFAT, please email [email protected].

Page 140
APPENDIX B – COMPOSITION OF REGIONS AND COUNTRY GROUPS USED IN ALL DFAT TRADE STATISTICAL PUBLICATIONS
Africa Central & West Africa; North Africa; Southern & East Africa Algeria; Angola; Benin; Botswana; British Indian Ocean Territory; Burkina Faso; Burundi; Cabo Verde; Cameroon; Central African Republic; Chad; Comoros; Cote D’Ivoire; Dem. Rep. of Congo; Djibouti; Egypt; Equatorial Guinea; Eritrea; Ethiopia; Gabon; Gambia; Ghana; Guinea; Guinea-Bissau; Kenya; Lesotho; Liberia; Libya; Madagascar; Malawi; Mali; Mauritania; Mauritius; Mayotte; Morocco; Mozambique; Namibia; Niger; Nigeria; Reunion; Republic of Congo; Rwanda; Sao Tome & Principe; Senegal; Seychelles; Sierra Leone; Somalia; South Africa; South Sudan; Sudan; St Helena; Swaziland; Tanzania; Togo; Tunisia; Uganda; Western Sahara, Zambia; Zimbabwe.
Antarctica Antarctica; Australian Antarctic Territory; British Antarctic Territory; French Southern & Antarctic Territories; Ross Dependency.
Americas Caribbean; Central America; North America; South America Anguilla; Antigua & Barbuda; Argentina; Aruba; Bahamas; Barbados; Belize; Bermuda; Bolivia; Bonaire, Sint Eustatius & Saba; Brazil; Canada; Cayman Is.; Chile; Colombia; Costa Rica; Cuba; Curacao; Dominica; Dominican Republic; Ecuador; El Salvador; Falkland Is.; French Antilles; French Guiana; Grenada; Guadeloupe; Guatemala; Guyana; Haiti; Honduras; Jamaica; Martinique; Mexico; Montserrat; Nicaragua; Panama; Paraguay; Peru; Puerto Rico; Sint Maarten; St Barthelemy; St Kitts & Nevis; St Lucia; St Martin; St Pierre & Miquelon; St Vincent & Grenadines; Suriname; Trinidad & Tobago; Turks & Caicos Is.; UK Virgin Is.; US Virgin Is.; United States; Uruguay; Venezuela.
APEC Asia Pacific Economic Cooperation Australia; Brunei; Canada; Chile; China; Hong Kong China; Indonesia; Japan; Malaysia; Mexico; New Zealand; Papua New Guinea; Peru; Philippines; Republic of Korea; Russian Federation; Singapore; Chinese Taipei; Thailand; United States (incl Puerto Rico and the US Virgin Is.); Vietnam.
ASEAN Association of South East Asian Nations Brunei; Cambodia; Indonesia; Laos; Malaysia; Myanmar; Philippines; Singapore; Thailand; Vietnam.
Asia Central Asia; Middle East; North Asia; South East Asia; Southern Asia Afghanistan; Armenia; Azerbaijan; Bahrain; Bangladesh; Bhutan; Brunei; Cambodia; China; Democratic People’s Republic of Korea; Georgia; Hong Kong (SAR of China); India; Indonesia; Iran; Iraq; Israel; Japan; Jordan; Kazakhstan; Kuwait; Kyrgyzstan; Laos; Lebanon; Macau (SAR of China); Malaysia; Maldives; Mongolia; Myanmar; Nepal; Oman; Pakistan; Palestinian Territories; Philippines; Qatar; Republic of Korea; Saudi Arabia; Singapore; Sri Lanka; Syria; Taiwan; Tajikistan; Thailand; Timor-Leste; Turkmenistan; United Arab Emirates; Uzbekistan; Vietnam; Yemen.
Cairns Group Argentina; Australia; Bolivia; Brazil; Canada; Chile; Colombia; Costa Rica; Guatemala; Indonesia; Malaysia; New Zealand; Pakistan; Paraguay; Peru; Philippines; South Africa; Thailand; Uruguay.

Page 141
Caribbean Anguilla; Antigua & Barbuda; Aruba; Bahamas; Barbados; Bermuda; Bonaire, Sint Eustatius & Saba; Cayman Is.; Cuba; Curacao; Dominica; Dominican Republic; French Antilles; Grenada; Guadeloupe; Haiti; Jamaica; Martinique; Montserrat; [Netherlands Antilles]; Puerto Rico; Sint Maarten; St Barthelemy; St Kitts & Nevis; St Lucia; St Martin; St Vincent & Grenadines; Trinidad & Tobago; Turks & Caicos Is.; UK Virgin Is.; US Virgin Is.
Central & West Africa Benin; Burkina Faso; Cabo Verde; Cameroon; Central African Republic; Chad; Cote D’Ivoire; Dem. Rep. of Congo; Equatorial Guinea; Gabon; Gambia; Ghana; Guinea; Guinea-Bissau; Liberia; Mali; Mauritania; Niger; Nigeria; Republic of Congo; Sao Tome & Principe; Senegal; Sierra Leone; Togo.
Central America Belize; Costa Rica; El Salvador; Guatemala; Honduras; Mexico; Nicaragua; Panama.
Central Asia Afghanistan; Armenia; Azerbaijan; Georgia; Kazakhstan; Kyrgyzstan; Tajikistan; Turkmenistan; Uzbekistan.
East Asia North Asia; South East Asia.
Eastern Europe Belarus; Czech Republic; Estonia; Hungary; Latvia; Lithuania; Poland; Russian Federation; Slovak Republic; Ukraine.
EFTA European Free Trade Association Iceland; Norway; Switzerland.
Europe Eastern Europe; Northern Europe; South Eastern Europe; Southern Europe; Western Europe Aland Is.; Albania; Andorra; Austria; Belarus; Belgium; Bosnia & Herzegovina; Bulgaria; Croatia; Cyprus; Czech Republic; Denmark; Estonia; Faeroe Is.; Finland; France; FYR Macedonia; Germany; Gibraltar; Greece; Greenland; Holy See; Hungary; Iceland; Ireland; Italy; Kosovo; Latvia; Liechtenstein; Lithuania; Luxembourg; Malta; Moldova; Monaco; Montenegro; Netherlands; Norway; Poland; Portugal; Romania; Russian Federation; San Marino; Serbia; Slovak Republic; Slovenia; Spain; Sweden; Switzerland; Turkey; Ukraine; United Kingdom.
EU 27 European Union 27 Austria; Belgium; Bulgaria; Cyprus; Czech Republic; Denmark; Estonia; Finland; France; Germany; Greece; Hungary; Ireland; Italy; Latvia; Lithuania; Luxembourg; Malta; Netherlands; Poland; Portugal; Romania; Slovak Republic; Slovenia; Spain; Sweden; United Kingdom.
EU 28 European Union 28 Austria; Belgium; Bulgaria; Croatia; Cyprus; Czech Republic; Denmark; Estonia; Finland; France; Germany; Greece; Hungary; Ireland; Italy; Latvia; Lithuania; Luxembourg; Malta; Netherlands; Poland; Portugal; Romania; Slovak Republic; Slovenia; Spain; Sweden; United Kingdom.
Euro area Austria; Belgium; Cyprus; Estonia; Finland; France; Germany; Greece; Ireland; Italy; Latvia; Lithuania; Luxembourg; Malta; Netherlands; Portugal; Slovak Republic; Slovenia; Spain.
Gulf Cooperation Bahrain; Kuwait; Oman; Qatar; Saudi Arabia; United Arab Emirates. Council
G20 Group of twenty Argentina; Australia; Brazil; Canada; China; European Union; France; Germany; India; Indonesia; Italy; Japan; Republic of Korea; Mexico; Russian Federation; Saudi Arabia; South Africa; Turkey; United Kingdom; United States.

Page 142
IORA Indian Ocean Rim Association Australia; Bangladesh; Comoros; India; Indonesia; Iran; Kenya; Madagascar; Malaysia; Mauritius; Mozambique; Oman; Seychelles; Singapore; South Africa; Sri Lanka; Tanzania; Thailand; United Arab Emirates; Yemen.
Latin America Central America; South America.
Middle East Bahrain; Iran; Iraq; Israel; Jordan; Kuwait; Lebanon; Oman; Palestinian Territories; Qatar; Saudi Arabia; Syria; United Arab Emirates; Yemen.
NAFTA North America Free Trade Agreement Canada; Mexico; Puerto Rico; United States; US Virgin Is.
North Africa Algeria; Egypt; [Former Sudan]; Libya; Morocco; South Sudan; Sudan; Tunisia; Western Sahara.
North America Canada; St Pierre & Miquelon; United States.
North Asia China; Democratic People’s Republic of Korea; Hong Kong (SAR of China); Japan; Macau (SAR of China); Mongolia; Republic of Korea; Taiwan.
Northern Europe Aland Is.; Denmark; Faeroe Is.; Finland; Greenland; Iceland; Ireland; Norway; Sweden; United Kingdom.
Oceania & Antarctica Antarctica; Other Oceania; Pacific Islands American Samoa; Antarctica; Australia; Australian Antarctic Territory; British Antarctic Territory; Christmas Is.; Cocos Keeling Is.; Cook Is.; Federated States of Micronesia; Fiji; French Polynesia; French Southern & Antarctic Terr.; Guam; Heard & McDonald Is., Johnston & Sand Is.; Kiribati; Marshall Is.; Midway Is.; Nauru; New Caledonia; New Zealand; Niue; Norfolk Is.; Northern Marianas; Palau; Papua New Guinea; Pitcairn Is.; Ross Dependency; Samoa; Solomon Is.; Tokelau; Tonga; Trust Territory of Pacific Is.; Tuvalu; US Pacific Is.; Vanuatu; Wake Is.; Wallis & Futuna Is.
OECD Organisation for Economic Cooperation and Development Australia; Austria; Belgium; Canada; Chile; Czech Republic; Denmark; Estonia; Finland; France; Germany; Greece; Hungary; Iceland; Ireland; Israel; Italy; Japan; Luxembourg; Mexico; Netherlands; New Zealand; Norway; Poland; Portugal; Republic of Korea; Slovak Republic; Slovenia; Spain; Sweden; Switzerland; Turkey; United Kingdom; United States.
Other Oceania Christmas Island; Cocos Keeling Islands; Heard & McDonald Islands, French Southern Territory; Johnston & Sand Islands; Midway Island; US Pacific Islands; Wake Island.
Pacific Islands1 American Samoa; Australia; Cook Island; Federated States of Micronesia; Fiji; French Polynesia; Guam; Kiribati; Marshall Islands; Nauru; New Caledonia; New Zealand; Niue; Norfolk Island; Northern Marianas; Palau; Papua New Guinea; Pitcairn Island; Samoa; Solomon Islands; Tokelau; Tonga; Tuvalu; Vanuatu; Wallis & Futuna Islands.
Pacific Islands Forum Australia; Cook Islands; Federated States of Micronesia; Fiji; Kiribati; Marshall Is.; Countries Nauru; New Zealand; Niue; Palau; Papua New Guinea; Samoa; Solomon Islands; Tonga;
Tuvalu; Vanuatu.
South America Argentina; Bolivia; Brazil; Chile; Colombia; Ecuador; Falkland Is.; French Guiana; Guyana; Paraguay; Peru; Suriname; Uruguay; Venezuela.
South East Asia Brunei; Cambodia; Indonesia; Laos; Malaysia; Myanmar; Philippines; Singapore; Thailand; Timor-Leste; Vietnam.
1 The Pacific Islands country group has been created for departmental needs and consists of the following SACC country and minor country group codes: Australia (SACC code 1101), Norfolk Island (1102), New Zealand (1201), Melanesia (13), Micronesia (14) and Polynesia (excl Hawaii) (15).

Page 143
South Eastern Europe Albania; Bosnia & Herzegovina; Bulgaria; Croatia; Cyprus; FYR Macedonia; Greece; Kosovo; Moldova; Montenegro; Romania; Serbia; Slovenia; Turkey.
Southern & East Africa Angola; Botswana; British Indian Ocean Territories; Burundi; Comoros; Djibouti; Eritrea; Ethiopia; Kenya; Lesotho; Madagascar; Malawi; Mauritius; Mayotte; Mozambique; Namibia; Reunion; Rwanda; Seychelles; Somalia; South Africa; St Helena; Swaziland; Tanzania; Uganda; Zambia; Zimbabwe.
Southern Asia Bangladesh; Bhutan; India; Maldives; Nepal; Pakistan; Sri Lanka.
Southern Europe Andorra; Gibraltar; Holy See; Italy; Malta; Portugal; San Marino; Spain.
Sub-Saharan Africa Central & West Africa; Southern & East Africa.
Western Europe Austria; Belgium; France; Germany; Liechtenstein; Luxembourg; Monaco; Netherlands; Switzerland.

Page 144
APPENDIX C – ABBREVIATIONS AND SYMBOLS USED IN ALL DFAT TRADE STATISTICAL PUBLICATIONS
.. not meaningful $b $ billion
$m $ million ABARES Australian Bureau of Agricultural & Resource Economics & Sciences ABS Australian Bureau of Statistics
adp automatic data processing agric agricultural AHECC Australian Harmonized Export Commodity Classification
alum aluminium ANZSIC06 Australia and New Zealand Standard Industry Classification 2006 APEC Asia Pacific Economic Cooperation
bev beverage BOP Balance of Payments BPM5 IMF Balance of Payments and International Investment Position Manual 5th Edition
BPM6 IMF Balance of Payments and International Investment Position Manual 6th Edition chem chemical c.i.f. cost, insurance and freight
comp compounds conc concentrates confid confidential
constr construction consump consumption cont. continued
cool cooling Curr Acc Current Account CVM chain volume measure
Dem Democratic DET Department of Education & Training DFAT Department of Foreign Affairs and Trade
DIIS Department of Industry, Innovation & Science DIBP Department of Immigration & Border Protection distrib distributing
EBOP The ABS Extended Balance of Payments services classification elec electric, electrical elem elements
ELICOS English Language Intensive Courses for Overseas Students eng engineering
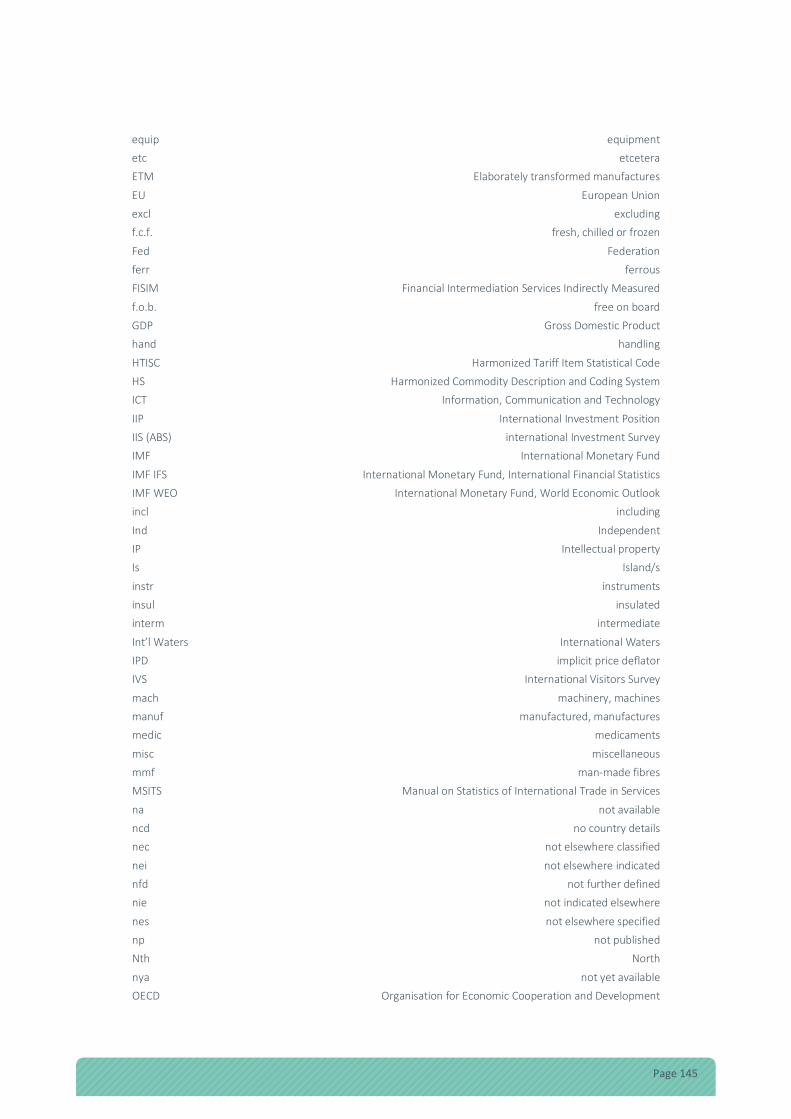
Page 145
equip equipment etc etcetera ETM Elaborately transformed manufactures
EU European Union excl excluding f.c.f. fresh, chilled or frozen
Fed Federation ferr ferrous FISIM Financial Intermediation Services Indirectly Measured
f.o.b. free on board GDP Gross Domestic Product hand handling
HTISC Harmonized Tariff Item Statistical Code HS Harmonized Commodity Description and Coding System ICT Information, Communication and Technology
IIP International Investment Position IIS (ABS) international Investment Survey IMF International Monetary Fund
IMF IFS International Monetary Fund, International Financial Statistics IMF WEO International Monetary Fund, World Economic Outlook incl including
Ind Independent IP Intellectual property Is Island/s
instr instruments insul insulated interm intermediate
Int’l Waters International Waters IPD implicit price deflator IVS International Visitors Survey
mach machinery, machines manuf manufactured, manufactures medic medicaments
misc miscellaneous mmf man-made fibres MSITS Manual on Statistics of International Trade in Services
na not available ncd no country details nec not elsewhere classified
nei not elsewhere indicated nfd not further defined nie not indicated elsewhere
nes not elsewhere specified np not published Nth North
nya not yet available OECD Organisation for Economic Cooperation and Development

Page 146
pharm pharmaceutical photo photographic PPP Purchasing Power Parity
prec precious prep preparations, prepared pres preserved
proc processing prod products Rep Republic
SAR of China Special Administrative Region of China SITC Standard International Trade Classification SITS Survey of International Trade in Services
spec specifically Sth South STM Simply transformed manufactures
struct structures synth synthetic TCI Telecommunications, computer & information
telecom telecommunications TRA Tourism Research Australia TREC Trade Export Classification
TRIEC Trade Import and Export Classification transport transportation TSA Tourism Satellite Account
TWI Trade Weighted Index UN United Nations UNCTAD United Nations Conference on Trade and Development
unmanuf unmanufactured USDA United States Department of Agriculture veg vegetables
WTO World Trade Organization yoy year on year

Page 147
APPENDIX D – CONFIDENTIAL EXPORTS IN THE SITC 988
The system used by the ABS for confidentialising foreign trade statistics is designed to maximise the release of data, without divulging details of any single firm's operations. A complex range of confidentiality provisions are applied to the data. Those of most relevance in this publication are:
A. No details No data for a particular commodity item is separately released. For example, the total value of non-industrial diamonds exports is only included in the confidential item dump code of 988 for all countries and world total.
B. No country details
Total exports of a particular commodity are available, but not for individual countries. For example, the value of liquefied natural gas exports to each country is suppressed, but the world total is available.
C. Selected country details
Exports of a particular commodity to some countries are suppressed, but the value of exports to other countries, and the world total is available.
The following table lists details of confidential commodity items that can be identified separately in the SITCr4 classification: SITC Code
Description
Restriction Type
Period
042 Rice (selected varieties) A,B various 043 Unmilled barley B latest 6 months only 045.2 Unmilled oats B from Jul 1993 048.3 Macaroni, spaghetti and similar products (specifically uncooked pasta) A,B from Oct 2008 057.79 Edible nuts nes (specifically macadamia nuts) B, C from Jan, 2012 061.11 Sugar (raw cane) A available on a
quarterly basis after a 6 month lag
081.13 Lupins (incl feed for animals during a voyage A latest 6 months only 098.91 Pasta cooked or stuffed; couscous (specifically couscous) A from Oct 2008 112.3 Beer made from malt A,B various 273.31 Silica and quartz sands B from Jul 1999 278.3 Salt A from Mar 2008 246.11 Coniferous wood, in chips or particles B from May 2013 246.15 Non-coniferous wood, in chips or particles B from May 2013 284.21 Nickel mattes A from Jul 1988 285.2 Alumina (aluminium oxide) B, C* from Jul 1988 286.1 Uranium ores A# from Aug 2009 287.70 Manganese ores & concentrates A from Oct 2016 287.83 Titanium ores &concentrates (eg rutile) A# quantity data released
on a 6 month basis 287.84 Zirconium ores & concentrates A# various 287.99 Base metal ores & concentrates nes A# from Jul 2000 288.10 Slag, ash and residues ( specifically tantalum glass) A# from Jan 2002

Page 148
SITC Code
Description
Restriction Type
Period
292.94 Vegetable saps and extracts A from Sep 2002 321.21 Bituminous coal, not agglomerated (specifically semi coking coal) C Various to Aug-2012 333 Crude petroleum
(China, India and Japan from July 2013; Malaysia and Korea from November 2013)
C From July 2013 to Oct 2015
335.21 Tar distilled from coal, lignite or peat A from Oct 2011 335.25 Oils and other products (specifically Naphthalene) A from Mar 2003 343.1 Liquefied natural gas B from Aug 1995 421.29 Cotton-seed oil & its fractions A from Jul 2011 511.25 Styrene A from Oct 1999 511.22 Benzene, chemically or commercially pure A from Feb 2011 522.1 Carbon (incl black carbon), nes A from Jan 2006 522.67 Artificial corundum A from Feb 2002 523.64 Sodium triphosphate (sodium tripolyphosphate) A from Mar 2002 523.72 Neutral sodium carbonate (disodium carbonate) A,B from Mar 1992 523.73 Sodium hydrogen carbonate (sodium bicarbonate) A,B from Mar 1992 523.81 Cyanides (specifically Sodium cyanide) A from Sep 2002 524.94 Carbides (specifically Silicon carbide) A from Jul 1999 541.41 Alkaloids of opium A from Jul 1991 541.49 Other vegetable alkaloids (specifically Vegetable alkaloids, salts, ethers,
esters & other derivatives) A from Jul 2004
541.99 Other pharmaceutical goods (specifically Sterile surgical sutures) A from Feb 2004 571.11 Polyethylene A from Nov 1992 572.19 Polystyrene (non-expansible) A,C(Feb-11) from Jan 1988 574.33 Polyethylene terephthalate A from Feb 2003 598.64 Activated carbon B from May 2006 to
Aug-12 634.54 Medium density fibreboard B from Nov 1988 to
Nov-11 667.12 Unworked cultured pearls B from May 1995 667.22 Sorted diamonds, non-industrial A available on a
quarterly basis after a 6 month lag
671.21 Non-alloyed pig iron A from Feb 2009 671.41 Ferro-manganese (containing by weight 2% carbon) A from Aug 1999 671.52 Ferro-silico-manganese A from Aug 1999 683.1 Nickel and nickel alloys, unwrought A from Feb 2003 683.23 Nickel powders and flakes A from Feb 2003 691.51 Sanitary ware of iron or steel (specifically sinks and wash basins) A from Dec 2002 721.21 Mowers for lawn (specifically 4 stroke mowers) B from Dec 2009 to Aug
2012 723.21 Front end shovel loaders A from Jan 2003 741.82 Non-gas instantaneous water heaters A from Feb 1998 764.32 Transmission apparatus incorporating reception apparatus (specifically
base stations for radio) A,B from Jul 2007
771.23 Ballast for discharge lamps or tubes A from Feb 2007 793 Ships boats and floating structures (specifically cruise ships and similar
vessels designed to transport persons and motor boats) A from Feb 2004
851.15 Footwear non-water proof (specifically metal toe cap) A,B from Apr 2009 851.48 Footwear nes B, C from Jan 2007
* Special case. See “Confidentiality” section in Explanatory Notes. # Broad values for these commodities are published in SITC 280 – Confidential
minerals ores.

Page 149
APPENDIX E – ABS TRADE COMMODITIES CLASSIFIED TO TRIEC 3041 – CONFIDENTIAL TRADE
Exports
1. Major confidential items at the Australia total level
TRIEC AHECC DESCRIPTION
Primary products – Processed – Minerals 1222 7501.10.00 Nickel mattes (a)
Manufactures – Simply transformed – Mineral manufactures & metals 2313 7502.10.00 Unwrought nickel, not alloyed (a) 2313 7502.20.00 Unwrought nickel alloys (a)
2. Major confidential items at the country level
TRIEC AHECC DESCRIPTION
Primary products – Unprocessed – Minerals 1121 2602.00.00 Manganese ores & concentrates (China, Korea & South Africa only) 1121 2612.10.01 Uranium ores & concentrates 1121 2818.20.00 Alumina (aluminium oxide) 1121 Various Minerals sands (b)
Primary products – Processed – Minerals 1222 7501.10.00 Nickel mattes (a)
Primary products – Processed – Fuels 1232 2711.11.00 Liquefied natural gas
Manufactures – Simply transformed – Mineral manufactures & metals 2313 7502.10.00 Unwrought nickel, not alloyed (a) 2313 7502.20.00 Unwrought nickel alloys (a)
(a) For more information on confidential Nickel exports refer to the article on "Impact of ABS confidential restrictions on Nickel exports" at http://dfat.gov.au/about-us/publications/Pages/recent-trade-statistical-articles-and-information-papers.aspx. (b) Includes: Rutile ores & concentrates, Beneficiated ilmenite ores & concentrates, Ilmenite (excl Beneficiated ilmenite) ores & concentrates, Leucoxene ores & concentrates, Zirconium ores & concentrates and Tantalum ores & concentrates.

Page 150
Imports
1. Major confidential items at the Australia level (a)
TRIEC HTISC DESCRIPTION
Primary products – Unprocessed – Fuels 1133 2711.21.90.08 Natural gas Manufactures – Elaborately transformed – Engineering products (excl Household equipment)
2434 8802.40.00.07 Aeroplanes and other aircraft (excl helicopters) of an unladen weight exc 15,000 kg
2. Major confidential items at the country level
Please note the following commodities are not allocated to TRIEC 3041 at the country level but are excluded from the country level data entirely. Therefore country import totals for some countries may be under reported. TRIEC HTISC DESCRIPTION
Manufactures – Elaborately transformed – Engineering products (excl Household equipment)
2434 8802.40.00.07 Aeroplanes and other aircraft (excl helicopters) of an unladen weight exc 15,000 kg
(a) For more details refer to the article on "Imports of aircraft and parts" at http://dfat.gov.au/about-us/publications/Pages/recent-trade-statistical-articles-and-information-papers.aspx
A full list of ABS confidential trade items can be found at the ABS website (http://www.abs.gov.au) under publication - International Merchandise Trade: Confidential Commodities List (catalogue 5372.0.55.001).

Page 151
APPENDIX F – GOODS AND SERVICES RANKINGS
Commodity rankings The ranking of Australia’s top exports and imports is usually based on merchandise (goods) trade only. DFAT ranks merchandise trade using the United Nations Standard International Trade Classification Rev4 (SITC). SITC is a hierarchical trade commodity classification with five different levels, with the 5-digit codes aggregating to the 4-digit level and so on to the 1-digit level. SITC does not include services.
When ranking merchandise exports and imports, DFAT uses SITC at the 3-digit level (approximately 260 codes). At this level, all Australia's goods exports are easily identifiable with meaningful descriptions, i.e. Coal, Iron ore, Gold, Crude petroleum, Beef, Wheat, Alumina, Aluminium, Natural gas, Passenger cars etc.
To measure the contribution of services activities to exports and imports, the SITC classification was combined with the ABS Extended Balance of Payments (EBOP) services classification to derive Australia's top 25 exports and imports. The ABS EBOP services classification is based on the United Nation publication Manual on Statistics of International Trade in Services, 2010 (MSITS) and the International Monetary Fund’s (IMF) sixth edition of the Balance of Payments and International Investment Position Manual (BPM6).
Services classified by EBOP were integrated into the SITC 3-digit merchandise rankings at the 1-digit level covering 12 broad services activities with the exception of: . Transport, Travel and Other business services. As these three codes accounted for more than
80 per cent of Australia’s total services exports and imports, so activities at the 2-digit EBOP level were used to provide more detail on the types of services traded in these broad categories; and
. For Personal travel services only, the 3-digit EBOP level was used to separate out Education-related travel services and Other personal travel services – Australia’s two largest services exports activities.
Using this method, Australia’s top 25 exports and imports of goods and services are shown in Tables 4 and 5 in this publication.
In addition to the rankings DFAT has also included two analytical industry series in these tables covering trade by the Education and Tourism industries.
Education includes the following EBOP codes – Education-related-travel services (EBOP 4.2.1), Royalties on education services (EBOP code 8.5.1) and Other education services (EBOP code 11.2.2).
Tourism is based on the ABS Tourism Satellite Account (TSA): . The TSA measures the consumption of goods and services by the tourism industry, with an aim to
measure the direct contribution to the Australian economy of the tourism industry. The TSA defines tourism consumption to include all travellers who stay in the host economy for less than one year, regardless of their purpose for travel (such as business, education, health and recreational purposes). As such the TSA definition of exports and imports of tourism covers more than just recreational travellers.
. The TSA definition includes all or part of the following services activities from the EBOP trade in services classification: Passenger air and Sea transportation services and Related agency fees & commissions; Travel services (including Business travel, Education-related travel and Other personal travel) as well as imputed services which are not measured in the EBOP classification, such as goods provided to visitors in private households; and

Page 152
. The TSA data is only available on a financial year basis. For more information on the TSA please refer to the ABS publication Tourism Satellite Accounts (catalogue 5249.0).
Users should not include these two analytical series in the goods and services rankings as they would double count particular EBOP services items. For example to include Tourism into the rankings without adjusting other EBOP items would double count all or part of Business, Education, Other personal travel services and Passenger transport services.
Country rankings DFAT estimates total trade in goods and services on a regional basis by adding goods (merchandise) data on a recorded trade basis with services data on a BOP basis. DFAT has been producing these estimates since the ABS ceased publishing its regional BOP publication in 1999-2000 (this publication contained regional goods and services both on a consistent BOP basis).
As DFAT cannot convert merchandise trade data to a BOP basis to be consistent with ABS published services data, DFAT’s current methodology to produce regional goods and services estimates has a number of issues that users should be aware of: . Net exports of goods under merchanting will not be included in DFAT’s regional goods and services
statistics as it is not included in ABS merchandise trade statistics. This export was valued at $416 million in 2016-17;
. Imports of Goods procured in port by carriers will not be included in DFAT’s regional goods and services statistics as it is not included in ABS merchandise trade statistics. This import was valued at $1.1 billion in 2016-17; and
. Exports and imports of Goods for processing includes the gross value of the good as reported in ABS merchandise trade statistics, but also double counts the processing fee recorded in ABS services trade statistics under Manufactured services on physical inputs owned by others. The processing fee was valued at $21 million for exports and $0 for imports in 2016-17.
DFAT has analysed the impact of these issues on its regional estimates (for 2008-09) and has found that they are relatively insignificant. For exports only one country (the United States) was out by more than 1 per cent. For imports only six countries are impacted by more than 1 per cent, with the exception of imports from Hong Kong (which was out by plus 15 per cent, mainly due to imports of Goods procured in port).

Page 153
APPENDIX G – DFAT ADJUSTMENTS TO ABS OFFICIAL TRADE DATA
Introduction The Department of Foreign Affairs and Trade (DFAT) makes a number of adjustments to published Australian Bureau of Statistics (ABS) official monthly merchandise trade data to produce the most accurate dataset possible on Australia’s merchandise trade data on a calendar year and financial year basis. These adjustments include using ABS trade data that is released after a time lag, DFAT estimates and the correction of a number of small errors in the ABS monthly trade dataset.
1. Merchandise trade data released after a time lag The ABS has been able to negotiate special reporting arrangements with a number of providers of trade data by releasing confidential data with a time lag. These export commodities include: • Barley (AHECC2 1003.00.10 & 20) and Lupins (AHECC 1214.90.21) — all country details released on a
monthly basis six months after the reference period. This data is automatically included in the regular monthly updates of ABS merchandise trade data after the time lag.
• Raw cane sugar (AHECC 1701.11.40) — commodity and country details (values and quantity) on a quarterly basis are released six months after the reference period. This data is not automatically included in monthly updates of ABS merchandise trade data but is available in a spreadsheet format.
• Non-industrial diamonds (AHECC 7102.31.00) — commodity and country details (values only) released on a quarterly basis only. This data is not automatically included in monthly updates of ABS merchandise trade data but is available in a spreadsheet format.
The ABS monthly export dataset does not include the Raw cane sugar and the Non-industrial diamonds (though it does include the Barley and Lupins six months after the reference period). In DFAT’s annual trade publications and time series datasets exports of Raw cane sugar and the Non-industrial diamonds has been included.
2. Confidentiality in ABS monthly trade data and its impact on accurate partner country export and import data The ABS has been required to apply country level restrictions to a number of commodities to maintain confidentiality within its monthly export and import data. This has resulted in some commodities being excluded from partner country totals and State/Territory totals.
For exports, from June 2013 a number of export commodities3 were excluded, with the major ones Cane sugar, Nickel Mattes, Nickel alloys unworked and Non-industrial diamonds. From this period onwards, a number of Country/State totals for exports will be under-reported in ABS monthly trade statistics. The ABS
2 Australian Harmonised Export Classification Code (AHECC). 3 AHECC at the 8-digit level that have the confidentiality restrictions 'No commodity details' or 'No value details'. See the ABS publication International
Merchandise Trade: Confidential Commodities List (catalogue 5372.055.001).

Page 154
advised that data was confidentialised in this way to ensure that trade to individual countries/states could not be identified, even if the transactions were unusually large4.
The confidential export commodity codes excluded from partner country totals may not remain consistent over time. The ABS reviews confidentiality on a monthly basis and may add or remove some exports codes from this list. For example the ABS added a new commodity, Fresh or dried macadamia nuts to the list from October 2013.
In aggregate $6.2 billion has been excluded from ABS partner country export data in 2016-17 (refer to Table A). List A shows the full list of the export commodities affected at this stage and the time period the restriction covers.
Table A: Value of ‘No country details’ included in export totals
No country details Total goods exports Share of total
exports A$m A$m %
Calendar year 13 (from Jun-13) 3,694 261,959 1.4
2014 5,808 265,923 2.2 2015 5,964 249,625 2.4 2016 6,044 258,469 2.4
Financial year 2012-13 (from Jun-13) 596 246,982 0.2
2013-14 5,667 272,921 2.1 2014-15 6,176 254,552 2.4 2015-16 5,802 243,424 2.4 2016-17 6,155 291,063 2.1
Based on ABS trade data (July 2017) on DFAT STARS database.
In terms of imports, from the month of September 2008 onwards, a number of import commodities5 have been excluded from partner country totals and State/Territory totals for the same reasons as the export data.
The major commodities excluded include selected aircraft, refined petroleum and natural gas imports. From this period onwards, a number of Country/State totals for imports will be under-reported in ABS monthly trade statistics. In aggregate $7.4 billion has been excluded from ABS partner country import data in 2016-17 (refer to Table B).
As with exports, the confidential import commodity codes excluded from partner country totals may not remain consistent over time. List B shows the full list of the import commodities affected at this stage and the time period the restriction covers.
Given the importance of accurate trade data, DFAT has been working with the ABS to find a solution that will allow accurate partner country export/import totals on a financial and calendar year basis to be published while maintaining business confidentiality. As a result, the ABS was able to provide calendar and financial year export and import totals to DFAT for selected trading partners for the periods affected in the publication International Trade: Supplementary Information (catalogue number 5368.0.55.003 & 004).
4 International Trade in goods and services Australia, June 2013 issue, page 4 (catalogue 5368.0). 5 Harmonized Tariff Item Statistical Code (HTISC) at the 10-digit level that have the confidentiality restrictions 'No commodity details' or 'No value
details'.

Page 155
Appendix A (http://www.dfat.gov.au/trade/resources/trade-statistics/Pages/trade-time-series-data.aspx) shows the full list of the actual partner country export and import data that has been obtained from the ABS on a calendar and financial year basis. This data is included in DFAT’s annual trade publications and time series datasets.
Table B: Value of ‘No country details’ included in import totals
No country details Total goods imports Share of total
imports A$m A$m %
Calendar year 2008 (from Sept-08) 2,025 225,946 0.9
2009 5,491 200,604 2.7 2010 6,099 210,494 2.9 2011 6,728 226,903 3.0 2012 5,155 241,863 2.1 2013 4,541 241,037 1.9 2014 6,784 252,789 2.7 2015 6,908 267,092 2.6 2016 2,440 254,368 1.0
Financial year 2008-09 (from Sep-08) 4,761 219,487 2.2
2009-10 5,712 204,027 2.8 2010-11 5,897 213,809 2.8 2011-12 6,674 239,736 2.8 2012-13 4,295 236,509 1.8 2013-14 5,797 252,345 2.3 2014-15 6,948 256,982 2.7 2015-16 4,686 263,284 1.8 2016-17 7,448 264,042 2.8
Based on ABS trade data (July 2017) on DFAT STARS database.
Please note that this issue is going to make it difficult to determine actual trends in Australia’s total exports and imports by partner country on an ongoing basis. All users are advised to use ABS partner country merchandise export and import data with caution for the countries not covered by the unpublished ABS data.
For State/Territory exports and imports, the ABS has published actual totals on a balance of payments basis in the quarterly publication Balance of Payments and International Investment Position (catalogue number 5302.0).
3. Corrections to ABS merchandise trade data DFAT has identified a number of small corrections to ABS merchandise trade data that the ABS did not apply to their monthly trade dataset as the value of the transaction fell below the ABS normal threshold level for amending trade records6.
The following is a list of corrections that have been applied to ABS trade data by DFAT in its annual and financial trade statistical publications and time series datasets:
6 Refer to the ABS article - International Trade Review: Data Quality and Client Queries for further information.

Page 156
• Exports of Arms & ammunition (AHECC 9306) from the ACT to Germany in October 2009 valued at $2,380,000 were a re-export and should not be included as an export produced from the ACT.
• Imports of $93,000 of Meat of bovine animals, frozen (HTISC 0202) from the United States in May 2005 were incorrect in ABS import statistics. The Department of Immigration & Border Protection confirmed the imports were pork (HTISC 0203) not beef.
• Imports of Iron ore (HTISC 2601) from New Caledonia were incorrectly being coded in ABS import statistics. The imports were actually Nickel ores (HTISC 2606). All time periods have been corrected.
• Imports of Arms & ammunition (HTISC 9306) from Timor-Leste were incorrectly coded. Imports have been coded to miscellaneous manufactures. All time periods have been corrected.
4. DFAT estimates for missing data items. In some cases DFAT has estimated trade that is not included in published ABS data. • Raw cane sugar exports – To overcome the time lag for Raw cane sugar exports, DFAT has estimated
data for the March and June quarters 2017 (for the financial year 2016-17) by using information from the Australian Bureau for Agricultural and Resources Economics and Sciences (ABARES) and partner-country import data from Australia’s major Raw cane sugar export markets.
• France imports – DFAT has estimated actual imports from France for the period September 2008 until June 2017 (excluding the periods July 2013 to June 2014, January 2015 to June 2015 and January 2017 to June 2017 which is based on actual ABS data). The major import excluded from partner country import data from September 2008 onwards is aircraft.
• United States imports – DFAT has estimated actual imports from the United States for the period January 2016 to June 2016 (all other periods are based on actual ABS data). The major import excluded from partner country import data from September 2008 onwards is aircraft
• LNG floating processing platforms imported from the Republic of Korea – DFAT has estimated the value of the import of the INPEX’s Ichthys Explorer LNG central processing platform in May 2017. This adjustment has been allocated as imports from Korea to Western Australia and allocated to the SITC code 793 Ships, boats & floating structures and TRIEC code 2434 Other transport equipment & parts.
These estimates are included in DFAT’s annual and financial trade statistical publications and time series datasets.
For further information DFAT publishes a number of articles that provide supplementary information on Australian trade data not included in ABS official trade statistics including: • Australia's imports of aircraft & parts;
• Changes to ABS merchandise export statistics and its impact on partner country aggregates;
• Impact of ABS confidential restrictions on exports of Nickel; and
• Confidentiality in Australian merchandise export statistics.
These articles can be found on the DFAT website at http://dfat.gov.au/about-us/publications/Pages/recent-trade-statistical-articles-and-information-papers.aspxl.
For further information on the impact of confidentiality in ABS merchandise trade statistics please refer to the ABS publication – catalogue. 5372.0.55.001 - International Merchandise Trade: Confidential Commodities List.

Page 157
List A
AHECC codes not included in ABS partner country export totals
AHECC SITC-REV4
Date of Effect
Date of Cessation
Restriction applied Commodity Description Count
08026100 057.79 Oct-13 Feb-15 No Commodity Details Fresh or dried macadamia nuts, in shell 1
10049010 045.20 Jun-13 No Commodity Details Oats, in bulk (excl. seed and oats in bags) 2
10063025 042.31 Jun-13 No Commodity Details
Rice, whole long grain, semi-milled or wholly milled, whether or not polished or glazed 3
10064000 042.32 Jun-13 No Commodity Details Broken rice 4
12149021 081.13 Jun-13 No Commodity Details (latest 6 months only)
Lupins, whether or not in the form of pellets (incl. feed for animals during a voyage) 5
13021910 292.94 Jun-13 No Commodity Details
Saps and extracts of pyrethrum or of the roots of plants containing rotenone 6
15041000 411.11 Jul-16 No Commodity Details
Fish-liver oils and their fractions, whether or not refined, but not chemically modified 7
15122100 421.21 Jun-13 Feb-14 No Commodity Details Crude cotton-seed oil, not chemically modified 8
15122900 421.29 Jun-13 No Commodity Details Refined cotton-seed oil and its fractions, not chemically modified 9
17011400 061.11 Jun-13
No Commodity Details (Commodity details available quarterly with a 6 month lag)
Raw cane sugar (excl. that specified in Subheading Note 2 to Chapter 17), in solid form, not containing added flavouring or colouring matter 10
19021100 048.30 Jun-13 Dec-14 No Commodity Details
Uncooked pasta (incl. spaghetti, macaroni, noodles, lasagne, gnocchi, ravioli and canelloni), containing eggs, not stuffed with meat or other substances or otherwise prepared 11
19021900 048.30 Jun-13 No Commodity Details
Uncooked pasta (incl. spaghetti, macaroni, noodles, lasagne, gnocchi, ravioli and canelloni), not containing eggs, not stuffed with meat or other substances or otherwise prepared 12
19024000 098.91 Jun-13 No Commodity Details Couscous, whether or not prepared 13 22030020 112.30 Jun-13 Apr-15 No Commodity Details Canned beer made from malt 14
22030090 112.30 Jun-13 Aug-16 No Commodity Details Beer made from malt (excl. bottled and canned) 15
23064100 081.36 Sep-16 No Commodity Details
Oil-cake and other solid residues of low erucic acid rape or colza seeds, resulting from the extraction of fats or oils, whether or not ground or in the form of pellets 16
25010094 278.30 Jun-13 No Commodity Details Salt (excl. table salt) and pure sodium chloride (incl. denatured salt), 17
25051000 273.31 Jun-13 Dec-14 No Commodity Details Silica sands and quartz sands, whether or not coloured 18
25191000 278.24 Jan-14 No Commodity Details Natural magnesium carbonate (magnesite) 19

Page 158
AHECC codes not included in ABS partner country export totals
AHECC SITC-REV4
Date of Effect
Date of Cessation
Restriction applied Commodity Description Count
25199000 278.25 Jun-13 No Commodity Details
Fused magnesia; dead-burned (sintered) magnesia, whether or not containing small quantities of other oxides added before sintering; and other magnesium oxide, whether or not pure 20
27040030 325.00 Jun-15 No Commodity Details
Retort carbon and char (excl. articles of retort carbon of a kind used for electrical purposes) 21
27040093 325.00 Jun-15 No Commodity Details Coke and semi-coke of coal, of lignite or of peat 22
27060000 335.21 Jun-13 Jul-16 No Commodity Details
Tar distilled from coal, from lignite or from peat and other mineral tars, whether or not dehydrated or partially distilled (incl. reconstituted tars) 23
27071000 335.22 Feb-15 No Commodity Details
Benzol (benzene) from the distillation of high temperature coal tar (excl. benzene with a purity of 95% or more) 24
27074000 335.25 Jun-13 May-16 No Commodity Details Naphthalene from the distillation of high temperature coal tar 25
28030000 522.10 Jun-13 Feb-15 No Commodity Details Carbon (carbon blacks and other forms of carbon) 26
28181000 522.67 Jun-13 Sep-16 No Commodity Details Artificial corundum 27
28353100 523.64 Jun-13 Feb-15 No Commodity Details Sodium triphosphate (sodium tripolyphosphate) 28
28362000 523.72 Jun-13 Mar-15 No Commodity Details Disodium carbonate 29
28363000 523.73 Jun-13 Mar-15 No Commodity Details Sodium hydrogencarbonate (sodium bicarbonate) 30
28371101 523.81 Jun-13 No Commodity Details Sodium cyanide (CAS 143-33-9) 31
29022000 511.22 Jun-13 Jul-16 No Commodity Details Benzene, chemically or commercially pure 32
29391101 541.41 Jun-13 No Commodity Details
Concentrates of poppy straw, containing by weight 50% or more of alkaloids 33
29391110 541.41 Jun-13 No Commodity Details Codeine and its salts, an alkaloid and/or derivative of opium 34
29391112 541.41 Jun-13 No Commodity Details Thebaine and its salts, an alkaloid and/or derivative of opium 35
29391129 541.41 Jun-13 Dec-14 No Commodity Details
Other derivatives & alkaloids of opium, including salts, as listed in 2939.11 36
29397900 541.49 Jan-17 No Commodity Details
Alkaloids, of vegetal origin, natural or reproduced by synthesis and their salts, ethers, esters and other derivatives (excluding those of HS 29391 to 293971) 37

Page 159
AHECC codes not included in ABS partner country export totals
AHECC SITC-REV4
Date of Effect
Date of Cessation
Restriction applied Commodity Description Count
29399900 541.49 Jun-13 Dec-16 No Commodity Details
Vegetable alkaloids, salts, ethers, esters & other derivs (excl. opium alkaloids, cinchona & rye ergot & deriv & salts, caffeine & ephedrines & salts, theophylline & aminophylline (theophylline-ethylenediamine) & derivatives & salts) 38
38021000 598.64 Jun-13 May-15 No Commodity Details
Activated carbon (excl. those having the character of medicaments or put up in retail packs as deodorisers) 39
39011000 571.11 Jun-13 No Commodity Details Polyethylene having a specific gravity of less than 0.94, in primary forms 40
39012000 571.12 Jun-13 No Commodity Details
Polyethylene, in primary forms, having a specific gravity at 20 degrees Celsius of 0.94 or more, calculated on an additive-free polymer basis (high density polyethylene (HDPE)) 41
39076000 574.33 Jun-13 Jan-15 No Commodity Details Poly(ethylene terephthalate), in primary forms 42
44012120 246.11 Mar-16 May-17 No Commodity Details Coniferous wood, in chips or particles 43
71012101 667.12 Jan-15 No Commodity Details
Unworked cultured pearls, not strung, mounted or set (incl. temporarily strung for convenience of transport) 44
71023100 667.22 Jun-13
No Commodity Details (Country and Value
details available quarterly)
Non-industrial diamonds, unworked or simply sawn, cleaved or bruted, not mounted or set 45
72021100 671.41 Jun-13 No Commodity Details
Ferro-manganese containing by weight more than 2% of carbon in primary forms, in granules or powders or in forms obtained by continuous casting 46
72023000 671.52 Jun-13 No Commodity Details
Ferro-silico-manganese in primary forms, in granules or powders or in forms obtained by continuous casting 47
72071200 672.62 Jun-13 Feb-15 No Commodity Details
Semi-finished products of iron or non-alloy steel of rectangular (excl. square) cross-section nes, containing by weight less than 0.25% of carbon 48
72085100 673.24 Jun-13 Jul-16 No Commodity Details
Flat-rolled products of iron or non-alloy steel, of a width of 600 mm or more, not in coils, not further worked than hot-rolled; of a thickness exceeding 10 mm 49
72091800 673.41 Jun-13 Jul-16 No Commodity Details
Coils of iron or non-alloy steel, not further worked than cold-rolled (cold-reduced), of a width of 600 mm or more, of a thickness of less than 0.5 mm 50

Page 160
AHECC codes not included in ABS partner country export totals
AHECC SITC-REV4
Date of Effect
Date of Cessation
Restriction applied Commodity Description Count
72104900 674.13 Jun-13 Jul-16 No Commodity Details
Flat-rolled products of iron or non-alloy steel, with a width of 600 mm or more (excl. corrugated), plated or coated with zinc (excl. electrolytically) 51
73042992 679.13 Jun-15 Mar-16 No Commodity Details
Casing and tubing, seamless, of iron or steel (excl. cast iron and stainless steel), of a kind used in drilling for oil or gas (excl. drill pipe) 52
73241000 697.51 Jun-13 No Commodity Details Sinks and wash basins, of stainless steel 53
75011000 284.21 Jun-13 No Commodity Details Nickel mattes 54 75021000 683.11 Jun-13 No Commodity Details Unwrought nickel, not alloyed 55 75022000 683.12 Jun-13 No Commodity Details Unwrought nickel alloys 56 75040000 683.23 Jun-13 No Commodity Details Nickel powders and flakes 57
84191900 741.82 Feb-16 No Commodity Details
Instantaneous (excl. gas water heaters) or storage water heaters, non-electric (eg. solar water heaters) 58
84295100 723.21 Jun-13 Mar-15 No Commodity Details Self-propelled mechanical front-end shovel loaders 59
85041000 771.23 Jun-13 May-16 No Commodity Details Ballasts for discharge lamps or tubes 60
85176120 764.12 Jun-13 Oct-15 No Commodity Details
Base stations incorporating reception apparatus, for radio-telephony or radio-telegraphy 61
85176260 764.12 Jun-13 Mar-14 No Commodity Details
Transmission apparatus incorporating reception apparatus, for radio-telephony or radio-telegraphy (excl. base stations) 62
89011000 793.28 Jun-13 No Commodity Details
Cruise ships, excursion boats and similar vessels principally designed for the transport of persons; ferry-boats of all kinds 63
89039220 793.19 Jun-13 Mar-15 No Commodity Details
Motorboats (excl. outboard motorboats) for pleasure or sports, non-cargo (under own power) 64
89039940 793.19 May-15 May-15 No Commodity Details
Non-cargo carrying yachts and other vessels for pleasure or sport under own power (excl. inflatables, sailboats, and motor boats) 65
89069000 793.29 Jun-13 No Commodity Details Vessels (incl. lifeboats but excl. warships and rowing boats) 66
89061000 793.29 Apr-15 No Commodity Details Warships 67
90248000 874.53 Jan-17 Jan-17 No Commodity Details
Machines and appliances for testing the hardness, strength, compressibility, elasticity or other mechanical properties of materials (eg wood, textiles, paper or plastics but excl. metals) 68

Page 161
List B
HTISC codes not included in ABS partner country import totals
HTISC SITC-REV4
Date of Effect
Date of Cessation
Restriction applied Commodity Description Count
0802510022 05778 Jul-12 Nov-12 No Commodity Details Fresh or dried pistachios, in shell 1 0802510022 05778 Oct-13 Jan-14 No Commodity Details Fresh or dried pistachios, in shell 2
0802620025 05779 Jul-12 Feb-15 No Commodity Details Shelled, fresh or dried macadamia nuts, whether or not peeled 3
2106909043 098.99 Aug-17 No Commodity Details
Preparations for making non-alcoholic beverages (excl. those previously identified in Chapter 21), not elsewhere specified or included 4
2106909065 098.99 Aug-17 No Commodity Details
Food preparations (excl. those previously identified in Chapter 21), not elsewhere specified or included 5
2101110048 07.131 Feb-13 No Commodity Details Extracts, essences and concentrates of coffee, in packs exceeding 30 kg 6
2106909043 098.99 May-17 May-17 No Commodity Details
Preparations for making non-alcoholic beverages (excl. those previously identified in Chapter 21), not elsewhere specified or included 7
2106909065 098.99 May-17 May-17 No Commodity Details
Food preparations (excl. those previously identified in Chapter 21), not elsewhere specified or included 8
2401200028 12.120 Jul-13 May-15 No Commodity Details
Unmanufactured, flue cured virginia type tobacco, partly or wholly stemmed/stripped 9
2707400014 335.25 Dec-11 May-15 No Commodity Details
Naphthalene from the distillation of high temperature coal tar (excl. naphthalene with a crystallising point of 79.4 degrees C or more) 10
2708100020 335.31 Sep-08 Feb-15 No Value Details Pitch 11
2708100020 335.31 Mar-15 Sep-16 No Commodity Details Pitch obtained from coal tar or from other mineral tars 12
2710195374 334.60 May-14 Feb-17 No Commodity Details
Fuel oil having the characteristics as defined in Additional Note 1 to this Chapter (excl. heavy fuel oil for use as ships' bunkers, light oils and waste oils) 13
2711219008 343.20 Dec-13 No Value Details
Natural gas in gaseous state (excl. CNG as defined in Additional Note 5 to Chapter 27) 14
2808000027 522.33 Jan-11 Feb-13 No Commodity Details Nitric acid; sulphonitric acids 15
2815200017 522.64 Sep-08 Nov-10 No Commodity Details Potassium hydroxide (caustic potash) 16
2826120023 523.10 Sep-08 Feb-15 No Value Details Aluminium fluoride 17 2826120023 523.10 Mar-15 Sep-16 No Commodity Details Aluminium fluoride 18 2832300027 523.44 Mar-11 Oct-15 No Commodity Details Thiosulphates 19
2824900031 522.57 Jan-12 Oct-15 No Commodity Details
Red lead, orange lead and lead oxides (excl. lead monoxide (litharge, massicot)) 20
2833250004 523.49 Apr-13 Apr-14 No Commodity Details Copper sulphates 21
2840190015 523.84 Jan-17 No Value Details Disodium tetraborate (excl. anhydrous disodium tetraborate) 22

Page 162
HTISC codes not included in ABS partner country import totals
HTISC SITC-REV4
Date of Effect
Date of Cessation
Restriction applied Commodity Description Count
2847000014 524.91 Sep-08 Feb-13 No Commodity Details Hydrogen peroxide, solidified or not solidified with urea 23
2905110012 512.11 Jul-17 No Value Details Saturated methanol (methyl alcohol) 24
3304990023 553.20 May-17 May-17 No Commodity Details
Beauty or make-up preparations, preparations for the care of the skin and sunscreen or suntan preparations (excl. medicaments; lip and eye make-up preparations; manicure or pedicure preparations; and powders) 25
3402110044 554.21 Aug-17
Anionic organic surface-active alkylbenzene sulphonic acids and their salts, whether or not put up for retail sale (excl. soap; and those in liquid form in packs not exceeding 10 L or in other forms in packs not exceeding 7 kg) 26
3402130051 554.21 Nov-09 Dec-11 No Commodity Details
Non-ionic primary alcohol ethoxylates, whether or not put up for retail sale (excl in liquid form in packs not exc 10 L or in other forms in packs not exc 7kg) 27
3808930014 591.30 Sep-08 Dec-09 No Commodity Details
Herbicides, anti-sprouting products and plant-growth regulators, wholly of, or with a basis of 2,4-dichlorophenoxyacetic acid, its salts or esters 28
3808930041 59130 Feb-10 Mar-16 No Commodity Details
Herbicides, anti-sprouting product & plant-growth regulator wholly of, or with a basis of 2,4-dichlorophenoxyacetic acid, its salts or esters 29
3823120002 512.18 Jan-15 Jun-15 No Commodity Details
Oleic acid (excl. oleic acid of a purity of 85% or more, calculated on the weight of the dry product) 30
3901400014 554.21 Feb-17 No Commodity Details
Ethylene-alpha-olefin copolymers in primary forms, having a specific gravity of less than 0.94 31
3901900006 571.90 Sep-08 No Commodity Details
Polymers of ethylene, in primary forms (excl polyethylene and ethylene-vinyl acetate copolymers) 32
3902300009 575.13 Nov-14 Apr-15 No Commodity Details Propylene copolymers, in compound or adhesive forms 33
3902300009 575.13 Aug-16 No Commodity Details Propylene copolymers, in compound or adhesive forms 34
3904210019 573.12 Sep-08 Oct-12 No Commodity Details
Non-plasticised polyvinyl chloride, mixed with other substances, in primary forms 35
3907400017 574.31 Nov-12 Nov-14 No Commodity Details Compounded polycarbonates, in primary forms 36
3907910032 574.34 Sep-08 Nov-10 No Commodity Details Vinyl ester resin 37 3920200001 582.22 Nov-14 Jun-15 No Commodity Details Biaxially oriented, metallised film, 38

Page 163
HTISC codes not included in ABS partner country import totals
HTISC SITC-REV4
Date of Effect
Date of Cessation
Restriction applied Commodity Description Count
of polymers of propylene, not exceeding 0.08 mm in thickness, non-cellular and not reinforced, laminated, supported or similarly combined with other materials (excl. goods of HS 3918 and HS 3919)
4008211034 621.33 Sep-08 May-15 No Commodity Details
Natural rubber sheets produced by adding vulcanising agents directly to fresh field latex before coagulation, containing not less than 90% natural rubber hydrocarbons 39
4801006004 641.10 Aug-17 No Commodity Details
Newsprint (refer to Note 4 of this Chapter) in rolls or sheets of a size stated in Note 8, of which more than 10% but less than 65% by weight of the total fibre content consists of fibres obtained by a mechanical process (excluding 48010040) 40
4810191070 641.32 Mar-09 Jun-10 No Commodity Details
Paper & p/board cast coated with Kaolin or oth inorganic subst, for writing or graphic use, <= 10% of mechanical or chemi-mech fibre, in strips > 15cm wide or rect sheets with 1 side > 36cm & 1 > 15cm, weighing > 150 g/m2 (excl. HS 481014) 41
4816200058 642.42 Sep-08 Dec-11 No Commodity Details Self-copy paper in rolls (excl those of 4809) 42
4816200060 642.42 Jan-12 Jul-12 No Commodity Details
Self-copy paper, in rolls of a width not exceeding 36 cm, rectangular (incl. square) sheets of which no side exceeds 36 cm in the unfolded state or cut into shapes other than rectangles, whether or not put up in boxes 43
5402110005 651.62 Jan-09 Nov-10 No Commodity Details
High tenacity yarn (excl sewing thread, but incl. synthetic monofilament of less than 67 decitex) of aramids, not put up for retail sale 44
5402320008 651.51 Apr-10 Dec-12 No Commodity Details
Textured yarn (excl sewing thread but incl. synthetic monofilament of less than 67 decitex) of nylon or other polyamides, measuring per single yarn more than 50 tex but not exc 200 tex, not put up for retail sale 45
6815100003 663.36 Jan-09 Mar-10 No Commodity Details
Non-electrical fibres (eg continuous filament) of graphite, or other carbon 46

Page 164
HTISC codes not included in ABS partner country import totals
HTISC SITC-REV4
Date of Effect
Date of Cessation
Restriction applied Commodity Description Count
7019190050 651.95 Sep-08 Dec-11 No Commodity Details Other glass fibres of yarn, excluding slivers 47
7019310022 664.95 Jan-15 Jun-16 No Commodity Details Glass fibre mats 48
7019391054 664.95 Jan-09 Nov-10 No Commodity Details
Webs, mattresses, boards and similar nonwoven products of glass wool 49
7019400052 654.60 Sep-08 Dec-08 No Commodity Details Woven fabrics of rovings 50
7213910044 723.33 Sep-12 No Commodity Details
Bars & rods of iron/non-alloy steel, of circular cross section <14mm diameter, hot-rolled, in irregularly wound coils (excl those of free-cutting steel & those with indentations, ribs, grooves etc produced during rolling) 51
7207200009 67270 Sep-11 Oct-14 No Commodity Details
Semi-finished products of iron or non-alloy steel containing by weight 0.25% or more of carbon 52
7208100031 673.21 Sep-08 Aug-13 No Commodity Details
Flat-rolled products of iron or non-alloy steel, in coils, not further worked than hot-rolled, with patterns in relief of a width of 600mm or more 53
7208100031 673.21 Nov-14 Aug-13 No Commodity Details
Flat-rolled products of iron or non-alloy steel, in coils, not further worked than hot-rolled, with patterns in relief of a width of 600mm or more 54
7208260033 673.21 Aug-09 Jul-11 No Commodity Details
Coils of iron or non-alloy steel, not further worked than hot-rolled, pickled of a width of 600mm or more, of a thickness of 3mm or more but less than 4.75mm 55
7208270034 673.21 Sep-13 Oct-14 No Commodity Details
Coils of iron or non-alloy steel, not further worked than hot-rolled, pickled of a width of 600 mm or more, of a thickness of less than 3 mm 56
7208360035 673.21 Sep-08 Aug-13 No Commodity Details
Products of iron or non-alloy steel, in coils, not further worked than hot-rolled, of a width of 600mm or more, of a thickness exceeding 10mm 57
7208370036 673.21 Sep-08 Jul-09 No Commodity Details
Products of iron or non-alloy steel, other in coils, not further worked than hot-rolled, of a width of 600mm or more, of a thickness of 4.75mm or more but not exceeding 10mm 58
7208370036 673.21 Sep-13 Oct-14 No Commodity Details
Products of iron or non-alloy steel, other in coils, not further worked than hot-rolled, of a width of 600mm or more, of a thickness of 59

Page 165
HTISC codes not included in ABS partner country import totals
HTISC SITC-REV4
Date of Effect
Date of Cessation
Restriction applied Commodity Description Count
4.75mm or more but not exceeding 10mm
7208370036 673.21 May-16 No Commodity Details
Products of iron or non-alloy steel, other in coils, not further worked than hot-rolled, of a width of 600mm or more, of a thickness of 4.75mm or more but not exceeding 10mm 60
7208380037 673.10 Aug-09 Jul-17 No Commodity Details
Products of iron or non-alloy steel, other in coils, not further worked than hot-rolled, of a width of 600 mm or more, of a thickness of 3 mm or more but less than 4.75 mm 61
7208390038 673.21 Aug-09 Jul-17 No Commodity Details
Products of iron or non-alloy steel, other, in coils, not further worked than hot-rolled, of a width of 600mm or more, of a thickness of less than 3mm 62
7208400039 673.24 Aug-09 Jul-11 No Commodity Details
Flat-rolled products of iron or non-alloy steel, not in coils, not further worked than hot-rolled, of a width of 600mm or more, with patterns in relief 63
7208530042 673.24 Aug-09 Oct-14 No Commodity Details
Flat-rolled products of iron or non-alloy steel, of a width of 600mm or more, not in coils, not further worked than hot-rolled, of a thickness of3 m m or more but less than 4.75mm 64
7208540043 673.24 Aug-09 Oct-14 No Commodity Details
Flat-rolled products of iron or non-alloy steel, of a width of 600mm or more, not in coils, not further worked than hot-rolled, of a thickness of less than 3mm 65
7209160034 673.41 Jun-17 No Commodity Details
Coils of iron or non-alloy steel, not further worked than cold-rolled (cold-reduced), of a width of 600 mm or more, of a thickness exceeding 1 mm but less than 3 mm 66
7210490055 674.13 Aug-09 Jul-11 No Commodity Details
Flat-rolled products of iron or non-alloy steel plated or coated with zinc,of width of 600mm or more,f a thickness of less than 0.5mm (excl electrolytically plated or coated or corrugated) 67
7210490055 67413 Sep-11 Oct-14 No Commodity Details
Flat-rolled products of iron or non-alloy steel plated or coated with zinc,of width of 600 mm or more,f a thickness of less than 0.5 mm (excl. electrolytically plated or coated or 68

Page 166
HTISC codes not included in ABS partner country import totals
HTISC SITC-REV4
Date of Effect
Date of Cessation
Restriction applied Commodity Description Count
corrugated)
7210490055 67413 Dec-14 No Commodity Details
Flat-rolled products of iron or non-alloy steel plated or coated with zinc,of width of 600 mm or more,f a thickness of less than 0.5 mm (excl. electrolytically plated or coated or corrugated) 69
7210490058 674.13 Sep-08 Aug-13 No Commodity Details
Flat-rolled products of iron or non-alloy steel electrolytically plated or coated with zinc, of width of 600mm or more, of a thickness of 2.5mm or more (excl electrolytically plated or coated or corrugated) 70
7210490058 674.13 Mar-16 No Commodity Details
Flat-rolled products of iron or non-alloy steel electrolytically plated or coated with zinc, of width of 600mm or more, of a thickness of 2.5mm or more (excl electrolytically plated or coated or corrugated) 71
7210610061 674.43 Sep-13 Oct-14 No Commodity Details
Flat-rolled products of iron or non-alloy steel plated or coated with aluminum-zinc alloys, of width of 600 mm or more, of a thickness of 0.5 mm or more but less than 1.5 mm 72
7210610061 674.43 May-16 Jul-17 No Commodity Details
Flat-rolled products of iron or non-alloy steel plated or coated with aluminum-zinc alloys, of width of 600 mm or more, of a thickness of 0.5 mm or more but less than 1.5 mm 73
7210610062 674.43 Aug-09 No Commodity Details
Flat-rolled products of iron or non-alloy steel plated or coated with aluminum-zinc alloys, of width of 600mm or more, of a thickness of 1.5mm or more 74
7211130039 673.27 Aug-09 Jul-17 No Commodity Details
Iron or non-alloy steel, not further worked than hot-rolled, width less than 600mm, rolled on four faces or in a closed box pass, of a width exceeding 150mm and a thickness of not less than 4mm, not in coils and without patterns in relief 75
7211190041 673.29 Aug-09 Jul-11 No Commodity Details
Iron or non-alloy steel, not further worked than hot-rolled, width less than 600mm, other (excl others, of a thickness of 4.75mm or more & rolled on four faces or in a closed box pass, of a width exc. 150mm 76

Page 167
HTISC codes not included in ABS partner country import totals
HTISC SITC-REV4
Date of Effect
Date of Cessation
Restriction applied Commodity Description Count
and a thickness of not less 4mm)
7211190041 673.29 Sep-13 No Commodity Details
Iron or non-alloy steel, not further worked than hot-rolled, width less than 600mm, other (excl others, of a thickness of 4.75mm or more & rolled on four faces or in a closed box pass, of a width exc. 150mm and a thickness of not less 4mm) 77
7213910044 676.19 May-09 Nov-10 No Commodity Details
Bars & rods of iron/non-alloy steel, of circular cross section <14mm diameter, hot-rolled, in irregularly wound coils (excl those of free-cutting steel & those with indentations, ribs, grooves etc produced during rolling) 78
7213910044 676.19 Sep-12 Sep-14 No Commodity Details
Bars & rods of iron/non-alloy steel, of circular cross section <14mm diameter, hot-rolled, in irregularly wound coils (excl those of free-cutting steel & those with indentations, ribs, grooves etc produced during rolling) 79
7213990045 676.16 Dec-14 No Commodity Details
Bars and rods of iron or non-alloy steel, hot-rolled, in irregularly wound coils, excl of circular cross-section measuring less than 14 mm in diameter of free-cutting steel and those containing indentations, ribs etc producedduring rolling 80
7216100027 676.81 Nov-14 Jul-17 No Commodity Details
U, I or H sections of iron or non-alloy steel, not further worked than hot-rolled, hot-drawn or extruded, of a height of less than 80 mm 81
7216220029 676.81 Nov-14 No Commodity Details
T sections of iron or non-alloy steel, not further worked than hot-rolled, hot-drawn or extruded, of a height of less than 80 mm 82
7216310030 676.82 Sep-08 Jul-11 No Commodity Details
U sections of iron or non-alloy steel, not further worked than hot-rolled, hot-drawn or extruded, of a height of 80mm or more 83
7216310030 676.82 Sep-13 Apr-16 No Commodity Details
U sections of iron or non-alloy steel, not further worked than hot-rolled, hot-drawn or extruded, of a height of 80mm or more 84
7216320031 676.82 Sep-08 Jul-09 No Commodity Details
I sections of iron or non-alloy steel, not further worked than hot-rolled, hot-drawn or extruded, of a height of 80mm or more 85

Page 168
HTISC codes not included in ABS partner country import totals
HTISC SITC-REV4
Date of Effect
Date of Cessation
Restriction applied Commodity Description Count
7216320031 676.82 Sep-13 Oct-14 No Commodity Details
I sections of iron or non-alloy steel, not further worked than hot-rolled, hot-drawn or extruded, of a height of 80mm or more 86
7216330032 676.82 Sep-08 Aug-09 No Commodity Details
H sections of iron or non-alloy steel, not further worked than hot-rolled, hot-drawn or extruded, of a height of 80mm or more 87
7216330032 676.82 Aug-11 Oct-14 No Commodity Details
H sections of iron or non-alloy steel, not further worked than hot-rolled, hot-drawn or extruded, of a height of 80 mm or more 88
7216400033 676.82 Sep-08 Jul-09 No Commodity Details
L or T sections of iron or non-alloy steel, not further worked than hot-rolled, hot-drawn or extruded, of a height of 80mm or more 89
7216500056 676.83 Aug-09 Aug-13 No Commodity Details
Iron or non-alloy steel, angles, shapes and sections (excl U, I, H, L and t sections) not further worked than hot-rolled, hot-drawn or extruded 90
7216500056 676.83 May-16 No Commodity Details
Iron or non-alloy steel, angles, shapes and sections (excl U, I, H, L and t sections) not further worked than hot-rolled, hot-drawn or extruded 91
7217200042 678.15 Jul-10 Jan-13 No Commodity Details
Wire of iron or non-alloy steel, plated or coated with zinc, containing by weight 0.60% or more of carbon 92
7225990039 675.73 Jun-17
Flat-rolled products of alloy steel, of a width of 600 mm or more, further worked than hot-rolled or cold-rolled (cold reduced) (excl. steel plated or coated with zinc, stainless steel and silicon-electrical steel) 93
7227901069 676.19 Mar-16 Jul-17 No Commodity Details
Bars and rods, hot-rolled in irregularly wound coils of high alloy steel; 'flattened circles' and 'modified rectangles' 94
7227909001 676.19 Mar-16 No Commodity Details
Bars and rods of alloy steel, hot-rolled, in irregularly wound coils, containing indentations, ribs, grooves or other deformations produced during rolling (excl. those of stainless, high speed or silico-manganese steel & those of 7227901069) 95
7228309040 676.29 Aug-15 No Commodity Details
Bar & rod of alloy steel, not further worked than hot-rolled, hot-drawn or extruded, with indentations, ribs, grooves or other deformations produced during rolling, not in 96

Page 169
HTISC codes not included in ABS partner country import totals
HTISC SITC-REV4
Date of Effect
Date of Cessation
Restriction applied Commodity Description Count
irregularly wound coils (excl. stainless & 7228100043 to 7228301070)
7228309041 676.29 Nov-15 No Commodity Details
Bar & rod of alloy steel, not further worked than hot-rolled, hot-drawn or extruded, not in irregularly wound coils (excl. stainless; those with indentations, ribs, grooves or deformations produced during rolling & 7228100043 to 7228301070) 97
7228309049 676.29 Nov-14 No Commodity Details
Bars and rods of alloy steel (excl. stainless steel, high speed steel, silico-manganese steel and high alloy steel), not further worked than hot-rolled, hot-drawn or extruded, not in irregularly wound coils 98
7301100001 676.86 Sep-08 No Value Details
Sheet piling of iron or steel, whether or not drilled, punched or made from assembled elements 99
7303000043 679.11 Jan-10 Oct-14 No Commodity Details Tubes, pipes and hollow profiles of cast iron 100
7304240050 674.13 Oct-16 Nov-16 No Commodity Details
Casing and tubing of stainless steel, seamless, of a kind used in drilling for oil or gas (excl. drill pipe) 101
7306210048 679.42 Dec-14 Mar-15 No Commodity Details
Welded casing & tubing of stainless steel, of a kind used in drilling for oil or gas 102
7306210048 679.42 Jun-15 Mar-17 No Commodity Details
Welded casing & tubing of stainless steel, of a kind used in drilling for oil or gas 103
7306610022 679.44 Dec-14 Jul-17 No Commodity Details
Welded tubes, pipes and hollow profiles nes, of square or rectangular cross section, of iron or non-alloy steel, not exc 279.4 mm perimeter with a wall thickness exc 2 mm 104
7306610025 679.44 Dec-14 No Commodity Details
Welded tubes, pipes and hollow profiles, of iron or non-alloy steel, of square or rectangular cross section, exceeding 279.4 mm perimeter (excl. those of cast iron; line pipe and casing and tubing used for drilling on oil and gas pipelines) 105
7306690026 679.44 Aug-11 Dec-11 No Commodity Details
Welded tubes, pipes and hollow profiles nes, of non-circular cross-section, of iron or non-alloy steel, not exc 279.4 mm perimeter with a wall thickness not exc 2 mm 106

Page 170
HTISC codes not included in ABS partner country import totals
HTISC SITC-REV4
Date of Effect
Date of Cessation
Restriction applied Commodity Description Count
7306690027 679.44 Aug-09 Dec-11 No Commodity Details
Welded tubes, pipes and hollow profiles nes, of non-circular cross-section, of iron or non-alloy steel, not exc 279.4mm perimeter with a wall thickness exc 2mm 107
7306690028 679.44 Aug-09 Dec-11 No Commodity Details
Welded tubes, pipes and hollow profiles nes, of non-circular cross-section, of iron or non-alloy steel, exc 279.4mm but not exc 1277.3mm perimeter 108
7306900012 679.49 May-16 No Commodity Details Tubes, pipes and hollow profiles of iron or steel nes 109
7312100091 693.11 Jan-15 No Commodity Details
Stranded steel ropes & cable, not electrically insulated, of a diameter exceed 50mm but not exceed 100mm, with not more than 8 strands (excl. stainless steel; brass coated cord for reinforcing rubber tyres; stress-relieved steel wire strand) 110
7321110021 697.31 Jul-13 Oct-14 No Commodity Details
Non-portable, 2 burners or more, non-electric domestic ovens for gas fuel or for both gas and other fuels (excl. combined gas-electric) of iron or steel and solid fuel, total input capacity which exceeds 5 Mj 111
7606120033 684.23 Sep-08 Jul-16 No Commodity Details
Alloyed rectangular (incl. square) aluminium plates, sheets and strip (excl of a kind used in the manufacture of venetian blinds), coiled, exc 1,500mm in width, exc 0.2mm but not exc 3mm in thickness 112
8414901041 743.80 Mar-17 Mar-17 No Commodity Details Parts of pumps and compressors used in the liquefaction of gases 113
8418210010 775.21 Jul-09 Jun-12 No Commodity Details
Compression-type, household type refrigerators 200 L and over but less than 300 L gross internal capacity 114
8429400029 723.33 Jul-09 Aug-12 No Commodity Details Self-propelled tamping machines and road rollers 115
8517620061 764.12 May-17 May-17 No Commodity Details
Telephonic or telegraphic switching apparatus (excl telephone switching apparatus for small business systems (SBS)) 116
8517620090 764.12 May-17 May-17 No Commodity Details
Machines for the reception, conversion and transmission or regeneration of voice, images or other data, including switching and routing apparatus nes 117
8518220083 764.22 May-17 May-17 No Commodity Details
Multiple loudspeakers, mounted in the same enclosure (excl. for use in domestic Hi Fi systems, public 118

Page 171
HTISC codes not included in ABS partner country import totals
HTISC SITC-REV4
Date of Effect
Date of Cessation
Restriction applied Commodity Description Count
address systems or with musical instruments)
8518309010 764.24 May-17 May-17 No Commodity Details
Headphones, earphones and combined microphone/speaker sets (excl line telephone headsets) 119
8519813032 763.39 Oct-09 Dec-11 No Commodity Details
Cassette type dictating machines capable of operating without an external source of power 120
Author: Frank Bingham Office of Economic Analysis [email protected]
Page 172
APPENDIX H – TRIEC CLASSIFICATION
1 Primary products
11 Primary products – Unprocessed
111 Food & live animals 112 Minerals 113 Fuels 114 Other
12 Primary products – Processed
121 Food 122 Minerals 123 Fuels 124 Other
2 Manufactured products
23 Manufactures – Simply transformed
231 Mineral manufactures & metals 232 Chemicals & other semi-manufactures 233 Other simply transformed
24 Manufactures – Elaborately transformed
241 Mineral manufactures & metals 242 Chemicals & other semi-manufactures 243 Engineering products (excl Household equipment) 244 Other elaborately transformed
3 Other goods
30 Other goods
301 Miscellaneous trade 302 Non-monetary gold 303 Unclassified trade & invalid items 304 Confidential items

Page 173
1 Primary products
11 Primary products – Unprocessed
111 Primary products – Unprocessed - Food & live animals
1111 Live animals, chiefly for food 1112 Seafood, fresh, chilled, dried, smoked, salted 1113 Vegetables, fruit & nuts, fresh, chilled, or provisionally preserved 1114 Cereal grains 1119 Unprocessed food nes
112 Primary products – Unprocessed – Minerals
1121 Iron ore & concentrates (Australian split only)7 1122 Other metalliferous ores & concentrates 1129 Unprocessed minerals nes
113 Primary products – Unprocessed – Fuels
1131 Coal, anthracite & bituminous 1132 Crude petroleum 1133 Petroleum gases & gaseous hydrocarbons nes
114 Primary products – Unprocessed – Other
1141 Hides, skins & furskins, raw 1142 Cork & wood 1143 Textile fibres, unprocessed & waste 1149 Crude materials nes
12 Primary products – Processed
121 Primary products – Processed – Food
1211 Meat & meat preparations 1212 Seafood, frozen or processed 1213 Dairy products, processed 1214 Vegetables, fruit & nuts preparations 1215 Cereal preparations 1216 Animal & vegetable oils, fats & waxes 1217 Sugars, honey, coffee, cocoa & confectionery 1219 Preparations of food, beverages & tobacco nes
7 For international merchandise trade data TRIEC codes 1121 & 1122 will be combined to code 1123 ‘Metalliferous ores & concentrates’.

Page 174
122 Primary products – Processed – Minerals
1221 Non-metallic minerals, processed 1222 Metallic minerals, processed
123 Primary products – Processed – Fuels
1231 Refined petroleum products 1232 Petroleum gases & other gaseous hydrocarbons, processed 1233 Electric current (Not an Australian code) 1239 Other processed fuels nes
124 Primary products – Processed – Other
1241 Rubber, natural, synthetic & reclaimed 1242 Wood, simply worked & pulp 1243 Textile fibres, processed
2 Manufactured products
23 Manufactures – Simply transformed
231 Manufactures – Simply transformed – Mineral manufactures & metals
2311 Non-metallic mineral manufactures 2312 Iron & steel 2313 Non-ferrous metals
232 Manufactures – Simply transformed – Chemicals & other semi-manufactures
2321 Organic chemicals 2322 Inorganic chemicals 2323 Other chemical & chemical preparations 2324 Other semi-manufactures
233 Manufactures – Simply transformed – Other
2339 Other simply transformed manufactures nes
24 Manufactures – Elaborately transformed
241 Manufactures – Elaborately transformed – Mineral manufactures & metals
2411 Non-metallic mineral manufactures 2412 Iron & steel 2413 Non-ferrous metals

Page 175
242 Manufactures – Elaborately transformed – Chemicals & other semi-manufactures
2421 Pharmaceutical products 2422 Essential oils, perfume & cosmetic products 2423 Plastics & articles of plastic 2424 Other chemical & chemical preparations 2425 Other semi-manufactures
243 Manufactures – Elaborately transformed – Engineering products (excl Household equipment)
2431 Machinery for specialised industries 2432 Office & telecommunications equipment & parts 2433 Road motor vehicles & parts 2434 Other transport equipment & parts 2435 Professional, scientific & controlling instruments & apparatus 2439 Other engineering products nes
244 Manufactures – Elaborately transformed – Other
2441 Household equipment 2442 Textiles, clothing & footwear 2449 Other miscellaneous manufactured articles nes
3 Other goods
30 Other goods
301 Other goods – Miscellaneous trade
3011 Armoured fighting vehicles, arms of war, etc & parts, nes 3012 Gold coins & other coins that are legal tender 3019 Miscellaneous merchandise trade nes
302 Other goods – Non-monetary gold
3021 Non-monetary gold
303 Other goods – Unclassified trade & invalid items
3031 Unclassified trade & invalid items
304 Other goods – Confidential trade
3041 Confidential trade

Page 176


Composition of Trade Australia 2016-17