Embed Size (px)
Citation preview

World Rabbit Sci. 27: 185-198 185
COMPOSITION OF RABBIT CAECAL MICROBIOTA AND THE EFFECTS OF DIETARY QUERCETIN SUPPLEMENTATION AND SEX THEREUPON
NORTH M.K. *, DALLE ZOTTE A. †, HOFFMAN L.C. *‡
*Department of Animal Sciences, Stellenbosch University, Private Bag X1, Matieland, StellenboSch 7602, South Africa.†Department of Animal Medicine, Production and Health, University of Padova, Agripolis, Viale dell’Università, 16,
35020 legnaro, Padova, Italy.‡Centre for Nutrition and Food Sciences, Queensland Alliance for Agriculture and Food Innovation (QAAFI), The University of
Queensland, Health and Food Sciences Precinct, 39 Kessels Road, cooperS plainS 4108, Australia.
Abstract: The purpose of this study was to add to the current understanding of rabbit caecal microbiota. This involved describing its microbial composition and linking this to live performance parameters, as well as determining the effects of dietary quercetin (Qrc) supplementation (2 g/kg feed) and sex on the microbial population. The weight gain and feed conversion ratio of twelve New Zealand White rabbits was measured from 5 to 12 wk old, blood was sampled at 11 wk old for the determination of serum hormone levels, and the rabbits were slaughtered and caecal samples collected at 13 wk old. Ion 16STM metagenome sequencing was used to determine the microbiota profile. The dominance of Firmicutes (72.01±1.14% of mapped reads), Lachnospiraceae (23.94±1.01%) and Ruminococcaceae (19.71±1.07%) concurred with previous reports, but variation both between studies and individual rabbits was apparent beyond this. Significant correlations between microbial families and live performance parameters were found, suggesting that further research into the mechanisms of these associations could be useful. Negative correlations with the caecal flavonoid content were found, but the latter was not affected by diet, and the effects of quercetin supplementation on the microbiota were very limited, possibly due to the absorption of the quercetin-aglycone from the gastrointestinal tract prior to the caecum. Nonetheless, Clostridiales Family XIII. Incertae Sedis was more abundant in the quercetin-supplemented rabbits (Control: 0.003±0.003%; Qrc: 0.020±0.000; P=0.005), as was the genus Anaerofustis (Control: 0.000±0.002; Qrc: 0.010±0.002; P=0.003). Serum cortisol levels were higher in females, and several microbial families differed between the sexes. Most were more abundant in female rabbits, including the most abundant, the family Eubacteriaceae (Male: 2.93±0.40; Female: 4.73±0.40; P=0.01).
Key Words: flavonoid, growth, gut, microbiota, Oryctolagus cuniculus, rabbit.
INTRODUCTION
Rabbits rely on their commensal gut microbiota for assistance in the digestion of fibrous plant material and thus the supply of important nutrients, with the majority of microbial fermentation taking place in the caecum (Combes et al., 2013). Caecal short-chain fatty acid production is suggested to account for 30-50% of maintenance energy requirements, while bacterial proteins, which are consumed during caecotrophy (the consumption of specifically produced soft faeces), can contribute 15% or more of the total ingested nitrogen in adults (Combes et al., 2013). The caecal bacterial population is also an essential source of vitamins, particularly biotin, thiamine, cobalamin, riboflavin, folic acid and niacin (McBee, 1971).
The complexity and stability of the gut microbial ecosystem is also important for the prevention of disease, as it serves as a protective barrier and plays a role in development of the immune system and intestinal mucosa (Combes et al.,
World Rabbit Sci. 2019, 27: 185-198doi:10.4995/wrs.2019.11905
© WRSA, UPV, 2003
Correspondence: L.C. Hoffman, [email protected]. Received May 2019 - Accepted September 2019.https://doi.org/10.4995/wrs.2019.11905
W o r l dR a b b i t Sc ience

North et al.
World Rabbit Sci. 27: 185-198186
2013). This aspect of host-bacteria interaction is of particular interest in rabbits, for which post-weaning mortalities due to digestive disturbances are very high (Michelland et al., 2010).
It is consequently important that the composition of the caecal microbiota is understood, and that the effects of any dietary manipulation are elucidated, particularly in the case of substances with antimicrobial properties, such as flavonoids (Cushnie and Lamb, 2005; Lee et al., 2006). Flavonoids have been reported to both alter the gut microbial profile (Duda-Chodak, 2012; Espley et al., 2014; Oteiza et al., 2018), and be affected by it, as the gut microbiota can metabolise flavonoids and thereby alter their absorption and biological effects (Lin et al., 2003; Oteiza et al., 2018).
The purpose of this study was to describe the composition of the rabbit caecal microbiota and investigate the link between this and live performance, as well as to investigate the possible effects of dietary quercetin supplementation and sex on this microbial population.
MATERIALS AND METHODS
Ethical clearance for this study was obtained from the Stellenbosch University Animal Care and Use Committee (protocol number SU-ACUD16-00094).
Rearing and samplingTwelve (6 male, 6 female) New Zealand White rabbits reared at the Mariendahl Experimental Farm outside Stellenbosch in the Western Cape of South Africa were used for the study. They were weaned at 5 wk old, and assigned to treatment groups according to sex and weaning weight, so that there were 3 male and 3 female rabbits per dietary treatment group, and the average weights of the rabbits in each treatment group were comparable. The treatment diets were provided ad libitum from weaning, and consisted of two complete, pelleted feeds, one control (Ctrl) and one supplemented with 2 g quercetin dihydrate/kg feed (Qrc). The control diet contained predominantly alfalfa meal (36.2%), wheat bran (35.6%) and sunflower meal (12.6%), with 88.3% dry matter (DM), 19.0% crude fibre, 18.5% crude protein, 8.3% ash and 3.7% ether extract (see North et al., 2018 for full composition). The quercetin dihydrate was extracted from Sophorae japonica flowers (Chengdu Okay Plant and Chemical Co., Ltd, Chengdu, China), and was added to the feed during mixing and prior to pelleting.
The rabbits were housed in individual cages in two rooms with 12L:12D light regimes during the growth period, with the males and females and dietary treatments being distributed between the two rooms. Each rabbit was assigned an identifying code based on the dietary treatment (Q or C), sex (M or F) and cage number, resulting in the following 12 codes: CM9, CM35 and CM 83 (control males), CF14, CF58 and CF88 (control females), QM11, QM37 and QM63 (quercetin males), and QF16, QF60 and QF86 (quercetin females). During the growth period, from 5 to 12 wk of age, the live weight (LW) of the individual rabbits was determined weekly, as was the daily feed intake, so that the feed conversion ratio (FCR) could be calculated. At 11 wk old, blood samples were collected from the rabbits via the central ear artery, and the free thyroxine (fT4), free triiodothyronine (fT3), somatotropin (GH) and cortisol contents of the serum were determined, as described by North et al. (2018).
The temperature and humidity of the grower rooms was measured during the growth period using automatic loggers (LogTag humidity and temperature recorder, Model HAX0-8). The average temperature and humidity in room A (rabbits CM9, CM35 CF14, QM11, QM37 and QF16) was 14.9±0.21°C and 72.3±0.96%, and in room B (rabbits CM 83, CF58, CF88, QM63, QF60 and QF86) was 16.4±0.14°C and 63.4±0.73%. All the rabbits used in this study were healthy throughout the growth period.
At 13 wk of age the rabbits were slaughtered, without prior fasting, at an abattoir on the experimental farm. They were electrically stunned and exsanguinated via the carotid arteries and jugular veins, and the gastrointestinal tracts were removed and collected. Samples of the caecal content for microbial DNA extraction were collected in a sterile manner from approximately 3 cm from the ileocaecal junction. Additional samples were collected for determination of the total flavonoid content, and the pH of the caecal content was measured using a calibrated Crison PH25 portable pH meter with a 50 54 electrode (Crison Instruments S.A., Barcelona, Spain).
Total flavonoid content determinationCaecal content samples were lyophilised (CHRIST, model ALPHA 1-4/LDC-1M) until a constant pressure of 0.037-0.040 mbar was attained (ca. 72 h), indicating complete drying. They were ground using a mortar and pestle

EffEct of quErcEtin on caEcal microbiota
World Rabbit Sci. 27: 185-198 187
prior to flavonoid extraction. Flavonoid extraction was performed according to the method of Vasantha Rupasinghe et al. (2008), with modifications as described in full by North et al. (2018). The colorimetric assay was performed as described by Herald et al. (2012), as also described by North et al. (2018), with the exception that 25 µL, rather than 10 µL, of flavonoid extract was used for the assay. The total flavonoid content was quantified using a quercetin (Sigma-Aldrich, Steinheim, Germany) standard (25-500 µg/mL, R2 = 0.997), and is expressed as mg quercetin equivalents/g DM.
16STM metagenome sequencingMicrobial DNA was extracted from fresh caecal content samples using the PureLink™ Microbiome DNA Purification Kit (ThermoFisher Scientific) according to the manufacturer’s protocol (MAN0014266 Rev. A.0). Briefly, ca. 100 mg of each sample was homogenised with 700 μL S1 Lysis buffer in a bead tube. The DNA was bound to the column and washed, and subsequently eluted in 100 μL buffer using two sequential 50 μL elution steps. The total DNA contents of the extracts were quantified with the Qubit 2.0 Fluorometer, using the Qubit dsDNA HS assay kit according to the protocol (MAN0002326 REVA.0). To confirm the presence of bacterial gDNA in the sample material, the Femto™ Bacterial DNA Quantification Kit was used according to the manufacturer’s protocol (Ver. 1.0.0). The bacterial DNA quantity and quality was considered sufficient for library construction. The Ion 16S™ Metagenomics Kit was used to amplify hypervariable regions from the polybacterial samples according to the protocol (MAN0010799 REV C.0). Two primer sets were used, one which amplified hypervariable regions V2, V4 and V8, and the other V3, V6, V7 and V9. Target regions were amplified from 2 μL gDNA across 25 cycles on the SimplyAmp Thermal Cycler (ThermoFisher Scientific). The presence of amplified products was verified on the PerkinElmer LabChip GXII Touch using the DNA NGS 3K LabChip and Reagent Kit according to the protocol (CLS145099 Rev. D). Following verification, PCR products were pooled and purified with Agencourt™ AMPure™ XP reagent and eluted in 15 μL nuclease-free water. Purified amplicons were quantified with the Qubit 2.0 Fluorometer using the Qubit dsDNA HS assay kit.
Library preparation was performed from 50 ng pooled amplicons for each sample using the Ion Plus Fragment Library Kit according to the protocol (MAN0006846, REV B.0). Briefly, amplified fragments were end-repaired in preparation for blunt-end ligation to IonCode™ Barcode Adapters. The adapter-ligated, barcoded library was purified with Agencourt™ AMPure™ XP reagent and subsequently quantified using the Ion Universal Library Quantitation Kit. The StepOnePlus™ Real-time PCR system was used to perform the quantitative polymerase chain reaction (qPCR) amplification. Libraries were diluted to a target concentration of 10 pM, and the 16S libraries were combined in equimolar amounts for template preparation, which was performed using the Ion 520™ and Ion 530™ Chef Kit. In brief, 25 µL of the pooled library was loaded onto the Ion Chef liquid handler using reagents, solutions and supplies according to the protocol (MAN0010846, REVD.0). Enriched, template positive ion sphere particles were loaded onto an Ion 530™ Chip. Massively parallel sequencing was performed on the Ion S5™ System using the Ion S5™ sequencing solutions and sequencing reagent kits according to the protocol (MAN0010846, REVD.0). Flow space calibration and base caller analyses were performed using default analysis parameters in the Torrent Suite Version 5.6.0 Software. Run data was uploaded to an IonReporterTM cloud account for mapping and annotation of the identified sequences, with the Basic Local Alignment Search Tool (BLAST) being used to align sequences to the curated MicroSEQ® 16S v2013.1 and Greengenes v13.5 reference libraries. Reads with fewer than ten copies were ignored. Alpha and beta diversity analysis was performed using the QIIME 1.9.1 open-source bioinformatics pipeline, through IonReporterTM. The bacterial composition (per operational taxonomic unit, OTU) is reported as the percentage of the total mapped reads (for all primers) per sample.
Statistical analysisEach rabbit constituted an experimental unit for statistical analysis. Data was analysed using Statistica version 13 software, with normality being tested using normal probability plots, and homoscedasticity using Levene’s test. Univariate tests of significance for the main effects (diet and sex) and their interaction, were performed using the general linear model procedure, with Fisher’s LSD test being performed to compare the individual diet-sex treatment groups. Pearson’s correlation coefficients were calculated to measure the strength and direction of any relationships between the bacterial families and the total LW gain from 5 to 12 wk old, the average FCR from 5 to 12 wk, the serum hormone levels and the caecal flavonoid content and pH. Main effects and interactions with P<0.05 were considered significant, and values are reported as least square means (LSM), with the standard error of the mean (SEM) provided.
North et al.
World Rabbit Sci. 27: 185-198188
RESULTS
The LW gain, FCR and serum fT3, fT4 and GH contents did not differ between the sexes or dietary treatment groups (Table 1), while the cortisol content was higher in females than males (P=0.02). Neither the caecal pH nor caecal flavonoid content differed between the diets or sexes, with an average pH of 5.59 and an average flavonoid content of 3.90 mg quercetin equivalent/g DM being found.
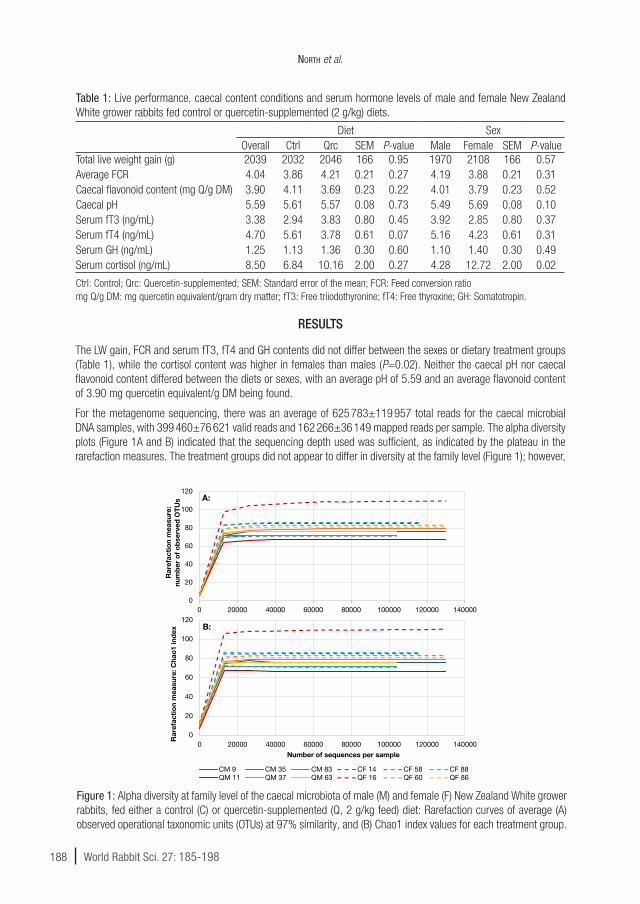
For the metagenome sequencing, there was an average of 625 783±119 957 total reads for the caecal microbial DNA samples, with 399 460±76 621 valid reads and 162 266±36 149 mapped reads per sample. The alpha diversity plots (Figure 1A and B) indicated that the sequencing depth used was sufficient, as indicated by the plateau in the rarefaction measures. The treatment groups did not appear to differ in diversity at the family level (Figure 1); however,
Table 1: Live performance, caecal content conditions and serum hormone levels of male and female New Zealand White grower rabbits fed control or quercetin-supplemented (2 g/kg) diets.
Diet SexOverall Ctrl Qrc SEM P-value Male Female SEM P-value
Total live weight gain (g) 2039 2032 2046 166 0.95 1970 2108 166 0.57Average FCR 4.04 3.86 4.21 0.21 0.27 4.19 3.88 0.21 0.31Caecal flavonoid content (mg Q/g DM) 3.90 4.11 3.69 0.23 0.22 4.01 3.79 0.23 0.52Caecal pH 5.59 5.61 5.57 0.08 0.73 5.49 5.69 0.08 0.10Serum fT3 (ng/mL) 3.38 2.94 3.83 0.80 0.45 3.92 2.85 0.80 0.37Serum fT4 (ng/mL) 4.70 5.61 3.78 0.61 0.07 5.16 4.23 0.61 0.31Serum GH (ng/mL) 1.25 1.13 1.36 0.30 0.60 1.10 1.40 0.30 0.49Serum cortisol (ng/mL) 8.50 6.84 10.16 2.00 0.27 4.28 12.72 2.00 0.02
Ctrl: Control; Qrc: Quercetin-supplemented; SEM: Standard error of the mean; FCR: Feed conversion ratio mg Q/g DM: mg quercetin equivalent/gram dry matter; fT3: Free triiodothyronine; fT4: Free thyroxine; GH: Somatotropin.
41
FIGURES 804
805
806 807 Figure 1: Alpha diversity at family level of the caecal microbiota of male (M) and female (F) New 808
Zealand White grower rabbits, fed either a control (C) or quercetin-supplemented (Q, 2 g/kg feed) 809
diet: Rarefaction curves of average (A) observed operational taxonomic units (OTUs) at 97 % 810
similarity, and (B) Chao1 index values for each treatment group.811
0
20
40
60
80
100
120
0 20000 40000 60000 80000 100000 120000 140000
Rar
efac
tion
mea
sure
: nu
mbe
r of
obs
erve
d O
TUs A:
0
20
40
60
80
100
120
0 20000 40000 60000 80000 100000 120000 140000
Rar
efac
tion
mea
sure
: Cha
o1 in
dex
Number of sequences per sample
B:
CM 9 CM 35 CM 83 CF 14 CF 58 CF 88QM 11 QM 37 QM 63 QF 16 QF 60 QF 86
Figure 1: Alpha diversity at family level of the caecal microbiota of male (M) and female (F) New Zealand White grower rabbits, fed either a control (C) or quercetin-supplemented (Q, 2 g/kg feed) diet: Rarefaction curves of average (A) observed operational taxonomic units (OTUs) at 97% similarity, and (B) Chao1 index values for each treatment group.

EffEct of quErcEtin on caEcal microbiota
World Rabbit Sci. 27: 185-198 189
one sample, QF 16, had considerably higher levels of microbial diversity than the other samples, with a larger number of OTUs being identified.
In accordance with the alpha diversity results, no clear separation of the treatment groups was seen at the species level in the Bray-Curtis beta diversity principle coordinate plots (Figure 2), suggesting that the overall diversity was more due to individual than treatment differences. However, two samples from Qrc rabbits, QM37 and QF16, had very different microbiota compositions at the family level to the other samples, with the latter concurring with the higher diversity seen in Figure 1.
At the phylum level (Figure 3), the dominant group in all the samples was Firmicutes, making up an average of 72.01±1.14% of the total mapped reads, followed by Proteobacteria (11.14±0.96%), Bacteroidetes (9.82±1.54%), Actinobacteria (3.67±0.26%), Tenericutes (1.42±0.22%) and Verrucomicrobia (1.28±0.16%). While some of the phyla were only present at very low levels, but were detected in all the samples, such as Spirochaetes (0.08±0.01%) and Synergistetes (0.13±0.03%), Deinococcus-Thermus (0.22±0.12%) was only present in a few of the samples, and Nitrospinae was only detected in one sample (0.01% in QF60), and was consequently not included in Figure 3.
As expected, families falling within the Firmicutes phylum (indicated in shades of green) dominated the microbiota (Figure 4), particularly Lachnospiraceae (23.94±1.01%), Ruminococcaceae (19.71±1.07%) and Clostridiaceae (10.17±0.74%), all of which also fall within the order Clostridiales (indicated by dotted shades of green), which was the most prevalent order (62.27±1.39%). The remaining prominent families were Desulfovibrionaceae (7.65±0.77%), Eubacteriaceae (3.83±0.38%), Bacteroidaceae (4.19±0.91%) and Porphyromonadaceae (4.05±0.63%), with both of the latter belonging to the phylum Bacteroidetes, (indicated by shades of blue). The latter two also both belong to the order Bacteroidales (9.05±1.47%, indicated in striped shades of blue), which was the second most prevalent order. The majority of the families detected (67 of 83) had abundances of less than 1% of the total mapped reads, and many were only present in a few of the samples, and were consequently not statistically analysed.
Only ca. 3.8% of the total mapped reads were identified to the species level, with 85.13±1.02% having family level identification and 10.92±0.78% having genus level identification. The proportion of the total mapped reads identified as species also varied widely between individuals, from 2.49% to 6.76%. 42
812
813
Figure 2: Bray-Curtis plots indicating the beta diversity at (A) family and (B) species level of the 814
caecal microbiota of male and female New Zealand White grower rabbits fed either a control (Ctrl) 815
or quercetin-supplemented (Qrc, 2 g/kg) diet. Points indicate individual samples, with blue circles 816
representing Ctrl males (CM), purple circles Ctrl females (CF), orange circles Qrc males (QM) 817
and yellow circles Qrc females (QF).818
CM 83
CF 58CM 9CF 14QM 11
QF 86 CF 88QM 63
QM 37
QF 60CM 35QF 16
-0,15
-0,1
-0,05
0
0,05
0,1
0,15
0,2
0,25
-0,7 -0,6 -0,5 -0,4 -0,3 -0,2 -0,1 0 0,1 0,2PC
2 (1
1.55
%)
PC1 (67.37 %)
A:
CM 83
CF 58
CM 9
CF 14
QM 11
QF 86CF 88 QM 63
QM 37
QF 60
CM 35
QF 16
-0,2
-0,1
0
0,1
0,2
0,3
0,4
-0,3 -0,2 -0,1 0 0,1 0,2 0,3 0,4
PC
2 (2
2.76
%)
PC1 (27.60 %)
B:
Figure 2: Bray-Curtis plots indicating the beta diversity at (A) family and (B) species level of the caecal microbiota of male and female New Zealand White grower rabbits fed either a control (Ctrl) or quercetin-supplemented (Qrc, 2 g/kg) diet. Points indicate individual samples, with blue circles representing Ctrl males (CM), purple circles Ctrl females (CF), orange circles Qrc males (QM) and yellow circles Qrc females (QF).

North et al.
World Rabbit Sci. 27: 185-198190
Figure 4: Relative abundance of the major bacterial groups (those contributing more than 1 % of
total mapped reads) in the rabbit caecum at the family level. Families are organised vertically from
most to least prevalent (average across treatment groups), and samples are grouped horizontally
by treatment (C: control; Q: dietary quercetin supplemented at 2 g/kg feed; M: male; F: female).
0
10
20
30
40
50
60
70
80
90
100
CM 9 CM 35 CM 83 CF 14 CF 58 CF 88 QM 11 QM 37 QM 63 QF 16 QF 60 QF 86
Per
cent
age
of m
appe
d re
ads
Mycoplasmataceae Thermoanaerobacterales Family III. Incertae SedisNatranaerobiaceae PeptococcaceaeVeillonellaceae VerrucomicrobiaceaeOxalobacteraceae ErysipelotrichaceaeCoriobacteriaceae EubacteriaceaePorphyromonadaceae BacteroidaceaeDesulfovibrionaceae ClostridiaceaeRuminococcaceae Lachnospiraceae
Figure 4: Relative abundance of the major bacterial groups (those contributing more than 1% of total mapped reads) in the rabbit caecum at family level. Families are organised vertically from most to least prevalent (average across treatment groups), and samples are grouped horizontally by treatment (C: control; Q: dietary quercetin supplemented at 2 g/kg feed; M: male; F: female).
0
10
20
30
40
50
60
70
80
90
100
CM 9 CM 35 CM 83 CF 14 CF 58 CF 88 QM 11 QM 37 QM 63 QF 16 QF 60 QF 86
Per
cent
age
of m
appe
d re
ads
Sample names
Firmicutes Proteobacteria BacteroidetesActinobacteria Tenericutes VerrucomicrobiaDeinococcus-Thermus Synergistetes ChloroflexiSpirochaetes Unclassified
Figure 3: Relative abundance of the major bacterial groups in the rabbit caecum at the phylum level. Phyla are organised vertically from most to least prevalent (average across treatment groups) and samples are grouped horizontally by treatment (C: control; Q: dietary quercetin supplemented at 2 g/kg feed; M: male; F: female).

EffEct of quErcEtin on caEcal microbiota
World Rabbit Sci. 27: 185-198 191
The composition at the species level (Figure 5) was far more diverse than at the phylum or family levels. Some species, such as Gemmiger formicilis (0.72±0.09%), Stomatobaculum longum (0.50±0.13%) and Ruminococcus gnavus (0.40±0.03%) were relatively consistently present in all the samples, whereas others, such as Bacteroides dorei (0.50±0.18%), Bacteroides uniformis (0.17±0.11%) and Bacteroides rodentium (0.13±0.08%) were present at high levels in some samples, but barely detected in others. Ruminococcus (family Ruminococcaceae) was the most prevalent genus (2.17±0.28%), with four identified species, of which Ruminococcus albus (0.44±0.10%) was the 4th most prevalent overall, whereas Ruminococcus (proposed taxonomy, family Lachnospiraceae, 2.03±0.17%), was the 2nd most abundant genus, but only had only a single identified species, R. gnavus. In contrast, eight of the identified species belonged to the genus Bacteroides, despite it being only the 5th most prevalent genus identified (1.32±0.43%). Moryella indoligenes was the only identified species in the genus Moryella, and the 6th most abundant species overall (0.19±0.07%). A number of species (18 of 38) were only identified in a few of the samples, generally at very low levels, although some, such as Bacteroides fragilis and Akkermansia muciniphila, were abundant in the few samples in which they were detected.
Despite the small sample number, several of the bacterial families correlated significantly with the live performance data (Table 2). Eubacteriaceae, Natranaerobiaceae, Peptococcaceae and Syntrophomonadaceae all had strong positive Pearson’s correlations with the total weight gain, suggesting that rabbits for which these families were more abundant tended to gain more weight from weaning to 12 wk old. In contrast, rabbits with higher proportions of Hyphomicrobiaceae tended to grow less. Only three families correlated with the FCR, Clostridiaceae, Erysipelotrichaceae and Haloplasmataceae, suggesting that a higher abundance of these families coincided with a lower FCR, and thus an improvement in the efficiency of feed utilisation.
Figure 5: Relative abundance of the major bacterial species identified in the rabbit caecum.
Species are organised vertically from most to least prevalent (average across treatment groups),
and samples are grouped horizontally by treatment (C: control; Q: dietary quercetin
supplemented at 2 g/kg feed; M: male; F: female).
0
1
2
3
4
5
6
7
CM 9 CM 35 CM 83 CF 14 CF 58 CF 88 QM 11 QM 37 QM 63 QF 16 QF 60 QF 86
Per
cent
age
of m
appe
d re
ads
Gemmiger formicilis Stomatobaculum longum Bacteroides doreiRuminococcus albus Ruminococcus gnavus Moryella indoligenesBacteroides uniformis Clostridium sp. Bacteroides rodentiumBacteroides intestinalis Campylobacter cuniculorum Ruminococcus flavefaciensCoprococcus catus Parabacteroides johnsonii Faecalibacterium prausnitziiParabacteroides distasonis Ruminococcus gauvreauii Alistipes sp.Butyricimonas virosa Odoribacter splanchnicus Oxalobacter formigenesBlautia producta
Figure 5: Relative abundance of the major bacterial species identified in the rabbit caecum. Species are organised vertically from most to least prevalent (average across treatment groups) and samples are grouped horizontally by treatment (C: control; Q: dietary quercetin supplemented at 2 g/kg feed; M: male; F: female).

North et al.
World Rabbit Sci. 27: 185-198192
There were also several correlations between bacterial families and serum hormone levels (Table 3). Carnobacteriaceae, Coriobacteriaceae (class Coriobacteriia), Streptosporangiaceae, Thermoanaerobacterales Family III. Incertae Sedis, Thermoanaerobacterales Family IV. Incertae Sedis and Thermosporotrichaceae all correlated positively with serum fT3 levels, whereas Entomoplasmataceae and Hyphomicrobiaceae both had strong negative correlations. Carnobacteriaceae, although correlating positively with fT3 levels, had a negative correlation with fT4 levels, as did Campylobacteraceae and Clostridiales Family XVI. Incertae Sedis. In contrast, Acidaminococcaceae, Peptostreptococcaceae and Sutterellaceae tended to be more abundant when serum fT4 levels were higher. Only Clostridiales Family XII. Incertae Sedis (r = 0.65) correlated with serum GH levels. Alicyclobacillaceae correlated negatively with the serum cortisol level, while Flavobacteriaceae, Rhizobiaceae and Rhodospirillaceae correlated positively with this hormone.
Several bacterial families correlated with the caecal pH and flavonoid content. Acetobacteraceae, Erythrobacteraceae, Microbacteriaceae, Mycoplasmataceae, Synergistaceae and Veillonellaceae (order Selenomonadales) all tended to be less abundant in samples with higher flavonoid contents, while proportions of Coriobacteriaceae (class Actinobacteria) and Veillonellaceae (order Clostridiales) were higher. Three families correlated with the pH of the caecal content, Clostridiales Family XI. Incertae Sedis, Desulfuromonadaceae and Spiroplasmataceae, with all three being more abundant at higher pH levels. There was no apparent correlation between the pH and the caecal flavonoid content.
Diet had a very limited effect on the microbiota (Table 4), with only Clostridiales Family XIII. Incertae Sedis (P=0.005) and Anaerofustis (P=0.003) being more abundant in the Qrc group. Somewhat more extensive differences were found between the sexes, with this in most cases involving higher levels of the particular OTU being found in caecal samples from female rabbits. Females had higher levels of Flavobacteriia (P = 0.032), due to a higher abundance of Flavobacteriales and Flavobacteriaceae, as well as higher levels of Desulfuromonadales (P=0.038), Eubacteriaceae (P=0.013) and Geobacteraceae (P=0.023).
Table 2: Significant Pearson’s correlation coefficients between the abundance of bacterial families and the live performance data and caecal content conditions of New Zealand White grower rabbits (P-values provided in parentheses).
Overall abundance
Total weight gain Average FCR
Caecal flavonoids (mg Q/g DM) Caecal pH
Clostridiaceae 10.17±0.74 - -0.67 (0.02) - -Eubacteriaceae 3.83±0.38 0.62 (0.03) - - -Coriobacteriaceae (class Actinobacteria) 2.92±0.20 - - 0.64 (0.02) -Erysipelotrichaceae 2.63±0.13 - -0.61 (0.04) - -Veillonellaceae (order Selenomonadales) 1.21±0.12 - - -0.66 (0.02) -Peptococcaceae 1.11±0.08 0.60 (0.04) - - -Natranaerobiaceae 1.08±0.19 0.70 (0.01) - - -Mycoplasmataceae 1.01±0.19 - - -0.69 (0.01) -Hyphomicrobiaceae 0.74±0.09 –0.62 (0.03) - - -Clostridiales Family XI. Incertae Sedis 0.25±0.06 - - - 0.64 (0.03)Acetobacteraceae 0.18±0.04 - - -0.74 (<0.01) -Microbacteriaceae 0.17±0.04 - - -0.59 (0.04) -Haloplasmataceae 0.14±0.10 - –0.68 (0.02) - -Synergistaceae 0.13±0.03 - - -0.62 (0.03) -Erythrobacteraceae 0.10±0.02 - - -0.60 (0.04) -Desulfuromonadaceae 0.07±0.02 - - - 0.69 (0.01)Syntrophomonadaceae 0.06±0.02 0.63 (0.03) - -Spiroplasmataceae 0.06±0.01 - - - 0.72 (<0.01)Veillonellaceae (order Clostridiales) 0.05±0.01 - - 0.61 (0.03) -No.= 12 for all correlations; Families listed from most to least abundant (abundance provided as least square mean±standard error of the mean). Total weight gain: weight gain from 5 to 12 wk of age; Average FCR: Average feed conversion ratio from 5 to 12 wk of age; mg Q/g DM: mg quercetin equivalent/gram dry matter.

EffEct of quErcEtin on caEcal microbiota
World Rabbit Sci. 27: 185-198 193
DISCUSSION
The microbiota profile
At phylum level, the dominance of Firmicutes found in this study (Figure 3) was in agreement with previous studies of the rabbit caecal microbiota, and its relative abundance fitted within the previously reported range (Monteils et al., 2008; Bäuerl et al., 2014; Zhu et al., 2015). The abundance of Proteobacteria and Bacteroidetes also concurred with some existing literature (Monteils et al., 2008; Zhu et al., 2015), although other studies reported considerably lower proportions of Proteobacteria (Massip et al., 2012; Bäuerl et al., 2014). It is notable that Proteobacteria tended to be more abundant in rabbits exhibiting the symptoms of epizootic rabbit enteropathy (ERE) (Bäuerl et al., 2014); however, ERE did not occur in this study.
The abundance of Actinobacteria and Tenericutes was high relative to the results of Massip et al. (2012) and Zhu et al. (2015); however, Bäuerl et al. (2014) and Badiola et al. (2016) found a higher proportion of Tenericutes but minor amounts of Actinobacteria. Reports of Verrucomicrobia abundance also vary widely, possibly due to differences in rabbit age at sampling and the starch to fibre ratios of the diets used, as both have been reported to affect the abundance of this phylum (Monteils et al., 2008; Massip et al., 2012; Bäuerl et al., 2014; Zhu et al., 2015).
At the family level (Figure 4), the predominance of Lachnospiraceae and Ruminococcaceae concurred with the findings of Zhu et al. (2015), Massip et al. (2012) and Bäuerl et al. (2014), although the proportions were much lower than reported by the latter two. These families are thought to play an important role in fibre digestion, particularly of peptose and cellulose (Gosalbes et al., 2011), and are significant producers of short-chain fatty acids (Zhu et al., 2015). In addition, Ruminococcaceae has been associated with antibiotic biosynthesis in a metatranscriptomic study on the human gut microbiota, suggesting a role in gut health (Gosalbes et al., 2011).
Clostridiaceae, the third most abundant family, was not reported as a main bacterial family in rabbits by Massip et al. (2012); however, it was present in rabbit caeca (Bäuerl et al., 2014), and was a dominant family in the capybara (García-Amado et al., 2012) and healthy horses (Steelman et al., 2012). Members of the Clostridiaceae family have
Table 3: Significant Pearson’s correlation coefficients between the abundance of bacterial families and the serum hormone levels of New Zealand White grower rabbits. P-values provided in parentheses.
Overall abundance Serum fT3 Serum fT4 Serum GH
Serum cortisol
Thermoanaerobacterales Family III. Incertae Sedis 1.06±0.16 0.58 (0.05) - - -Hyphomicrobiaceae 0.74±0.09 –0.61 (0.03) - - -Flavobacteriaceae 0.54±0.14 - - - 0.62 (0.03)Acidaminococcaceae 0.41±0.07 - 0.58 (0.05) - -Campylobacteraceae 0.11±0.02 - –0.58 (0.05) - -Thermosporotrichaceae 0.09±0.03 0.67 (0.02) - - -Carnobacteriaceae 0.09 ±0.04 0.66 (0.02) –0.64 (0.02) - -Sutterellaceae 0.09±0.01 - 0.62 (0.03) - -Peptostreptococcaceae 0.09±0.04 - 0.65 (0.02) - -Clostridiales Family XII. Incertae Sedis 0.06±0.01 - - 0.65 (0.02) -Alicyclobacillaceae 0.05±0.01 - - - –0.65 (0.02)Coriobacteriaceae (class Coriobacteriia) 0.05±0.02 0.69 (0.01) - - -Rhodospirillaceae 0.05±0.01 - - - 0.70 (0.01)Entomoplasmataceae 0.04±0.01 –0.68 (0.01) - - -Rhizobiaceae 0.03±0.01 - - - 0.60 (0.04)Thermoanaerobacterales Family IV. Incertae Sedis 0.03±0.01 0.62 (0.03) - - -Streptosporangiaceae 0.02±0.01 0.61 (0.04) - - -Clostridiales Family XVI. Incertae Sedis 0.02±0.01 - -0.58 (0.05) - -No. = 12 for all correlations; Families listed from most to least abundant (abundance provided as least square mean±standard error of the mean). fT3: free triiodothyronine; fT4: free thyroxine; GH: somatotropin.

North et al.
World Rabbit Sci. 27: 185-198194
been found to prefer simpler carbohydrates, rather than the fibrous components utilised by the Lachnospiraceae and Ruminococcaceaea, and its prevalence in the caecum was thus somewhat surprising (Biddle et al., 2013).
Desulfovibrionaceae was also detected by Bäuerl et al. (2014) and Massip et al. (2012), and was linked to feed intake levels by the latter, and Bacteroidaceae was found at similar levels by Badiola et al. (2016). Both Bacteroidaceae and Porphyromonadaceae have been found to be among the most active of the human gut microbiota (Gosalbes et al., 2011). However, Badiola et al. (2016) did not detect any Porphyromonadaceae in the rabbit caecum. Eubacteraceae have also been suggested to be functionally versatile (De Vos et al., 2009; Gosalbes et al., 2011), and were detected in the rabbit caecum by Bäuerl et al. (2014), but were not by Badiola et al. (2016) or Zhu et al. (2015).
Of the remaining families contributing more than 1% of the total mapped reads, Coriobacteraceae, Erysipelotrichaceae, Oxalobacteraceae, Verrucomicrobiaceae, Veillonellaceae and Peptococcaceae have been previously detected in rabbit caecum, although at widely varying abundances (Massip et al., 2012; Bäuerl et al., 2014; Badiola et al., 2016). In contrast, Natranaerobiaceae, Thermoanaerobacterales Family III. Incertae Sedis and Mycoplasmataceae do not appear to have been previously found to form part of the rabbit caecal microbiota.
The greatest extent of individual variation was seen at the species level (Figure 5), with not only the abundance of the different species varying, but also the proportion of the sequences that were identified to this level. Only between 2.0% and 6.8% of the sequences were identified to the species level, which supports the speculation that rabbit caeca contain a large proportion of undescribed bacterial species (Michelland et al., 2010), and suggests that the composition of these novel species may vary between individuals.
Overall, five species contributed 67% of the total identified at the species level, with the two most prevalent being Gemmiger formicilis and Stomatobaculum longum, although the abundance of the latter varied widely. Neither species appear to have been identified in rabbit caeca before, although G. formicilis has been found in chicken ceca (Clench and Mathias, 1995) and human faeces (Salanitro et al., 1976).
The variable abundance of Bacteroides dorei was notable, as the genus Bacteroides has been suggested to be largely responsible for pectinolytic activity in the rabbit caecum (Sirotek et al., 2001). Furthermore, Badiola et al. (2016) observed that the inoculation of rabbit kits with B. dorei reduced the expression of pro-inflammatory cytokines and increased the expression of MHC II, a surface antigen, as well as increasing immunoglobulin diversity, thereby possibly helping reduce the risk of ERE.
Table 4: Abundance (percentage of total mapped reads) of bacterial classes, orders, families or genera, in the caecal microbiota of New Zealand White grower rabbits, which differed significantly between males and females, or rabbits fed control or quercetin-supplemented (2 g/kg) diets.
Overall Diet Sex
Ctrl Qrc SEM P-value Male Female SEM P-valueNo. 12 6 6 6 6Class
Flavobacteriia 0.54 0.56 0.53 0.16 0.90 0.25 0.84 0.16 0.03Order
Flavobacteriales 0.54 0.56 0.53 0.16 0.90 0.25 0.84 0.16 0.03Desulfuromonadales 0.25 0.19 0.32 0.06 0.22 0.14 0.37 0.06 0.04
Family Eubacteriaceae 3.83 3.58 4.07 0.40 0.41 2.93 4.73 0.40 0.01Flavobacteriaceae 0.54 0.56 0.53 0.16 0.90 0.25 0.84 0.16 0.03Geobacteraceae 0.18 0.13 0.23 0.04 0.14 0.09 0.26 0.04 0.02Clostridiales Family XIII. Incertae Sedis 0.012 0.003 0.020 0.003 0.005 0.008 0.015 0.003 0.17
Genus Anaerofustis 0.005 0.000 0.010 0.002 0.003 0.003 0.007 0.002 0.20
Ctrl: Control; Qrc: Quercetin-supplemented; SEM: Standard error of the mean.
EffEct of quErcEtin on caEcal microbiota
World Rabbit Sci. 27: 185-198 195
The prevalence of the genus Ruminococcus concurred with Bäuerl et al. (2014), and R. albus, the most abundant species identified in this genus and 4th most abundant overall, is generally recognised as being one of the main cellulolytic bacteria in the rumen environment and has been previously reported in the rabbit caecum (Abecia et al., 2005; Monteils et al., 2008; Rodríguez-Romero et al., 2013). In contrast, R. gnavus, the fifth most abundant species, does not appear to have been previously detected in rabbits.
The remaining species detected in rabbit caecum were only present at much lower levels (<0.2% of mapped reads), and varied greatly in abundance between individuals.
Correlations with live performance and caecal conditions
Four families had significant, positive correlations with the total weight gain (Table 2), with Eubacteraceae being the most abundant (3.83±0.38% total mapped reads). Similar results have been previously reported for Eubacterium, a genus in the family Eubacteraceae, which correlated positively with the average milk fat yield and residual feed intake (RFI) in dairy cows (Jami et al., 2014). Only Hyphomicrobiaceae was more abundant in rabbits showing lower growth.
Three families correlated negatively with the FCR (Table 2), indicating a beneficial association with feed efficiency. The genus Clostridium, which was the only member of the Clostridiaceae family detected in this study, was not found to significantly correlate with the FCR of dairy cattle (Jami et al., 2014). However, it did have a moderately positive correlation with the RFI, which contrasts with the findings of this study.
A number of families correlated significantly with serum levels of fT3, fT4, GH and cortisol (Table 3). While these specific correlations do not seem to have been previously investigated, and no highly abundant families were involved, such possible interactions have been suggested in previous studies. Specifically, links between the gut microbiota and serum leptin and cortisol levels have been reported (Sanz et al., 2010), and intestinal bacteria are known to deconjugate excreted thyroid hormones, thus allowing their reabsorption and possibly increasing circulating levels (Yen, 2001). However, the existence of these correlations alone does not necessarily indicate a physiological link or causation, and considerable further research is required before any assumptions of a direct link between serum hormones and the gut microbiota can be made.
Considering the known antimicrobial properties of the flavonoids (Cushnie and Lamb, 2005), the predominantly negative correlations with the total flavonoid content of the caecum were unsurprising (Table 2). The negative correlations with Veillonellaceae and Mycoplasmataceae concurred with previous findings that these families decreased in abundance in response to dihydromyricetin (Fan et al., 2018), and an essential oil high in flavonoids (De Nardi et al., 2016), respectively. In contrast, Coriobacteriaceae (class Actinobacteria) was more prevalent in samples with a higher total flavonoid content, concurring with the results of Huang et al. (2016), who found that quercetin, catechin and puerarin had no inhibitory effect on this family.
Few families correlated with the caecal pH (Table 2), with Clostridiales Family XI. Incertae Sedis, Desulfuromonadaceae and Spiroplasmataceae all being more abundant for higher pH values (Table 2). This general preference for a higher pH is in agreement with the known detrimental effects of acidic conditions on rumen microbial function (Russell and Wilson, 1996).
Effects of diet
Only two OTUs differed significantly between the dietary treatment groups, and both made only minimal contributions to the total mapped reads (Table 4). Clostridiales Family XIII. Incertae Sedis was more abundant in the Qrc rabbits, which loosely concurred with previous findings that quercetin increased the abundance of Firmicutes (the phylum to which it belongs), as well as the abundance of another member of the order Clostridiales, Ruminococcaceae (Huang et al., 2016). The genus Anaerofustis, which belongs to the family Eubacteraceae, was also more abundant in the Qrc rabbits (Table 4). This concurred with previous findings for another species within this family, Eubacterium ramulus, which has been found to increase in relative abundance in response to the ingestion of flavonoids, including quercetin (Simmering et al., 2002). This stimulatory effect of flavonoids on the growth of E. ramulus may be linked to its proposed role as a key species responsible for the degradation of flavonoids in the gut (Braune et al., 2001), as

North et al.
World Rabbit Sci. 27: 185-198196
it can use the ingested flavonoids as a substrate for growth (Simmering et al., 2002). A similar interaction may have been responsible for the higher levels of Anaerofustis in the supplemented rabbits found in this study.
The negligible effects of dietary quercetin on the caecal microbiota found in this study, in conjunction with the lack of effect on the caecal total flavonoid content, may have been due to the quercetin aglycone being absorbed from the gut prior to the caecum. As the absorption of flavonoid glycosides in the small intestine has been suggested to be limited by the presence of the sugar moiety, these glycosides may accumulate in the caecum, whereas the aglycone may not (Oteiza et al., 2018).
Effects of sex
The only sex effect on a non-microbiota parameter was on the serum cortisol level, which was much higher in females than males. The same was found for the larger population from which the 12 rabbits used in this study were sampled, as discussed by North et al. (2018). Similar sex differences in serum cortisol levels have been reported in humans (Gunn et al., 2016; Kirschbaum et al., 1992) and a variety of other mammals (Tilbrook et al., 2000; Green & McCormick, 2016).
The most abundant bacterial family to differ between the sexes was Eubacteraceae, which was more prevalent in females than males (Table 4). Considering the versatility of function of this group it is difficult to identify how or whether this would impact the overall health and efficiency of the microbiota (De Vos et al., 2009; Gosalbes et al., 2011). However, as Eubacteraceae did correlate with improvements in weight gain, this sex difference may be linked to the tendency for a higher growth rate in female rabbits towards the end of the growth period, as found by North et al. (2018).
Flavobacteriaceae and Geobacteraceae were also both more abundant in females, with this effect carrying over to the order (Flavobacteriales, Desulfuromonadales) and class (Flavobacteriia) level. Flavobacteraceae has not previously been found to be a major family in the rabbit caecal microbiota, with Bäuerl et al. (2014) only detecting it at very low levels. Badiola et al. (2016) also only detected Flavobacteraceae in younger rabbits (25 or 39 d old), and by 70 d of age it was no longer present. Unfortunately, sex was not reported by Badiola et al. (2016), as it would have been interesting to see whether the evolution in the abundance of Flavobacteraceae with age differed for males and females. Geobacteraceae similarly does not appear to be common species in the gut environment (Bäuerl et al., 2014; Zhu et al., 2015; Badiola et al., 2016).
CONCLUSION
The comparison of the composition of the microbiota found in this study to those in previous research suggested that certain bacterial groups, such as Firmicutes at phylum level and Lachnospiraceae and Ruminococcaceae at family level, are relatively consistently dominant in the rabbit caecum. However, consensus beyond this was extremely limited, even between individuals within this study. This absence of a clear, consistent microbiota profile will present a challenge for any future research attempting to understand or manipulate this population. Nonetheless, the correlations between live performance traits and bacterial families, particularly Eubacteraceae and Clostridiaceae, suggest that further research may be of value. The correlations with serum hormone levels found, while not necessarily suggesting causation, should nonetheless also be kept in mind during future research.
The largely negative correlations between the caecal flavonoid content and the various bacterial families concurred with the antimicrobial properties of these compounds. However, there was a lack of any clear pattern in this relationship between studies, and this correlation did not translate into a difference between the dietary treatment groups, for either the caecal flavonoid content or the caecal microbiota. This minimal effect of diet may have been due to the use of the quercetin-aglycone, which may have been absorbed from the gastrointestinal tract prior to the caecum. Nonetheless, Clostridiales Family XIII. Incertae Sedis and Anaerofustis were both more abundant in the Qrc rabbits, with the latter possibly using the flavonoid as a substrate for growth.
The sex differences largely involved higher levels of OTUs in samples from female rabbits. Eubacteraceae was one of the most abundant families affected by sex, along with Flavobacteriaceae, but in the absence of genus or species-level identification, relating these differences to functional changes in the caecum was not possible.

EffEct of quErcEtin on caEcal microbiota
World Rabbit Sci. 27: 185-198 197
Overall, the practical implications of this study are limited, as is typical of exploratory studies of this kind. However, the information presented provides avenues for further research, and adds to the limited picture of the rabbit caecal microbiota currently available.
Acknowledgements: This research was supported by the South African Research Chairs Initiative (SARChI) and partly funded by the South African Department of Science and Technology (UID number: 84633), as administered by the National Research Foundation (NRF) of South Africa, and partly by the Department of Trade and Industry’s THRIP programme (THRIP/64/19/04/2017) with Wildlife Ranching South Africa as partner. Any opinions, findings and conclusions or recommendations expressed in this material are those of the author(s) and the NRF accepts no liability in this regard. Personal funding for M. K. North was also provided by the NRF, in the form of a Scarce Skills Doctoral Scholarship (UID 102514). The contributions of Prof Martin Kidd, from the Centre for Statistical Consultation at Stellenbosch University, and Ms Alvera Vorster, Senior Analyst of the DNA Sequencing Unit of the Central Analytical Facility of Stellenbosch University, were invaluable.
REFERENCES
Abecia L., Fondevila M., Balcells J., Edwards J.E., Newbold C.J., McEwan N.R. 2005. Molecular profiling of bacterial species in the rabbit caecum. FEMS Microbiol. Lett., 244: 111-115. https://doi.org/10.1016/j.femsle.2005.01.028
Badiola I., de Rozas P., Gonzalez J., Aloy N., Carabaño R. 2016. Recent advances in ERE in growing rabbits. In Proc.: 11th World Rabbit Congress, 15-18 June, 2016. Qingdao, China. 1: 491-502.
Bäuerl C., Collado M.C., Zúñiga M., Blas E., Martínez G.P. 2014. Changes in cecal microbiota and mucosal gene expression revealed new aspects of epizootic rabbit enteropathy. PLoS One, 9: e105707. https://doi.org/10.1371/journal.pone.0105707
Biddle A., Stewart L., Blanchard J., Leschine S. 2013. Untangling the genetic basis of fibrolytic specialization by Lachnospiraceae and Ruminococcaceae in diverse gut communities. Diversity, 5: 627-640. https://doi.org/10.3390/d5030627
Braune A., Gütschow M., Engst W., Blaut M. 2001. Degradation of quercetin and luteolin by Eubacterium ramulus. Appl. Environ. Microbiol., 67: 5558-5567. https://doi.org/10.1128/AEM.67.12.5558-5567.2001
Clench M.H., Mathias J.R. 1995. The avian cecum: A review. Wilson Bull., 107: 93-121. https://www.jstor.org/stable/4163516
Combes S., Fortun-Lamothe L., Cauquil L., Gidenne T. 2013. Engineering the rabbit digestive ecosystem to improve digestive health and efficacy. Animal, 7: 1429-1439. https://doi.org/10.1017/S1751731113001079
Cushnie T.P.T., Lamb A.J. 2005. Antimicrobial activity of flavonoids. Int. J. Antimicrob. Agents, 26: 343-356. https://doi.org/10.1016/j.ijantimicag.2005.09.002
De Nardi R., Marchesini G., Li S., Khafipour E., Plaizier K.J.C., Gianesella M., Ricci R., Andrighetto I., Segato S. 2016. Metagenomic analysis of rumen microbial population in dairy heifers fed a high grain diet supplemented with dicarboxylic acids or polyphenols. BMC Vet. Res., 12: 1-9. https://doi.org/10.1186/s12917-016-0653-4
De Vos P., Garrity G.M., Jones D., Krieg N.R., Ludwig W., Rainey F.A., Schleifer K.-H., Whitman W.B. 2009. Bergey’s Manual of Systematic Bacteriology, Volume 3 — The Firmicutes, 2nd edition. Springer, New York, USA.
Duda-Chodak A. 2012. The inhibitory effect of polyphenols on human gut microbiota. J. Physiol. Pharmacol., 63(5): 497-503.
Espley R.V., Butts C.A., Laing W.A., Martell S., Smith H., McGhie T.K., Zhang J., Paturi G., Hedderley D., Bovy A., Schouten H.J., Putterill J., Allan A.C., Hellens R.P. 2014. Dietary flavonoids from modified apple reduce inflammation markers and modulate gut microbiota in mice. J. Nutr., 144: 146-154. https://doi.org/10.3945/jn.113.182659
Fan L., Zhao X., Tong Q., Zhou X., Chen J., Xiong W., Fang J., Wang W., Shi C. 2018. Interactions of dihydromyricetin, a flavonoid from vine tea (Ampelopsis grossedentata) with gut microbiota. J. Food Sci., 83: 1444-1453. https://doi.org/10.1111/1750-3841.14128
García-Amado M.A., Godoy-Vitorino F., Piceno Y.M., Tom L.M., Andersen G.L., Herrera E.A., Domínguez-Bello M.G. 2012. Bacterial diversity in the cecum of the world’s largest living rodent (Hydrochoerus hydrochaeris ). Microb. Ecol., 63: 719-725. https://doi.org/10.1007/s00248-011-9963-z
Gosalbes M.J., Durbán A., Pignatelli M., Abellan J.J., Jiménez-Hernández N., Pérez-Cobas A.E., Latorre A., Moya A. 2011. Metatranscriptomic approach to analyze the functional human gut microbiota. PLoS One, 6: e17447. https://doi.org/10.1371/journal.pone.0017447
Green M.R., McCormick C.M. 2016. Sex and stress steroids in adolescence: Gonadal regulation of the hypothalamic-pituitary-adrenal axis in the rat. Gen. Comp. Endocrinol., 234: 110-116. https://doi.org/10.1016/j.ygcen.2016.02.004
Gunn P.J., Middleton B., Davies S.K., Revell V.L., Skene D.J. 2016. Sex differences in the circadian profiles of melatonin and cortisol in plasma and urine matrices under constant routine conditions. Chronobiol. Int., 33: 39-50. https://doi.org/10.3109/07420528.2015.1112396
Herald T.J., Gadgil P., Tilley M. 2012. High-throughput micro plate assays for screening flavonoid content and DPPH-scavenging activity in sorghum bran and flour. J. Sci. Food Agric., 92: 2326-2331. https://doi.org/10.1002/jsfa.5633
Huang J., Chen L., Xue B., Liu Q., Ou S., Wang Y., Peng X. 2016. Different flavonoids can shape unique gut microbiota profile in vitro. J. Food Sci., 81: H2273-H2279. https://doi.org/10.1111/1750-3841.13411
Jami E., White B.A., Mizrahi I. 2014. Potential role of the bovine rumen microbiome in modulating milk composition and feed efficiency. PLoS One, 9: e85423. https://doi.org/10.1371/journal.pone.0085423
Kirschbaum C., Wüst S., Hellhammer D. 1992. Consistent sex differences in cortisol responses to psychological stress. Psychosom. Med., 54: 648-657.

North et al.
World Rabbit Sci. 27: 185-198198
Lee H.C., Jenner A.M., Low C.S., Lee Y.K. 2006. Effect of tea phenolics and their aromatic fecal bacterial metabolites on intestinal microbiota. Res. Microbiol., 157: 876-884. https://doi.org/10.1016/j.resmic.2006.07.004
Lin Y.T., Hsui S.L., Hou Y.C., Chen H.Y., Chao P.D.L. 2003. Degradation of flavonoid aglycones by rabbit, rat and human fecal flora. Biol. Pharm. Bull., 26: 747-751. https://doi.org/10.1248/bpb.26.747
Massip K., Combes S., Cauquil L., Zemb O., Gidenne T. 2012. High throughput 16S-DNA sequencing for phylogenetic affiliation of the caecal bacterial community in the rabbit: Impact of the hygiene of housing and of the intake level. In Proc.: 8th INRA-RRI Symposium on Gut Microbiology, 18-21 June, 2012. Clermont-Ferrand, France. 1: 57.
McBee R.H. 1971. Significance of intestinal microflora in herbivory. Annu. Rev. Ecol. Syst., 2: 165-176. https://doi.org/10.1146/annurev.es.02.110171.001121
Michelland R.J., Combes S., Monteils V., Cauquil L., Gidenne T., Fortun-Lamothe L. 2010. Molecular analysis of the bacterial community in digestive tract of rabbit. Anaerobe, 16: 61-65. https://doi.org/10.1016/j.anaerobe.2009.05.002
Monteils V., Cauquil L., Combes S., Godon J.-J., Gidenne T. 2008. Potential core species and satellite species in the bacterial community within the rabbit caecum. FEMS Microbiol. Ecol., 66: 620-629. https://doi.org/10.1111/j.1574-6941.2008.00611.x
North M.K., Dalle Zotte A., Hoffman L.C. 2018. Effect of quercetin supplementation on the growth, feed efficiency and serum hormone levels of New Zealand White rabbits. S. Afr. J. Anim. Sci., 48: 1128-1139. https://www.ajol.info/index.php/sajas/article/view/183157. Accessed: May 2019.
Oteiza P.I., Fraga C.G., Mills D.A., Taft D.H. 2018. Flavonoids and the gastrointestinal tract: Local and systemic effects. Mol. Aspects Med., 61: 41-49. https://doi.org/10.1016/j.mam.2018.01.001
Rodríguez-Romero N., Abecia L., Fondevila M. 2013. Microbial ecosystem and fermentation traits in the caecum of growing rabbits given diets varying in neutral detergent soluble and insoluble fibre levels. Anaerobe, 20: 50-57. https://doi.org/10.1016/j.anaerobe.2013.02.001
Russell J.B., Wilson D.B. 1996. Why are ruminal cellulolytic bacteria unable to digest cellulose at low pH? J. Dairy Sci., 79: 1503-1509. https://doi.org/10.3168/jds.S0022-0302(96)76510-4
Salanitro J.P., Muirhead P.A., Goodman J.R. 1976. Morphological and physiological characteristics of Gemmiger formicilis isolated from chicken ceca. Appl. Environ. Microbiol., 32: 623-632. https://aem.asm.org/content/32/4/623.short. Accessed: May 2019.
Sanz Y., Santacruz A., Gauffin P. 2010. Gut microbiota in obesity and metabolic disorders. Proc. Nutr. Soc., 69: 434-441. https://doi.org/10.1017/S0029665110001813
Simmering R., Pforte H., Jacobasch G., Blaut M. 2002. The growth of the flavonoid-degrading intestinal bacterium, Eubacterium ramulus, is stimulated by dietary flavonoids in vivo. FEMS Microbiol. Ecol., 40: 243-248. https://doi.org/10.1111/j.1574-6941.2002.tb00957.x
Sirotek K., Marounek M., Rada V., Benda V. 2001. Isolation and characterization of rabbit caecal pectinolytic bacteria. Folia Microbiol., 46: 79-82. https://doi.org/10.1007/BF02825893
Steelman S.M., Chowdhary B.P., Dowd S., Suchodolski J., Janečka J.E. 2012. Pyrosequencing of 16S rRNA genes in fecal samples reveals high diversity of hindgut microflora in horses and potential links to chronic laminitis. BMC Vet. Res., 8: 231. https://doi.org/10.1186/1746-6148-8-231
Tilbrook A.J., Turner A.I., Clarke I.J. 2000. Effects of stress on reproduction in non-rodent mammals: The role of glucocorticoids and sex differences. Rev. Reprod., 5: 105-113. https://doi.org/10.1530/ror.0.0050105
Vasantha Rupasinghe H.P., Wang L., Huber G.M., Pitts N.L. 2008. Effect of baking on dietary fibre and phenolics of muffins incorporated with apple skin powder. Food Chem., 107: 1217-1224. https://doi.org/10.1016/j.foodchem.2007.09.057
Yen P.M. 2001. Physiological and molecular basis of thyroid hormone action. Physiol. Rev., 81: 1097-1142. https://doi.org/10.1152/physrev.2001.81.3.1097
Zhu Y., Wang C., Li F. 2015. Impact of dietary fiber/starch ratio in shaping caecal microbiota in rabbits. Can. J. Microbiol., 61: 771-784. https://doi.org/10.1139/cjm-2015-0201

![Mucosal microbiota and metabolome along the intestinal ... · microbiota through fermentation of complex carbohydrates [13]. Without a functional microbiota, the colon epithelia undergo](https://img.pdfslide.us/doc/110x75/5f430db1384e9c41ca5af5ab/mucosal-microbiota-and-metabolome-along-the-intestinal-microbiota-through-fermentation.jpg)


![Histological Study of the Caecal Tonsil in the Cecum of 4 ... · Since caecal tonsil activity depends on the activity of bursa of fabricious and thymus[9,10] and since bursa of fabricious](https://img.pdfslide.us/doc/110x75/5d4058e488c99377448c267c/histological-study-of-the-caecal-tonsil-in-the-cecum-of-4-since-caecal-tonsil.jpg)