Embed Size (px)
Citation preview
2211-601X © 2015 The Authors. Published by Elsevier Ltd. This is an open access article under the CC BY-NC-ND license (http://creativecommons.org/licenses/by-nc-nd/4.0/).Peer-review under responsibility of the organizing committee of Indonesian Food Technologist Communitydoi: 10.1016/j.profoo.2015.01.022
Available online at www.sciencedirect.com
ScienceDirect
Procedia Food Science 3 ( 2015 ) 200 – 210
* Corresponding author. Email : [email protected]
The First International Symposium on Food and Agro-biodiversity (ISFA2014)
Composition and Isolation of Lactoferrin from Colostrum and Milk of Various Goat Breeds
Agus Bahar Rachmana*, Rarah RA Maheswarib, Mirnawati S Bachroemc
aAnimal Science Department, Faculty of Agriculture, State University of Gorontalo
bFaculty of Animal Science, Bogor Agricultural University cFaculty of Veterinary Medicine, Bogor Agricultural University
Abstract
Dairy goats colostrum is one of lactoferrin source which has various benefits such as antimicrobial activity. The samples of colostrum and milk are samples of three breeds of goats. The highest concentration of lactoferrin in colostrum and milk is 88.70±12.11 mg/l for saanen goats crosses with PE goats (SAPE), with approximately molecular mass of lactoferrin is 83,513.3 Dalton and the last is 72.57±23.61 mg/l for peranakan etawah (PE), with approximately molecular mass of lactoferrin is 86,075.4 Dalton. These results have important information as a basic knowledge of the value of the concentration of lactoferrin in goat breeds.
© 2014 The Authors. Published by Elsevier Ltd. Peer-review under responsibility of the organizing committee of Indonesian Food Technologist Community Keywords: Isolation, Lactoferrin, Colostrum, Milk, Goat, Breeds
Introduction
Goats are one of the types of animals that potentially developed into a producer of meat and milk in Indonesia. Several types of dairy goats breeds that can be developed in Indonesia, among others Peranakan Etawah goats (PE), Jawarandu goat and Saanen goats crosses with PE goats
© 2015 The Authors. Published by Elsevier Ltd. This is an open access article under the CC BY-NC-ND license (http://creativecommons.org/licenses/by-nc-nd/4.0/).Peer-review under responsibility of the organizing committee of Indonesian Food Technologist Community
201 Agus Bahar Rachman et al. / Procedia Food Science 3 ( 2015 ) 200 – 210
(SAPE). Maintenance of dairy goats could provide valuable animal protein of high biological and essential minerals and vitamins from cattle. According to comprehensive studies it was established [12] that goat's milk has a nutritional value similar to cow's milk and can be used as an alternative to cow's milk for the rehabilitation of children, who suffer from poor nutrition. Goat colostrum lactoferrin concentration is higher than cow's milk, which ranged from 455.8 to 2058.3 mg / dl on goat colostrum and 575.0 mg / dl in bovine colostrum [7]. Goat colostrum lactoferrin concentration is high due to the quantity of goat colostrum produced. The higher the quantity of colostrum, then the quality will be reduced, in terms of dry matter high goat colostrum, which ranged between 25.43 to 38.96%, while the dry matter 18.30% bovine colostrum[11].
Goat's milk has a milk components such as lactoferrin, immunoglobulins and lactoperoxidase as an anti-microbial. Lactoferrin in milk are able to bind metal ions on the microbes that inhibit microbial growth. Lactoferrin can be used for enrichment or fortification of milk. High levels of lactoferrin in milk will improve the quality of milk, especially microbiological quality and value to milk as a functional food. Based on the function of proteins chemically, then there are two possible physiological functions of lactoferrin, namely: 1) as a source of iron for infants / children and 2) a potential antimicrobial factors in the milk ducts in the digestive tract and baby / children [2,5,6]
Colostrum also called "mother's milk" is a light yellow solution produced by glands udder during the first hour after birth, usually began to be produced before birth and collected over the last few weeks of pregnancy [3] Colostrum is stored by the udder glands around 2-3 last day of gestation and secreted approximately 2-3 first days after birth. Colostrum is no longer produced at 4-5 days after birth, then there will be changes in the colostrum into milk completely [3] Colostrum has a serum protein content is very high and often still contained blood [16]. The things that affect levels of lactoferrin in colostrum generally include 1) day milking, colostrum has a higher lactoferrin levels (575.0 mg / dl in colostrum of cows and 459.4 mg / dl in cow's milk) [7], 2) presence or absence of bacterial infection [15], and 3) Genetic animal itself [14].
Preliminary studies that identify the presence of lactoferrin in milk goat “kacang”, and goat colostrum and milk have been conducted [10]. The results of these studies indicate that lactoferrin band has gained a molecular weight of 73.441 kDa for goat milk and “kacang’ goat milk whereas for colostrum peranakan etawah (PE) goats molecular weight of 74.991 kDa were obtained. However, information on the isolation of lactoferrin contained in colostrum and milk from various dairy goats breeds is still very limited. This study aims to (1) Studying the influence of the chemical composition of colostrum and milk of goats breeds Peranakan Etawah (PE), Jawarandu and Saanen goats crosses with PE goats (SAPE), including dry matter content, non fat dry matter, protein, specific gravity, and pH on lactoferrin to be identified, (2) Perform insulation lactoferrin from colostrum and goat milk to obtain isolates lactoferrin, and (3) Identify the presence of lactoferrin to determine the concentration and lactoferrin content in colostrum and milk goats were studied.
Materials & Methods This research used colostrum and milk from the Peranakan Etawah goats (PE), Jawarandu, and Saanen goats crosses with PE goats (SAPE) that were obtained from local farm. The method of research was Completely Randomize Design (RAL) factorial pattern (3×8) with three repetition treatments to the various species of goats and different days of milking. Colostrum
202 Agus Bahar Rachman et al. / Procedia Food Science 3 ( 2015 ) 200 – 210
samples used 150 ml with the result of milking days 1 (H1), day 2 (H2) and day 3 (H3), whereas for the samples of milk used 250 ml with the results of milking day 4 (H4) up to day 8 (H8), stored at 50C for 6 months were studied. The methods of research such as milk and colostrum quality test (test of specific gravity, test of milk fat content (methods gerber), test of levels of protein milk, and test of pH value); separation fat and casein; isolate of whey protein, lactoferrin concentration calculation, determination of content lactoferrin by sodium dodecyl sulphate polyacrylamide gel electrophoresis (SDS-PAGE) Results and Discussions
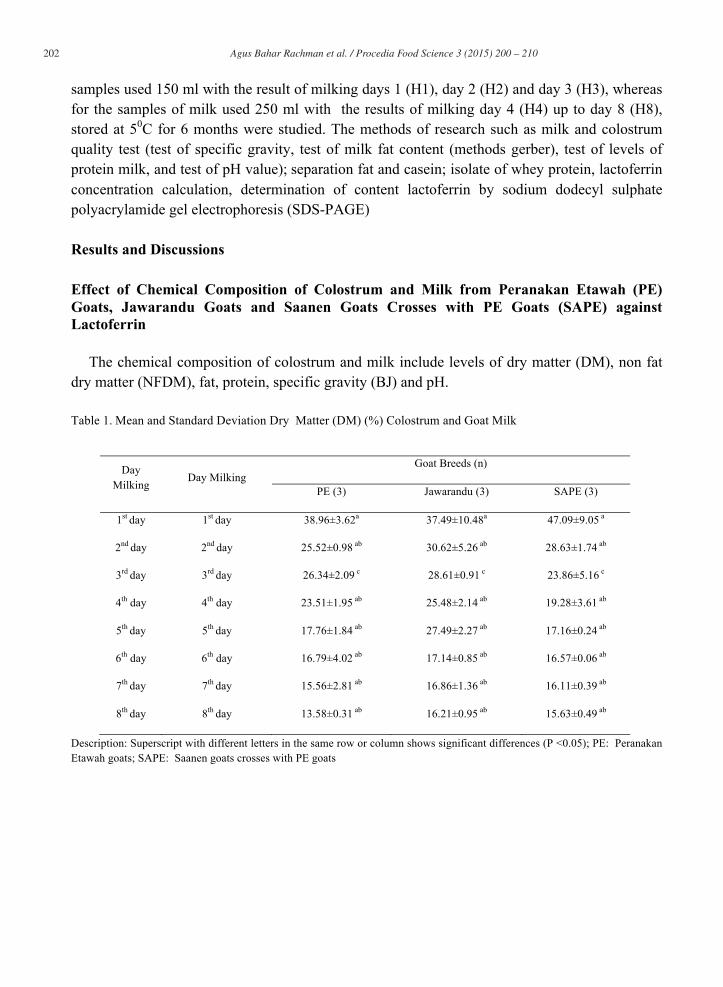
Effect of Chemical Composition of Colostrum and Milk from Peranakan Etawah (PE) Goats, Jawarandu Goats and Saanen Goats Crosses with PE Goats (SAPE) against Lactoferrin The chemical composition of colostrum and milk include levels of dry matter (DM), non fat dry matter (NFDM), fat, protein, specific gravity (BJ) and pH. Table 1. Mean and Standard Deviation Dry Matter (DM) (%) Colostrum and Goat Milk
Description: Superscript with different letters in the same row or column shows significant differences (P <0.05); PE: Peranakan Etawah goats; SAPE: Saanen goats crosses with PE goats
Day Milking
Day Milking Goat Breeds (n)
PE (3) Jawarandu (3) SAPE (3)
1st day 1st day 38.96±3.62a 37.49±10.48a 47.09±9.05 a
2nd day 2nd day 25.52±0.98 ab 30.62±5.26 ab 28.63±1.74 ab
3rd day 3rd day 26.34±2.09 c 28.61±0.91 c 23.86±5.16 c
4th day 4th day 23.51±1.95 ab 25.48±2.14 ab 19.28±3.61 ab
5th day 5th day 17.76±1.84 ab 27.49±2.27 ab 17.16±0.24 ab
6th day 6th day 16.79±4.02 ab 17.14±0.85 ab 16.57±0.06 ab
7th day 7th day 15.56±2.81 ab 16.86±1.36 ab 16.11±0.39 ab
8th day 8th day 13.58±0.31 ab 16.21±0.95 ab 15.63±0.49 ab
203 Agus Bahar Rachman et al. / Procedia Food Science 3 ( 2015 ) 200 – 210
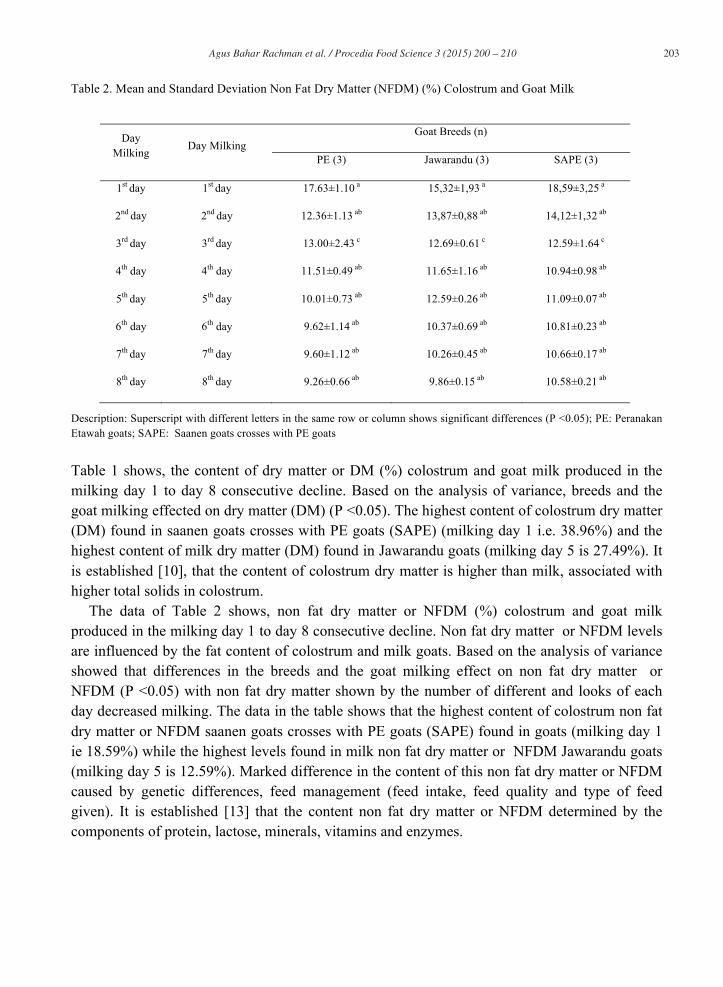
Table 2. Mean and Standard Deviation Non Fat Dry Matter (NFDM) (%) Colostrum and Goat Milk
Description: Superscript with different letters in the same row or column shows significant differences (P <0.05); PE: Peranakan Etawah goats; SAPE: Saanen goats crosses with PE goats Table 1 shows, the content of dry matter or DM (%) colostrum and goat milk produced in the milking day 1 to day 8 consecutive decline. Based on the analysis of variance, breeds and the goat milking effected on dry matter (DM) (P <0.05). The highest content of colostrum dry matter (DM) found in saanen goats crosses with PE goats (SAPE) (milking day 1 i.e. 38.96%) and the highest content of milk dry matter (DM) found in Jawarandu goats (milking day 5 is 27.49%). It is established [10], that the content of colostrum dry matter is higher than milk, associated with higher total solids in colostrum. The data of Table 2 shows, non fat dry matter or NFDM (%) colostrum and goat milk produced in the milking day 1 to day 8 consecutive decline. Non fat dry matter or NFDM levels are influenced by the fat content of colostrum and milk goats. Based on the analysis of variance showed that differences in the breeds and the goat milking effect on non fat dry matter or NFDM (P <0.05) with non fat dry matter shown by the number of different and looks of each day decreased milking. The data in the table shows that the highest content of colostrum non fat dry matter or NFDM saanen goats crosses with PE goats (SAPE) found in goats (milking day 1 ie 18.59%) while the highest levels found in milk non fat dry matter or NFDM Jawarandu goats (milking day 5 is 12.59%). Marked difference in the content of this non fat dry matter or NFDM caused by genetic differences, feed management (feed intake, feed quality and type of feed given). It is established [13] that the content non fat dry matter or NFDM determined by the components of protein, lactose, minerals, vitamins and enzymes.
Day Milking Day Milking
Goat Breeds (n)
PE (3) Jawarandu (3) SAPE (3)
1st day 1st day 17.63±1.10 a 15,32±1,93 a 18,59±3,25 a
2nd day 2nd day 12.36±1.13 ab 13,87±0,88 ab 14,12±1,32 ab
3rd day 3rd day 13.00±2.43 c 12.69±0.61 c 12.59±1.64 c
4th day 4th day 11.51±0.49 ab 11.65±1.16 ab 10.94±0.98 ab
5th day 5th day 10.01±0.73 ab 12.59±0.26 ab 11.09±0.07 ab
6th day 6th day 9.62±1.14 ab 10.37±0.69 ab 10.81±0.23 ab
7th day 7th day 9.60±1.12 ab 10.26±0.45 ab 10.66±0.17 ab
8th day 8th day 9.26±0.66 ab 9.86±0.15 ab 10.58±0.21 ab
204 Agus Bahar Rachman et al. / Procedia Food Science 3 ( 2015 ) 200 – 210
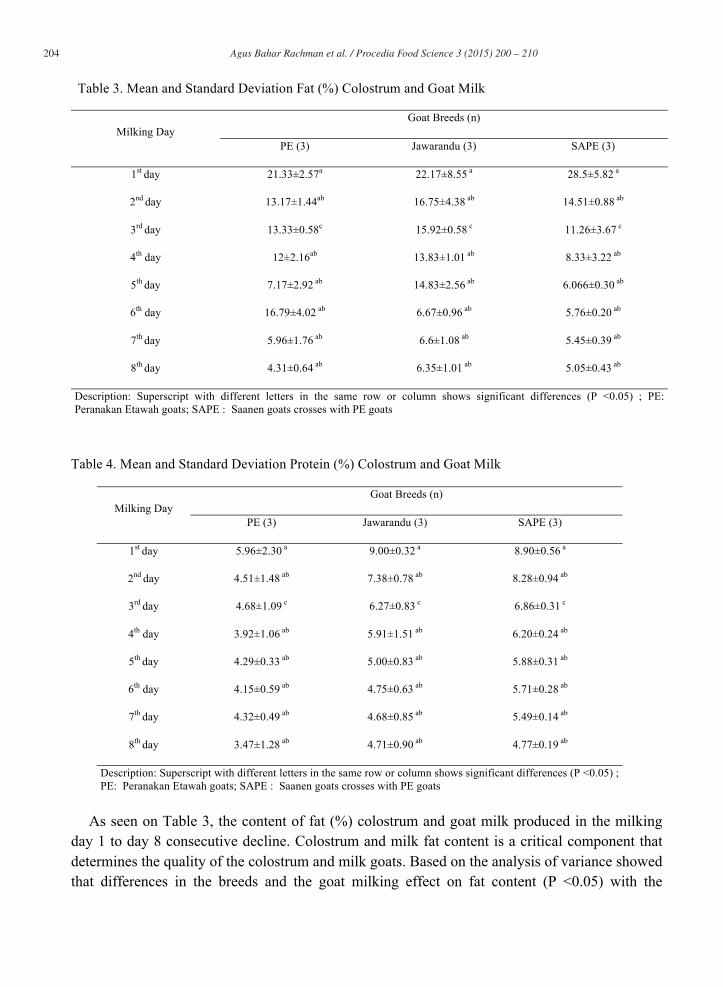
Table 3. Mean and Standard Deviation Fat (%) Colostrum and Goat Milk
Milking Day Goat Breeds (n)
PE (3) Jawarandu (3) SAPE (3)
1st day 21.33±2.57a 22.17±8.55 a 28.5±5.82 a
2nd day 13.17±1.44ab 16.75±4.38 ab 14.51±0.88 ab
3rd day 13.33±0.58c 15.92±0.58 c 11.26±3.67 c
4th day 12±2.16ab 13.83±1.01 ab 8.33±3.22 ab
5th day 7.17±2.92 ab 14.83±2.56 ab 6.066±0.30 ab
6th day 16.79±4.02 ab 6.67±0.96 ab 5.76±0.20 ab
7th day 5.96±1.76 ab 6.6±1.08 ab 5.45±0.39 ab
8th day 4.31±0.64 ab 6.35±1.01 ab 5.05±0.43 ab
Description: Superscript with different letters in the same row or column shows significant differences (P <0.05) ; PE: Peranakan Etawah goats; SAPE : Saanen goats crosses with PE goats Table 4. Mean and Standard Deviation Protein (%) Colostrum and Goat Milk
Milking Day Goat Breeds (n)
PE (3) Jawarandu (3) SAPE (3)
1st day 5.96±2.30 a 9.00±0.32 a 8.90±0.56 a
2nd day 4.51±1.48 ab 7.38±0.78 ab 8.28±0.94 ab
3rd day 4.68±1.09 c 6.27±0.83 c 6.86±0.31 c
4th day 3.92±1.06 ab 5.91±1.51 ab 6.20±0.24 ab
5th day 4.29±0.33 ab 5.00±0.83 ab 5.88±0.31 ab
6th day 4.15±0.59 ab 4.75±0.63 ab 5.71±0.28 ab
7th day 4.32±0.49 ab 4.68±0.85 ab 5.49±0.14 ab
8th day 3.47±1.28 ab 4.71±0.90 ab 4.77±0.19 ab
Description: Superscript with different letters in the same row or column shows significant differences (P <0.05) ; PE: Peranakan Etawah goats; SAPE : Saanen goats crosses with PE goats
As seen on Table 3, the content of fat (%) colostrum and goat milk produced in the milking day 1 to day 8 consecutive decline. Colostrum and milk fat content is a critical component that determines the quality of the colostrum and milk goats. Based on the analysis of variance showed that differences in the breeds and the goat milking effect on fat content (P <0.05) with the
205 Agus Bahar Rachman et al. / Procedia Food Science 3 ( 2015 ) 200 – 210
amount indicated by the different fat content of each breeds and seen goats decreased on each day milking. The data in the table show that the fat content of colostrum is highest in saanen goat crosses with PE goats (SAPE) (milking day 1 ie 28.50%) while the highest content of milk fat contained in Jawarandu goats (milking day 5 is 14.83%). It can be caused by a change in the normal colostrum into milk so the longer the time milking the fat content decreased. It is estbalished [3] that colostrum is not produced again 4-5 days after birth, then there will be changes in the colostrum into milk completely. It is established [9] that a milk fat content and dry matter less than colostrum. The data in Table 4 shows, the content of protein (%) colostrum and goat milk produced in the milking day 1 to day 8 consecutive decline. The protein content is an important component that determines the concentration of lactoferrin in colostrum and milk goats. Based on the analysis of variance showed that differences in the breeds and the milking goats influenced the protein content (P <0.05) indicated by the number of different protein content of each breeds and seen goats decreased on each day milking. The data in the table show that colostrum contains the highest protein levels found in Jawarandu goats (milking day 1 which is 9%) while the highest content of milk protein content found in saanen goats crosses PE goats (SAPE) (milking day 5 is 14.83%). It is established [9] that the levels of protein in the initial milking higher than normal milk completely. This is due to the protein content of forages is quite low.
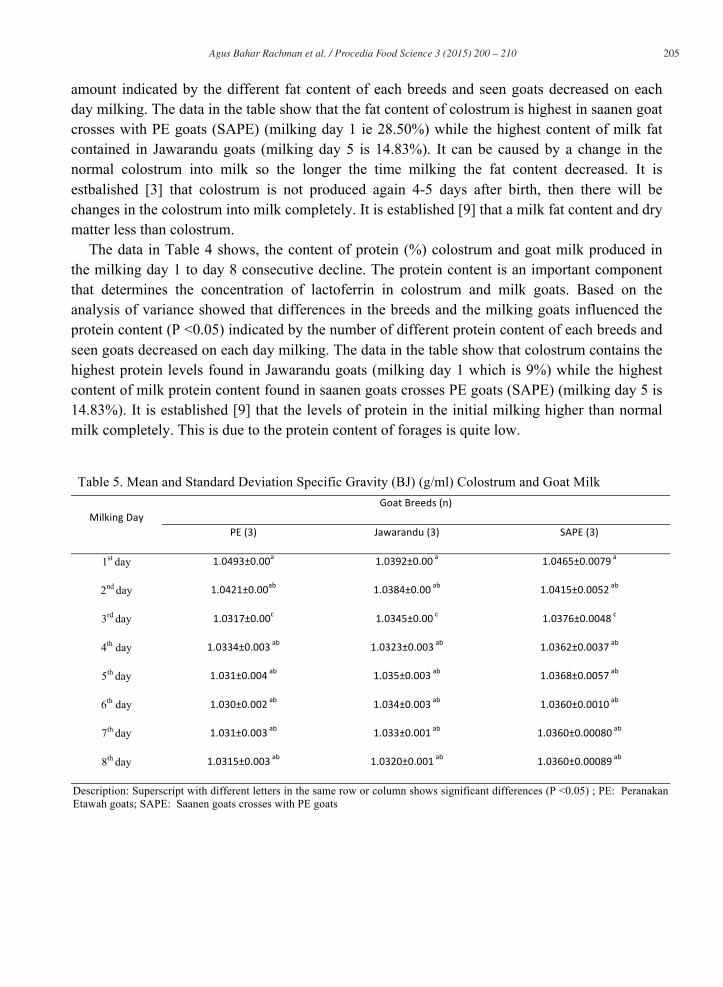
Table 5. Mean and Standard Deviation Specific Gravity (BJ) (g/ml) Colostrum and Goat Milk
1st day
2nd day
3rd day
4th day
5th day
6th day
7th day
8th day
Description: Superscript with different letters in the same row or column shows significant differences (P <0.05) ; PE: Peranakan Etawah goats; SAPE: Saanen goats crosses with PE goats
206 Agus Bahar Rachman et al. / Procedia Food Science 3 ( 2015 ) 200 – 210
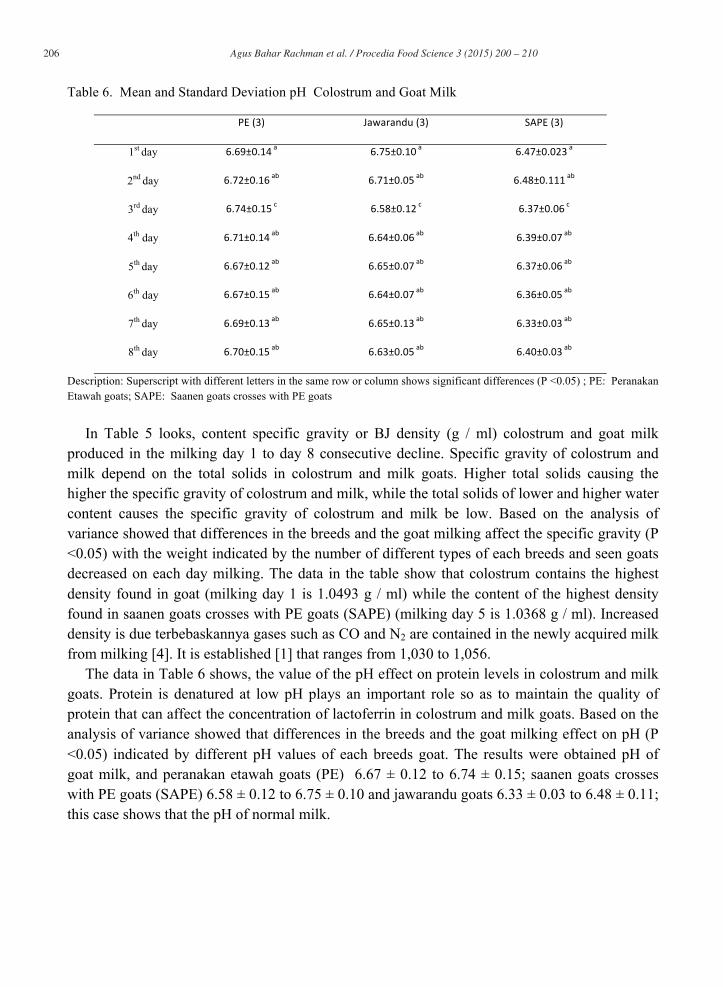
Table 6. Mean and Standard Deviation pH Colostrum and Goat Milk
1st day
2nd day
3rd day
4th day
5th day
6th day
7th day
8th day
Description: Superscript with different letters in the same row or column shows significant differences (P <0.05) ; PE: Peranakan Etawah goats; SAPE: Saanen goats crosses with PE goats In Table 5 looks, content specific gravity or BJ density (g / ml) colostrum and goat milk produced in the milking day 1 to day 8 consecutive decline. Specific gravity of colostrum and milk depend on the total solids in colostrum and milk goats. Higher total solids causing the higher the specific gravity of colostrum and milk, while the total solids of lower and higher water content causes the specific gravity of colostrum and milk be low. Based on the analysis of variance showed that differences in the breeds and the goat milking affect the specific gravity (P <0.05) with the weight indicated by the number of different types of each breeds and seen goats decreased on each day milking. The data in the table show that colostrum contains the highest density found in goat (milking day 1 is 1.0493 g / ml) while the content of the highest density found in saanen goats crosses with PE goats (SAPE) (milking day 5 is 1.0368 g / ml). Increased density is due terbebaskannya gases such as CO and N2 are contained in the newly acquired milk from milking [4]. It is established [1] that ranges from 1,030 to 1,056. The data in Table 6 shows, the value of the pH effect on protein levels in colostrum and milk goats. Protein is denatured at low pH plays an important role so as to maintain the quality of protein that can affect the concentration of lactoferrin in colostrum and milk goats. Based on the analysis of variance showed that differences in the breeds and the goat milking effect on pH (P <0.05) indicated by different pH values of each breeds goat. The results were obtained pH of goat milk, and peranakan etawah goats (PE) 6.67 ± 0.12 to 6.74 ± 0.15; saanen goats crosses with PE goats (SAPE) 6.58 ± 0.12 to 6.75 ± 0.10 and jawarandu goats 6.33 ± 0.03 to 6.48 ± 0.11; this case shows that the pH of normal milk.
207 Agus Bahar Rachman et al. / Procedia Food Science 3 ( 2015 ) 200 – 210
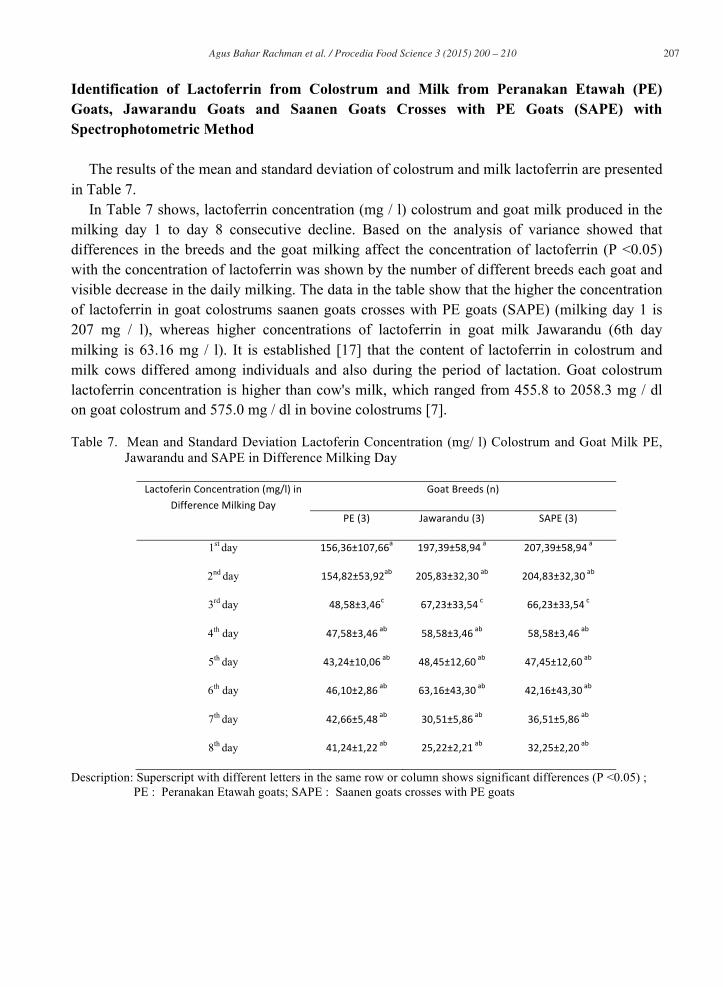
Identification of Lactoferrin from Colostrum and Milk from Peranakan Etawah (PE) Goats, Jawarandu Goats and Saanen Goats Crosses with PE Goats (SAPE) with Spectrophotometric Method The results of the mean and standard deviation of colostrum and milk lactoferrin are presented in Table 7. In Table 7 shows, lactoferrin concentration (mg / l) colostrum and goat milk produced in the milking day 1 to day 8 consecutive decline. Based on the analysis of variance showed that differences in the breeds and the goat milking affect the concentration of lactoferrin (P <0.05) with the concentration of lactoferrin was shown by the number of different breeds each goat and visible decrease in the daily milking. The data in the table show that the higher the concentration of lactoferrin in goat colostrums saanen goats crosses with PE goats (SAPE) (milking day 1 is 207 mg / l), whereas higher concentrations of lactoferrin in goat milk Jawarandu (6th day milking is 63.16 mg / l). It is established [17] that the content of lactoferrin in colostrum and milk cows differed among individuals and also during the period of lactation. Goat colostrum lactoferrin concentration is higher than cow's milk, which ranged from 455.8 to 2058.3 mg / dl on goat colostrum and 575.0 mg / dl in bovine colostrums [7].
Table 7. Mean and Standard Deviation Lactoferin Concentration (mg/ l) Colostrum and Goat Milk PE, Jawarandu and SAPE in Difference Milking Day
1st day
2nd day
3rd day
4th day
5th day
6th day
7th day
8th day
Description: Superscript with different letters in the same row or column shows significant differences (P <0.05) ; PE : Peranakan Etawah goats; SAPE : Saanen goats crosses with PE goats
208 Agus Bahar Rachman et al. / Procedia Food Science 3 ( 2015 ) 200 – 210
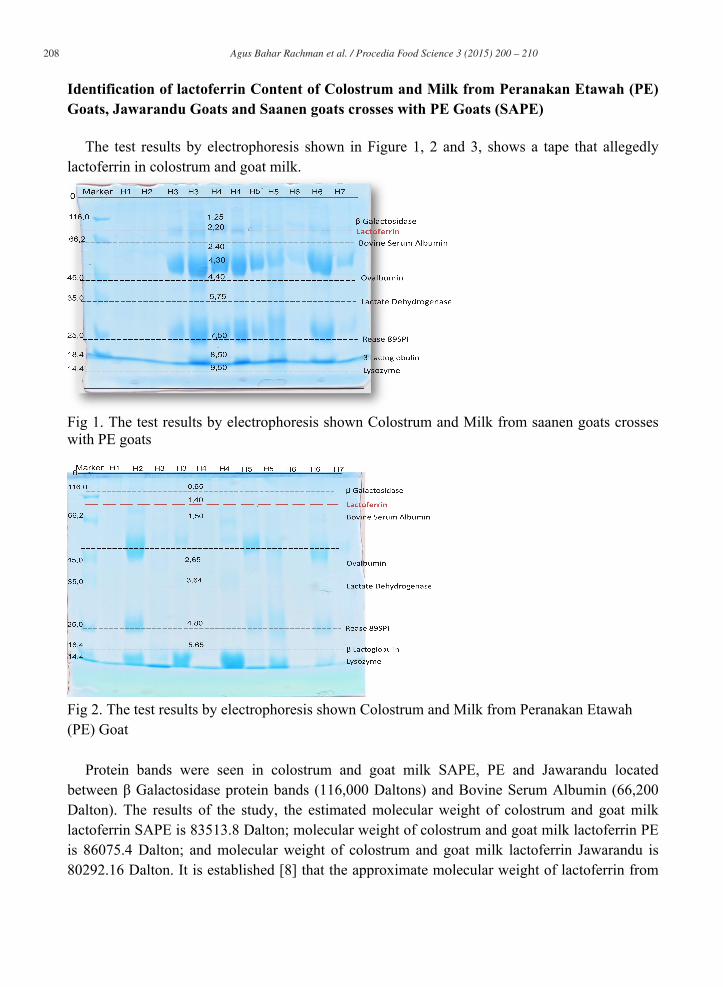
Identification of lactoferrin Content of Colostrum and Milk from Peranakan Etawah (PE) Goats, Jawarandu Goats and Saanen goats crosses with PE Goats (SAPE) The test results by electrophoresis shown in Figure 1, 2 and 3, shows a tape that allegedly lactoferrin in colostrum and goat milk.
Fig 1. The test results by electrophoresis shown Colostrum and Milk from saanen goats crosses with PE goats
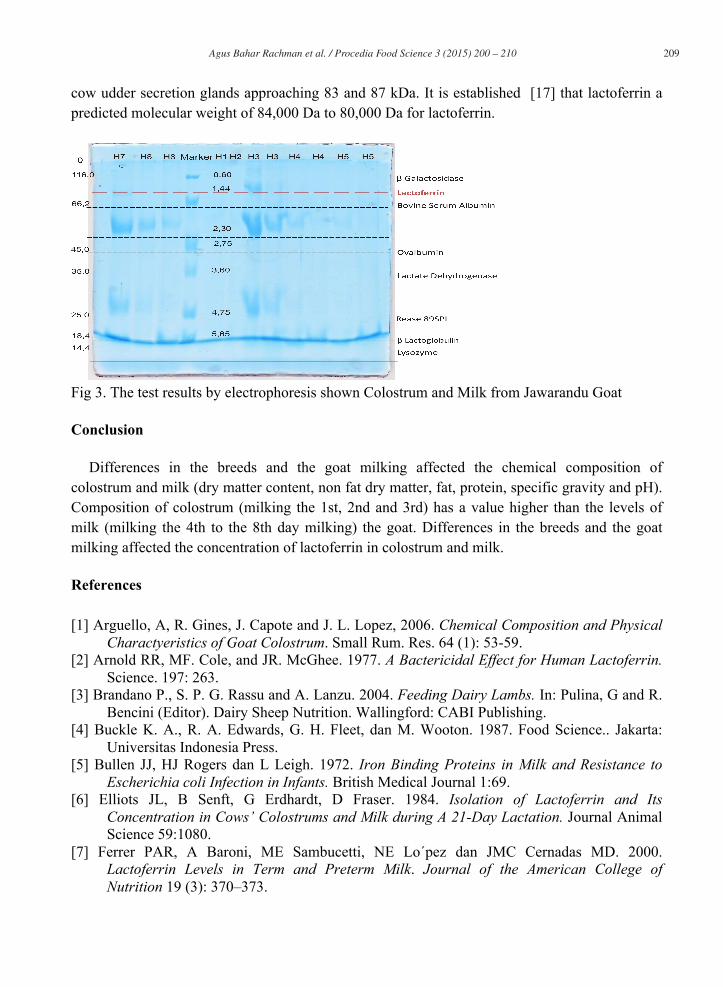
Fig 2. The test results by electrophoresis shown Colostrum and Milk from Peranakan Etawah (PE) Goat Protein bands were seen in colostrum and goat milk SAPE, PE and Jawarandu located between β Galactosidase protein bands (116,000 Daltons) and Bovine Serum Albumin (66,200 Dalton). The results of the study, the estimated molecular weight of colostrum and goat milk lactoferrin SAPE is 83513.8 Dalton; molecular weight of colostrum and goat milk lactoferrin PE is 86075.4 Dalton; and molecular weight of colostrum and goat milk lactoferrin Jawarandu is 80292.16 Dalton. It is established [8] that the approximate molecular weight of lactoferrin from
209 Agus Bahar Rachman et al. / Procedia Food Science 3 ( 2015 ) 200 – 210
cow udder secretion glands approaching 83 and 87 kDa. It is established [17] that lactoferrin a predicted molecular weight of 84,000 Da to 80,000 Da for lactoferrin.
Fig 3. The test results by electrophoresis shown Colostrum and Milk from Jawarandu Goat Conclusion Differences in the breeds and the goat milking affected the chemical composition of colostrum and milk (dry matter content, non fat dry matter, fat, protein, specific gravity and pH). Composition of colostrum (milking the 1st, 2nd and 3rd) has a value higher than the levels of milk (milking the 4th to the 8th day milking) the goat. Differences in the breeds and the goat milking affected the concentration of lactoferrin in colostrum and milk. References [1] Arguello, A, R. Gines, J. Capote and J. L. Lopez, 2006. Chemical Composition and Physical
Charactyeristics of Goat Colostrum. Small Rum. Res. 64 (1): 53-59. [2] Arnold RR, MF. Cole, and JR. McGhee. 1977. A Bactericidal Effect for Human Lactoferrin.
Science. 197: 263. [3] Brandano P., S. P. G. Rassu and A. Lanzu. 2004. Feeding Dairy Lambs. In: Pulina, G and R.
Bencini (Editor). Dairy Sheep Nutrition. Wallingford: CABI Publishing. [4] Buckle K. A., R. A. Edwards, G. H. Fleet, dan M. Wooton. 1987. Food Science.. Jakarta:
Universitas Indonesia Press. [5] Bullen JJ, HJ Rogers dan L Leigh. 1972. Iron Binding Proteins in Milk and Resistance to
Escherichia coli Infection in Infants. British Medical Journal 1:69. [6] Elliots JL, B Senft, G Erdhardt, D Fraser. 1984. Isolation of Lactoferrin and Its
Concentration in Cows’ Colostrums and Milk during A 21-Day Lactation. Journal Animal Science 59:1080.
[7] Ferrer PAR, A Baroni, ME Sambucetti, NE Lo´pez dan JMC Cernadas MD. 2000. Lactoferrin Levels in Term and Preterm Milk. Journal of the American College of Nutrition 19 (3): 370–373.
210 Agus Bahar Rachman et al. / Procedia Food Science 3 ( 2015 ) 200 – 210
[8] Hurley, W. L., R. C. J. Grieve, C. E. Magura, H. M. Hegarty and S. Zou. 1993. Electrophoretic Comparisons of Lactoferrin from Bovine Mammary Secretions, Milk Neutrophils and Human Milk. Journal of Diary Science. 76: 377-387.
[9] Johnson, A. H. 1972. The Composition of Milk. In: B. H. Webb, A. H. Jonson dan J. A. Alford (Editors). Fundamental of Dairy Chemistry Second Edition. Connecticut: The AVI Publishing Company, Inc.
[10] Maheswari RRA, C Sumantri, A. Farajallah. 2006. Based Research Proposal. Department of Research and Community Development. Bogor: Bogor Agricultural University.
[11] Ontsouka CE, RM Bruckmaler, JW Blum. 2003. Fractionized Milk Composition during Removal of Colostrums and Mature Milk. Journal of Dairy Science 86: 2005-2011.
[12] Razafindrakoto et al. 1994. Goat's Milk as a Substitute for Cow's Milk in Undernourished Children: A Randomized Double-Blind Clinical Trial. Journal of Dairy Science. 94(1): 65-69.
[13] Ressang, A. Z. dan A. M. Nasution. 1982. Book of Medical of Dairy. Bogor Agricultural University.
[14] Sumantri, C. 2006. Gen of Dairy Production Control with High Content of Lactoferrin in Friesian Holstein Cow. Wartazoa 16 (2): 72-81.
[15] Tsuji, S., Y. Hirata dan F Mukai. 1990. Comparison of Lactoferrin Content in Colostrum between Different Cattle Breeds. Journal of Dairy Science 73:125-128.
[16] Walstra P, R. Jenness. 1984. Dairy Chemistry and Phisics. Canada: John Wiley and Sons, Inc.
[17] Yoshida S, Z Wei, Y Shinmura, N Fukunaga. 2000. Separation of Lactoferrin-a and -b from Bovine Colostrum. Journal of Dairy Science. 83:2211–2215.
Presented at ISFA (September 16-17, 2014Semarang, Indonesia) as paper #64,”Managing Biosafety and Biodiversity of Food from Local to Global Industries”