Embed Size (px)
Citation preview

Composites Science and Technology 83 (2013) 11–21
Contents lists available at SciVerse ScienceDirect
Composites Science and Technology
journal homepage: www.elsevier .com/ locate/compsci tech
Damage quantification in polymer composites using a hybrid NDTapproach
0266-3538/$ - see front matter � 2013 Elsevier Ltd. All rights reserved.http://dx.doi.org/10.1016/j.compscitech.2013.04.013
⇑ Corresponding author. Tel.: +1 215 895 2297; fax: +1 215 895 1478.E-mail address: [email protected] (A. Kontsos).
Jefferson Cuadra a, Prashanth A. Vanniamparambil a, Kavan Hazeli a, Ivan Bartoli b, Antonios Kontsos a,⇑a Mechanical Engineering & Mechanics Department, Drexel University, Philadelphia, PA, United Statesb Civil, Architectural and Environmental Engineering Department, Drexel University, Philadelphia, PA, United States
a r t i c l e i n f o
Article history:Received 15 October 2012Received in revised form 10 March 2013Accepted 17 April 2013Available online 25 April 2013
Keywords:A. Polymer–matrix composites (PMCs)C. Damage mechanicsD. Non-destructive testingD. Acoustic emissionDigital image correlation
a b s t r a c t
Damage is an inherently dynamic and multi-scale process. Of interest herein is the monitoring and quan-tification of progressive damage accumulation in a newly developed glass fiber reinforced polymer com-posite subjected to both tensile and fatigue loading conditions. To achieve this goal, the potential of datafusion in structural damage detection, identification and remaining-life estimation is investigated byintegrating heterogeneous monitoring techniques and extracting damage-specific information. Damagemonitoring is achieved by the use of a hybrid non-destructive testing system relying on the combinationof acoustic emission, digital image correlation and infrared thermography. Full-field strain and temper-ature differential maps reveal appearance and development of damage ‘‘hot spots’’ at prescribed strain/load increments that also correlate well with distinct changes in the recorded acoustic activity. The use ofnon-destructive and mechanical testing data further allows the quantification of the observed hystereticfatigue behavior by providing measurements of the: (i) stiffness degradation, (ii) energy dissipation, and(iii) average strain as a function of fatigue cycles. Furthermore, analysis of the real time recorded acousticactivity indicates the existence of three characteristic stages of fatigue life that can be used to construct aframework for reliable remaining life-predictions.
� 2013 Elsevier Ltd. All rights reserved.
1. Introduction
The emerging use of fiber reinforced polymer composites(FRPCs) in aerospace [1] and power generation applications [2], isjustified by their exceptional combination of properties includinghigh specific strength and stiffness [3]. However, more than threedecades since their appearance, the widespread acceptance of FRPCas a reliable class of engineering materials remains an issue. Thereasons for this observed hysteresis between development andapplication of FRPC can be traced primarily in the inability to effec-tively model and predict their performance and remaining life as afunction of both applied load and evolving surrounding environ-ment [4,5], as for example currently accomplished in the case ofmetal alloys [6]. The resulting uncertainty naturally increases therisk in using this material type and ultimately overweighs theircomparative advantages as engineering materials.
Failure in laminated polymer composites is driven by variousdamage mechanisms including matrix cracking, fiber breakage,interfacial debonding, transverse ply cracking, and ply delamina-tion [7]. The number, activation and interactions of these failure
mechanisms is further heavily dependent on prior manufacturingand machining operations, that often result in defects and pre-damage conditions that ultimately affect the observed failure pat-terns [8,9]. In addition, the probable simultaneous activation oftwo or more of such failure mechanisms and their unpredictableevolution with applied loading, changing material states, and inter-actions with the overall structural design, create the need for thedevelopment of effective strategies for early detection of damageinitiation, as well as subsequent tracking of its evolution and accu-mulation [10]. In this context, nondestructive testing (NDT) meth-ods have proved invaluable both in understanding the complexbehavior of FRPC and in monitoring their damage process. RecentNDT applications for damage monitoring of composites includethe use of non contact optical methods [11–16], acoustic-basedtechniques [17–21], as well as electrical potential/resistance ap-proaches [22,23]. In addition to NDT, other methods have beenused for monitoring the degradation of properties and the bulkmechanical behavior of composites using standard metrologicaldevices, such as extensometers and strain gages [10,24–27].Although such efforts have had some success in characterizingthe mechanical and damage behavior of composite materials, anintegrated approach which could effectively and reliably trackand quantify both damage initiation and subsequent damage evo-lution is needed [5,28,29].
12 J. Cuadra et al. / Composites Science and Technology 83 (2013) 11–21
This paper addresses the experimental procedure followed toobtain in situ cross-validated NDT data as a function of loadingin uniaxial tensile and tension–tension fatigue tests. To this aim,digital image correlation (DIC), infrared thermography (IRT) andacoustic emission (AE) testing were used in parallel to quantifythe damage process in Glass Fiber Reinforced Polymer (GFRP) com-posites intended for use in wind turbines.
2. Background
A robust monitoring system based on periodical, triggered orcontinuous inspections, should be capable of determining whetherthe current state of a material or structural component has devi-ated from its normal operational conditions, i.e. damaged. For thispurpose, innovations in NDT technologies including both novelsensor platforms (e.g. embedded carbon nanotube networks [30]or fiber bragg sensors [31] in newly manufactured composites foron line structural assessment) and several advanced post-process-ing methods (e.g. the class of statistical pattern recognition (SPR)techniques [32]) have been reported. Data post-processing throughinformation integration, a process frequently called ‘‘fusion’’, iseither inherently built in the harvesting part of the system or isapplied in post mortem. At the sensor level fusion has beenachieved by novel platforms with multiphysics sensing capabilities(e.g. piezoelectricity plus strain) that collect in parallel indepen-dent information or implement acceptance criteria for hierarchicalrecordings based on switching and rejection protocols [33]. Fusionmay also occur at the post-processing level in which heteroge-neous sensing units provide inputs that are subsequently classifiedby the data acquisition system using intelligent schemes includingmachine learning [34], as well as neural/fuzzy/probabilistic net-works [35,36], outlier analysis (OA) [37,38] and probability densityestimations [39] to name a few.
The NDT monitoring approach in this paper is based on the useof three different techniques briefly described next for complete-ness that can provide complementary surface and volume informa-tion to describe damage initiation and development in compositematerials and relate them to remaining life estimations. Specifi-cally, AE is a promising technique to monitor developing damagein FRPC as it can track in real time both the activation and evolu-tion of various damage mechanisms as a function of applied load-ing. AE refers to stress waves that are produced by the rapid releaseof energy caused by reversible/irreversible changes within thematerial. Previous work on AE focused on relating extracted fea-tures, such as counts and amplitude to damage as a function ofe.g. the number of fatigue cycles [17,19,20]. Furthermore, Barreand Benzeggagh [40] correlated AE amplitude with SEM imagesto investigate the various damage mechanisms present in glass fi-ber composites. Additionally, spectral analysis has been used todifferentiate the different damage mechanisms such as matrixcracking and fiber breakage [21]. Sause and Horn [41] developeda finite element model (FEM) to simulate the AE from targeteddamage modes in carbon fiber reinforced composites and usedthe frequency content of the numerically produced AE signals toinfer on ways to effectively detect damage experimentally. How-ever, material type, geometry and damage mode interaction com-plexities in fiber reinforced composites, and additionaluncertainties introduced by the AE sensors have revealed severedifficulties in the identification of damage modes using conven-tional, ‘‘feature-based’’ AE monitoring. To address such difficulties,SPR algorithms based on both unsupervised and supervised modesof learning have been implemented with the goal to correlatemathematically defined clusters of AE data with deformation anddamage mechanisms [42]. Additional difficulties even in suchadvanced post-processing techniques have been reported, which
create the need for cross-validation of recorded AE informationwith both other NDT information and mechanical data during test-ing, as described in this article.
DIC is a non-contact optical metrology technique capable ofmeasuring full-field in and out of plane displacements and com-puting in-plane strains on the surface of a specimen undergoingdeformation [43,44]. The technique relies on measurements of sur-face deformation by comparing an original (reference) configura-tion with subsequent deformed states through tracking contrastchanges in light intensity fields typically achieved by applying aspeckle pattern on the tested sample. This emerging optical meth-od has been successfully employed to investigate material charac-terization and failure mechanisms of FRPC subjected to monotonicand cyclic loadings [11–16]. The DIC method has also been em-ployed to obtain better understanding of the micromechanicalbehavior of FRPC by analyzing strain distributions and associatedfracture surfaces [13,14,16].
Infrared imaging which allows real-time tracking of surfacetemperatures, have permitted thermography techniques (includ-ing active and passive) to grow as reliable and successful methodsfor both material inspection and characterization. Measuring theinfrared radiation emitted by samples subjected to mechanicalloading has provided damage accumulation monitoring by meansof heat dissipation measurements [11,19,45–50]. Ghorbel et al.[46] for example studied the temperature increase of glass rein-forced polyamide in a monotonic tensile test during yielding andnecking. Toubal et al. [47] analyzed damage evolution in notchedcarbon fiber reinforced epoxy samples based on calculations ofresidual stiffness degradation, which was additionally comparedto average surface temperature fluctuations as a function of thenumber of fatigue cycles. In addition, Broughton [11] providedthe inverse relationship between normalized residual stiffnessand surface temperature using the fatigue cycles as a correlationparameter for E-glass epoxy laminates. A similar trend was ob-served and measured by Reis et al. [19] in conjunction with AE fea-tures in pristine glass fiber reinforced polypropylene samples.
3. Experimental setup
3.1. Hybrid NDT system
The hybrid NDT system used for mechanical tests is shown inFig. 1a; the AE part consisted of a four-channel DiSP system (Phys-ical Acoustics); two piezoelectric transducers (Pico) were mountedon the specimen as shown in Fig. 1b using cyanoacrylate adhesive.The piezoelectric transducers had an operating frequency range of200–750 kHz with a peak frequency at 500 kHz. The received sig-nals were amplified using 2/4/6-AST preamplifiers with a uniformgain of 40 dB, while threshold values of 65 and 60 dB were used forthe tension and fatigue test, respectively. These rather high thresh-old values minimized the recordings of unwanted noise, such asmechanical vibrations introduced by the MTS testing machine.The recorded signals were band-pass filtered in a frequency rangeof 100 kHz–2 MHz and the pick definition time, hit definition timeand hit lockout time settings used were 40, 80 and 300 ls, respec-tively. Before testing, lead break tests were carried out to deter-mine the sensitivity of the sensors, calibrate the system andcalculate a surface wave speed of 12,000 m/s. The use of two sen-sors further permitted linear location source detection duringtesting.
A GOM ARAMIS 3D 5 megapixel DIC system with a peak imageacquisition rate of 30 frames/s (fps) was utilized to record full fieldstrain maps for the duration of the test. A 65 � 55 mm2
(2400 � 2100 pixels) field of view (FOV) was employed. 3D surfacedeformations were obtained through triangulation of the two

(b)
(a)
(c)
N nN i
max
mean
min
Stre
ss [M
Pa]
Cycles, N
t delay
Fig. 1. (a) Hybrid NDT experimental setup; (b) material specimen geometry; and (c) custom DIC image acquisition for the imposed cyclic sinusoidal loading profile.
J. Cuadra et al. / Composites Science and Technology 83 (2013) 11–21 13
camera lenses. A stochastic speckle pattern was applied on thefront surface to create a vivid surface light contrast and to trackthe deformation process. DIC images were captured at a rate of1 fps during the tensile tests. In the fatigue tests, the DIC systemwas programmed to record images at 11 fps using an in-house-developed script, which triggered the DIC cameras at specific timeinstances that corresponded to target force values (marked with Xin Fig. 1c). The strain uncertainty for DIC measurements reportedin this article was ±150 lm/m, achieved by a facet size of25 � 25 pixels, a step size of 12 pixels and 52% overlap.
Infrared thermography was performed using a Fluke Ti55 IRFlexCam camera system operating in the 8–14 lm range. A ther-mal emissivity of 0.75 with an acquisition rate of 0.2 fps for boththe tensile and fatigue tests was utilized. The focal plane array pix-el format was 320 � 256 pixels for a FOV of 172 � 230 mm2. Thebackground temperature was set to 70 �F and the accuracy of thesystem was ±2 �C for a temperature from �25 �C to 100 �C.
3.2. Material and loading specifications
The composite material tested was a glass fiber reinforcedepoxy laminate consisting of E-glass fibers and epoxy resin withdimensions 200 mm � 23mm � 1.48 mm. The material had astacking sequence of [0/90/90/0] with a fiber volume fraction of54%. The GFRP specimens were tested both in displacement-con-trolled tension and force-controlled tension–tension fatigue witha sinusoidal profile using a MTS servohydraulic testing machine.Tensile tests were carried out at a 2 mm/min displacement ratein accordance with ASTM D3039. Fatigue loads were selectedbased on the ultimate tensile strength measured in the tensile
tests. The fatigue tests were carried out at a frequency rate of3 Hz with a minimum to maximum stress ratio (R-value) of 0.1.
4. Results and discussion
4.1. Tensile testing
Fig. 2a presents the obtained stress–strain (r–e) behavior corre-lated with the AE amplitude distribution and average temperaturedifferential evolution. Corresponding full field DIC and IRT resultsat marked locations along the r–e curve are shown in Fig. 2b.Strain values in the r–e curve were computed by averaging fullfield strain measurements in the longitudinal direction. The tem-perature differential values were calculated by the ratio of theabsolute temperature difference over the initial temperature. It isclear in Fig. 2a that both the temperature differential and scatterAE amplitude increase significantly as the stress increases. At pointmarked as 2, the stress suddenly drops and a slight visual macro-scopic damage could be detected as shown in the related top rawDIC image in Fig. 2c, strongly indicating sub-surface damage initi-ation. Note that such small stress drops are typically referred to as‘pop-ins’ [51]. The corresponding average strain at point 2 was1.8%. Both AE and IRT present distinct increases in their activity ex-actly at this point, with AE emissions demonstrating a large in-crease in both their event density and amplitude, while asubsequent decrease was observed past point 2.
The thermography measurements showed a large, sudden andsteady increase in the temperature differential at point 2. Interest-ingly, both the full field longitudinal strain and temperature differ-ential values started to show ‘‘hot spots’’ at the left side of the

(a)
(b) (c)
Fig. 2. (a) Measured tensile stress versus strain curves correlated with the distribution of real-time extracted amplitude of AE events and computed (in post mortem) averagetemperature differential values; (b) full field longitudinal strain (top) and temperature differential (bottom) maps; and (c) ‘‘raw’’ optical images recorded by the DIC systemshowing the specimen’s surface at marked points 2 and 3, respectively in the stress–strain curve.
14 J. Cuadra et al. / Composites Science and Technology 83 (2013) 11–21
specimen, although no critical surface damage was observed. It isfurther interesting to note, that although at this load increment fullfield DIC data show rather fuzzy trends, the IRT results clearlymark the formation of a region at the left side of the specimenwhere incipient damage actually occurred, as shown in the secondraw DIC image (bottom) in Fig. 2c. After the load drop at point 2,the stress started to increase again until point 3 where final frac-ture occurred. During this second, the average temperature differ-ential continued to increase with an impressive �18% rise for ashort load increase period. This increase can be clearly correlatedto the full field temperature differential, which shows high concen-trations on the initial and final fracture zone, while the AE activitypresented a second sudden rise in both event density and corre-sponding AE amplitude.
Fig. 3 presents further DIC results that correspond to the tensiletests in Fig. 2. Specifically, the average transversal strain (ex) in
Fig. 3a (left) increased almost linearly with respect to the averagelongitudinal strain, for almost the entire duration of the test indi-cating linear behavior. However, after point 2, a nonlinearity wasobserved associated with critical failure damage formation de-scribed in Fig. 2. Corresponding local Poisson’s ratio (PR) mapswere computed based on full field longitudinal and transversestrains. At point 1, spots corresponding to relatively high PR valuesappear to form along the loading direction and can be compared tothe GFRP constituents PR values (mfiber = 0.23 and mmatrix = 0.4).These high values can be attributed to the increased transversestrain sustained by the matrix. At point 2, additional spots of lowerPR values can be seen which could be related to matrix crackingand/or debonding in the specimen, resulting in the fibers carryingload. Furthermore, at point 3, the initial high PR spots seemed con-nected in a way that correlates well with the location and shape ofthe observed final fracture, indicating an interesting correlation

0.0 0.5 1.0 1.5 2.0
0.0
-0.2
-0.4
-0.6 32
11A
vera
ge T
rans
vers
al S
trai
n [%
]
Average Longitudinal Strain [%]
0.0 0.5 1.0 1.5 2.0
0
2x10⁻⁴
4x10⁻⁴
6x10⁻⁴
3
21
Ave
rage
She
ar S
trai
n
Average Longitudinal Strain [%]
(a)
(b)
εxy1=1.93x10⁻⁵εxy2=7.58x10⁻⁵ εxy3=5.51x10⁻⁴
ν1=0.289 ν2=0.273 ν3=0.281
Fig. 3. (a) Average transversal strain as a function of imposed longitudinal strain and corresponding local Poisson’s ratio maps computed by using recorded DIC data and (b)average shear strains versus longitudinal strain and related full field shear strain values.
J. Cuadra et al. / Composites Science and Technology 83 (2013) 11–21 15
between a locally resolved mechanical parameter only possible tobe measured by a technique such as DIC, and occurring damage.
A possible method of evaluating the matrix–fiber bonding is bymeasuring the shear strain [29,52]. Fig. 3b shows the average shearstrain (exy) computed by DIC, as a function of the longitudinalstrain. Interestingly, the slope of the shear strain changes signifi-cantly at point 1 (ey = 1.4% strain), as well as past point 2(ey = 1.8% strain). While the average shear strain was found to in-crease for longitudinal strain values between 1.4% and 1.8%, it rap-idly increased thereafter. Based on these findings, it can besuggested that the slope change at 1.4% strain could probably beassociated with the initiation possibly of interfacial failure, whilethe significant increase of the shear strain at 1.8% can be relatedto the final stages of damage development. These remarks are fur-ther supported by the full-field shear strain visualizations also pre-sented in Fig. 3b, which indicate the appearance and evolution ofpermanent concentrations, associated with significant strain val-ues in regions related to the final fracture location shown in Fig. 2c.
To correlate the recorded AE results with both mechanical dataand evolving damage in the material, the r–e curve versus thecumulative AE energy is plotted in Fig. 4a and versus the numberof AE counts in Fig. 4b. The AE energy remained nearly constantinitially and presented a significant jump at 1.8% strain level corre-sponding to the stress drop in the r–e curve, which can also beassociated with the shear strain changes. Past 1.8% strain level,the AE energy continued to increase indicating severe source activ-ity. Similarly, it can be seen at and past this strain level in Fig. 4bwhere both the number and density of counts increased signifi-cantly, offering additional evidence on the evolution of damagein the composite specimen.
Furthermore, unsupervised SPR analysis was performed to clas-sify the recorded AE signals from the tensile tests. Four AE featureswere used as descriptors in this clustering methodology, namely,
counts to peak, decay angle, absolute energy and peak frequency[42]. Based on previous work by the authors, the max–min dis-tance algorithm was employed to remove any noise recorded dur-ing the test; and a complete link clustering algorithm with theselected four features was performed. The features were normal-ized and were found to have a correlation level less than 0.3, whichis acceptable for clustering. The classification procedure was eval-uated using the R and s criteria, which yielded the case of 2 classesas optimum [42].
In Fig. 5a, the evolution of the absolute energy of the AE signalsin each of the identified classes as a function of the average longi-tudinal strain is plotted. Class 0 appears to be active throughoutthe test with a noticeable change in slope at 1.4%; moreover, a dis-tinct sharp increase at 1.8% in agreement with the results pre-sented previously at point 2. Class 1 appears to be almost idle upto about 1.6%, where starts increasing with a slower rate comparedto Class 0. To further investigate the properties of the identifiedclusters, the rise-time of the AE signals for each class is plottedagainst peak frequencies (Fig. 5b). Interestingly, class 0 AE signalsseem to be linked with higher rise-time and lower peak frequencyvalues which has been associated earlier in literature to matrix-dominated failure in composites (Fig. 6c), whereas class 1 com-prises AE activity with relatively lower rise time and higher fre-quencies typical for fiber-dominated failure processes (Fig. 6aand b).
The weighted spectral content of the signals in each class wasfurther analyzed using a Fast Fourier Transform (FFT) algorithmusing the formula given in the following equation:
WFFT ¼
XN
i¼0
XFFTi
Nð1Þ

0.0 0.5 1.0 1.5 2.0
0
200
400
600
800 32
1
Cou
nts
Stre
ss [M
Pa]
Average Longitudinal Strain [%]
0
5
10
15
20
0.0 0.5 1.0 1.5 2.0
0
200
400
600
800
Cum
ulat
ive
Ener
gy
Stre
ss [M
Pa]
Average Longitudinal Strain [%]
0.0
5.0x10²
1.0x10332
1
(a) (b)
Fig. 4. Stress–strain correlation with (a) cumulative AE energy and (b) AE counts.
0 500 1000 1500 20000
10
20
30
40
50
FFT
Mag
nitu
de
Frequency [kHz]0 500 1000 1500 2000
0
5
10
15
20
25
FFT
Mag
nitu
de
Frequency [kHz]
100 200 300 400 5000
20
40
60
80
100
Ris
e-tim
e (µ
s)
Peak Frequency (kHz)
Class 0Class 1
0.0 0.5 1.0 1.5 2.0
0
3
6
9
12
Abs
olut
e En
ergy
(pJ)
Average Longitudinal Strain [%]
Class 0Class 1
(a)
(c)
(b)
(d)
Fig. 5. SPR analysis: (a) Evolution of absolute energy with strain; (b) rise-time versus peak frequency; (c) weighted FFT of several signals in class 0; and (d) weighted FFT ofseveral signals in class 1.
40 µm
(a)
60 µm
(b)
400 µm
(c)
Fig. 6. SEM images of characteristics failure modes: (a) fiber breakage, (b) fiber pullout, and (c) matrix cracking.
16 J. Cuadra et al. / Composites Science and Technology 83 (2013) 11–21
(a)
(c) (d)
(b)
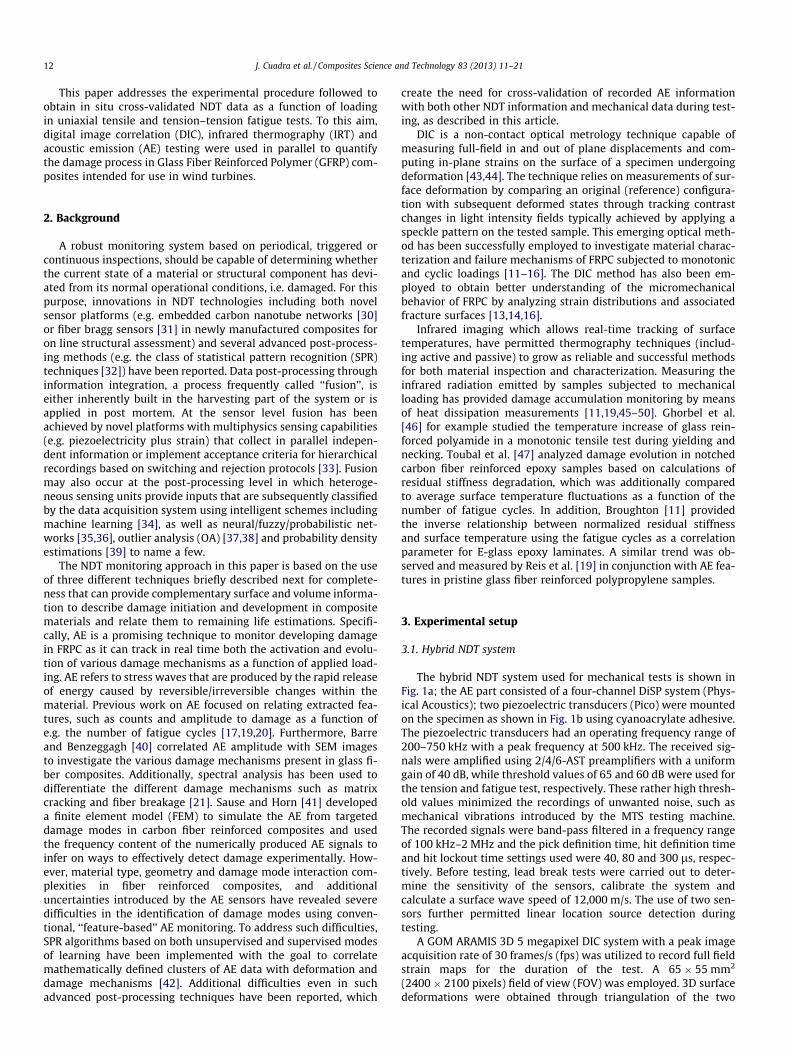
Fig. 7. (a) Representative fatigue stress–strain loops and (b) full field stain maps at marked locations 1–4 at LF = 99%. (c) Energy density and (d) residual stiffness compared tocumulative AE energy and versus normalized fatigue life.
J. Cuadra et al. / Composites Science and Technology 83 (2013) 11–21 17
where XFFT is the FFT of a signal belonging to a particular class and Nis the total number of signals. The results are shown in Fig. 5c and dfor each class. The peak frequencies of class 0 and 1 lie around166 kHz and 517 kHz respectively, while it is interesting to notethat the 166 kHz peak of class 0 also appears in class 1 which cor-relates well with the absolute energy results in Fig. 5a. AE eventswith a dominant frequency <300 kHz have been associated to ma-trix cracking (Fig. 6c), fiber pullout (Fig. 6b) and fiber debonding(Fig. 6a), while events with >300 kHz peak frequencies typically cor-relate well with the fiber breakage dominated stage of failure incomposites [53–55]. Such damage modes were revealed by a de-tailed microscopic analysis subsequent to the tensile tests (Fig. 6),reinforcing the classification results shown in Fig. 5b. However, itshould be noted that only the most reliable trends related to AEand damage are sought in this analysis. Furthermore, no effortwas made to directly associate a particular damage mode (e.g. fiberbreakage) with one or more extracted AE features, as frequently at-tempted in the pertinent literature mentioned in this section. TheAE results presented herein are however examined in comparisonto related fatigue data, as described next.
4.2. Fatigue testing
Force controlled tension–tension (R = 0.1) fatigue tests wereperformed at loading rates of 2–3 Hz using a sinusoidal profile(Fig. 1c) while simultaneously recording AE, DIC and IR data. Rep-resentative stress–strain loops measured using customized DICdata recording schemes (designated with marks in Fig. 1c) areillustrated in Fig. 7a. An increase in the average maximum longitu-
dinal strain as the fatigue process develops can be seen, whichindicates changes in the overall damage condition of the testedspecimen. Full field longitudinal strain distributions at specificpoints along a loop that corresponds to the end of the fatigue life(�99%) are shown in Fig. 7b demonstrating significant strain accu-mulation defined near a vertical line on the right side of the spec-imen, which coincided with the fractured zone.
The energy density (area inside the r–e loops) and residual stiff-ness (slope connecting the two strain extrema in the loops) arepresented in Fig. 7c and d respectively as a function of normalizedfatigue life and correlated to the in situ recorded cumulative AE en-ergy. Three stages of fatigue life were identified based on theseparameters and are marked with the vertical dotted lines inFig. 7c and d. The first significant change in the slope of the AE en-ergy curve denotes the transition from the initial stage I (0–32%) tostage II (32–84%), which is the longest out of the three. In stage IIthe calculated energy density gradually increases while the resid-ual stiffness decreases, providing two additional bulk parametersto quantify the material’s damage condition. The onset of stageIII (>84%) was clearly identified by the sudden change in both en-ergy density and stiffness, which is subsequently followed by asteep increase of the AE energy right before final fracture.
To further investigate the correlation between NDT data,mechanical properties and fatigue behavior, Fig. 8a shows the AEamplitude distribution in comparison with the computed averagePR, while Fig. 8b presents the variation of the average x and ystrains calculated from the field data presented in Fig. 8c and das a function of fatigue life. In stage I, the initial high amplitudeof AE signals associated with rapid material changes that

(a) (b)
(c)
(d)
(e)
(f)
1.2
1.4
1.6
1.8
2.0
Ave
rage
y a
t Max
imum
Loa
d [%
]
0.0 0.2 0.4 0.6 0.8 1.0Life Fraction, N/Nf
Ave
rage
x a
t Max
imum
Loa
d[%
]
-0.7
-0.6
-0.5
-0.4
-0.3
-0.2
εε
Fig. 8. (a) Poisson’s ratio evolution correlated with AE amplitude and (b) maximum average longitudinal and transversal strains as a function of life fraction. Correspondingfull-field strain localization maps for (c) longitudinal, (d) transversal strain and (e) Poisson’s ratio. Ex situ SEM image along with optical image and Poisson’s ratio fracturelocalization. (f) Strain map at point 5 along with DIC, and SEM optical images of fractured surface.
18 J. Cuadra et al. / Composites Science and Technology 83 (2013) 11–21
accommodate the imposed loading, decreases as fatigue evolvesdue to temporary saturation of these microstructural effects, whileit is further accompanied by decreasing PR values. To investigatethis trend, the full field DIC data for ex in Fig. 8d and PR in Fig. 8eshow the appearance of localized ellipsoidal regions, in which bothex and mxy are significantly lower than that their neighborhood. Inaddition, these regions were found to be close to the distinct sur-face failure zone shown in Fig. 8f. The average strains values pre-sented in Fig. 8b reveal that the calculated variations in the PRvalues are caused by the change in the x strains in stage I (y strainsremain almost constant as also further verified by the full field datain Fig. 8c). Furthermore, a closer look at the ex data in Fig. 8d showsthat at marked location 2 the actual failure zone starts formingfrom the right size of the coupon, which becomes more pro-nounced at locations 3–4 and can be clearly seen at location 5.Having such DIC data and motivated by the results describedabove, the calculation of localized Poisson ratio values shown inFig. 8e was achieved, and demonstrated again the sensitivity of thismechanical parameter in monitoring progressive damage under
fatigue loading conditions. Note that at the transition betweenstages II and III, both x and y strains suddenly present significantchanges accompanied by the clear formation of the fracture zonein Fig. 8f, which was subsequently followed by a sharp increaseof the AE amplitude as shown in Fig. 8a and an accompanying in-crease of the average PR values.
Further analysis of the recorded AE activity was performed byanalyzing waveforms both in time and frequency domains, asshown in Fig. 9. The spectral content of the waveforms was com-puted using FFT. A large number of AE signals at each of the threefatigue stages was used for this analysis; however, for presentationpurposes only three waveforms from each stage are presented inFig. 9, while the remarks made correspond to the analysis of theentire data set. Specifically, although the waveform population cor-responding to all identified fatigue stages comprised primarilyburst-type emissions, differences in their features were identifiedin both time and frequency domains. Real time recorded AE signalswere found to have low amplitude and short duration in stage Iwith their dominant frequencies centered around 150–200 kHz
0 75 150 225 300 375-60
-40
-20
0
20
40
60Stage I
109.81 sec224.52 sec560.90 sec
AE
Am
plitu
de [m
V]
0 75 150 225 300 375-60
-40
-20
0
20
40
60Stage II
3657.83 sec3661.91 sec3742.50 sec
AE
Am
plitu
de [m
V]
0 75 150 225 300-60
-40
-20
0
20
40
60Stage III
4437.10 sec4454.42 sec4646.76 sec
AE
Am
plitu
de [m
V]
Time [µs]
Time [µs]
Time [µs]0 100 200 300 400 500
0.00
0.15
0.30
0.45
0.60109.81 sec224.52 sec560.90 sec
Stage I
AE
Am
plitu
de [m
V]
Frequency [kHz]
0 100 200 300 400 500
500
0.00
0.15
0.30
0.45
0.603657.83 sec3661.91 sec3742.50 sec
Stage II
AE
Am
plitu
de [m
V]
Frequency [kHz]
0 100 200 300 4000.00
0.15
0.30
0.45
0.604437.10 sec4454.42 sec4646.76 sec
Stage III
AE
Am
plitu
de [m
V]
Frequency [kHz]
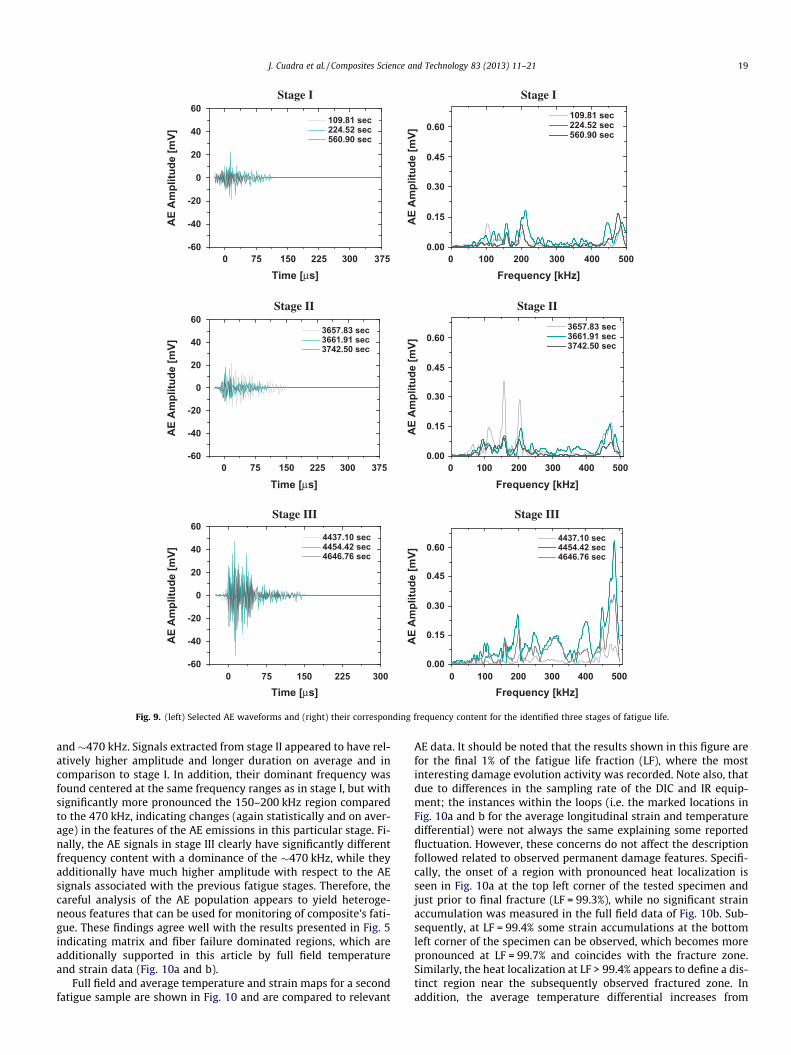
Fig. 9. (left) Selected AE waveforms and (right) their corresponding frequency content for the identified three stages of fatigue life.
J. Cuadra et al. / Composites Science and Technology 83 (2013) 11–21 19
and�470 kHz. Signals extracted from stage II appeared to have rel-atively higher amplitude and longer duration on average and incomparison to stage I. In addition, their dominant frequency wasfound centered at the same frequency ranges as in stage I, but withsignificantly more pronounced the 150–200 kHz region comparedto the 470 kHz, indicating changes (again statistically and on aver-age) in the features of the AE emissions in this particular stage. Fi-nally, the AE signals in stage III clearly have significantly differentfrequency content with a dominance of the �470 kHz, while theyadditionally have much higher amplitude with respect to the AEsignals associated with the previous fatigue stages. Therefore, thecareful analysis of the AE population appears to yield heteroge-neous features that can be used for monitoring of composite’s fati-gue. These findings agree well with the results presented in Fig. 5indicating matrix and fiber failure dominated regions, which areadditionally supported in this article by full field temperatureand strain data (Fig. 10a and b).
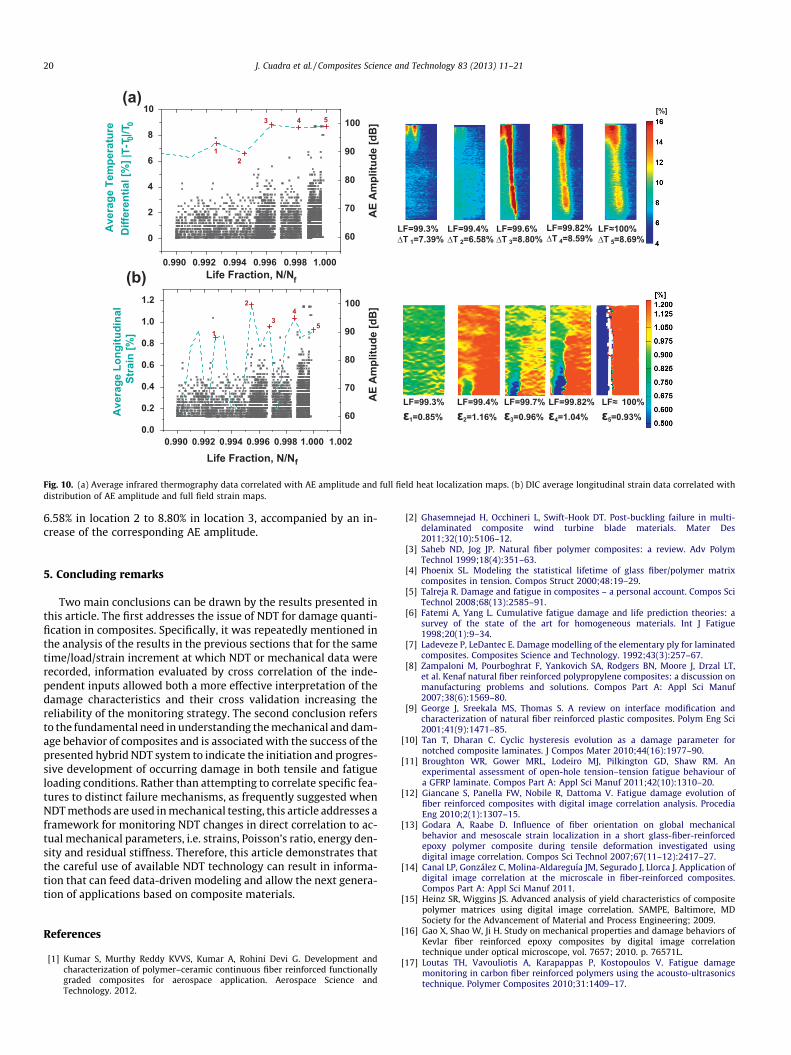
Full field and average temperature and strain maps for a secondfatigue sample are shown in Fig. 10 and are compared to relevant
AE data. It should be noted that the results shown in this figure arefor the final 1% of the fatigue life fraction (LF), where the mostinteresting damage evolution activity was recorded. Note also, thatdue to differences in the sampling rate of the DIC and IR equip-ment; the instances within the loops (i.e. the marked locations inFig. 10a and b for the average longitudinal strain and temperaturedifferential) were not always the same explaining some reportedfluctuation. However, these concerns do not affect the descriptionfollowed related to observed permanent damage features. Specifi-cally, the onset of a region with pronounced heat localization isseen in Fig. 10a at the top left corner of the tested specimen andjust prior to final fracture (LF = 99.3%), while no significant strainaccumulation was measured in the full field data of Fig. 10b. Sub-sequently, at LF = 99.4% some strain accumulations at the bottomleft corner of the specimen can be observed, which becomes morepronounced at LF = 99.7% and coincides with the fracture zone.Similarly, the heat localization at LF > 99.4% appears to define a dis-tinct region near the subsequently observed fractured zone. Inaddition, the average temperature differential increases from
LF=99.3%ΔT 1=7.39%
LF=99.4%ΔT 2=6.58%
LF=99.6%ΔT 3=8.80%
LF=99.82%ΔT 4=8.59%
LF≈100%ΔT 5=8.69%
LF=99.3%ε1=0.85%
LF=99.4%ε2=1.16%
LF=99.7%ε3=0.96%
LF=99.82%ε4=1.04%
LF≈ 100%ε5=0.93%
1.0000.9980.9960.9940.9920.990
0
2
4
6
8
10
AE
Am
plitu
de [d
B]
Ave
rage
Tem
pera
ture
4 53
21|T
-T 0|/T 0
Life Fraction, N/Nf
60
70
80
90
100
1.0021.0000.9980.9960.9940.9920.0
0.2
0.4
0.6
0.8
1.0
1.2
5
43
1
2
AE
Am
plitu
de [d
B]
Ave
rage
Lon
gitu
dina
l
Str
ain
[%]
Life Fraction, N/Nf
60
70
80
90
100
(a)
(b)
0.990
Diff
eren
tial [
%]
Fig. 10. (a) Average infrared thermography data correlated with AE amplitude and full field heat localization maps. (b) DIC average longitudinal strain data correlated withdistribution of AE amplitude and full field strain maps.
20 J. Cuadra et al. / Composites Science and Technology 83 (2013) 11–21
6.58% in location 2 to 8.80% in location 3, accompanied by an in-crease of the corresponding AE amplitude.
5. Concluding remarks
Two main conclusions can be drawn by the results presented inthis article. The first addresses the issue of NDT for damage quanti-fication in composites. Specifically, it was repeatedly mentioned inthe analysis of the results in the previous sections that for the sametime/load/strain increment at which NDT or mechanical data wererecorded, information evaluated by cross correlation of the inde-pendent inputs allowed both a more effective interpretation of thedamage characteristics and their cross validation increasing thereliability of the monitoring strategy. The second conclusion refersto the fundamental need in understanding the mechanical and dam-age behavior of composites and is associated with the success of thepresented hybrid NDT system to indicate the initiation and progres-sive development of occurring damage in both tensile and fatigueloading conditions. Rather than attempting to correlate specific fea-tures to distinct failure mechanisms, as frequently suggested whenNDT methods are used in mechanical testing, this article addresses aframework for monitoring NDT changes in direct correlation to ac-tual mechanical parameters, i.e. strains, Poisson’s ratio, energy den-sity and residual stiffness. Therefore, this article demonstrates thatthe careful use of available NDT technology can result in informa-tion that can feed data-driven modeling and allow the next genera-tion of applications based on composite materials.
References
[1] Kumar S, Murthy Reddy KVVS, Kumar A, Rohini Devi G. Development andcharacterization of polymer–ceramic continuous fiber reinforced functionallygraded composites for aerospace application. Aerospace Science andTechnology. 2012.
[2] Ghasemnejad H, Occhineri L, Swift-Hook DT. Post-buckling failure in multi-delaminated composite wind turbine blade materials. Mater Des2011;32(10):5106–12.
[3] Saheb ND, Jog JP. Natural fiber polymer composites: a review. Adv PolymTechnol 1999;18(4):351–63.
[4] Phoenix SL. Modeling the statistical lifetime of glass fiber/polymer matrixcomposites in tension. Compos Struct 2000;48:19–29.
[5] Talreja R. Damage and fatigue in composites – a personal account. Compos SciTechnol 2008;68(13):2585–91.
[6] Fatemi A, Yang L. Cumulative fatigue damage and life prediction theories: asurvey of the state of the art for homogeneous materials. Int J Fatigue1998;20(1):9–34.
[7] Ladeveze P, LeDantec E. Damage modelling of the elementary ply for laminatedcomposites. Composites Science and Technology. 1992;43(3):257–67.
[8] Zampaloni M, Pourboghrat F, Yankovich SA, Rodgers BN, Moore J, Drzal LT,et al. Kenaf natural fiber reinforced polypropylene composites: a discussion onmanufacturing problems and solutions. Compos Part A: Appl Sci Manuf2007;38(6):1569–80.
[9] George J, Sreekala MS, Thomas S. A review on interface modification andcharacterization of natural fiber reinforced plastic composites. Polym Eng Sci2001;41(9):1471–85.
[10] Tan T, Dharan C. Cyclic hysteresis evolution as a damage parameter fornotched composite laminates. J Compos Mater 2010;44(16):1977–90.
[11] Broughton WR, Gower MRL, Lodeiro MJ, Pilkington GD, Shaw RM. Anexperimental assessment of open-hole tension–tension fatigue behaviour ofa GFRP laminate. Compos Part A: Appl Sci Manuf 2011;42(10):1310–20.
[12] Giancane S, Panella FW, Nobile R, Dattoma V. Fatigue damage evolution offiber reinforced composites with digital image correlation analysis. ProcediaEng 2010;2(1):1307–15.
[13] Godara A, Raabe D. Influence of fiber orientation on global mechanicalbehavior and mesoscale strain localization in a short glass-fiber-reinforcedepoxy polymer composite during tensile deformation investigated usingdigital image correlation. Compos Sci Technol 2007;67(11–12):2417–27.
[14] Canal LP, González C, Molina-Aldareguía JM, Segurado J, Llorca J. Application ofdigital image correlation at the microscale in fiber-reinforced composites.Compos Part A: Appl Sci Manuf 2011.
[15] Heinz SR, Wiggins JS. Advanced analysis of yield characteristics of compositepolymer matrices using digital image correlation. SAMPE, Baltimore, MDSociety for the Advancement of Material and Process Engineering; 2009.
[16] Gao X, Shao W, Ji H. Study on mechanical properties and damage behaviors ofKevlar fiber reinforced epoxy composites by digital image correlationtechnique under optical microscope, vol. 7657; 2010. p. 76571L.
[17] Loutas TH, Vavouliotis A, Karapappas P, Kostopoulos V. Fatigue damagemonitoring in carbon fiber reinforced polymers using the acousto-ultrasonicstechnique. Polymer Composites 2010;31:1409–17.
J. Cuadra et al. / Composites Science and Technology 83 (2013) 11–21 21
[18] Bentahar M, El Guerjouma R. Monitoring progressive damage in polymer-based composite using nonlinear dynamics and acoustic emission. J AcousticalSoc Am 2009;125(1). EL39–44.
[19] Reis P, Ferreira J, Richardson M. Fatigue damage characterization by NDT inpolypropylene/glass fibre composites. Appl Compos Mater 2011;18:409–19.
[20] Bourchak M, Farrow I, Bond I, Rowland C, Menan F. Acoustic emission energyas a fatigue damage parameter for CFRP composites. Int J Fatigue2007;29(3):457–70.
[21] Marec A, Thomas JH, El Guerjouma R. Damage characterization of polymer-based composite materials: multivariable analysis and wavelet transform forclustering acoustic emission data. Mech Syst Signal Process2008;22(6):1441–64.
[22] Wang D, Wang S, Chung DDL, Chung JH. Sensitivity of the two-dimensionalelectric potential/resistance method for damage monitoring in carbon fiberpolymer–matrix composite. J Mater Sci 2006;41(15):4839–46.
[23] Xia ZH, Curtin WA. Damage detection via electrical resistance in CFRPcomposites under cyclic loading. Compos Sci Technol 2008;68(12):2526–34.
[24] Eliopoulos EN, Philippidis TP. A progressive damage simulation algorithm forGFRP composites under cyclic loading. Part II: FE implementation and modelvalidation. Compos Sci Technol 2011;71(5):750–7.
[25] Van Paepegem W, De Baere I, Lamkanfi E, Degrieck J. Monitoring quasi-staticand cyclic fatigue damage in fibre-reinforced plastics by Poisson’s ratioevolution. Int J Fatigue 2010;32(1):184–96.
[26] Kang K-W, Lim D-M, Kim J-K. Probabilistic analysis for the fatigue life ofcarbon/epoxy laminates. Compos Struct 2008;85(3):258–64.
[27] Allix O, Blanchard L. Mesomodeling of delamination: towards industrialapplications. Compos Sci Technol 2006;66(6):731–44.
[28] Kaddour AS, Hinton MJ, Li S, Smith PA. Damage theories for fibre-reinforcedpolymer composites: The Third World-Wide Failure Exercise (WWFE-III). In:16th International Conference on composite materials, 2007.
[29] Anderson TL. Fracture mechanics: fundamentals and applications. 3 ed. BocaRaton, FL: CRC; 2005.
[30] Inpil K, Mark JS, Jay HK, Vesselin S, Donglu S. A carbon nanotube strain sensorfor structural health monitoring. Smart Mater Struct 2006;15(3):737.
[31] Hongo A, Kojima S, Komatsuzaki S. Applications of fiber Bragg grating sensorsand high-speed interrogation techniques. Struct Control Health Monit2005;12(3–4):269–82.
[32] Sohn H, Farrar CR, Hunter NF, Worden K. Structural health monitoring usingstatistical pattern recognition techniques. J Dyn Syst Meas Control2001;123(4):706–11.
[33] Ozevin D, Greve DW, Oppenheim IJ, Pessiki SP. Resonant capacitive MEMSacoustic emission transducers. Smart Mater Struct 2006;15(6):1863.
[34] Xiukuan Z, Min L, Gangbing S, Jinwu X. Hierarchical ensemble-based datafusion for structural health monitoring. Smart Mater Struct2010;19(4):045009.
[35] Jiang S-F, Fu C, Zhang C. A hybrid data-fusion system using modal data andprobabilistic neural network for damage detection. Adv Eng Software2011;42(6):368–74.
[36] Jiang S-F, Zhang C-M, Zhang S. Two-stage structural damage detection usingfuzzy neural networks and data fusion techniques. Expert Syst Appl2011;38(1):511–9.
[37] Rizzo P, Sorrivi E, Lanza di Scalea F, Viola E. Wavelet-based outlier analysis forguided wave structural monitoring: application to multi-wire strands. J SoundVib 2007;307(1–2):52–68.
[38] Worden K, Manson G, Fieller NRJ. Damage detection using outlier analysis. JSound Vib 2000;229(3):647–67.
[39] Bishop CM. Novelty detection and neural network validation. Vision ImageSignal Process IEE Proc 1994;141(4):217–22.
[40] Barre S, Benzeggagh ML. On the use of acoustic emission to investigate damagemechanisms in glass-fiber-reinforced polypropylene. Compos Sci Technol1994;52:369–76.
[41] Sause MGR, Horn S. Simulation of acoustic emission in planar carbon fiberreinforced plastic specimens. J Nondestruct Eval 2010;29:123–42.
[42] Kostopoulos V, Loutas TH, Kontsos A, Sotiriadis G, Pappas YZ. On theidentification of the failure mechanisms in oxide/oxide composites usingacoustic emission. NDT & E Int 2003;36(8):571–80.
[43] Pan B, Qian K, Xie H, Asundi A. Two-dimensional digital image correlation forin-plane displacement and strain measurement: a review. Meas Sci Technol2009;20(6). 062001-062001.
[44] Cofaru C, Philips W, Van Paepegem W. Improved Newton-Raphson digitalimage correlation method for full-field displacement and strain calculation.Appl Opt 2010;49(33):6472–84.
[45] Shull PJ. Nondestructive evaluation: theory, techniques, and applications. CRC;2002.
[46] Ghorbel A, Saintier N, Dhiab A. Investigation of damage evolution in short glassfibers reinforced polyamide 6,6 under tensile loading using infraredthermography. Procedia Eng 2011;10:2123–8.
[47] Toubal L, Karama M, Lorrain B. Damage evolution and infrared thermographyin woven composite laminates under fatigue loading. Int J Fatigue2006;28(12):1867–72.
[48] Meola C, Carlomagno GM, Squillace A, Prisco U, Morace RE. Analysis ofcomposites with infrared thermography, vol. 228. Wiley-VCH Verlag; 2005. p.273–286.
[49] Pan YP, Miller RA, Chu TP, Filip P. Detection of defects in commercial C/Ccomposites using infrared thermography. In: SEM Annual Conference andExposition on Experimental and Applied Mechanics 2009, June 1, 2009–June 4,2009, vol. 1 Albuquerque, NM, United states: Society for, ExperimentalMechanics; 2009. p. 199–206.
[50] Huo Y, Li H, Zhao Y, Zhang C. Study on the detectability of carbon fiberreinforced plastics composites using pulsed infrared thermography. ZhongguoJiguang/Chin J Lasers 2010;37(Suppl. 1):277–81.
[51] Karger-Kocsis J, Harmia T, Czigany T. Comparison of the fracture and failurebehavior of polypropylene composites reinforced by long glass fibers and byglass mats. Compos Sci Technol 1995;54:287–98.
[52] Hülsenberg D, Fehling P, Leutbecher T. Damage tolerant, translucent oxidefiber/glass matrix composites. Composites Part B 2008;39(2):362–73.
[53] de Groot PJ, Wijnen PAM, Janssen RBF. Real-time frequency determination ofacoustic emission for different fracture mechanisms in carbon/epoxycomposites. Compos Sci Technol 1995;55(4):405–12.
[54] Qi G, Wavelet-based AE. Characterization of composite materials. NDT & E Int2000;33(3):133–44.
[55] Sause M, Horn S. Simulation of acoustic emission in planar carbon fiberreinforced plastic specimens. J Nondestruct Eval 2010;29(2):123–42.