Embed Size (px)
Citation preview

Composite Structures 116 (2014) 193–210
Contents lists available at ScienceDirect
Composite Structures
journal homepage: www.elsevier .com/locate /compstruct
Low speed impact of laminated polymethylmethacrylate/adhesive/polycarbonate plates
http://dx.doi.org/10.1016/j.compstruct.2014.04.0060263-8223/� 2014 Elsevier Ltd. All rights reserved.
⇑ Corresponding author. Tel.: +1 540 231 6051; fax: +1 540 231 4574.E-mail addresses: [email protected] (G.O. Antoine), [email protected] (R.C. Batra).
G.O. Antoine, R.C. Batra ⇑Department of Engineering Science and Mechanics, M/C 0219, Virginia Polytechnic Institute and State University, Blacksburg, VA 24061, USA
a r t i c l e i n f o
Article history:Available online 9 May 2014
Keywords:LaminatesImpactCracksDamageFinite elasto-plastic deformations
a b s t r a c t
We study three-dimensional finite transient deformations of transparent poly-methyl-methacrylate(PMMA)/adhesive/polycarbonate (PC) laminates impacted at low speed by a hemispherical nosed rigidcylinder using the commercial finite element (FE) software LS-DYNA. The two glassy polymers PMMAand PC are modeled as thermo-elasto-visco-plastic materials by using the constitutive relation proposedby Mulliken and Boyce and modified by Varghese and Batra. For the nearly incompressible viscoelasticbonding layer, the elastic response is modeled by the Ogden relation and the viscous response by theProny series. Delamination at interfaces between the adhesive and the polymeric sheets is simulatedby using the cohesive zone model incorporated in LS-DYNA. The effective plastic strain, the maximumprincipal stress, and the maximum stretch based failure criteria are used for delineating failure in PC,PMMA and the adhesive, respectively. Failed elements are deleted from the analysis domain. The threelayers are discretized by using 8-node brick elements and integrals over elements are numerically eval-uated by using a reduced Gauss integration rule. The coupled nonlinear ordinary differential equationsobtained by the Galerkin approximation are integrated by using the conditionally stable explicit algo-rithm. Results have been computed for at least two different FE meshes. The computed number and con-figurations of cracks in the PMMA are found to qualitatively agree with the test observations. It is alsofound that the energy dissipated due to plastic deformations in the PC is considerably more than thatdue to cracks formed in the PMMA.
� 2014 Elsevier Ltd. All rights reserved.
1. Introduction
Polymers are composed of long chains of monomers while ametal is generally a polycrystalline material. This difference inthe microstructure explains why their thermo-mechanicalresponse is quite different. Polymers usually exhibit strongstrain-rate dependence in their mechanical response and arewidely used as transparent armors because of their high specificimpact performance, e.g., see Radin and Goldsmith [1]. Sandset al. [2] have reported that polymethylmetha-acrylate (PMMA)and polycarbonate (PC) polymers have better impact resistancethan most glasses. Rabinowitz et al. [3] used a high pressure tor-sion test to experimentally investigate the effect of pressure onthe quasi-static shear stress-shear strain response and on the frac-ture strain of PMMA and poly(ethylene terephthalate). They foundthat an increase in the hydrostatic pressure increases the yieldstrain, the yield stress and the fracture stress of the materials butdecreases the fracture strain.
The mechanical behavior of glassy polymers has been experi-mentally and computationally studied by several investigators.Duckett et al. [4] experimentally studied the strain rate and pres-sure dependence of the yield stress of PMMA and poly (ethyleneterephthalate) deformed in uniaxial compression at strain ratesfrom 10�6/s to 10�1/s. They found that the yield stresses in com-pression and torsion increase monotonically with increasingstrain-rate and decreasing temperature. This was confirmed byArruda et al. [5] in the same range of strain rates and by Mulllikenand Boyce [6] for low to high strain rates (up to 103/s). Similar con-clusions about the dependence of the yield strain and the yieldstress upon the strain rate and the temperature hold for the PCmaterial [6–11]. Moy et al. [8] performed uniaxial compressiontests on Lexan 9034A PC from 10�4/s to 4600/s strain rates. Theyused an Instron test machine for the quasi-static tests and asplit-Hopkinson (Kolsky) bar for the high strain rate experiments.Rittel et al. [12] studied heating of PMMA samples subjected touniaxial compressive cyclic loading at stress levels above the yieldstress of the PMMA and at strain rates up to 0.1/s. They related thetemperature rise to the chain mobility of the polymers. Rittel [13]and Rittel and Rabinowitz [14] performed uniaxial tensile and

194 G.O. Antoine, R.C. Batra / Composite Structures 116 (2014) 193–210
cyclic tests on PMMA and PC at low strain rates and measured thetemperature rise.
Schmachtenberg et al. [15] proposed a method to find values ofmaterial parameters for modeling the mechanical behavior of ther-moplastics. Arruda et al. [5] performed uniaxial compression testson PMMA samples at various strain rates and temperatures, anddeveloped a material model for the PMMA based on the multipli-cative decomposition of the deformation gradient into elastic, ther-mal and inelastic parts. Moreover, they assumed that a part of theenergy dissipated due to inelastic deformations is converted intoheating while the remainder contributes to the back stress.Richeton et al. [9–11] used shift factors for the strain rate andthe stresses to model the temperature and strain rate dependenceof the yield stress of amorphous polymers. Richeton et al. [16] andTervoort et al. [17] employed a spring in series with a dashpot anda Langevin spring to derive constitutive equations for polymers.Buckley and Jones [18] modeled the behavior of amorphous poly-mers near the glass transition temperature by decomposing thestress into two components, a bond stretching stress (partially irre-versible) and a reversible conformational stress, and introduced ashift factor for the temperature and the strain rate dependence ofthe elastic moduli. Alavarado-Contreras et al. [19] used a simplechemical description of the amorphous and the crystalline phasesto derive equations describing the mechanical behavior of amor-phous semicrystalline materials. An eight-chain model is used forthe amorphous phase and the stress tensor for this phase is thesum of a conformational stress tensor and a back-stress tensor.The deformation of the crystalline phase is assumed to be drivenby effective shear stresses along its eight slip systems. Further-more, they introduced two scalar variables that represent damagein each phase, proposed their evolution relations, and consideredthe loss of stiffness of the material due to progressive damage priorto failure. Boyce et al. [20] and Mulliken and Boyce [6] introduced arate dependent model for the behavior of glassy polymers thatassumes the coexistence of three different phases with the samevalues of the deformation gradient at a material point. Two of thesephases have similar constitutive equations with different values ofmaterial parameters, and the third phase contributes to the generalstress via a back-stress component. This material model has beengeneralized by Varghese and Batra [21,22] to account for thedependence of the elastic moduli upon the temperature and tem-perature dependent strain softening. Predictions from this workfor uniaxial tensile and compressive deformations compare wellwith the test results at low and high strain rates.
The damage initiation and evolution, and the failure of poly-mers have been studied experimentally and numerically. Lajtai[23] studied the failure of pre-cracked specimens subjected tocompressive loading and used a modified Coulomb model to studythe final stages of their failure. Saghafi et al. [24] proposed a crite-rion to predict mode II and mixed-mode fracture toughness of brit-tle materials. Using data obtained from three-point bend tests onmarble specimens they found that their criterion predicted betterthe failure of specimens than that given by the maximum tangen-tial stress (MTS) criterion. Seweryn [25] proposed a criterion forbrittle fracture of structures with sharp notches based on modesI, II and III stress intensity factors. Seweryn and Lukaszewicz [26]analyzed crack initiation in brittle specimens with V-shapednotches under mixed mode loading and found good agreementbetween the experimental measurements and the J-integral com-puted with the boundary element method. Vandenberghe et al.[27] proposed a model of crack formation in PMMA platesimpacted at normal incidence. They considered energy dissipateddue to crack formation and for flexural deformations of petalsformed in the cracked plate. They could accurately predict thenumber of cracks formed in the plate as a function of the impactspeed and the plate thickness.
Schultz [28] has related the failure of semicrystalline polymersto the spherulitic structure of the material and the inter- and intra-spherulitic fracture. Zaïri et al. [29] proposed constitutive equa-tions to describe the progressive void growth in elasto-viscoplasticpolymers, and showed that their model could predict well thestress–strain response of rubber-modified PMMA deformed in uni-axial tension. Ayatollahi et al. [30] performed fracture tests onsemi-circular PMMA specimens containing an edge crack and mod-eled crack propagation using the finite element method (FEM) andthe MTS failure criterion. They accurately predicted the cracktrajectory in semi-circular bend (SCB) specimens. For small pre-existing cracks in an infinite PMMA medium, Beaumont et al.[31] investigated the relation between the crack propagation speedand the stress intensity factor at the crack tip for mode I failure ofsharply-notched specimens. Wada et al. [32] experimentally stud-ied the impact fracture toughness of edge-cracked PMMA speci-mens and computationally analyzed their 3D deformations usingthe FEM. Marshall et al. [33] introduced a factor to account forthe notch size in the calculation of the energy release-rate forthe PMMA material, which enabled them to derive a material spe-cific energy/area that is independent of the specimen geometry. Intheir work the ratio of the initial crack length to the width of thesample ranged between 0.03 and 0.5. Moy et al. [34] found thatthe failure of PMMA is ductile at strain rates �1/s and brittle atstrain rates�1/s. Weerasooriya et al.’s [35] test data have revealedthat the fracture toughness of PMMA for strain rates >100/s isalmost twice that for quasi-static loading.
The failure modes of PC are quite different from those of PMMA.Chang and Chu [36] study the effect of temperature and notch-tipradius on the fracture mode of PC and of a modified PC. They foundthe existence of a semi-ductile fracture mode at low temperatures(�40 �C) for some notch-tip radii and proposed a diagram describ-ing the 2D-fracture mode of PC as a function of the temperatureand of the notch-tip radius. Mills [37] performed Charpy impacttests on notched PC bars and studied the effect of annealing onthe ductile to brittle failure transitions. Fraser and Ward [38]investigated the effect of the notch-tip radius on the impact frac-ture behavior of PC samples. Allen et al. [39] measured the Charpyimpact strength of notched polydiancarbonate and found that thepolymer exists in two different varieties with different yield andfailure properties, but did not relate this difference to the morphol-ogy of the polymers. Rittel et al. [40] tested cracked specimens anddelineated two failure mechanisms, opening and shear banding, inPC as a function of the mode-mixity. Rittel and Levin [41] used twodifferent experimental set-ups to study crack propagation in PCwith either mode-I dominant or mode-II dominant deformations.They found that the same mechanisms govern the failure of PCregardless of the mode-mixity. Curran et al. [42] analyzed the frac-ture of PC disks subjected to dynamic flat-plate impact and pre-dicted the level of damage induced in the PC sample with adamage model based on the nucleation, growth and coalescenceof cracks. Plati and Williams [43,44] compared the energy releaserate of different polymers including PMMA and PC obtained withCharpy and Izod tests at different temperatures, and found thatthey gave essentially the same value of the energy release rate.Adams et al. [45] used three-point bend specimens made of fivedifferent polymers (PC, polyacetal, two nylons and PMMA) to mea-sure the plane strain fracture toughness of these materials underimpact loading. Ogihara et al. [46] examined fracture mechanismsof polymeric materials by high velocity impact and quasistatic per-foration tests and compared the static and the dynamic perforationenergies of PMMA plates with various edge lengths and thick-nesses. Fleck et al. [47] pointed out that craze nucleation was theprincipal failure mechanism for both PMMA and PC at high strainrates despite PMMA exhibiting brittle failure and PC ductile failure.Livingstone et al. [48] and Richards et al. [49] used a bulk strain
G.O. Antoine, R.C. Batra / Composite Structures 116 (2014) 193–210 195
based failure criterion to model damage in PC and a principal ten-sile stress criterion to model the failure of polyurethane interlayerduring their simulations of the impact of a glass/interlayer/PC lam-inate. They accurately simulated the fracture pattern of theimpacted plate, and predicted the ballistic limit (v50) within 10%accuracy. Kelly [50] used the Johnson–Holmquist failure criterionto simulate damage in PC and PMMA.
Kihara et al. [51] measured the impact shear strength of adhe-sive interlayers, and developed an experimental apparatus thatcan be used to deform an adhesive in shear at high strain rates.They used it in conjunction with the FE simulations to determinethe maximum shear stress in the sample at fracture and showedthat it equals the impact shear strength.
The study of failure of plates subjected to low speed impact isimportant for analyzing the survivability of goggles, aircraft can-opy and windshields. Tsai and Chen [52] have investigated thefracture of a glass plate impacted by a spherical (deformable orrigid) body. They related the critical stress developed in the plateto the impact velocity, the plate thickness and the support span.They found that the Hertzian fracture (formation of a fracture coneunder the impact site) is predominant for short support span andthe sample fails due to flexural fracture for large support spans.Fountzoulas et al. [53] used the FEM to investigate the effect ofdefects on the impact response of aluminate spinel (MgAl2O4),polyurethane and PC plates. Gilde et al. [54] performed ballisticimpact tests on monolithic PMMA plates and on glass/PMMA/PClaminates, and exploited the synergy between glass and polymersto create a lightweight transparent armor with improved ballisticresistance. They showed that the laminated structure rather thana monolithic glass increased the ballistic limit by nearly 50% forthe same areal density. In numerical work, the v50 of a structureequals the minimum impact speed required to perforate it.
Zee et al. [55] used a gas gun to conduct impact tests on com-posites made of epoxy matrix reinforced with polyethylene andpolyester fibers. They found that the energy loss mechanisms arethe fracture of the target and the generation of frictional heatdue to the passage of the projectile through the composite. Tarimet al. [56] experimentally studied the ballistic impact performanceof polymer-based composites. They performed high velocity(between 180 and 425 m/s, bullets with mass ranging from 3.2 to15.55 g) impact experiments on composites and showed that add-ing layers to the structure increases its bending and tensile stiff-ness and reduces the residual velocity of the bullet for perforatedtargets.
The low-velocity impact of composite panels is often modeledas quasi-static indentation. Wu and Chang [57] used the finite ele-ment method to study the quasi-static impact of a graphite/epoxysandwich beam with an elasto-plastic foam core. They found thatmatrix cracking could be predicted by comparing the principalstresses in the matrix with the transverse strength of the laminaand used the strain-energy release rate (SERR) to predict thedelamination. Tita et al. [58] studied the low-velocity impact(indentation) response of carbon fiber reinforced epoxy disks byusing a user defined subroutine implemented in the FE code ABA-QUS. They accounted for progressive damage of the material bydegrading the material properties, i.e., the elastic moduli, andfound that the damage induced by indentation is more localizedthan that for impact. Palazotto et al. [59] developed an analyticalmodel for the quasi-static impact of composite sandwich plates.They used stress-based criteria to predict initiation of damageand degraded the stiffness of the materials to study its progression.The model accurately predicted the indentation response of thelaminate panel and the core failure load. Cheon et al. [60] proposedthat the progressive damage of glass fiber-reinforced compositesduring a Charpy impact test be simulated by deleting the fracturedpart of the specimen at each stage of the loading which degrades
the stiffness of the composite and causes the energy to dissipate.Batra et al. [61] used constitutive relations based on a microme-chanical approach to model the impact response of a carbonfiber-reinforced polymer composite plate. They implemented thematerial model in a user-defined subroutine in the finite elementcode ABAQUS and considered inertia effects in the impact simula-tions. They could predict accurately the contact force and the dam-age and failure of the plate.
Stenzler and Goulbourne [62] and Stenzler [63] performedimpact tests on PMMA/Adhesive/PC laminated plates withDFA4700, IM800A and VHB4905 as adhesives. The examinationof the post failure of plates revealed that the front PMMA platehad radial cracks whereas the adhesive and the PC layers remainedundamaged (no failure of the adhesive interlayer or of the PC rearplate was visually noticed). Zhang et al. [64] and Tekalur et al. [65]studied the low speed impact of a PMMA plate, and reported crackpatterns typical of brittle failure. Gunnarson et al. [66] performedimpact tests on monolithic PC plates of various thicknesses. Theyreported time histories of the maximum deflection of 3.0, 4.45and 5.85 mm thick plates for impact velocities between 10 and50 m/s, and found that the penetration velocity for the 5.85 and3.0 mm thick plates equaled 80 m/s and 65 m/s, respectively.Gunnarson et al. [67] conducted impact tests at velocities between10 and 50 m/s on monolithic and laminated structures involvingPMMA, PC and an adhesive. They found that PMMA (PC) has brittle(ductile) failure. Stickle and Shultz [68] simulated oblique ballistic(�750 m/s) impact on a PMMA plate, used the Johnson–Cook dam-age model (accounting for limited plastic deformations of PMMA),and combined it with a principal stress fracture criterion (account-ing for the brittle failure (spalling) of PMMA under tensile loading)to model damage and failure of PMMA.
The mechanical behavior and failure of the PMMA, PC and TPUs(thermoplastic polyurethanes) materials taken separately can beaccurately modeled for a wide range of strains, strain rates andtemperatures. However, the impact response of compositePMMA/adhesive/PC laminates has mostly been studied experimen-tally. Here we propose a mathematical and a computational modelthat accounts for the complex response of the polymeric materialsincluding effects such as strain-rate and temperature dependence,plasticity, viscosity, brittle and ductile failure and predicts theimpact response and survivability of monolithic and laminatedplates. The model includes brittle and ductile failure of the variousconstituents of the plate (failure within the materials) as well asinterfacial failure on faces of the bonding interlayers (delamina-tion). It can predict well the response of laminates to low velocityimpact. It can be used to improve our understanding of theirimpact response, and delineate the role of the different constitu-ents and interactions amongst them. We note that in our simula-tions the steel impactor is regarded as rigid and all contactsurfaces as smooth.
The rest of the paper is organized as follows. Section 2 gives themathematical model of the problem (i.e., problem description, con-stitutive relations for different constituents of the laminate, failurecriteria for the PMMA, the PC, the TPUs, and values of materialparameters). The computational model is described in Section 3,and results of several problems are presented in Section 4, and dis-cussed in Section 5. Conclusions from this work are summarized inSection 6.
2. Mathematical model
2.1. Problem description
A schematic sketch of the problem studied is exhibited in Fig. 1.The laminated rectangular plate of sides L1 and L2, and made ofPMMA/adhesive/PC layers is impacted at normal incidence by a

196 G.O. Antoine, R.C. Batra / Composite Structures 116 (2014) 193–210
slow moving steel cylinder of height h and a hemispherical nose ofdiameter d0. We use rectangular Cartesian coordinate axes withorigin at the centroid of the top face of the rectangular laminatedplate clamped on all four edges, the positive x-axis pointing tothe right and the positive z-axis pointing upwards. The thicknessesof the top PMMA, the middle adhesive and the bottom PC layersare denoted by h1, h2 and h3, respectively. The mathematical modeldeveloped and the analysis technique is applicable to an arbitrarynumber of layers in the laminate, and their materials.
2.2. Equations of motion
We use the Lagrangian description of motion to study deforma-tions of the laminate. Thus balance laws governing deformations ofthe body are:
mass : qJ ¼ q0
linear momentum : q0 _v ¼ r � Tmomentum of momentum : T � FT ¼ F � TT
ð1Þ
Here q and q0 are mass densities in the current and the referenceconfigurations, respectively, J = det(F) is the Jacobian of the defor-mation, F = @x/@X is the deformation gradient that maps a materialpoint from the reference position X to its current location x, a super-imposed dot indicates the material time derivative, v is the velocityof a material point, T is the first Piola–Kirchhoff stress tensor relatedto the Cauchy stress tensor r by T = Jr � F�T, and ðrÞ is the gradientoperator with respect to X.
For low impact speeds, deformations of the steel impactor areassumed to be negligible as compared to those of the compositelaminate. Thus we regard the impactor as rigid. Equations governingthe translational and rotational motion of the rigid impactor are:
xz
y
O
L1
L2
top view of the plate s
PMMA
PC
h1
L1
h3
h2 adhesive (DFA470
O
Fig. 1. Sketch of the imp
translation _p ¼ f
rotation _HC ¼ MC
ð2Þ
Here p and HC are the linear momentum and the moment of linearmomentum (or the angular momentum) of the rigid impactor,respectively, f is the resultant force acting on the impactor, MC isthe moment of forces acting on it, and the subscript C on a quantityimplies that it is calculated with respect to the center of mass C ofthe rigid body.
2.3. Initial, boundary and continuity conditions
We study problems with bounding surfaces of the laminate,except for the surface contacting the impactor, either clamped orfree. At a clamped edge, the three displacement components areset equal to zero. At a free surface, the surface tractions vanish.The contact surface between the impactor and the laminated plateis assumed to be smooth. Thus on it the following continuity con-ditions are imposed.
normal velocity : s _ut � n ¼ 0
normal traction : s_tt � n ¼ 0
tangential traction on contact surface : t� n ¼ 0
ð3Þ
Here double brackets enclosing a variable indicate the jump init across the contact surface, n is a unit normal to the contactsurface, u is the displacement field, t is the traction vector,and the symbol � denotes the cross product between twovectors.
The PMMA, the PC and the adhesive are initially at rest, stressfree and at the uniform temperature of 300 K. At t = 0, the impactorjust contacts the top surface of the laminated structure.
L1
xy
z
O
h3
ide view of the plate and impactor
rigid impactormass minitial velocity v0
h1h2
L2
rigid impactormass minitial velocity v0
0 / IM800A)
xy
z
act problem studied.

G.O. Antoine, R.C. Batra / Composite Structures 116 (2014) 193–210 197
2.4. Constitutive equations for PMMA and PC
The thermo-elasto-visco-plastic response of the PMMA and thePC polymers are modeled following the work of Mulliken and Boy-ce [6] with the modifications suggested by Varghese and Batra[21]. It assumes that the total Cauchy stress tensor r at a materialpoint equals the sum of contributions from three phases, namely B,a and b, i.e., r = rB + ra + rb. The three phases coexist at a materialpoint and have the same value of the deformation gradient F. Thephase B behaves like a non-linear elastic Langevin spring for which
rB ¼CR
3
ffiffiffiffiffiNlp
kp L�1 kpffiffiffiffiffiNlp� �
B0B ð4Þ
Here rB is the Cauchy stress tensor, B0B the deviatoric part of
BB ¼ ðJÞ�2=3FFT; kp ¼ffiffiffiffiffiffiffiffiffiffiffiffiffiffiffiffiffiffitrðBBÞ=3
qa measure of stretch, tr() the trace
operator, L�1 the inverse of the Langevin function defined byL(b) � cothb � 1/b, Nl the limiting stretch, CR � nRkh the rubberymodulus, h the temperature in Kelvin, k Boltzmann’s constant,and nR a material parameter.
The other two phases, a and b, are modeled with the same con-stitutive equation but with different values of material parameters.For each phase the deformation gradient F is decomposed intoelastic and plastic parts, e.g., see Kroner [69] and Lee [70]:
F ¼ FeaFp
a ¼ FebFp
b ð5Þ
Neither Fea; Fe
b nor Fpa; Fp
b is gradient of a vector field. The plasticdeformation gradients Fp
a and Fpb map a material point in the refer-
ence configuration to a material point in the intermediate configu-ration obtained after elastically unloading the current configurationto a stress-free state.
The rate of the plastic deformation gradient in phases a and b isgiven by
_Fpa ¼ _Fe�1
a~Dp
aFa; _Fpb ¼ _Fe�1
b~Dp
bFb ð6Þ
where eDpi is the plastic strain rate tensor in phase i (i = a,b), and it
has been assumed that the plastic spin tensors in phases a and bidentically vanish. We note that eDp
i does not equal the symmetricpart of the velocity gradient (with respect of x) of phase i.
The Hencky elastic strain tensors of phases a and b are definedas
eea ¼ ln
ffiffiffiffiffiffiffiffiffiffiffiffiFe
aFea
Tq� �
; eeb ¼ ln
ffiffiffiffiffiffiffiffiffiffiffiffiFe
bFeb
Tq� �
ð7Þ
and the corresponding Cauchy stress tensors are given by
ra ¼1J
2laeea þ katr ee
a
� �d
� �; rb ¼
1J
2lbeeb þ kbtr ee
b
d
h ið8Þ
where Young’s moduli of phases a and b of PMMA and PC and con-sequently Lame’s constants, k and l, are temperature and strain-rate dependent. They partly capture the temperature and thestrain-rate dependence of the material response while Poisson’sratio is taken to be constant. Using test data given in the Appendixof Mulliken’s thesis [71], we compute the temperature and thestrain-rate dependence of Young’s moduli of PMMA and PC. Theseresults depicted in Figs. 2 and 3 imply that the total Young’s mod-ulus of each material increases with an increase in the strain-rateand decreases with a rise in the temperature. We note that Eq. (8)is valid for finite deformations and accounts for all geometricnonlinearities.
The plastic strain rates are assumed to be coaxial with the devi-atoric Cauchy stress tensors in their respective phases, that is,
~Dpa ¼ _cp
ar0ar0a�� �� ; ~Dp
b ¼ _cpb
r0b
r0b
��� ��� ð9Þ
where r0i ði ¼ a,b) is the deviatoric part of the Cauchy stress in
phase i; r0i�� �� ¼ ffiffiffiffiffiffiffiffiffiffiffiffiffiffiffiffiffi
tr r0ir0i
� �qis the magnitude of r0i, and _cp
i is the effec-
tive plastic strain rate in phase i. This equation implies that
tr eDpi
¼ 0.
The effective plastic strain rates in a and b phases are given by
_cpi ¼ _cp
0i exp �DGi
kh1� si
tisi þ api p
� �� ; i ¼ a; b ð10Þ
where _cp0i ði ¼ a,b) is the pre-exponential factor, DGi the activation
energy, p = �tr(r)/3 the pressure, si ¼ffiffiffiffiffiffiffiffiffiffiffiffiffiffiffiffiffiffiffiffiffiffiffiffi0:5tr r0ir
0i
� �qthe equivalent
shear stress, api the pressure coefficient, si ¼ 0:077li=ð1� v iÞ the
athermal shear strength, vi Poisson’s ratio, k Boltzmann’s constant,and ti an internal variable that evolves with plastic deformations.The variable si is function of li and is, therefore, temperature andstrain-rate dependent. Since no yield surface is postulated plasticdeformations always occur. The evolution of internal variable ti inphases a and b is given by
_ti ¼hi
s0i
1� ti
tssi
� �_cp
i ; i ¼ a; b ð11Þ
where tssi and hi are softening parameters, and s0
i is the referencevalue of si given by the reference values of li and mi. Eq. (11) impliesthat the internal variable ti remains constant for elasticdeformations.
We postulate that the energy dissipated during plastic deforma-tions in the a and b phases is converted into heat, that is
_Q ¼ J � ra : ~Dpa þ rb : ~Dp
b
ð12Þ
where _Q is the heat generated per unit volume in the reference con-figuration. It is assumed that heating is mostly adiabatic for theimpact problems studied here because there is not enough timefor the heat to be conducted away, and neglecting heat conductionfacilitates numerical integration of the governing differential equa-tions. Thus the temperature rise is given by
q0c _h ¼ _Q ð13Þ
where c is the specific heat of either the PMMA or the PC.We refer the reader to Mulliken and Boyce [6] and Varghese and
Batra [21] for the determination of values of material parametersfrom the test data for the PMMA and the PC, and for the compari-son of the computed and experimental axial stress vs. axial straincurves.
2.5. Constitutive equations for the adhesives
We assume that the adhesive can be modeled as a nearlyincompressible rubberlike material [63] with the elastic responsegiven by the Ogden strain energy density function W and the vis-coelastic response by the Prony series [72,73]. That is,
W ¼XN
n¼1
ln
an
~kan1 þ ~kan
2 þ ~kan3 � 3
þ KðJ � 1� lnðJÞÞ ð14Þ
where N is an integer, ~ki ¼ ðJÞ�1=3ki is the volumetric independentprincipal stretch, an and ln are material parameters, and K and G,respectively, the initial bulk and the shear moduli given byK ¼ 2ð1þvÞ
3ð1�2vÞG; G ¼ l ¼ 12
PNn¼1anln
The viscoelastic response of the adhesive is assumed to obey thefollowing constitutive relation proposed by Christensen [73].
_rve ¼XM
m¼1
2GmDdev �XM
m¼1
2bmGm
Z t
s¼0e�bmðt�sÞDdevðsÞds ð15Þ

Strain Rate [/s]
You
ng's
mod
ulus
[GPa
]
10-3 10-2 10-1 100 101 102 103 1041
1.5
2
2.5
3
3.5
4
4.5
PMMA , θ = 300 KPMMA , θ = 325 KPMMA , θ = 350 KPC , θ = 300 KPC , θ = 325 KPC , θ = 350 K
Fig. 2. Variation with the strain rate of the total Young’s modulus (Ea + Eb) of the PMMA and the PC.
Temperature [°C]
You
ng's
mod
ulus
[GPa
]
0 5 10 15 20 25 30 35 40 45 501
2
3
4
5
PMMA , 0.1/sPMMA , 1/sPMMA , 1000/sPC , 0.1/sPC , 1/sPC , 1000/s
Fig. 3. Variation with the temperature of the total Young’s modulus (Ea + Eb) of the PMMA and the PC.
198 G.O. Antoine, R.C. Batra / Composite Structures 116 (2014) 193–210
Here M is the number of terms in the summation, _rve is the co-rotated rate of stress tensor (see [74] for the definition of co-rotatedtensors), Ddev is the co-rotated deviatoric rate-of-deformation ten-sor, and Gm and bm are material parameters representing, respec-tively, the shear moduli and the inverse of relaxation times. Notethat there are 2 terms that determine the instantaneous elasticresponse of the material: Eq. (14) and the 1st term on the right-hand side of Eq. (15)
Heating of the adhesive caused by the energy dissipated due toviscous deformations is neglected since it is usually very small.
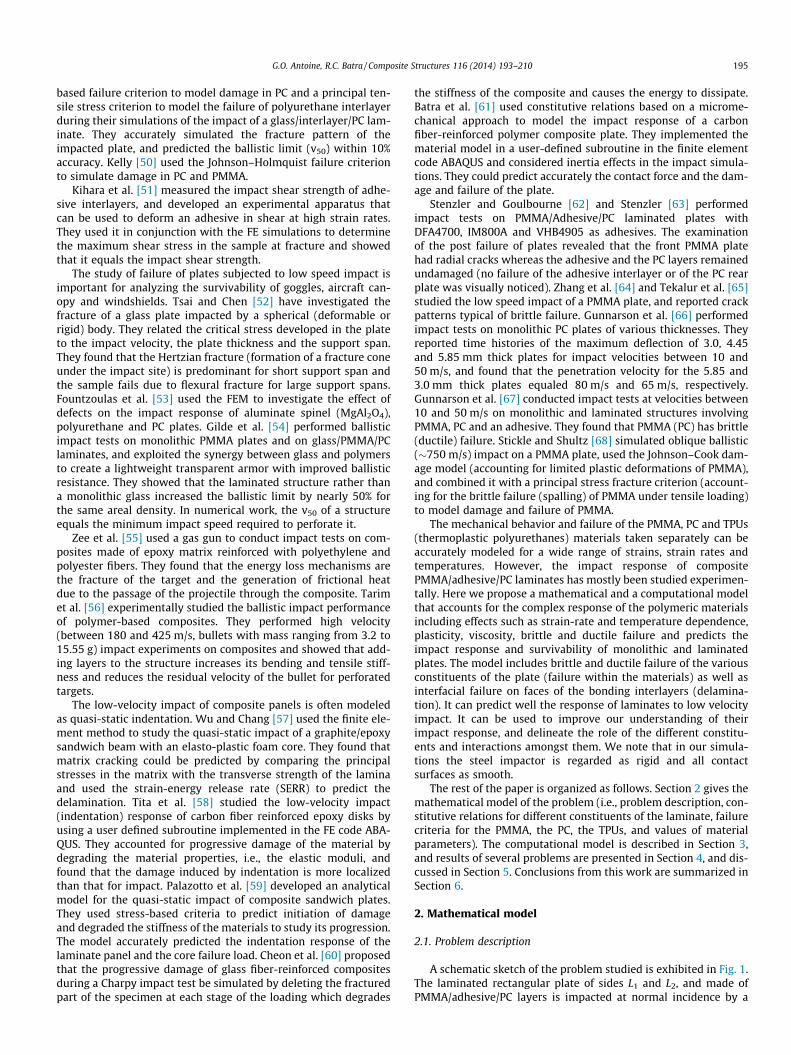
We use the test data of Stenzler [63] to find values of materialparameters for the DFA4700 and the IM800A. Stenzler tested thesematerials in uniaxial tension at engineering strain rates of 0.01, 0.1,1.0 and 5.0/s and in uniaxial compression at 0.001/s. The tests at0.01/s and 0.001/s are assumed to correspond to the static nonlin-ear elastic response of the material and are used to find values ofmaterial parameters in the strain energy density potential (seeEq. (14)). As described below, for the DFA4700 (IM800A), two(one) terms in Eq. (14) are necessary to achieve satisfactory agree-ment (within 5% deviation) between the computed and the exper-imental axial stress–axial strain curves. Assuming that theadhesive material is incompressible, the axial stress–axial strainrelation for a uniaxial tensile test conducted at constant engineer-ing strain rate is:
rTrue ¼XN
n¼1
ln expðaneTrueÞ � exp �12aneTrue
� �� �
þXM
m¼1
3Gm exp � expðeTrueÞ_eEng bm
� �
� EiexpðeTrueÞ
_eEng bm
� �� Ei
bm
_eEng
� �� ð16Þ
where rTrue is the axial Cauchy stress, eTrue the axial logarithmicstrain, _eEng the constant engineering strain rate at which the test
is conducted, and EiðxÞ ¼ �R1
t¼�xe�t
t dt. The software Mathematicawas used to find values of parameters in Eq. (16) so that the com-puted axial stress–strain curve is close to the experimental one. Asingle term in the series for the IM800A and two terms for theDFA4700 adhesive were found to be sufficient. The values of mate-rial parameters are given in Table 1, and the computed and theexperimental stress–strain curves are depicted in Fig. 4 for theDFA4700 and in Fig. 5 for the IM800A. The deviations betweenthe two sets of curves are listed in Table 2. We note that the twoadhesives are assumed to be slightly compressible because wecould not model incompressible materials in LS-DYNA. The threedifferent values, 0.490, 0.495 and 0.498, of Poisson’s ratio showedno noticeable differences among the computed results. The numer-ical results presented and discussed herein are obtained with Pois-son’s ratio = 0.498 which gives the initial bulk modulus of about 250times the initial shear modulus. Values of Poisson’s ratio greaterthan 0.498 significantly increase the computational cost, and werenot considered. We note that only the monotonic part of the exper-imental axial stress–strain curve has been employed to find valuesof material parameters.
2.6. Failure models
We model the brittle failure of PMMA in tension by using thefollowing maximum tensile stress based criterion proposed byFleck et al. [47]:
rf ¼1v f
kT ln_e_e0
� �þ Q f
� �ð17Þ
Here _e is the effective strain rate, _e0 ¼ 1:0=s the reference effectivestrain rate, k the Boltzmann constant, rf the tensile stress atfailure, T the local temperature in Kelvin, Qf = 2.95 � 10�19 J andvf = 2.30 � 10�18 mm3. These values of Qf and vf correspond to178 kJ/mol activation energy and 2.3 nm3 activation volume and
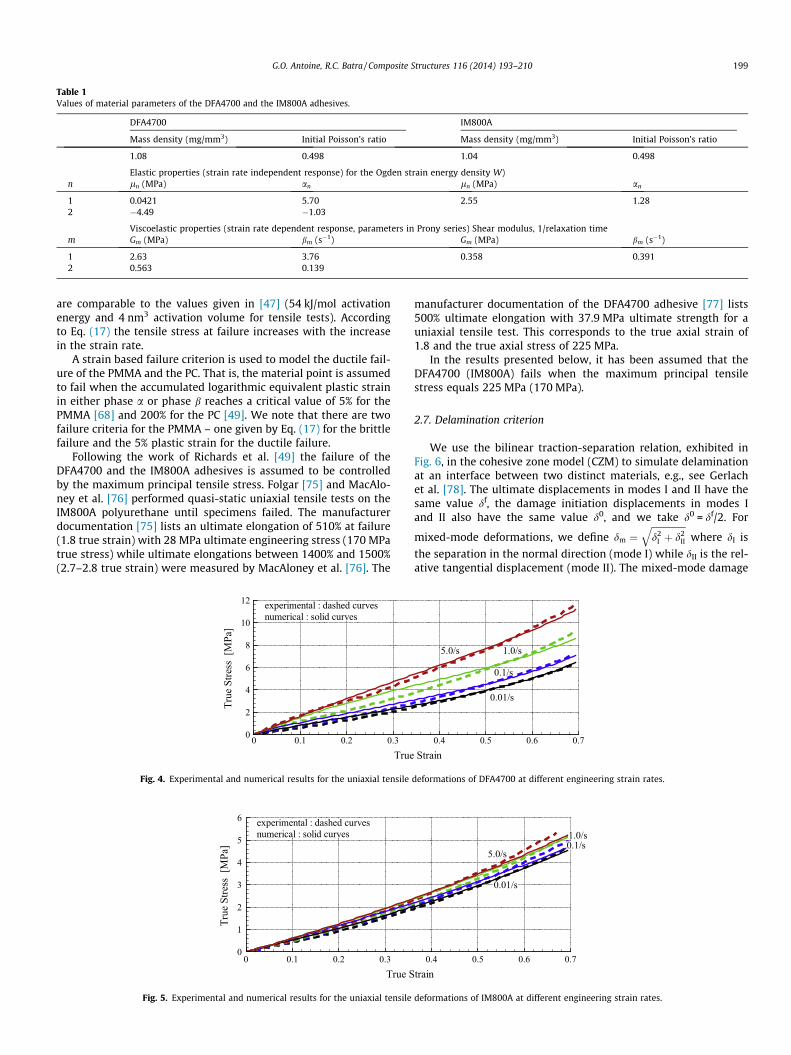
Table 1Values of material parameters of the DFA4700 and the IM800A adhesives.
DFA4700 IM800A
Mass density (mg/mm3) Initial Poisson’s ratio Mass density (mg/mm3) Initial Poisson’s ratio
1.08 0.498 1.04 0.498
Elastic properties (strain rate independent response) for the Ogden strain energy density W)n ln (MPa) an ln (MPa) an
1 0.0421 5.70 2.55 1.282 �4.49 �1.03
Viscoelastic properties (strain rate dependent response, parameters in Prony series) Shear modulus, 1/relaxation timem Gm (MPa) bm (s�1) Gm (MPa) bm (s�1)
1 2.63 3.76 0.358 0.3912 0.563 0.139
G.O. Antoine, R.C. Batra / Composite Structures 116 (2014) 193–210 199
are comparable to the values given in [47] (54 kJ/mol activationenergy and 4 nm3 activation volume for tensile tests). Accordingto Eq. (17) the tensile stress at failure increases with the increasein the strain rate.
A strain based failure criterion is used to model the ductile fail-ure of the PMMA and the PC. That is, the material point is assumedto fail when the accumulated logarithmic equivalent plastic strainin either phase a or phase b reaches a critical value of 5% for thePMMA [68] and 200% for the PC [49]. We note that there are twofailure criteria for the PMMA – one given by Eq. (17) for the brittlefailure and the 5% plastic strain for the ductile failure.
Following the work of Richards et al. [49] the failure of theDFA4700 and the IM800A adhesives is assumed to be controlledby the maximum principal tensile stress. Folgar [75] and MacAlo-ney et al. [76] performed quasi-static uniaxial tensile tests on theIM800A polyurethane until specimens failed. The manufacturerdocumentation [75] lists an ultimate elongation of 510% at failure(1.8 true strain) with 28 MPa ultimate engineering stress (170 MPatrue stress) while ultimate elongations between 1400% and 1500%(2.7–2.8 true strain) were measured by MacAloney et al. [76]. The
True
True
Stre
ss[M
Pa]
0 0.1 0.2 0.30
2
4
6
8
10
12 experimental : dashed curvesnumerical : solid curves
Fig. 4. Experimental and numerical results for the uniaxial tensile
True S
True
Stre
ss[M
Pa]
0 0.1 0.2 0.30
1
2
3
4
5
6 experimental : dashed curvesnumerical : solid curves
Fig. 5. Experimental and numerical results for the uniaxial tensile
manufacturer documentation of the DFA4700 adhesive [77] lists500% ultimate elongation with 37.9 MPa ultimate strength for auniaxial tensile test. This corresponds to the true axial strain of1.8 and the true axial stress of 225 MPa.
In the results presented below, it has been assumed that theDFA4700 (IM800A) fails when the maximum principal tensilestress equals 225 MPa (170 MPa).
2.7. Delamination criterion
We use the bilinear traction-separation relation, exhibited inFig. 6, in the cohesive zone model (CZM) to simulate delaminationat an interface between two distinct materials, e.g., see Gerlachet al. [78]. The ultimate displacements in modes I and II have thesame value df, the damage initiation displacements in modes Iand II also have the same value d0, and we take d0 = df/2. For
mixed-mode deformations, we define dm ¼ffiffiffiffiffiffiffiffiffiffiffiffiffiffiffid2
I þ d2II
qwhere dI is
the separation in the normal direction (mode I) while dII is the rel-ative tangential displacement (mode II). The mixed-mode damage
Strain0.4 0.5 0.6 0.7
5.0/s
0.01/s
0.1/s
1.0/s
deformations of DFA4700 at different engineering strain rates.
train0.4 0.5 0.6 0.7
1.0/s0.1/s
0.01/s
5.0/s
deformations of IM800A at different engineering strain rates.

Table 2Deviations in L2-norm between the predicted and the experimental responses of theDFA4700 and the IM800A subjected to axial loading.
Engineering strain rate 0.01/s 0.1/s 1.0/s 5.0/sDFA4700 5.01% 6.50% 9.87% 3.74%IM800A 3.97% 5.10% 5.81% 4.50%
200 G.O. Antoine, R.C. Batra / Composite Structures 116 (2014) 193–210
initiation displacement is d0m ¼ d0. Likewise the mixed-mode ulti-
mate displacement is dfm ¼ df .
Different values of the ultimate displacement df between 0.01and 0.05 mm gave essentially the same values of the resisting forceexperienced by the impactor and the energy dissipated. Here wehave assumed that df = 0.05 mm. The value of the maximum trac-tion in the CZM is determined from the value of the critical strainenergy release rate (SERR) for the interface.
Pickett et al. [79] have conducted 90� peel tests on aluminum/DFA4700/PC assemblies, and reported the peel strength of26.18 kN/m for one adhesive/PC configuration. Thus 26.2 N/mm(or equivalently 0.02618 J/mm2) corresponds to the mode I tough-ness of the DFA4700/PC interface. Due to lack of data about themode II toughness of this interface, we assume that GII,C = 2GI,C,which is typical for an interface between a soft polyurethane adhe-sive and a material with surface properties similar to those of PC.Furthermore, it is assumed that the PMMA/DFA4700 andDFA4700/PC interfaces have the same toughness values.
The manufacturer documentation for the IM800A [75] givesresults of 90� peel tests of the IM800A from a glass substrate. For80, 90, 100 and 120 �C temperature, the IM800A/glass peel forceequals, respectively, 144, 155, 160 and 138 pli (pounds per linearinch). A linear fit of the peel force vs. the temperature through thefirst three data points gave the peel strength of 17 N/mm at 20 �C.
It was then assumed that the PMMA/IM800A and the IM800A/PC interfaces have the same properties as the IM800A/glass inter-face, and that GII,C = 2GI,C.
3. Computational model
3.1. General description
We use the commercial FE software LS-DYNA with explicit sol-ver in which constitutive relations for the PMMA and the PC havebeen implemented in a user-defined subroutine written in FOR-TRAN. The software has in-built material model to simulate defor-mations of the adhesives.
For an impact problem, Khalili et al. [80] computed numericalresults for different choices of the shell element, the integrationscheme and the FE mesh. They found that the ‘‘unstructured’’ meshgave better results in terms of convergence vs. computational cost.We also observed a similar trend (see description of the FE mesh
Fig. 6. Traction-separation law for delamination in m
later in this section). They also showed that assuming the impactorto be rigid reduces the computation time with minor effects on thenumerical results.
As stated above, the impactor has been modeled as a rigid bodytranslating with a uniform velocity normal to the impact surface.All contact surfaces are assumed to be frictionless. Non-interpene-tration of one material into the other is satisfied by using a pen-alty-based contact algorithm that considers the newly formedsurfaces due to the deletion of failed elements.
In LS-DYNA, the governing partial differential equations are firstreduced to nonlinear and coupled ordinary differential equations(ODEs) in time by using the Galerkin approximation. The ODEsare integrated with respect to time by using the explicit condition-ally stable central-difference method using the lumped massmatrix. The critical time step size equals the time taken for an elas-tic wave to propagate through the smallest element in the FE mesh.We set the time step size equal to a fraction of the critical time stepto ensure stability of the computed solution. The effect of the timestep size on the numerical solution was investigated and the timestep is fixed to a value for which the numerical solution converged.Of course, each FE mesh requires a different time step size.
The FE mesh consisted of 8-node brick elements with one pointintegration (reduced integration) used to evaluate element matri-ces. Since zero energy deformation modes (or hourglass modes)can arise due to using reduced integration rule, an hourglass con-trol algorithm was used. The suitability of this algorithm waschecked with a 3D-patch test. A cube is discretized into sevenirregularly shaped hexahedrons (one for each face and one forthe center, see Fig. 7). The master cube is then quasi-staticallydeformed in uniaxial tension. Results computed with the defaultand the Belytschko–Bindeman formulations are shown in Fig. 8for an isotropic elastic material with Young’s modulus = 1 GPaand Poisson’s ratio = 0.25. The later formulation was selected forall numerical simulations presented herein. The energy of hour-glass mode deformations was found to be less than 5% of the peakstrain energy of the elastic cube implying that the hourglass modesdid not introduce significant errors in the numerical solution.
For the Hertz contact problem analyzed with LS-DYNA, themaximum difference between the computed and the analyticalreaction force was found to be 9.1%.
For each impact problem studied in this paper, results werecomputed with at least two FE meshes. The FE mesh A was uni-formly refined to obtain a finer mesh B having at least 30% morenodes than those in mesh A. The solution with two FE mesheswas taken to have converged if the difference in two values ofthe reaction force, the energy dissipated and the length of theradial cracks was less than 10%. For brevity we describe here themesh used for the impact simulations of the laminate discussedin Section 4.3 (and that gave the converged solution). For each
ode I (bottom, left) and mode II (bottom, right).

1 m
1 m 1 m
elem#1
elem#2
elem#3
elem#4
elem#5
elem#6
elem#7
zxy
Fig. 7. Master cube formed with seven irregularly shaped hexahedrons used to check the hourglass control formulation.
Axial Strain
Axi
alSt
ress
[MPa
]
0 0.02 0.04 0.06 0.08 0.10
20
40
60
80
100
120
AnalyticalNumerical
Axial Strain
Axi
alSt
ress
[MPa
]
0 0.02 0.04 0.06 0.08 0.10
20
40
60
80
100
120
AnalyticalNumerical
curves overlap
Fig. 8. Analytical stress and the computed stress in the seven hexahedron elements for the uniaxial tensile test of the master cube. Left (Right): with the default (theBelytschko–Bindeman) hourglass control.
G.O. Antoine, R.C. Batra / Composite Structures 116 (2014) 193–210 201
one of the three layers the mesh in the xy-plane is the same. ThePMMA, the interlayer and the PC are discretized, respectively, with9, 6 and 9 uniform elements through the thickness. The CZM ele-ments are initially flat and placed at the adhesive interfaces. Thepattern of the FE mesh in the xy-plane is obtained by partitioningthe plate along its diagonals. Then each of the four quarters of theplate is partitioned by a 10-mm radius circle centered at the pointof impact. Each quarter of circumference of the circle, the part ofeach one of the four diagonals that are within the circle, and eachedge of the plate are discretized with 55 uniform elements. Theouter part of the plate diagonals, i.e., the part located more than10-mm from the plate center, was divided into 64 segments of dif-ferent lengths so that the ratio of the smallest segment – locatednear the circle – to the largest segment – located at the corner –equaled 15. The mesh in the impactor near the contact regionwas refined until the element size there was comparable to thatof the elements at the plate center. The rest of the impactor wasdiscretized with coarse elements. The FE mesh had 19,680 ele-ments in the impactor, 209,376 elements in the PMMA and thePC layers, 139,584 elements in the adhesive interlayer, and23,264 flat CZM elements in each interface.
The computed values of the time histories of the reaction forceand the energy dissipated with perfect bonding at the PMMA/adhesive and the adhesive/PC interfaces differed from those com-puted considering delamination at these interfaces by less than5%. Thus we present and discuss here only the results obtainedusing CZM elements at the adhesive interfaces.
3.2. Calculation of the energy dissipation
There are two main sources of energy dissipation, namely,energy dissipated due to failure of the materials (modeled withelement deletion) and the energy dissipated due to inelastic
deformations of the material (plasticity, viscosity, softening).When a failed element is deleted from the computational domain,its internal energy and kinetic energy are also removed. Thisdecreases the energy of the remaining system. This change inenergy is referred to as the eroded energy in LS-DYNA. The erodedenergies calculated by LS-DYNA were verified using a set of simpleproblems for which internal and kinetic energies could be analyti-cally determined and compared with the computed ones.
The energy dissipated due to viscous deformations of the adhe-sives is computed during the post-processing phase. The energydissipated due to inelastic deformations of the PMMA and the PCis calculated for each element at each time step inside the subrou-tine developed for these materials. There are two sources ofdissipation for these materials: energy dissipated by plastic defor-mations, and energy dissipated by the softening of the materialattributed to decrease in Young’s modulus caused by the tempera-ture rise. This latter contribution to the energy dissipated will bereferred to as ‘‘softening energy’’. An analogy for 1D linear elastic-ity and discrete stiffnesses (i.e., springs) is shown in Fig. 9. Due tostretching of the springs elastic energy is stored in the system.Subsequent heating reduces the stiffness of the material that canbe simulated by removing a spring which dissipates a part of theelastic energy stored in the spring that is taken out of the system.
4. Results and discussion
4.1. Impact of monolithic PMMA plates
We first simulate the impact experiments of Zhang et al. [64] inwhich initially stationary and stress free clamped circular 6.35 mmthick PMMA plates of 76.2 mm diameter are impacted at normalincidence by 6.95 kg cylindrical impactor with hemispherical noseof 12.7 mm diameter translating at 0.7, 1.0, 2.0, 3.0 or 5.0 m/s. It is

Fig. 9. Visualization of the energy dissipated due to material softening for 1D linear elastic system with a discrete spring model.
202 G.O. Antoine, R.C. Batra / Composite Structures 116 (2014) 193–210
clear from the experimental and the computed fracture patterns inthe plates impacted at 2.0 m/s and 3.0 m/s shown in Fig. 10 thatthe two sets of results agree well qualitatively. Both in tests andin simulations radial cracks but no hole developed in the plateimpacted at 2.0 m/s, while the panel impacted at 3.0 m/s had radialcracks and had been perforated by the drop weight. The computednumber of cracks and the crack patterns differ from those foundexperimentally.
4.2. Impact of monolithic PC plates
We now simulate impact experiments of Gunnarson et al. [66]in which initially stationary and stress free clamped square PCplates of side 25.4 cm and different thicknesses are impacted atnormal incidence by a 104 g cylindrical steel impactor with hemi-spherical nose of 12.7 cm diameter. For various values of the platethickness and the impact speed, we have compared in Table 3 theexperimentally measured and the computed maximum deflectionsof the center of the back surface of the plates. The maximum differ-ence in the two sets of values of 10.3% validates the mathematicalmodel for the impact of the PC plate, at least for finding the max-imum deflections. In Fig. 11 we have plotted time histories of theexperimental and the computed deflections of the center of theback surface of the 5.85 and 12.32 mm thick panels impacted atvarious velocities. While the time of return to 0 deflection is well
Experimental [64]
v0 = 2.0 m/s
v0 = 3.0 m/s
Fig. 10. Experimental and computed fracture patterns in the PMMA panels impacted a
captured by the model for the 12.32 mm thick panel, it is not sofor the 5.85 mm thick panel especially at the higher impact speedof 50.6 m/s.
The time periods of the first three modes of free vibrations ofthe 5.85 mm and the 12.32 mm thick clamped PC plates are 1.32,1.60, 2.35 ms, and 0.66, 0.80, 1.12 ms, respectively. Comparingthese with the time histories of the deflection of the plates shownabove, we see that there is no clear correlation between the timeperiods of free vibration and time periods of the contact forcehistories.
4.3. Impact of laminated plates
We now study transient deformations of 12.7 � 12.7 cm2
clamped PMMA/Adhesive/PC laminated plate impacted at normalincidence by a 28.5 g 1-cm diameter hemispherical nosed steel cyl-inder at either 12 m/s or 22 m/s. Using the notation of Fig. 1, we seth1 = h3 = 1.5875 mm, and h2 = 0.635 mm for the adhesive inter-layer. Thus the top PMMA and the bottom PC layer have the samethickness. This configuration was used by Stenzler [63] in hisexperiments.
Time histories of the experimental [63] and the computed reac-tion force for the plates bonded with the DFA4700 and the IM800Aadhesives are displayed in Fig. 12 and the deviations between thetwo sets of results are summarized in Table 4.
Computed
t normal incidence by the rigid cylindrical impactor translating at 2.0 and 3.0 m/s.

Table 3Comparison of the experimental and the computed maximum deflections (measured at the center of the back face of the plate) of the clamped circular PC panels.
Panel thickness (mm) Impact velocity (m/s)
10 20 30 40 50
Experimental (computed) maximum deflection (mm)
3.00 13.2 (13.0)error: �1.5%
16.1 (17.1)error: +6.2%
4.45 9.4 (9.0)error: �4.3%
12.9 (13.1)error: +1.6%
5.85 6.5 (7.1)error: +9.2%
10.9 (10.2)error: �6.4%
15.2 (14.8)error: �2.6%
19.2 (19.0)error: �1.0%
22.0 (22.7)error: +3.2%
9.27 10.2 (10.4)error: +2.0%
11.3 (12.1)error: +7.1%
14.0 (14.8)error: +5.7%
12.32 6.9 (7.3)error: +5.8%
8.7 (9.6)error: +10.3%
10.7 (11.3)error: +5.6%
G.O. Antoine, R.C. Batra / Composite Structures 116 (2014) 193–210 203
The time periods of the first four modes of free vibrations of theclamped laminated plates are 0.82, 0.96, and 1.34 ms (two modes)for the plate with the DFA4700 interlayer, and 0.97, 1.03, and1.43 ms (two modes) for the IM800A adhesive. Therefore we cansee that for both plates the drop in the reaction force coincideswith the time period of the 1st mode, the second peak to that ofthe 2nd mode, and the contact termination with that of the 3rdperiod.
We note that the computed and the experimental time historiesof the reaction force for the PMMA/DFA4700/PC laminate are closeto each other except for small times for the 22 m/s impact speedand around 1.2 ms for the 12 m/s impact speed. The large local dif-ferences between the two curves give L2-norms of deviations of�0.25. However, the numerically computed results for thePMMA/IM800A/PC laminate differ noticeably from the correspond-ing test findings for times beyond the time of the first peak in thereaction force. In particular the second spike in the computed reac-tion force at t 1.1 ms is not found in test results. The qualitativeshape of the reaction force history curve (two peaks separated by adrop) is consistent with the experimental results of Wu and Chang[57] and to the corresponding simulations by Her and Liang [81]who used ANSYS/LS-DYNA (these results were obtained for low-velocity impact of graphite/epoxy composites). Moreover wenotice that the maximum value reached by the reaction force isnearly proportional to the impact velocity, which agrees with theobservations of Her and Liang [81].
The characteristics of the computed crack patterns in the PMMAplate are compared with those found experimentally in Table 5. InFig. 13 we have exhibited the crack patterns on the back surface ofthe PMMA plate obtained for the impact speed of 12 m/s, and inFigs. 14 and 15 we have depicted the experimental and the com-puted post-impact failure of the PMMA plate. These two sets of
Time [ms]
Def
lect
ion
[mm
]
0 1 2 3 4 5-10
-5
0
5
10
15
20
25 10.7m/s50.6m/s
Fig. 11. Time histories of the experimental (solid curves) and the computed (dashed curv(left) and 12.32 mm (right).
results are in good agreement with each other for the four impactscenarios studied. One can conclude from these results that theadhesive significantly affects the fracture of the PMMA plate sincea change in the adhesive material noticeably alters the fractureinduced in the PMMA plate. The evolution with time of the failedand hence the deleted region in the PMMA plate is also exhibitedin Fig. 15. Whereas in the simulations, a cavity is developed inthe PMMA plate, in tests this material is severely deformed andits mechanical properties severely degraded but it is not removedfrom the plate.
The energy balance at the instant of separation of the impactorfrom the laminates is given in Table 6. For the laminate using theDFA4700 (IM800A) this time equals �1.6 (1.8) ms and �1.4(1.6) ms, respectively, for 12 m/s and 22 m/s impact speeds.
Values of different energies listed in the Table indicate that themain energy dissipation mechanisms are plastic deformations ofthe PC plate and the energy dissipated due to cracking (elementdeletion) of the PMMA plate. Since the PMMA is brittle, it is notsurprising that its plastic deformations are negligible. The onlymaterial which partially failed in the simulations is the PMMA.The failure criteria for the other materials were not met at anypoint in their domains. The energy dissipated due to viscous defor-mations of the adhesives is small, which is consistent with thelarge relaxation times (b�1 � 1 s) of the DFA4700 and the IM800Aas compared to the impact duration (�1 ms) considered. Thedelamination at the adhesive interfaces dissipated a negligibleamount of energy. For the lowest impact velocity, the dissipationdue to the softening of the PMMA and the PC materials contributedto about 7% of the total energy dissipation.
By comparing results depicted in Figs. 14 and 15, and consider-ing the energy dissipated due to cracking of the PMMA plate listedin Table 6, we conclude that choosing a softer – in terms of the
Time [ms]
Def
lect
ion
[mm
]
0 1 2 3 4 5-6
-4
-2
0
2
4
6
8
10
1230.0m/s40.7m/s48.9m/s
es) deflections of the centers of the back face of the PC plates of thickness 5.85 mm

Time [ms]
Rea
ctio
nFo
rce
[kN
]
0 0.4 0.8 1.2 1.60
0.5
1
1.5
Time [ms]
Rea
ctio
nFo
rce
[kN
]
0 0.5 1 1.5 20
0.5
1
1.5
Fig. 12. Experimental (dark curves) and computed (red curves) reaction force time histories for the PMMA/DFA4700/PC (left) and the PMMA/IM800A/PC (right) platesimpacted at 12 m/s (dashed curves) and 22 m/s (solid curves). (For interpretation of the references to color in this figure legend, the reader is referred to the web version ofthis article.)
Table 4L2-norm of the difference between the experimental and the computed reaction forcevs. time curves.
Plate 12 m/s Impact velocity 22 m/s Impact velocityPMMA-DFA4700-PC 0.26 0.23PMMA-IM800A-PC 0.46 0.43
10 mm 10 mm
Fig. 13. Computed fracture patterns on the back surface of the PMMA plates of thePMMA/DFA4700/PC (left) and the PMMA/IM800A/PC (right) laminates for theimpact speed of 12 m.
204 G.O. Antoine, R.C. Batra / Composite Structures 116 (2014) 193–210
instantaneous modulus – adhesive interlayer (IM800A overDFA4700) induces longer cracks and hence larger energy dissipa-tion due to failure of the impacted front PMMA layer but decreasesthe energy dissipated due to plastic deformations of the PC layer. Inorder to relate this to the stress wave reflections introduced by theacoustic impedance mismatch at the PMMA/adhesive and theadhesive/PC interfaces, we consider their 1-D deformations andlinear elastic response. The acoustic impedance of the PMMA,DFA4700 and IM800A are, respectively, �2.3, 0.11 and0.077 mg mm�2 ls�1. Therefore, in this approximation, 9% of thestress wave amplitude coming from the PMMA material and reach-ing the PMMA/DFA4700 interface will be transmitted to theDFA4700 interlayer, while only 6% will be transmitted for thePMMA/IM800A interface. Since the rest of the stress wave isreflected, stresses in the PMMA layer induce more damage withthe IM800A adhesive. This also explains, at least partially, thelower energy dissipation in the PC layer with the IM800A ratherthan the DFA4700 as the adhesive. In Fig. 16, we have exhibitedfringe plots of the larger of the effective plastic strain in the aand the b phases at the bottom surface of the PC plate, and in aplane orthogonal to the plate edge. It is clear that larger surfacearea of the PC plate is more severely plastically deformed for theDFA4700 adhesive as compared to that for the IM800A adhesive.
Time histories of the in-plane lengths of the computed crackson the back surface of the PMMA layer in the two laminates forimpact speeds of 12 and 22 m/s are plotted in Figs. 17 and 18,respectively.
Table 5Comparison of the experimental and the computed fracture patterns on the back surface
Impact velocity (m/s) Interlayer material Experimental
12 DFA4700 No damaged material at the imp5 cracks, length 4–7 mm
12 IM800A No damaged material at the imp5 cracks, length 14–17 mm
22 DFA4700 Diameter of damaged zone at the7 cracks, length 11–12 mm
22 IM800A Diameter of damaged zone at the6 cracks, length 22–28 mm
The length of a radial crack increases rapidly in the early forma-tion phase (25–35 ls for the 12 m/s impact speed, 5–15 ls for the22 m/s impact speed) and the crack speed reaches a peak value of1.0 mm/ls (1 km/s) for the four cases investigated. For 5000/sstrain rate (which is typical for impact problems) and 300 K tem-perature the speed of an elastic wave in the PMMA is �2.5 mm/ls and the Rayleigh wave speed is 1.19 mm/ls. Thus the maximumcrack speed is 40% of the elastic wave speed and 84% of the Ray-leigh wave speed. The crack initiation times and the correspondingvalues of the maximum principal stress and the strain rate at thecrack initiation site are given in Table 7. The maximum principalstress in the PMMA at the time of crack initiation is essentiallythe same for the four cases studied, and the strain rate for the12 m/s impact speed is about 40% less for the IM800A adhesivethan that for the DFA4700 adhesive. Also, the crack initiates 4 lsearlier with the IM800A interlayer than that with the DFA4700adhesive. For the higher impact speed of 22 m/s, the crackinitiation times, the maximum principal stress and the strain ratesare essentially the same for the two adhesives.
of the PMMA plate for the PMMA/DFA4700/PC and the PMMA/IM800A/PC laminates.
Computed
act site No damaged material at the impact site4 cracks, length 10–11 mm
act site No damaged material at the impact site4 cracks, length 12–13 mm
impact site = 5 mm Diameter of damaged zone at the impact site = 6 mm8–9 cracks, length 10–11 mm
impact site = 5 mm Diameter of damaged zone at the impact site = 7 mm8 cracks, length 31–33 mm

10 mm
t = 7.52 µs
t = 10.0 µs
t = 12.5 µs
t = 15.0 µs
t = 17.5 µs
t = 20.0 µs
5 mm
x = y = 0
Fig. 14. Details of the experimental (left) [63] and the computed (right) fracturepattern on the back surface of the PMMA plate of the PMMA/DFA4700/PC laminatefor the impact speed of 22 m/s, (bottom) the view normal to (ex + ey) (since themain cracks form along the diagonals) for the PMMA plate at various times.
10 mm
Fig. 15. (Top) Details of the experimental (left) [63] and the computed (right)fracture pattern on the back surface of the PMMA plate for the PMMA/IM800A/PClaminate for the impact speed of 22 m/s.
G.O. Antoine, R.C. Batra / Composite Structures 116 (2014) 193–210 205
The reaction force, the energy dissipation, the deflection (mea-sured at the center of the back face of the PC layer) and the in-plane extension of the cracks in the PMMA are plotted against timein Fig. 19. More than 75% of the erosion energy is not due to theelongation of radial cracks but due to the formation of the ‘‘second-ary cracks’’, i.e., to the formation of smaller cracks and to the dam-age induced at the impact site (e.g., see Fig. 20 in which crackpatterns at t = 0.8 and 1.0 ms are exhibited). This is because thenumber of elements that fail due to ductile failure (Johnson–Cookdamage criterion) increases with time and more energy/volume isdissipated due to the ductile failure than that due to the brittle fail-ure. We also notice that the drop in the reaction force (at �0.7 ms)occurs when the plate deflection is the maximum. At this time, theradial cracks have reached their maximum length. There is almost
no energy eroded subsequent to the reaction force decreasing to0.65 kN at t = �0.7 ms as shown by the eroded energy reaching aplateau between 0.65 ms and 0.90 ms. The majority of the energyerosion occurs during the spring back phase of the plate (reloadingcorresponding to the second peak of the reaction force, and returnto the 0 deflection position).
5. Summary and discussion
We have analyzed by the FEM transient deformations of PMMA/DFA4700/PC and PMMA/IM800A/PC laminates impacted at normalincidence by a 28.5 g hemispherical nosed steel cylinder translat-ing at 12 m/s and 22 m/s. The computed results are found to rea-sonably agree with the corresponding experimental ones. Thesesimulations confirm the ‘‘sacrificial’’ role of the front PMMA plate.Results computed by enhancing the failure stress of the PMMA by15% induced less damage in the impacted face of the PMMA in thePMMA/DFA4700/PC laminate but increased by 20% damage at thecenter of the rear face of the PC plate. Hence plastic deformationsand failure of the impacted PMMA plate dissipate energy and pro-tect the rear plate of the assembly.
In Fig. 21 are plotted the equivalent stress r ¼ffiffiffiffiffiffiffiffiffiffiffiffiffiffiffiffi32 r0 : r0
qagainst
the effective strain e ¼ffiffiffiffiffiffiffiffiffiffiffiffiffiffi23 e0 : e0
qat the center of the back surface of
the PC layer (where the damage is maximum). Here r0 is the devi-atoric part of the Cauchy stress tensor and e0 the deviatoric part ofthe Hencky strain tensor. The stress–strain curves for the PMMA/DFA4700/PC and the PMMA/IM800A/PC laminates are qualitativelysimilar, but the times corresponding to various features of thecurves and magnitudes of the stresses and strains differ quantita-tively. In both cases the yield stress of PC – about 80 MPa – isreached 50 ls after contact initiation. This initial phase of elasticdeformation is followed by softening of the PC material that lastsuntil 0.5 (0.55) ms for the laminates with the DFA4700 (IM800A)adhesive. These times correspond to the first peak in the time-his-tory of the reaction force, see Fig. 12, and with the initiation of elas-tic unloading of the PC during which the effective stress drops tonearly one-fourth (one-third) of its original value for the DF4700(IMA800A) adhesive. The subsequent increase of the contact forcecorresponds to the elastic re-loading of the PC material. The PCdeforms then plastically until the effective strain reaches its max-imum value. Then there is elastic unloading of the PC followed byan increase in the effective stress while the effective straindecreases. This corresponds to switching from tensile to compres-sive deformations of the PC as made clear by the two non-zero in-plane principal stresses plotted in Fig. 22, the 3rd out-of-planeprincipal stress is zero. The maximum effective strain at the pointin the PC layer and the transition from tensile to compressivedeformations occurs during the second peak of the reaction force.It is clear from these plots that the evolution of stresses and strainsin the PC is unaffected by the initiation and propagation of cracksin the PMMA layer.
The dominant stress component in the adhesives at points morethan 5 mm in-plane distance from the interlayer centroid is theshear stress rrz. Its time history for the two laminates is plottedin Fig. 23 for the impact speed of 22 m/s. This stress componentwas found to be the dominant one by examining stress compo-nents at different points on the mid-plane of the adhesive layer.Therefore, the adhesive deforms mostly in shear suggestingthereby that it is mainly loaded by the relative radial sliding ofthe PMMA and the PC layers. However, at the centroid of the adhe-sive interlayer the pressure is greater than the effective stressimplying that near the center of impact the adhesive transmitsnormal tractions mainly due to the high value of the hydrodynamicpressure.

Table 6Energy analysis of the impact of the laminates. Energies are given in Joules.
Adhesive material of the laminated plate DFA4700 IM800A
Impact velocity 12 m/s 22 m/s 12 m/s 22 m/sInitial impactor kinetic energy 2.041 6.860 2.041 6.860Impactor kinetic energy 1.603 5.123 1.629 4.992
Plate kinetic energy 0.185 0.264 0.179 0.357PMMA 0.078 0.101 0.076 0.139Adhesive 0.029 0.61 0.027 0.081PC 0.078 0.102 0.076 0.137
Elastic energy of the plate 0.109 0.336 0.092 0.471PMMA 0.039 0.096 0.039 0.151Adhesive 0.031 0.068 0.026 0.147PC 0.038 0.172 0.028 0.173
Dissipation by plasticity, softening and viscosity 0.133 0.894 0.111 0.789PMMA Plasticity 0.000 0.003 0.000 0.001
Softening 0.005 0.007 0.005 0.007Adhesive Viscosity 0.001 0.004 0.000 0.000PC Plasticity 0.121 0.871 0.102 0.771
Softening 0.005 0.010 0.004 0.010
Dissipation due to cracking/failure 0.020 0.154 0.030 0.279PMMA 0.020 0.154 0.030 0.279Adhesive 0.000 0.000 0.000 0.000PC 0.000 0.000 0.000 0.000
Dissipation by delamination 0.000 0.001 0.000 0.001PMMA-adhesive interface 0.000 0.001 0.000 0.001PC-adhesive interface 0.000 0.000 0.000 0.000
Remaining energy (elastic and kinetic) 1.897 5.722 1.900 5.820Energy dissipation 0.153 1.049 0.142 1.069Total 2.049 6.771 2.041 6.889Variation w.r.t. initial energy +0.42% �1.29% +0.02% +0.43%
Adhesive v0 = 12 m/s v0 = 22 m/s
DFA4700
IM800A
0.70.60.50.40.30.20.10.0
equivalent plastic strain
5 mm 5 mm
5 mm 5 mm
xz
10 mm
Fig. 16. For the impact of PMMA/adhesive/PC plate at 22 m/s, fringe plots in the PC layer of the computed equivalent plastic strain on the back surface (top) and for thePMMA/DFA4700/PC laminate in a plane orthogonal to the edge of the plate and passing through its center (bottom).
206 G.O. Antoine, R.C. Batra / Composite Structures 116 (2014) 193–210

Time [ms]
Cra
ckEx
tens
ion
[mm
]
0 0.5 1 1.5 20
5
10
15
Time [ms]
Cra
ckEx
tens
ion
[mm
]
0 0.025 0.05 0.075 0.10
2
4
6
8
10DFA4700IM800A
Fig. 17. Radial lengths of the cracks in the PMMA plate bonded with DFA4700 and IM800A adhesives and impacted at 12 m/s. The Fig. on the right is a magnified view of thaton the left for small times.
Time [ms]
Cra
ckEx
tens
ion
[mm
]
0 0.025 0.05 0.075 0.10
2
4
6
8
10
DFA4700IM800A
Time [ms]
Cra
ckEx
tens
ion
[mm
]
0 0.5 1 1.50
10
20
30
40
Fig. 18. Radial lengths of the cracks in the PMMA plate bonded with DFA4700 and IM800A adhesives impacted at 22 m/s. The figure on the right is a magnified view of that onthe left for small times.
Table 7Computed times of crack initiation (first element deletion), corresponding strain ratesand the maximum principal stress in parentheses at the crack initiation sites. Thetemperature rise at these times was insignificant.
Plate 12 m/s Impact speed 22 m/s Impact speed
PMMA/DFA4700/PC 28.6 ls(1687/s, 141 MPa)
7.39 ls(2319/s, 142 MPa)
PMMA/IM800A/PC 24.4 ls(1095/s, 141 MPa)
7.51 ls(2213/s, 142 MPa)
G.O. Antoine, R.C. Batra / Composite Structures 116 (2014) 193–210 207
The deformed shape of the PC layer is plotted in Fig. 24 forthe 22 m/s impact speed and the PMMA/DFA4700/PC laminate.The maximum deflection, 7.57 mm, of the plate occurs at its centerat 0.68 ms. It is interesting to observe that the sides of the
Time [
Cra
ckEx
tens
ion
[mm
]
Erod
edEn
ergy
[J]
0 0.50
5
10
15
20
0
0.1
0.2
0.3
0.4
Fig. 19. Time histories of the crack length, eroded energy, reaction force, and the laminasolid for crack extension and dashed for eroded energy; Blue curve, solid for reaction forcelegend, the reader is referred to the web version of this article.)
plate initially have a negative deflection, i.e., that they have anupward displacement. This agrees with the experimental resultsof Stenzler [63].
The main energy dissipation mechanisms have been identifiedand quantified. While the viscous deformations of the adhesiveinterlayers do not contribute significantly to the energy dissipatedduring the impact process, the plastic deformations of the PC mate-rial and the cracking of the PMMA materials are responsible formore than 90% of the energy dissipated. The energy dissipated bysoftening of the PMMA and the PC due to temperature rise had asmall contribution. The energy dissipated due to delamination atthe interfaces was also miniscule.
Factors such as values of material parameters, failure criteria,delamination criteria, constitutive relations (material models) for
ms]
Def
lect
ion
[mm
]
Rea
ctio
nFo
rce
[kN
]
1 1.50
2
4
6
8
0
0.4
0.8
1.2
1.6
te deflection for the 22 m/s impact of the PMMA/DFA4700/PC laminate. Red curve,and dashed for deflection. (For interpretation of the references to color in this figure

10 mm 10 mm
Fig. 20. Details of the crack patterns in the PMMA plate of the PMMA/DFA4700/PClaminate impacted at 22 m/s at t = 0.8 ms (left) and t = 1.0 ms (right).
Effective Strain
Effe
ctiv
eSt
ress
[MPa
]
0 0.1 0.2 0.3 0.40
20
40
60
80
100
t=0.9ms
t=0.7ms
t=0.05ms
t=0.5ms t=1ms
t=1.65ms
t=1.2mst=1.45ms
Fig. 21. Effective stress vs. effective strain curves at the point located at the center of the(right) panels impacted at 22 m/s.
Time [ms]
Prin
cipa
lCau
chy
Stre
ss[M
Pa]
0 0.5 1 1.5-60
-40
-20
0
20
40
60
80
100
σ1σ2
Fig. 22. Time histories of the in-plane principal stresses r1 and r2 (with r1 P r2) at the cIM800A/PC (right) laminates impacted at 22 m/s. The out-of-plane principal stress is ze
Time [ms]
Pres
sure
atce
ntro
id[M
Pa]
0 0.5 1 1.5 2-10
-5
0
5
10
15
20
Fig. 23. Time history of the pressure at the adhesive centroid and dominant stress compo(solid curves) and PMMA/IM800A/PC (dashed curves) laminates impacted at 22 m/s.
208 G.O. Antoine, R.C. Batra / Composite Structures 116 (2014) 193–210
the PMMA, the PC and the adhesives, and the boundary conditionsaffect computed results. No single paper in the literature provides acomplete set of material data in order to compute results. Algo-rithms employed in the computational model such as the numeri-cal integration with respect to time of the coupled nonlinearordinary differential equations, element deletion algorithm, andthe FE mesh size and the gradation of elements in the FE meshintroduce dissipation and errors in the computed solution. Ofcourse, the test data is not necessarily exactly reproducible. It isan arduous task to quantify error introduced by each factor/param-eter in a complex system such as the one analyzed here. Neverthe-less the model enables one to delineate details of deformations ineach component of the system, and identify dominant sources ofenergy dissipation.
Effective Strain
Effe
ctiv
eSt
ress
[MPa
]
0 0.1 0.2 0.30
20
40
60
80
100t=0.05ms t=1.0ms
t=1.77ms
t=1.3ms
t=1.1ms
t=0.75ms
t=0.55ms
t=1.7ms
rear surface of the PC layer of the PMMA/DFA4700/PC (left) and PMMA/IM800A/PC
Time [ms]
Prin
cipa
lCau
chy
Stre
ss[M
Pa]
0 0.5 1 1.5 2-60
-40
-20
0
20
40
60
80
100
σ1σ2
enter of the rear surface of the PC plate of the PMMA/DFA4700/PC (left) and PMMA/ro since the surface is traction free.
Time [ms]
σ rzat
5mm
from
cent
roid
[MPa
]
0 0.5 1 1.5 2-1
0
1
2
3
4
5
6
7
nent at 5 mm in-plane offset from the adhesive centroid for the PMMA/DFA4700/PC

Position from plate center [mm]
Def
lect
ion
[mm
]
-60 -40 -20 0 20 40 60
0
2
4
6
8
Position from plate center [mm]
Def
lect
ion
[mm
]
-12 -9 -6 -3 0 3 6 9 12
0
2
4
6
8
t = 0.2mst = 0.4mst = 0.6mst = 0.8mst = 1.0mst = 1.2mst = 1.4ms
Fig. 24. Deformed shapes of the back surface of the PC plate of the PMMA/DFA4700/PC laminate impacted at 22 m/s; the right figure is a blown up view of the deformedcentral region of the plate.
G.O. Antoine, R.C. Batra / Composite Structures 116 (2014) 193–210 209
6. Conclusions
We have developed a mathematical and a computational modelto study finite transient deformations of a laminated plateimpacted at normal incidence by a hemispherical nosed steel cyl-inder. The PMMA and the PC have been modeled as thermo-elas-to-visco-plastic materials and the adhesive as a viscoelasticmaterial. Failure of each material and of the interface betweentwo distinct materials has been considered. Values of materialparameters have been determined by using test data available inthe literature. The user defined subroutine for modeling the PMMAand the PC have been implemented in the commercial software,LS-DYNA.
During the impact of the PMMA/DFA4700/PC and PMMA/IM800A/PC laminates the time history of the reaction force experi-enced by the impactor has two dominant peaks before dropping tozero when the impactor separates from the laminate. Whereas thecomputational model predicts reasonably well the portion of thereaction force time history until the first peak and the maximumdeflection of the laminate, the reaction force beyond the first peakand hence the time of separation between the impactor and thelaminate are not well predicted. The dominant source of energydissipation is the plastic deformation in the PC back plate ratherthan the cracking of the front PMMA plate. The time of rapid dropin the reaction force corresponds to that of the maximum deflec-tion of the plate, and at this time the radial cracks in the PMMAhave reached their maximum in-plane extension. The majority ofthe eroded energy occurs during the rebound of the laminate tothe zero deflection position. The mechanical properties of theadhesive significantly influence both the time when cracks in thePMMA initiate, the damage zone in the PMMA plate developedaround the impact site, and the lengths and the number of cracks.An adhesive with a small value of instantaneous Young’s moduluswill result in more damage to the front layer due to the greaterimpedance mismatch between the PMMA and the adhesive, andwill protect the rear PC layer more effectively in the sense thatthere will be less damage induced in it due to plastic deformations.
Acknowledgments
This research was sponsored by the Army Research Laboratoryand was accomplished under Cooperative Agreement NumberW911NF-06-2-0014. The views and conclusions contained in thisdocument are those of the authors and should not be interpretedas representing the official policies, either expressed or implied,of the Army Research Laboratory or the US Government. The USGovernment is authorized to reproduce and distribute reprintsfor Government purposes notwithstanding any copyright notationhereon.
References
[1] Radin J, Goldsmith W. Normal projectile penetration and perforation of layeredtargets. Int J Impact Eng 1988;7:229–59.
[2] Sands J, Patel P, Dehmer P, Hsieh A. Protecting the future force: transparentmaterials safeguard the army’s vision. AMTIAC Q 2004;8.
[3] Rabinowitz S, Ward I, Parry J. The effect of hydrostatic pressure on the shearyield behaviour of polymers. J Mater Sci 1970;5:29–39.
[4] Duckett R, Rabinowitz S, Ward I, strain-rate The. temperature and pressuredependence of yield of isotropic poly (methylmethacrylate) and poly (ethyleneterephthalate). J Mater Sci 1970;5:909–15.
[5] Arruda EM, Boyce MC, Jayachandran R. Effects of strain-rate, temperature andthermomechanical coupling on the finite strain deformation of glassy-polymers. Mech Mater 1995;19:193–212.
[6] Mulliken AD, Boyce MC. Mechanics of the rate-dependent elastic–plasticdeformation of glassy polymers from low to high strain rates. Int J Solids Struct2006;43:1331–56.
[7] Siviour CR, Walley SM, Proud WG, Field JE. The high strain rate compressivebehaviour of polycarbonate and polyvinylidene difluoride. Polymer 2005;46:12546–55.
[8] Moy P, Weerasooriya T, Hsieh A, Chen W. Strain rate response of apolycarbonate under uniaxial compression. In: Proceedings of the SEMconference on experimental mechanics; 2003.
[9] Richeton J, Ahzi S, Daridon L, Remond Y. A formulation of the cooperativemodel for the yield stress of amorphous polymers for a wide range of strainrates and temperatures. Polymer 2005;46:6035–43.
[10] Richeton J, Schlatter G, Vecchio KS, Remond Y, Ahzi S. A unified model forstiffness modulus of amorphous polymers across transition temperatures andstrain rates. Polymer 2005;46:8194–201.
[11] Richeton J, Ahzi S, Vecchio KS, Jiang FC, Adharapurapu RR. Influence oftemperature and strain rate on the mechanical behavior of three amorphouspolymers: characterization and modeling of the compressive yield stress. Int JSolids Struct 2006;43:2318–35.
[12] Rittel D, Eliash N, Halary JL. Hysteretic heating of modifiedpoly(methylmethacrylate). Polymer 2003;44:2817–22.
[13] Rittel D. An investigation of the heat generated during cyclic loading of twoglassy polymers. Part I: Experimental. Mech Mater 2000;32:131–47.
[14] Rittel D, Rabin Y. An investigation of the heat generated during cyclic loadingof two glassy polymers. Part II: Thermal analysis. Mech Mater 2000;32:149–59.
[15] Schmachtenberg E, Glissmann M, Brinkmann M. Modelling the dynamicmaterial behaviour of thermoplastics in the FEA. J Polym Eng 2006;26:245–58.
[16] Richeton J, Ahzi S, Vecchio KS, Jiang FC, Makradi A. Modeling and validation ofthe large deformation inelastic response of amorphous polymers over a widerange of temperatures and strain rates. Int J Solids Struct 2007;44:7938–54.
[17] Tervoort T, Smit R, Brekelmans W, Govaert LE. A constitutive equation for theelasto-viscoplastic deformation of glassy polymers. Mech Time-Depend Mater1997;1:269–91.
[18] Buckley CP, Jones DC. Glass–rubber constitutive model for amorphouspolymers near the glass-transition. Polymer 1995;36:3301–12.
[19] Alvarado-Contreras JA, Polak MA, Penlidis A. Constitutive modeling ofdamage evolution in semicrystalline polyethylene. J Eng Mater Trans ASME2010;132.
[20] Boyce MC, Parks DM, Argon AS. Large inelastic deformation of glassy-polymers. 1. Rate dependent constitutive model. Mech Mater 1988;7:15–33.
[21] Varghese AG, Batra RC. Constitutive equations for thermomechanicaldeformations of glassy polymers. Int J Solids Struct 2009;46:4079–94.
[22] Varghese AG, Batra RC. Strain localization in polycarbonates deformed at highstrain rates. J Polym Eng 2011;31:495–519.
[23] Lajtai EZ, Carter BJ, Ayari ML. Criteria for brittle-fracture in compression. EngFract Mech 1990;37:59–74.
[24] Saghafi H, Ayatollahi MR, Sistaninia M. A modified MTS criterion (MMTS) formixed-mode fracture toughness assessment of brittle materials. Mat Sci Eng AStruct 2010;527:5624–30.

210 G.O. Antoine, R.C. Batra / Composite Structures 116 (2014) 193–210
[25] Seweryn A. Brittle-fracture criterion for structures with sharp notches. EngFract Mech 1994;47:673–81.
[26] Seweryn A, Lukaszewicz A. Verification of brittle fracture criteria for elementswith V-shaped notches. Eng Fract Mech 2002;69:1487–510.
[27] Vandenberghe N, Vermorel R, Villermaux E. Star-shaped crack pattern ofbroken windows. Phys Rev Lett 2013;110:174302.
[28] Schultz JM. Microstructural aspects of failure in semicrystalline polymers.Polym Eng Sci 1984;24:770–85.
[29] Zairi F, Nait-Abdelaziz M, Gloaguen JM, Lefebvre JM. Modelling of the elasto-viscoplastic damage behaviour of glassy polymers. Int J Plast 2008;24:945–65.
[30] Ayatollahi MR, Aliha MRM, Hassani MM. Mixed mode brittle fracture in PMMA– an experimental study using SCB specimens. Mat Sci Eng A Struct2006;417:348–56.
[31] Beaumont PW, Young RJ. Failure of brittle polymers by slow crack growth. JMater Sci 1975;10:1334–42.
[32] Wada H, Seika M, Calder CA, Kennedy TC. Measurement of impact fracture-toughness for Pmma with single-point bending test using an air gun. Eng FractMech 1993;46:715–9.
[33] Marshall G, Williams J, Turner C. Fracture toughness and absorbed energymeasurements in impact tests on brittle materials. J Mater Sci 1973;8:949–56.
[34] Moy P, Weerasooriya T, Chen W, Hsieh A. Dynamic stress-strain response andfailure behavior of PMMA. In ASME; 2003.
[35] Weerasooriya T, Moy P, Casem D, Cheng M, Chen W. Fracture toughness forPMMA as a function of loading rate. In Proceedings of the 2006 SEM annualconference on experimental mechanics; June 2006. p. 5–7.
[36] Chang FC, Chu LH. Coexistence of ductile, semi-ductile, and brittle fractures ofpolycarbonate. J Appl Polym Sci 1992;44:1615–23.
[37] Mills N. The mechanism of brittle fracture in notched impact tests onpolycarbonate. J Mater Sci 1976;11:363–75.
[38] Fraser R, Ward I. The impact fracture behaviour of notched specimens ofpolycarbonate. J Mater Sci 1977;12:459–68.
[39] Allen G, Morley D, Williams T. The impact strength of polycarbonate. J MaterSci 1973;8:1449–52.
[40] Rittel D, Levin R, Maigre H. On dynamic crack initiation in polycarbonate undermixed-mode loading. Mech Res Commun 1997;24:57–64.
[41] Rittel D, Levin R. Mode-mixity and dynamic failure mode transitions inpolycarbonate. Mech Mater 1998;30:197–216.
[42] Curran DR, Shockey DA, Seaman L. Dynamic fracture criteria for apolycarbonate. J Appl Phys 1973;44:4025–38.
[43] Plati E, Williams J. Effect of temperature on the impact fracture toughness ofpolymers. Polymer 1975;16:915–20.
[44] Plati E, Williams J. The determination of the fracture parameters for polymersin impact. Polym Eng Sci 1975;15:470–7.
[45] Adams GC, Bender RG, Crouch BA, Williams JG. Impact fracture-toughnesstests on polymers. Polym Eng Sci 1990;30:241–8.
[46] Ogihara S, Ishigure T, Kobayashi A. Study on impact perforation fracturemechanism in PMMA. J Mater Sci Lett 1998;17:691–2.
[47] Fleck NA, Stronge WJ, Liu JH. High strain-rate shear response of polycarbonateand polymethyl methacrylate. Proc R Soc London A Math 1990;429:459.
[48] Livingstone I, Richards M, Clegg R. Numerical and experimental investigationof ballistic performance of transparent armour systems. In: Lightweightarmour system symposium, LASS; 1999.
[49] Richards M, Clegg R, Howlett S. Ballistic performance assessment of glasslaminates through experimental and numerical investigation. In: Proceedingsof the 18th international symposium on ballistics; 1999. p. 1123–30.
[50] Kelly PM. Lightweight transparent armour systems for combat eyewear. In:The proceedings of the 19th international symposium of balllistics, Interlaken,Switzerland; 2001. p. 7–11.
[51] Kihara K, Isono H, Yamabe H, Sugibayashi T. A study and evaluation of theshear strength of adhesive layers subjected to impact loads. Int J Adhes Adhes2003;23:253–9.
[52] Tsai YM, Chen YT. Transition of Hertzian fracture to flexure fracture producedin glass plates by impact. Eng Fract Mech 1983;18:1185–90.
[53] Fountzoulas C, Sands J, Gilde G, Patel P. Modeling of defects in transparentceramics for improving military armor. In: DTIC document; 2009.
[54] Gilde GA, Patel PJ, Hsieh AJ. Improved low-cost multi-hit transparent armor.In: Army research lab aberdeen proving ground MD weapons and materialsresearch directorate; 2006.
[55] Zee RH, Wang CJ, Mount A, Jang BZ, Hsieh CY. Ballistic response of polymercomposites. Polym Compos 1991;12:196–202.
[56] Tarim N, Findik F, Uzun H. Ballistic impact performance of compositestructures. Compos Struct 2002;56:13–20.
[57] Wu HYT, Chang FK. Transient dynamic analysis of laminated composite platessubjected to transverse impact. Comput Struct 1989;31:453–66.
[58] Tita V, de Carvalho J, Vandepitte D. Failure analysis of low velocity impact onthin composite laminates: experimental and numerical approaches. ComposStruct 2008;83:413–28.
[59] Palazotto AN, Herup EJ, Gummadi LNB. Finite element analysis of low-velocityimpact on composite sandwich plates. Compos Struct 2000;49:209–27.
[60] Cheon SS, Lim TS, Lee DG. Impact energy absorption characteristics of glassfiber hybrid composites. Compos Struct 1999;46:267–78.
[61] Batra RC, Gopinath G, Zheng JQ. Damage and failure in low energy impact offiber-reinforced polymeric composite laminates. Compos Struct 2012;94:540–7.
[62] Stenzler JS, Goulbourne N. Impact mechanics of transparent multi-layeredpolymer composites. In: Society for experimental mechanics-SEM annualconference and exposition on experimental and applied mechanics; 2009. p.V3.
[63] Stenzler JS. Impact mechanics of PMMA/PC multi-laminates with soft polymerinterlayers. In: University libraries, Virginia polytechnic institute and stateuniversity, Blacksburg, VA; 2009.
[64] Zhang W, Tekalur SA, Huynh L. Impact behavior and dynamic failure of PMMAand PC plates. Dynamic behavior of materials, vol. 1. Springer; 2011. p.93–104.
[65] Tekalur SA, Zhang W, Huynh L. Dynamic failure of monolithic and layeredPMMA and PC plates; 2010.
[66] Gunnarsson CA, Ziemski B, Weerasooriya T, Moy P. Deformation and failure ofpolycarbonate during impact as a function of thickness. In: Proceedings of the2009 international congress and exposition on experimental mechanics andapplied mechanics; 2009.
[67] Gunnarsson CA, Weerasooriya T, Moy P. Impact response of PC/PMMAcomposites. Dynamic behavior of materials, vol. 1. Springer; 2011. p. 195–209.
[68] Stickle AM, Schultz PH. Exploring the role of shear in oblique impacts: acomparison of experimental and numerical results for planar targets. Int JImpact Eng 2011;38:527–34.
[69] Kröner E. Allgemeine kontinuumstheorie der versetzungen undeigenspannungen. Arch Ration Mech Anal 1959;4:273–334.
[70] Lee EH. Elastic–plastic deformation at finite strains, Stanford university,Division of engineering mechanics; 1968.
[71] Mulliken EH. Mechanics of amorphous polymers and polymer nanocompositesduring high rate deformation. In: Massachusetts Institute of Technology; 2006.p. 290.
[72] Ogden RW. Non-linear elastic deformations. Courier Dover Publications; 1997.[73] Christensen RM. A non-linear theory of viscoelasticity for application to
elastomers. J Appl Mech Trans ASME 1980;47:762–8.[74] Rankin C. Application of linear finite elements to finite strain using corotation.
In: AIAA Paper AIAA-2006-1751, 47th AIAA structures, structural dynamicsand materials conference; May 2006.
[75] Folgar F. Advanced aliphatic polyurethane resins for high durability andsuperior ballistic performance laminated glass. In: 22nd Internationalsymposium on ballistics. Vancouver BC, Canada: DESTech Publications, Inc.;2005. p. 908–16.
[76] MacAloney N, Bujanda A, Jensen R, Goulbourne N. Viscoelastic characterizationof aliphatic polyurethane interlayers In: DTIC document; 2007.
[77] A4700 Dureflex� optical aliphatic polyether polyurethane grade. In: UrethaneD, editor; 2006.
[78] Gerlach S, Fiolka M, Matzenmiller A. Modelling and analysis of adhesivelybonded joints with interface elements for crash analysis. In: LS-DYNAAnwenderforum, Bamberg, 2005.
[79] Pickett JE, Suriano JA, Rice ST, Li X. Weatherable multilayer articles andmethod for their preparation. In: Google patents; 2003.
[80] Khalili SMR, Soroush M, Davar A, Rahmani O. Finite element modeling of low-velocity impact on laminated composite plates and cylindrical shells. ComposStruct 2011;93:1363–75.
[81] Her SC, Liang YC. The finite element analysis of composite laminates and shellstructures subjected to low velocity impact. Compos Struct 2004;66:277–85.


![[Text deleted]](https://img.pdfslide.us/doc/110x75/61d054833e41477b8537a7c5/text-deleted.jpg)