Embed Size (px)
Citation preview
Composite Structures Materials Testing for the Orion Crew Vehicle Heat Shield
Farah Khemani
JOHNSON SPACE CENTER
Major: Aerospace Engineering
USRP Spring Session
Date: 29 Apr 2011
https://ntrs.nasa.gov/search.jsp?R=20110013245 2018-07-23T04:17:56+00:00Z
NASA USRP – Internship Final Report
2 Spring 2011 Session
Composite Structures Materials Testing for the Orion Crew Vehicle Heat Shield
Farah N. Khemani1
Georgia Institute of Technology, Atlanta, GA 30332
As research is being performed for the new heat shield for the Orion capsule, National
Aeronautics and Space Administration (NASA) is developing the first composite heat shield. As an intern of the Structures Branch in the Engineering Directorate (ES 2), my main task was to set up a test plan to determine the material properties of the honeycomb that will be used on the Orion Crew Module heat shield to verify that the composite is suitable for the capsule. Before conducting composite shell tests, which are performed to simulate the crush performance of the heat shield on the capsule, it is necessary to determine the compression and shear properties of the composite used on the shell. During this internship, I was responsible for developing a test plan, designing parts for the test fixtures as well as getting them fabricated for the honeycomb shear and compression testing. This involved work in Pro/Engineer as well as coordinating with Fab Express, the Building 9 Composite Shop and the Structures Test Laboratory (STL). The research and work executed for this project will be used for composite sandwich panel testing in the future as well. As a part of the Structures Branch, my main focus was to research composite structures. This involves system engineering and integration (SE&I) integration, manufacturing, and preliminary testing. The procedures for these projects that were executed during this internship included design work, conducting tests and performing analysis.
Nomenclature NASA = National Aeronautics and Space Administration JSC = Johnson Space Center ISS = International Space Station STL = Structures Test Laboratory SE&I = System Engineering and Integration USRP = Undergraduate Student Research Program Pro/E = Pro/Engineer 3D Modeling Tool AL = Aluminum SG = Strain Gage AF = Adhesive Film SEM = Scanning Electron Microscopy d = diameter of rod l = length or rod F = Force M = Moment I = Moment of Inertia c = Scanning Electron Microscopy σ = Bending Stress FS = Factor of Safety MS = Margin of Safety
1 Undergraduate Student Research Intern (USRP), Engineering Directorate, ES2, Lyndon B. Johnson Space Center, Georgia Institute of Technology
NASA USRP – Internship Final Report
3 Spring 2011 Session
I. Introduction
Composite structures are essential in spaceflight, especially in the space exploration vehicles of the future,
and there are many advantages of using composites in comparison to metals. The most important advantage is that composite structures carry a significant amount less of mass due to less material that is used. Although the weight is less than metal, the strength per pound is actually higher. The reduction of mass is imperative in order to propel the space vehicle to and back from a deep space mission. However, it is important not to sacrifice the strength of the material. In addition, composite materials can be shaped to any contour, which reduces drag on the structure and increases the design applications.
NASA is developing the first composite heat shield on a space exploration vehicle, the Orion. The Orion will
enter the Earth’s atmosphere at 6.8 miles per second; the fastest a spacecraft has ever entered the atmosphere. It will generate very high surface temperatures reaching up to more than 4,800 degrees Fahrenheit. An effective heat shield design is necessary to ensure crew and vehicle safety. The final structure of the heat shield is unknown until the testing and analysis is complete. The structures branch at NASA Johnson Space Center is building the first ever composite heat shield as a probable structure to use on the Orion Crew Vehicle. Drop tests will be conducted on composite shells that are about 1/5th of the size of the actual heat shield, but in order to run these tests, it is important to know the material properties of the composite on the structure. The necessary tests to be run prior to the drop tests are flat-wise compression tests and shear tests. The data resulting from these tests will help with composite sandwich failure mode prediction.
II. Test Plan
There are nine total material properties tests to be conducted for the heat shield honeycomb testing. Three of the tests are flat-wise compression, or crush, tests, and six are shear tests. The samples are made from the same type of material that will be used on the Orion heat shield. It is made from Al 5052. The part number is as follows: CR111 – 5/32 – 5052 – .0007N – 2.6. Data from these tests are requested from the composite shell drop test manager, Claude Bryant. The test plans and setup designed for these tests can be used for all composite sandwich panel testing.
A. Compression Test Plan
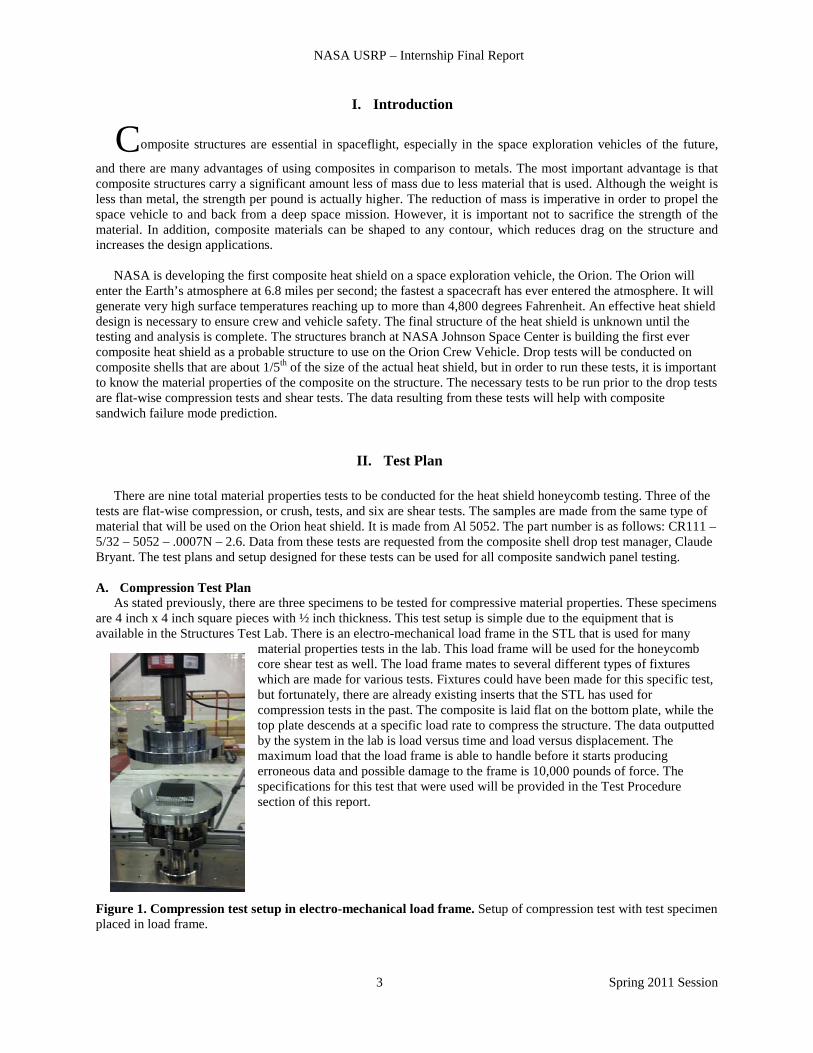
As stated previously, there are three specimens to be tested for compressive material properties. These specimens are 4 inch x 4 inch square pieces with ½ inch thickness. This test setup is simple due to the equipment that is available in the Structures Test Lab. There is an electro-mechanical load frame in the STL that is used for many
material properties tests in the lab. This load frame will be used for the honeycomb core shear test as well. The load frame mates to several different types of fixtures which are made for various tests. Fixtures could have been made for this specific test, but fortunately, there are already existing inserts that the STL has used for compression tests in the past. The composite is laid flat on the bottom plate, while the top plate descends at a specific load rate to compress the structure. The data outputted by the system in the lab is load versus time and load versus displacement. The maximum load that the load frame is able to handle before it starts producing erroneous data and possible damage to the frame is 10,000 pounds of force. The specifications for this test that were used will be provided in the Test Procedure section of this report.
Figure 1. Compression test setup in electro-mechanical load frame. Setup of compression test with test specimen placed in load frame.
NASA USRP – Internship Final Report
4 Spring 2011 Session
B. Core Shear Tests
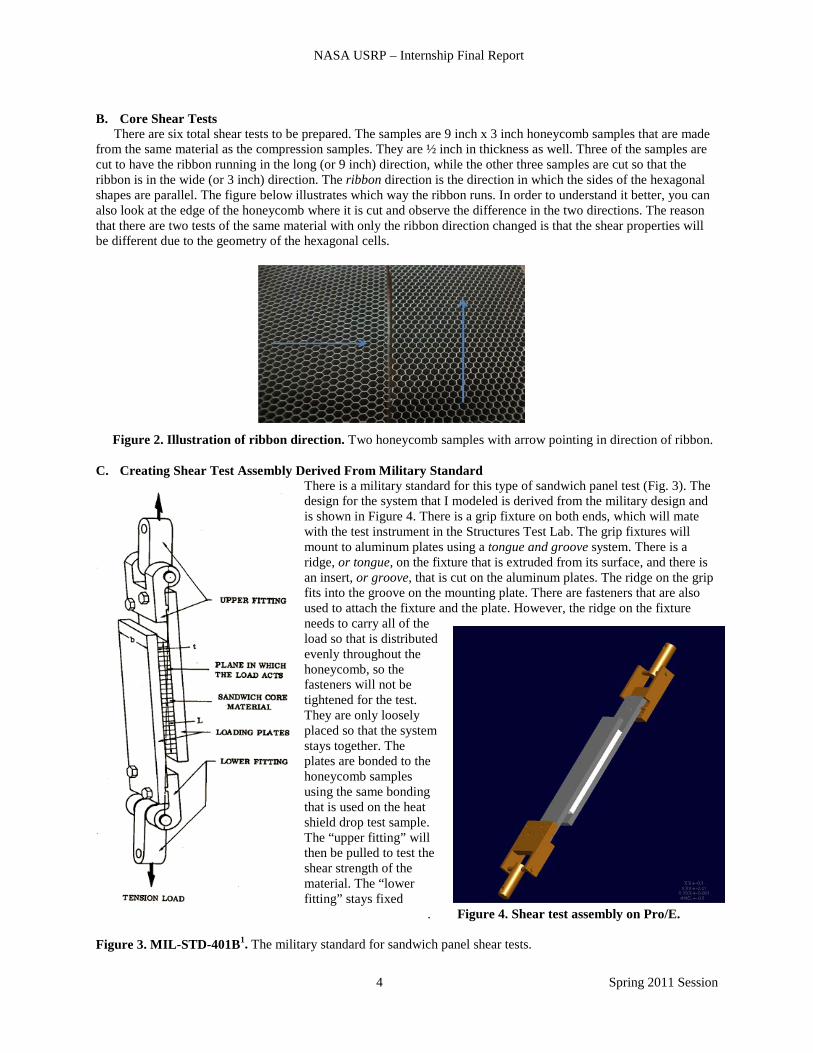
There are six total shear tests to be prepared. The samples are 9 inch x 3 inch honeycomb samples that are made from the same material as the compression samples. They are ½ inch in thickness as well. Three of the samples are cut to have the ribbon running in the long (or 9 inch) direction, while the other three samples are cut so that the ribbon is in the wide (or 3 inch) direction. The ribbon direction is the direction in which the sides of the hexagonal shapes are parallel. The figure below illustrates which way the ribbon runs. In order to understand it better, you can also look at the edge of the honeycomb where it is cut and observe the difference in the two directions. The reason that there are two tests of the same material with only the ribbon direction changed is that the shear properties will be different due to the geometry of the hexagonal cells.
Figure 2. Illustration of ribbon direction. Two honeycomb samples with arrow pointing in direction of ribbon. C. Creating Shear Test Assembly Derived From Military Standard
There is a military standard for this type of sandwich panel test (Fig. 3). The design for the system that I modeled is derived from the military design and is shown in Figure 4. There is a grip fixture on both ends, which will mate with the test instrument in the Structures Test Lab. The grip fixtures will mount to aluminum plates using a tongue and groove system. There is a ridge, or tongue, on the fixture that is extruded from its surface, and there is an insert, or groove, that is cut on the aluminum plates. The ridge on the grip fits into the groove on the mounting plate. There are fasteners that are also used to attach the fixture and the plate. However, the ridge on the fixture needs to carry all of the load so that is distributed evenly throughout the honeycomb, so the fasteners will not be tightened for the test. They are only loosely placed so that the system stays together. The plates are bonded to the honeycomb samples using the same bonding that is used on the heat shield drop test sample. The “upper fitting” will then be pulled to test the shear strength of the material. The “lower fitting” stays fixed . Figure 4. Shear test assembly on Pro/E.
Figure 3. MIL-STD-401B1. The military standard for sandwich panel shear tests.
NASA USRP – Internship Final Report
5 Spring 2011 Session
D. Alignment Test Before running the shear tests, there are several procedures to be done to verify that correct results are obtained.
One of the procedures is to conduct an alignment test on the system. For this, another plate is needed. This alignment test plate is made of the same material as the mounting plates but has a slightly different geometry.
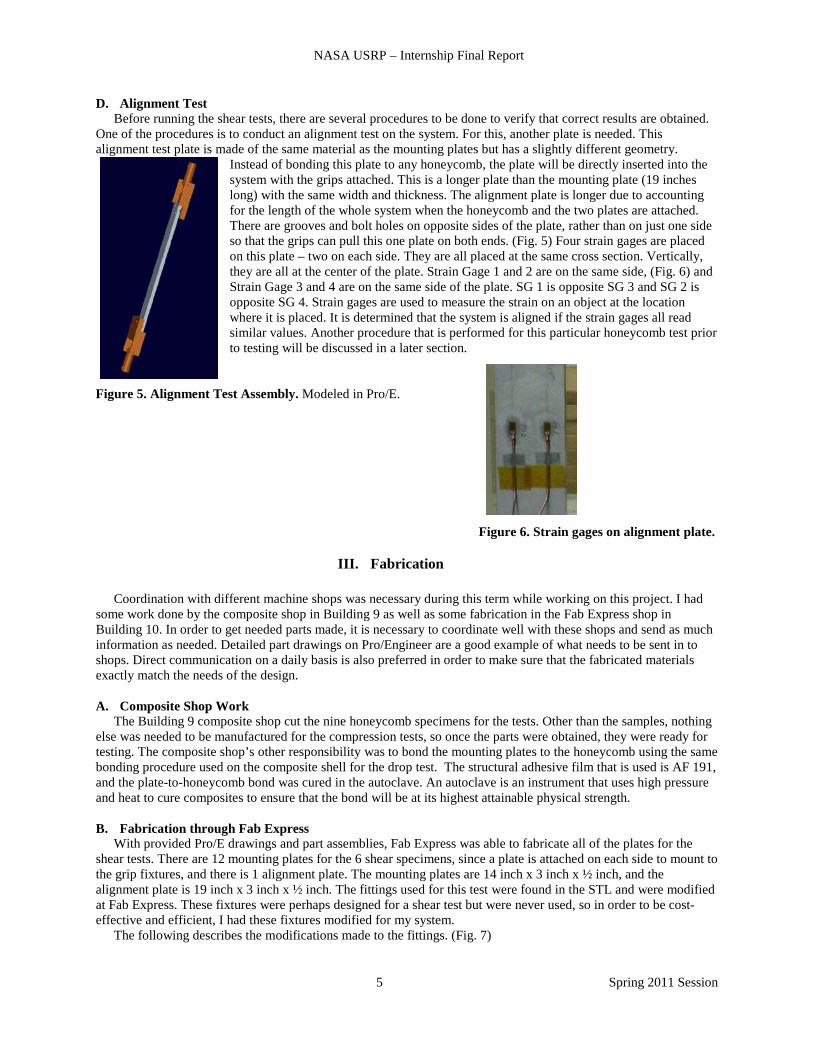
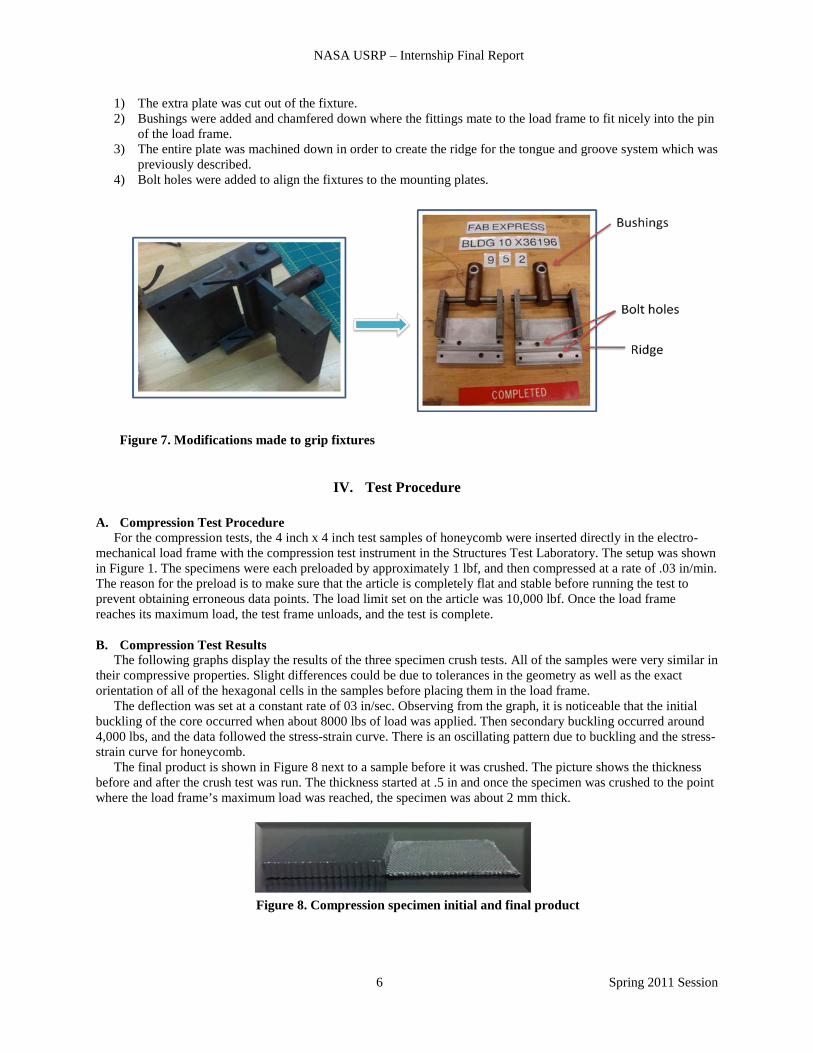
Instead of bonding this plate to any honeycomb, the plate will be directly inserted into the system with the grips attached. This is a longer plate than the mounting plate (19 inches long) with the same width and thickness. The alignment plate is longer due to accounting for the length of the whole system when the honeycomb and the two plates are attached. There are grooves and bolt holes on opposite sides of the plate, rather than on just one side so that the grips can pull this one plate on both ends. (Fig. 5) Four strain gages are placed on this plate – two on each side. They are all placed at the same cross section. Vertically, they are all at the center of the plate. Strain Gage 1 and 2 are on the same side, (Fig. 6) and Strain Gage 3 and 4 are on the same side of the plate. SG 1 is opposite SG 3 and SG 2 is opposite SG 4. Strain gages are used to measure the strain on an object at the location where it is placed. It is determined that the system is aligned if the strain gages all read similar values. Another procedure that is performed for this particular honeycomb test prior to testing will be discussed in a later section.
Figure 5. Alignment Test Assembly. Modeled in Pro/E.
Figure 6. Strain gages on alignment plate.
III. Fabrication
Coordination with different machine shops was necessary during this term while working on this project. I had some work done by the composite shop in Building 9 as well as some fabrication in the Fab Express shop in Building 10. In order to get needed parts made, it is necessary to coordinate well with these shops and send as much information as needed. Detailed part drawings on Pro/Engineer are a good example of what needs to be sent in to shops. Direct communication on a daily basis is also preferred in order to make sure that the fabricated materials exactly match the needs of the design.
A. Composite Shop Work
The Building 9 composite shop cut the nine honeycomb specimens for the tests. Other than the samples, nothing else was needed to be manufactured for the compression tests, so once the parts were obtained, they were ready for testing. The composite shop’s other responsibility was to bond the mounting plates to the honeycomb using the same bonding procedure used on the composite shell for the drop test. The structural adhesive film that is used is AF 191, and the plate-to-honeycomb bond was cured in the autoclave. An autoclave is an instrument that uses high pressure and heat to cure composites to ensure that the bond will be at its highest attainable physical strength.
B. Fabrication through Fab Express
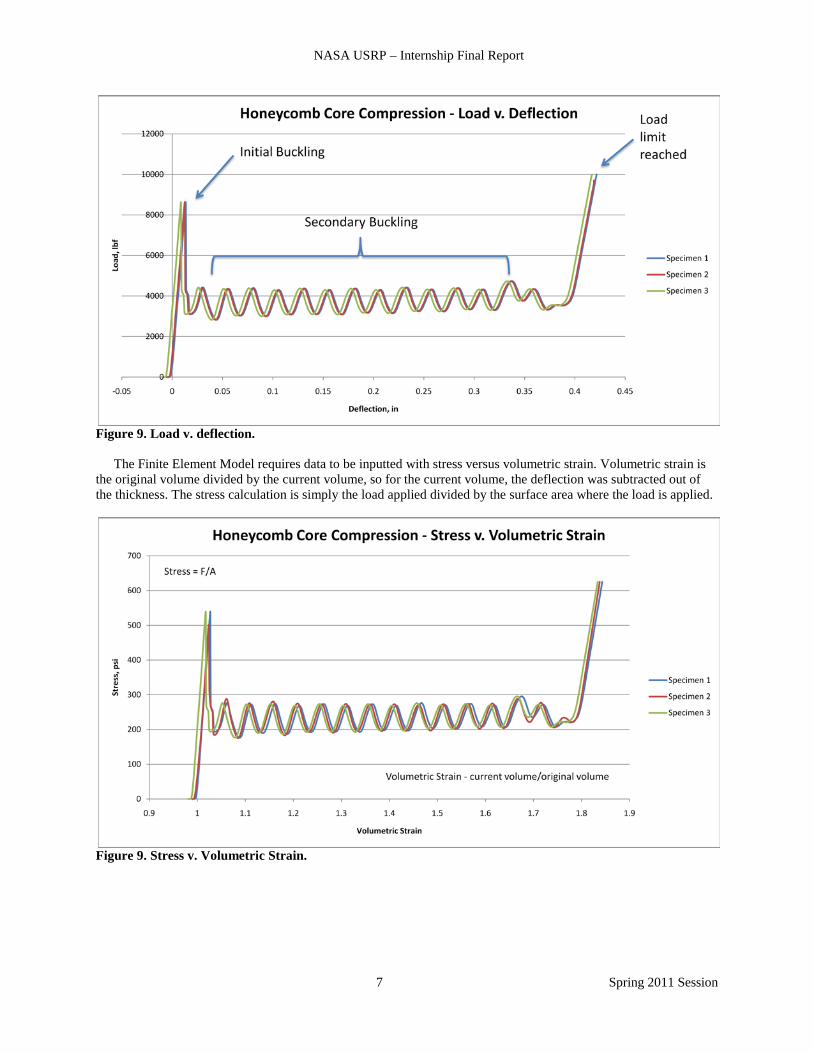
With provided Pro/E drawings and part assemblies, Fab Express was able to fabricate all of the plates for the shear tests. There are 12 mounting plates for the 6 shear specimens, since a plate is attached on each side to mount to the grip fixtures, and there is 1 alignment plate. The mounting plates are 14 inch x 3 inch x ½ inch, and the alignment plate is 19 inch x 3 inch x ½ inch. The fittings used for this test were found in the STL and were modified at Fab Express. These fixtures were perhaps designed for a shear test but were never used, so in order to be cost-effective and efficient, I had these fixtures modified for my system. The following describes the modifications made to the fittings. (Fig. 7)
NASA USRP – Internship Final Report
6 Spring 2011 Session
1) The extra plate was cut out of the fixture. 2) Bushings were added and chamfered down where the fittings mate to the load frame to fit nicely into the pin
of the load frame. 3) The entire plate was machined down in order to create the ridge for the tongue and groove system which was
previously described. 4) Bolt holes were added to align the fixtures to the mounting plates.
Figure 7. Modifications made to grip fixtures
IV. Test Procedure A. Compression Test Procedure
For the compression tests, the 4 inch x 4 inch test samples of honeycomb were inserted directly in the electro-mechanical load frame with the compression test instrument in the Structures Test Laboratory. The setup was shown in Figure 1. The specimens were each preloaded by approximately 1 lbf, and then compressed at a rate of .03 in/min. The reason for the preload is to make sure that the article is completely flat and stable before running the test to prevent obtaining erroneous data points. The load limit set on the article was 10,000 lbf. Once the load frame reaches its maximum load, the test frame unloads, and the test is complete.
B. Compression Test Results
The following graphs display the results of the three specimen crush tests. All of the samples were very similar in their compressive properties. Slight differences could be due to tolerances in the geometry as well as the exact orientation of all of the hexagonal cells in the samples before placing them in the load frame.
The deflection was set at a constant rate of 03 in/sec. Observing from the graph, it is noticeable that the initial buckling of the core occurred when about 8000 lbs of load was applied. Then secondary buckling occurred around 4,000 lbs, and the data followed the stress-strain curve. There is an oscillating pattern due to buckling and the stress-strain curve for honeycomb.
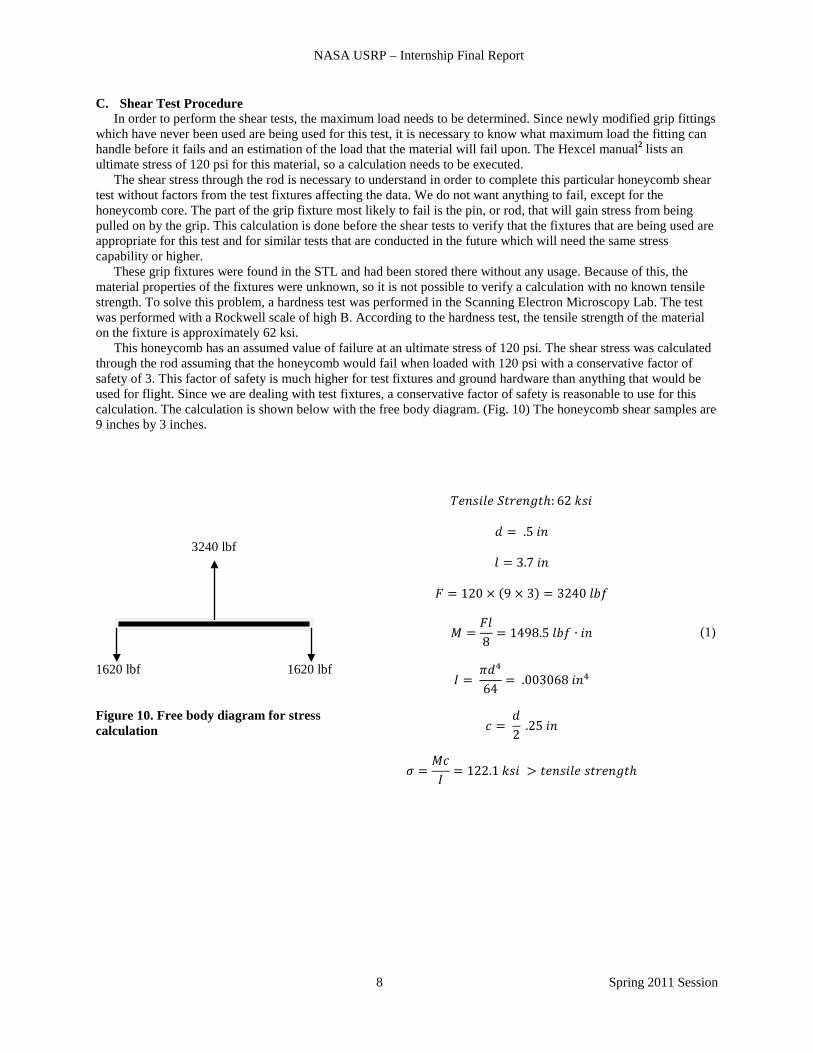
The final product is shown in Figure 8 next to a sample before it was crushed. The picture shows the thickness before and after the crush test was run. The thickness started at .5 in and once the specimen was crushed to the point where the load frame’s maximum load was reached, the specimen was about 2 mm thick.
Figure 8. Compression specimen initial and final product
NASA USRP – Internship Final Report
7 Spring 2011 Session
Figure 9. Load v. deflection.
The Finite Element Model requires data to be inputted with stress versus volumetric strain. Volumetric strain is the original volume divided by the current volume, so for the current volume, the deflection was subtracted out of the thickness. The stress calculation is simply the load applied divided by the surface area where the load is applied.
Figure 9. Stress v. Volumetric Strain.
NASA USRP – Internship Final Report
8 Spring 2011 Session
C. Shear Test Procedure In order to perform the shear tests, the maximum load needs to be determined. Since newly modified grip fittings
which have never been used are being used for this test, it is necessary to know what maximum load the fitting can handle before it fails and an estimation of the load that the material will fail upon. The Hexcel manual2 lists an ultimate stress of 120 psi for this material, so a calculation needs to be executed.
The shear stress through the rod is necessary to understand in order to complete this particular honeycomb shear test without factors from the test fixtures affecting the data. We do not want anything to fail, except for the honeycomb core. The part of the grip fixture most likely to fail is the pin, or rod, that will gain stress from being pulled on by the grip. This calculation is done before the shear tests to verify that the fixtures that are being used are appropriate for this test and for similar tests that are conducted in the future which will need the same stress capability or higher.
These grip fixtures were found in the STL and had been stored there without any usage. Because of this, the material properties of the fixtures were unknown, so it is not possible to verify a calculation with no known tensile strength. To solve this problem, a hardness test was performed in the Scanning Electron Microscopy Lab. The test was performed with a Rockwell scale of high B. According to the hardness test, the tensile strength of the material on the fixture is approximately 62 ksi.
This honeycomb has an assumed value of failure at an ultimate stress of 120 psi. The shear stress was calculated through the rod assuming that the honeycomb would fail when loaded with 120 psi with a conservative factor of safety of 3. This factor of safety is much higher for test fixtures and ground hardware than anything that would be used for flight. Since we are dealing with test fixtures, a conservative factor of safety is reasonable to use for this calculation. The calculation is shown below with the free body diagram. (Fig. 10) The honeycomb shear samples are 9 inches by 3 inches. 3240 lbf 1620 lbf 1620 lbf Figure 10. Free body diagram for stress calculation
𝑇𝑒𝑛𝑠𝑖𝑙𝑒 𝑆𝑡𝑟𝑒𝑛𝑔𝑡ℎ: 62 𝑘𝑠𝑖
𝑑 = .5 𝑖𝑛
𝑙 = 3.7 𝑖𝑛
𝐹 = 120 × (9 × 3) = 3240 𝑙𝑏𝑓
𝑀 =𝐹𝑙8
= 1498.5 𝑙𝑏𝑓 ∙ 𝑖𝑛
𝐼 = 𝜋𝑑4
64= .003068 𝑖𝑛4
𝑐 = 𝑑2
.25 𝑖𝑛
𝜎 =𝑀𝑐𝐼
= 122.1 𝑘𝑠𝑖 > 𝑡𝑒𝑛𝑠𝑖𝑙𝑒 𝑠𝑡𝑟𝑒𝑛𝑔𝑡ℎ
(1)
NASA USRP – Internship Final Report
9 Spring 2011 Session
The above calculation is a conservative calculation since the entire load is applied at the center of the rod as a point load rather than a distributed load. Eq. (1) is the calculation of the maximum value of the moment when the load is applied at the center of the rod (Young, 1989). As shown above, the calculated applied bending stress is over 20 ksi greater than the tensile strength. By performing finite element analysis, it is concluded that only about 3 to 5 percent of the stress is reduced, so regardless, there is a negative margin. In order to solve this problem, gussets will be added on the fixtures to essentially reduce the length of the rod. This will decrease the amount of bending stress applied to the rod itself, so the fixture will be able to carry the load without failure.
𝑐 =𝑑2
= .25 𝑖𝑛
𝐼 = 𝜋𝑑4
64= .003068 𝑖𝑛4
𝜎𝑎𝑙𝑙𝑜𝑤𝑎𝑏𝑙𝑒 =𝑀𝑐𝐼
= 62000 𝑝𝑠𝑖
𝑀 =𝐹𝑙8
=𝐼𝜎𝑐
= 760.864 𝑙𝑏𝑓 ∙ 𝑖𝑛
𝑙 =8𝑀𝐹
= 1.879 𝑖𝑛
This is essentially a backwards calculation of the original calculation in order to find the needed rod length. The original length of the rod is 3.7 inches, so gussets need to be added to reduce the length to 1.879 inches in order for the grip fixtures to be able to carry the load that the honeycomb requires for failure. D. Alignment Test Procedure
For the alignment test, four strain gages are place on the alignment plate in order to collect strain data while load is increased. From the data obtained, one will be able to analyze whether or not the system is properly aligned. As the fixtures cannot carry the 2,220 lbf load, another load will be needed to be determined as a maximum load for the test. The calculation below shows the verification that 1,000 lbf will not damage the grip fixtures.
𝐹 = 1000 𝑙𝑏𝑓
𝑀 =𝐹𝑙8
= 462.5 𝑙𝑏𝑓 ∙ 𝑖𝑛
𝐼 = 𝜋𝑑4
64= .003068 𝑖𝑛4
𝑐 = 𝑑2
.25 𝑖𝑛
𝜎 =𝑀𝑐𝐼
= 37687.4 𝑝𝑠𝑖 < 𝑡𝑒𝑛𝑠𝑖𝑙𝑒 𝑠𝑡𝑟𝑒𝑛𝑔𝑡ℎ
𝐹𝑆 = 5
𝑀𝑆 = 𝜎𝑎𝑙𝑙𝑜𝑤𝑎𝑏𝑙𝑒
𝜎𝑐𝑎𝑙𝑐𝑢𝑙𝑎𝑡𝑒𝑑 × 𝐹𝑆= .329
NASA USRP – Internship Final Report
10 Spring 2011 Session
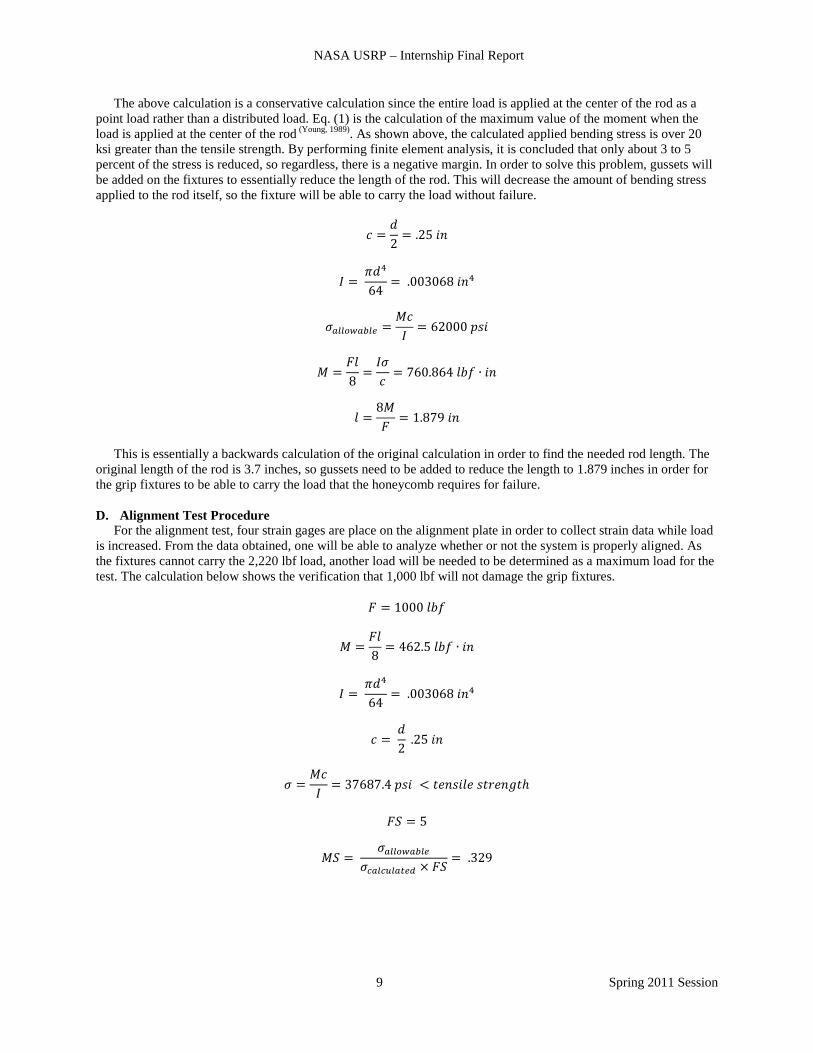
In the calculation, a conservative factor of safety of 5 is used, yet the margin of safety is still positive. Therefore, the alignment test can be carried out at a load limit of 1,000 lbf. Readings from this test, although at a smaller load, may be able to provide preliminary information on the alignment of the system, which we can then decide whether the system needs to be altered in any way to attain maximum accuracy for the shear tests. E. Alignment Test Results There were two tests performed, one which produced usable data values and one which was done as a test. As mentioned previously, for the grip fixture-to-mounting plate assembly, there are fasteners as well as the tongue and groove system. The assumption is to refrain from tightening the fasteners and only loosely place them in the structure so that the ridge can take all of the load. To verify that the hypothesis is correct, a test was run with the fasteners tightened. They contained torque of approximately 15ft-lbs each prior to testing. The load limit was 1,000 lbf , and the rate of deflection on the load frame was .03 in/sec.
Figure 11. Alignment Test Setup. Pre-alignment test displaying setup of test in electro-mechanical load frame.
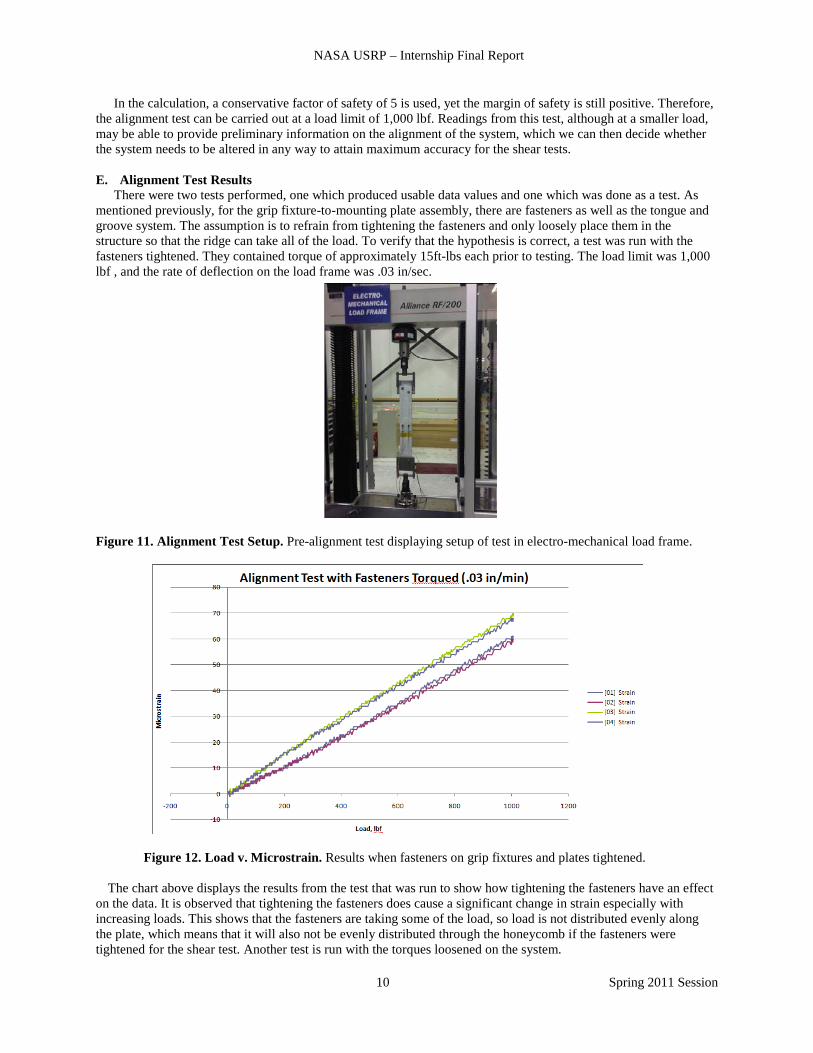
Figure 12. Load v. Microstrain. Results when fasteners on grip fixtures and plates tightened.
The chart above displays the results from the test that was run to show how tightening the fasteners have an effect
on the data. It is observed that tightening the fasteners does cause a significant change in strain especially with increasing loads. This shows that the fasteners are taking some of the load, so load is not distributed evenly along the plate, which means that it will also not be evenly distributed through the honeycomb if the fasteners were tightened for the shear test. Another test is run with the torques loosened on the system.
NASA USRP – Internship Final Report
11 Spring 2011 Session
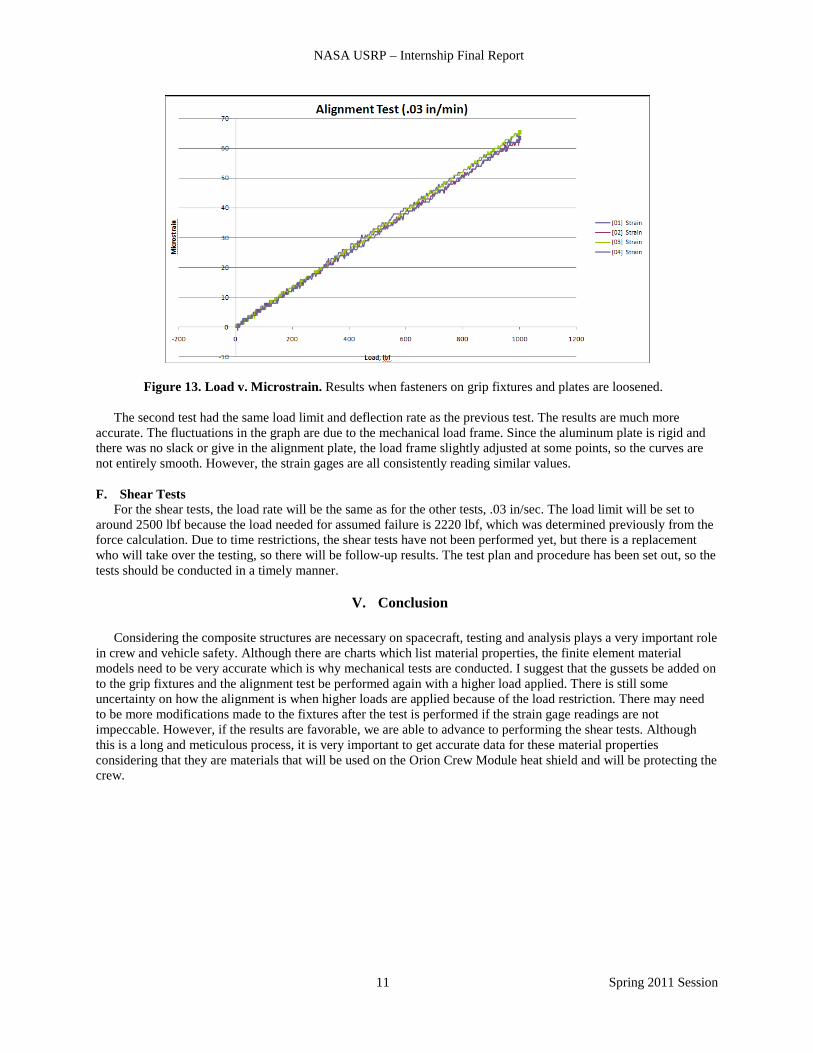
Figure 13. Load v. Microstrain. Results when fasteners on grip fixtures and plates are loosened. The second test had the same load limit and deflection rate as the previous test. The results are much more accurate. The fluctuations in the graph are due to the mechanical load frame. Since the aluminum plate is rigid and there was no slack or give in the alignment plate, the load frame slightly adjusted at some points, so the curves are not entirely smooth. However, the strain gages are all consistently reading similar values. F. Shear Tests
For the shear tests, the load rate will be the same as for the other tests, .03 in/sec. The load limit will be set to around 2500 lbf because the load needed for assumed failure is 2220 lbf, which was determined previously from the force calculation. Due to time restrictions, the shear tests have not been performed yet, but there is a replacement who will take over the testing, so there will be follow-up results. The test plan and procedure has been set out, so the tests should be conducted in a timely manner.
V. Conclusion
Considering the composite structures are necessary on spacecraft, testing and analysis plays a very important role in crew and vehicle safety. Although there are charts which list material properties, the finite element material models need to be very accurate which is why mechanical tests are conducted. I suggest that the gussets be added on to the grip fixtures and the alignment test be performed again with a higher load applied. There is still some uncertainty on how the alignment is when higher loads are applied because of the load restriction. There may need to be more modifications made to the fixtures after the test is performed if the strain gage readings are not impeccable. However, if the results are favorable, we are able to advance to performing the shear tests. Although this is a long and meticulous process, it is very important to get accurate data for these material properties considering that they are materials that will be used on the Orion Crew Module heat shield and will be protecting the crew.
NASA USRP – Internship Final Report
12 Spring 2011 Session
Acknowledgments
Farah N. Khemani wishes to thank everyone involved in all aspects of her internship, starting with her mentor and senior structural engineer, Mr. David Lowry. He carries an extensive amount of knowledge, experience, and passion towards composite structural design, which was generously shared with Farah. She would also like to thank Mr. Greg Galbreath and Mr. John Zipay for introducing and welcoming her to the Structures Branch at NASA JSC. Farah thanks her branch as well as all the people who contributed to her projects. The author especially thanks Veronica Seyl and Courtney Crooks, the Undergraduate Student Research Program coordinators for providing her opportunity to take part in the program.
References 1Department of Defense. (1967). Military Standards Sandwich Constructions and Core Materials; General Test
Methods., (p. 25). Washington D. C. 2Hexcel Composites. (1999). HexWeb™ Honeycomb Attributes and Properties. TSB 120. 3Young, W. C. (1989). Roark's Formulas for Stress & Strain. McGraw-Hill, Inc.