Embed Size (px)
Citation preview
1
COMPOSITE DESIGN EXPERIENCE USING MSC NASTRAN FOR THEHYDRODYNAMIC FAIRINGS OF A NEW SUBMERSIBLE
Dr. E. Thomas Moyer Jr., Dr. Richard Cobb, Mr. Kim GrubbsAnalysis and Technology Inc., Engineering Technologies Group
andDr. William Gordon
Northrop-Grumman Corporation, Oceanic Systems
This paper details our recent experiences designing the fairings for a newsubmersible vehicle being constructed. A unique composite material designapproach was chosen to meet challenging structural requirements whileminimizing weight. Analysis examples include material selection decisions,laminate design tradeoff studies, modeling of bolted joints, establishment ofmaterial allowables and global/local analysis approaches.
1] Introduction
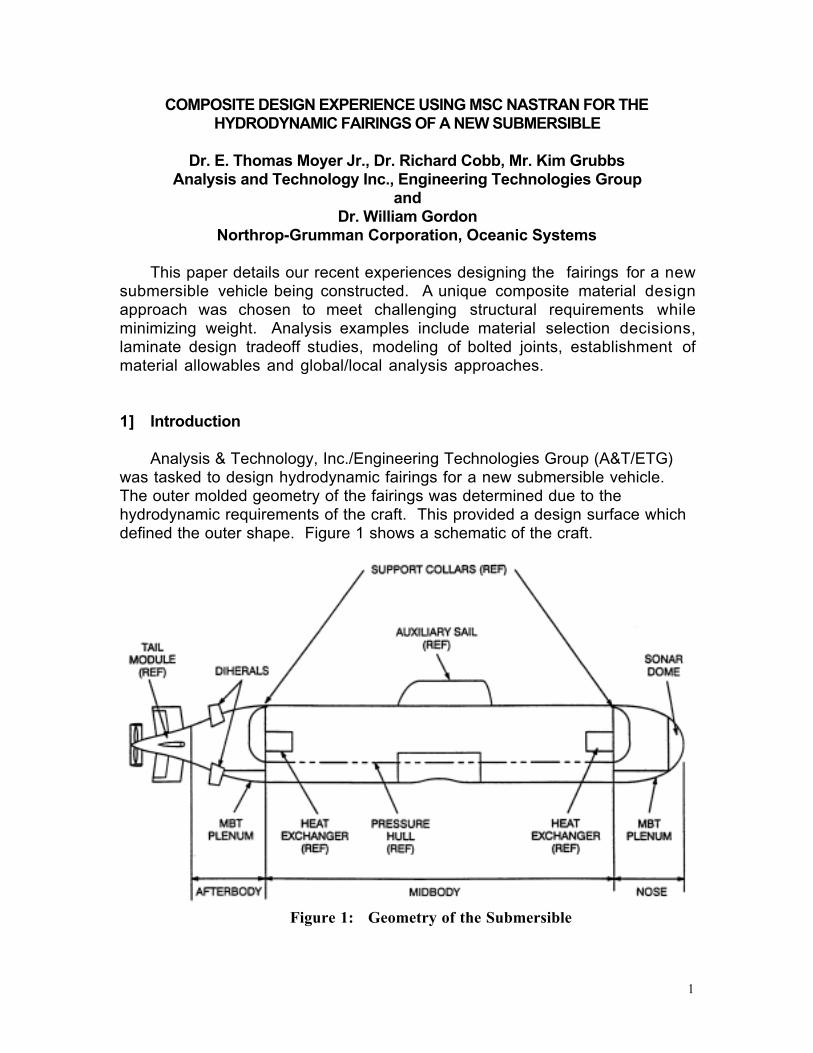
Analysis & Technology, Inc./Engineering Technologies Group (A&T/ETG)was tasked to design hydrodynamic fairings for a new submersible vehicle.The outer molded geometry of the fairings was determined due to thehydrodynamic requirements of the craft. This provided a design surface whichdefined the outer shape. Figure 1 shows a schematic of the craft.
Figure 1: Geometry of the Submersible
2
The fairings are divided into three distinct sections: the nose fairing, themidbody fairing panels and the aft fairing, each with independent requirements.The nose connects to the pressure hull of the craft at eight lugs welded to thesteel collar. The sonar dome is connected to the front end of the nose fairing.The aft fairing connects to a similar steel collar at the aft end of the pressurehull (also through eight lugs). The tail section bolts to the aft end of the aftfairing. Surrounding the pressure hull are the midbody fairing panels. Themidbody panels consist of discrete fairing panels which must be easilyremovable to provide access to equipment/systems foundationed to the hull.Due to space limitations, this paper will discuss the design of the nose/aftfairings and its connection to the pressure hull support collar. MSC NASTRAN[1] was the primary analysis tool used in the design process. Both linear andelastic-plastic analyses were performed. All analyses were performed underWindows NT using a 300 MHz Pentium II processor, 128Mb of RAM and a 10Gb SCSI hard disk drive.
2] Nose/Aft Design Requirements
The nose/aft fairings are separate structural systems which share manydesign features and requirements. Various loading conditions are defined toreflect both operational loads and extreme loads anticipated in use. Thecontrolling load cases to be discussed in this paper include an operationalload case where 1000 psf pressure is applied to the top of the structure whilesubjected to a 1 g inertial load. Inertial loads include 30% of the entrained andentrapped water of the flooded fairing structure. It was determined that thiswas the effective Òadded massÓ acting on the structure while submerged. Thesecond load case considered in this paper is an extreme load case(anticipated to occur very infrequently). This load is a 20 g inertial load in anydirection.
Due to weight considerations it was decided to use a rubber toughenedepoxy/glass prepreg composite for the outer surface of the nose/aft fairings.This material has excellent fracture toughness properties in addition to goodstiffness, strength and damage tolerance. The good fracture toughnessprovides the structure with good impact resistance. It was envisioned early onthat the nose/aft structures would be skin stiffened shells. The structuralconfiguration is presented in detail in the next section. Internal structure (forstiffeners, internal bulkheads, etc.) could be constructed from any readilyavailable composite materials. Both prepreg carbon/epoxy and VacuumAssisted Resin Transfer Molded E-glass/Vinylester (VARTM glass) compositeswere employed. Metallic parts were to be made from ELI grade titanium forweight/strength/corrosion considerations.
To assess structural integrity, it was decided to use a component bycomponent failure approach. For laminate composites the stress in the warp,
3
fill and in-plane shear direction for each lamina were compared with laminaallowables for those components. For operational load cases, a factor ofsafety of four (4) was imposed on all lamina strengths. This large factorprovides good fatigue life and some margin due to ignoring combined failuremode effects. For the extreme load case, no safety factor is employed. Therequirement for the extreme load is that the overall integrity of the structuremust be maintained, however, local damage is permitted. Under extremeloading, slight local stress excesses were, therefore, tolerated. For operationalload cases, a factor of safety of 2 on yield was employed for metals. For theextreme load case, ultimate strength (compared to principal stresses) wasused. A detailed elastic-plastic analysis was employed for the attachment tothe pressure hull.
3] Nose/Aft Model Features
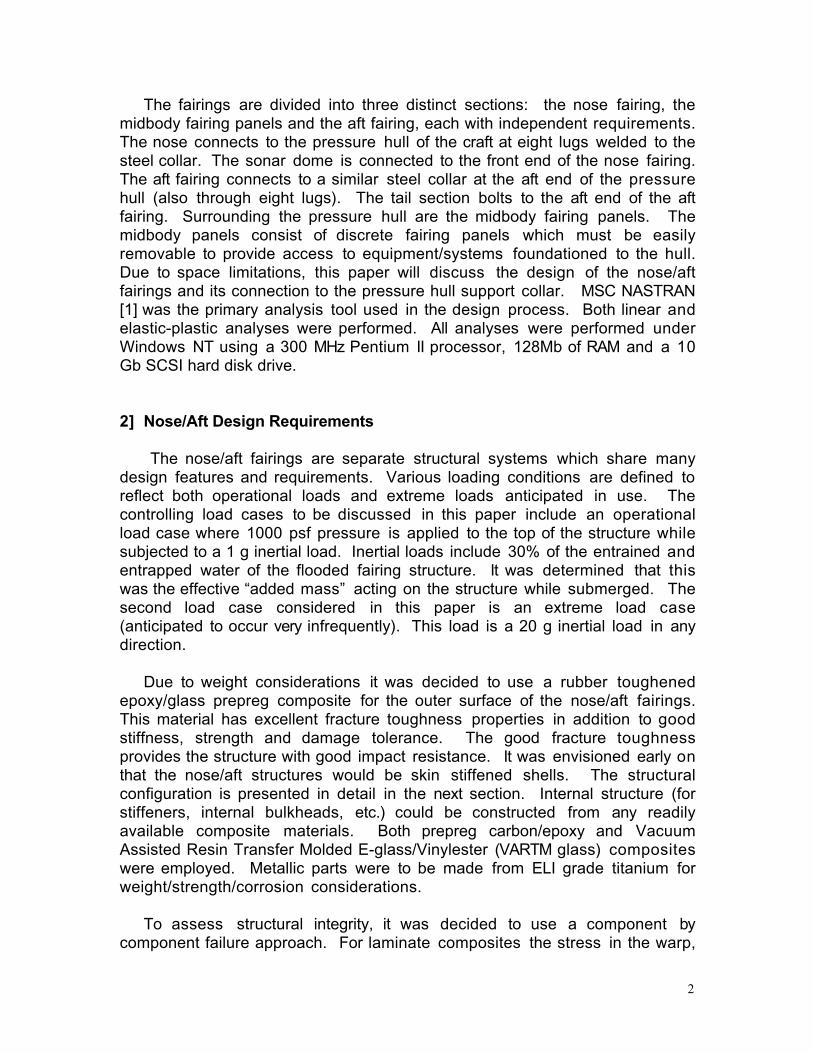
Figure 2 provides a picture of the global finite element model of the nosefairing.
Figure 2: Nose NASTRAN Model
This model assumes symmetry about the longitudinal center plane of thevehicle. The colors refer to the NASTRAN properties of the model. Basically,
4
the structure is a stiffened shell structure with on internal bulkhead. The majoropening in the side of the fairing is for the vehicle thrusters and is covered bythruster doors. The shell is stiffened by C channels constructed from prepregcarbon/epoxy composites. The stiffeners are bolted to the shell with titaniumbolts. The full model is comprised of approximately 28,000 nodes and 32,000elements.
All composite laminates in the submersible Nose Fairing structure aremodeled using layered shell elements (CQUAD4 and CTRIA3 elements).These include the E-Glass outer skin, floor, and forward bulkhead; the carbonL-channel, longerons, transverses, and roof bracing; and the VARTM GRPvertical and sloped bulkheads. Individual ply thicknesses, material sets, andangular orientations for each particular lamina are fully detailed in the elementdescriptions. Laminate properties are specified using the PCOMP propertycard with MAT8 material properties. The 1Ó thick and 6Ó thick syntactic foamcores (for the sloped bulkhead and the vertical bulkhead, respective), aremodeled using solid elements. The sonar dome on the submersible Nose isalso modeled with layered shell elements, using element descriptions andmaterial properties provided for the system. The sonar dome will not bediscussed in detail in this paper.
All of the composite structural elements in the submersible Nose Fairingare joined using titanium bathtub fittings. The entire nose structure is thenconnected to the submersible forward support collar through the use of eighttitanium clevi. These titanium pieces are represented in the submersible Nosemodels as discrete components, modeled using isotropic plate elements. Thebolts connecting the various structural components of the submersible Noseare discretely modeled as stiff bar elements. The bar elements are notpermitted to transmit torsion, however, they can transmit axial force, twocomponents of shear force and two bending moments.
Equipments which are foundationed to the submersible Nose Fairingstructure are modeled using point masses connected to the fairing structurewith stiff bar elements. All equipments weighing over 15 lb. are included in themodels.
4] Material Systems
The nose/aft fairings employ three composite material systems, the rubbertoughened epoxy GRP prepreg (E-Glass), the carbon/epoxy prepreg and theVARTM GRP. Since the vessel operates in seawater, strength degradation dueto moisture absorption must be considered. For the purposes of design, thestiffness data used are ÒdryÓ values. All properties are computed as ÒB-BasisÓvalues. Dry moduli are typically higher than ÒwetÓ moduli. Using dry stiffnessproperties, therefore, tends to predict conservative stresses. Strength
5
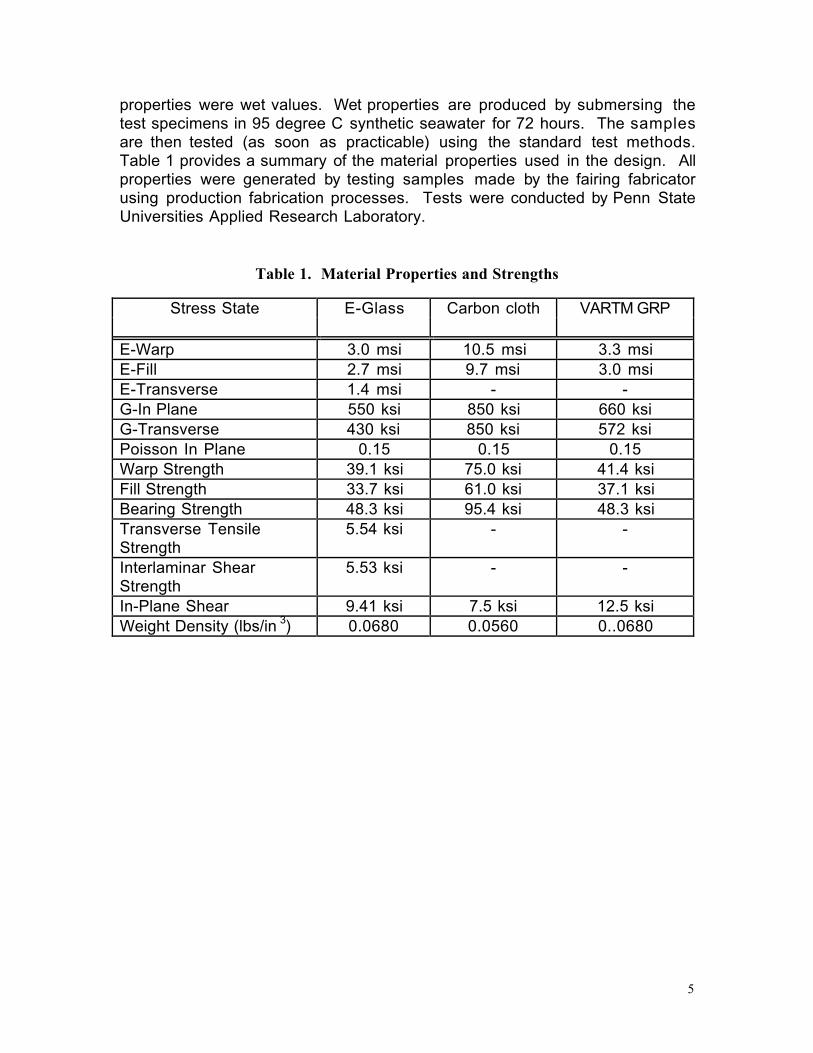
properties were wet values. Wet properties are produced by submersing thetest specimens in 95 degree C synthetic seawater for 72 hours. The samplesare then tested (as soon as practicable) using the standard test methods.Table 1 provides a summary of the material properties used in the design. Allproperties were generated by testing samples made by the fairing fabricatorusing production fabrication processes. Tests were conducted by Penn StateUniversities Applied Research Laboratory.
Table 1. Material Properties and Strengths
Stress State E-Glass Carbon cloth VARTM GRP
E-Warp 3.0 msi 10.5 msi 3.3 msiE-Fill 2.7 msi 9.7 msi 3.0 msiE-Transverse 1.4 msi - -G-In Plane 550 ksi 850 ksi 660 ksiG-Transverse 430 ksi 850 ksi 572 ksiPoisson In Plane 0.15 0.15 0.15Warp Strength 39.1 ksi 75.0 ksi 41.4 ksiFill Strength 33.7 ksi 61.0 ksi 37.1 ksiBearing Strength 48.3 ksi 95.4 ksi 48.3 ksiTransverse TensileStrength
5.54 ksi - -
Interlaminar ShearStrength
5.53 ksi - -
In-Plane Shear 9.41 ksi 7.5 ksi 12.5 ksiWeight Density (lbs/in 3) 0.0680 0.0560 0..0680
6
4] Stress Results Nose/Aft
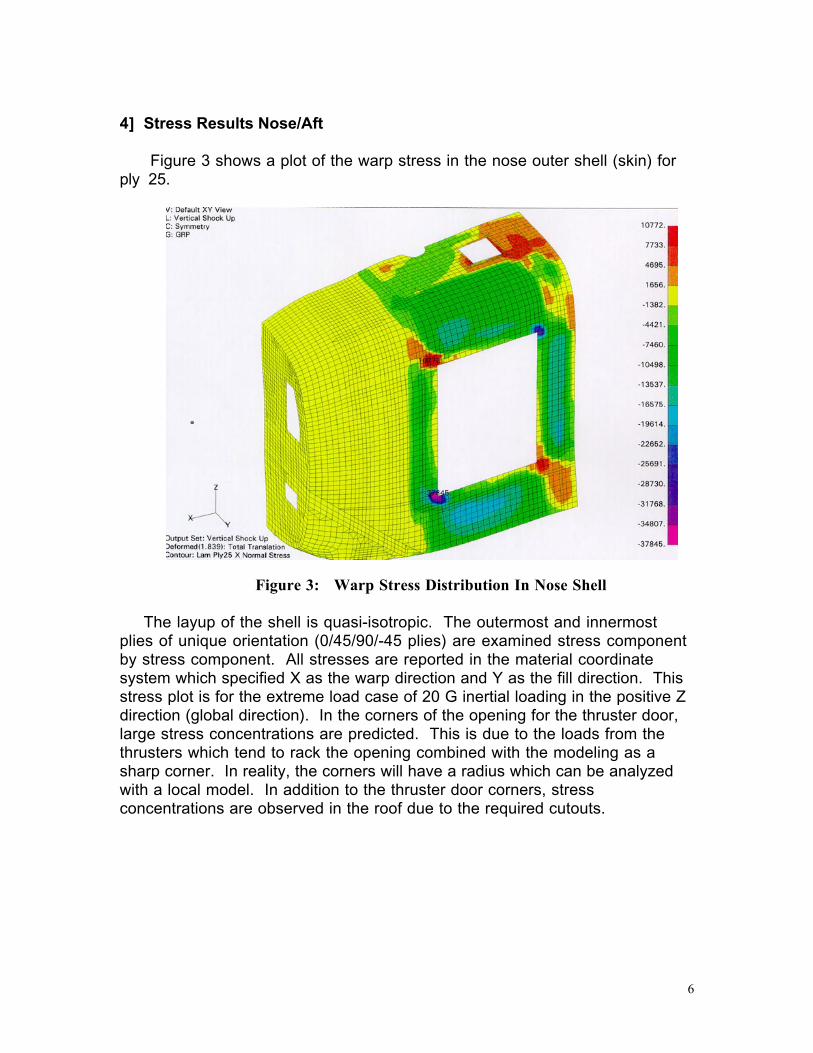
Figure 3 shows a plot of the warp stress in the nose outer shell (skin) forply 25.
Figure 3: Warp Stress Distribution In Nose Shell
The layup of the shell is quasi-isotropic. The outermost and innermostplies of unique orientation (0/45/90/-45 plies) are examined stress componentby stress component. All stresses are reported in the material coordinatesystem which specified X as the warp direction and Y as the fill direction. Thisstress plot is for the extreme load case of 20 G inertial loading in the positive Zdirection (global direction). In the corners of the opening for the thruster door,large stress concentrations are predicted. This is due to the loads from thethrusters which tend to rack the opening combined with the modeling as asharp corner. In reality, the corners will have a radius which can be analyzedwith a local model. In addition to the thruster door corners, stressconcentrations are observed in the roof due to the required cutouts.
7
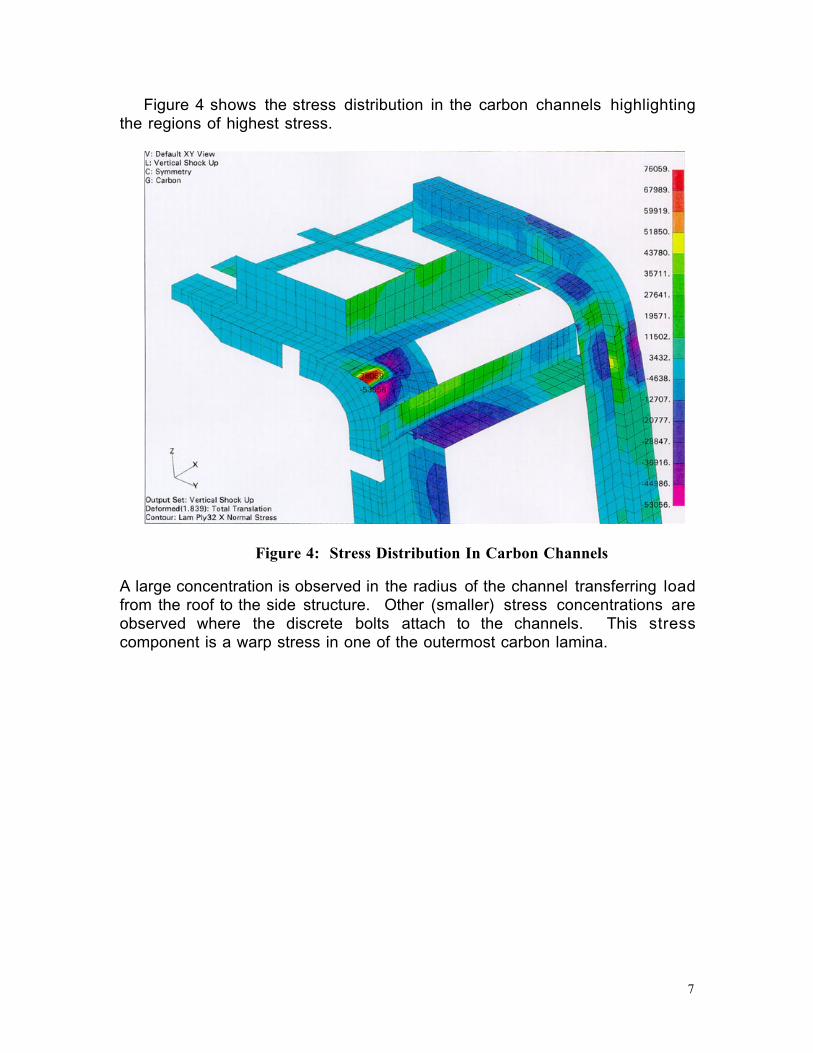
Figure 4 shows the stress distribution in the carbon channels highlightingthe regions of highest stress.
Figure 4: Stress Distribution In Carbon Channels
A large concentration is observed in the radius of the channel transferring loadfrom the roof to the side structure. Other (smaller) stress concentrations areobserved where the discrete bolts attach to the channels. This stresscomponent is a warp stress in one of the outermost carbon lamina.
8
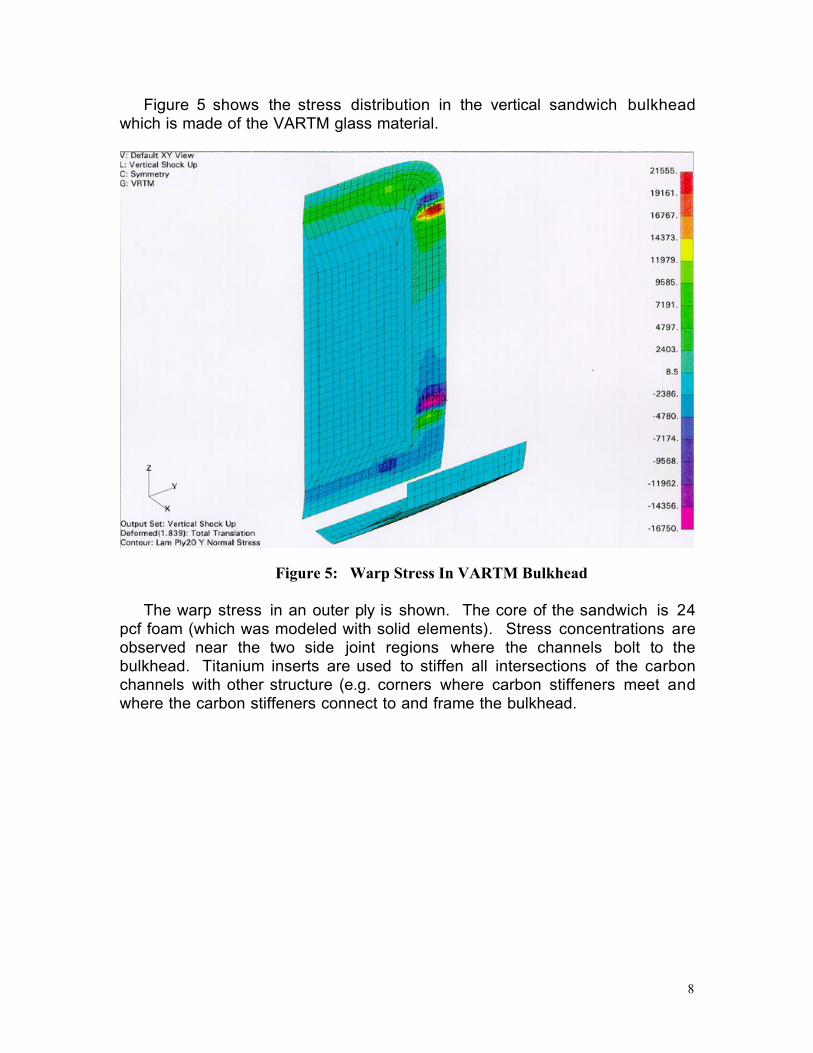
Figure 5 shows the stress distribution in the vertical sandwich bulkheadwhich is made of the VARTM glass material.
Figure 5: Warp Stress In VARTM Bulkhead
The warp stress in an outer ply is shown. The core of the sandwich is 24pcf foam (which was modeled with solid elements). Stress concentrations areobserved near the two side joint regions where the channels bolt to thebulkhead. Titanium inserts are used to stiffen all intersections of the carbonchannels with other structure (e.g. corners where carbon stiffeners meet andwhere the carbon stiffeners connect to and frame the bulkhead.
9
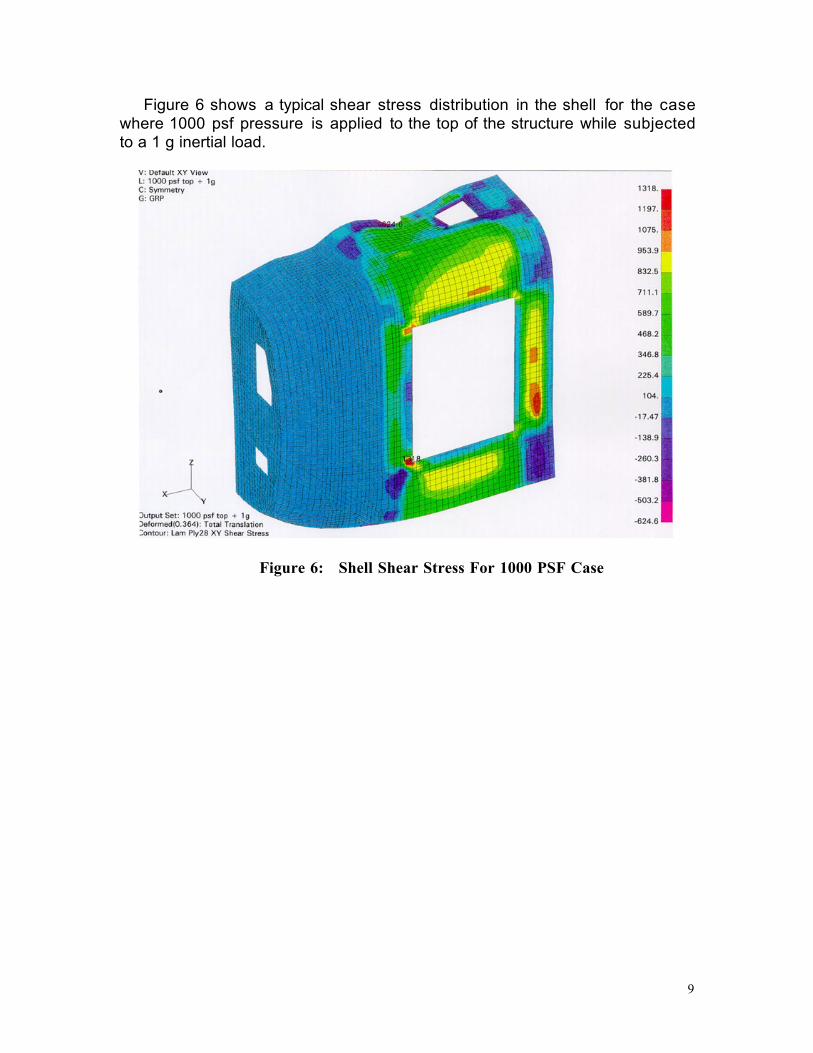
Figure 6 shows a typical shear stress distribution in the shell for the casewhere 1000 psf pressure is applied to the top of the structure while subjectedto a 1 g inertial load.
Figure 6: Shell Shear Stress For 1000 PSF Case
10
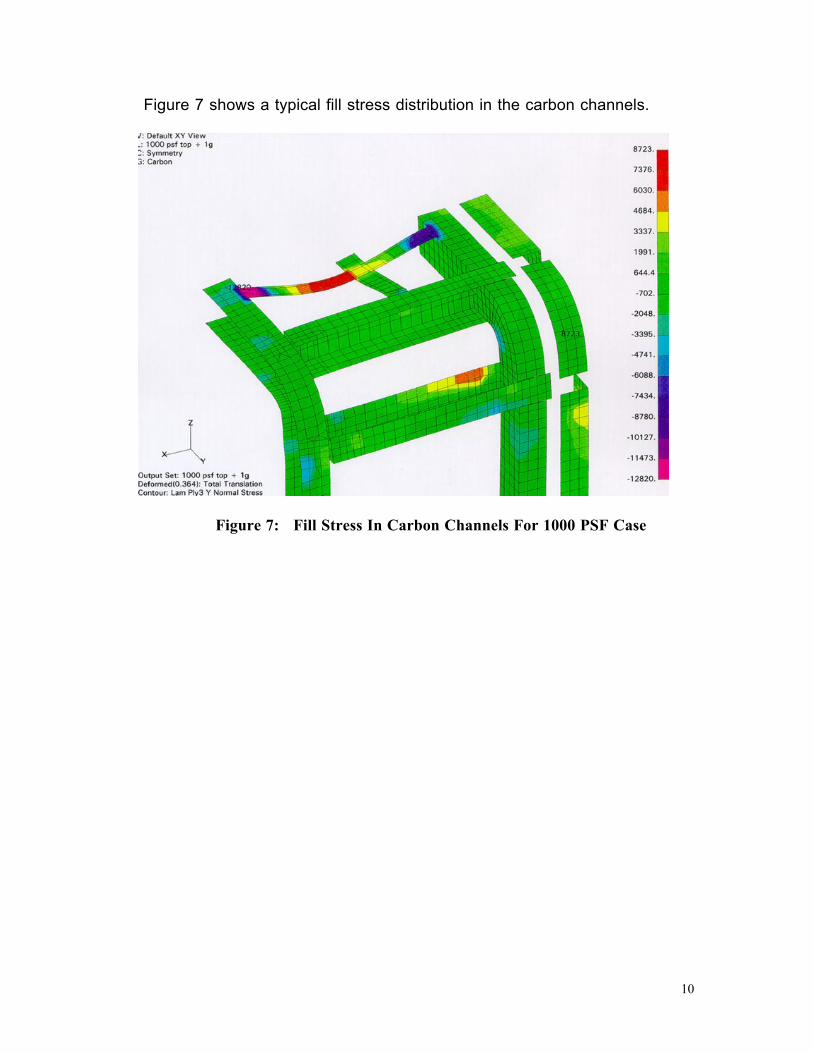
Figure 7 shows a typical fill stress distribution in the carbon channels.
Figure 7: Fill Stress In Carbon Channels For 1000 PSF Case
11
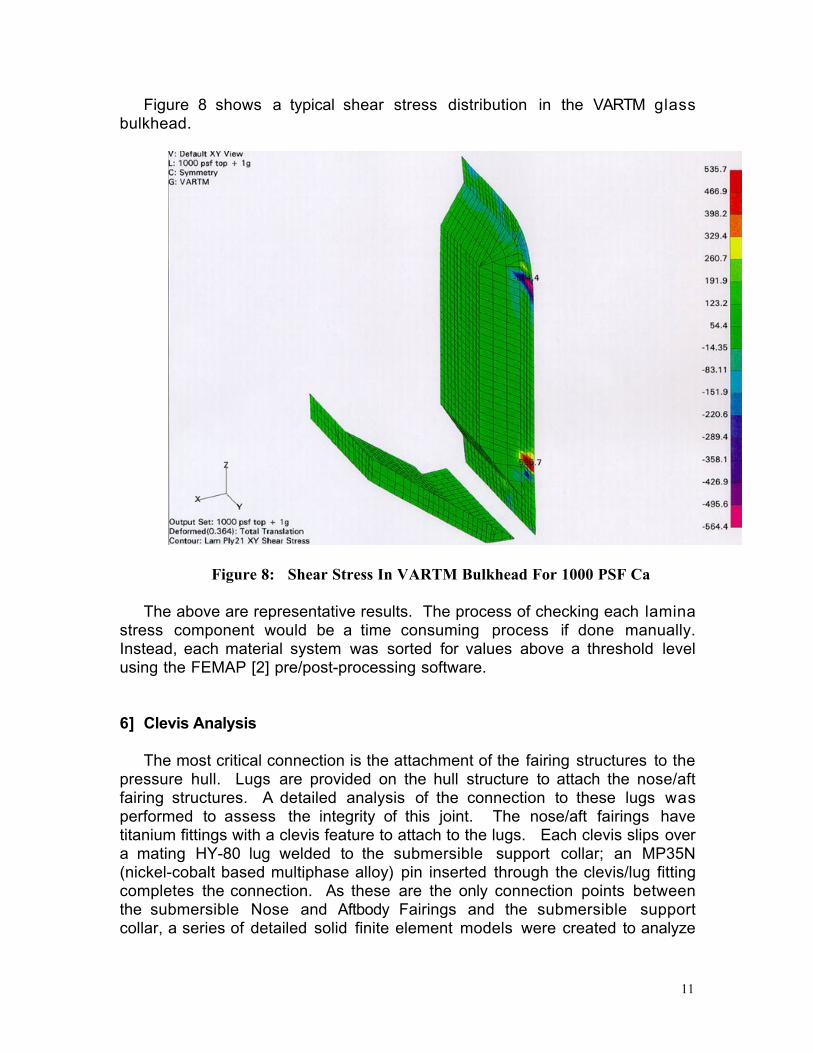
Figure 8 shows a typical shear stress distribution in the VARTM glassbulkhead.
Figure 8: Shear Stress In VARTM Bulkhead For 1000 PSF Ca
The above are representative results. The process of checking each laminastress component would be a time consuming process if done manually.Instead, each material system was sorted for values above a threshold levelusing the FEMAP [2] pre/post-processing software.
6] Clevis Analysis
The most critical connection is the attachment of the fairing structures to thepressure hull. Lugs are provided on the hull structure to attach the nose/aftfairing structures. A detailed analysis of the connection to these lugs wasperformed to assess the integrity of this joint. The nose/aft fairings havetitanium fittings with a clevis feature to attach to the lugs. Each clevis slips overa mating HY-80 lug welded to the submersible support collar; an MP35N(nickel-cobalt based multiphase alloy) pin inserted through the clevis/lug fittingcompletes the connection. As these are the only connection points betweenthe submersible Nose and Aftbody Fairings and the submersible supportcollar, a series of detailed solid finite element models were created to analyze
12
the stress/strain levels present in the clevi under Òworst caseÓ design loadconditions.
In order to determine the clevis strain levels, elastic-plastic analyses wereperformed using the finite element code MSC/NASTRAN. Elastic-plastic staticanalyses were performed on detailed finite element (FE) models of selectedclevi and surrounding fairing structure. Selection of clevi to be analyzed andmodel loads were based upon the results of previous analyses performed forthe submersible Nose and Aftbody.
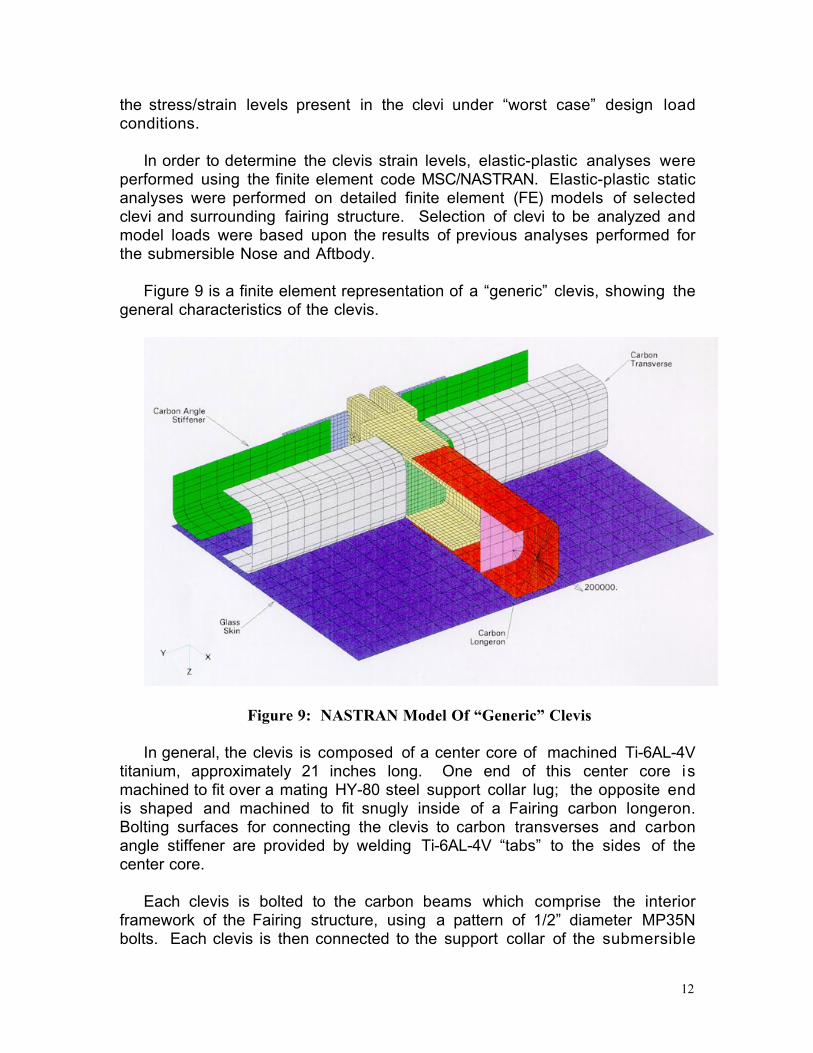
Figure 9 is a finite element representation of a ÒgenericÓ clevis, showing thegeneral characteristics of the clevis.
Figure 9: NASTRAN Model Of ÒGenericÓ Clevis
In general, the clevis is composed of a center core of machined Ti-6AL-4Vtitanium, approximately 21 inches long. One end of this center core ismachined to fit over a mating HY-80 steel support collar lug; the opposite endis shaped and machined to fit snugly inside of a Fairing carbon longeron.Bolting surfaces for connecting the clevis to carbon transverses and carbonangle stiffener are provided by welding Ti-6AL-4V ÒtabsÓ to the sides of thecenter core.
Each clevis is bolted to the carbon beams which comprise the interiorframework of the Fairing structure, using a pattern of 1/2Ó diameter MP35Nbolts. Each clevis is then connected to the support collar of the submersible
13
pressure hull by an MP35N pin that joins the clevis to its mating HY-80 steellug. Lateral constraint of the Fairing structure is provided by MP35N jackscrews on the clevis, which bear down upon either side of the support collarlug.
As mentioned earlier, the submersible has a total of sixteen clevi (eightforward and eight aft). While the general configuration of each clevis is thesame, there are specific differences in the particular geometry of each. Thesedifferences are due to the varying geometries of the particular carbon beamsinto which each clevis fits. These beams have varying degrees of curvatureand twist, depending upon their location in the fairing structure. For example,the transverse tabs on the clevi on the sides of the fairing structures arerelatively flat; the tabs on one side of the top clevis, on the other hand, have adegree of curvature due to the curvature of the carbon beams in the corner ofthe fairing structure.
The generic clevis model is exactly what its name implies - a genericrepresentation of a ÒtypicalÓ clevis. As discussed earlier, there is no singlegeometry which is completely accurate for each submersible clevis. Each hasa unique geometry, based upon its location on the Support Collar, the geometryof the carbon beams which are attached to it, and other factors. The genericclevis is an idealized version of all 16 clevi, with all bend and twist taken out ofits various components. Since there is no twist or bend in this modelgeometry, it was significantly easier to construct than the models representingactual clevis and fairing geometries. As such, it was used to obtain an initialÒquick lookÓ at the strain levels in the clevis under loading. This model wasloaded by applying a longitudinal force of 200,000 lb. to the end of the carbonlongeron; this is meant to represent the worst load case, which produces amaximum longitudinal reaction of 197,697 lb. (201,253 lb. total shear reaction)at the top clevis/lug joint.
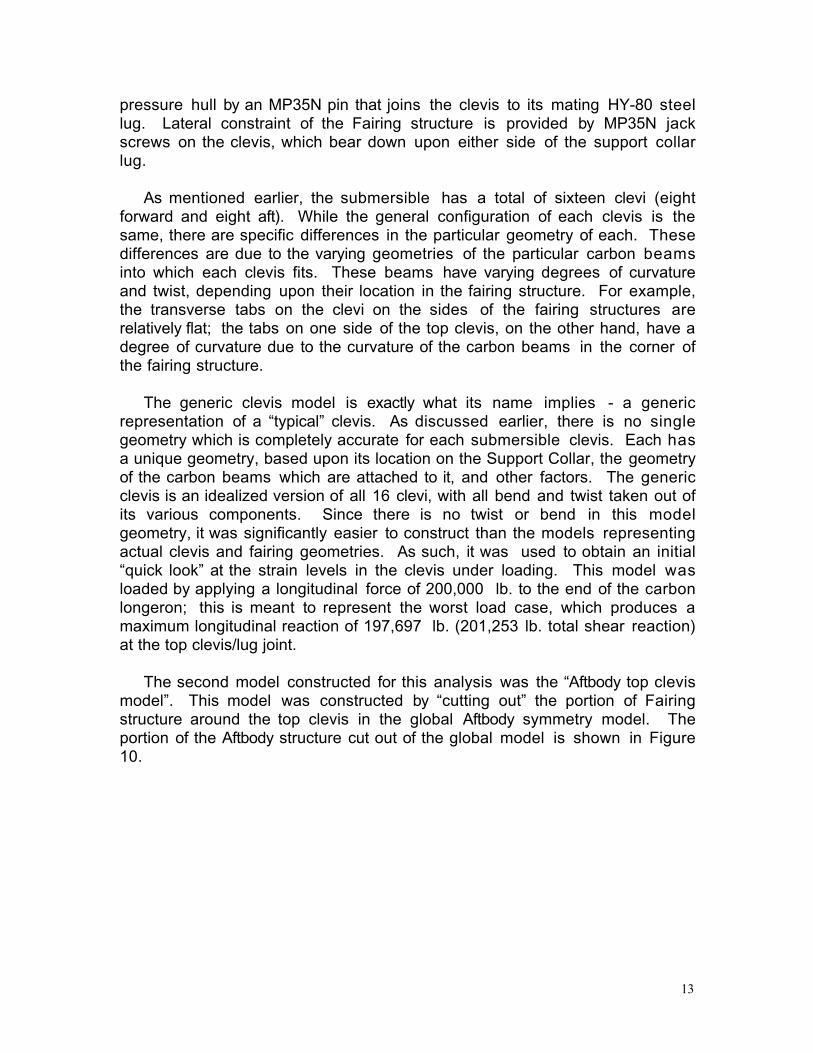
The second model constructed for this analysis was the ÒAftbody top clevismodelÓ. This model was constructed by Òcutting outÓ the portion of Fairingstructure around the top clevis in the global Aftbody symmetry model. Theportion of the Aftbody structure cut out of the global model is shown in Figure10.
14
Figure 10: Local Cutout For Aft-Body Analysis
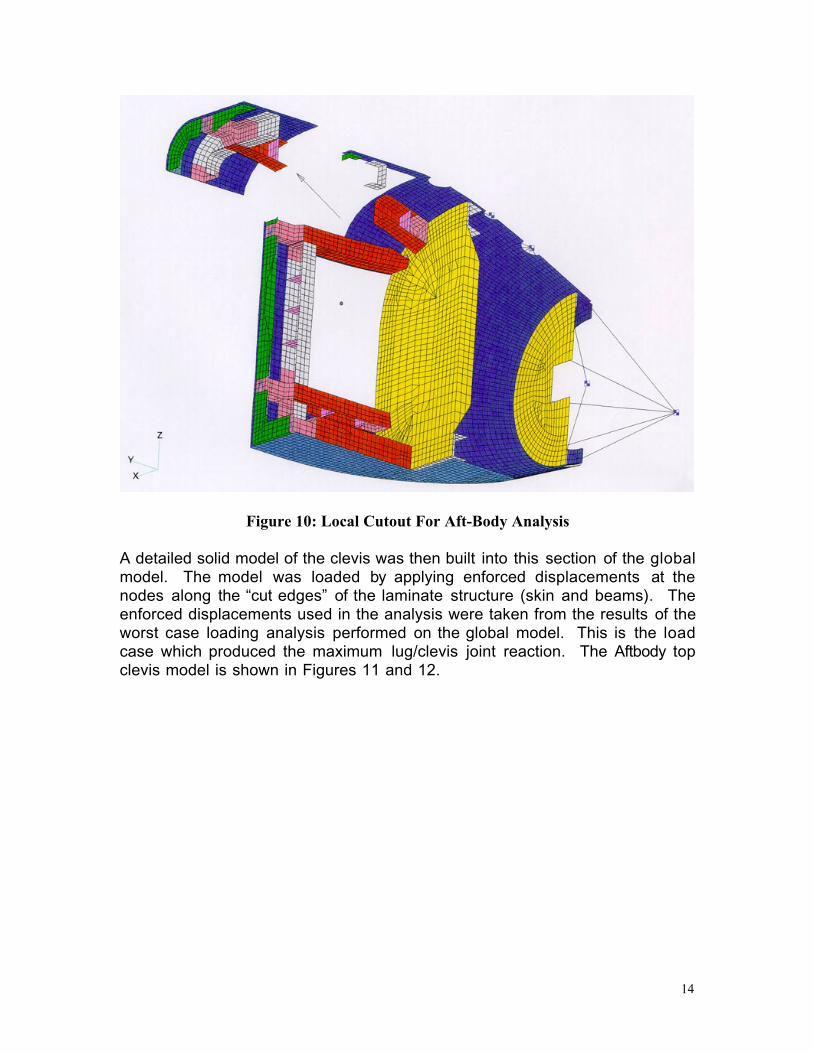
A detailed solid model of the clevis was then built into this section of the globalmodel. The model was loaded by applying enforced displacements at thenodes along the Òcut edgesÓ of the laminate structure (skin and beams). Theenforced displacements used in the analysis were taken from the results of theworst case loading analysis performed on the global model. This is the loadcase which produced the maximum lug/clevis joint reaction. The Aftbody topclevis model is shown in Figures 11 and 12.
15
Figure 11: Aft-Body Clevis Analysis Model
16
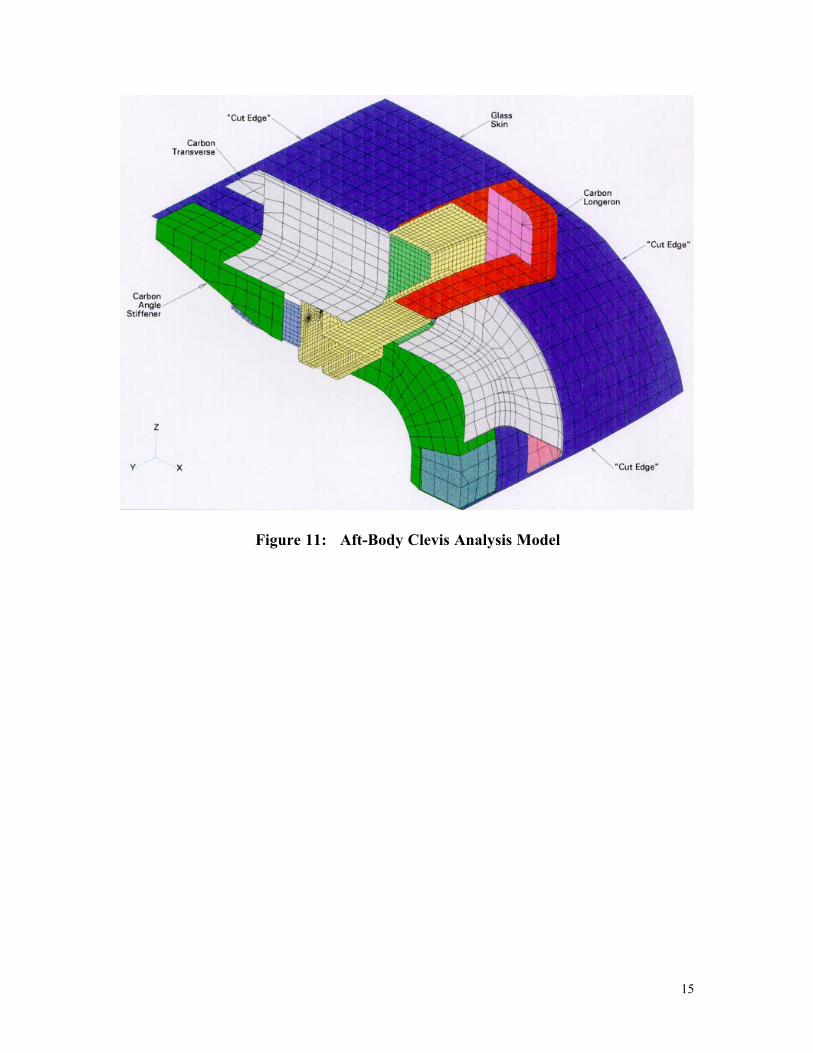
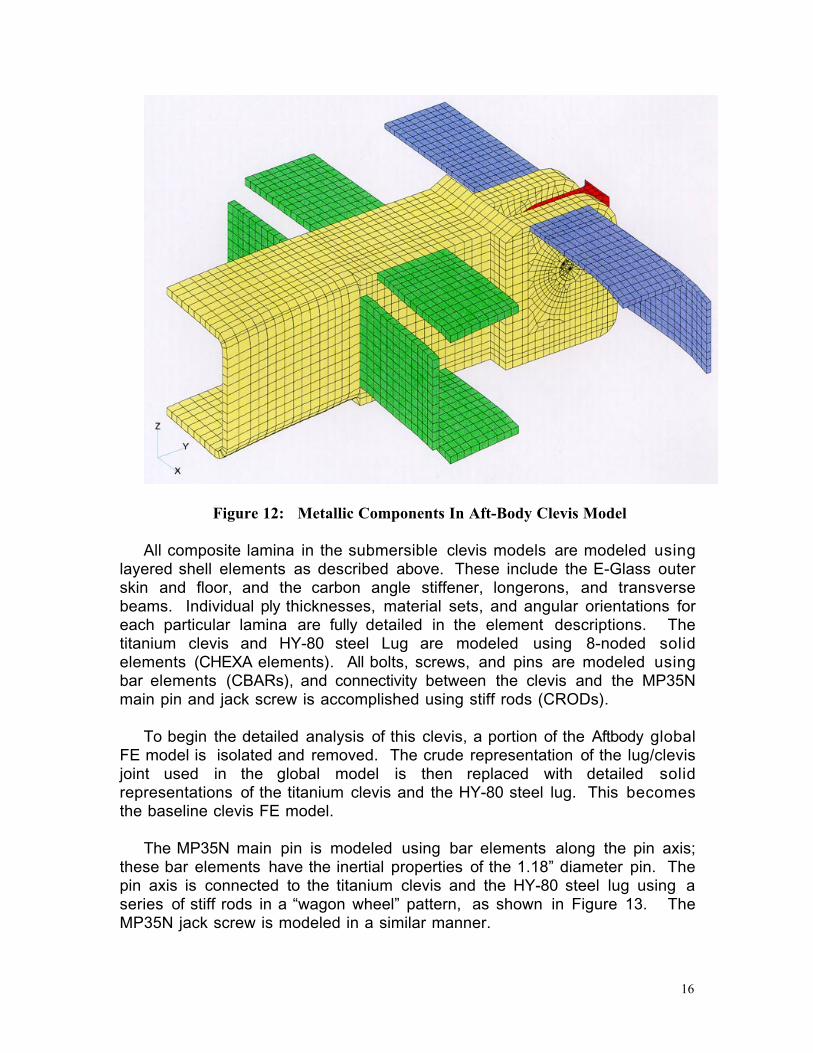
Figure 12: Metallic Components In Aft-Body Clevis Model
All composite lamina in the submersible clevis models are modeled usinglayered shell elements as described above. These include the E-Glass outerskin and floor, and the carbon angle stiffener, longerons, and transversebeams. Individual ply thicknesses, material sets, and angular orientations foreach particular lamina are fully detailed in the element descriptions. Thetitanium clevis and HY-80 steel Lug are modeled using 8-noded solidelements (CHEXA elements). All bolts, screws, and pins are modeled usingbar elements (CBARs), and connectivity between the clevis and the MP35Nmain pin and jack screw is accomplished using stiff rods (CRODs).
To begin the detailed analysis of this clevis, a portion of the Aftbody globalFE model is isolated and removed. The crude representation of the lug/clevisjoint used in the global model is then replaced with detailed solidrepresentations of the titanium clevis and the HY-80 steel lug. This becomesthe baseline clevis FE model.
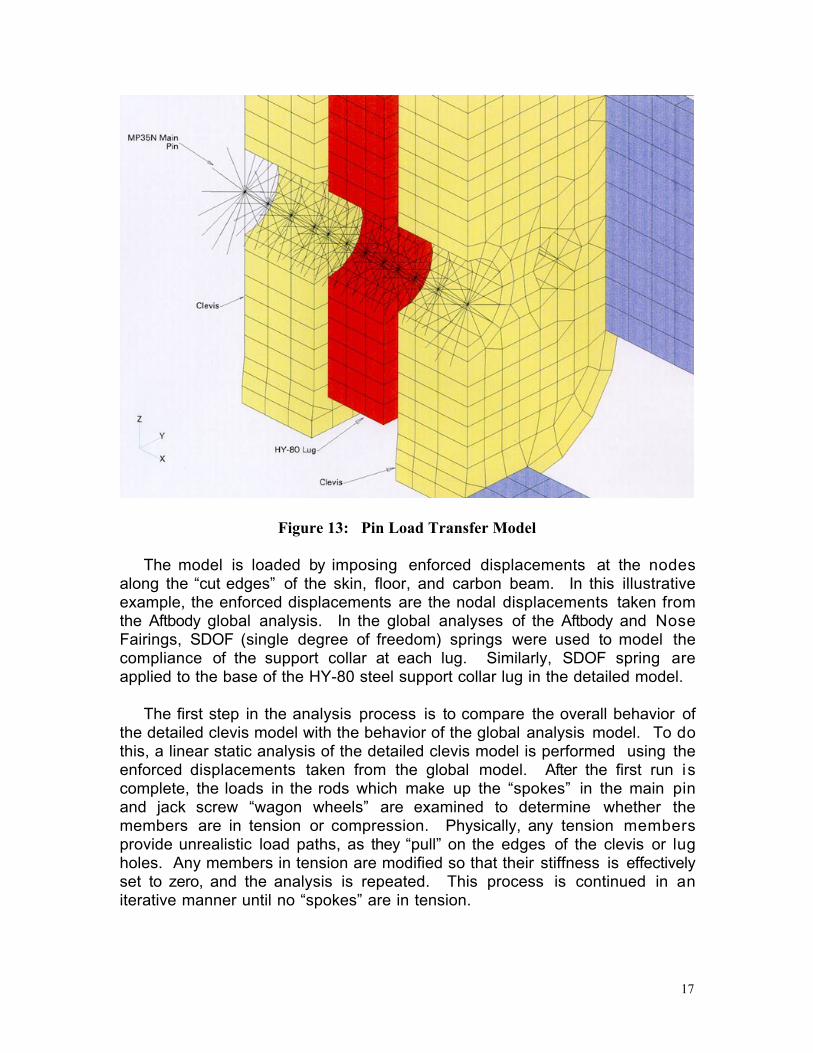
The MP35N main pin is modeled using bar elements along the pin axis;these bar elements have the inertial properties of the 1.18Ó diameter pin. Thepin axis is connected to the titanium clevis and the HY-80 steel lug using aseries of stiff rods in a Òwagon wheelÓ pattern, as shown in Figure 13. TheMP35N jack screw is modeled in a similar manner.
17
Figure 13: Pin Load Transfer Model
The model is loaded by imposing enforced displacements at the nodesalong the Òcut edgesÓ of the skin, floor, and carbon beam. In this illustrativeexample, the enforced displacements are the nodal displacements taken fromthe Aftbody global analysis. In the global analyses of the Aftbody and NoseFairings, SDOF (single degree of freedom) springs were used to model thecompliance of the support collar at each lug. Similarly, SDOF spring areapplied to the base of the HY-80 steel support collar lug in the detailed model.
The first step in the analysis process is to compare the overall behavior ofthe detailed clevis model with the behavior of the global analysis model. To dothis, a linear static analysis of the detailed clevis model is performed using theenforced displacements taken from the global model. After the first run iscomplete, the loads in the rods which make up the ÒspokesÓ in the main pinand jack screw Òwagon wheelsÓ are examined to determine whether themembers are in tension or compression. Physically, any tension membersprovide unrealistic load paths, as they ÒpullÓ on the edges of the clevis or lugholes. Any members in tension are modified so that their stiffness is effectivelyset to zero, and the analysis is repeated. This process is continued in aniterative manner until no ÒspokesÓ are in tension.
18
Once all the tension members have been removed from the model, thetotal force reactions at the lug are determined and compared to the reactionsobtained from the global analysis model. If there is a significant difference inthe reactions, then the stiffnesses of the SDOF springs at the base of the lugare adjusted and the analysis is repeated. Again, the analysis is repeated inan iterative manner until the force reactions obtained from the detailed clevismodel closely match the force reactions obtained from the global model. Thisprovides a level of confidence that the detailed model and the global model arebehaving in a similar manner, and are representative of the same load levels.The rods comprising the Main pin and jack screw spokes are again checked tomake sure that no members have gone into tension as the spring stiffnesseshave been modified. Table 2 is a comparison of the force reactions at theAftbody bottom clevis, for the global and detailed models.
Table 2. Comparison of Global Model and Detailed Model Lug Reactions
AftbodyGlobal Model
DetailedClevis Model
Percentage,Detailed/Global
Longitudinal Reaction(lbs)
-77,927 -76,697 98 %
Athwartship Reaction(lbs)
65,710 55,218 84 %
Vertical Reaction (lbs) -11,644 -7,187 62%
The good agreement between the global and detailed models in the majorcomponent reactions (longitudinal and athwartship directions) shows thedetailed model adequately represent the behavior of the global model.
As an additional check that the global and detailed models are behavingsimilarly, the laminate stresses in the skin for both models are compared.Again, confidence in the detailed model is gained by matching the globalmodel analysis results. Stress agreement was within 10% from the twoanalyses.
Once the linear static analysis has established that the detailed modelbehaves in a similar manner to the global model, then an elastic-plastic staticanalysis of the detailed model is performed to determine the plastic strains inthe clevis. Elastic-plastic material stress-strain curves are input for titaniumand MP35N, and an elastic-plastic static analysis is performed.
7] Clevis Results
The Aftbody top clevis model was shown in Figures 11 and 12. This modelwas constructed by Òcutting outÓ the portion of Fairing structure around the top
19
clevis in the global Aftbody symmetry model as previously described. Themodel was loaded by applying enforced displacements at the nodes along theÒcut edgesÓ of the laminate structure (skin and beams). The enforceddisplacements used in the detailed analysis were taken from the results of theworst case analysis performed on the global model. This is the load casewhich produced the maximum lug/clevis joint reaction (201,253 lbs).
A static linear analysis was first performed to identify and eliminate tensionrods in the pin and jack screw representations, and to ÒtuneÓ the springstiffnesses representing the support collar compliance. The force reactions atthe HY-80 steel lug were then compared to the reactions from the Aftbodyglobal analysis. Table 3 is a comparison of the force reactions at the Aftbodytop clevis under the worst case loading, for the global and detailed models.
Table 3. Comparison of Global Model and Detailed Model Lug Reactions
AftbodyGlobal Model
DetailedClevis Model
Percentage,Detailed/Global
Longitudinal Reaction(lbs)
196,697 186,800 94 %
Athwartship Reaction(lbs)
-13,847 -13,595 98 %
Vertical Reaction (lbs) 37,670 30,291 80 %
As an additional check that the global and detailed models were behavingsimilarly, the laminate stresses in the skin for both models were compared.Table 4 is a comparison of typical ply stresses in the skin around the Aftbodytop clevis (global model) and the detailed Aftbody top clevis model.
Table 4. Comparison of Global Model and Detailed Model Ply Stresses
AftbodyGlobal Model
DetailedClevis Model
Percentage,Detailed/Global
Ply 1 X-Normal Stress(psi)
9,737 9,304 96 %
Ply 1 Y-Normal Stress(psi)
-12,488 -13,210 106 %
Ply 1 XY Shear Stress(psi)
4,731 4,805 102 %
Ply 2 X-Normal Stress(psi)
-12,132 -10,937 90 %
Ply 2 Y-Normal Stress(psi)
11,581 11,446 99 %
Ply 2 XY Shear Stress(psi)
-3,834 -3,836 100 %
20
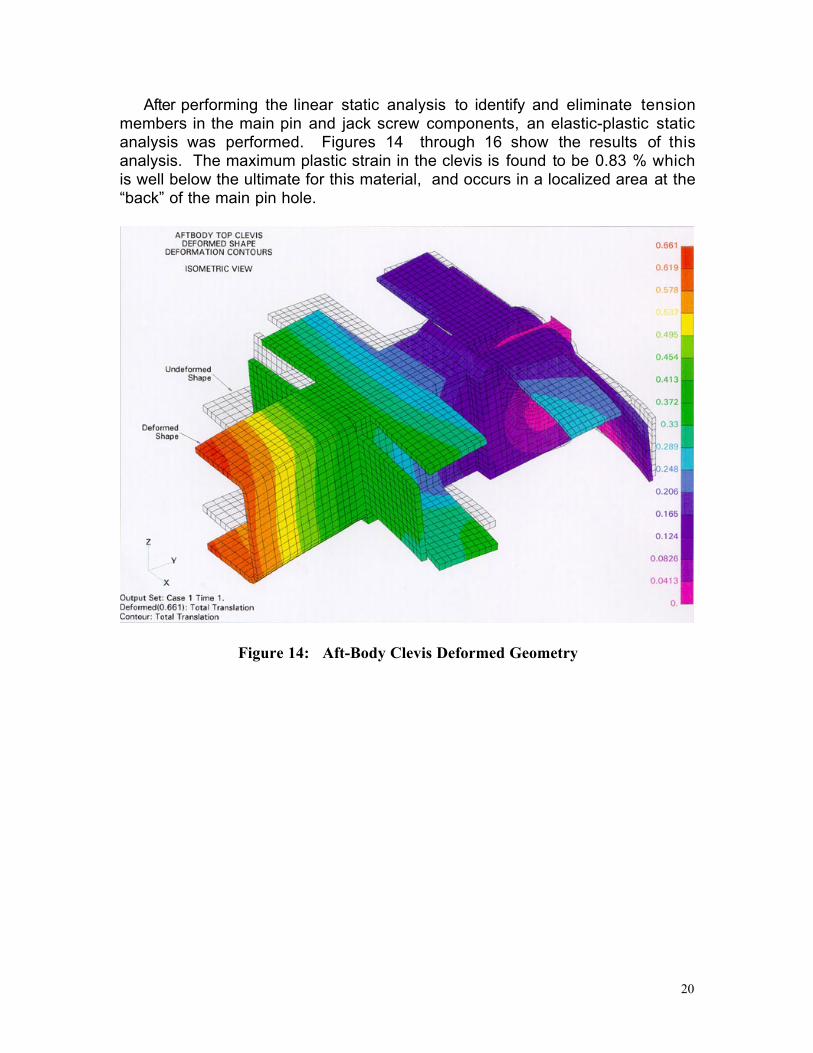
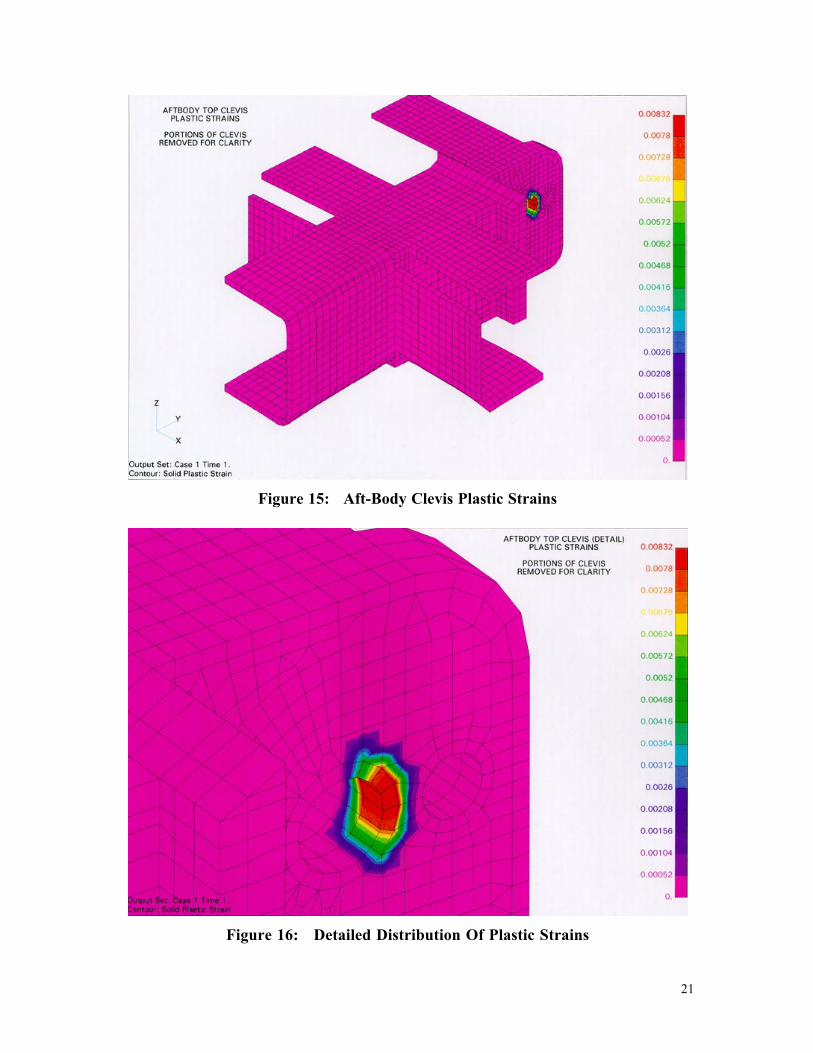
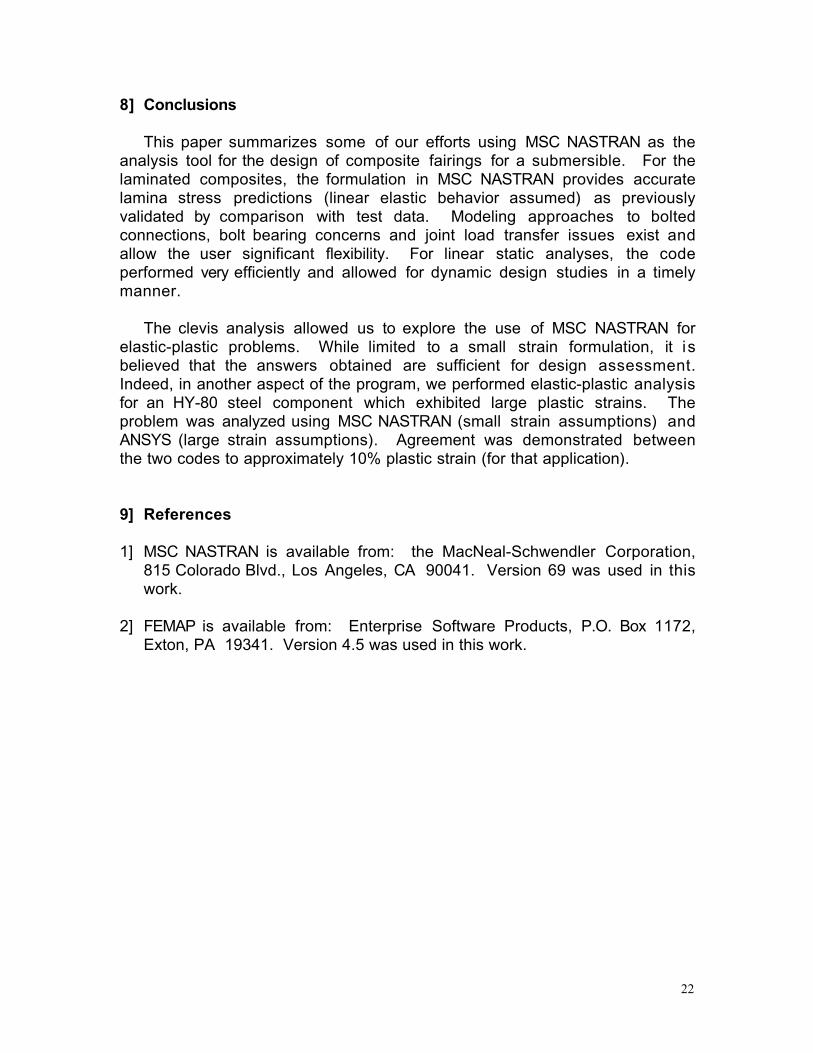
After performing the linear static analysis to identify and eliminate tensionmembers in the main pin and jack screw components, an elastic-plastic staticanalysis was performed. Figures 14 through 16 show the results of thisanalysis. The maximum plastic strain in the clevis is found to be 0.83 % whichis well below the ultimate for this material, and occurs in a localized area at theÒbackÓ of the main pin hole.
Figure 14: Aft-Body Clevis Deformed Geometry
21
Figure 15: Aft-Body Clevis Plastic Strains
Figure 16: Detailed Distribution Of Plastic Strains
22
8] Conclusions
This paper summarizes some of our efforts using MSC NASTRAN as theanalysis tool for the design of composite fairings for a submersible. For thelaminated composites, the formulation in MSC NASTRAN provides accuratelamina stress predictions (linear elastic behavior assumed) as previouslyvalidated by comparison with test data. Modeling approaches to boltedconnections, bolt bearing concerns and joint load transfer issues exist andallow the user significant flexibility. For linear static analyses, the codeperformed very efficiently and allowed for dynamic design studies in a timelymanner.
The clevis analysis allowed us to explore the use of MSC NASTRAN forelastic-plastic problems. While limited to a small strain formulation, it isbelieved that the answers obtained are sufficient for design assessment.Indeed, in another aspect of the program, we performed elastic-plastic analysisfor an HY-80 steel component which exhibited large plastic strains. Theproblem was analyzed using MSC NASTRAN (small strain assumptions) andANSYS (large strain assumptions). Agreement was demonstrated betweenthe two codes to approximately 10% plastic strain (for that application).
9] References
1] MSC NASTRAN is available from: the MacNeal-Schwendler Corporation,815 Colorado Blvd., Los Angeles, CA 90041. Version 69 was used in thiswork.
2] FEMAP is available from: Enterprise Software Products, P.O. Box 1172,Exton, PA 19341. Version 4.5 was used in this work.


![Unknown Author - Tutorials in Finite Element Analysis Using MSC-Patran-Nastran [Unknown]](https://img.pdfslide.us/doc/110x75/552d56a05503466f768b46db/unknown-author-tutorials-in-finite-element-analysis-using-msc-patran-nastran-unknown.jpg)