Embed Size (px)
Citation preview

Conclusions
Trends and relationships among a number of ions in the Sylvania brine indicate that relatively simple, widespread mechanisms such as evaporation and dolomitization are responsible for its near-constant character with regard to Ca, Mg, Na, Sr, C1, and Br. More complicated, local mechanisms are responsible for its variable character with regard to K, B, NH,, Li, Rb, and I.
I, and Li are so high as to suggest that they were not derived directly from sea water. NH, and I may be a result of bioconcentration and subsequent leaching of organic debris; and lithium may have come from the continent.
The mechanisms affecting the variable components are not well defined. As is often the case, the data perhaps raise more questions than they answer. As similar data from other basins become available-particularly those where relative concentrations of minor ions are greatly dif-
The relative amounts of
Components of Wood Pulp Bleach Effluents
J. W. Collins, A. A. Webb, H. P. Didwania, and B. F. Lueck
Pulp Manufacturers Research League, Inc., Appleton. Wis. 549 1 1
ferent-comparisons and contrasts among data sets should prove helpful in understanding the geochemistry of brines.
Literature Cited
Anderson, R. J., et al., Science 153 (3744), 1637-8 (1966). Braitsch, O., “Bromine and Rubidium as Indicators of En-
vironment during Sylvite and Carnallite Deposition of the Upper Rhine Valley Evaporites,” Second Symposium on Salt, pp. 297-300, Northern Ohio Geological Society, Cleveland, 1965.
Collins, A. G., Egleson, G. C., Science 156 (3777) , 935 (1967).
Ham, W. E., Mankin, C. J., Schleicher, J. A., “Borate Min- erals in Permian Gypsum of West-Central Oklahoma,” Oklahoma Geological Survey Bull. 92, 59 (1961).
Kinsman, D. J. J., “Gypsum and Anhydrite of Recent Age, Trucial Coast. Persian Gulf,” Second Symposium on Salt, p. 306, Northern Ohio Geological Society, Cleveland, 1965.
Received f o r review August 21, 1968. Accepted January 8 , 1969.
. Chlorination and alkaline extraction bleach effluents from a sulfite and a kraft wood pulp mill were concentrated by reverse osmosis and their dominating chemical proper- ties investigated. The solids were high in ash and the organic residues were highly colored. Biological oxygen demand was found to be due to relatively high molecular weight species as well as to low molecular species. The ultraviolet spectra and ionization difference spectra of the effluents and fractions obtained by gel chromatography on two Sephadex gels in series are presented. Some of the ionization difference spectra were lower in intensity than expected for alkaline extraction products of chlorinated lignin. Other spectra suggested that much of the color in a kraft chlorination effluent was of carbohydrate origin. Catechol groups were found to be stable end-products of a sulfite pulp chlorination.
the recent interest in improving the quality of the water in our rivers and recent development of
new and feasible techniques for concentrating dilute wastes, such as by reverse osmosis (Wiley, Ammerlaan, et al., 1967), more information regarding the composition of wood pulp mill bleaching wastes seems desirable. The methods for disposal or utilization of these concentrates will depend on the nature of the components. There have been few reported studies of wood pulp bleach liquor com- ponents. Only studies on sulfite pulp bleach liquor (Loris, 1965) and semichemical pulp bleach liquors (Bjorkqvist. Gustafsson, et a / . , 1953) begin to describe the organic components likely to be found in bleach mill effluents.
Two of the more undesirable properties of bleaching wastes have been their contributions to biochemical oxygen demand (B.O.D.) and color. This work describes the fractionation of B.O.D. and color contributing residues by gel chromatography. The colored residues are further characterized by ultraviolet spectral analysis and ionization difference spectra.
Four bleach effluents from two Wisconsin wood pulp mills are the subject of the study described here. The effluents were from chlorination and alkaline extraction stages of a sulfite and kraft pulp. Since chlorination of lignin is the principal reaction involved in generating the residues of these streams, the results of the ultraviolet analyses are discussed in terms of the current concepts of lignin chlorination. Two reviews on the subject summarize these concepts, Rydholm (1965) and Dence (1963) . The finding of large quantities of catechol groups in the chlori- nation effluent of sulfite pulp is also discussed.
Experimental
Production conditions and source pulps for the effluents are outlined in Table I. The lignin values reported were calculated using conversion factors for Roe and Kappa numbers obtained from Rydholm ( 1965). The methoxyl content was assumed to be 15% of the lignin. Other infor- mation in Table I was obtained from mill authorities.
Reverse osmosis (R.O.) of the more dilute bleach wastes was effected with equipment manufactured by Havens Industries. San Diego, Calif., and similar to that described by Wiley, Ammerlaan, et al. ( 1967). Essentially the proc- ess involves forcing the aqueous solvent, under high pres- sure, through cellulose acetate membranes backed by a porous Fiberglas structure. To protect the R.O. mem- branes from acid or alkaline hydrolysis, all effluents were
Volume 3, Number 4, April 1969 371

Cook
Table I. Bleach Effluents Source and Production Conditions
Wood
1st Stage Lbs. C1,/ ton pulp Final pH
Final p H 2nd Stage (NaOH)
Lignin content before bleaching Lignin content after 2nd stage Molar ratio of C1, to methoxyl Lbs. lignin lost/ ton Lbs. pulp lost/ton"
Sulfite Pulp Kraft Pulp Mitcherlich 22-28%
Spruce
75-80 2.2
7.8-8.0 5.9% 1.2% 0.9 94 90
sulfidity batch
75 % softwood
(mixed pine) 25 %
hardwood (dense)
95-105 2.2
10.5-1 1 .O 2.1% 0.6%
3.4 32
116
Includes fiber losses although the effluents as obtained from the mills contained little detectable fiber.
Table 11. Properties of Sulfite Pulp Bleach Effluents before and after Concentration - 1st Stage Effluent
obtained as
from Concen- mill trate "
Solids, g./L 1.18 84 5-Day B.O.D.,
mg./ g. solids 1 12 63 C.O.D., mg./g.
solids 625 796
2nd Stage Effluent
obtained as
from Concen- mill trate 0.60 95
104 36
515 5 60 41
% of solids - 5.7 - 7.8
Ash, % of solids - 34 - Organic chloride,
" Concentrated by reverse osmosis and vacuum evaporation.
Table 111. Properties of Kraft Pulp Bleach Effluents before and after Reverse Osmosis
1st Stage 2nd Stage Effluent Effluent
as as obtained obtained
from Concen- from Concen- mill trate". mill trate
Solids, g./ l . 1.65 119 1 .s2 108 5-Day B.O.D..
C.O.D., mg./g.
Ash, % of solids - 69 Organic chloride,
9.5
mg./g. solids 114 20 25 65
solids 143 190 530 643 48
4.6
-
- $4 of solids -
'I Obtained at different time from the same mill. Concentrated by reverse osmosis followed by vacuum evaporation Concentrated by reverse osmosis only.
adjusted to pH 3 to 7 with sulfuric acid or sodium hydrox- ide. All except the second stage kraft effluent were further concentrated from 3 to 5% solids to 8 to 12% solids by vacuum evaporation.
Analytical data for the concentrates are given in Tables I1 and 111. The solids there reported are so-called neu- tralized 24-hour solids (Salvesen and Hogan, 1948). Five-day biochemical oxygen demand values (B.O.D.,) , chemical oxygen demand (C.O.D.), and chlorides were determined by methods described in Standard Methods (American Public Health Association, 1965). Organic chloride was determined by the difference in chloride ion determinations before and after pyrolysis, using a pyrolysis procedure described in a Technical Bulletin (A. H. Thomas Co., 1961). Ash was determined by pyrolyzing samples at 550" C. for 24 hours. Both first stage bleach effluent sam- ples were neutralized with sodium hydroxide to pH 7.0 before pyrolysis with the appropriate corrections made in the results to account for the added sodium ion.
The concentrates were fractionated on two 2.5 X 100 cm. columns of Sephadex gels connected in series. One column contained Sephadex G-50 and the second a mixture of about 50% LH-20 and a laboratory methylated coarse grade of G-25. These gels fractionate compounds primarily by their molecular weight differences (Flodin. 1963). G-50 reportedly excludes dextrans of molecular weights equal to and above 10,000.
A column of Sephadex gel has an external volume of solvent. Ve, and an internal volume of solvent occupying spaces with restricted diffusion, Vi. The term "Kd value" is used to describe the portion of inner volume available for diffusion for a given sample. For a sample which elutes from a column at a volume, V s :
V s - Ve Kd=-
V i
If all the gel is readily penetrated by the sample. the Kd will be 1. No penetration of the gel would result in a sample elution volume equal to the external volume of the gel and a Kd value of 0.0.
Using the combination of LH-20 and G-50 gels provided a wide range of fractionation with extra capacity in the overlapping regions of 500 to 5000 where many of the materials of interest were thought to be distributed. LH-20, an alkylated form of G-25. was used since it gave better fractionation and resolution of the ultraviolet absorbing components than does G-25. The internal volume for these columns was assumed to be the volume of the last high solids peak (small molecular weight inorganics) which corresponded to 470 ml. for most runs. The external vol- ume was estimated to be 270 to 300 ml. since lignosulfonic acid preparations which are known to contain components greater than 10.000 in molecular weight consistently yielded a front running peak with this volume of eluate.
Ten-milliliter aliquots of the concentrates were used for the fractionations. The column eluates were monitored continuously with an LKB Uvicord I1 at 280 nm. using a 1-mm. quartz flow cell.
Ultraviolet spectra were determined on a Beckman DK-2A ratio recording spectrophotometer using 1 -cm. quartz cuvettes. Samples for ionization difference spectra were prepared by adding two drops of concentrated sodium hydroxide for the alkaline samples and two drops of con- centrated HCI for the acid samples in cuvettes containing
372 Environmental Science & Technology

approximately 3 ml. of sample. The spectra were recorded with the alkaline sample in the sample beam and the acid sample in the reference beam. The amounts of acid and base were sufficient to provide the difference spectra be- tween pH 2 and l l . Further addition of base or acid failed to increase the magnitude of difference. For difference spectra using intermediate pH values, the hydrogen ion concentration was monitored with a pH meter.
The adsorption spectra for the products of an alkaline degradation of glucose were prepared similarly. The alka- line degradation of glucose was carried out by heating a 2 % glucose solution in a sealed tube at 110" C. for 2 hours in 1N NaOH.
Catechol groups were determined by a method described by Falkehag, Marton, et al. (1966). The method involved measuring the intensity of color of a complex with ferrous and tartrate ions at the peak of absorption between 550 and 590 nm. All samples were measured against blanks con- taining sample and all reagents except iron.
Results
Reverse osmosis of the bleach effluents resulted in some losses, especially of small inorganics and B.O.D. contribut- ing components (especially low molecular weight volatile organics such as acetic and formic acids). Tables I1 and I11 summarize the results and compare the values for B.O.D., and C.O.D. before and after concentration. All but second stage kraft lost B.O.D.,. The loss of inorganics
is reflected by the increase in C.O.D. values. The B.O.D., increase noted for second stage kraft was relatively large and could have been due to the loss of an inhibitor during the reverse osmosis. The uniform increase noted for C.O.D. indicated that the lignin residues and other nonbiodegrad- able residues were largely rejected by the membranes used. Absolute measurements of yields after reverse osmosis were not made since the volumes of effluents were difficult to measure accurately due to the large quantities ( 5 0 to 200 gallons) involved and to the formation of precipitates dur- ing the concentrating processes. Calcium sulfate dihydrate precipitated from the sulfite bleach concentrates and cal- cium carbonate from the second stage kraft effluent.
Despite disproportionate losses of low molecular weight inorganics. the ash values in Table I1 indicated solids in the concentrates to be from one-third to almost teo-thirds inorganic. Since the bulk of the solids were inorganic, the solids peaks in the fractions obtained by gel chroniatogra- phy (Figures 1 and 2) were interpreted as being primarily inorganic salts.
The B.O.D. of fractions obtained by gel chromatography of the different effluents are recorded in Figures 1 and 2 . The peaks in the large molecular weight ranges suggested that there were some polysaccharides with molecular weights between 2000 and 10,000. The peak of B.O.D. for second stage sulfite and first and second stage kraft effluents ran behind the front running ultraviolet absorbing peaks which suggest that the predominate molecular weight
r n .t - 0.4 - 200
P 0.3 - l5OC
e
0.2 100 c
Be . ! \ '.,. \ ',.. . . . . - 50 l '8, - 0.1 ............... ........ .....
r -.--. -.--.-- q--' I I \ e - - - & 0
\ '.. I .......... ... 1 .s . \ ., \ *.:
- .....-. 80
1. . .....I
I '\ :.- ............ 435 580 725 8 70 1,015
Eluate Volume - mls
Eluate Volume - mlr
Figure 1. Gel chromatography of sulfite bleach effluent concentrate
'3% Transmittance at 280 nm.: , - - - . % solids; . - - - - . B.O.D., mg./l. Top, first stage: Bottom, second stage
Volume 3, Number 4, April 1969 373

Elude Volume - mi5
Figure 2. Gel chromatography of kraft bleach effluent concentrate
9% Transmittance at 280 nm.; .- - - . 92 solids; . - - - - , B.0.D.- mg./l. Top, first stage; Bottom, second stage
species was between 3000 and 7000. Such molecular weights are difficult to account for since the polysaccharides of wood are much higher in molecular weight, and when they are degraded they are generally thought to yield monosaccharides.
The small molecular weight B.O.D., peak in Figure 2 (top) was not as symmetrical as the others, suggesting that some of the overlapping components may have inhibited the bacterial growth. Since the various dilutions used for the B.O.D. assays gave proportional oxygen depressions, the presence of an inhibitor was not further confirmed.
The lack of correlation of the B.O.D., curves with any of the ultraviolet elution curves indicated that the lignin residues were not degraded and that the degradable residues were not involved in lignin carbohydrate bonds.
The high molecular weight solids peak in second stage kraft was not characterized although It appeared to elute simultaneously with the B.O.D., contributing residues.
Ultraviolet Characterization
The ultraviolet absorption spectrum for the first stage sulfite bleach effluent was characteristic of lignosulfonic acids and chlorinated lignosulfonic acids as reported by Ivancic and Rydholm (1959) and by Dence and Sarkanen ( 1960). The ultraviolet absorption spectra fractions pro- duced on columns similar to those used to produce the data shown in Figure 1 varied only in the degree of reso- lution of the 280-nm. peak and the intensity of the ioniza- tion difference peaks. The ultraviolet spectrum for the
fraction with a Kd value of 0.0 is recorded in Figure 3 along with spectra for the concentrate. The concentrate gave a much less intense ionization difference curve relative to the 280-nm. absorption which suggested that the high molecular weight fractions had proportionately more free phenolic groups (Goldschmid, 1954).
The first stage sulfite bleach effluent was the only one to give a positive test for catechol groups. Effluent taken directly from the bleach tower ahead of the washer gave 78 absorbance units per cm. at 560 nm. as the iron-tartrate complex and the same amount of uncomplexed bleach effluent gave 1180 units per cm. at 280 nm. The ratio of absorbance at 560 nm. as a complex, to absorbance at 280 nm. with no reagents. was 0.066. Similar calculations for pyrocatechol gave a ratio of 0.21 and for kraft lignin 0.016 (Falkehag, Marton, et al., 1966). Apparently the first stage sulfite has about four times the number of cate- chol groups found in kraft lignin. Kraft lignin was esti- mated by Falkehag, Marton. et al. (1966) to contain about 6% of its aromatic rings as catechol structures. By analogy the bleached lignin here would have about 25% of its aro- matic rings as catechol structures. The distribution of these groups in the various molecular weight fractions is presented in Figure 4. The lower the molecular weight the greater the ratio of 560 nm. to 280 nm., which sug- gested that the number of catechol groups per phenyl- propane groups was larger in the smaller molecular weight fractions,
Second stage sulfite ultraviolet absorption characteristics were less indicative of aromatic structures and had less intense ionization difference spectra. Figures 5 and 6 record the spectra for characteristic fractions. Although the high molecular weight residues Kd 0.0 were typical of the usual lignin spectra, some of the low molecular weight residues. especially those with a Kd value of 0.7, were
O 1 1 W.".leSPh - "m310 340
Figure 3. Ultraviolet spectra of first stage bleach effluent a. Diluted concentrate x. Ionization difference spectrum for diluted con-
centrate at twice the concentration for curve a b. Gel chromatography fraction from columns of
G-50 and LH-20, Kd = 0.0 y. Ionization difference spectrum for b
374 Environmental Science & Technology

atypical. The ionization difference spectrum for this frac- tion was especially interesting in that it had only one peak at 285 nm. The residues with Kd values greater than 0.7 and less than 0.5 were similar to those with the high K d values. Differences of 10 nm. for the wavelength of the maximum of the ionization difference spectra were noted but not given any significance at this time. The samples described in Figure 6, Kd 0.7 and 1.3, had peaks at 238 nm. which were not symmetrical. This suggests some sort of
Eluole V o l u m - mls
Figure 4. Gel chromatography of first stage sulfite bleach efflu- ent concentrate
% Transmittance at 280 nm.; , - - - - . arbitrary absorbance units at 560 nm. as iron-tartrate complex
140 160 180 300 310 340 Wavelength - nrn
Figure 5. Ultraviolet absorption spectra for second stage sulfite bleach effluent a. Diluted concentrate b. Ionization difference spectrum for a b. Gel chromatography fraction from column of G-50 and LH-20,
y. Ionization difference spectrum for b K d = 0.0
mechanical or chemical interference during the measure- ments despite apparently satisfactory operation.
The first stage kraft effluent had considerable color and ultraviolet absorption. The curve for the concentrate pre- sented in Figure 7 was not comparable to any curve pub- lished for lignin degradation products. For instance there are no similarities in the ultraviolet absorption curves to the chlorination degradation products of lignosulfonic acid preparations studied by Ivancic and Rydholm ( 1959). Their work included curves for degradation products using various ratios of chlorine to methoxyl up to 15. Most of the ultraviolet absorbing residues eluted in the lower molecular weight range, Kd 0.5 and above (Figure 2A) . Fractions with Kd values of 0.6 and 0.8 were charac- teristic of the two types of ionization difference spectra found (Figure 7 ) . No inflections at 280 nm. were found and the difference spectra had only one peak in this range, fraction with Kd 0.6, 300 nm. and Kd 0.8, 268 nm. The ionization difference spectrum underwent a large portion of its change between pH 6 and 2 and was accompanied by a deep color change around pH 4.0. These fractions apparently contained the predominating ultraviolet absorb- ing material since the curves for the diluted concentrate reflect both components. The fractions with Kd values 0.0 to 0.4, present in small quantities, had typical lignin spectra.
The lack of resemblance of these ultraviolet spectra to lignin degradation products prompted an investigation of the alkaline degradation products of sugars. Ultraviolet curves for dextrose treated to an alkaline cook are pre- sented in Figure 8. The ionization difference curve re- sembled that for the fraction with Kd value of 0.8 of the first stage kraft. The broad peak with a 300 nm. maximum and the need to adjust the pH range from 2 to 11 to obtain the maximum ionization difference spectra were the most evident similarities.
Figure 6. Ultraviolet absorption spectra of gel chromatography fractions from columns of G-50 and LH-20 of second stage sulfite bleach effluent a. Fraction K d 0.7 1. Ionization difference spectra for a b. Fraction with K d = 1.3 y. Ionization difference spectrum for b
Volume 3, Number 4, April 1969 375
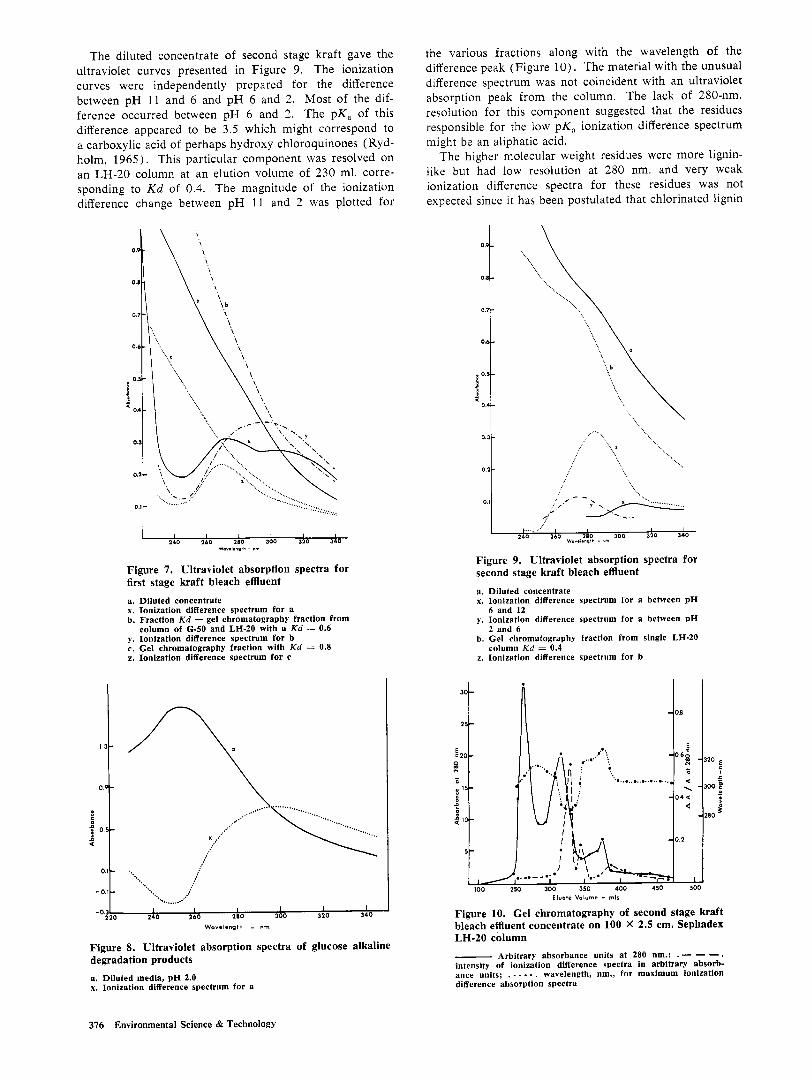
The diluted concentrate of second stage kraft gave the ultraviolet curves presented in Figure 9. The ionization curves were independently prepared for the difference between pH 11 and 6 and p H 6 and 2. Most of the dif- ference occurred between p H 6 and 2 . The pK, of this difference appeared to be 3.5 which might correspond to a carboxylic acid of perhaps hydroxy chloroquinones (Ryd- holm, 1965). This particular component was resolved on an LH-20 column at an elution volume of 230 ml. corre- sponding to K d of 0.4. The magnitude of the ionization difference change between p H 11 and 2 was plotted for
~ 240 160 W w h n s l h 210 - nm 300 320
Figure 7. Ultraviolet absorption spectra for first stage kraft bleach effluent a. Diluted concentrate x. Ionization difference spectrum for a b. Fraction Kd = gel chromatography fraction from
column of 6 - 5 0 and LH-20 with a Kd = 0.6 y. Ionization difference spectrum for b C. Gel chromatography fraction with Kd = 0.8 z. Ionization difference spectrum for c
Wavelength - nm
Figure 8. Ultraviolet absorption spectra of glucose alkaline degradation products a. Diluted media, p H 2.0 x. Ionization difference spectrum for a
the various fractions along with the wavelength of the difference peak (Figure 10) . The material with the unusual difference spectrum was not coincident with an ultraviolet absorption peak from the column. The lack of 280-nm. resolution for this component suggested that the residues responsible for the low pK, ionization difference spectrum might be an aliphatic acid.
The higher molecular weight residues were more lignin- like but had low resolution at 280 nm. and very weak ionization difference spectra for these residues was not expected since it has been postulated that chlorinated lignin
............... i\\ ..... '; b
...... . . . . . . . . ... ...
Figure 9. Ultraviolet absorption spectra for second stage kraft bleach effluent a. Diluted concentrate x. Ionization difference spectrum for a between p H
5 . Ionization difference spectrum for a between p H
b. Gel chromatography fraction from single LH-20
z. Ionization difference spectrum for b
6 and 12
2 and 6
column Kd = 0.4
Eluate Volume - mlr
Figure 10. Gel chromatography of second stage kraft bleach effluent concentrate on 100 X 2.5 cm. Sephadex LH-20 column - Arbitrary absorbance units a t 280 nm.; .- - -. intensity of ionization difference spectra in arbitrary absorb- ance units; . . - - - . wavelength, nm., for maximum ionization difference absorption spectra
376 Environmental Science & Technology

residues when subjected to alkali would lose the ring sub- stituted chlorine to form phenolic hydroxyls (Newcombe and Marshall, 1955; White, Swartz. et al., 1940).
Discussion
The low proportion of organic compounds in the bleach effluents studied will be a major consideration in searching for effective disposal methods or possible utilization in a salable product. The organic portion, although not com- pletely accounted for in the concentrates, revealed several interesting chemical properties not entirely anticipated.
At this time it is not possible to account for the presence of biodegradable substances with molecular weight distri- butions between 2000 and 10,000. These substances prob- ably represented an unusual degradation product of some polysaccharide or a low molecular weight natural poly- saccharide. So far as it is known such substances have not been recognized previously.
The finding of catechol structures indicated that lignin chlorination can be terminated between demethylation and quinone formation. Quinones are no doubt produced by the chlorination since the pulp from which this effluent was taken was a bright orange. The insolubility of quinones would limit their extractability in the wash, thus favoring the catechol residues as the only detectable cyclic de- methylation products. The low chlorine to methoxyl ratio may also have favored the accumulation of these catechol structures. The elemental chlorine which catalyzes the demethoxylation reaction (Sarkanen and Dence, 1960) would have been used up primarily by the substitution reactions which have been described as the initial and fast- est reactions. Since only 0.9 chlorine molecule was present per methoxyl, ring substitution would have depleted the chlorine, leaving little left for oxidation reactions required to convert the catechol groups to quinones. The reaction sequence is outlined below describing those features of chlorination discussed here:
R’ R’ n’
R = phenylpropane unit or H
R’ = HzC-OR. where R? = phenylpropane unit, SO., or H I
H-C-OR? I
H-C-OR2
Comparison of ultraviolet spectra for the effluent com- ponents and fractions obtained by gel chromatography with curves for laboratory chlorinations of lignosulfonic acids indicated that the original residues solubilized during first and second stage sulfite bleaching were lightly chlorinated lignin products with only one exception found in the second stage low molecular weight fractions. This low molecular weight component lacked aromatic character and gave a single peaked ionization difference curve. Other residues with unique ionization difference spectra domi- nated the first stage kraft fractions, one of which was directly comparable to alkaline degradation products of dextrose. The lack of residues with ultraviolet spectra char- acteristic of lignin or intermediate lignin chlorination prod- ucts suggested that the ultraviolet-absorbing constituents
and therefore probably the chromophores in the first stage kraft were mostly derived from carbohydrates. Further studies by Webb (1969) show that the compounds from the alkaline degradation of glucose which give rise to these characteristic ionization difference spectra are not sepa- rated from the chromophores by Sephadex chromatography. Residues with ionization difference spectra more like alka- line degradation products of sugars than lignin also ap- peared in the second stage kraft effluent; however, such residues were not a major constituent of that effluent.
The strong color produced during the alkaline degrada- tion of dextrose and other sugars suggests that during the “peeling reaction” of polysaccharides and cellulose many of the degradation products might give rise to color and yet not have been completely solubilized. Solubilization of such residues may be part of the reason why the greater ratios of chlorine to methoxyl are required in the kraft chlorination compared to the sulfite pulp Chlorination.
The relatively low lignin content and larger losses of nonlignin pulp components during the kraft bleaching sup- ports the conclusion that considerable carbohydrate degra- dation products require removal to obtain optimum pulp brightness.
Acknowledgment
The authors thank Ann Addie and Gerald Hovind for their technical assistance.
Literature Cited
A. H. Thomas Co., Technical Bulletin, Philadelphia, Pa., 1961.
American Public Health Association, Inc., New York, “Standard Methods for the Examination of Water and Waste Water,” 12th ed., p. 415, 510, 372, 1965.
Bjorkqvist, K. J., Gustafsson, S., Jorgensen, I., Svensk Pap- perstid. 56, 734 (1953).
Dence, C. W., in “The Bleaching of Pulp,” H. P. Rapson, Ed., p. 40, Tappi Monograph Series No. 27, New York, 1963.
Dence, C. W., Sarkanen, K. V., Tappi 43, 87 (1960). Falkehag, S. I., Marton, J., Adler, E., Advan. Chem. 59,
86 (1966). Flodin, P., “Dextran Gels and Their Applications in Gel
Filtration,” 3rd ed., Pharmacia, Uppsala, Sweden, 1963. Goldschmid, 0.. Anal. Chem. 26, 1421 (1954) . Ivancic, A,, Rydholm, S. A., Svensk Papperstidn. 62, 554
Lor& V., Tappi 48, 125 (1965) . Newcombe, A. G., Marshall, H. B., Can. J . Technol. 33,
Rydholm, S . A, , “Pulping Processes,” p. 929, 1110, 938,
Salvesen, J. R., Hogan, D., Anal. Chem. 20, 910 (1948). Sarkanen, K. V., Dence, C. W., J . Org. Chem. 25, 715
(1960) . Webb, A. A., Tappi, 54th Meeting, New York City, Feb-
ruary, 1969. White, E. V., Swartz, J . N., Penniston, Q. P.. Schwartz, H.,
McCarthy, J. L., Hibbert, H., Tech. Assoc. Papers 24, 179 (1941) .
Wiley. A. J., Ammerlaan, A. C. F., Dubey, G. A., Tappi 50, 455 (1967) .
(1959) .
152 (1955) .
Interscience, New York, 1965.
Received for review April 12, 1968. Accepted January 21 , 1969. Paper presented before the Division of Water, Air, & Waste Chemistry, 155th Meeting, A C S , Sun Francisco, Calif., March 31-April 5 , 1968. This project has been au- thorized, supported, and financed, in part, by the Depart- ment o f the Interior pursuant to the Federal Water Pollu- tion Control Ac t .
Volume 3, Number 4, April 1969 377