Embed Size (px)
Citation preview
CDM-SSC-CPA-DD-FORM
Version 03.0 Page 1 of 59
Component project activity design document form for small-scale CDM component project activities
(Version 03.0)
Complete this form in accordance with the Attachment “Instructions for filling out the component project activity design document form for CDM small-scale component project activities” at the end of this form.
COMPONENT PROJECT DESIGN DOCUMENT (CPA-DD)
Title of the CPA Fuel Efficient Stoves for Ethiopia Programme of Activity CPA 001
Version number of the CPA-DD 2.2
Completion date of the CPA-DD 07/08/2014
Title of the PoA to which the CPA is included Fuel Efficient Stoves for Ethiopia Programme of Activity
Host Party(ies) Ethiopia
Estimated amount of annual average GHG emission reductions
43,097 t CO2e
CDM-SSC-CPA-DD-FORM
Version 03.0 Page 2 of 59
SECTION A. General description of CPA
A.1. Title of the proposed or registered PoA
Fuel Efficient Stoves for Ethiopia Programme of Activity
A.2. Title of the CPA
Fuel Efficient Stoves for Ethiopia Programme of Activity CPA 001
A.3. Description of the CPA
The CPA entitled “Fuel Efficient Stoves for Ethiopia Programme of Activity CPA 001” consists in the distribution of a combination of two different type of improved cookstoves (ICS) to particulatly rural households, namely: Slim type of Mirt stoves for injera baking (further only referred to as “Mirt stove“) and Tikikil rocket stoves for other cooking tasks. Both ICS types have efficiency improvements in thermal applications of non-renewable biomass as compared to the baseline technology, as per AMS-II.G, ver. 5. Generally, participating households will receive a pair of ICS, consisting in a Mirt stove and a Tikikil stove. However, the distribution of a single ICS to a household is also possible under this CPA 1. The purpose of the CPA 1 is to reduce GHG emissions and indoor air pollution by the dissemination of efficient cookstoves in households in Ethiopia. The boundary of the CPA 1 will correspond to the national borders of Ethiopia. In this CPA-DD, the subscript ICS is used frequently. It always refers to both Mirt and Tikikil stoves. For example, NICS, the number of ICS distributed, refers to the sum of NMirt, the numbers of Mirt stoves distributed, and NTikikil, the number of Tikikil stoves distributed.
A.4. Entity/individual responsible for the operation of CPA
The CME and implementer of the CPA is the World Food Programme Ethiopia.
World Food Programme Office of Ethiopia, P.O. Box 25584 Code 1000 Tel. No. 00251 11 551 5188, Fax No. 00251 11 551 4433
The World Food Programme (WFP) is the world's largest humanitarian agency fighting hunger worldwide.
The CPA will be implemented under the institutional setting described in section C of the PoA-DD. The dissemination of ICSs to households will be achieved in cooperation with the Ministry of Agriculture and its offices at the Woreda level. The dissemination of IRSs to schools will be organized by WFP directly, in cooperation with the Ministry of Education.
A.5. Technical description of the CPA
A.5.a) Main technologies, systems and equipment involved
The CPA consists consists in the distribution of a combination of two improved cookstoves (ICS) to households that are designed particularly for Ethiopian cooking habits. The stove types to be disseminated are:
CDM-SSC-CPA-DD-FORM
Version 03.0 Page 3 of 59
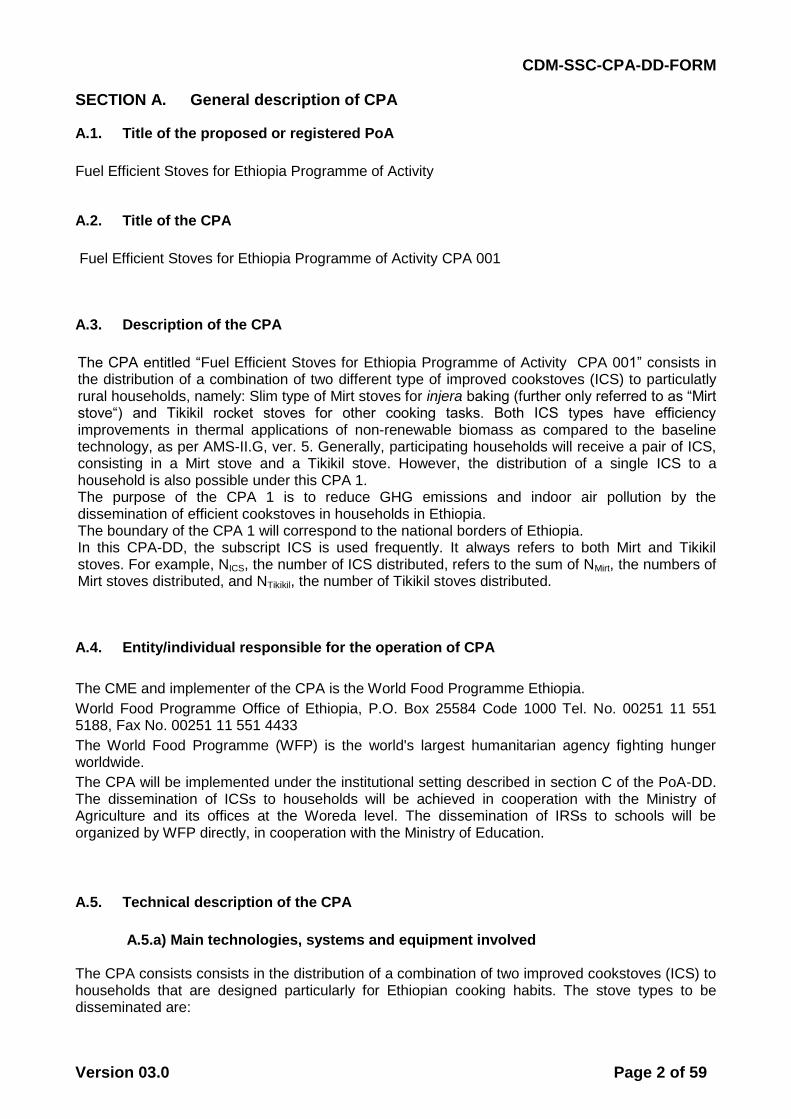
1) fixed Mirt stoves (slim type, further only referred to as “Mirt stove“) designed for injera baking (Figure 1a),
2) Tikikil portable household cookstove for household cooking other than injera baking (Figure 1b)
It is planned to distribute 18,000 Mirt stoves, 18,000 Tikikil stoves under this CPA. The two stove types are distributed to households in pairs (one Mirt and one Tikikil stove).
Figure 1: a), b): Stove types disseminated within this CPA1
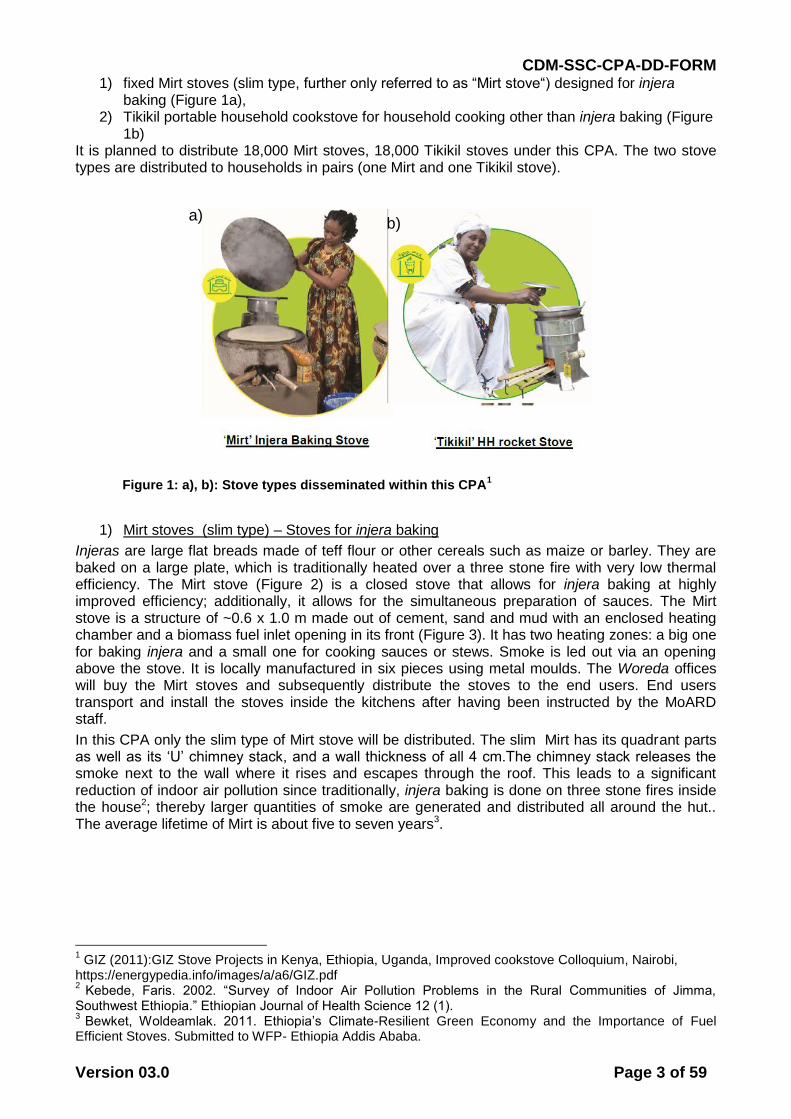
1) Mirt stoves (slim type) – Stoves for injera baking
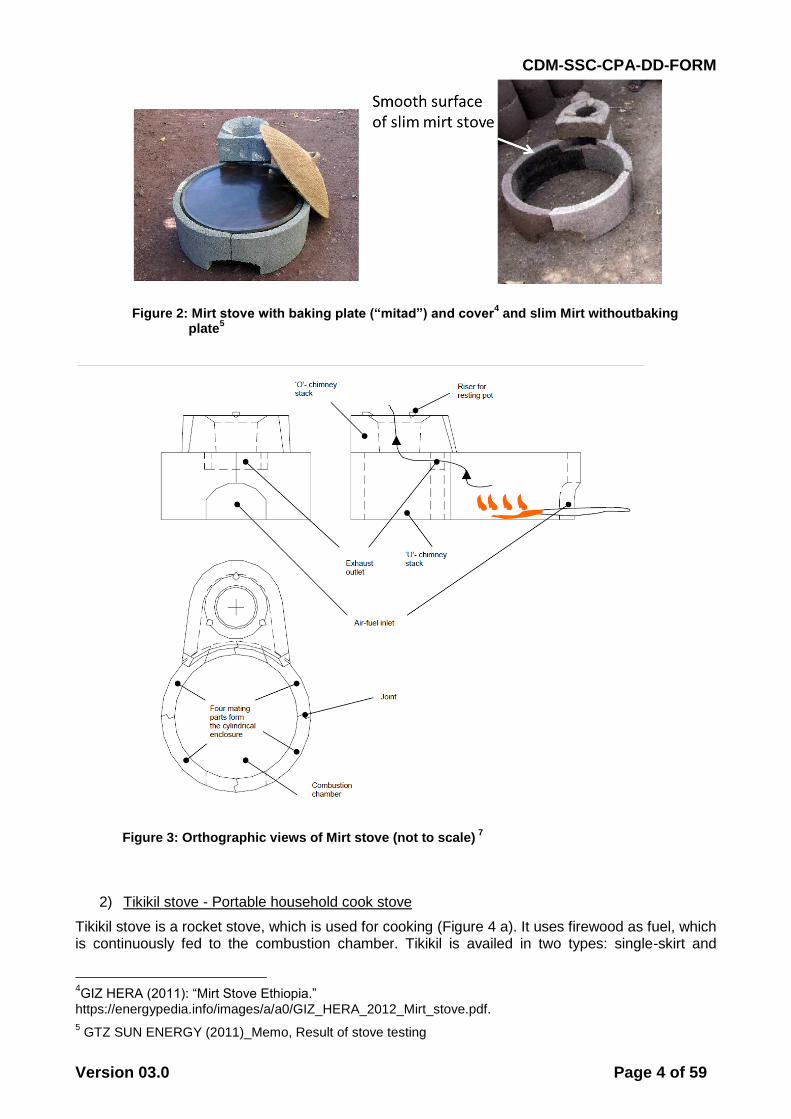
Injeras are large flat breads made of teff flour or other cereals such as maize or barley. They are baked on a large plate, which is traditionally heated over a three stone fire with very low thermal efficiency. The Mirt stove (Figure 2) is a closed stove that allows for injera baking at highly improved efficiency; additionally, it allows for the simultaneous preparation of sauces. The Mirt stove is a structure of ~0.6 x 1.0 m made out of cement, sand and mud with an enclosed heating chamber and a biomass fuel inlet opening in its front (Figure 3). It has two heating zones: a big one for baking injera and a small one for cooking sauces or stews. Smoke is led out via an opening above the stove. It is locally manufactured in six pieces using metal moulds. The Woreda offices will buy the Mirt stoves and subsequently distribute the stoves to the end users. End users transport and install the stoves inside the kitchens after having been instructed by the MoARD staff.
In this CPA only the slim type of Mirt stove will be distributed. The slim Mirt has its quadrant parts as well as its ‘U’ chimney stack, and a wall thickness of all 4 cm.The chimney stack releases the smoke next to the wall where it rises and escapes through the roof. This leads to a significant reduction of indoor air pollution since traditionally, injera baking is done on three stone fires inside the house2; thereby larger quantities of smoke are generated and distributed all around the hut.. The average lifetime of Mirt is about five to seven years3.
1 GIZ (2011):GIZ Stove Projects in Kenya, Ethiopia, Uganda, Improved cookstove Colloquium, Nairobi,
https://energypedia.info/images/a/a6/GIZ.pdf 2 Kebede, Faris. 2002. “Survey of Indoor Air Pollution Problems in the Rural Communities of Jimma,
Southwest Ethiopia.” Ethiopian Journal of Health Science 12 (1). 3 Bewket, Woldeamlak. 2011. Ethiopia’s Climate-Resilient Green Economy and the Importance of Fuel
Efficient Stoves. Submitted to WFP- Ethiopia Addis Ababa.
a) b)
CDM-SSC-CPA-DD-FORM
Version 03.0 Page 4 of 59
Figure 2: Mirt stove with baking plate (“mitad”) and cover4 and slim Mirt withoutbaking
plate5
Figure 3: Orthographic views of Mirt stove (not to scale) 7
2) Tikikil stove - Portable household cook stove
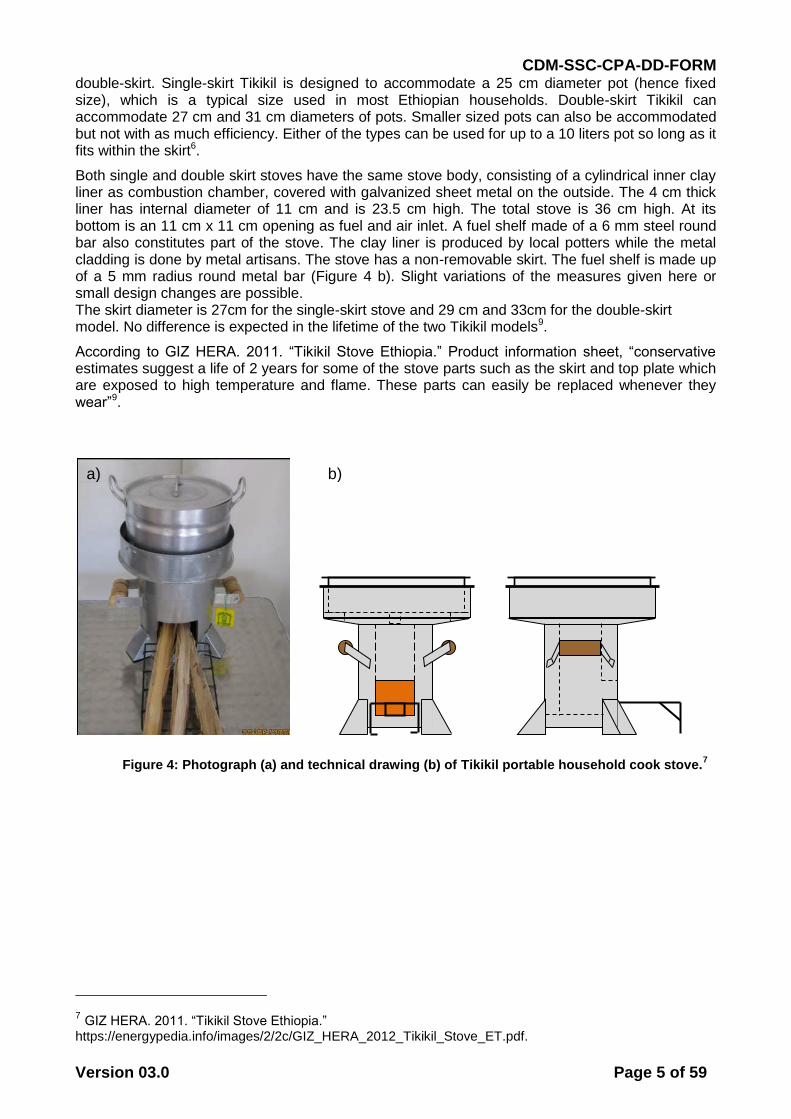
Tikikil stove is a rocket stove, which is used for cooking (Figure 4 a). It uses firewood as fuel, which is continuously fed to the combustion chamber. Tikikil is availed in two types: single-skirt and
4GIZ HERA (2011): “Mirt Stove Ethiopia.”
https://energypedia.info/images/a/a0/GIZ_HERA_2012_Mirt_stove.pdf. 5 GTZ SUN ENERGY (2011)_Memo, Result of stove testing
CDM-SSC-CPA-DD-FORM
Version 03.0 Page 5 of 59
double-skirt. Single-skirt Tikikil is designed to accommodate a 25 cm diameter pot (hence fixed size), which is a typical size used in most Ethiopian households. Double-skirt Tikikil can accommodate 27 cm and 31 cm diameters of pots. Smaller sized pots can also be accommodated but not with as much efficiency. Either of the types can be used for up to a 10 liters pot so long as it fits within the skirt6.
Both single and double skirt stoves have the same stove body, consisting of a cylindrical inner clay liner as combustion chamber, covered with galvanized sheet metal on the outside. The 4 cm thick liner has internal diameter of 11 cm and is 23.5 cm high. The total stove is 36 cm high. At its bottom is an 11 cm x 11 cm opening as fuel and air inlet. A fuel shelf made of a 6 mm steel round bar also constitutes part of the stove. The clay liner is produced by local potters while the metal cladding is done by metal artisans. The stove has a non-removable skirt. The fuel shelf is made up of a 5 mm radius round metal bar (Figure 4 b). Slight variations of the measures given here or small design changes are possible. The skirt diameter is 27cm for the single-skirt stove and 29 cm and 33cm for the double-skirt model. No difference is expected in the lifetime of the two Tikikil models9.
According to GIZ HERA. 2011. “Tikikil Stove Ethiopia.” Product information sheet, “conservative estimates suggest a life of 2 years for some of the stove parts such as the skirt and top plate which are exposed to high temperature and flame. These parts can easily be replaced whenever they wear”9.
Figure 4: Photograph (a) and technical drawing (b) of Tikikil portable household cook stove.7
7 GIZ HERA. 2011. “Tikikil Stove Ethiopia.” https://energypedia.info/images/2/2c/GIZ_HERA_2012_Tikikil_Stove_ET.pdf.
a) b)
CDM-SSC-CPA-DD-FORM
Version 03.0 Page 6 of 59
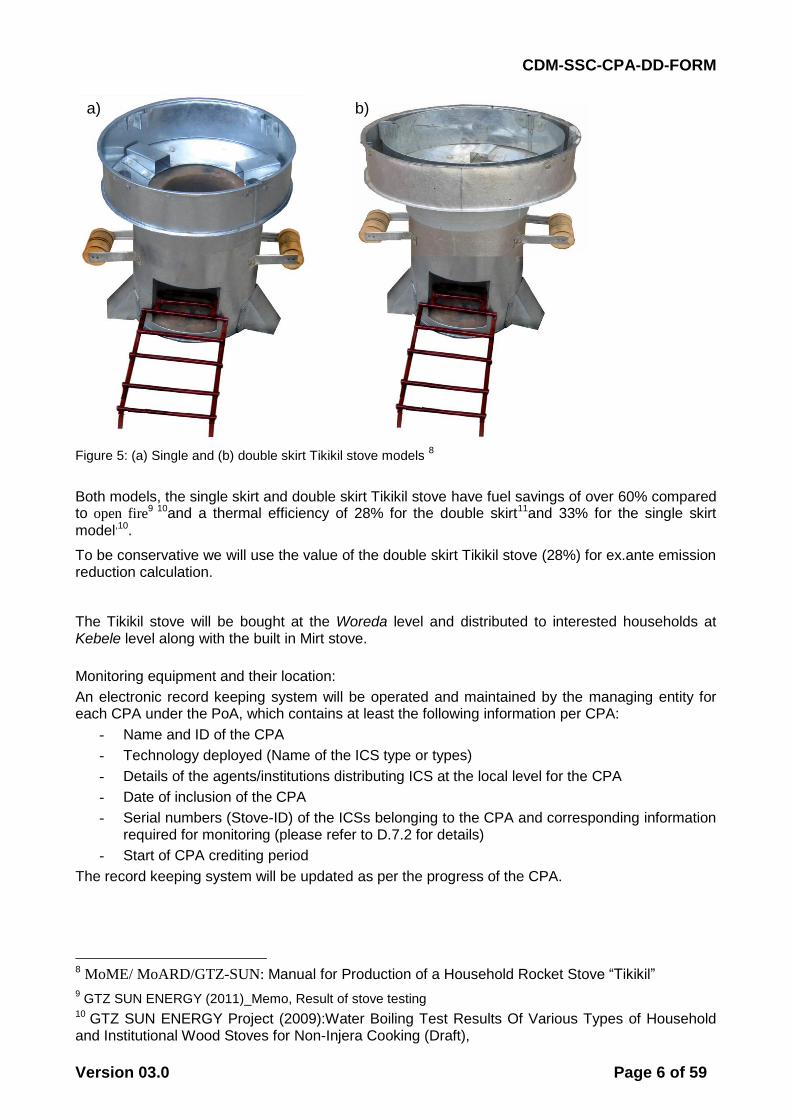
Figure 5: (a) Single and (b) double skirt Tikikil stove models 8
Both models, the single skirt and double skirt Tikikil stove have fuel savings of over 60% compared to open fire
9 10and a thermal efficiency of 28% for the double skirt11and 33% for the single skirt
model,10.
To be conservative we will use the value of the double skirt Tikikil stove (28%) for ex.ante emission reduction calculation.
The Tikikil stove will be bought at the Woreda level and distributed to interested households at Kebele level along with the built in Mirt stove.
Monitoring equipment and their location:
An electronic record keeping system will be operated and maintained by the managing entity for each CPA under the PoA, which contains at least the following information per CPA:
- Name and ID of the CPA
- Technology deployed (Name of the ICS type or types)
- Details of the agents/institutions distributing ICS at the local level for the CPA
- Date of inclusion of the CPA
- Serial numbers (Stove-ID) of the ICSs belonging to the CPA and corresponding information required for monitoring (please refer to D.7.2 for details)
- Start of CPA crediting period
The record keeping system will be updated as per the progress of the CPA.
8 MoME/ MoARD/GTZ-SUN: Manual for Production of a Household Rocket Stove “Tikikil”
9 GTZ SUN ENERGY (2011)_Memo, Result of stove testing
10 GTZ SUN ENERGY Project (2009):Water Boiling Test Results Of Various Types of Household and Institutional Wood Stoves for Non-Injera Cooking (Draft),
a) b)
CDM-SSC-CPA-DD-FORM
Version 03.0 Page 7 of 59
A.5.b) Energy and mass flows and balances of the systems and equipment
Energy and mass flows will be of the same form in the CPA and in the baseline scenario, with the difference that the increased efficiency of the technologies distributed under the CPA will lead to huge savings of CO2 emissions stemming from burning larger quantities of firewood in the baseline case. In both cases, firewood is collected and combusted in cooking appliances where it is converted to thermal energy which is used for preparing food.
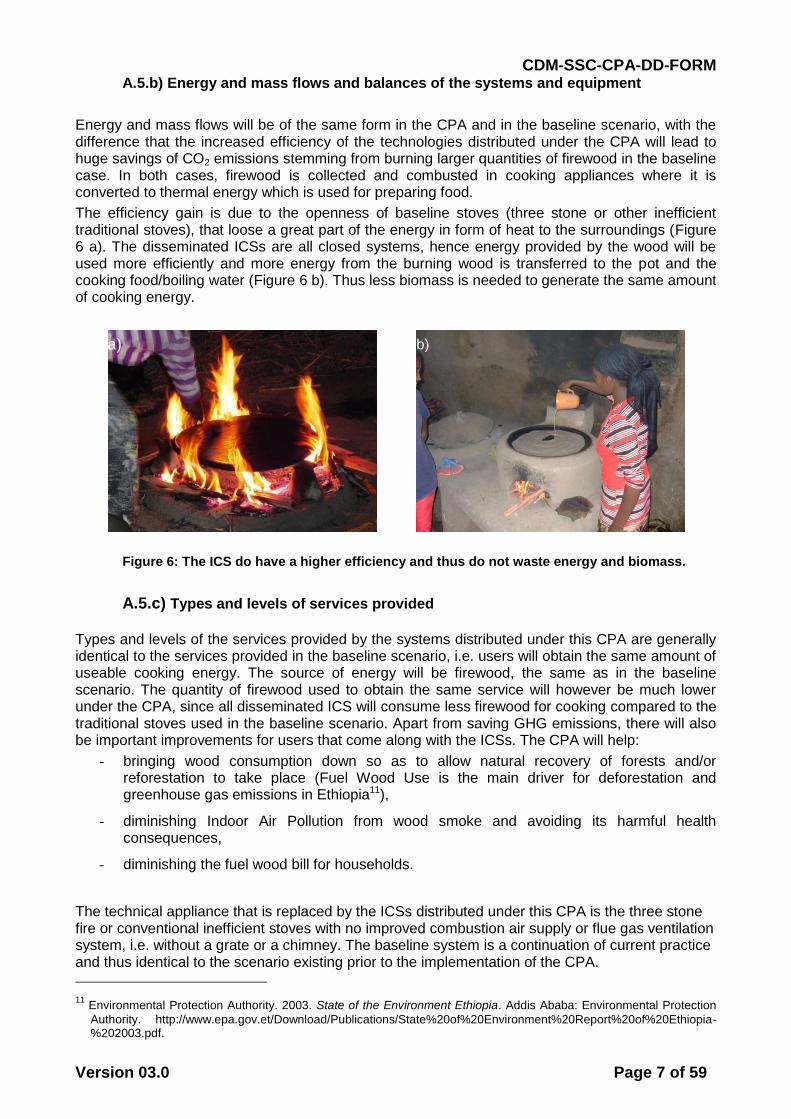
The efficiency gain is due to the openness of baseline stoves (three stone or other inefficient traditional stoves), that loose a great part of the energy in form of heat to the surroundings (Figure 6 a). The disseminated ICSs are all closed systems, hence energy provided by the wood will be used more efficiently and more energy from the burning wood is transferred to the pot and the cooking food/boiling water (Figure 6 b). Thus less biomass is needed to generate the same amount of cooking energy.
Figure 6: The ICS do have a higher efficiency and thus do not waste energy and biomass.
A.5.c) Types and levels of services provided
Types and levels of the services provided by the systems distributed under this CPA are generally identical to the services provided in the baseline scenario, i.e. users will obtain the same amount of useable cooking energy. The source of energy will be firewood, the same as in the baseline scenario. The quantity of firewood used to obtain the same service will however be much lower under the CPA, since all disseminated ICS will consume less firewood for cooking compared to the traditional stoves used in the baseline scenario. Apart from saving GHG emissions, there will also be important improvements for users that come along with the ICSs. The CPA will help:
- bringing wood consumption down so as to allow natural recovery of forests and/or reforestation to take place (Fuel Wood Use is the main driver for deforestation and greenhouse gas emissions in Ethiopia11),
- diminishing Indoor Air Pollution from wood smoke and avoiding its harmful health consequences,
- diminishing the fuel wood bill for households.
The technical appliance that is replaced by the ICSs distributed under this CPA is the three stone fire or conventional inefficient stoves with no improved combustion air supply or flue gas ventilation system, i.e. without a grate or a chimney. The baseline system is a continuation of current practice and thus identical to the scenario existing prior to the implementation of the CPA.
11
Environmental Protection Authority. 2003. State of the Environment Ethiopia. Addis Ababa: Environmental Protection
Authority. http://www.epa.gov.et/Download/Publications/State%20of%20Environment%20Report%20of%20Ethiopia-%202003.pdf.
a) b)
CDM-SSC-CPA-DD-FORM
Version 03.0 Page 8 of 59
A.6. Party(ies)
Name of Party involved (host) indicates host Party
Private and/or public entity(ies) CPA implementer(s) (as applicable)
Indicate if the Party involved wishes to be considered as CPA implementer (Yes/No)
Federal Democratic Republic of Ethiopia
World Food Programme
Ethiopia
No
A.7. Geographic reference or other means of identification
The geographical area within which this CPA 1 is implemented is the territory of the Federal Democratic Republic of Ethiopia.
The first distribution of ICSs under this CPA will occur in the Amhara region in the Woredas of East Belesa and Ebenat. Coordinates of the Amhara region are Latitude: 13.659960, Longitude: 36.449777 (upper left corner).
All ICSs disseminated under this CPA shall have a unique serial number, allowing to doubtlessly identify the appliance. Serial numbers are transferred to the corresponding CPA electronic record keeping system. An electronic record keeping system for the CPA will be operated and maintained by the managing entity
A.8. Duration of the CPA
A.8.1. Start date of the CPA
10/03/2014, the date when funding was approved for implementation.
A.8.2. Expected operational lifetime of the CPA
21 years
A.9. Choice of the crediting period and related information
Renewable crediting period.
A.9.1. Start date of the crediting period
The crediting period starting date shall be the date of CPA inclusion into the registered PoA. It is not known at the time of preparation of this CPA-DD, but expected for 15/11/2014. The crediting period of the CPA shall not exceed the PoA end date.
A.9.2. Length of the crediting period
7 years
CDM-SSC-CPA-DD-FORM
Version 03.0 Page 9 of 59
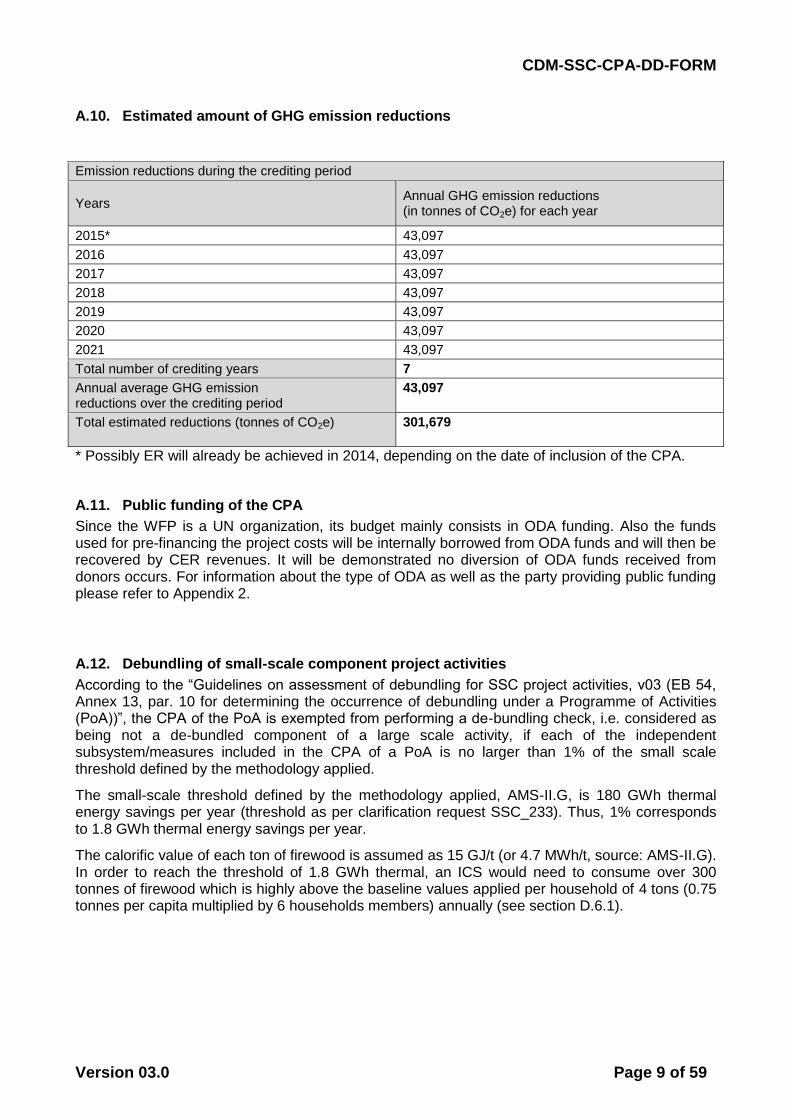
A.10. Estimated amount of GHG emission reductions
Emission reductions during the crediting period
Years Annual GHG emission reductions (in tonnes of CO2e) for each year
2015* 43,097
2016 43,097
2017 43,097
2018 43,097
2019 43,097
2020 43,097
2021 43,097
Total number of crediting years 7
Annual average GHG emission reductions over the crediting period
43,097
Total estimated reductions (tonnes of CO2e) 301,679
* Possibly ER will already be achieved in 2014, depending on the date of inclusion of the CPA.
A.11. Public funding of the CPA
Since the WFP is a UN organization, its budget mainly consists in ODA funding. Also the funds used for pre-financing the project costs will be internally borrowed from ODA funds and will then be recovered by CER revenues. It will be demonstrated no diversion of ODA funds received from donors occurs. For information about the type of ODA as well as the party providing public funding please refer to Appendix 2.
A.12. Debundling of small-scale component project activities
According to the “Guidelines on assessment of debundling for SSC project activities, v03 (EB 54, Annex 13, par. 10 for determining the occurrence of debundling under a Programme of Activities (PoA))”, the CPA of the PoA is exempted from performing a de-bundling check, i.e. considered as being not a de-bundled component of a large scale activity, if each of the independent subsystem/measures included in the CPA of a PoA is no larger than 1% of the small scale threshold defined by the methodology applied.
The small-scale threshold defined by the methodology applied, AMS-II.G, is 180 GWh thermal energy savings per year (threshold as per clarification request SSC_233). Thus, 1% corresponds to 1.8 GWh thermal energy savings per year.
The calorific value of each ton of firewood is assumed as 15 GJ/t (or 4.7 MWh/t, source: AMS-II.G). In order to reach the threshold of 1.8 GWh thermal, an ICS would need to consume over 300 tonnes of firewood which is highly above the baseline values applied per household of 4 tons (0.75 tonnes per capita multiplied by 6 households members) annually (see section D.6.1).
CDM-SSC-CPA-DD-FORM
Version 03.0 Page 10 of 59
A.13. Confirmation for CPA
The small-scale CPA is neither registered as an individual CDM project activity nor is it part of another registered PoA. No ICS distributed under the specific CPA will be part of another single CDM project activity or CPA under another PoA.
A.14. Contact information of responsible persons/ entities for completing the CDM-SSC-CPA-DD-FORM
The completion of the CPA-DD was done by the World Food Programme Ethiopia, who represents the CME of this PoA. For contact details please see Appendix 1 of this CPA-DD with the support of atmosfair gGmbH.
CPA implementer and/or responsible person/ entity
CPA implementer(s)
Responsible person/ entity for completing the CDM-SSC-CPA-DD-
FORM
Organization World Food Programme Ethiopia
Street/P.O. Box Off Olompya/ Haile Gebreselassie Road, P.O.Box 25584
Building Kebele 17/18 River Side Hotel PLC
City Addis Ababa, Kirkos Sub City
State/Region Oromia
Postcode 1000
Country Ethiopia
Telephone 00251 115515188
Fax 00251 115514433
Website www.wfp.org/ www.wfp.org/countries/ethiopia
Contact person Keton Sankei
Title Programme Officer
Salutation Mr
Last name Sankei
Middle name
First name Keton
Department World Food Programme Ethiopia
Mobile 0051 0922122593
Direct fax 00251 115514433
Direct tel. 00251 115515188
Personal e-mail [email protected]
CDM-SSC-CPA-DD-FORM
Version 03.0 Page 11 of 59
SECTION B. Environmental analysis
B.1. Analysis of the environmental impacts
According to the DIRECTIVE NO.2/ 2008 issued by the Environmental Council in accordance with Article 9(3) of the Environmental Protection Organs Establishment Proclamation No. 295/2002, no EIA is necessary12, since the project activity is not listed under the Types of Project Requiring Environmental Impact Assessment. No negative environmental impacts of the programme, including transboundary impacts, are foreseen, neither by the project participants nor by the host country. In contrast, the programme will have positive environmental impacts, among these, improvement of air quality and forest protection.
Air quality
Indoor Air Pollution will be reduced since all ICSs distributed under this CPA will lead to more efficient and cleaner combustion of biomass, thereby reducing smoke generation. With the usage of, for example, the Mirt stove other harmful substances like CO are decreased by up to 92%13.
Forest protection
Through the use of the ICSs, less fuel wood will be consumed; hence this CPA directly contributes to lowering the pressure on woody biomass. Indirectly, this also leads to a protection of water resources and to a decrease in soil erosion through decreased deforestation. Decreased deforestation will contribute to the conservation of the unique biodiversity of Ethiopia.
SECTION C. Local stakeholder comments
C.1. Solicitation of comments from local stakeholders
A stakeholder consultation process was conducted at the PoA level.
C.2. Summary of comments received
A stakeholder consultation process was conducted at the PoA level.
C.3. Report on consideration of comments received
Regarding the responsibilities of ministries, it was clarified that the implementation of the project shall be in the responsibility of the same ministry in all regions. The Ministry of Agriculture (MoARD) will be in charge for the local distribution of Mirt and Tikikil stoves, since the national Climate Resilient Green Economy Initiative it is clearly points out that the implementation of cookstoves is under the agenda of the Ministry of Agriculture. The practical reason for this responsibility is that the MoARD has the best local network at Woreda and even Kebele level.
12 Directive No. 2/ 2008 issued to determine the Categories of projects subject to the Environmental Impact Assessment Proclamation No. 299/ 2002
13 GTZ Sun 2011, on energypedia, 2011, https://energypedia.info/index.php/File:Stove_testing_results_summary.pdf
CDM-SSC-CPA-DD-FORM
Version 03.0 Page 12 of 59
SECTION D. Eligibility of CPA and estimation of emissions reductions
D.1. Reference of methodology(ies) and standardized baseline(s)
The methodology AMS-II.G “Energy Efficiency Measures in Thermal Applications of Non-Renewable Biomass” (version 5.0) is used in this CPA.
http://cdm.unfccc.int/methodologies/DB/UFM2QB70KFMWLVO7LJN8XD1O2RKHEK
The use of this methodology in a project activity under a programme of activities is permitted if leakages are estimated and accounted for. Here we will use option (c) of par. 29 for the accounting of leakages:
(c) As an alternative to subparagraphs (a) and (b), Bold can be multiplied by a net to gross adjustment factor of 0.95 to account for leakages, in which case surveys are not required.
D.2. Applicability of methodology(ies) and standardized baseline(s)
Part I: Demonstration of the small scale limit for the CPA
The CPA 1 will distribute a combination of 2 types of ICS. The CPA qualifies as Type II – energy efficiency improvement project and will remain under the limit of small-scale project activity type (annual energy savings below 180 GWhth, threshold as per clarification request SSC_233) during each year of the crediting period. The number of disseminated ICSs is recorded in the database. Only the ICSs recorded in the database will be part of the CPA.
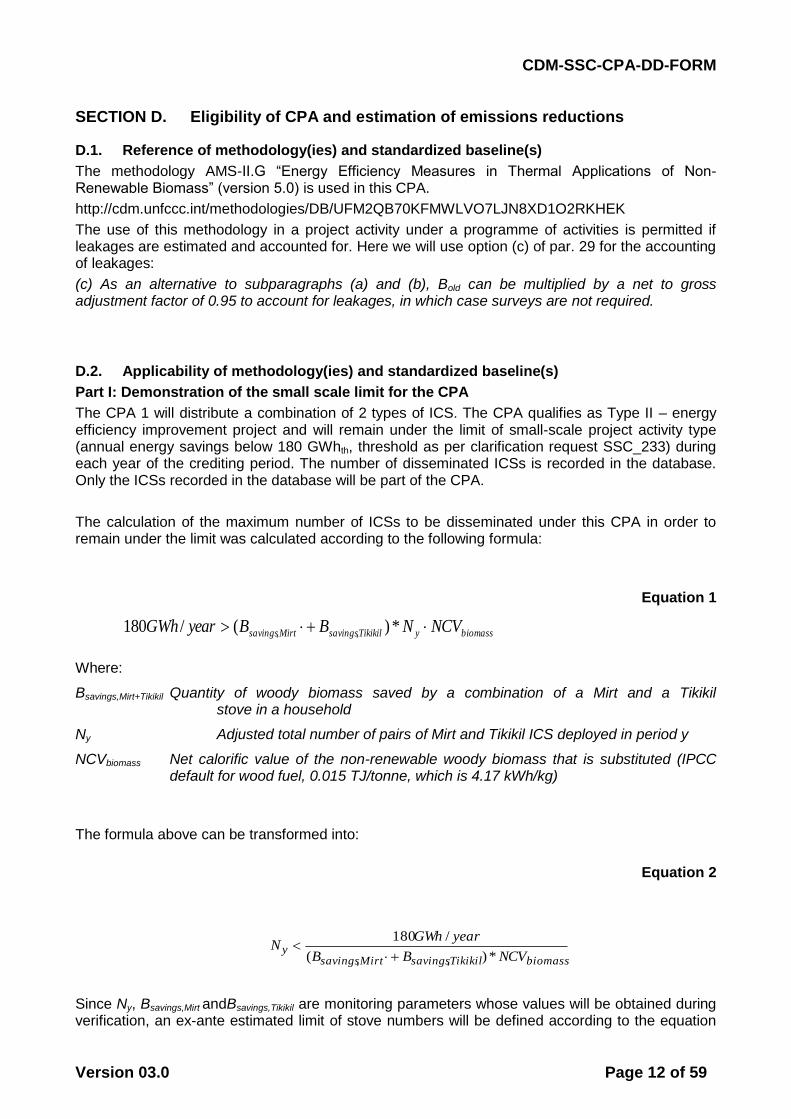
The calculation of the maximum number of ICSs to be disseminated under this CPA in order to remain under the limit was calculated according to the following formula:
Equation 1
biomassyTikikilsavingsMirtsavings NCVNBByearGWh *) (/180 ,,
Where:
Bsavings,Mirt+Tikikil Quantity of woody biomass saved by a combination of a Mirt and a Tikikil stove in a household
Ny Adjusted total number of pairs of Mirt and Tikikil ICS deployed in period y
NCVbiomass Net calorific value of the non-renewable woody biomass that is substituted (IPCC default for wood fuel, 0.015 TJ/tonne, which is 4.17 kWh/kg)
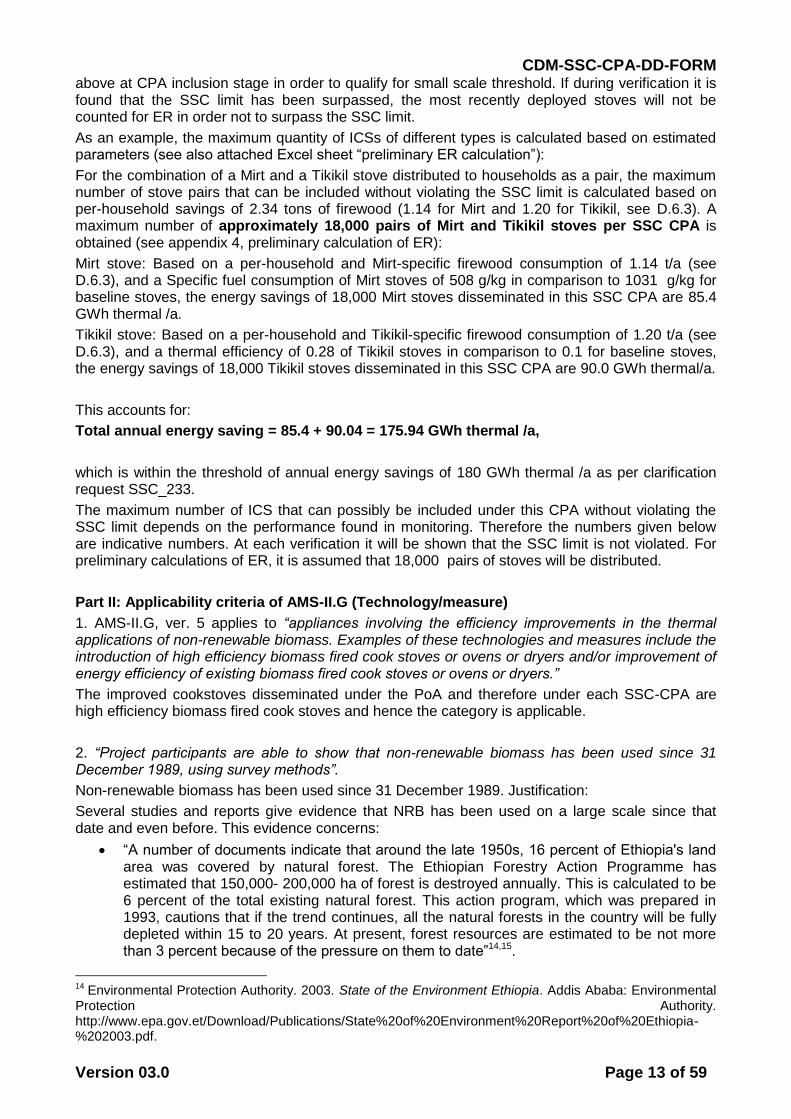
The formula above can be transformed into:
Equation 2
biomassTikikilsavingsMirtsavingsy
NCVBB
yearGWhN
*) (
/180
,,
Since Ny, Bsavings,Mirt andBsavings,Tikikil are monitoring parameters whose values will be obtained during verification, an ex-ante estimated limit of stove numbers will be defined according to the equation
CDM-SSC-CPA-DD-FORM
Version 03.0 Page 13 of 59
above at CPA inclusion stage in order to qualify for small scale threshold. If during verification it is found that the SSC limit has been surpassed, the most recently deployed stoves will not be counted for ER in order not to surpass the SSC limit.
As an example, the maximum quantity of ICSs of different types is calculated based on estimated parameters (see also attached Excel sheet “preliminary ER calculation”):
For the combination of a Mirt and a Tikikil stove distributed to households as a pair, the maximum number of stove pairs that can be included without violating the SSC limit is calculated based on per-household savings of 2.34 tons of firewood (1.14 for Mirt and 1.20 for Tikikil, see D.6.3). A maximum number of approximately 18,000 pairs of Mirt and Tikikil stoves per SSC CPA is obtained (see appendix 4, preliminary calculation of ER):
Mirt stove: Based on a per-household and Mirt-specific firewood consumption of 1.14 t/a (see D.6.3), and a Specific fuel consumption of Mirt stoves of 508 g/kg in comparison to 1031 g/kg for baseline stoves, the energy savings of 18,000 Mirt stoves disseminated in this SSC CPA are 85.4 GWh thermal /a.
Tikikil stove: Based on a per-household and Tikikil-specific firewood consumption of 1.20 t/a (see D.6.3), and a thermal efficiency of 0.28 of Tikikil stoves in comparison to 0.1 for baseline stoves, the energy savings of 18,000 Tikikil stoves disseminated in this SSC CPA are 90.0 GWh thermal/a.
This accounts for:
Total annual energy saving = 85.4 + 90.04 = 175.94 GWh thermal /a,
which is within the threshold of annual energy savings of 180 GWh thermal /a as per clarification request SSC_233.
The maximum number of ICS that can possibly be included under this CPA without violating the SSC limit depends on the performance found in monitoring. Therefore the numbers given below are indicative numbers. At each verification it will be shown that the SSC limit is not violated. For preliminary calculations of ER, it is assumed that 18,000 pairs of stoves will be distributed.
Part II: Applicability criteria of AMS-II.G (Technology/measure)
1. AMS-II.G, ver. 5 applies to “appliances involving the efficiency improvements in the thermal applications of non-renewable biomass. Examples of these technologies and measures include the introduction of high efficiency biomass fired cook stoves or ovens or dryers and/or improvement of energy efficiency of existing biomass fired cook stoves or ovens or dryers.”
The improved cookstoves disseminated under the PoA and therefore under each SSC-CPA are high efficiency biomass fired cook stoves and hence the category is applicable.
2. “Project participants are able to show that non-renewable biomass has been used since 31 December 1989, using survey methods”.
Non-renewable biomass has been used since 31 December 1989. Justification:
Several studies and reports give evidence that NRB has been used on a large scale since that date and even before. This evidence concerns:
“A number of documents indicate that around the late 1950s, 16 percent of Ethiopia's land area was covered by natural forest. The Ethiopian Forestry Action Programme has estimated that 150,000- 200,000 ha of forest is destroyed annually. This is calculated to be 6 percent of the total existing natural forest. This action program, which was prepared in 1993, cautions that if the trend continues, all the natural forests in the country will be fully depleted within 15 to 20 years. At present, forest resources are estimated to be not more than 3 percent because of the pressure on them to date”14,15.
14
Environmental Protection Authority. 2003. State of the Environment Ethiopia. Addis Ababa: Environmental Protection Authority. http://www.epa.gov.et/Download/Publications/State%20of%20Environment%20Report%20of%20Ethiopia-%202003.pdf.
CDM-SSC-CPA-DD-FORM
Version 03.0 Page 14 of 59
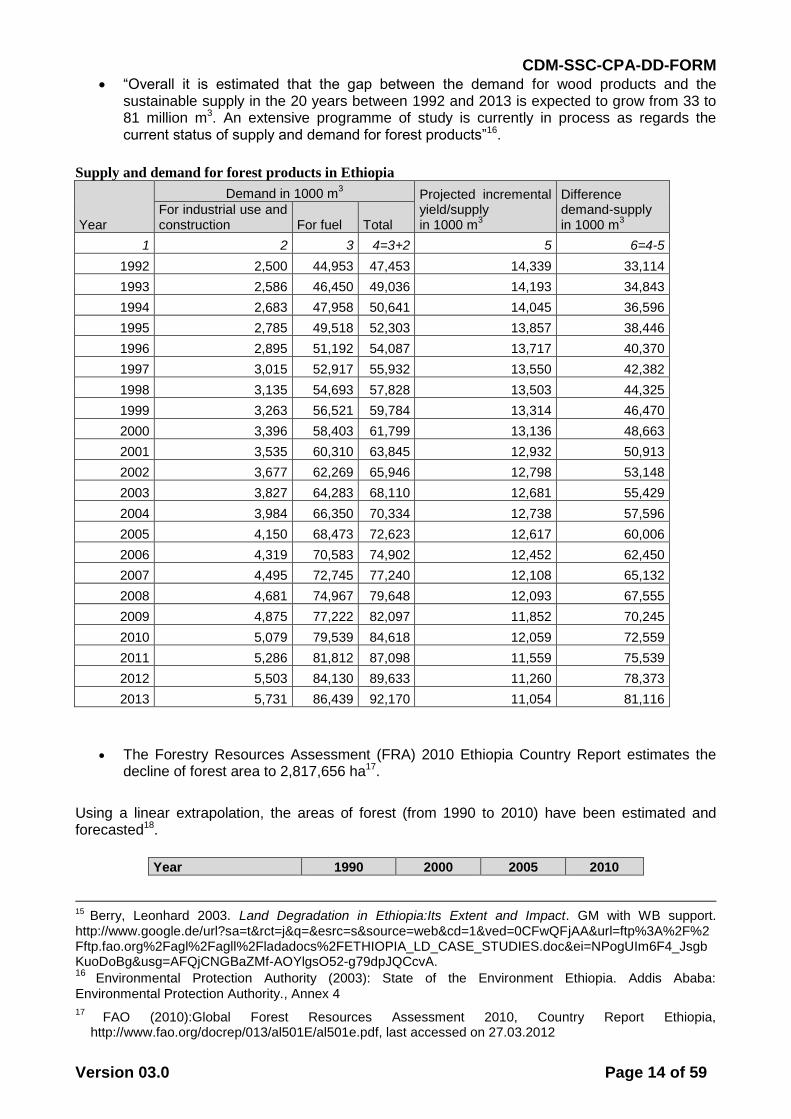
“Overall it is estimated that the gap between the demand for wood products and the sustainable supply in the 20 years between 1992 and 2013 is expected to grow from 33 to 81 million m3. An extensive programme of study is currently in process as regards the current status of supply and demand for forest products”16.
Supply and demand for forest products in Ethiopia
Year
Demand in 1000 m3 Projected incremental
yield/supply in 1000 m
3
Difference demand-supply in 1000 m
3
For industrial use and construction For fuel Total
1 2 3 4=3+2 5 6=4-5
1992 2,500 44,953 47,453 14,339 33,114
1993 2,586 46,450 49,036 14,193 34,843
1994 2,683 47,958 50,641 14,045 36,596
1995 2,785 49,518 52,303 13,857 38,446
1996 2,895 51,192 54,087 13,717 40,370
1997 3,015 52,917 55,932 13,550 42,382
1998 3,135 54,693 57,828 13,503 44,325
1999 3,263 56,521 59,784 13,314 46,470
2000 3,396 58,403 61,799 13,136 48,663
2001 3,535 60,310 63,845 12,932 50,913
2002 3,677 62,269 65,946 12,798 53,148
2003 3,827 64,283 68,110 12,681 55,429
2004 3,984 66,350 70,334 12,738 57,596
2005 4,150 68,473 72,623 12,617 60,006
2006 4,319 70,583 74,902 12,452 62,450
2007 4,495 72,745 77,240 12,108 65,132
2008 4,681 74,967 79,648 12,093 67,555
2009 4,875 77,222 82,097 11,852 70,245
2010 5,079 79,539 84,618 12,059 72,559
2011 5,286 81,812 87,098 11,559 75,539
2012 5,503 84,130 89,633 11,260 78,373
2013 5,731 86,439 92,170 11,054 81,116
The Forestry Resources Assessment (FRA) 2010 Ethiopia Country Report estimates the decline of forest area to 2,817,656 ha17.
Using a linear extrapolation, the areas of forest (from 1990 to 2010) have been estimated and forecasted18.
Year 1990 2000 2005 2010
15
Berry, Leonhard 2003. Land Degradation in Ethiopia:Its Extent and Impact. GM with WB support. http://www.google.de/url?sa=t&rct=j&q=&esrc=s&source=web&cd=1&ved=0CFwQFjAA&url=ftp%3A%2F%2Fftp.fao.org%2Fagl%2Fagll%2Fladadocs%2FETHIOPIA_LD_CASE_STUDIES.doc&ei=NPogUIm6F4_JsgbKuoDoBg&usg=AFQjCNGBaZMf-AOYlgsO52-g79dpJQCcvA. 16 Environmental Protection Authority (2003): State of the Environment Ethiopia. Addis Ababa:
Environmental Protection Authority., Annex 4 17
FAO (2010):Global Forest Resources Assessment 2010, Country Report Ethiopia, http://www.fao.org/docrep/013/al501E/al501e.pdf, last accessed on 27.03.2012
CDM-SSC-CPA-DD-FORM
Version 03.0 Page 15 of 59
Forest area (1000 ha) 15,114 13,705 13,000 12,296
The Environmental Protection Authority Ethiopia states in their 2003 State of the environment Ethiopia report: report “Increases in population and consequent expansion of settlement resulting in demand for farm lands near forest areas, increases in demand for fuel, construction and industrial wood, forest fires, low public awareness, pervasive poverty and failure to demarcate and protect the boundaries of forests are major, among the factors that impact the forest resources of the country”18
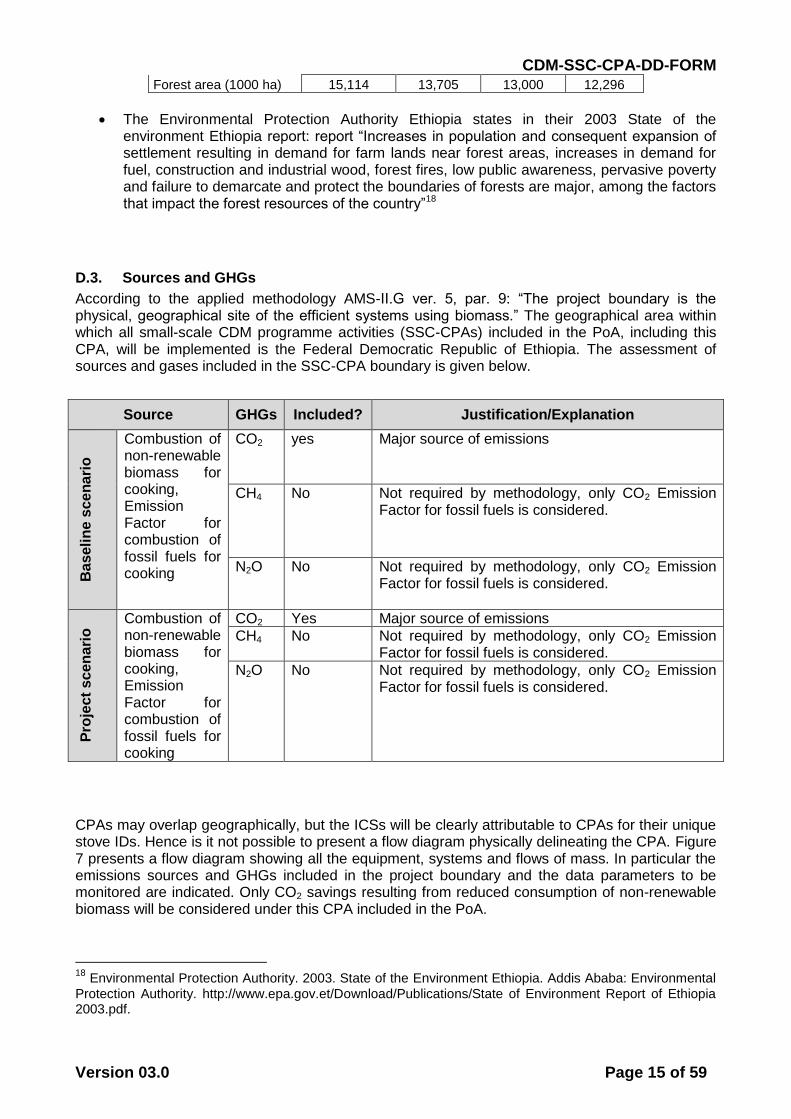
D.3. Sources and GHGs
According to the applied methodology AMS-II.G ver. 5, par. 9: “The project boundary is the physical, geographical site of the efficient systems using biomass.” The geographical area within which all small-scale CDM programme activities (SSC-CPAs) included in the PoA, including this CPA, will be implemented is the Federal Democratic Republic of Ethiopia. The assessment of sources and gases included in the SSC-CPA boundary is given below.
Source GHGs Included? Justification/Explanation
Ba
se
lin
e s
ce
na
rio
Combustion of non-renewable biomass for cooking, Emission Factor for combustion of fossil fuels for cooking
CO2 yes Major source of emissions
CH4 No Not required by methodology, only CO2 Emission Factor for fossil fuels is considered.
N2O No Not required by methodology, only CO2 Emission Factor for fossil fuels is considered.
Pro
ject
sce
na
rio
Combustion of non-renewable biomass for cooking, Emission Factor for combustion of fossil fuels for cooking
CO2 Yes Major source of emissions
CH4 No Not required by methodology, only CO2 Emission Factor for fossil fuels is considered.
N2O
No Not required by methodology, only CO2 Emission Factor for fossil fuels is considered.
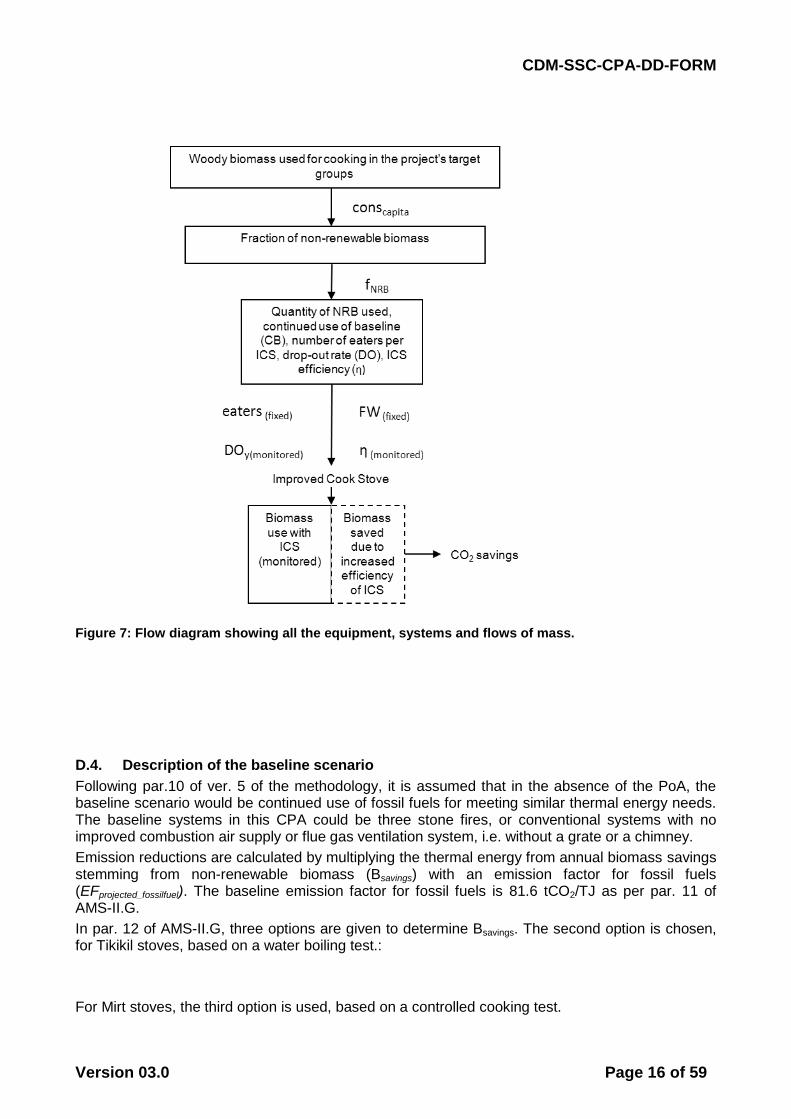
CPAs may overlap geographically, but the ICSs will be clearly attributable to CPAs for their unique stove IDs. Hence is it not possible to present a flow diagram physically delineating the CPA. Figure 7 presents a flow diagram showing all the equipment, systems and flows of mass. In particular the emissions sources and GHGs included in the project boundary and the data parameters to be monitored are indicated. Only CO2 savings resulting from reduced consumption of non-renewable biomass will be considered under this CPA included in the PoA.
18 Environmental Protection Authority. 2003. State of the Environment Ethiopia. Addis Ababa: Environmental
Protection Authority. http://www.epa.gov.et/Download/Publications/State of Environment Report of Ethiopia 2003.pdf.
CDM-SSC-CPA-DD-FORM
Version 03.0 Page 16 of 59
Figure 7: Flow diagram showing all the equipment, systems and flows of mass.
D.4. Description of the baseline scenario
Following par.10 of ver. 5 of the methodology, it is assumed that in the absence of the PoA, the baseline scenario would be continued use of fossil fuels for meeting similar thermal energy needs. The baseline systems in this CPA could be three stone fires, or conventional systems with no improved combustion air supply or flue gas ventilation system, i.e. without a grate or a chimney.
Emission reductions are calculated by multiplying the thermal energy from annual biomass savings stemming from non-renewable biomass (Bsavings) with an emission factor for fossil fuels (EFprojected_fossilfuel). The baseline emission factor for fossil fuels is 81.6 tCO2/TJ as per par. 11 of AMS-II.G.
In par. 12 of AMS-II.G, three options are given to determine Bsavings. The second option is chosen, for Tikikil stoves, based on a water boiling test.:
For Mirt stoves, the third option is used, based on a controlled cooking test.
CDM-SSC-CPA-DD-FORM
Version 03.0 Page 17 of 59
Par.13 of AMS-II.G gives two approaches to determine Bold. We choose to apply approach (a), where Bold is derived from the estimated average annual consumption of woody biomass per appliance (tonnes/year), derived from historical data or a survey of local usage. The average annual consumption of woody biomass per appliance is determined using the average annual firewood consumption per capita (conscapita) and the number of eaters (eatersHH).
In determining conscapita for household stoves, we opt for historical data as source since such data are available for Ethiopian households.
For determination of each parameter required for the calculation of the emission reductions, please refer to Sections D.6.2 and D.7.1.
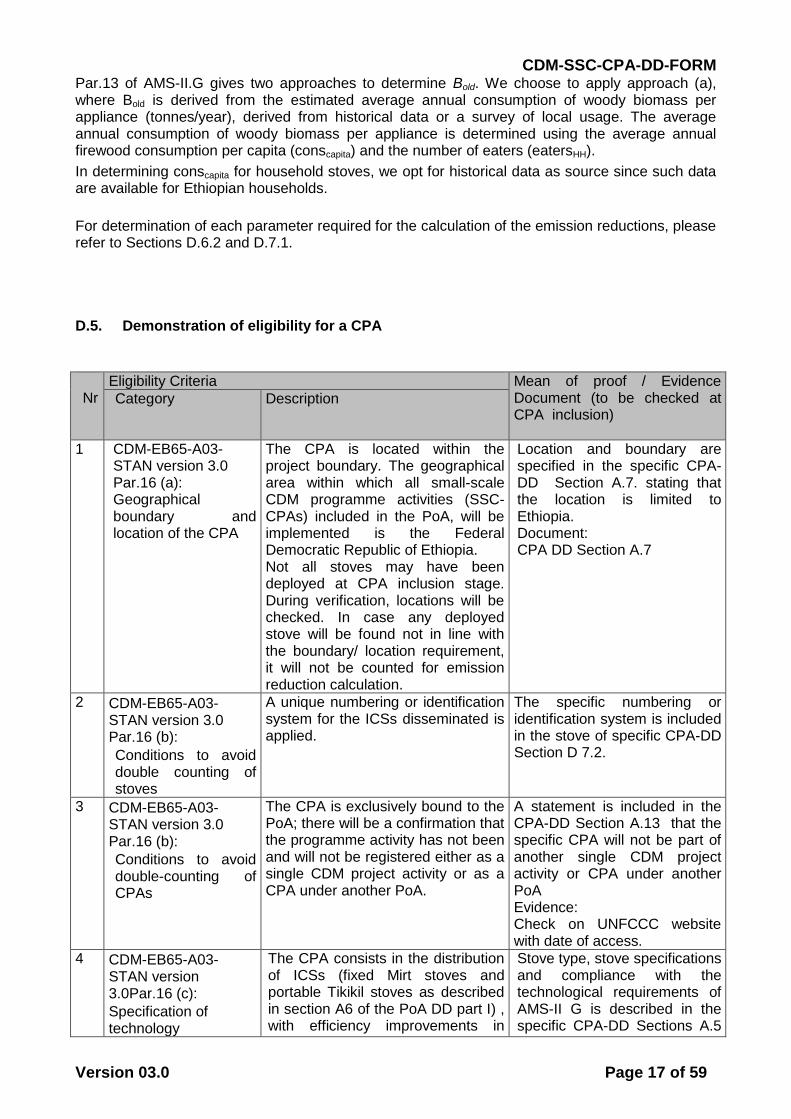
D.5. Demonstration of eligibility for a CPA
Nr
Eligibility Criteria Mean of proof / Evidence Document (to be checked at CPA inclusion)
Category Description
1 CDM-EB65-A03-STAN version 3.0 Par.16 (a): Geographical boundary and location of the CPA
The CPA is located within the project boundary. The geographical area within which all small-scale CDM programme activities (SSC-CPAs) included in the PoA, will be implemented is the Federal Democratic Republic of Ethiopia. Not all stoves may have been deployed at CPA inclusion stage. During verification, locations will be checked. In case any deployed stove will be found not in line with the boundary/ location requirement, it will not be counted for emission reduction calculation.
Location and boundary are specified in the specific CPA-DD Section A.7. stating that the location is limited to Ethiopia. Document: CPA DD Section A.7
2 CDM-EB65-A03-STAN version 3.0 Par.16 (b):
Conditions to avoid double counting of stoves
A unique numbering or identification system for the ICSs disseminated is applied.
The specific numbering or identification system is included in the stove of specific CPA-DD Section D 7.2.
3 CDM-EB65-A03-STAN version 3.0 Par.16 (b):
Conditions to avoid double-counting of CPAs
The CPA is exclusively bound to the PoA; there will be a confirmation that the programme activity has not been and will not be registered either as a single CDM project activity or as a CPA under another PoA.
A statement is included in the CPA-DD Section A.13 that the specific CPA will not be part of another single CDM project activity or CPA under another PoA Evidence: Check on UNFCCC website with date of access.
4 CDM-EB65-A03-STAN version 3.0Par.16 (c):
Specification of technology
The CPA consists in the distribution of ICSs (fixed Mirt stoves and portable Tikikil stoves as described in section A6 of the PoA DD part I) , with efficiency improvements in
Stove type, stove specifications and compliance with the technological requirements of AMS-II G is described in the specific CPA-DD Sections A.5
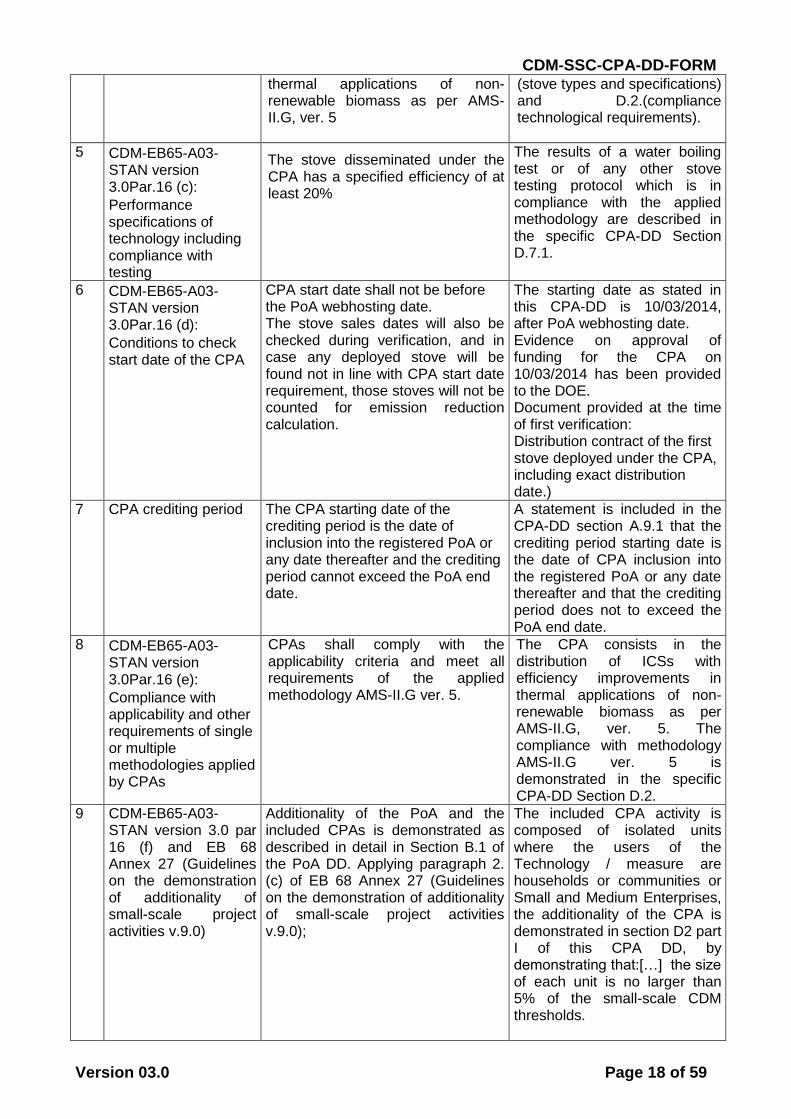
CDM-SSC-CPA-DD-FORM
Version 03.0 Page 18 of 59
thermal applications of non-renewable biomass as per AMS-II.G, ver. 5
(stove types and specifications) and D.2.(compliance technological requirements).
5 CDM-EB65-A03-STAN version 3.0Par.16 (c):
Performance specifications of technology including compliance with testing
The stove disseminated under the CPA has a specified efficiency of at least 20%
The results of a water boiling test or of any other stove testing protocol which is in compliance with the applied methodology are described in the specific CPA-DD Section D.7.1.
6 CDM-EB65-A03-STAN version 3.0Par.16 (d):
Conditions to check start date of the CPA
CPA start date shall not be before the PoA webhosting date. The stove sales dates will also be checked during verification, and in case any deployed stove will be found not in line with CPA start date requirement, those stoves will not be counted for emission reduction calculation.
The starting date as stated in this CPA-DD is 10/03/2014, after PoA webhosting date. Evidence on approval of funding for the CPA on 10/03/2014 has been provided to the DOE. Document provided at the time of first verification: Distribution contract of the first stove deployed under the CPA, including exact distribution date.)
7 CPA crediting period The CPA starting date of the crediting period is the date of inclusion into the registered PoA or any date thereafter and the crediting period cannot exceed the PoA end date.
A statement is included in the CPA-DD section A.9.1 that the crediting period starting date is the date of CPA inclusion into the registered PoA or any date thereafter and that the crediting period does not to exceed the PoA end date.
8 CDM-EB65-A03-STAN version 3.0Par.16 (e):
Compliance with applicability and other requirements of single or multiple methodologies applied by CPAs
CPAs shall comply with the applicability criteria and meet all requirements of the applied methodology AMS-II.G ver. 5.
The CPA consists in the distribution of ICSs with efficiency improvements in thermal applications of non-renewable biomass as per AMS-II.G, ver. 5. The compliance with methodology AMS-II.G ver. 5 is demonstrated in the specific CPA-DD Section D.2.
9 CDM-EB65-A03-STAN version 3.0 par 16 (f) and EB 68 Annex 27 (Guidelines on the demonstration of additionality of small-scale project activities v.9.0)
Additionality of the PoA and the included CPAs is demonstrated as described in detail in Section B.1 of the PoA DD. Applying paragraph 2. (c) of EB 68 Annex 27 (Guidelines on the demonstration of additionality of small-scale project activities v.9.0);
The included CPA activity is composed of isolated units where the users of the Technology / measure are households or communities or Small and Medium Enterprises, the additionality of the CPA is demonstrated in section D2 part I of this CPA DD, by demonstrating that:[…] the size of each unit is no larger than 5% of the small-scale CDM thresholds.
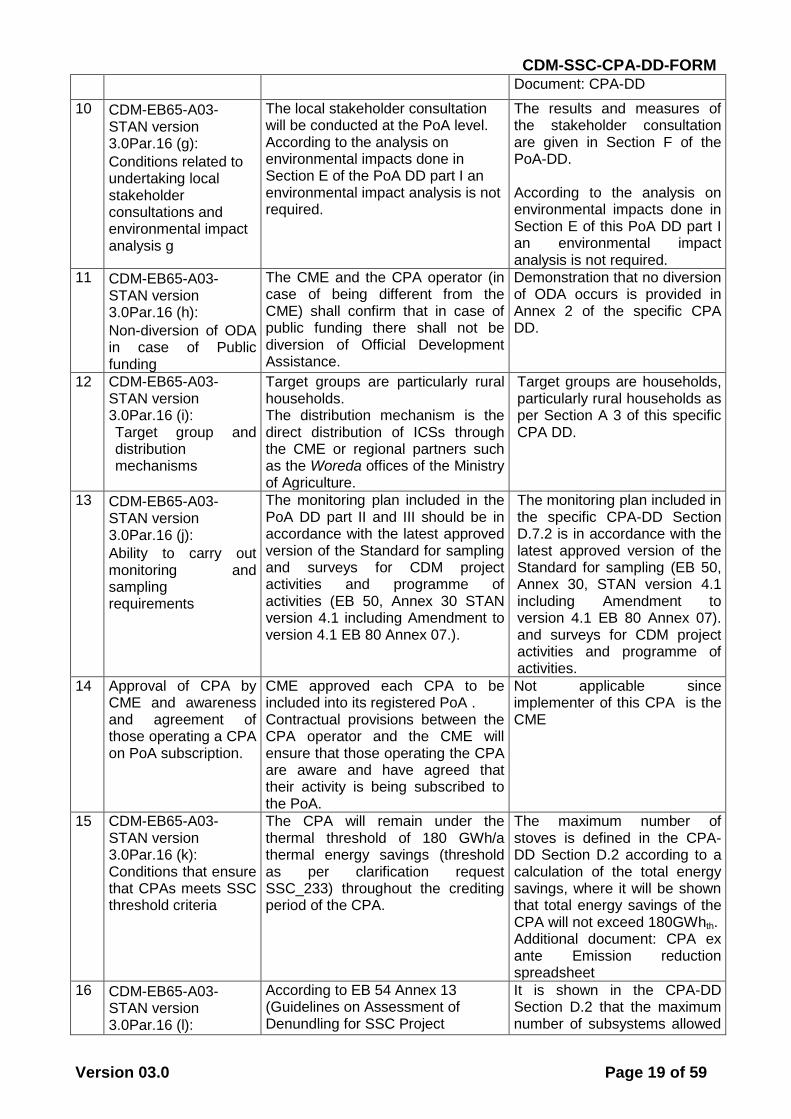
CDM-SSC-CPA-DD-FORM
Version 03.0 Page 19 of 59
Document: CPA-DD
10 CDM-EB65-A03-STAN version 3.0Par.16 (g):
Conditions related to undertaking local stakeholder consultations and environmental impact analysis g
The local stakeholder consultation will be conducted at the PoA level. According to the analysis on environmental impacts done in Section E of the PoA DD part I an environmental impact analysis is not required.
The results and measures of the stakeholder consultation are given in Section F of the PoA-DD. According to the analysis on environmental impacts done in Section E of this PoA DD part I an environmental impact analysis is not required.
11 CDM-EB65-A03-STAN version 3.0Par.16 (h):
Non-diversion of ODA in case of Public funding
The CME and the CPA operator (in case of being different from the CME) shall confirm that in case of public funding there shall not be diversion of Official Development Assistance.
Demonstration that no diversion of ODA occurs is provided in Annex 2 of the specific CPA DD.
12 CDM-EB65-A03-STAN version 3.0Par.16 (i): Target group and distribution mechanisms
Target groups are particularly rural households. The distribution mechanism is the direct distribution of ICSs through the CME or regional partners such as the Woreda offices of the Ministry of Agriculture.
Target groups are households, particularly rural households as per Section A 3 of this specific CPA DD.
13 CDM-EB65-A03-STAN version 3.0Par.16 (j):
Ability to carry out monitoring and sampling requirements
The monitoring plan included in the PoA DD part II and III should be in accordance with the latest approved version of the Standard for sampling and surveys for CDM project activities and programme of activities (EB 50, Annex 30 STAN version 4.1 including Amendment to version 4.1 EB 80 Annex 07.).
The monitoring plan included in the specific CPA-DD Section D.7.2 is in accordance with the latest approved version of the Standard for sampling (EB 50, Annex 30, STAN version 4.1 including Amendment to version 4.1 EB 80 Annex 07). and surveys for CDM project activities and programme of activities.
14 Approval of CPA by CME and awareness and agreement of those operating a CPA on PoA subscription.
CME approved each CPA to be included into its registered PoA . Contractual provisions between the CPA operator and the CME will ensure that those operating the CPA are aware and have agreed that their activity is being subscribed to the PoA.
Not applicable since implementer of this CPA is the CME
15 CDM-EB65-A03-STAN version 3.0Par.16 (k): Conditions that ensure that CPAs meets SSC threshold criteria
The CPA will remain under the thermal threshold of 180 GWh/a thermal energy savings (threshold as per clarification request SSC_233) throughout the crediting period of the CPA.
The maximum number of stoves is defined in the CPA-DD Section D.2 according to a calculation of the total energy savings, where it will be shown that total energy savings of the CPA will not exceed 180GWhth. Additional document: CPA ex ante Emission reduction spreadsheet
16 CDM-EB65-A03-STAN version 3.0Par.16 (l):
According to EB 54 Annex 13 (Guidelines on Assessment of Denundling for SSC Project
It is shown in the CPA-DD Section D.2 that the maximum number of subsystems allowed
CDM-SSC-CPA-DD-FORM
Version 03.0 Page 20 of 59
Requirements for the De-bundling check
Activities“ /Version 03): A CPA of PoA is exempted from performing de-bundling check, if each of the independent subsystems/measures included in the CPA of a PoA is no larger than 1% of the small-scale thresholds defined by the methodology applied.
to be included in a CPA is above 100, which would be the maximum number in case each subsystem would save 1% of the SSC threshold.
17 CER ownership End users receiving ICSs under the specific CPA contractually cede their rights to claim and own emission reductions under the Clean Development Mechanism of the UNFCCC to the CME of the PoA.
A default sales agreement for end users including the provision that emission reductions generated by the stove are owned by the CME is provided for the CPA. At the time of verification, the DOE will check that the default sales agreement has been used for stove distribution.
18 Definition of CPA Baseline
1. if the CPA is only including ICS for household level (as defined in Section B4 of this PoA-DD part II): The CPA applies the baseline fuel consumption as defined in this PoA-DD
2. if the CPA is only including institutional ICS (as defined in Section in Section B4 this PoA-DD part III): the baseline fuel consumption is to be defined in the specific CPA and validated by the DOE prior to CPA inclusion.
1. CPA states that only household ICS are to be implemented under the CPA 2. Baseline fuel consumption is defined in the specific CPA-DD according to the regulations specified in AMS-II.G. and validated by a DOE before inclusion into the CPA.
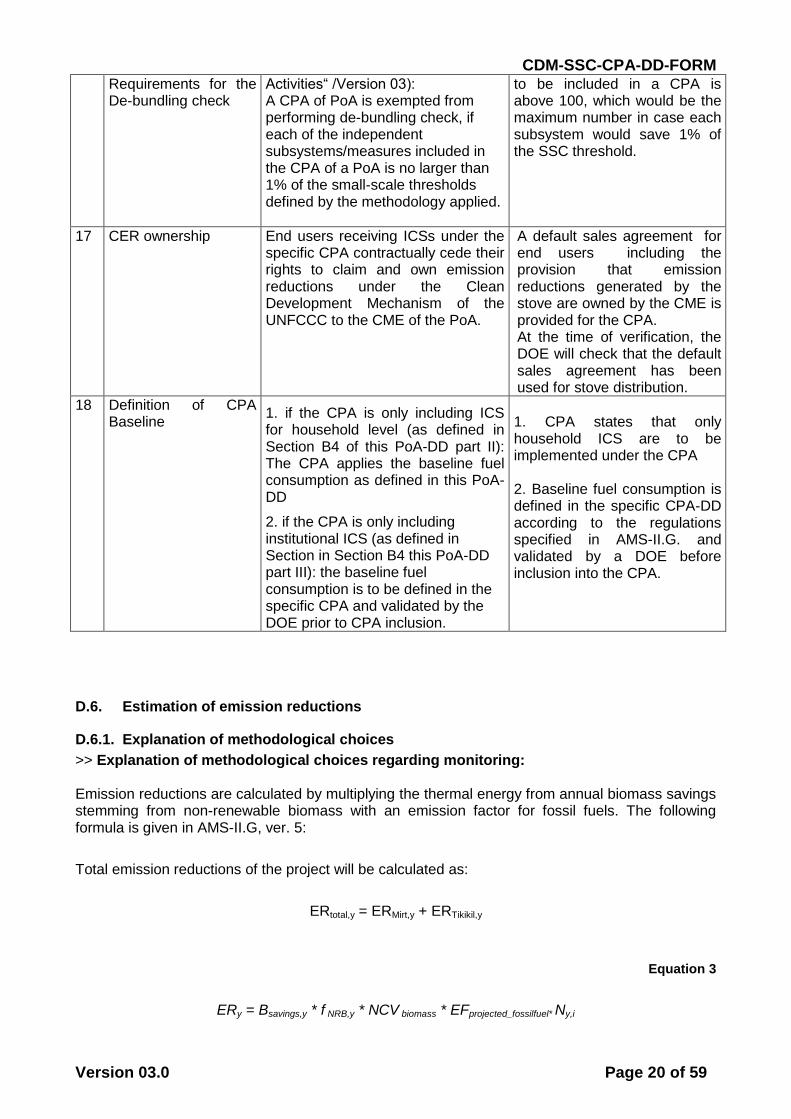
D.6. Estimation of emission reductions
D.6.1. Explanation of methodological choices
>> Explanation of methodological choices regarding monitoring: Emission reductions are calculated by multiplying the thermal energy from annual biomass savings stemming from non-renewable biomass with an emission factor for fossil fuels. The following formula is given in AMS-II.G, ver. 5:
Total emission reductions of the project will be calculated as:
ERtotal,y = ERMirt,y + ERTikikil,y
Equation 3
ERy = Bsavings,y * f NRB,y * NCV biomass * EFprojected_fossilfuel* Ny,i
CDM-SSC-CPA-DD-FORM
Version 03.0 Page 21 of 59
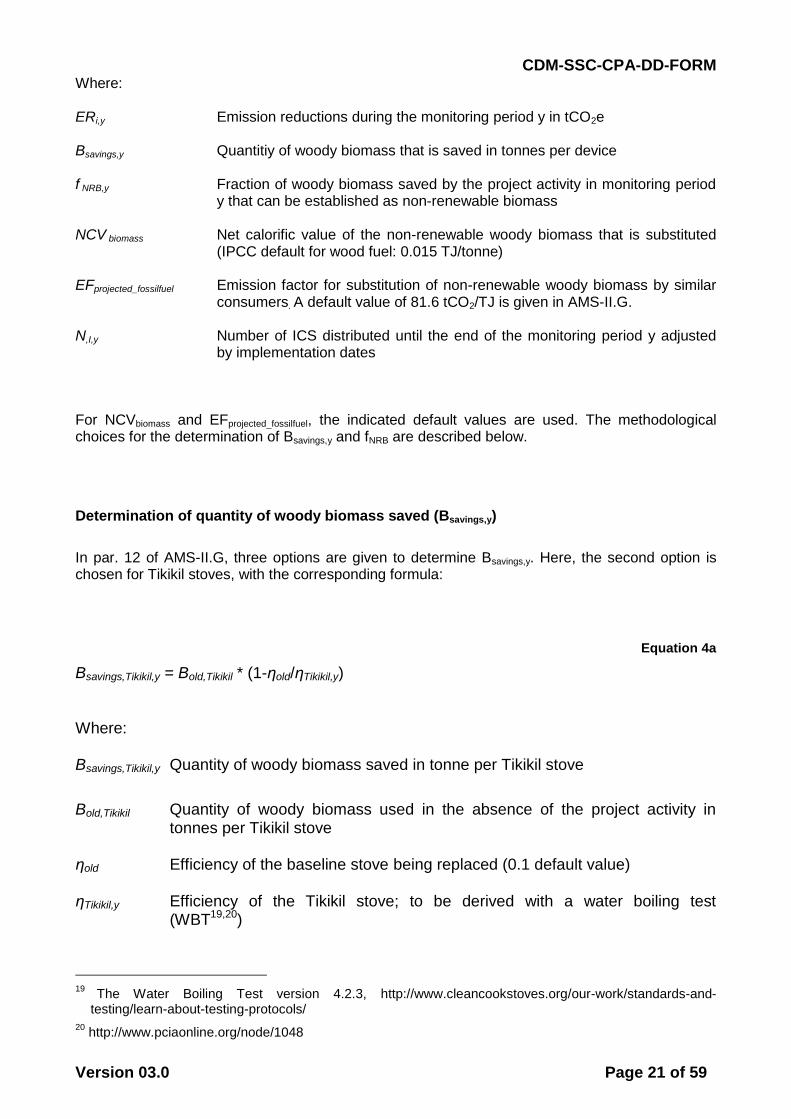
Where: ERi,y Emission reductions during the monitoring period y in tCO2e Bsavings,y Quantitiy of woody biomass that is saved in tonnes per device f NRB,y Fraction of woody biomass saved by the project activity in monitoring period
y that can be established as non-renewable biomass NCV biomass Net calorific value of the non-renewable woody biomass that is substituted
(IPCC default for wood fuel: 0.015 TJ/tonne) EFprojected_fossilfuel Emission factor for substitution of non-renewable woody biomass by similar
consumers. A default value of 81.6 tCO2/TJ is given in AMS-II.G.
N,I,y Number of ICS distributed until the end of the monitoring period y adjusted by implementation dates
For NCVbiomass and EFprojected_fossilfuel, the indicated default values are used. The methodological choices for the determination of Bsavings,y and fNRB are described below.
Determination of quantity of woody biomass saved (Bsavings,y)
In par. 12 of AMS-II.G, three options are given to determine Bsavings,y. Here, the second option is chosen for Tikikil stoves, with the corresponding formula:
Equation 4a
Bsavings,Tikikil,y = Bold,Tikikil * (1-ηold/ηTikikil,y) Where: Bsavings,Tikikil,y Quantity of woody biomass saved in tonne per Tikikil stove
Bold,Tikikil Quantity of woody biomass used in the absence of the project activity in
tonnes per Tikikil stove
ηold Efficiency of the baseline stove being replaced (0.1 default value) ηTikikil,y Efficiency of the Tikikil stove; to be derived with a water boiling test
(WBT19,20)
19
The Water Boiling Test version 4.2.3, http://www.cleancookstoves.org/our-work/standards-and-testing/learn-about-testing-protocols/
20 http://www.pciaonline.org/node/1048
CDM-SSC-CPA-DD-FORM
Version 03.0 Page 22 of 59
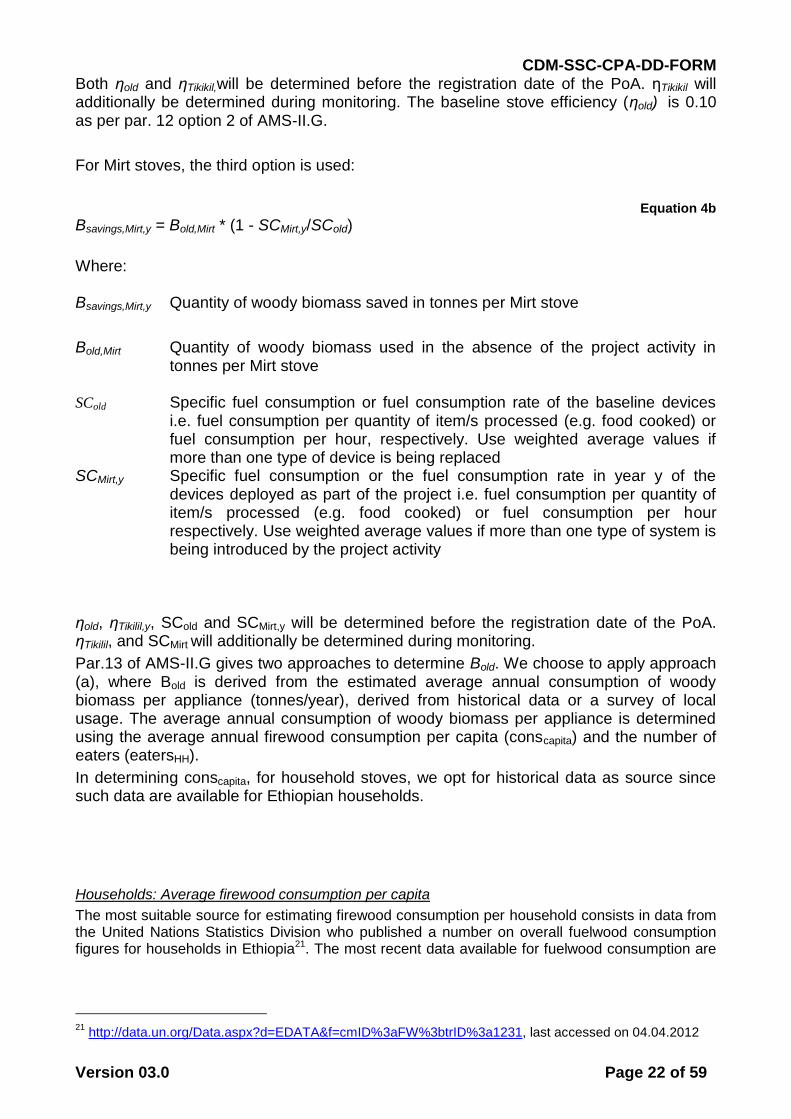
Both ηold and ηTikikil,will be determined before the registration date of the PoA. ηTikikil will additionally be determined during monitoring. The baseline stove efficiency (ηold) is 0.10 as per par. 12 option 2 of AMS-II.G.
For Mirt stoves, the third option is used:
Equation 4b
Bsavings,Mirt,y = Bold,Mirt * (1 - SCMirt,y/SCold)
Where: Bsavings,Mirt,y Quantity of woody biomass saved in tonnes per Mirt stove
Bold,Mirt Quantity of woody biomass used in the absence of the project activity in
tonnes per Mirt stove
SCold Specific fuel consumption or fuel consumption rate of the baseline devices i.e. fuel consumption per quantity of item/s processed (e.g. food cooked) or fuel consumption per hour, respectively. Use weighted average values if more than one type of device is being replaced
SCMirt,y Specific fuel consumption or the fuel consumption rate in year y of the devices deployed as part of the project i.e. fuel consumption per quantity of item/s processed (e.g. food cooked) or fuel consumption per hour respectively. Use weighted average values if more than one type of system is being introduced by the project activity
ηold, ηTikilil,y, SCold and SCMirt,y will be determined before the registration date of the PoA. ηTikilil, and SCMirt will additionally be determined during monitoring.
Par.13 of AMS-II.G gives two approaches to determine Bold. We choose to apply approach (a), where Bold is derived from the estimated average annual consumption of woody biomass per appliance (tonnes/year), derived from historical data or a survey of local usage. The average annual consumption of woody biomass per appliance is determined using the average annual firewood consumption per capita (conscapita) and the number of eaters (eatersHH).
In determining conscapita, for household stoves, we opt for historical data as source since such data are available for Ethiopian households.
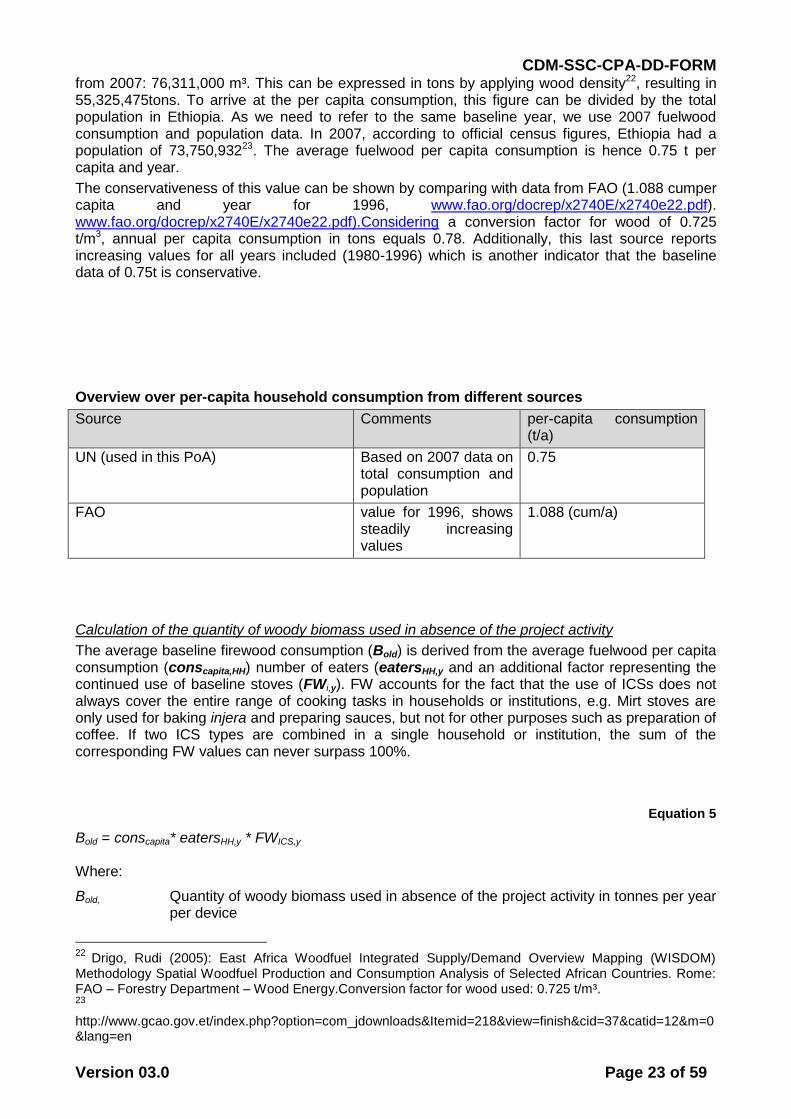
Households: Average firewood consumption per capita
The most suitable source for estimating firewood consumption per household consists in data from the United Nations Statistics Division who published a number on overall fuelwood consumption figures for households in Ethiopia21. The most recent data available for fuelwood consumption are
21
http://data.un.org/Data.aspx?d=EDATA&f=cmID%3aFW%3btrID%3a1231, last accessed on 04.04.2012
CDM-SSC-CPA-DD-FORM
Version 03.0 Page 23 of 59
from 2007: 76,311,000 m³. This can be expressed in tons by applying wood density22, resulting in 55,325,475tons. To arrive at the per capita consumption, this figure can be divided by the total population in Ethiopia. As we need to refer to the same baseline year, we use 2007 fuelwood consumption and population data. In 2007, according to official census figures, Ethiopia had a population of 73,750,93223. The average fuelwood per capita consumption is hence 0.75 t per capita and year.
The conservativeness of this value can be shown by comparing with data from FAO (1.088 cumper capita and year for 1996, www.fao.org/docrep/x2740E/x2740e22.pdf). www.fao.org/docrep/x2740E/x2740e22.pdf).Considering a conversion factor for wood of 0.725 t/m3, annual per capita consumption in tons equals 0.78. Additionally, this last source reports increasing values for all years included (1980-1996) which is another indicator that the baseline data of 0.75t is conservative.
Overview over per-capita household consumption from different sources
Source Comments per-capita consumption (t/a)
UN (used in this PoA) Based on 2007 data on total consumption and population
0.75
FAO value for 1996, shows steadily increasing values
1.088 (cum/a)
Calculation of the quantity of woody biomass used in absence of the project activity
The average baseline firewood consumption (Bold) is derived from the average fuelwood per capita consumption (conscapita,HH) number of eaters (eatersHH,y and an additional factor representing the continued use of baseline stoves (FWi,y). FW accounts for the fact that the use of ICSs does not always cover the entire range of cooking tasks in households or institutions, e.g. Mirt stoves are only used for baking injera and preparing sauces, but not for other purposes such as preparation of coffee. If two ICS types are combined in a single household or institution, the sum of the corresponding FW values can never surpass 100%.
Equation 5
Bold = conscapita* eatersHH,y * FWICS,y Where:
Bold, Quantity of woody biomass used in absence of the project activity in tonnes per year per device
22 Drigo, Rudi (2005): East Africa Woodfuel Integrated Supply/Demand Overview Mapping (WISDOM) Methodology Spatial Woodfuel Production and Consumption Analysis of Selected African Countries. Rome: FAO – Forestry Department – Wood Energy.Conversion factor for wood used: 0.725 t/m³. 23 http://www.gcao.gov.et/index.php?option=com_jdownloads&Itemid=218&view=finish&cid=37&catid=12&m=0&lang=en
CDM-SSC-CPA-DD-FORM
Version 03.0 Page 24 of 59
conscapita Baseline fuelwood consumption per capita
eatersHH,y average number of eaters (residents) per household
FWICS,,y The proportion of household fuel wood consumed by the ICS, used as adjustment factor to account for the continued use of baseline stoves in the monitoring period y, according to par. 29 c) of AMS-II.G
Total are then derived by multiplying with the length of the monitoring period and the number of implemented and operational ICS, adjusted by a drop out rate and leakage.
Combining equations 3), 4a or 4b, and 5), and considering drop out and leakage leads to:
Equation 4a
ERMirt,y = conscapita * eatersHH,y * FWMirt,y * (1-SCMirt/SCold) * fNRB,y * NCVbiomass * EFprojected_fossilfuel * NMirt,y * mplength,y /365 *(1-DOMirt,y) * Ly
Equation 5b
ERTikikil,y = conscapita* eatersHH,y * FWTikikil,y * (1-ηold/ηTikikil) * fNRB,y * NCVbiomass * EFprojected_fossilfuel * NTikikil,y * mplength,y /365 *(1-DOTikikil,y) * Ly
Where:
mplengthy Length of monitoring period y in days DOi,y Discount factor for drop-out, monitored
Ly Leakage, default value of 0.95 according to AMS-II.G ver.5 par. 29 (c)
Determination of the Share of Non-Renewable Biomass
A country specific default fraction of non-renewable woody biomass (fNRB) is used, as available on the CDM website: 88%24
Qualitative assessment of non-renewable woody biomass in Ethiopia
24
https://cdm.unfccc.int/DNA/fNRB/index.html
CDM-SSC-CPA-DD-FORM
Version 03.0 Page 25 of 59
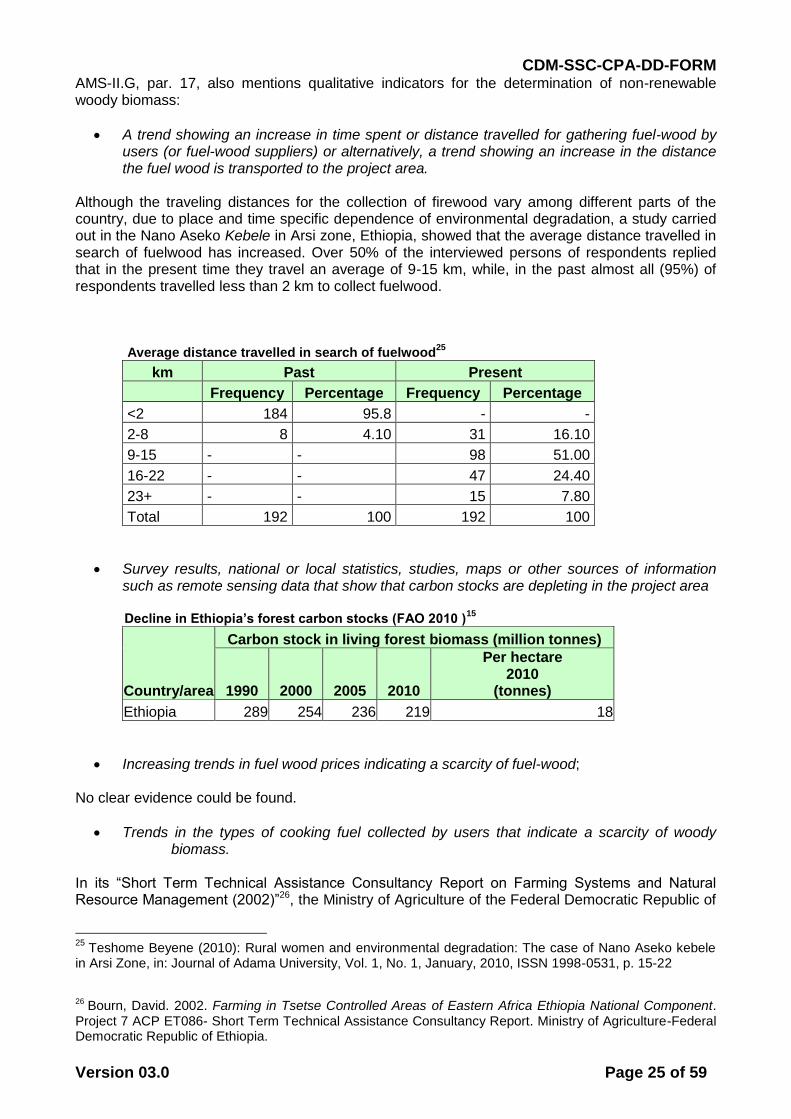
AMS-II.G, par. 17, also mentions qualitative indicators for the determination of non-renewable woody biomass:
A trend showing an increase in time spent or distance travelled for gathering fuel-wood by users (or fuel-wood suppliers) or alternatively, a trend showing an increase in the distance the fuel wood is transported to the project area.
Although the traveling distances for the collection of firewood vary among different parts of the country, due to place and time specific dependence of environmental degradation, a study carried out in the Nano Aseko Kebele in Arsi zone, Ethiopia, showed that the average distance travelled in search of fuelwood has increased. Over 50% of the interviewed persons of respondents replied that in the present time they travel an average of 9-15 km, while, in the past almost all (95%) of respondents travelled less than 2 km to collect fuelwood. Average distance travelled in search of fuelwood
25
km Past Present
Frequency Percentage Frequency Percentage
<2 184 95.8 - -
2-8 8 4.10 31 16.10
9-15 - - 98 51.00
16-22 - - 47 24.40
23+ - - 15 7.80
Total 192 100 192 100
Survey results, national or local statistics, studies, maps or other sources of information such as remote sensing data that show that carbon stocks are depleting in the project area
Decline in Ethiopia’s forest carbon stocks (FAO 2010 )
15
Country/area
Carbon stock in living forest biomass (million tonnes)
1990 2000 2005 2010
Per hectare 2010
(tonnes)
Ethiopia 289 254 236 219 18
Increasing trends in fuel wood prices indicating a scarcity of fuel-wood; No clear evidence could be found.
Trends in the types of cooking fuel collected by users that indicate a scarcity of woody biomass.
In its “Short Term Technical Assistance Consultancy Report on Farming Systems and Natural Resource Management (2002)”26, the Ministry of Agriculture of the Federal Democratic Republic of
25
Teshome Beyene (2010): Rural women and environmental degradation: The case of Nano Aseko kebele in Arsi Zone, in: Journal of Adama University, Vol. 1, No. 1, January, 2010, ISSN 1998-0531, p. 15-22
26
Bourn, David. 2002. Farming in Tsetse Controlled Areas of Eastern Africa Ethiopia National Component. Project 7 ACP ET086- Short Term Technical Assistance Consultancy Report. Ministry of Agriculture-Federal Democratic Republic of Ethiopia.
CDM-SSC-CPA-DD-FORM
Version 03.0 Page 26 of 59
Ethiopia states that due to fuelwood scarcity, dung and crop residues are important substitute fuels in many parts of the country, e.g.: “For the Central Rift Valley in East Shewa Zone the report states: “Fuel wood is becoming scarce in many parts of the area, and annual per capita consumption rates are between 400-600kg. Both dung and crop residues are important substitute fuels: with per capita consumption rates of about 300-400kg of dung, and similar rates for crop residues (almost all maize stalks)”. Also “In West Harerge food fuel is being substituted by dung” (page 13). Another example for fuel wood scarcity is presented by the report for Oromiya region: “With reduced availability of woody biomass, dung is also being increasingly widely used as fuel (page 31).” AMS-II.G also presents Indicators for DRB. Woody biomass is “renewable” if one of the following two conditions is satisfied:
I. The woody biomass is originating from land areas that are forests where: (a) The land area remains a forest; and (b) Sustainable management practices are undertaken on these land areas to
ensure, in particular, that the level of carbon stocks on these land areas does not systematically decrease over time (carbon stocks may temporarily decrease due to harvesting); and
(c) Any national or regional forestry and nature conservation regulations are complied with.
II. The biomass is woody biomass and originates from non-forest areas (e.g., croplands, grasslands) where:
(a) The land area remains as non-forest or is reverted to forest; and (b) Sustainable management practices are undertaken on these land areas to
ensure in particular that the level of carbon stocks on these land areas does not systematically decrease over time (carbon stocks may temporarily decrease due to harvesting); and
(c) Any national or regional forestry, agriculture and nature conservation regulations are complied with.
The following sources show that the conditions for renewable biomass are not in place:
Bourn (2002)27 shows that in all different parts of Ethiopia, forests areas are decreasing, with annual rates of up to 2.4%. The report also demonstrates that sustainable managing practices are not in place, e.g. p.12 for the region around Addis Ababa: “Fuel wood stocks are relatively plentiful but are being harvested well above their sustainable yield. Annual per capita consumption rates are 900 to 1,100 kg. Total rates of harvesting are most certainly well above this figure because of the large market for fuel wood in Addis Ababa and the surrounding towns.”
There is also only low compliance with national regulations as shown by Abebe Damte (2010)28:“Given that all major forests in Ethiopia are state-owned, while the government, like those
27
Bourn, David. 2002. Farming in Tsetse Controlled Areas of Eastern Africa Ethiopia National Component. Project 7 ACP ET086- Short Term Technical Assistance Consultancy Report. Ministry of Agriculture-Federal Democratic Republic of Ethiopia.
28
Damte Bayene, Abebe. 2010. “Property Rights and Choice of Fuel Wood Sources in Rural Ethiopia.” Contributed Paper Prepared for Presentation at the 3rd Conference of African Association of Agricultural Economists (AAAE) and the 48th Agricultural Economics Association of South Africa (AEASA), Cape Town,. http://purl.umn.edu/96171.
CDM-SSC-CPA-DD-FORM
Version 03.0 Page 27 of 59
in many other low-income countries, has neither the capacity nor the incentive to properly regulate these forests, such rates of forest degradation may not be that surprising…In terms of use, the wood supplied from open source forests is mainly used for fuel wood, fencing and construction”.
Leakage
According to AMS-II.G the following potential sources of leakage have to be considered:
a) Use of NRB savings by non-project households or institutions According to AMS-II.G par. 29 (c) the default net to gross adjustment factor of 0.95 is applied to account for leakage and therefore surveys are not required.
b) Transfer of Equipment
AMS-II.G par. 21 states: “If devices currently being utilised outside the project boundary are transferred to the project activity, leakage is to be considered.”
This leakage source can be ruled out since all ICSs being deployed under the PoA will be new stoves.
Methodological choices regarding monitoring
AMS-II.G, ver. 5, par. 22 and 23
“Monitoring shall consist of checking of all devices or a representative sample thereof, at least once every two years (biennial) to determine if they are still operating; those devices that have been replaced by an equivalent in-service device can be counted as operating.
Monitoring shall also consist of checking the efficiency of all devices or a representative sample thereof...
A representative sample of the appliances disseminated under a CPA will be monitored to determine the share of appliances that are still operating at the specified efficiency. Where appliances are found to be operational but with a changed efficiency the actual efficiency determined in monitoring will be applied to calculate emission reductions. Replacement of appliances is monitored and the replaced devices will have same efficiency. The procedures for monitoring the share of operational appliances and their respective efficiency(ies) are laid out in section B.7.
AMS-II.G, ver. 5 par. 25
“In order to assess the leakage described above, monitoring shall include data on the amount of woody biomass saved under the project activity that is used by non-project households/users (who previously used renewable energy sources). Other data on non-renewable woody biomass use required for leakage assessment shall also be collected.”
Par. 25 does not need to be considered for monitoring, as the net-to gross adjustment factor of 0.95 for leakage is used, according to par. 29 c) of AMS-II.G, ver. 5
According to par. 20 of AMS-II.G, ver. 5, monitoring shall ensure that either:
“The replaced low efficiency appliances are disposed of and not used within the boundary or within the region; or
If baseline stoves continue to be used, monitoring shall ensure that the fuel-wood consumption of those stoves is excluded from Bold.”

CDM-SSC-CPA-DD-FORM
Version 03.0 Page 28 of 59
The continued use of baseline stoves is accounted for according to the explanations in D.6.2. It will be fixed conservatively ex-ante for Mirt and Tikikil stoves and it be monitored for IRS.
CDM-SSC-CPA-DD-FORM
Version 03.0 Page 29 of 59
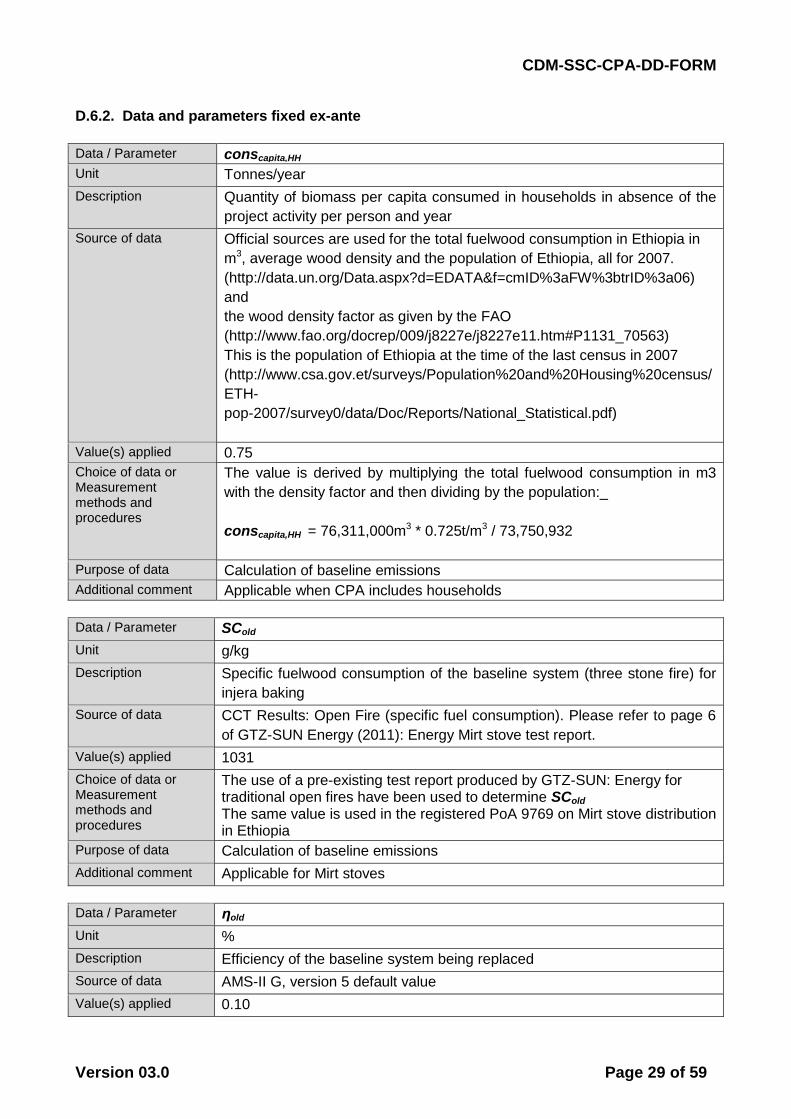
D.6.2. Data and parameters fixed ex-ante
Data / Parameter conscapita,HH
Unit Tonnes/year
Description Quantity of biomass per capita consumed in households in absence of the
project activity per person and year
Source of data Official sources are used for the total fuelwood consumption in Ethiopia in
m3, average wood density and the population of Ethiopia, all for 2007.
(http://data.un.org/Data.aspx?d=EDATA&f=cmID%3aFW%3btrID%3a06)
and
the wood density factor as given by the FAO
(http://www.fao.org/docrep/009/j8227e/j8227e11.htm#P1131_70563)
This is the population of Ethiopia at the time of the last census in 2007
(http://www.csa.gov.et/surveys/Population%20and%20Housing%20census/
ETH-
pop-2007/survey0/data/Doc/Reports/National_Statistical.pdf)
Value(s) applied 0.75
Choice of data or Measurement methods and procedures
The value is derived by multiplying the total fuelwood consumption in m3
with the density factor and then dividing by the population:_
conscapita,HH = 76,311,000m3 * 0.725t/m3 / 73,750,932
Purpose of data Calculation of baseline emissions
Additional comment Applicable when CPA includes households
Data / Parameter SCold
Unit g/kg
Description Specific fuelwood consumption of the baseline system (three stone fire) for
injera baking
Source of data CCT Results: Open Fire (specific fuel consumption). Please refer to page 6
of GTZ-SUN Energy (2011): Energy Mirt stove test report.
Value(s) applied 1031
Choice of data or Measurement methods and procedures
The use of a pre-existing test report produced by GTZ-SUN: Energy for traditional open fires have been used to determine SCold
The same value is used in the registered PoA 9769 on Mirt stove distribution in Ethiopia
Purpose of data Calculation of baseline emissions
Additional comment Applicable for Mirt stoves
Data / Parameter ηold
Unit %
Description Efficiency of the baseline system being replaced
Source of data AMS-II G, version 5 default value
Value(s) applied 0.10
CDM-SSC-CPA-DD-FORM
Version 03.0 Page 30 of 59
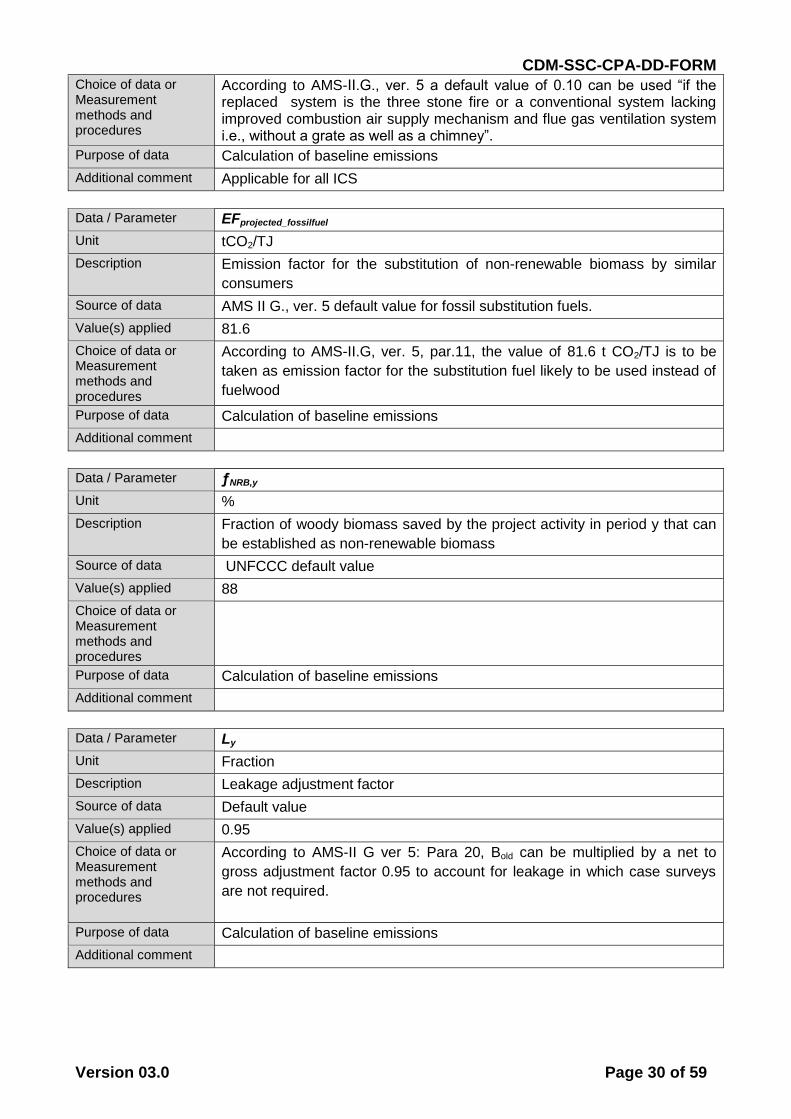
Choice of data or Measurement methods and procedures
According to AMS-II.G., ver. 5 a default value of 0.10 can be used “if the replaced system is the three stone fire or a conventional system lacking improved combustion air supply mechanism and flue gas ventilation system i.e., without a grate as well as a chimney”.
Purpose of data Calculation of baseline emissions
Additional comment Applicable for all ICS
Data / Parameter EFprojected_fossilfuel
Unit tCO2/TJ
Description Emission factor for the substitution of non-renewable biomass by similar
consumers
Source of data AMS II G., ver. 5 default value for fossil substitution fuels.
Value(s) applied 81.6
Choice of data or Measurement methods and procedures
According to AMS-II.G, ver. 5, par.11, the value of 81.6 t CO2/TJ is to be
taken as emission factor for the substitution fuel likely to be used instead of
fuelwood
Purpose of data Calculation of baseline emissions
Additional comment
Data / Parameter ƒNRB,y
Unit %
Description Fraction of woody biomass saved by the project activity in period y that can
be established as non-renewable biomass
Source of data UNFCCC default value
Value(s) applied 88
Choice of data or Measurement methods and procedures
Purpose of data Calculation of baseline emissions
Additional comment
Data / Parameter Ly
Unit Fraction
Description Leakage adjustment factor
Source of data Default value
Value(s) applied 0.95
Choice of data or Measurement methods and procedures
According to AMS-II G ver 5: Para 20, Bold can be multiplied by a net to
gross adjustment factor 0.95 to account for leakage in which case surveys
are not required.
Purpose of data Calculation of baseline emissions
Additional comment
CDM-SSC-CPA-DD-FORM
Version 03.0 Page 31 of 59
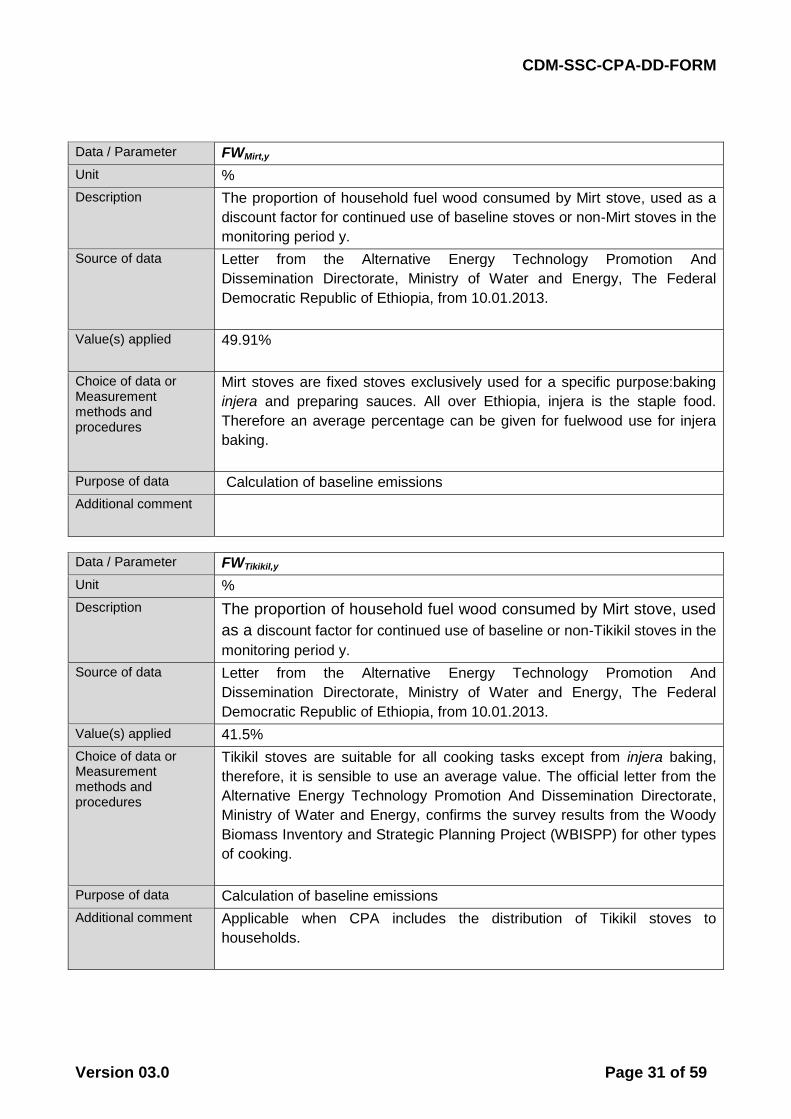
Data / Parameter FWMirt,y
Unit %
Description The proportion of household fuel wood consumed by Mirt stove, used as a
discount factor for continued use of baseline stoves or non-Mirt stoves in the
monitoring period y.
Source of data Letter from the Alternative Energy Technology Promotion And
Dissemination Directorate, Ministry of Water and Energy, The Federal
Democratic Republic of Ethiopia, from 10.01.2013.
Value(s) applied 49.91%
Choice of data or Measurement methods and procedures
Mirt stoves are fixed stoves exclusively used for a specific purpose:baking
injera and preparing sauces. All over Ethiopia, injera is the staple food.
Therefore an average percentage can be given for fuelwood use for injera
baking.
Purpose of data Calculation of baseline emissions
Additional comment
Data / Parameter FWTikikil,y
Unit %
Description The proportion of household fuel wood consumed by Mirt stove, used
as a discount factor for continued use of baseline or non-Tikikil stoves in the
monitoring period y.
Source of data Letter from the Alternative Energy Technology Promotion And
Dissemination Directorate, Ministry of Water and Energy, The Federal
Democratic Republic of Ethiopia, from 10.01.2013.
Value(s) applied 41.5%
Choice of data or Measurement methods and procedures
Tikikil stoves are suitable for all cooking tasks except from injera baking,
therefore, it is sensible to use an average value. The official letter from the
Alternative Energy Technology Promotion And Dissemination Directorate,
Ministry of Water and Energy, confirms the survey results from the Woody
Biomass Inventory and Strategic Planning Project (WBISPP) for other types
of cooking.
Purpose of data Calculation of baseline emissions
Additional comment Applicable when CPA includes the distribution of Tikikil stoves to
households.
CDM-SSC-CPA-DD-FORM
Version 03.0 Page 32 of 59
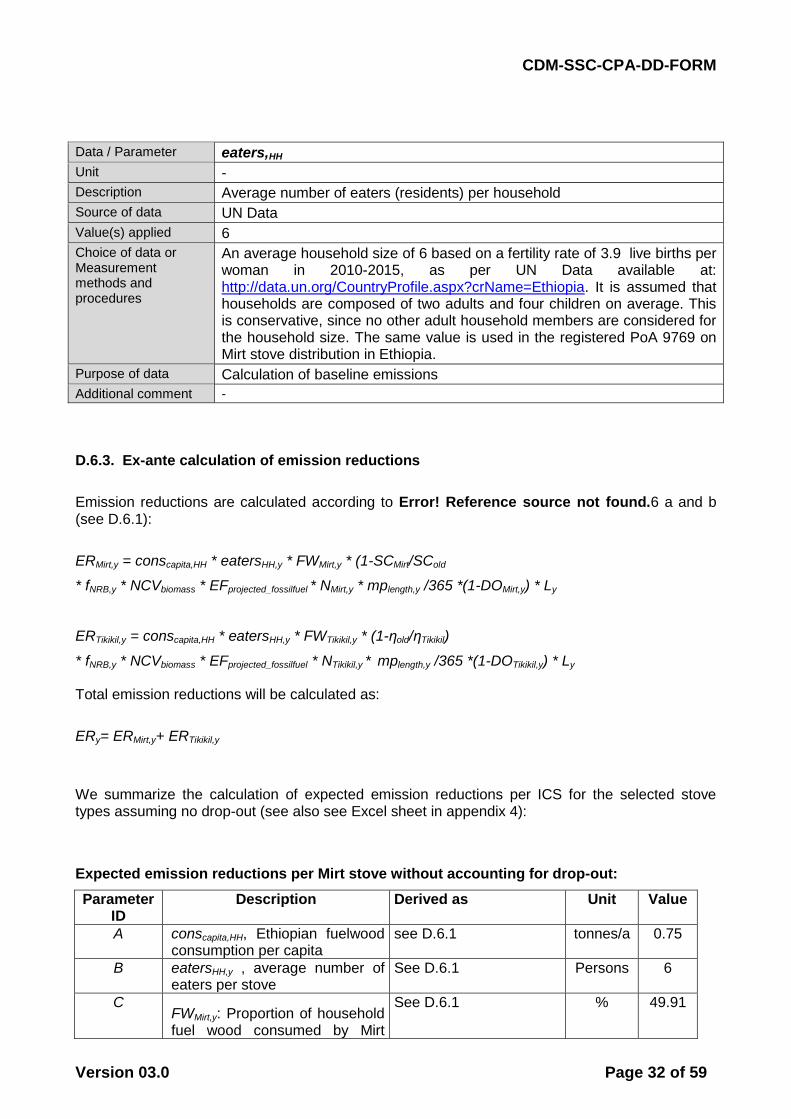
Data / Parameter eaters,HH
Unit -
Description Average number of eaters (residents) per household
Source of data UN Data
Value(s) applied 6
Choice of data or Measurement methods and procedures
An average household size of 6 based on a fertility rate of 3.9 live births per woman in 2010-2015, as per UN Data available at: http://data.un.org/CountryProfile.aspx?crName=Ethiopia. It is assumed that households are composed of two adults and four children on average. This is conservative, since no other adult household members are considered for the household size. The same value is used in the registered PoA 9769 on Mirt stove distribution in Ethiopia.
Purpose of data Calculation of baseline emissions
Additional comment -
D.6.3. Ex-ante calculation of emission reductions
Emission reductions are calculated according to Error! Reference source not found.6 a and b (see D.6.1):
ERMirt,y = conscapita,HH * eatersHH,y * FWMirt,y * (1-SCMirt/SCold
* fNRB,y * NCVbiomass * EFprojected_fossilfuel * NMirt,y * mplength,y /365 *(1-DOMirt,y) * Ly
ERTikikil,y = conscapita,HH * eatersHH,y * FWTikikil,y * (1-ηold/ηTikikil)
* fNRB,y * NCVbiomass * EFprojected_fossilfuel * NTikikil,y * mplength,y /365 *(1-DOTikikil,y) * Ly Total emission reductions will be calculated as:
ERy= ERMirt,y+ ERTikikil,y
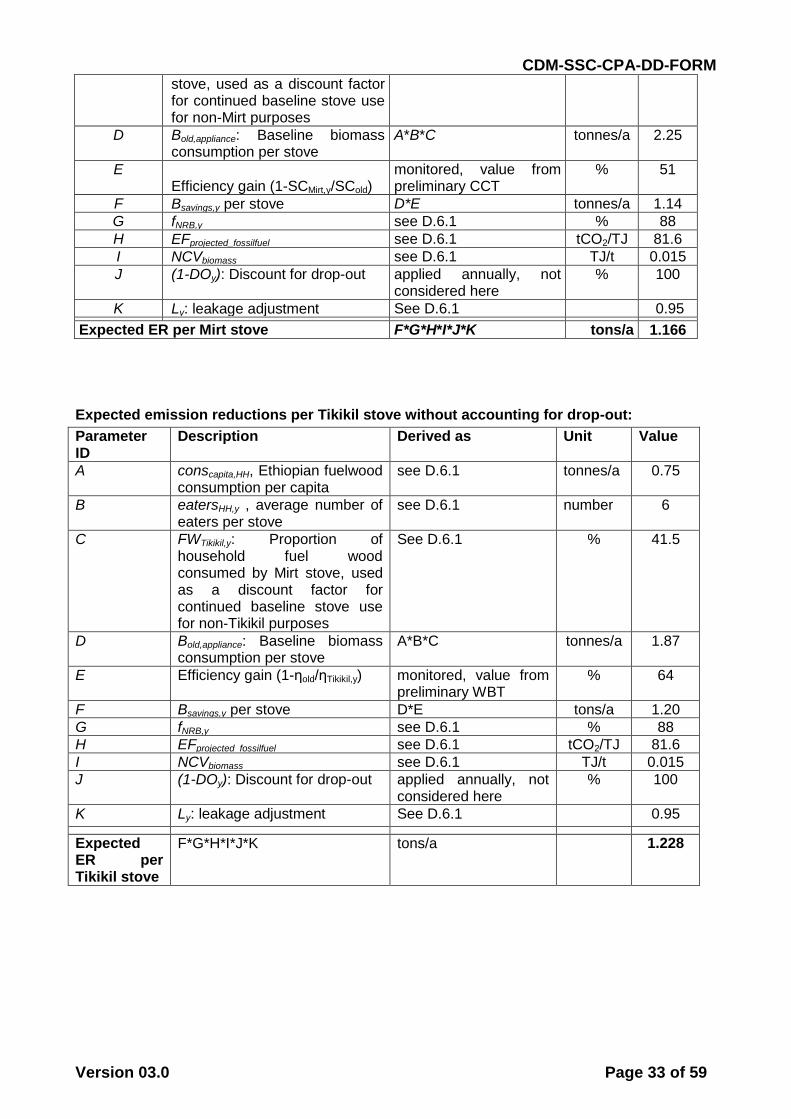
We summarize the calculation of expected emission reductions per ICS for the selected stove types assuming no drop-out (see also see Excel sheet in appendix 4):
Expected emission reductions per Mirt stove without accounting for drop-out:
Parameter ID
Description Derived as Unit Value
A conscapita,HH, Ethiopian fuelwood consumption per capita
see D.6.1 tonnes/a 0.75
B eatersHH,y , average number of eaters per stove
See D.6.1 Persons 6
C FWMirt,y: Proportion of household fuel wood consumed by Mirt
See D.6.1 % 49.91
CDM-SSC-CPA-DD-FORM
Version 03.0 Page 33 of 59
stove, used as a discount factor for continued baseline stove use for non-Mirt purposes
D Bold,appliance: Baseline biomass consumption per stove
A*B*C tonnes/a 2.25
E Efficiency gain (1-SCMirt,y/SCold)
monitored, value from preliminary CCT
% 51
F Bsavings,y per stove D*E tonnes/a 1.14
G fNRB,y see D.6.1 % 88
H EFprojected_fossilfuel see D.6.1 tCO2/TJ 81.6
I NCVbiomass see D.6.1 TJ/t 0.015
J (1-DOy): Discount for drop-out applied annually, not considered here
% 100
K Ly: leakage adjustment See D.6.1 0.95
Expected ER per Mirt stove F*G*H*I*J*K tons/a 1.166
Expected emission reductions per Tikikil stove without accounting for drop-out:
Parameter ID
Description Derived as Unit Value
A conscapita,HH, Ethiopian fuelwood consumption per capita
see D.6.1 tonnes/a 0.75
B eatersHH,y , average number of eaters per stove
see D.6.1 number 6
C FWTikikil,y: Proportion of household fuel wood consumed by Mirt stove, used as a discount factor for continued baseline stove use for non-Tikikil purposes
See D.6.1 % 41.5
D Bold,appliance: Baseline biomass consumption per stove
A*B*C tonnes/a 1.87
E Efficiency gain (1-ηold/ηTikikil,y) monitored, value from preliminary WBT
% 64
F Bsavings,y per stove D*E tons/a 1.20
G fNRB,y see D.6.1 % 88
H EFprojected_fossilfuel see D.6.1 tCO2/TJ 81.6
I NCVbiomass see D.6.1 TJ/t 0.015
J (1-DOy): Discount for drop-out applied annually, not considered here
% 100
K Ly: leakage adjustment See D.6.1 0.95
Expected ER per Tikikil stove
F*G*H*I*J*K tons/a 1.228
CDM-SSC-CPA-DD-FORM
Version 03.0 Page 34 of 59
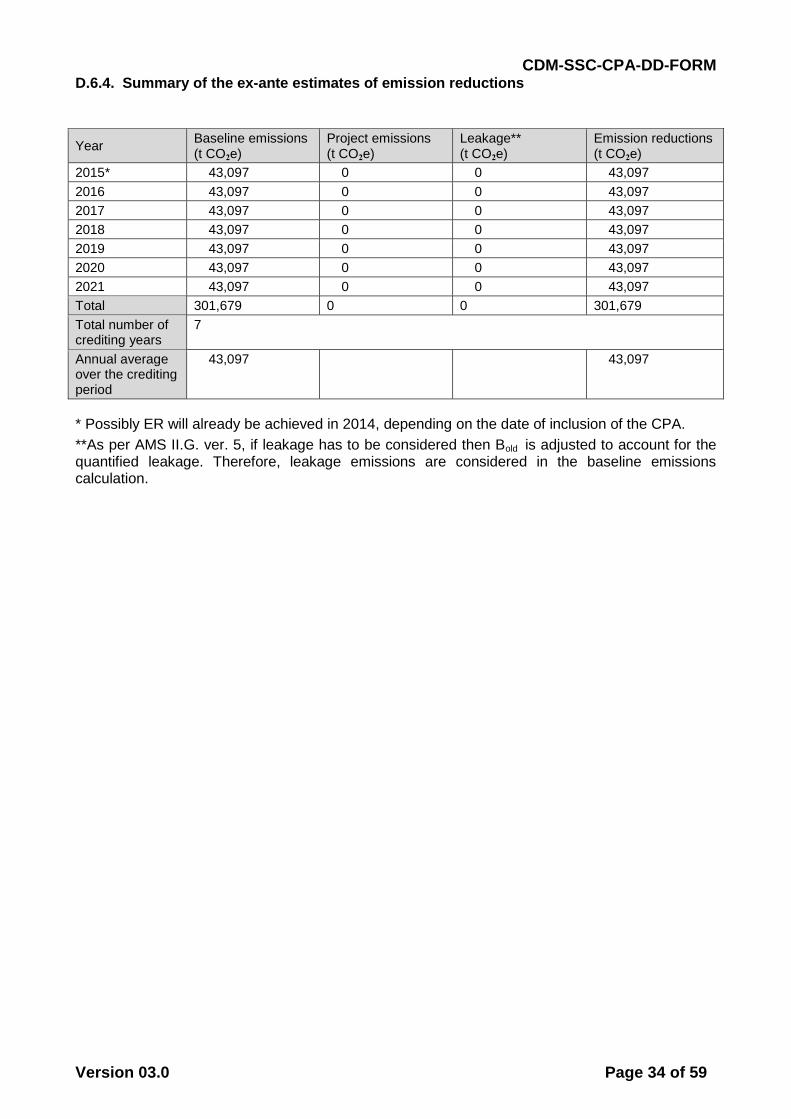
D.6.4. Summary of the ex-ante estimates of emission reductions
Year Baseline emissions (t CO2e)
Project emissions (t CO2e)
Leakage** (t CO2e)
Emission reductions (t CO2e)
2015* 43,097 0 0 43,097
2016 43,097 0 0 43,097
2017 43,097 0 0 43,097
2018 43,097 0 0 43,097
2019 43,097 0 0 43,097
2020 43,097 0 0 43,097
2021 43,097 0 0 43,097
Total 301,679 0 0 301,679
Total number of crediting years
7
Annual average over the crediting period
43,097 43,097
* Possibly ER will already be achieved in 2014, depending on the date of inclusion of the CPA.
**As per AMS II.G. ver. 5, if leakage has to be considered then Bold is adjusted to account for the quantified leakage. Therefore, leakage emissions are considered in the baseline emissions calculation.
CDM-SSC-CPA-DD-FORM
Version 03.0 Page 35 of 59
D.7. Application of the monitoring methodology and description of the monitoring plan
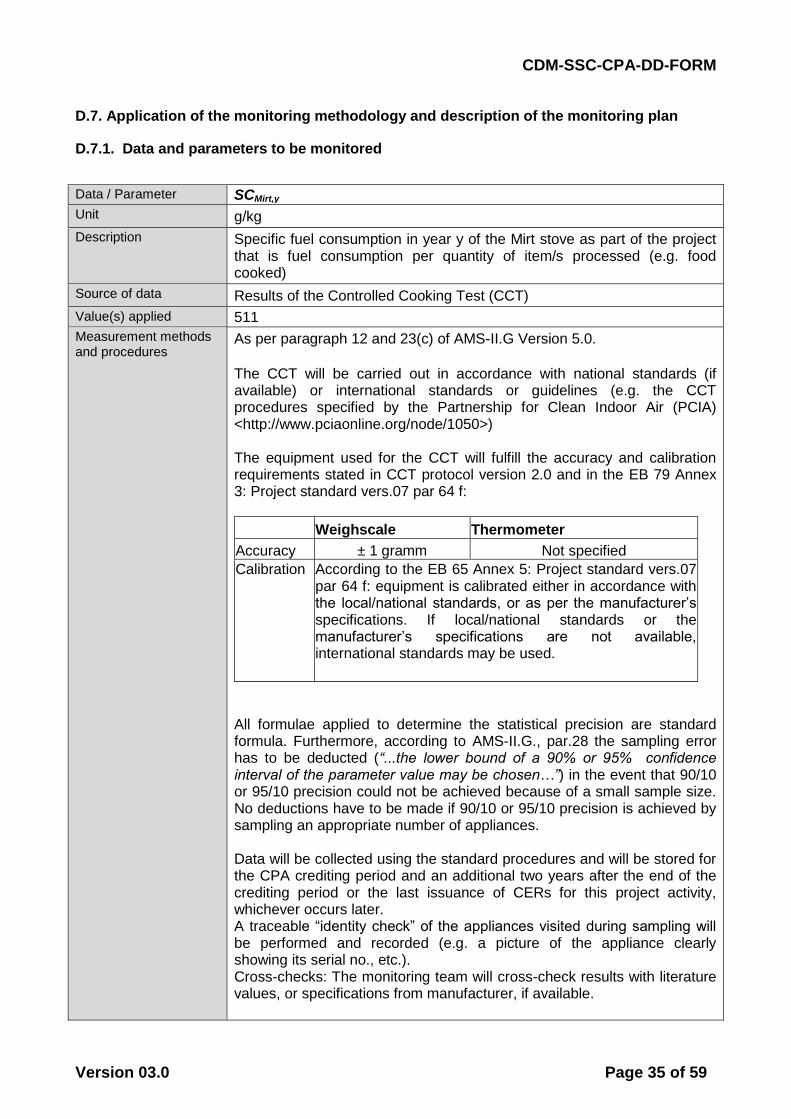
D.7.1. Data and parameters to be monitored
Data / Parameter SCMirt,y
Unit g/kg
Description Specific fuel consumption in year y of the Mirt stove as part of the project that is fuel consumption per quantity of item/s processed (e.g. food cooked)
Source of data Results of the Controlled Cooking Test (CCT)
Value(s) applied 511
Measurement methods and procedures
As per paragraph 12 and 23(c) of AMS-II.G Version 5.0.
The CCT will be carried out in accordance with national standards (if available) or international standards or guidelines (e.g. the CCT procedures specified by the Partnership for Clean Indoor Air (PCIA) <http://www.pciaonline.org/node/1050>) The equipment used for the CCT will fulfill the accuracy and calibration requirements stated in CCT protocol version 2.0 and in the EB 79 Annex 3: Project standard vers.07 par 64 f:
Weighscale Thermometer
Accuracy ± 1 gramm Not specified
Calibration According to the EB 65 Annex 5: Project standard vers.07 par 64 f: equipment is calibrated either in accordance with the local/national standards, or as per the manufacturer’s specifications. If local/national standards or the manufacturer’s specifications are not available, international standards may be used.
All formulae applied to determine the statistical precision are standard formula. Furthermore, according to AMS-II.G., par.28 the sampling error has to be deducted (“...the lower bound of a 90% or 95% confidence interval of the parameter value may be chosen…”) in the event that 90/10 or 95/10 precision could not be achieved because of a small sample size. No deductions have to be made if 90/10 or 95/10 precision is achieved by sampling an appropriate number of appliances. Data will be collected using the standard procedures and will be stored for the CPA crediting period and an additional two years after the end of the crediting period or the last issuance of CERs for this project activity, whichever occurs later. A traceable “identity check” of the appliances visited during sampling will be performed and recorded (e.g. a picture of the appliance clearly showing its serial no., etc.). Cross-checks: The monitoring team will cross-check results with literature values, or specifications from manufacturer, if available.
CDM-SSC-CPA-DD-FORM
Version 03.0 Page 36 of 59
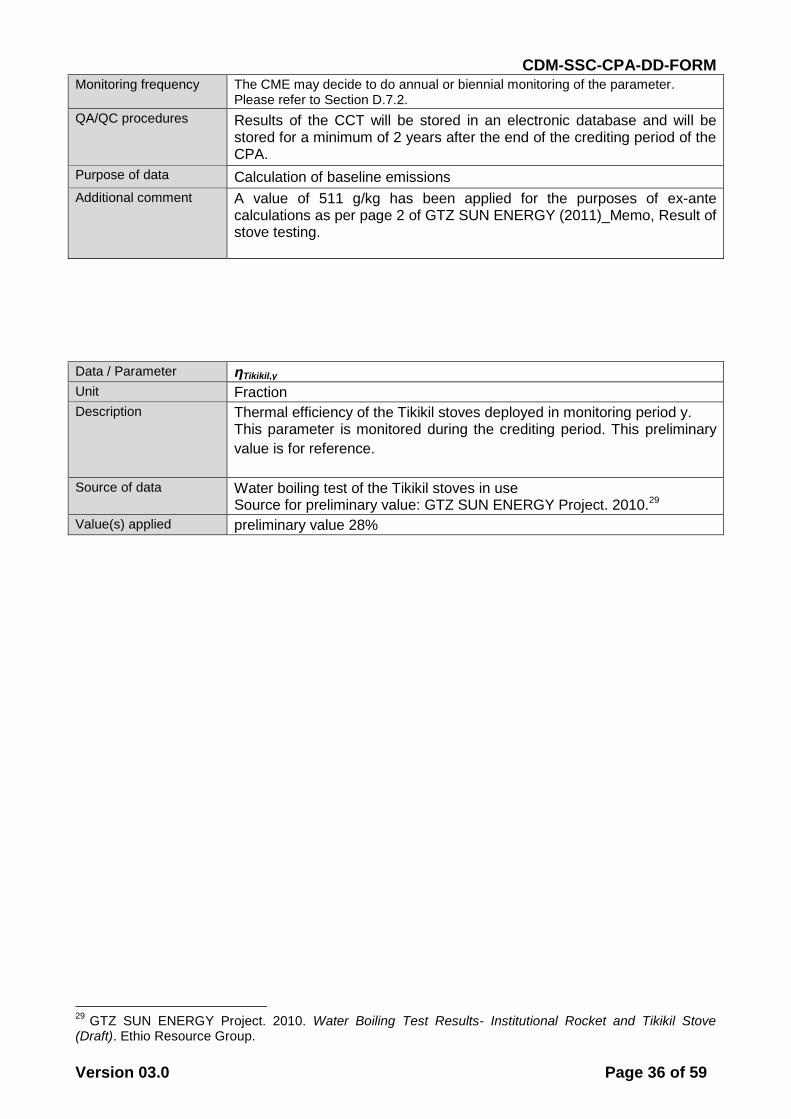
Monitoring frequency The CME may decide to do annual or biennial monitoring of the parameter. Please refer to Section D.7.2.
QA/QC procedures Results of the CCT will be stored in an electronic database and will be stored for a minimum of 2 years after the end of the crediting period of the CPA.
Purpose of data Calculation of baseline emissions
Additional comment A value of 511 g/kg has been applied for the purposes of ex-ante calculations as per page 2 of GTZ SUN ENERGY (2011)_Memo, Result of stove testing.
Data / Parameter ηTikikil,y
Unit Fraction
Description Thermal efficiency of the Tikikil stoves deployed in monitoring period y. This parameter is monitored during the crediting period. This preliminary
value is for reference.
Source of data Water boiling test of the Tikikil stoves in use Source for preliminary value: GTZ SUN ENERGY Project. 2010.29
Value(s) applied preliminary value 28%
29
GTZ SUN ENERGY Project. 2010. Water Boiling Test Results- Institutional Rocket and Tikikil Stove (Draft). Ethio Resource Group.
CDM-SSC-CPA-DD-FORM
Version 03.0 Page 37 of 59
Measurement methods and procedures
The data will be derived from applying the WBT ver. 4.2.3 30as by AMS-II.G to a representative sample of Tikikil stoves distributed. The equipment used for the WBT will fulfill the accuracy and calibration requirements stated in WBT protocol version 4.2.3 and in the EB 79 Annex 3: Project standard vers.07 par 64 f:
Weighscale Thermometer
Accuracy ± 1 gramm 0.5 °C
Calibration According to the EB 65 Annex 5: Project standard vers.07 par 64 f: equipment is calibrated either in accordance with the local/national standards, or as per the manufacturer’s specifications. If local/national standards or the manufacturer’s specifications are not available, international standards may be used.
All formulae applied to determine the statistical precision are standard formula. Furthermore, according to AMS-II.G., par.28 the sampling error has to be deducted (“...the lower bound of a 90% or 95% confidence interval of the parameter value may be chosen…”) in the event that 90/10 or 95/10 precision could not be achieved because of a small sample size. No deductions have to be made if 90/10 or 95/10 precision is achieved by sampling an appropriate number of appliances. Data will be collected using the standard procedures and will be stored for the CPA crediting period and an additional two years after the end of the crediting period or the last issuance of CERs for this project activity, whichever occurs later. A traceable “identity check” of the appliances visited during sampling shall be performed and recorded (e.g. a picture of the appliance clearly showing its serial no., etc.). Cross-checks: The monitoring team will cross-check results with literature values, or specifications from manufacturer, if available.
Monitoring frequency The CME may decide to do annual or biennial monitoring of the parameter. Please refer to Section D.7.2.
QA/QC procedures Results of the WBT will be stored in an electronic database and will be stored for a minimum of 2 years after the end of the crediting period of the CPA.
Purpose of data Calculation of baseline emissions
Additional comment Applicable to CPAs including Tikikil stoves
Data / Parameter NMirt,y
Unit n/a
Description Number of efficient Mirt stoves distributed until the end of the monitoring period y adjusted by implementation dates. The adjustment accounts for the fact that stoves do not start to save CO2 simultaneously, but each stove starts saving CO2 as soon as it is sold and implemented.
Source of data Sales Record Database
Value(s) applied Will be determined during monitoring. Assumption for ex-ante Emission Calculation: See D.6.3.
30
30
http://www.cleancookstoves.org/our-work/standards-and-testing/learn-about-testing-protocols/
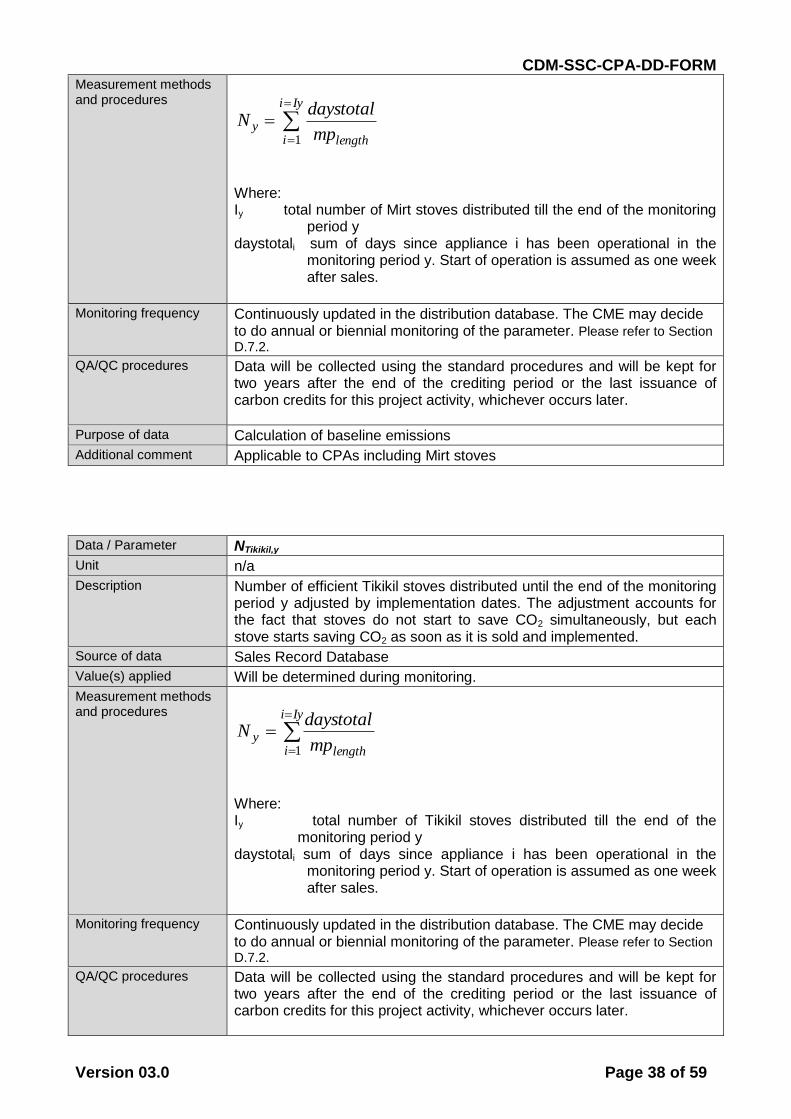
CDM-SSC-CPA-DD-FORM
Version 03.0 Page 38 of 59
Measurement methods and procedures
Iyi
i lengthy
mp
daystotalN
1
Where: Iy total number of Mirt stoves distributed till the end of the monitoring
period y daystotali sum of days since appliance i has been operational in the
monitoring period y. Start of operation is assumed as one week after sales.
Monitoring frequency Continuously updated in the distribution database. The CME may decide to do annual or biennial monitoring of the parameter. Please refer to Section D.7.2.
QA/QC procedures Data will be collected using the standard procedures and will be kept for two years after the end of the crediting period or the last issuance of carbon credits for this project activity, whichever occurs later.
Purpose of data Calculation of baseline emissions
Additional comment Applicable to CPAs including Mirt stoves
Data / Parameter NTikikil,y
Unit n/a
Description Number of efficient Tikikil stoves distributed until the end of the monitoring period y adjusted by implementation dates. The adjustment accounts for the fact that stoves do not start to save CO2 simultaneously, but each stove starts saving CO2 as soon as it is sold and implemented.
Source of data Sales Record Database
Value(s) applied Will be determined during monitoring.
Measurement methods and procedures
Iyi
i lengthy
mp
daystotalN
1
Where: Iy total number of Tikikil stoves distributed till the end of the
monitoring period y daystotali sum of days since appliance i has been operational in the
monitoring period y. Start of operation is assumed as one week after sales.
Monitoring frequency Continuously updated in the distribution database. The CME may decide to do annual or biennial monitoring of the parameter. Please refer to Section D.7.2.
QA/QC procedures Data will be collected using the standard procedures and will be kept for two years after the end of the crediting period or the last issuance of carbon credits for this project activity, whichever occurs later.
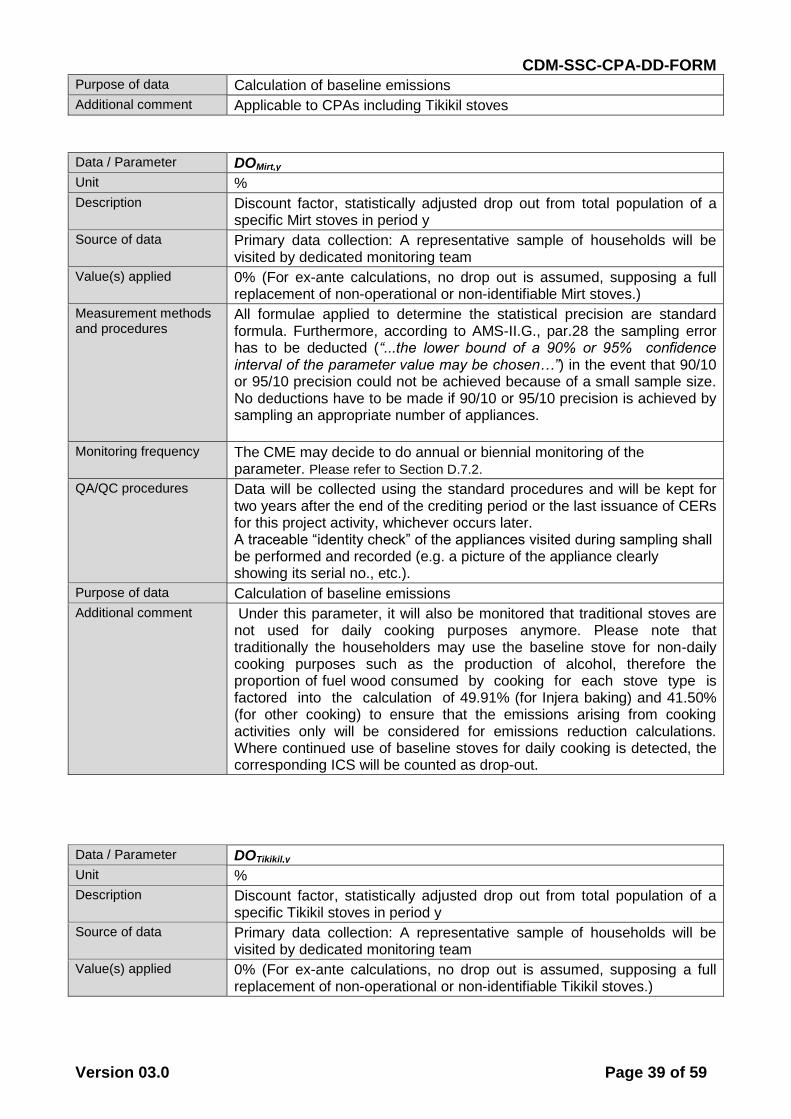
CDM-SSC-CPA-DD-FORM
Version 03.0 Page 39 of 59
Purpose of data Calculation of baseline emissions
Additional comment Applicable to CPAs including Tikikil stoves
Data / Parameter DOMirt,y
Unit %
Description Discount factor, statistically adjusted drop out from total population of a specific Mirt stoves in period y
Source of data Primary data collection: A representative sample of households will be visited by dedicated monitoring team
Value(s) applied 0% (For ex-ante calculations, no drop out is assumed, supposing a full replacement of non-operational or non-identifiable Mirt stoves.)
Measurement methods and procedures
All formulae applied to determine the statistical precision are standard formula. Furthermore, according to AMS-II.G., par.28 the sampling error has to be deducted (“...the lower bound of a 90% or 95% confidence interval of the parameter value may be chosen…”) in the event that 90/10 or 95/10 precision could not be achieved because of a small sample size. No deductions have to be made if 90/10 or 95/10 precision is achieved by sampling an appropriate number of appliances.
Monitoring frequency The CME may decide to do annual or biennial monitoring of the parameter. Please refer to Section D.7.2.
QA/QC procedures Data will be collected using the standard procedures and will be kept for two years after the end of the crediting period or the last issuance of CERs for this project activity, whichever occurs later. A traceable “identity check” of the appliances visited during sampling shall be performed and recorded (e.g. a picture of the appliance clearly showing its serial no., etc.).
Purpose of data Calculation of baseline emissions
Additional comment Under this parameter, it will also be monitored that traditional stoves are not used for daily cooking purposes anymore. Please note that traditionally the householders may use the baseline stove for non-daily cooking purposes such as the production of alcohol, therefore the proportion of fuel wood consumed by cooking for each stove type is factored into the calculation of 49.91% (for Injera baking) and 41.50% (for other cooking) to ensure that the emissions arising from cooking activities only will be considered for emissions reduction calculations. Where continued use of baseline stoves for daily cooking is detected, the corresponding ICS will be counted as drop-out.
Data / Parameter DOTikikil,y
Unit %
Description Discount factor, statistically adjusted drop out from total population of a specific Tikikil stoves in period y
Source of data Primary data collection: A representative sample of households will be visited by dedicated monitoring team
Value(s) applied 0% (For ex-ante calculations, no drop out is assumed, supposing a full replacement of non-operational or non-identifiable Tikikil stoves.)
CDM-SSC-CPA-DD-FORM
Version 03.0 Page 40 of 59
Measurement methods and procedures
All formulae applied to determine the statistical precision are standard formula. Furthermore, according to AMS-II.G., par.28 the sampling error has to be deducted (“...the lower bound of a 90% or 95% confidence interval of the parameter value may be chosen…”) in the event that 90/10 or 95/10 precision could not be achieved because of a small sample size. No deductions have to be made if 90/10 or 95/10 precision is achieved by sampling an appropriate number of appliances.
Monitoring frequency The CME may decide to do annual or biennial monitoring of the parameter. Please refer to Section D.7.2.
QA/QC procedures Data will be collected using the standard procedures and will be kept for two years after the end of the crediting period or the last issuance of CERs for this project activity, whichever occurs later. A traceable “identity check” of the appliances visited during sampling shall be performed and recorded (e.g. a picture of the appliance clearly showing its serial no., etc.).
Purpose of data Calculation of baseline emissions
Additional comment Under this parameter, it will also be monitored that traditional stoves are not used for daily cooking purposes anymore. Please note that traditionally the householders may use the baseline stove for non-daily cooking purposes such as the production of alcohol, therefore the proportion of fuel wood consumed by cooking for each stove type is factored into the calculation of 49.91% (for Injera baking) and 41.50% (for other cooking) to ensure that the emissions arising from cooking activities only will be considered for emissions reduction calculations. Where continued use of baseline stoves for daily cooking is detected, the corresponding ICS will be counted as drop-out.
D.7.2. Description of the monitoring plan
There will be a continuous documentation of all ICS distributions in a centralized database. For the preparation of monitoring reports, samples will be drawn from the centralized database and the corresponding stoves will be examined regarding efficiency and usage. The CME will hold the responsibility for all procedures related to monitoring, but it will cooperate with regional or local institutions involved in ICS distribution. The flow chart below describes the general monitoring procedure (Figure 8).
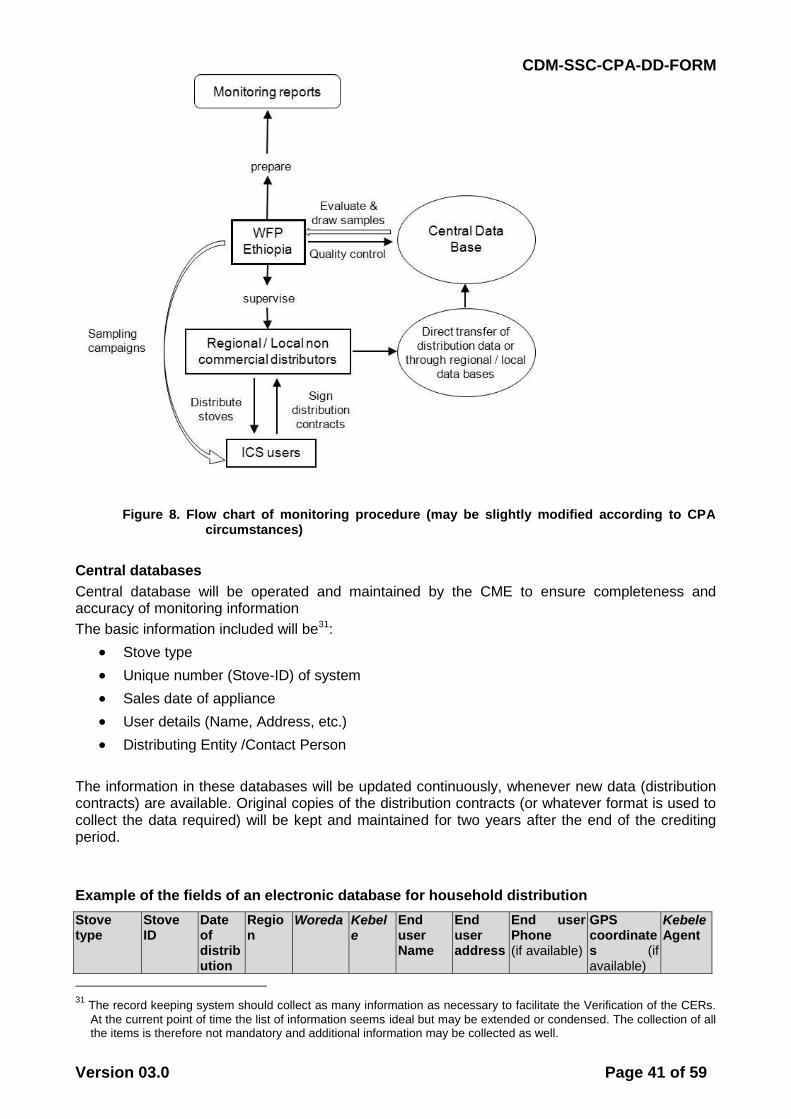
CDM-SSC-CPA-DD-FORM
Version 03.0 Page 41 of 59
Figure 8. Flow chart of monitoring procedure (may be slightly modified according to CPA circumstances)
Central databases
Central database will be operated and maintained by the CME to ensure completeness and accuracy of monitoring information
The basic information included will be31:
Stove type
Unique number (Stove-ID) of system
Sales date of appliance
User details (Name, Address, etc.)
Distributing Entity /Contact Person
The information in these databases will be updated continuously, whenever new data (distribution contracts) are available. Original copies of the distribution contracts (or whatever format is used to collect the data required) will be kept and maintained for two years after the end of the crediting period.
Example of the fields of an electronic database for household distribution
Stove type
Stove ID
Date of distribution
Region
Woreda Kebele
End user Name
End user address
End user Phone (if available)
GPS coordinates (if available)
Kebele Agent
31
The record keeping system should collect as many information as necessary to facilitate the Verification of the CERs.
At the current point of time the list of information seems ideal but may be extended or condensed. The collection of all the items is therefore not mandatory and additional information may be collected as well.
CDM-SSC-CPA-DD-FORM
Version 03.0 Page 42 of 59
Stove IDs
Each ICS will obtain a unique number which facilitates its identification in the data base and avoid double counting. These unique numbers will be provided by the CME and shall be inserted in the distribution contract at the moment of distributing the stove. It is planned to make the unique numbers visible on the ICSs, for example blowtorching numbers on the stove material for Tikikil stoves. For Mirt stoves that are built-in, IDs may also be attached somewhere at the house where it is installed in. Physical labels shall facilitate stove identification and shall be used where possible, but identification may also be achieved through other data indicated in the data base in the case of the built-in Mirt stoves.
Sampling campaigns
Sampling campaigns consist in generating extracts of the central database for checks in order to prepare the monitoring reports. A representative number of ICSs will be selected randomly for site visits in order to check the following monitoring parameters:
operability (yes/no), in order to determine the drop out rates for a specific stove (DOICS,y). Under this parameter, it will also be monitored that traditional stoves are not used for cooking purposes anymore. Please note that traditionally the householders may use the baseline stove for non-cooking purposes such as the production of alcohol, therefore the proportion of fuel wood consumed by cooking for each stove type is factored into the calculation of 49.91% (for Injera baking) and 41.50% (for other cooking) to ensure that the emissions arising from cooking activities only will be considered for emissions reduction calculations. Where continued use of baseline stoves for cooking is detected, the corresponding ICS will be counted as drop-out.
thermal efficiency (ηTikikil,y) and specific fuelwood consumtion (SCMirt,y) of a specific stove,
tested according to the Water Boiling Test protocol, or the Controlled Cooking Test respectively.
.
number of eaters per ICS distributed at the household level, (eatersHH,y), if not fixed before CPA inclusion
Different sample sizes can be selected for each of these parameters.
Sampling Plan
The Sampling Plan outlined below is in accordance with Appendix 3 of the standard for sampling and surveys for CDM project activities and programme of activities (EB 69 Annex 4).
1. Sampling Design
a. Objective and Reliability Requirements
i. Objective of the sampling effort
Due to the high number of appliances to be deployed an annual check of all appliances is not feasible.
Sampling is utilized to indicate that all the appliances deployed are still operating or to record end of operation and/or replacement of the appliances which will allow determination of the statistically adjusted annual or biennial value for drop out (DOICS,y). In cases where non-functional ICSs are
CDM-SSC-CPA-DD-FORM
Version 03.0 Page 43 of 59
replaced, this replacement will be made with new appliances; thereby it is guaranteed that replaced stoves operate at high efficiency.
Sampling methods may also be applied to determine the annual or biennial values for the thermal efficiencies of the ICSs in use (ηTikikil and SCMirt).
Therefore the sampling effort will provide data for the following parameters:
DOi,y, ηTikikil and SCMirt,y.
ii. Timeframe
The time frame for the parameters, i.e. annual or biennial, depends on selected inspection frequency which is at discretion of CME provided confidence/precision requirements are met, according to AMS-II.G., par. 28.
iii. Estimated parameter values
The estimated parameter values are as per the values used for ex-ante calculation of emission reductions (please refer to Section B.6.2. of the CPA-DD).
iv. Sampling requirements as per sampling standard and applicable
methodology
Precedence of methodology
Par. 3 of the Sampling Standard, EB 50 Annex 30 STAN, version 4.1 including Amendment to version 4.1 EB 80 Annex 07 clarifies that “[…] any requirements specified in the applicable
methodologies having precedence”.
Coverage of sampling requirements in the applicable methodology:
As per applicable methodology AMS-II.G. ver 5, par. 28, “when biennial inspection is chosen a 95% confidence interval and a 5% margin of error requirement shall be achieved for the sampling parameter. On the other hand when the project proponent chooses to inspect annually, a 90% confidence interval and a 10% margin of error requirement shall be achieved for the sampled parameters. In cases where survey results indicate that 90/10 precision or 95/10 precision is not achieved, the lower bound of a 90% or 95% confidence interval of the parameter value may be chosen as an alternative to repeating the survey efforts to achieve the 90/10 or 95/10 precision”.
Additional requirement for PoAs as per sampling standard
In case a single sampling plan for more than one CPA is used, “parameter values shall be estimated
by sampling in accordance with the requirements in the applied methodology separately and independently
for each of the CPAs included in a PoA except when a single sampling plan covering a group of CPAs is
undertaken applying 95/10 confidence/precision for the sample size calculation”, as per sampling standard,
EB 50 Annex 30 STAN, version 4.1 including Amendment to version 4.1 EB 80 Annex 07.
Furthermore, according to par. 37. EB 55 Annex 38 (PROCEDURES FOR REGISTRATION OF A PROGRAMME OF ACTIVITIES)32 a request for issuance includes all CPAs which are included under the PoA. Sampling may therefore be across CPAs and hence a single sample plan may be applied, to reduce monitoring efforts.
v. Confidence/precision criteria to be met
As mentioned above, according to AMS-II.G,ver 5, par. 28, confidence/precision criteria to be met is determined as follows:
32
UNFCCC (2010)_PROCEDURES FOR REGISTRATION OF A PROGRAMME OF ACTIVITIES_ EB 55, Annex 38, http://cdm.unfccc.int/Reference/Procedures/PoA_proc01.pdf
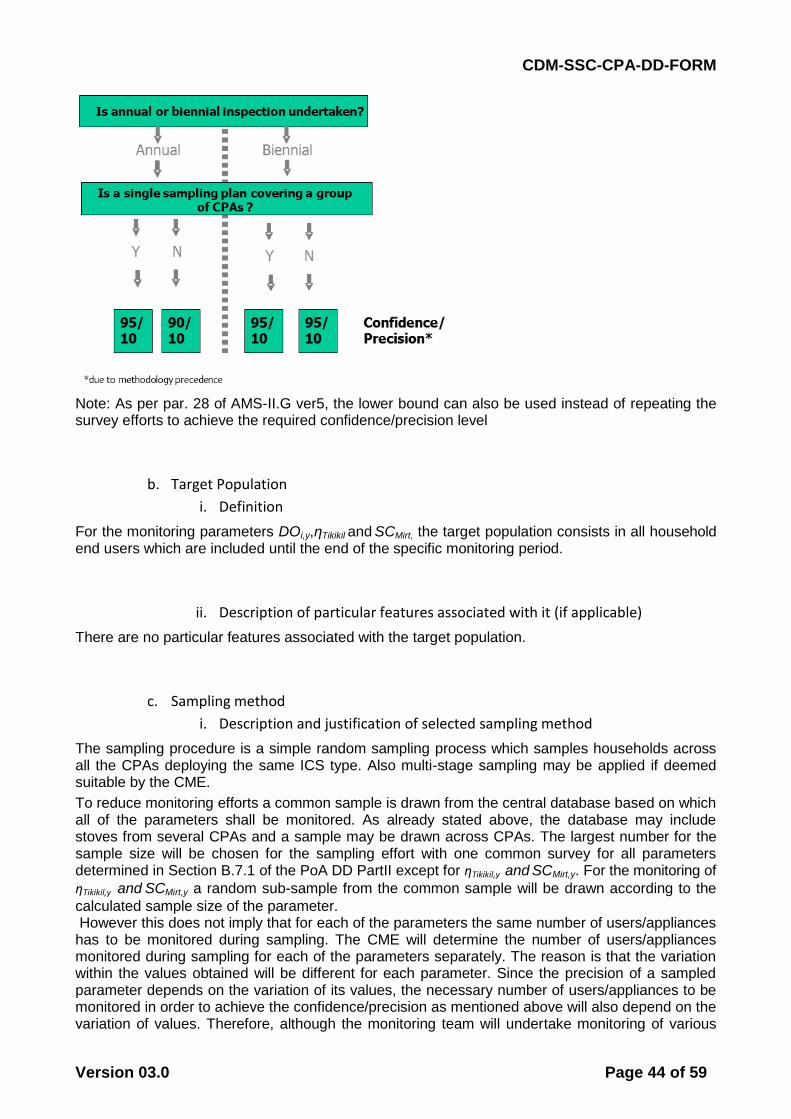
CDM-SSC-CPA-DD-FORM
Version 03.0 Page 44 of 59
Note: As per par. 28 of AMS-II.G ver5, the lower bound can also be used instead of repeating the survey efforts to achieve the required confidence/precision level
b. Target Population
i. Definition
For the monitoring parameters DOi,y,ηTikikil and SCMirt, the target population consists in all household end users which are included until the end of the specific monitoring period.
ii. Description of particular features associated with it (if applicable)
There are no particular features associated with the target population.
c. Sampling method
i. Description and justification of selected sampling method
The sampling procedure is a simple random sampling process which samples households across all the CPAs deploying the same ICS type. Also multi-stage sampling may be applied if deemed suitable by the CME.
To reduce monitoring efforts a common sample is drawn from the central database based on which all of the parameters shall be monitored. As already stated above, the database may include stoves from several CPAs and a sample may be drawn across CPAs. The largest number for the sample size will be chosen for the sampling effort with one common survey for all parameters determined in Section B.7.1 of the PoA DD PartII except for ηTikikil,y and SCMirt,y. For the monitoring of
ηTikikil,y and SCMirt,y a random sub-sample from the common sample will be drawn according to the
calculated sample size of the parameter. However this does not imply that for each of the parameters the same number of users/appliances has to be monitored during sampling. The CME will determine the number of users/appliances monitored during sampling for each of the parameters separately. The reason is that the variation within the values obtained will be different for each parameter. Since the precision of a sampled parameter depends on the variation of its values, the necessary number of users/appliances to be monitored in order to achieve the confidence/precision as mentioned above will also depend on the variation of values. Therefore, although the monitoring team will undertake monitoring of various
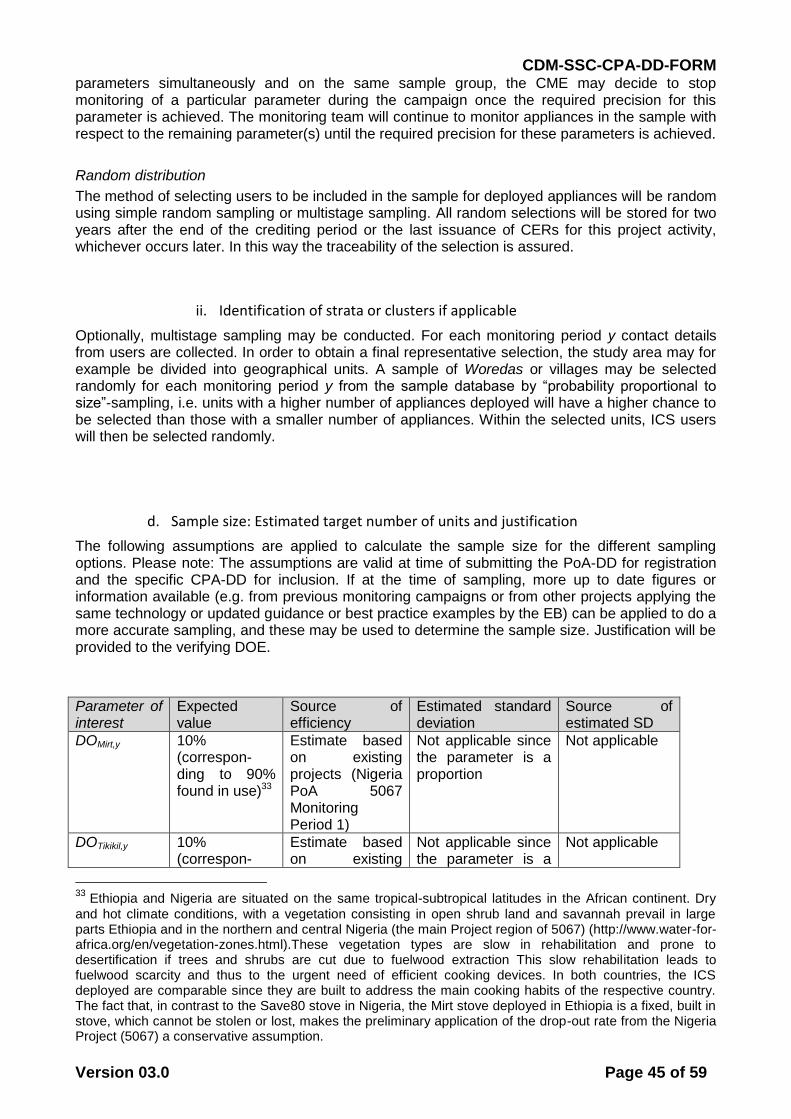
CDM-SSC-CPA-DD-FORM
Version 03.0 Page 45 of 59
parameters simultaneously and on the same sample group, the CME may decide to stop monitoring of a particular parameter during the campaign once the required precision for this parameter is achieved. The monitoring team will continue to monitor appliances in the sample with respect to the remaining parameter(s) until the required precision for these parameters is achieved.
Random distribution
The method of selecting users to be included in the sample for deployed appliances will be random using simple random sampling or multistage sampling. All random selections will be stored for two years after the end of the crediting period or the last issuance of CERs for this project activity, whichever occurs later. In this way the traceability of the selection is assured.
ii. Identification of strata or clusters if applicable
Optionally, multistage sampling may be conducted. For each monitoring period y contact details from users are collected. In order to obtain a final representative selection, the study area may for example be divided into geographical units. A sample of Woredas or villages may be selected randomly for each monitoring period y from the sample database by “probability proportional to size”-sampling, i.e. units with a higher number of appliances deployed will have a higher chance to be selected than those with a smaller number of appliances. Within the selected units, ICS users will then be selected randomly.
d. Sample size: Estimated target number of units and justification
The following assumptions are applied to calculate the sample size for the different sampling options. Please note: The assumptions are valid at time of submitting the PoA-DD for registration and the specific CPA-DD for inclusion. If at the time of sampling, more up to date figures or information available (e.g. from previous monitoring campaigns or from other projects applying the same technology or updated guidance or best practice examples by the EB) can be applied to do a more accurate sampling, and these may be used to determine the sample size. Justification will be provided to the verifying DOE.
Parameter of interest
Expected value
Source of efficiency
Estimated standard deviation
Source of estimated SD
DOMirt,y 10% (correspon-ding to 90% found in use)33
Estimate based on existing projects (Nigeria PoA 5067 Monitoring Period 1)
Not applicable since the parameter is a proportion
Not applicable
DOTikikil,y 10% (correspon-
Estimate based on existing
Not applicable since the parameter is a
Not applicable
33 Ethiopia and Nigeria are situated on the same tropical-subtropical latitudes in the African continent. Dry
and hot climate conditions, with a vegetation consisting in open shrub land and savannah prevail in large parts Ethiopia and in the northern and central Nigeria (the main Project region of 5067) (http://www.water-for-africa.org/en/vegetation-zones.html).These vegetation types are slow in rehabilitation and prone to desertification if trees and shrubs are cut due to fuelwood extraction This slow rehabilitation leads to fuelwood scarcity and thus to the urgent need of efficient cooking devices. In both countries, the ICS deployed are comparable since they are built to address the main cooking habits of the respective country. The fact that, in contrast to the Save80 stove in Nigeria, the Mirt stove deployed in Ethiopia is a fixed, built in stove, which cannot be stolen or lost, makes the preliminary application of the drop-out rate from the Nigeria Project (5067) a conservative assumption.
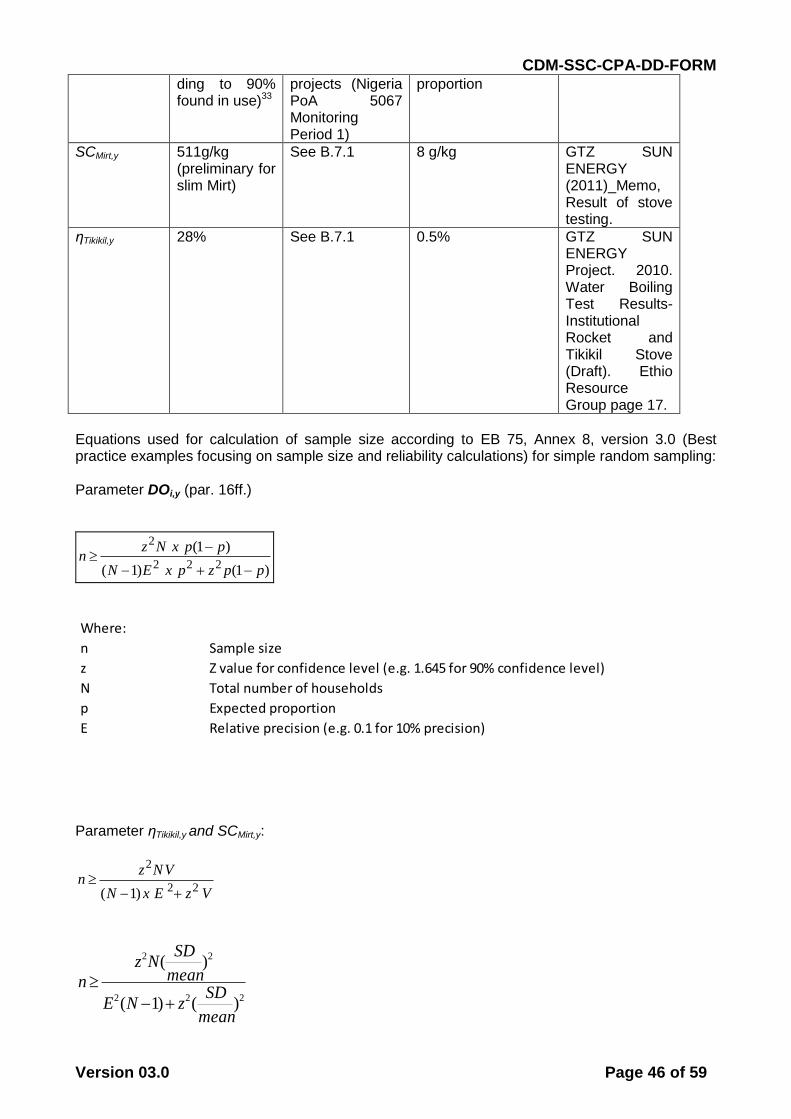
CDM-SSC-CPA-DD-FORM
Version 03.0 Page 46 of 59
222
22
)()1(
)(
mean
SDzNE
mean
SDNz
n
ding to 90% found in use)33
projects (Nigeria PoA 5067 Monitoring Period 1)
proportion
SCMirt,y 511g/kg (preliminary for slim Mirt)
See B.7.1 8 g/kg GTZ SUN ENERGY (2011)_Memo, Result of stove testing.
ηTikikil,y 28% See B.7.1 0.5% GTZ SUN ENERGY Project. 2010. Water Boiling Test Results- Institutional Rocket and Tikikil Stove (Draft). Ethio Resource Group page 17.
Equations used for calculation of sample size according to EB 75, Annex 8, version 3.0 (Best practice examples focusing on sample size and reliability calculations) for simple random sampling: Parameter DOi,y (par. 16ff.)
)1()1(
)1(
222
2
ppzpxEN
ppxNzn
Parameter ηTikikil,y and SCMirt,y:
VzExN
VNzn
22
2
)1(
Where:
n Sample size
z Z value for confidence level (e.g. 1.645 for 90% confidence level)
N Total number of households
p Expected proportion
E Relative precision (e.g. 0.1 for 10% precision)
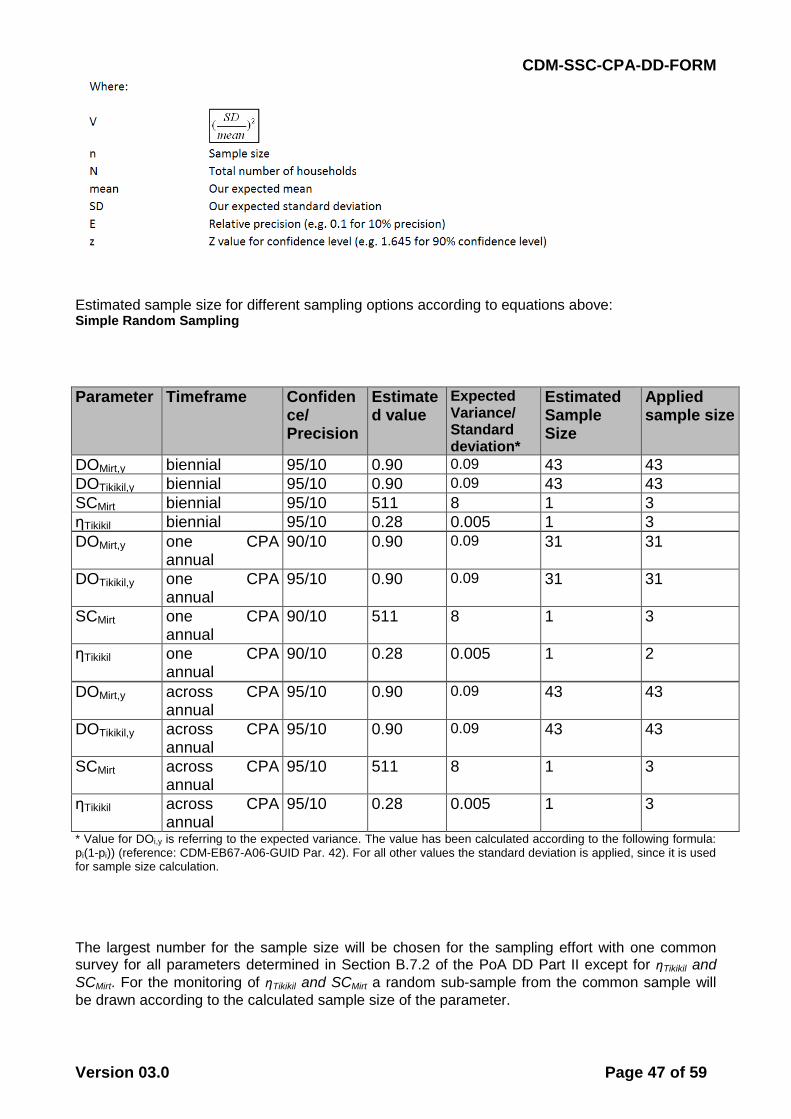
CDM-SSC-CPA-DD-FORM
Version 03.0 Page 47 of 59
Estimated sample size for different sampling options according to equations above: Simple Random Sampling
Parameter Timeframe Confidence/ Precision
Estimated value
Expected Variance/ Standard deviation*
Estimated Sample Size
Applied sample size
DOMirt,y biennial 95/10 0.90 0.09 43 43
DOTikikil,y biennial 95/10 0.90 0.09 43 43
SCMirt biennial 95/10 511 8 1 3
ηTikikil biennial 95/10 0.28 0.005 1 3
DOMirt,y one CPA annual
90/10 0.90 0.09 31 31
DOTikikil,y one CPA annual
95/10 0.90 0.09 31 31
SCMirt one CPA annual
90/10 511 8 1 3
ηTikikil one CPA annual
90/10 0.28 0.005 1 2
DOMirt,y across CPA annual
95/10 0.90 0.09 43 43
DOTikikil,y across CPA annual
95/10 0.90 0.09 43 43
SCMirt across CPA annual
95/10 511 8 1 3
ηTikikil across CPA annual
95/10 0.28 0.005 1 3
* Value for DOi,y is referring to the expected variance. The value has been calculated according to the following formula: pi(1-pi)) (reference: CDM-EB67-A06-GUID Par. 42). For all other values the standard deviation is applied, since it is used for sample size calculation.
The largest number for the sample size will be chosen for the sampling effort with one common survey for all parameters determined in Section B.7.2 of the PoA DD Part II except for ηTikikil and
SCMirt. For the monitoring of ηTikikil and SCMirt a random sub-sample from the common sample will
be drawn according to the calculated sample size of the parameter.
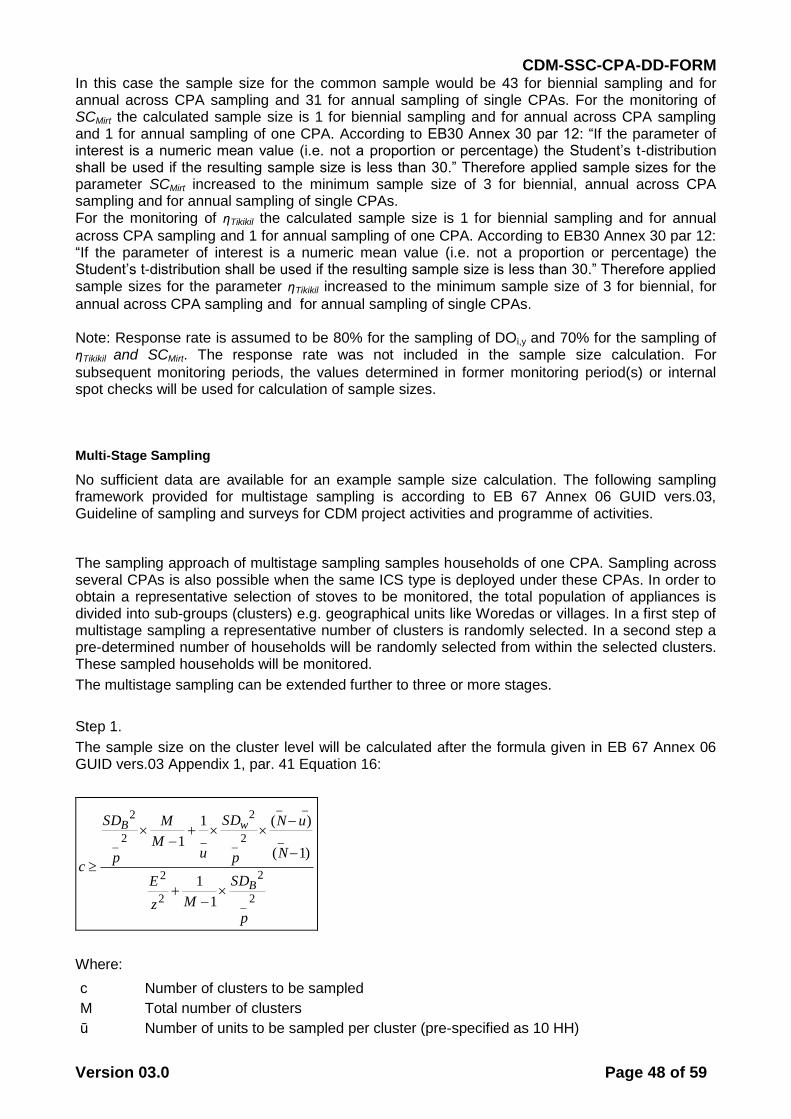
CDM-SSC-CPA-DD-FORM
Version 03.0 Page 48 of 59
In this case the sample size for the common sample would be 43 for biennial sampling and for annual across CPA sampling and 31 for annual sampling of single CPAs. For the monitoring of SCMirt the calculated sample size is 1 for biennial sampling and for annual across CPA sampling and 1 for annual sampling of one CPA. According to EB30 Annex 30 par 12: “If the parameter of interest is a numeric mean value (i.e. not a proportion or percentage) the Student’s t-distribution shall be used if the resulting sample size is less than 30.” Therefore applied sample sizes for the parameter SCMirt increased to the minimum sample size of 3 for biennial, annual across CPA sampling and for annual sampling of single CPAs. For the monitoring of ηTikikil the calculated sample size is 1 for biennial sampling and for annual
across CPA sampling and 1 for annual sampling of one CPA. According to EB30 Annex 30 par 12: “If the parameter of interest is a numeric mean value (i.e. not a proportion or percentage) the Student’s t-distribution shall be used if the resulting sample size is less than 30.” Therefore applied sample sizes for the parameter ηTikikil increased to the minimum sample size of 3 for biennial, for
annual across CPA sampling and for annual sampling of single CPAs. Note: Response rate is assumed to be 80% for the sampling of DOi,y and 70% for the sampling of ηTikikil and SCMirt. The response rate was not included in the sample size calculation. For
subsequent monitoring periods, the values determined in former monitoring period(s) or internal spot checks will be used for calculation of sample sizes. Multi-Stage Sampling
No sufficient data are available for an example sample size calculation. The following sampling framework provided for multistage sampling is according to EB 67 Annex 06 GUID vers.03, Guideline of sampling and surveys for CDM project activities and programme of activities.
The sampling approach of multistage sampling samples households of one CPA. Sampling across several CPAs is also possible when the same ICS type is deployed under these CPAs. In order to obtain a representative selection of stoves to be monitored, the total population of appliances is divided into sub-groups (clusters) e.g. geographical units like Woredas or villages. In a first step of multistage sampling a representative number of clusters is randomly selected. In a second step a pre-determined number of households will be randomly selected from within the selected clusters. These sampled households will be monitored.
The multistage sampling can be extended further to three or more stages.
Step 1.
The sample size on the cluster level will be calculated after the formula given in EB 67 Annex 06 GUID vers.03 Appendix 1, par. 41 Equation 16:
2_
2
2
2
_
__
2_
2
_2_
2
1
1
)1(
)(1
1
p
SD
Mz
E
N
uN
p
SD
uM
M
p
SD
c
B
wB
Where:
c Number of clusters to be sampled
M Total number of clusters
ū Number of units to be sampled per cluster (pre-specified as 10 HH)
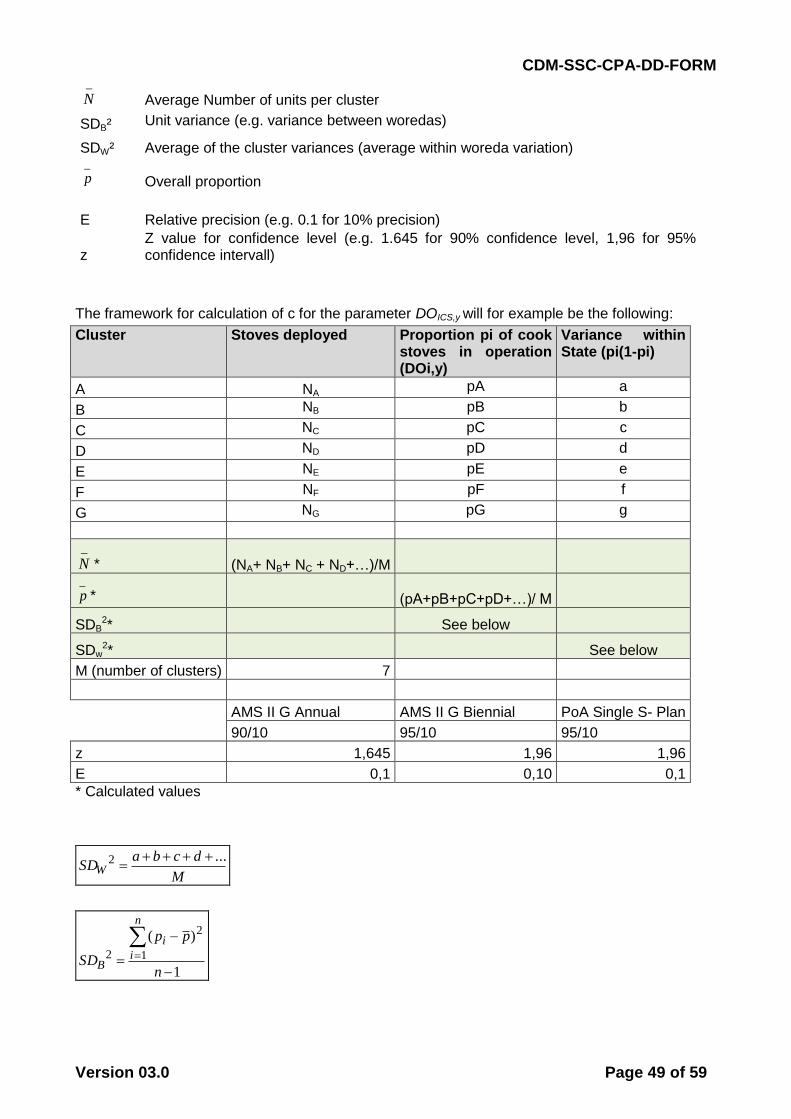
CDM-SSC-CPA-DD-FORM
Version 03.0 Page 49 of 59
_
N Average Number of units per cluster
SDB² Unit variance (e.g. variance between woredas)
SDW² Average of the cluster variances (average within woreda variation) _
p Overall proportion
E Relative precision (e.g. 0.1 for 10% precision)
z Z value for confidence level (e.g. 1.645 for 90% confidence level, 1,96 for 95% confidence intervall)
The framework for calculation of c for the parameter DOICS,y will for example be the following:
Cluster Stoves deployed Proportion pi of cook stoves in operation (DOi,y)
Variance within State (pi(1-pi)
A NA pA a
B NB pB b
C NC pC c
D ND pD d
E NE pE e
F NF pF f
G NG pG g
_
N * (NA+ NB+ NC + ND+…)/M _
p * (pA+pB+pC+pD+…)/ M
SDB2* See below
SDw2* See below
M (number of clusters) 7
AMS II G Annual AMS II G Biennial PoA Single S- Plan
90/10 95/10 95/10
z 1,645 1,96 1,96
E 0,1 0,10 0,1
* Calculated values
M
dcbaSDW
...2
1
)(
1
2
2
n
pp
SD
n
i
i
B
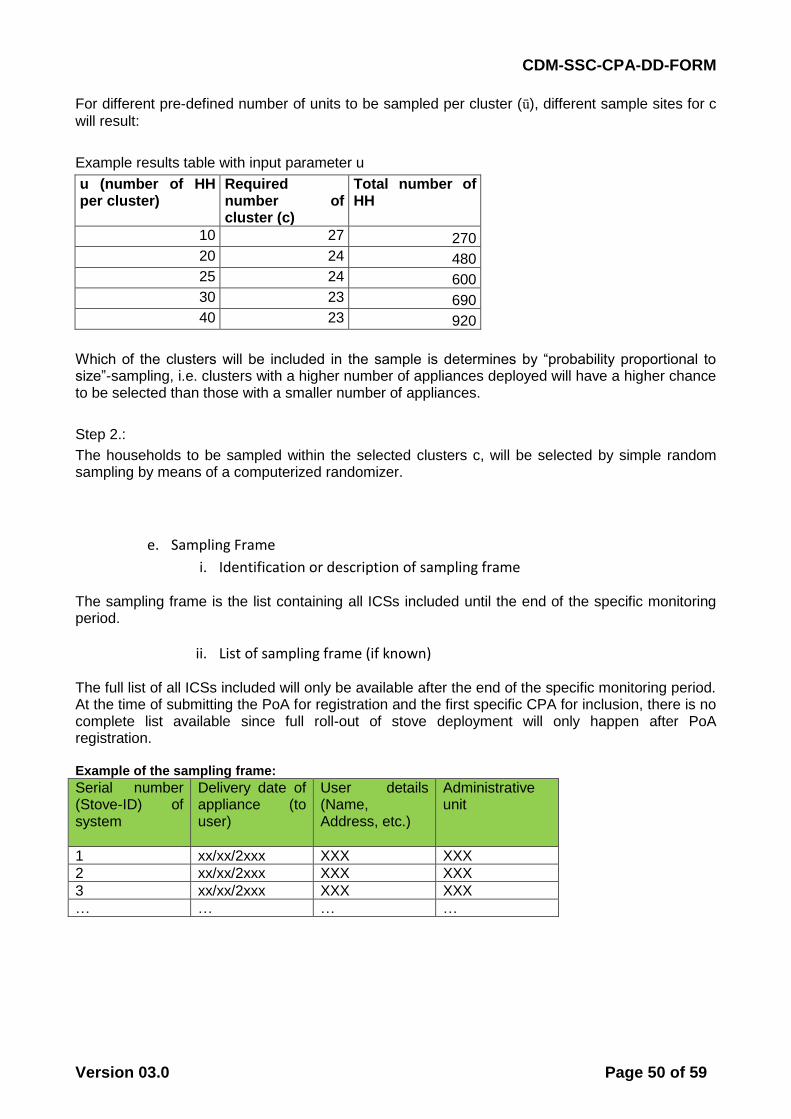
CDM-SSC-CPA-DD-FORM
Version 03.0 Page 50 of 59
For different pre-defined number of units to be sampled per cluster (ū), different sample sites for c
will result:
Example results table with input parameter u
u (number of HH per cluster)
Required number of cluster (c)
Total number of HH
10 27 270
20 24 480
25 24 600
30 23 690
40 23 920
Which of the clusters will be included in the sample is determines by “probability proportional to size”-sampling, i.e. clusters with a higher number of appliances deployed will have a higher chance to be selected than those with a smaller number of appliances.
Step 2.:
The households to be sampled within the selected clusters c, will be selected by simple random sampling by means of a computerized randomizer.
e. Sampling Frame
i. Identification or description of sampling frame
The sampling frame is the list containing all ICSs included until the end of the specific monitoring period.
ii. List of sampling frame (if known)
The full list of all ICSs included will only be available after the end of the specific monitoring period. At the time of submitting the PoA for registration and the first specific CPA for inclusion, there is no complete list available since full roll-out of stove deployment will only happen after PoA registration. Example of the sampling frame:
Serial number (Stove-ID) of system
Delivery date of appliance (to user)
User details (Name, Address, etc.)
Administrative unit
1 xx/xx/2xxx XXX XXX
2 xx/xx/2xxx XXX XXX
3 xx/xx/2xxx XXX XXX
… … … …
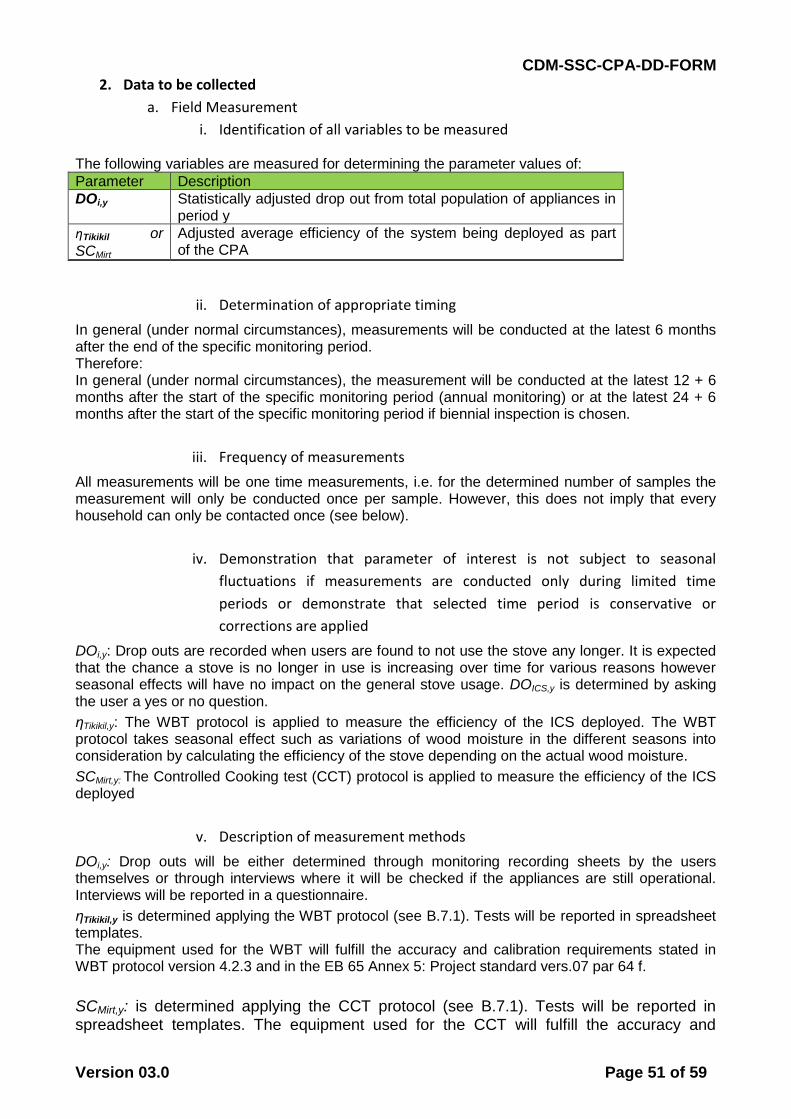
CDM-SSC-CPA-DD-FORM
Version 03.0 Page 51 of 59
2. Data to be collected
a. Field Measurement
i. Identification of all variables to be measured
The following variables are measured for determining the parameter values of:
Parameter Description
DOi,y Statistically adjusted drop out from total population of appliances in period y
ηTikikil or
SCMirt
Adjusted average efficiency of the system being deployed as part of the CPA
ii. Determination of appropriate timing
In general (under normal circumstances), measurements will be conducted at the latest 6 months after the end of the specific monitoring period. Therefore: In general (under normal circumstances), the measurement will be conducted at the latest 12 + 6 months after the start of the specific monitoring period (annual monitoring) or at the latest 24 + 6 months after the start of the specific monitoring period if biennial inspection is chosen.
iii. Frequency of measurements
All measurements will be one time measurements, i.e. for the determined number of samples the measurement will only be conducted once per sample. However, this does not imply that every household can only be contacted once (see below).
iv. Demonstration that parameter of interest is not subject to seasonal
fluctuations if measurements are conducted only during limited time
periods or demonstrate that selected time period is conservative or
corrections are applied
DOi,y: Drop outs are recorded when users are found to not use the stove any longer. It is expected that the chance a stove is no longer in use is increasing over time for various reasons however seasonal effects will have no impact on the general stove usage. DOICS,y is determined by asking the user a yes or no question.
ηTikikil,y: The WBT protocol is applied to measure the efficiency of the ICS deployed. The WBT protocol takes seasonal effect such as variations of wood moisture in the different seasons into consideration by calculating the efficiency of the stove depending on the actual wood moisture.
SCMirt,y: The Controlled Cooking test (CCT) protocol is applied to measure the efficiency of the ICS deployed
v. Description of measurement methods
DOi,y: Drop outs will be either determined through monitoring recording sheets by the users themselves or through interviews where it will be checked if the appliances are still operational. Interviews will be reported in a questionnaire.
ηTikikil,y is determined applying the WBT protocol (see B.7.1). Tests will be reported in spreadsheet templates. The equipment used for the WBT will fulfill the accuracy and calibration requirements stated in WBT protocol version 4.2.3 and in the EB 65 Annex 5: Project standard vers.07 par 64 f.
SCMirt,y: is determined applying the CCT protocol (see B.7.1). Tests will be reported in spreadsheet templates. The equipment used for the CCT will fulfill the accuracy and
CDM-SSC-CPA-DD-FORM
Version 03.0 Page 52 of 59
calibration requirements stated in WBT protocol version 4.2.3 and in the EB 65 Annex 5: Project standard vers.07 par 64 f.
b. Quality Assurance/ Quality Control
i. Procedures for conducting the data collection and/or field measurements
Data collected and processed by the field staff will be checked regularly by the CME or a person dedicated by the CME.
Training of field personnel
All personnel involved in the monitoring will be trained to ensure that each of them undertakes an appropriate monitoring assignment according to the Monitoring Plan. Any personnel involved in the monitoring will be trained by the CME or by or a person dedicated by the CME before performing any monitoring activities. Only people who are trained are qualified to be involved in the monitoring.
Provisions for maximizing response rates
Documentation of out-of-population cases, refusals, other sources of non-responses
- Refusals and non-respondents
Refusals and non-respondents (i.e. households where the contact could not be established) will be recorded by the monitoring team as well as the reason for the refusal.
In case a household or institution refuses to participate in the monitoring effort, the monitoring team will record the reason for the refusal and decide whether or not the refusal is due to a likely non-use of the ICS. If the CME decides that the refusal is due to a likely non-use of the stove, this stove will count as Drop-Out. If the reason is e.g. a time constraint that cannot be solved by repeating the survey effort at this end user at another date, the household or institution will be replaced by another.
ii. Procedure for defining outliers and under what circumstances outlier
data/measurements may be excluded and/or replaced
CME will apply the “3 sigma rule”: All values outside 3 standard deviations from the mean will be excluded. See also: http://en.wikipedia.org/wiki/68-95-99.7_rule
Other appropriate measures to define and exclude outliers may also be used.
c. Analysis: Describe how the data will be used
Data will be used to calculate emission reductions achieved during the specific monitoring period according to the equations provided in Section D.6.1 of this CPA-DD. The CME is responsible for preparing the Monitoring Report.
3. Implementation Plan
a. Schedule for implementing the sampling effort
As mentioned above, the schedule for implementing the sampling effort shall be: within 6 months after the end of the specific monitoring period the sampling effort can be finalized.
CDM-SSC-CPA-DD-FORM
Version 03.0 Page 53 of 59
b. Skills and resources required for data collection and the analyses, general
description of qualifications and experience
The CME will assign the people, entities or qualified third parties responsible for the data collection and analysis. The CME will ensure that the qualification and experience of the person or entity involved is adequate for the specific tasks to be performed by the person or entity.
Other sampling methods which may be more practical and cost effective may alternatively be used, while considering the most recent standard and best practice examples for sampling and surveys for small-scale CDM project activities. If this is the case, the DOE will have to verify at verification stage that the sampling method was statistically sound and as robust as the approaches presented in this PoA-DD.
SECTION E. Approval and authorization
The letter of approval from the host country is available and has been provided to the DOE at the time of submitting the CPA-DD to the validating DOE.
- - - - -
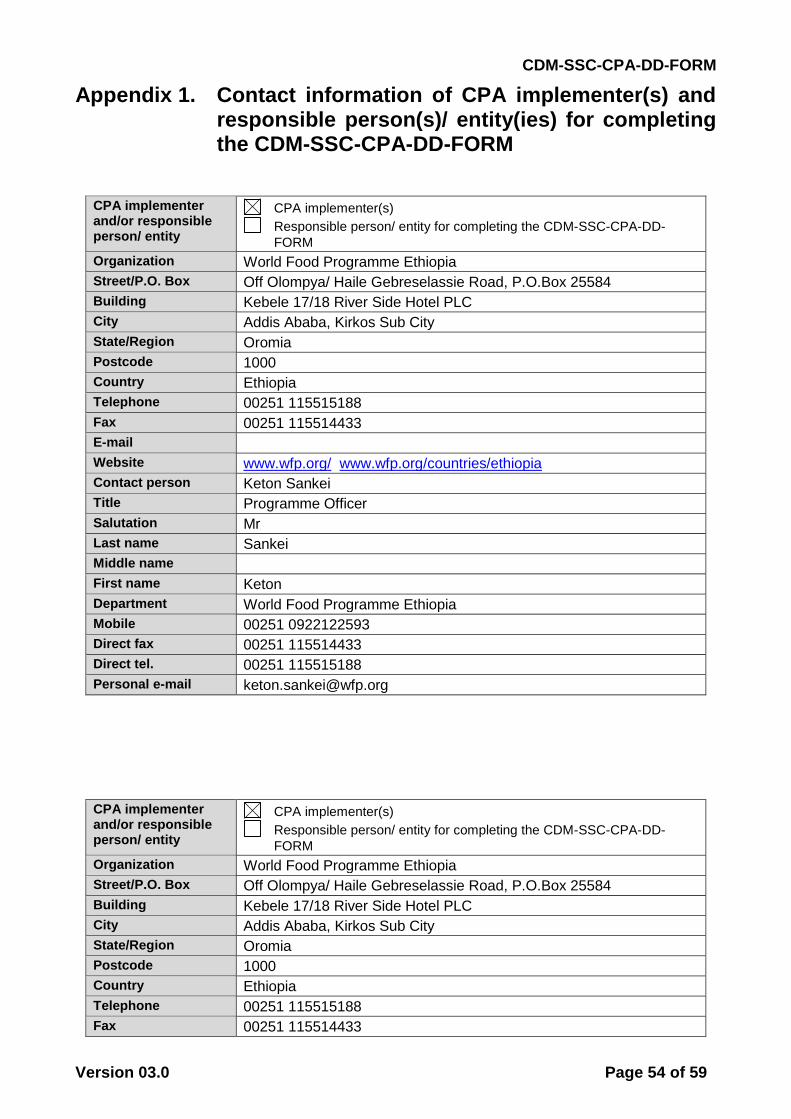
CDM-SSC-CPA-DD-FORM
Version 03.0 Page 54 of 59
Appendix 1. Contact information of CPA implementer(s) and responsible person(s)/ entity(ies) for completing the CDM-SSC-CPA-DD-FORM
CPA implementer and/or responsible person/ entity
CPA implementer(s)
Responsible person/ entity for completing the CDM-SSC-CPA-DD-
FORM
Organization World Food Programme Ethiopia
Street/P.O. Box Off Olompya/ Haile Gebreselassie Road, P.O.Box 25584
Building Kebele 17/18 River Side Hotel PLC
City Addis Ababa, Kirkos Sub City
State/Region Oromia
Postcode 1000
Country Ethiopia
Telephone 00251 115515188
Fax 00251 115514433
Website www.wfp.org/ www.wfp.org/countries/ethiopia
Contact person Keton Sankei
Title Programme Officer
Salutation Mr
Last name Sankei
Middle name
First name Keton
Department World Food Programme Ethiopia
Mobile 00251 0922122593
Direct fax 00251 115514433
Direct tel. 00251 115515188
Personal e-mail [email protected]
CPA implementer and/or responsible person/ entity
CPA implementer(s)
Responsible person/ entity for completing the CDM-SSC-CPA-DD-
FORM
Organization World Food Programme Ethiopia
Street/P.O. Box Off Olompya/ Haile Gebreselassie Road, P.O.Box 25584
Building Kebele 17/18 River Side Hotel PLC
City Addis Ababa, Kirkos Sub City
State/Region Oromia
Postcode 1000
Country Ethiopia
Telephone 00251 115515188
Fax 00251 115514433
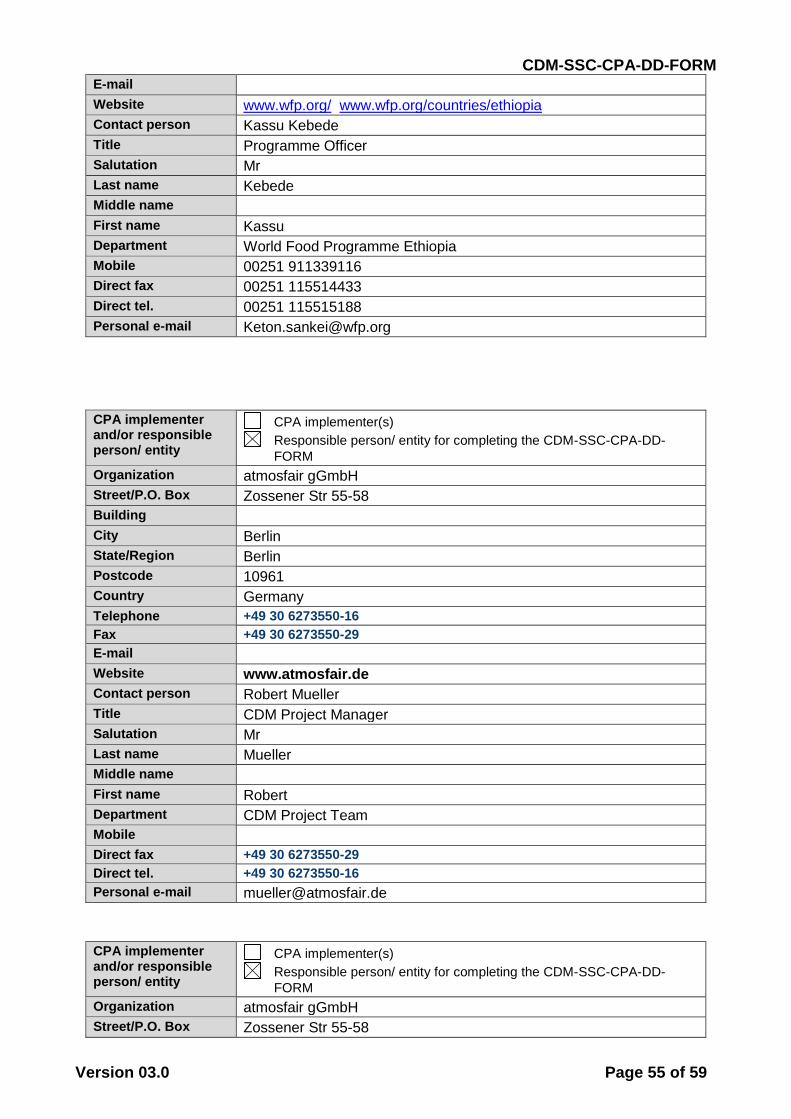
CDM-SSC-CPA-DD-FORM
Version 03.0 Page 55 of 59
Website www.wfp.org/ www.wfp.org/countries/ethiopia
Contact person Kassu Kebede
Title Programme Officer
Salutation Mr
Last name Kebede
Middle name
First name Kassu
Department World Food Programme Ethiopia
Mobile 00251 911339116
Direct fax 00251 115514433
Direct tel. 00251 115515188
Personal e-mail [email protected]
CPA implementer and/or responsible person/ entity
CPA implementer(s)
Responsible person/ entity for completing the CDM-SSC-CPA-DD-
FORM
Organization atmosfair gGmbH
Street/P.O. Box Zossener Str 55-58
Building
City Berlin
State/Region Berlin
Postcode 10961
Country Germany
Telephone +49 30 6273550-16
Fax +49 30 6273550-29
Website www.atmosfair.de
Contact person Robert Mueller
Title CDM Project Manager
Salutation Mr
Last name Mueller
Middle name
First name Robert
Department CDM Project Team
Mobile
Direct fax +49 30 6273550-29
Direct tel. +49 30 6273550-16
Personal e-mail [email protected]
CPA implementer and/or responsible person/ entity
CPA implementer(s)
Responsible person/ entity for completing the CDM-SSC-CPA-DD-
FORM
Organization atmosfair gGmbH
Street/P.O. Box Zossener Str 55-58
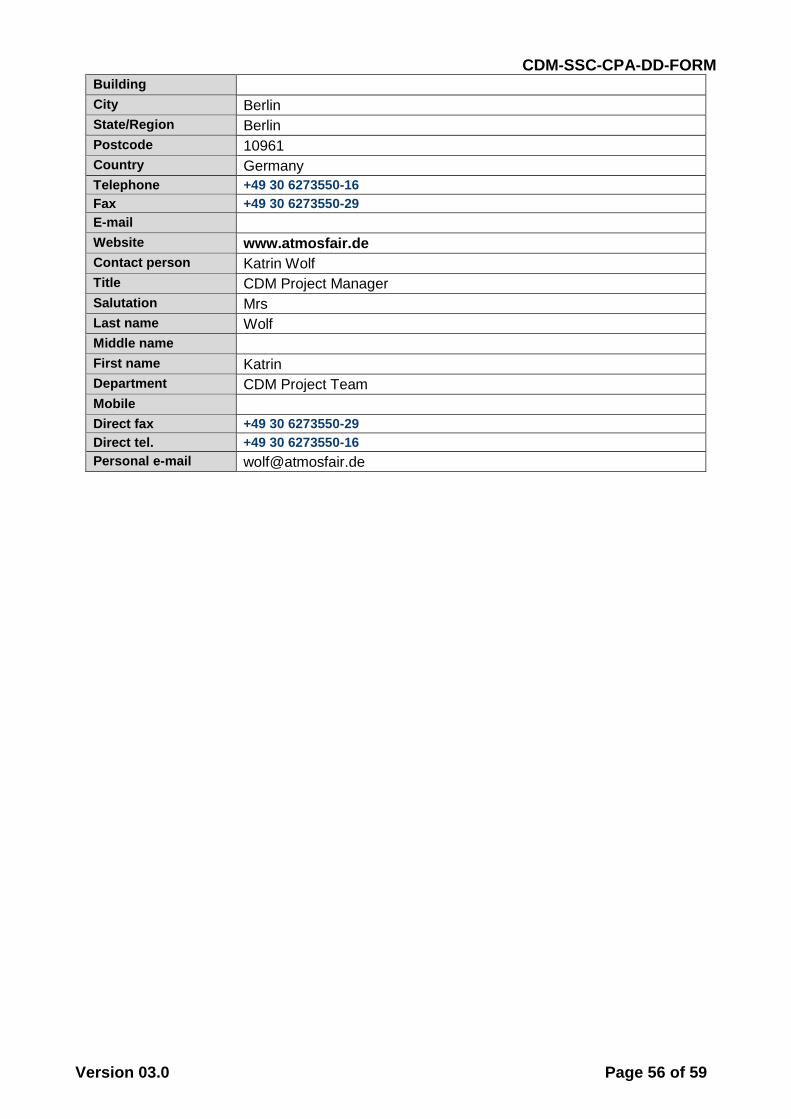
CDM-SSC-CPA-DD-FORM
Version 03.0 Page 56 of 59
Building
City Berlin
State/Region Berlin
Postcode 10961
Country Germany
Telephone +49 30 6273550-16
Fax +49 30 6273550-29
Website www.atmosfair.de
Contact person Katrin Wolf
Title CDM Project Manager
Salutation Mrs
Last name Wolf
Middle name
First name Katrin
Department CDM Project Team
Mobile
Direct fax +49 30 6273550-29
Direct tel. +49 30 6273550-16
Personal e-mail [email protected]
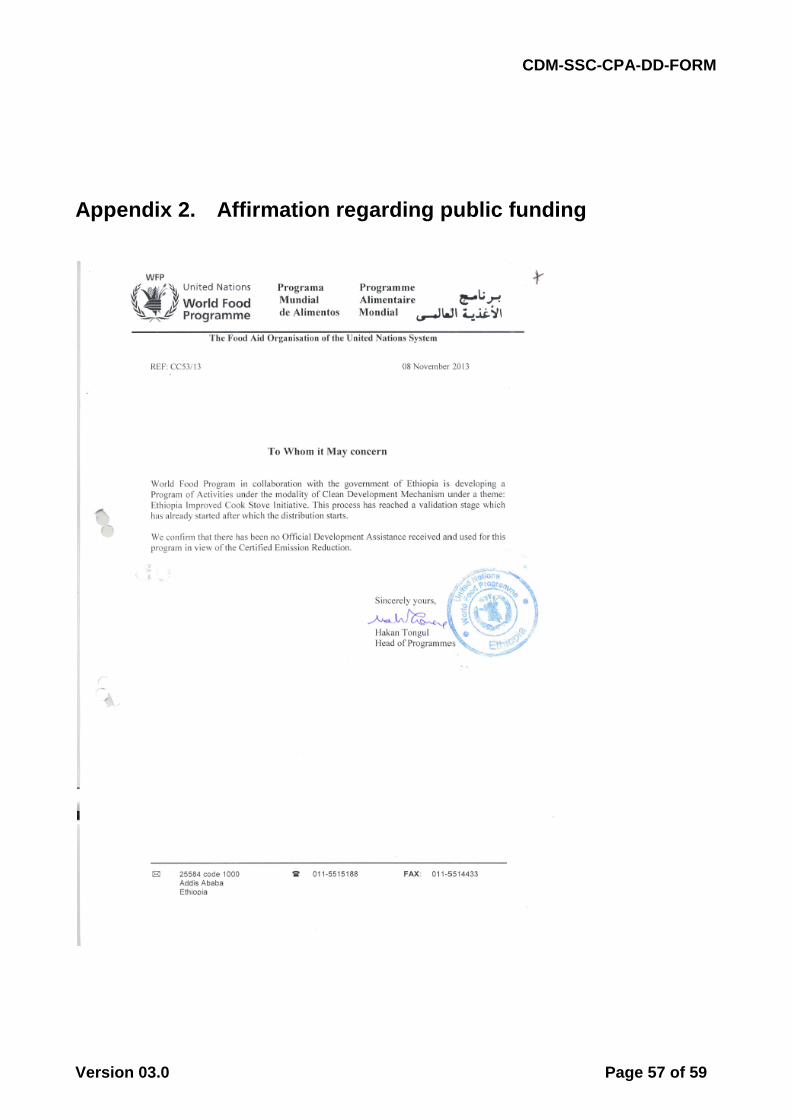
CDM-SSC-CPA-DD-FORM
Version 03.0 Page 57 of 59
Appendix 2. Affirmation regarding public funding
CDM-SSC-CPA-DD-FORM
Version 03.0 Page 58 of 59
Appendix 3. Applicability of methodology(ies) and standardized baseline(s)
See Section D
Appendix 4. Further background information on ex ante calculation of emission reductions
Excel sheet “preliminary ER calculation WFP Ethiopia”
Appendix 5. Further background information on monitoring plan
Sample size calculator in Excel
Appendix 6. Summary of post registration changes
- - - - -
- - - - -
Document information
Version Date Description
03.0 25 June 2014 Revisions to:
Include the Attachment: Instructions for filling out the component project activity design document form for small-scale CDM component project activities (these instructions supersede the "Guidelines for completing the component project activity design document form for small-scale component project activities" (Version 01.0));
Include provisions related to standardized baselines;
Add contact information on a CPA implementer and/or responsible person/ entity for completing the CDM-SSC-CPA-
CDM-SSC-CPA-DD-FORM
Version 03.0 Page 59 of 59
Version Date Description
DD-FORM in A.14. and Appendix 1;
Add general instructions on post-registration changes in paragraph 4 and 5 of general instructions and Error! Reference source not found.;
Change the reference number from F-CDM-SSC-CPA-DD to CDM-SSC-CPA-DD-FORM;
Editorial improvement.
02.0 13 March 2012 EB 66, Annex 17
Revision required to ensure consistency with the "Guidelines for completing the component project design document form for small-scale component project activities".
01.0 27 July 2007 EB33, Annex44
Initial adoption.
Decision Class: Regulatory Document Type: Form Business Function: Registration Keywords: component project activity, project design document, SSC project activities