Embed Size (px)
Citation preview
COMPONENT PRICING IN CANOLA: Weighing the Options
Prepared For: SaskCanola
Principal Authors: Tyler Bjornson, Christina Patterson and Shannon Schlecht
February 7, 2016
1 | P a g e
Table of Contents
Executive Summary ....................................................................................................................................... 3
Scope of the Project ...................................................................................................................................... 5
Introduction .................................................................................................................................................. 6
Section 1: Market Factors ............................................................................................................................. 7
Nature of Global Business in Canola ......................................................................................................... 7
Substitutes and the International Vegetable Oil Market .......................................................................... 7
Structure of International Purchase Contracts ....................................................................................... 11
Structure of Crushing Industry ................................................................................................................ 12
Structure of Grain Elevator Business ...................................................................................................... 13
Pricing Factors – Freight vs. Oil Content Premium ................................................................................. 14
Discounts & Premiums ............................................................................................................................ 15
Section 2: Production Factors ..................................................................................................................... 16
Overview ................................................................................................................................................. 16
North-South Oil Content Observations ................................................................................................... 20
Varieties .................................................................................................................................................. 22
Environment ........................................................................................................................................... 25
Agronomic Practices ............................................................................................................................... 26
Section 3: Implementation Issues ............................................................................................................... 28
Sampling/Testing .................................................................................................................................... 28
Storage/Segregation ............................................................................................................................... 28
Basis ........................................................................................................................................................ 29
Industry Views ......................................................................................................................................... 30
Producer Groups ................................................................................................................................. 30
Section 4: International Experience ............................................................................................................ 32
Australia .................................................................................................................................................. 33
Premium/Discount Schedule .............................................................................................................. 34
Environment........................................................................................................................................ 34
Results ................................................................................................................................................. 34
European Union ...................................................................................................................................... 35
Premium and Discount Schedule ........................................................................................................ 37
Testing ................................................................................................................................................. 38
Results ................................................................................................................................................. 38
2 | P a g e
United States ........................................................................................................................................... 38
Premium and Discount Schedule ........................................................................................................ 39
Results ................................................................................................................................................. 39
Other oilseeds in the international marketplace .................................................................................... 40
Section 5: Modelling Factors ....................................................................................................................... 42
Oil Content Distribution .......................................................................................................................... 42
Sensitivity Analysis of Canola Prices Vs. Basket of Commodities ........................................................... 48
Economic Impact by Province of Premium / Discount Schedule ............................................................ 49
Additional Considerations ....................................................................................................................... 51
Canada Oil Production Increases - Yield vs Oil Content ...................................................................... 51
Value of Oil Content by Province ........................................................................................................ 52
Interplay Between Oil and Protein...................................................................................................... 53
Moisture Bonification Comparison to EU and Australian Parameters ............................................... 53
Section 6: Conclusion & Recommendations ............................................................................................... 54
Recommendations .................................................................................................................................. 56
APPENDIX A – Questionnaire ...................................................................................................................... 57
Industry Questionnaire for SaskCanola Component Pricing Project ...................................................... 57
APPENDIX B – Overview of Interviewee Backgrounds ................................................................................ 60
APPENDIX C – Select Bibliography .............................................................................................................. 61
3 | P a g e
Executive Summary
This report provides an analysis and evaluation of moving the Canadian canola industry to a component
pricing system with a focus on oil content. The study considers whether component pricing would
create new value for the canola industry and whether it would result in a net benefit to the sector at
large and specifically to Saskatchewan canola producers. Market factors, production factors, relevant
international experience, implementation matters and statistical modelling are all reviewed as part of
this assessment.
The research and analysis in this report looks at global market factors such as canola’s substitutability,
the potential for product differentiation in the eyes of customers, canola’s shape and share of the
international vegetable oil market, the structure of demand from domestic buyers and importing
countries, the nature of international contracts in canola and competition from other producing
countries. It finds that canola in the international market carries the attributes of a bulk commodity
market and the need for high volume and efficient execution to drive value. Based on this assessment
and corroborated by extensive interviews, it determines that it would be unlikely that Canadian traders
would be able to extract additional value (i.e., beyond what is already captured today) for canola
sourced through a component pricing mechanism where premiums (or discounts) would have been paid
for higher (lower) oil content product.
Also assessed are the domestic market factors that similarly influence how and why buyers of farm gate
canola in the Western Canadian landscape act. It discusses the limitations and opportunities for
domestic buyers which in turn impacts the value that producers ultimately receive for their canola. The
report surmises that most buyers are driven by asset utilization and efficiency as well as freight costs vs.
opportunity. Regarding the latter, the study concludes that freight cost alone would be a significant
inhibitor to long haul procurement beyond natural catchment areas for local facilities in order to capture
high oil content opportunities.
It also reviews comparable markets namely the European Union (EU) and Australia which already use
component based pricing or ‘bonification’ systems. The study evaluates the relative success the system
has had at creating benefit or adding cost for the industry in those instances and draws lessons learned
which could be relevant to the Canadian context.
The report discusses production factors that could influence oil content in Western Canadian production
and concludes that environment and genetics are the major variables. In relation to varieties, it
highlights the jump in oil content roughly a decade ago corresponding to the introduction of new
genetics which may in large part be responsible for a relative narrowing of oil content distribution year
over year and between regions. Overall, it notes that producers have relatively few tools to directly
control oil content and as such, argues that this will balance out ‘good’ and ‘bad’ years and the
premiums or discounts that would come with them in a component pricing model.
Implementation matters are considered, including costs to administer component pricing, testing,
segregation costs among other issues. The study determines that while certain items may not be as
contentious as some actors suggest (e.g., testing), there will be costs to administering a bonification
model and these would be borne by the value chain without being able to pass them on to final
4 | P a g e
customers. Producers should be wary of adding costs into the system that could in part end up being
factored into the farm gate price.
Through a sensitivity analysis of canola pricing versus a basket of commodities, the report also finds that
Saskatchewan producers under the current system are already rewarded for higher oil content. If a
component pricing system were put into place, we anticipate that buyers would simply adjust basis
levels to accurately reflect local and international market expectations yielding the same profit result for
producers either inside or outside a bonification system.
Finally, the study considers a range of statistical information to aid analysis of a hypothetical oil content
pricing system and its potential impact on Saskatchewan canola producers. Data was gathered to model
different scenarios based on historical quality information, most notably the variance in oil content and
the distribution of oil content levels across the three main producing provinces. The model attempts to
illustrate the possible consequences for different production areas and its producers under a
component pricing system based on oil content.
In this it finds that the proportion of canola with oil content above 43% in Saskatchewan compared to
content below 43% is such that either punishing discounts would have to be in place to balance the
market or offsetting reductions in basis levels would need to occur to pay for the premium schedule
given that no new value is being created in the international market through the introduction of a
component pricing system in Canada. Overall it finds that while Saskatchewan producers may benefit
slightly from an oil content premium over time, it pales in comparison to the value driven by increased
canola yield on farm.
In a time when the canola industry is striving for continued higher production and greater yields, the
implementation of a system that focuses on oil content as a major pricing component may send the
wrong signal to producers and seed developers, add costs to administer the system that cannot be
recouped from customers, be a distraction and potential loadstone for unnecessary debate and friction
within the value chain, and would clearly create winners and losers among producers themselves.
The report finds that Saskatchewan canola producers have other opportunities to assess on a semi-
regular basis to determine if farmers are being paid the full value for their canola, and outlines
recommendations for SaskCanola to determine if its members are being fairly compensated through the
marketplace.
5 | P a g e
Scope of the Project
Component pricing of canola based on oil content is an issue that has been raised by some producers
across Western Canada. With the increasing oil content over the last number of years, especially in
Saskatchewan, some producers believe they are not being fully compensated when they sell their canola
with a higher oil content.
Like so many issues in the industry, there is no consensus on component pricing either between
producers or among various segments in the value chain. Historically, canola produced in Alberta had
the highest average oil content, while that produced in Manitoba has the lowest, with Saskatchewan
falling the middle. As such, the Alberta Canola Producers Commission has been vocal in its support of
component pricing whereas the Manitoba Canola Growers Association does not support a move to
component pricing.
Component pricing is not a unique concept. Premiums have been paid for higher protein content in
wheat for many years, so farmers wonder why something similar cannot be done for canola.
Other jurisdictions have implemented component pricing for canola. In Australia, the original goal of
moving to component pricing was to encourage the production of a consistent, higher quality product.
Across the Atlantic, the European market has had a bonification system in place for many years,
although it too has its own distinct characteristics that need to be taken into account when used as a
point of reference for this study.
Last year, SaskCanola invested in a study on canola crush margins and basis and are now looking to build
on that information by further researching the benefits and drawbacks of a potential component pricing
model for canola based on oil content.
Through investigative research and supply chain outreach, both in Canada and other jurisdictions, New
West Public Affairs will address the key factors in this report on whether or not it would be beneficial for
Saskatchewan producers to advocate for component pricing.
New West has engaged in significant online research, acquired considerable data from both government
and industry sources, and conducted phone interviews with canola handlers, exporters, processors and
their industry association representatives. The project is divided into six sections. Section 1 covers
market factors, Section 2 explores production factors, Section 3 discusses international experience with
component pricing in canola, Section 4 looks at implementation considerations, and Section 5 reviews
scenarios and information drawn from original modelling completed by New West for this project.
Finally, Section 6 provides conclusions and recommendations on component pricing for SaskCanola’s
consideration.
6 | P a g e
Introduction
Canada’s canola industry is a major success for the entire crop sector value chain. Since its inception in
the late 1970’s, canola is now second only to wheat in Canadian crop production volumes, but number
one in overall value to producers accounting for one quarter of all farm cash receipts1. Canada is by far
the largest exporter of canola at 74% of the world’s trade in this product. A significant domestic
crushing industry has also followed this success with roughly half of total canola production now going
to local value added processing facilities, and a major portion of that also undergoing further refining
within many of these plants. By adding in the major investments and assets required to refine,
companies have signaled their commitment to supply from Canada as the finished product is now
market ready for sale to end consumers (versus simply crushing for crude oil then transporting to a
refinery closer to market for the final processing steps.) In addition, the largest global research and
development investments in canola are being made in Canada, the only major crop to see this happen.
Alongside the incredible rise of this crop has come a relatively unique model of cooperation among
segments of the value chain, which includes considerable financial support from producers. There can
be challenges when competitors and members of the supply chain are brought around the same table,
however a lot of success of the canola industry can be attributed to everyone in the value chain
participating in the Canola Council of Canada. This includes work on production practices and
monitoring, market development research and promotion activities, regulatory improvements and
policy development particularly in the area of international trade and market access. Perhaps most
importantly, the value chain also cooperates extensively in the development and implementation of a
broad sector strategy to increase value of the sector to all of its participants. In the early 2000s this took
the form of a strategy calling on increased volumes in order to become more relevant to the global
vegetable oil complex and less risky from a supply perspective for potential end use customers to make
the switch to canola. The value chain is now on its third such strategy, going from a seed volume target
of 7 million tonnes by 2007 to its current overarching goal of achieving 26 million tonnes and 52 bushels
per acre by 2025.
1 Canola Council of Canada: http://www.canolacouncil.org/markets-stats/industry-overview/
7 | P a g e
Section 1: Market Factors
Nature of Global Business in Canola
This backdrop is relevant to the current study for several reasons. Firstly, even with a tripling of bulk
seed production volumes over two decades, canola’s overall share of the global vegetable oil market is
still smaller by comparison to the consumption of palm oil and soybean oil (See Figure A). In other
words, the canola oil market is from an international perspective still relatively illiquid in the eyes of
major global customers. This is particularly evident when one looks at the export market versus
production as we discuss further below.
Secondly, canola pricing internationally is still very much tied to the international market and pricing of
soybean oil, meaning canola is a bulk commodity product in the global market albeit with certain health
and functional attributes which do command a typical higher price over soybean oil. Nevertheless,
substitutes (e.g., soybean oil, sunflower oil, combination of oils and/or processes, etc.) are readily
available for most end use applications meaning global canola oil prices cannot pull too far away from
other vegetable oil pricing at the risk of being substituted. There are applications and varieties with
distinct quality characteristics that will command a significant premium because of the relative inability
of the end user to reasonably substitute, but these circumstances are few and the vast majority of global
canola production and usage does not fit this category. In the case of high oleic canola oil, both soybean
and sunflower have high oleic options which will temper premium pricing for this product.
Thirdly, the value chain as a whole continues to agree that bulk seed volume and production targets are
still the most relevant metrics to drive value for all participants and not other factors (e.g., increasing
quality characteristics, increasing oil content, etc.). In other words, the top line goal is still volume as a
whole, of which oil content is only one factor.
Fourthly, all segments of the value chain need to be aware of the impact of their actions on the broader
industry. Considering the extraordinary collaboration to date in the sector and the need for all
participants to be reasonably compensated for their part, strategies that are ‘win-lose’ between
segments are bound to be very contentious with the possibility of significant unintended repercussions.
This is not to say that fighting for one’s own is not proper, but rather that one needs to be mindful that
the market will naturally aim to redistribute profits in a balanced manner along the value chain. After
all, if significantly higher profits are available in one segment than another, one should expect to see
much more vertical integration or cross segment investing in response.
Substitutes and the International Vegetable Oil Market
In reviewing the possible benefits or drawbacks of a component pricing system it is worthwhile to
consider in slightly more detail the nature of the international vegetable oil market and the
substitutability among oil options.
Consumption of canola oil globally is quite common and represents a significant amount of the global
disappearance seen in Figure A below. That being said, this chart also demonstrates that the majority of
growth in global consumption is happening in palm and soybean oil, although the past two years has
seen a bump in canola.
8 | P a g e
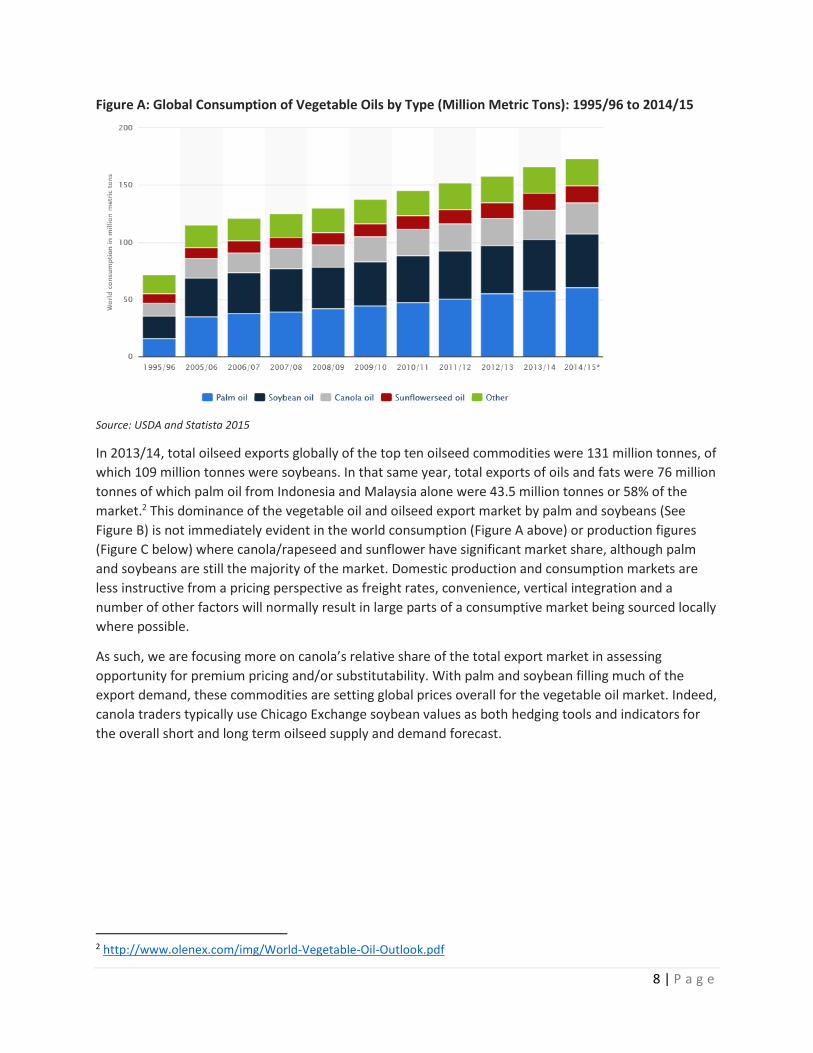
Figure A: Global Consumption of Vegetable Oils by Type (Million Metric Tons): 1995/96 to 2014/15
Source: USDA and Statista 2015
In 2013/14, total oilseed exports globally of the top ten oilseed commodities were 131 million tonnes, of
which 109 million tonnes were soybeans. In that same year, total exports of oils and fats were 76 million
tonnes of which palm oil from Indonesia and Malaysia alone were 43.5 million tonnes or 58% of the
market.2 This dominance of the vegetable oil and oilseed export market by palm and soybeans (See
Figure B) is not immediately evident in the world consumption (Figure A above) or production figures
(Figure C below) where canola/rapeseed and sunflower have significant market share, although palm
and soybeans are still the majority of the market. Domestic production and consumption markets are
less instructive from a pricing perspective as freight rates, convenience, vertical integration and a
number of other factors will normally result in large parts of a consumptive market being sourced locally
where possible.
As such, we are focusing more on canola’s relative share of the total export market in assessing
opportunity for premium pricing and/or substitutability. With palm and soybean filling much of the
export demand, these commodities are setting global prices overall for the vegetable oil market. Indeed,
canola traders typically use Chicago Exchange soybean values as both hedging tools and indicators for
the overall short and long term oilseed supply and demand forecast.
2 http://www.olenex.com/img/World-Vegetable-Oil-Outlook.pdf
9 | P a g e
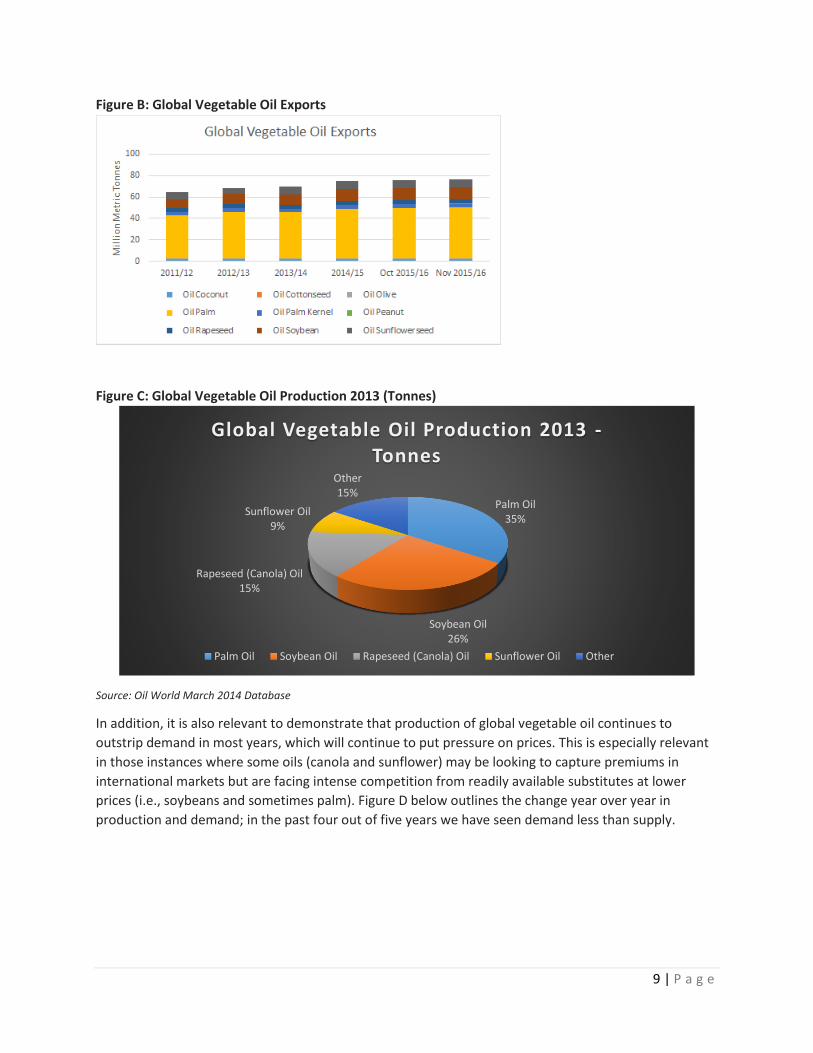
Figure B: Global Vegetable Oil Exports
Figure C: Global Vegetable Oil Production 2013 (Tonnes)
Source: Oil World March 2014 Database
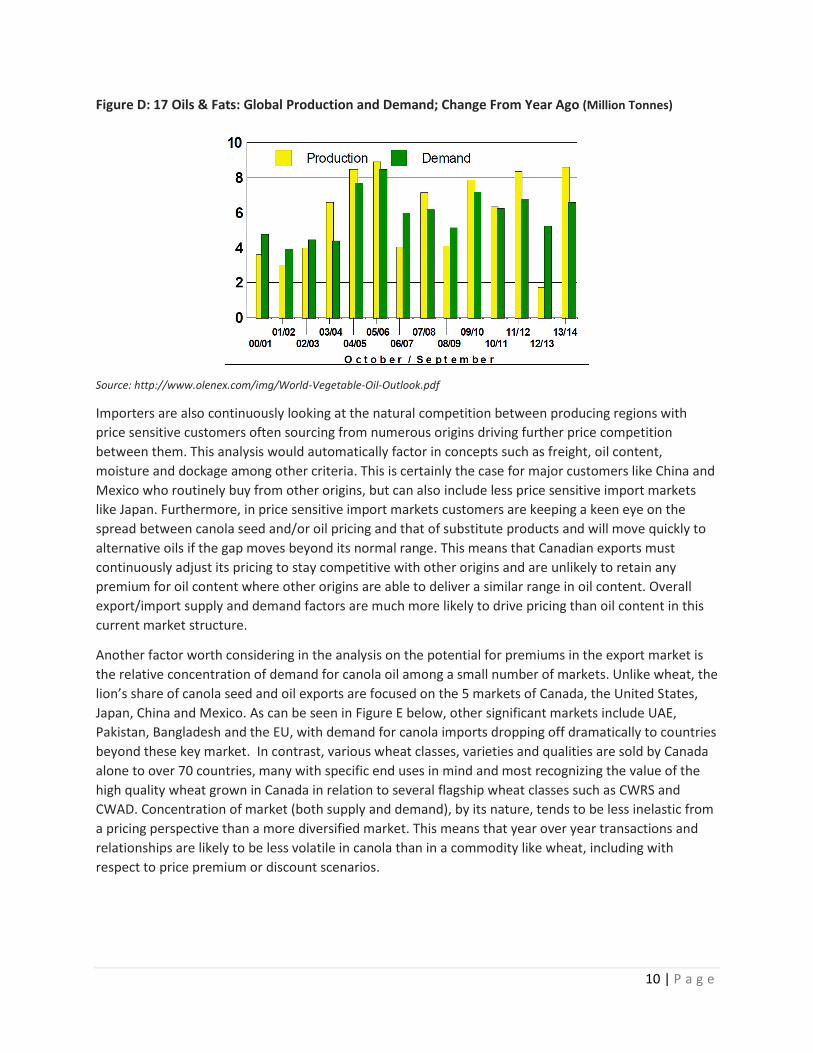
In addition, it is also relevant to demonstrate that production of global vegetable oil continues to
outstrip demand in most years, which will continue to put pressure on prices. This is especially relevant
in those instances where some oils (canola and sunflower) may be looking to capture premiums in
international markets but are facing intense competition from readily available substitutes at lower
prices (i.e., soybeans and sometimes palm). Figure D below outlines the change year over year in
production and demand; in the past four out of five years we have seen demand less than supply.
Palm Oil35%
Soybean Oil26%
Rapeseed (Canola) Oil15%
Sunflower Oil9%
Other15%
Global Vegetable Oil Production 2013 -Tonnes
Palm Oil Soybean Oil Rapeseed (Canola) Oil Sunflower Oil Other
10 | P a g e
Figure D: 17 Oils & Fats: Global Production and Demand; Change From Year Ago (Million Tonnes)
Source: http://www.olenex.com/img/World-Vegetable-Oil-Outlook.pdf
Importers are also continuously looking at the natural competition between producing regions with
price sensitive customers often sourcing from numerous origins driving further price competition
between them. This analysis would automatically factor in concepts such as freight, oil content,
moisture and dockage among other criteria. This is certainly the case for major customers like China and
Mexico who routinely buy from other origins, but can also include less price sensitive import markets
like Japan. Furthermore, in price sensitive import markets customers are keeping a keen eye on the
spread between canola seed and/or oil pricing and that of substitute products and will move quickly to
alternative oils if the gap moves beyond its normal range. This means that Canadian exports must
continuously adjust its pricing to stay competitive with other origins and are unlikely to retain any
premium for oil content where other origins are able to deliver a similar range in oil content. Overall
export/import supply and demand factors are much more likely to drive pricing than oil content in this
current market structure.
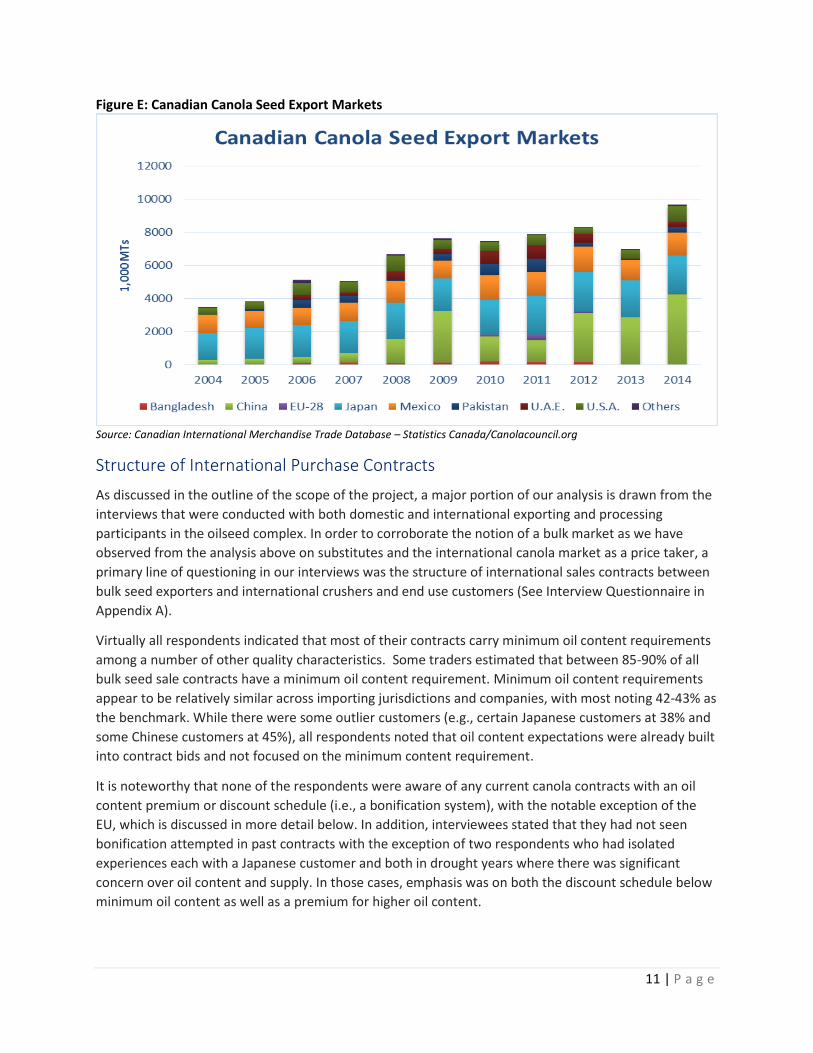
Another factor worth considering in the analysis on the potential for premiums in the export market is
the relative concentration of demand for canola oil among a small number of markets. Unlike wheat, the
lion’s share of canola seed and oil exports are focused on the 5 markets of Canada, the United States,
Japan, China and Mexico. As can be seen in Figure E below, other significant markets include UAE,
Pakistan, Bangladesh and the EU, with demand for canola imports dropping off dramatically to countries
beyond these key market. In contrast, various wheat classes, varieties and qualities are sold by Canada
alone to over 70 countries, many with specific end uses in mind and most recognizing the value of the
high quality wheat grown in Canada in relation to several flagship wheat classes such as CWRS and
CWAD. Concentration of market (both supply and demand), by its nature, tends to be less inelastic from
a pricing perspective than a more diversified market. This means that year over year transactions and
relationships are likely to be less volatile in canola than in a commodity like wheat, including with
respect to price premium or discount scenarios.
11 | P a g e
Figure E: Canadian Canola Seed Export Markets
Source: Canadian International Merchandise Trade Database – Statistics Canada/Canolacouncil.org
Structure of International Purchase Contracts
As discussed in the outline of the scope of the project, a major portion of our analysis is drawn from the
interviews that were conducted with both domestic and international exporting and processing
participants in the oilseed complex. In order to corroborate the notion of a bulk market as we have
observed from the analysis above on substitutes and the international canola market as a price taker, a
primary line of questioning in our interviews was the structure of international sales contracts between
bulk seed exporters and international crushers and end use customers (See Interview Questionnaire in
Appendix A).
Virtually all respondents indicated that most of their contracts carry minimum oil content requirements
among a number of other quality characteristics. Some traders estimated that between 85-90% of all
bulk seed sale contracts have a minimum oil content requirement. Minimum oil content requirements
appear to be relatively similar across importing jurisdictions and companies, with most noting 42-43% as
the benchmark. While there were some outlier customers (e.g., certain Japanese customers at 38% and
some Chinese customers at 45%), all respondents noted that oil content expectations were already built
into contract bids and not focused on the minimum content requirement.
It is noteworthy that none of the respondents were aware of any current canola contracts with an oil
content premium or discount schedule (i.e., a bonification system), with the notable exception of the
EU, which is discussed in more detail below. In addition, interviewees stated that they had not seen
bonification attempted in past contracts with the exception of two respondents who had isolated
experiences each with a Japanese customer and both in drought years where there was significant
concern over oil content and supply. In those cases, emphasis was on both the discount schedule below
minimum oil content as well as a premium for higher oil content.
12 | P a g e
All of this points to the international canola seed market demonstrating the characteristics of a bulk
commodity market with relatively few opportunities for differentiated or premium product categories
for bulk seed exports or domestic use. This is in direct contrast to the wheat market which is a highly
differentiated marketplace and numerous opportunities to extract further value from end use
customers with the segregation of various wheat classes, varieties and qualities within them
demonstrating specific functional characteristics and end use customer willingness to pay for them3. In
other words, canola seed from an end use perspective is fairly homogenous by comparison to wheat
where value chain participants are paying for components in a more direct fashion.
We have made the argument that canola is an international price taker with direct substitutes that keep
its price within a typical spread of other oil options and that canola is a relatively undifferentiated (i.e.,
bulk) commodity. We have also highlighted that international purchase contracts do not reflect any
opportunity for a premium schedule for high oil content in and of itself. Therefore, one must then look
at the possible implications for the redistribution of current values in the supply chain if a component
pricing system were implemented in Western Canada.
Structure of Crushing Industry
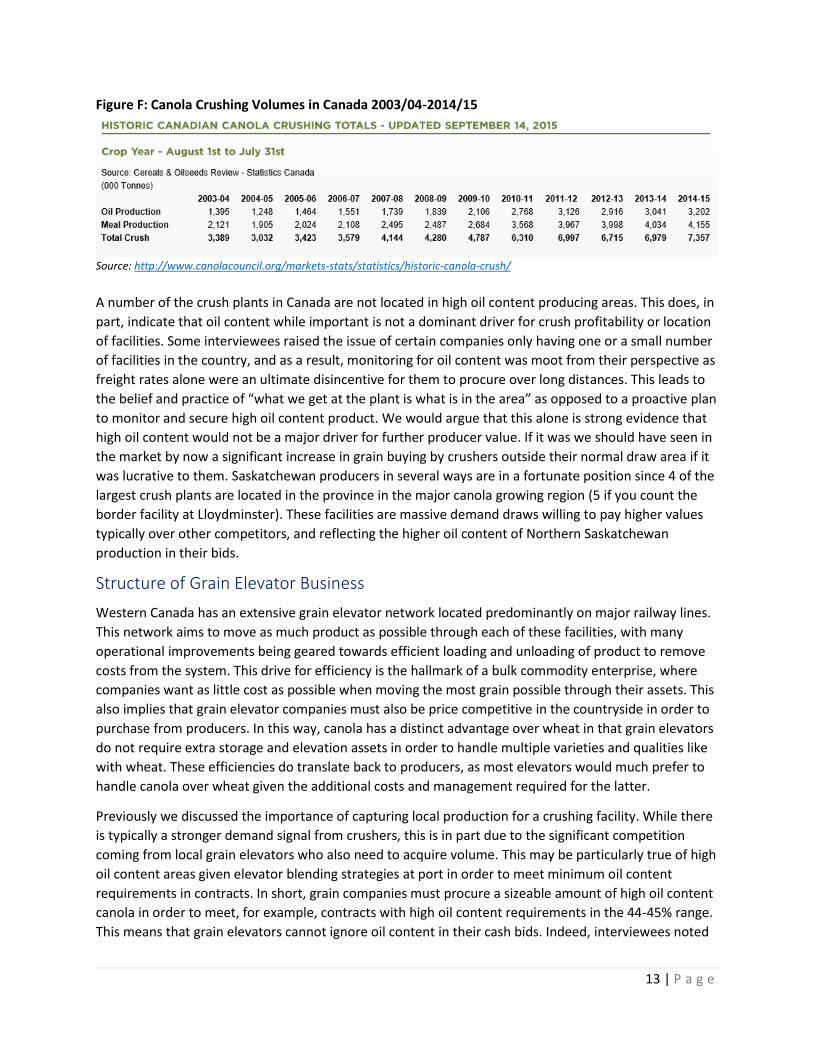
Canada currently has 14 crushing plants with 11 located in Western Canada. Combined they have the
capacity to crush 10 million tonnes of canola seed per year. In 2014/15, Canada crushed 7.3 million
tonnes of a total canola production of 15.5 million tonnes (See Figure F below) or 47% of total
production. As we have already described, local processing demand almost always represents the
highest price opportunity for producers given the captive nature of crushing facility supply to the
immediate draw area and the relative expense of overland freight costs to supply from outside of that
draw area. Several interviewees noted that crusher bids typically outpace elevator bids, with one
commentator indicating this occurs 8 years out of 10. All crusher respondents agreed that oil content
was a major component of value to crushers in their profitability. When asked what each percent of oil
content above the average meant to them given sunk costs of the crush operation, all indicated this was
heavily dependent on the crush margin and that the opportunity fluctuated significantly. Respondents
noted that the value of oil content, as one factor among many, was shown in the cash basis they were
paying local producers. While they agreed this was not completely transparent, it was from their
perspective an important element in the cash price. Several interviewees said that differences in cash
bids between competitors in a given region can often fluctuate between $10-30/tonne. This is reflective
of different companies having unique margin structures, efficiencies, sales, contract requirements, etc.
The fact that many of these elements are not transparent to some degree drives competition. Where
elements of cost are publicized (e.g., tariff fees for certain activities), the bid range for that service
between competitors tends to narrow significantly. Many interviewees were of the view that this would
happen in the case of published premium/discount schedules, and many of the international
respondents noted that bid ranges in bonification systems were narrower than other regions. In our
view a fully transparent oil premium/discount schedule would result in a narrowing of the competitive
bid range which we argue is not in producers’ favour.
3 http://www.agr.gc.ca/eng/industry-markets-and-trade/statistics-and-market-information/by-product-sector/crops/crops-market-information-canadian-industry/market-outlook-report/wheat-sector-profile-part-one-overview-november-2010/?id=1378843495280
13 | P a g e
Figure F: Canola Crushing Volumes in Canada 2003/04-2014/15
Source: http://www.canolacouncil.org/markets-stats/statistics/historic-canola-crush/
A number of the crush plants in Canada are not located in high oil content producing areas. This does, in
part, indicate that oil content while important is not a dominant driver for crush profitability or location
of facilities. Some interviewees raised the issue of certain companies only having one or a small number
of facilities in the country, and as a result, monitoring for oil content was moot from their perspective as
freight rates alone were an ultimate disincentive for them to procure over long distances. This leads to
the belief and practice of “what we get at the plant is what is in the area” as opposed to a proactive plan
to monitor and secure high oil content product. We would argue that this alone is strong evidence that
high oil content would not be a major driver for further producer value. If it was we should have seen in
the market by now a significant increase in grain buying by crushers outside their normal draw area if it
was lucrative to them. Saskatchewan producers in several ways are in a fortunate position since 4 of the
largest crush plants are located in the province in the major canola growing region (5 if you count the
border facility at Lloydminster). These facilities are massive demand draws willing to pay higher values
typically over other competitors, and reflecting the higher oil content of Northern Saskatchewan
production in their bids.
Structure of Grain Elevator Business
Western Canada has an extensive grain elevator network located predominantly on major railway lines.
This network aims to move as much product as possible through each of these facilities, with many
operational improvements being geared towards efficient loading and unloading of product to remove
costs from the system. This drive for efficiency is the hallmark of a bulk commodity enterprise, where
companies want as little cost as possible when moving the most grain possible through their assets. This
also implies that grain elevator companies must also be price competitive in the countryside in order to
purchase from producers. In this way, canola has a distinct advantage over wheat in that grain elevators
do not require extra storage and elevation assets in order to handle multiple varieties and qualities like
with wheat. These efficiencies do translate back to producers, as most elevators would much prefer to
handle canola over wheat given the additional costs and management required for the latter.
Previously we discussed the importance of capturing local production for a crushing facility. While there
is typically a stronger demand signal from crushers, this is in part due to the significant competition
coming from local grain elevators who also need to acquire volume. This may be particularly true of high
oil content areas given elevator blending strategies at port in order to meet minimum oil content
requirements in contracts. In short, grain companies must procure a sizeable amount of high oil content
canola in order to meet, for example, contracts with high oil content requirements in the 44-45% range.
This means that grain elevators cannot ignore oil content in their cash bids. Indeed, interviewees noted
14 | P a g e
that they would move into high oil content areas and “pay up” in their bids in order to secure this
product much like a local crusher would. This allows them to ultimately meet contracts with high
percentage requirements, as well as blend with lower oil content product from other regions in order to
hit the minimum criteria for those contracts with average percentage oil content (e.g., 42-43%). The
difference in basis levels across Western Canada are therefore already reflective of oil content, among
other factors.
As a result, the question of “am I getting compensated for the oil content of my product” appears to be
too narrow given the many factors at play in pricing. From a producer perspective, the more important
question is “do I have enough competition for my canola in my growing region to ensure I am getting
the full value for my product”. Some interviewees noted that the vast majority (certainly 95%+) of
producers would have at least 3 or 4 bids to consider in their growing area, with numerous places having
as many as 7 or 8 bids. The more bids available to an individual producer, the more likely that the
market will efficiently arbitrage any potential value for increased oil content in a producer’s canola.
Much like crushing facilities, elevators are also fixed assets with a relatively inflexible procurement
radius given the margin dampening effects of trucking freight for longer distance procurement. While
some companies have an elevator footprint that covers 150km draw radius’ across all Western Canadian
producing regions, that does not imply that a company does not require all of its facilities to move as
much volume as possible. That is to say, companies cannot afford to have assets that are not turning,
and as such, will acquire the crop produced in an elevator draw region to the best of its ability. As one
respondent indicated, “we want to move the whole crop and we will take the good along with the bad.”
Pricing Factors – Freight vs. Oil Content Premium
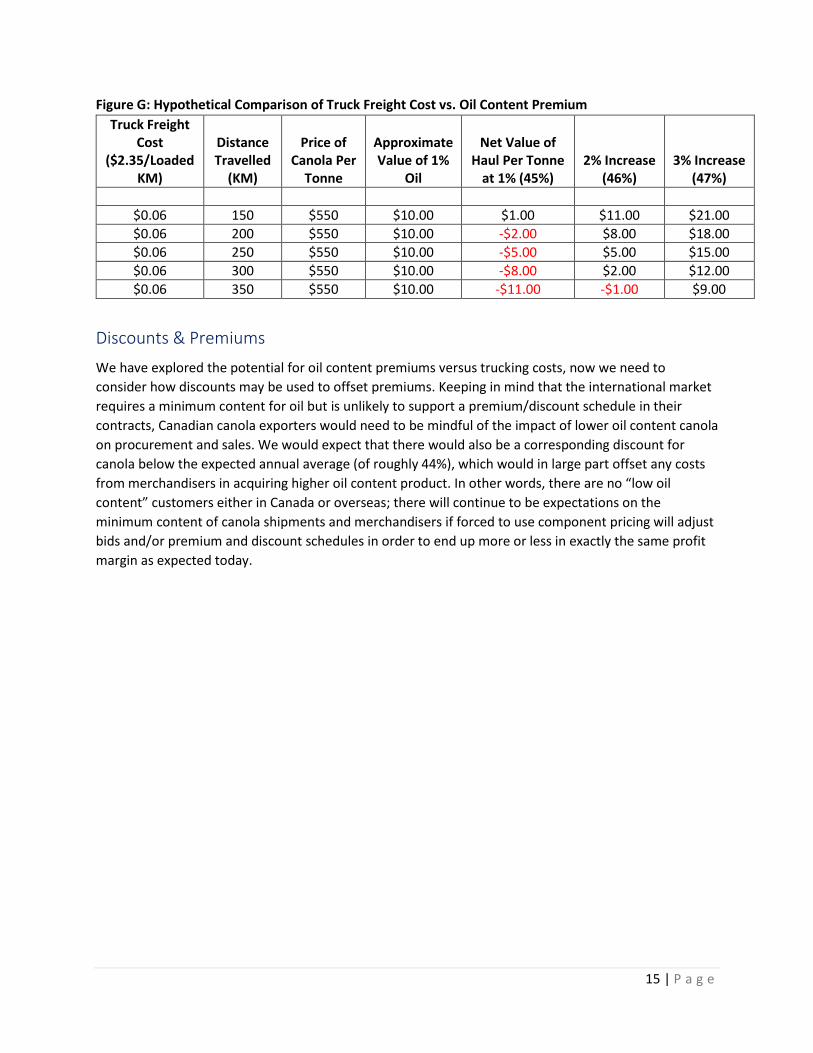
The idea that freight rates discourage longer distance buying can be seen in the current average truck
freight costs versus a potential premium for oil content. If we were to use current truck freight rates of
approximately $0.06 per loaded kilometer, a 300 km haul (double a draw distance) would cost on
average $18/tonne. By contrast a 1% bump in canola oil content over 44% at $550/tonne for canola
seed (based on average per tonne value in 2014/15) with 80% of the value on average being in the oil
content, means there is roughly a $10/tonne premium for the additional percentage. Even if we were to
double the percentage (i.e., $20/tonne), it would still not be attractive to compensate a grain buyer to
take the extraordinary action of procuring well beyond the natural draw area of a facility. Figure G
below sets out a table contrasting different distances and values. This simple calculation does not take
into account all of the other potential costs that would need to be borne to procure the seed (samples,
tests, extra storage space, extra time to handle, etc.), not to mention longer term costs such as
additional wear and tear on roads, among others. These would also be figured into estimates in some
fashion, meaning that the hypothetical values for each percent increase net payback are very aggressive
in this table. To arrive at a more realistic number, it would need to be adjusted downwards to account
for these other costs that would be charged as an additional tariff and/or reflected in a lower basis
before a premium is added on top.
15 | P a g e
Figure G: Hypothetical Comparison of Truck Freight Cost vs. Oil Content Premium
Truck Freight Cost
($2.35/Loaded KM)
Distance Travelled
(KM)
Price of Canola Per
Tonne
Approximate Value of 1%
Oil
Net Value of Haul Per Tonne
at 1% (45%) 2% Increase
(46%) 3% Increase
(47%)
$0.06 150 $550 $10.00 $1.00 $11.00 $21.00
$0.06 200 $550 $10.00 -$2.00 $8.00 $18.00
$0.06 250 $550 $10.00 -$5.00 $5.00 $15.00
$0.06 300 $550 $10.00 -$8.00 $2.00 $12.00
$0.06 350 $550 $10.00 -$11.00 -$1.00 $9.00
Discounts & Premiums
We have explored the potential for oil content premiums versus trucking costs, now we need to
consider how discounts may be used to offset premiums. Keeping in mind that the international market
requires a minimum content for oil but is unlikely to support a premium/discount schedule in their
contracts, Canadian canola exporters would need to be mindful of the impact of lower oil content canola
on procurement and sales. We would expect that there would also be a corresponding discount for
canola below the expected annual average (of roughly 44%), which would in large part offset any costs
from merchandisers in acquiring higher oil content product. In other words, there are no “low oil
content” customers either in Canada or overseas; there will continue to be expectations on the
minimum content of canola shipments and merchandisers if forced to use component pricing will adjust
bids and/or premium and discount schedules in order to end up more or less in exactly the same profit
margin as expected today.
16 | P a g e
Section 2: Production Factors
Overview
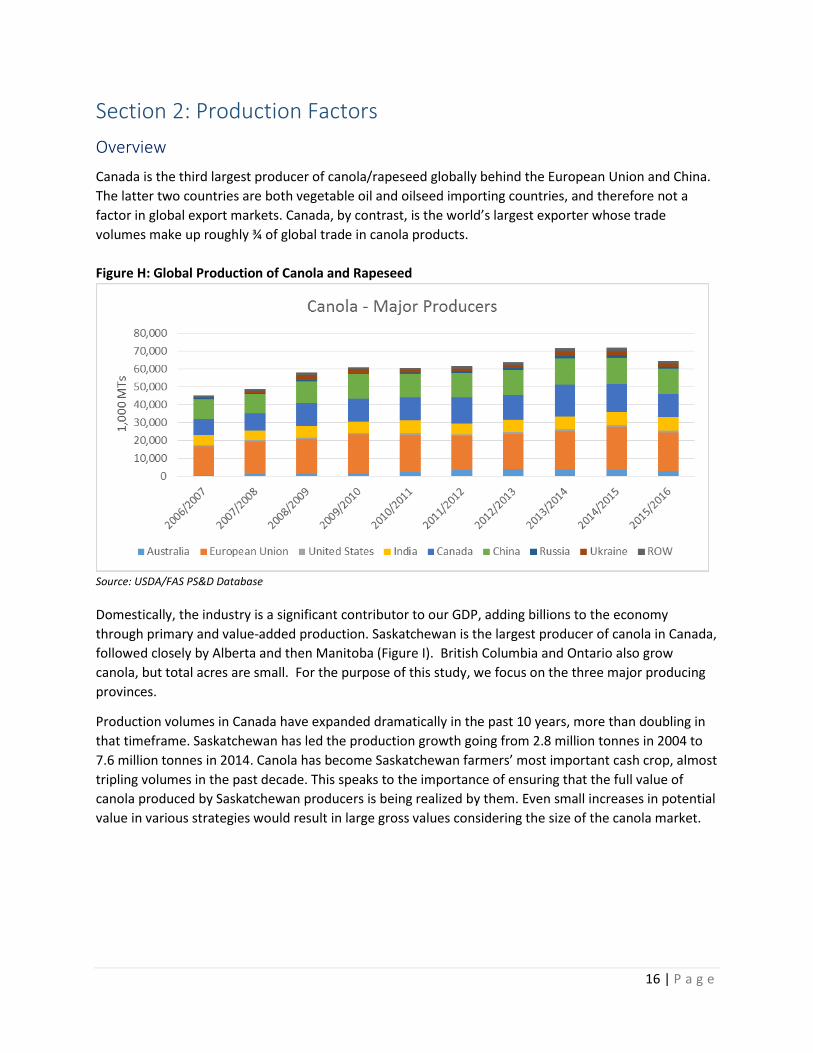
Canada is the third largest producer of canola/rapeseed globally behind the European Union and China.
The latter two countries are both vegetable oil and oilseed importing countries, and therefore not a
factor in global export markets. Canada, by contrast, is the world’s largest exporter whose trade
volumes make up roughly ¾ of global trade in canola products.
Figure H: Global Production of Canola and Rapeseed
Source: USDA/FAS PS&D Database
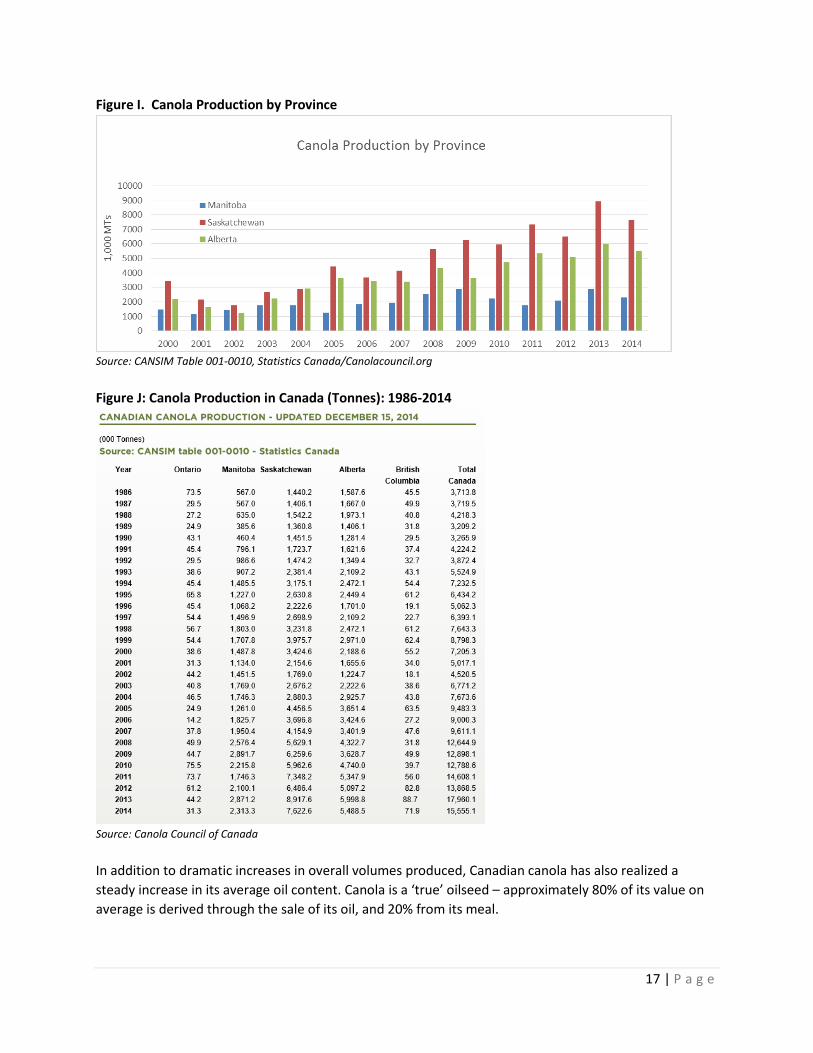
Domestically, the industry is a significant contributor to our GDP, adding billions to the economy
through primary and value-added production. Saskatchewan is the largest producer of canola in Canada,
followed closely by Alberta and then Manitoba (Figure I). British Columbia and Ontario also grow
canola, but total acres are small. For the purpose of this study, we focus on the three major producing
provinces.
Production volumes in Canada have expanded dramatically in the past 10 years, more than doubling in
that timeframe. Saskatchewan has led the production growth going from 2.8 million tonnes in 2004 to
7.6 million tonnes in 2014. Canola has become Saskatchewan farmers’ most important cash crop, almost
tripling volumes in the past decade. This speaks to the importance of ensuring that the full value of
canola produced by Saskatchewan producers is being realized by them. Even small increases in potential
value in various strategies would result in large gross values considering the size of the canola market.
17 | P a g e
Figure I. Canola Production by Province
Source: CANSIM Table 001-0010, Statistics Canada/Canolacouncil.org
Figure J: Canola Production in Canada (Tonnes): 1986-2014
Source: Canola Council of Canada
In addition to dramatic increases in overall volumes produced, Canadian canola has also realized a
steady increase in its average oil content. Canola is a ‘true’ oilseed – approximately 80% of its value on
average is derived through the sale of its oil, and 20% from its meal.
18 | P a g e
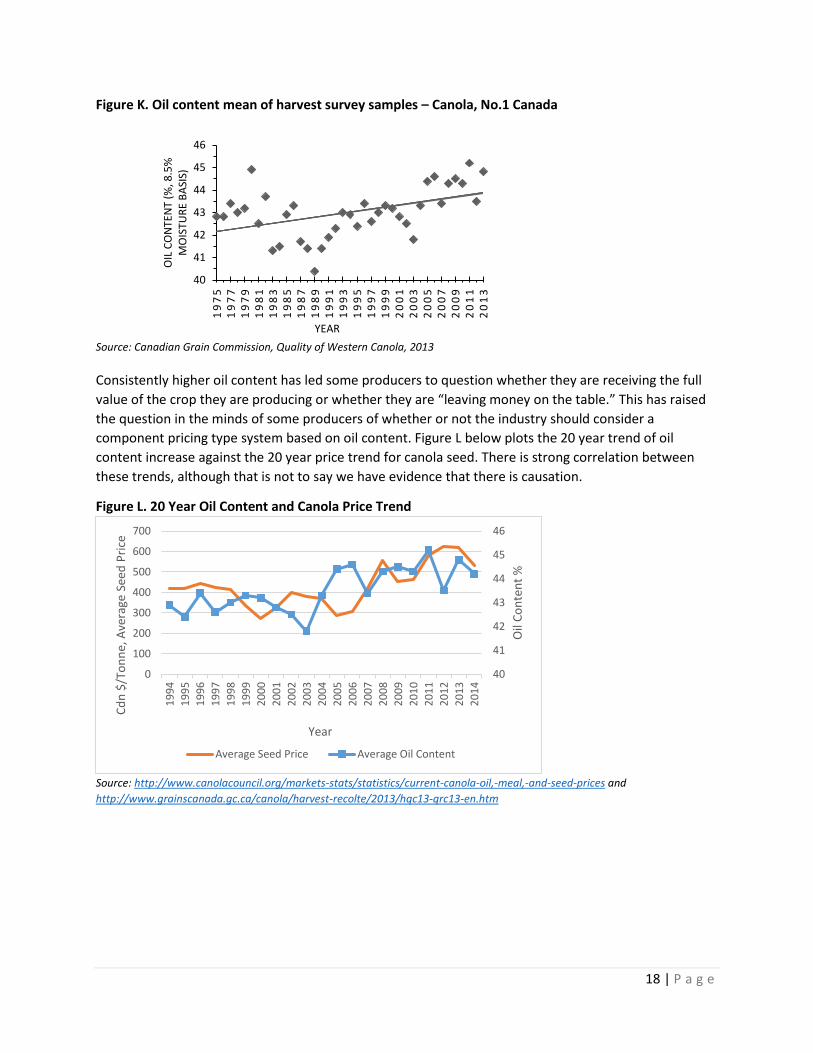
Figure K. Oil content mean of harvest survey samples – Canola, No.1 Canada
Source: Canadian Grain Commission, Quality of Western Canola, 2013
Consistently higher oil content has led some producers to question whether they are receiving the full
value of the crop they are producing or whether they are “leaving money on the table.” This has raised
the question in the minds of some producers of whether or not the industry should consider a
component pricing type system based on oil content. Figure L below plots the 20 year trend of oil
content increase against the 20 year price trend for canola seed. There is strong correlation between
these trends, although that is not to say we have evidence that there is causation.
Figure L. 20 Year Oil Content and Canola Price Trend
Source: http://www.canolacouncil.org/markets-stats/statistics/current-canola-oil,-meal,-and-seed-prices and
http://www.grainscanada.gc.ca/canola/harvest-recolte/2013/hqc13-qrc13-en.htm
40
41
42
43
44
45
46
19
75
19
77
19
79
19
81
19
83
19
85
19
87
19
89
19
91
19
93
19
95
19
97
19
99
20
01
20
03
20
05
20
07
20
09
20
11
20
13
OIL
CO
NTE
NT
(%, 8
.5%
M
OIS
TUR
E B
ASI
S)
YEAR
40
41
42
43
44
45
46
0
100
200
300
400
500
600
700
19
94
19
95
19
96
19
97
19
98
19
99
20
00
20
01
20
02
20
03
20
04
20
05
20
06
20
07
20
08
20
09
20
10
20
11
20
12
20
13
20
14
Oil
Co
nte
nt
%
Cd
n $
/To
nn
e, A
vera
ge S
eed
Pri
ce
Year
Average Seed Price Average Oil Content
19 | P a g e
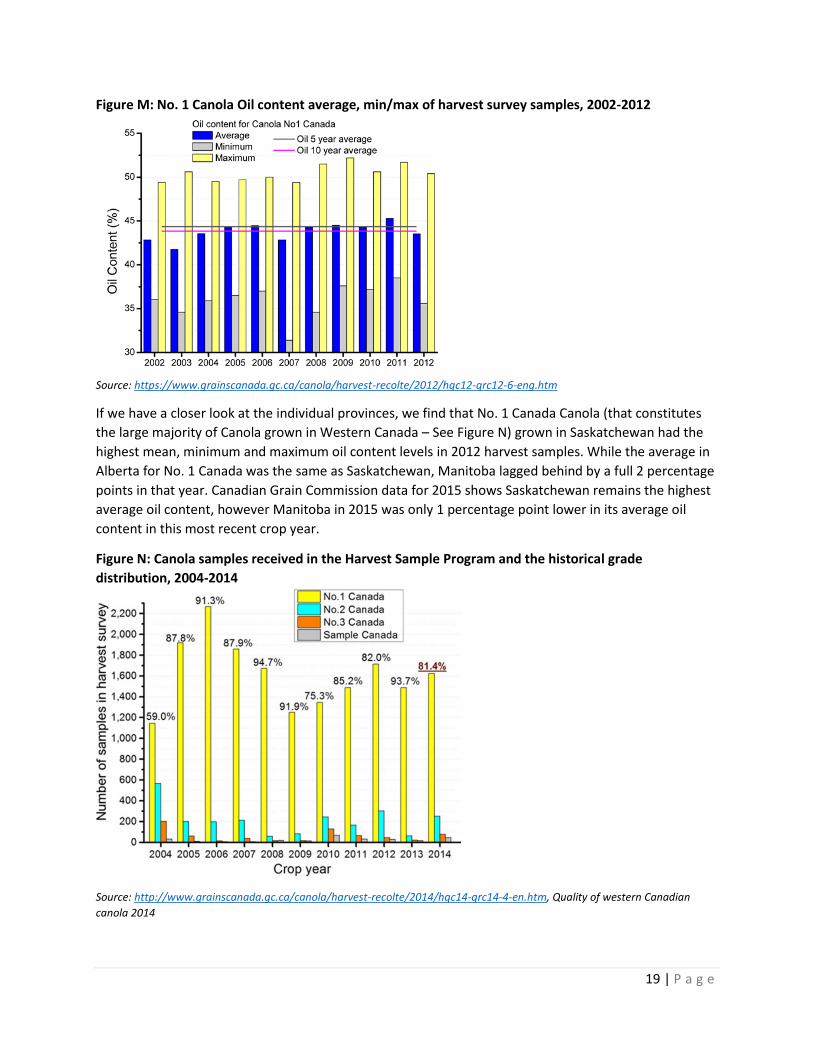
Figure M: No. 1 Canola Oil content average, min/max of harvest survey samples, 2002-2012
Source: https://www.grainscanada.gc.ca/canola/harvest-recolte/2012/hqc12-qrc12-6-eng.htm
If we have a closer look at the individual provinces, we find that No. 1 Canada Canola (that constitutes
the large majority of Canola grown in Western Canada – See Figure N) grown in Saskatchewan had the
highest mean, minimum and maximum oil content levels in 2012 harvest samples. While the average in
Alberta for No. 1 Canada was the same as Saskatchewan, Manitoba lagged behind by a full 2 percentage
points in that year. Canadian Grain Commission data for 2015 shows Saskatchewan remains the highest
average oil content, however Manitoba in 2015 was only 1 percentage point lower in its average oil
content in this most recent crop year.
Figure N: Canola samples received in the Harvest Sample Program and the historical grade
distribution, 2004-2014
Source: http://www.grainscanada.gc.ca/canola/harvest-recolte/2014/hqc14-qrc14-4-en.htm, Quality of western Canadian
canola 2014
20 | P a g e
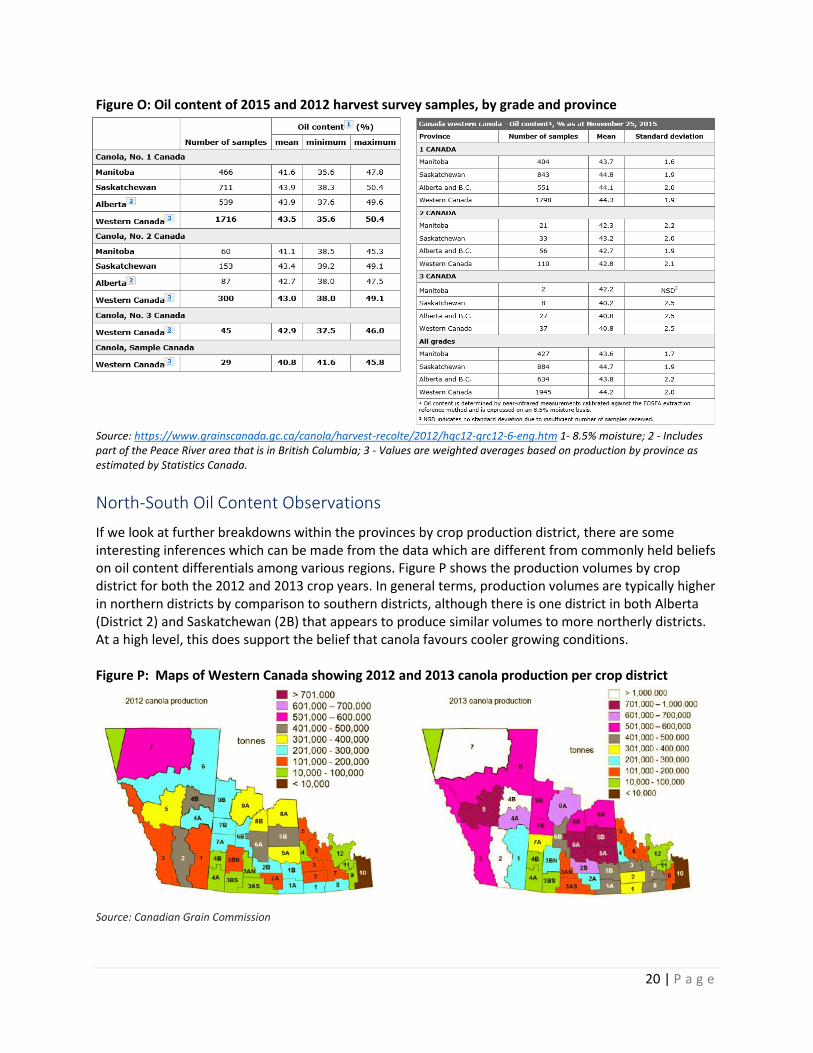
Figure O: Oil content of 2015 and 2012 harvest survey samples, by grade and province
Source: https://www.grainscanada.gc.ca/canola/harvest-recolte/2012/hqc12-qrc12-6-eng.htm 1- 8.5% moisture; 2 - Includes part of the Peace River area that is in British Columbia; 3 - Values are weighted averages based on production by province as estimated by Statistics Canada.
North-South Oil Content Observations
If we look at further breakdowns within the provinces by crop production district, there are some interesting inferences which can be made from the data which are different from commonly held beliefs on oil content differentials among various regions. Figure P shows the production volumes by crop district for both the 2012 and 2013 crop years. In general terms, production volumes are typically higher in northern districts by comparison to southern districts, although there is one district in both Alberta (District 2) and Saskatchewan (2B) that appears to produce similar volumes to more northerly districts. At a high level, this does support the belief that canola favours cooler growing conditions. Figure P: Maps of Western Canada showing 2012 and 2013 canola production per crop district
Source: Canadian Grain Commission
21 | P a g e
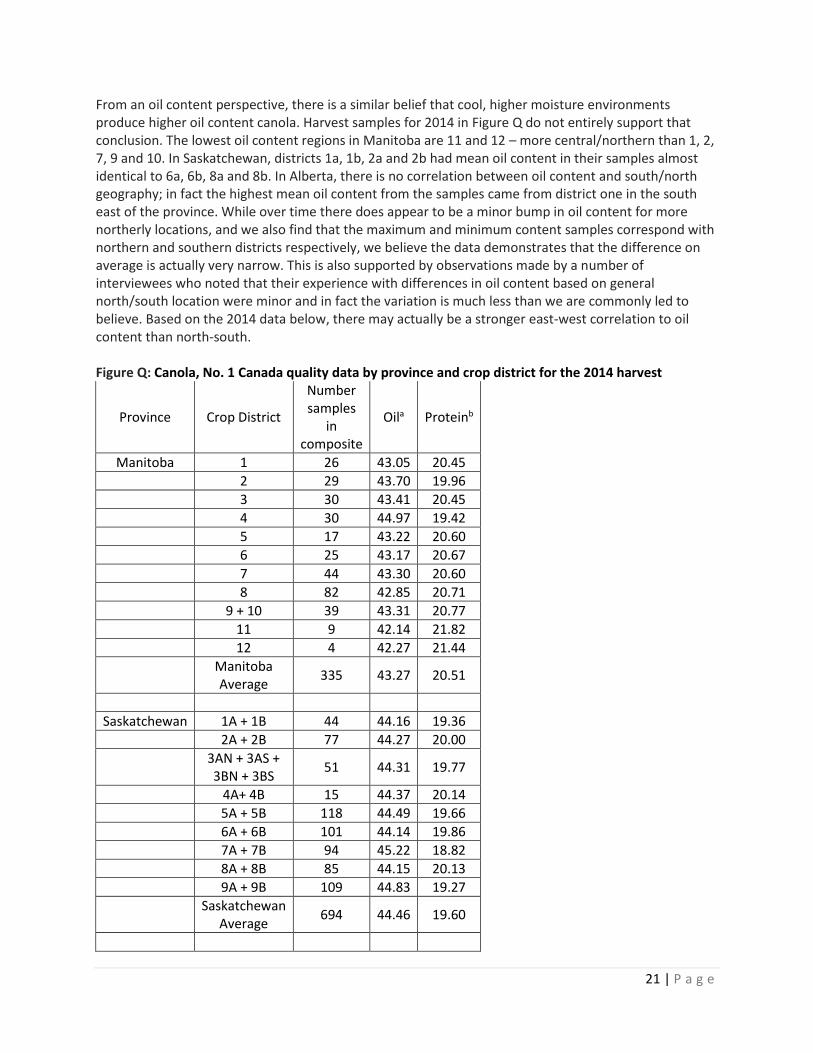
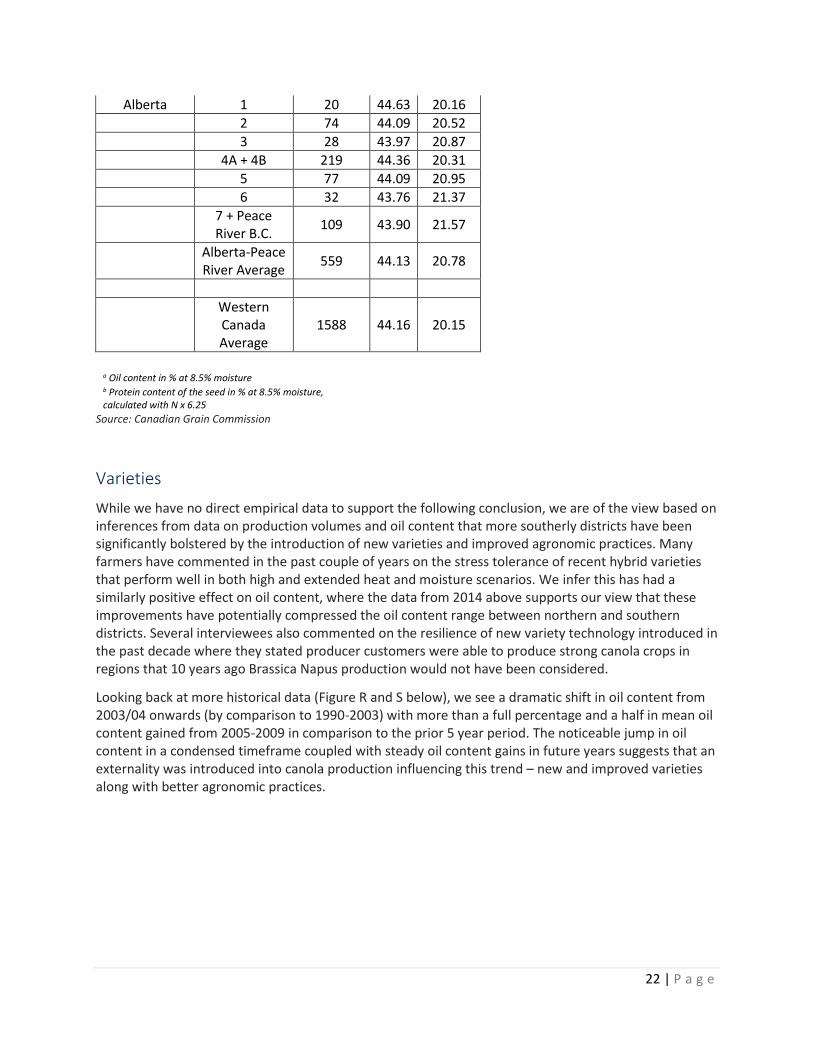
From an oil content perspective, there is a similar belief that cool, higher moisture environments produce higher oil content canola. Harvest samples for 2014 in Figure Q do not entirely support that conclusion. The lowest oil content regions in Manitoba are 11 and 12 – more central/northern than 1, 2, 7, 9 and 10. In Saskatchewan, districts 1a, 1b, 2a and 2b had mean oil content in their samples almost identical to 6a, 6b, 8a and 8b. In Alberta, there is no correlation between oil content and south/north geography; in fact the highest mean oil content from the samples came from district one in the south east of the province. While over time there does appear to be a minor bump in oil content for more northerly locations, and we also find that the maximum and minimum content samples correspond with northern and southern districts respectively, we believe the data demonstrates that the difference on average is actually very narrow. This is also supported by observations made by a number of interviewees who noted that their experience with differences in oil content based on general north/south location were minor and in fact the variation is much less than we are commonly led to believe. Based on the 2014 data below, there may actually be a stronger east-west correlation to oil content than north-south. Figure Q: Canola, No. 1 Canada quality data by province and crop district for the 2014 harvest
Province Crop District
Number samples
in composite
Oila Proteinb
Manitoba 1 26 43.05 20.45
2 29 43.70 19.96
3 30 43.41 20.45
4 30 44.97 19.42
5 17 43.22 20.60
6 25 43.17 20.67
7 44 43.30 20.60
8 82 42.85 20.71
9 + 10 39 43.31 20.77
11 9 42.14 21.82
12 4 42.27 21.44
Manitoba Average
335 43.27 20.51
Saskatchewan 1A + 1B 44 44.16 19.36
2A + 2B 77 44.27 20.00
3AN + 3AS + 3BN + 3BS
51 44.31 19.77
4A+ 4B 15 44.37 20.14
5A + 5B 118 44.49 19.66
6A + 6B 101 44.14 19.86
7A + 7B 94 45.22 18.82
8A + 8B 85 44.15 20.13
9A + 9B 109 44.83 19.27
Saskatchewan
Average 694 44.46 19.60
22 | P a g e
Alberta 1 20 44.63 20.16
2 74 44.09 20.52
3 28 43.97 20.87
4A + 4B 219 44.36 20.31
5 77 44.09 20.95
6 32 43.76 21.37
7 + Peace River B.C.
109 43.90 21.57
Alberta-Peace River Average
559 44.13 20.78
Western Canada Average
1588 44.16 20.15
a Oil content in % at 8.5% moisture b Protein content of the seed in % at 8.5% moisture, calculated with N x 6.25
Source: Canadian Grain Commission
Varieties
While we have no direct empirical data to support the following conclusion, we are of the view based on inferences from data on production volumes and oil content that more southerly districts have been significantly bolstered by the introduction of new varieties and improved agronomic practices. Many farmers have commented in the past couple of years on the stress tolerance of recent hybrid varieties that perform well in both high and extended heat and moisture scenarios. We infer this has had a similarly positive effect on oil content, where the data from 2014 above supports our view that these improvements have potentially compressed the oil content range between northern and southern districts. Several interviewees also commented on the resilience of new variety technology introduced in the past decade where they stated producer customers were able to produce strong canola crops in regions that 10 years ago Brassica Napus production would not have been considered.
Looking back at more historical data (Figure R and S below), we see a dramatic shift in oil content from 2003/04 onwards (by comparison to 1990-2003) with more than a full percentage and a half in mean oil content gained from 2005-2009 in comparison to the prior 5 year period. The noticeable jump in oil content in a condensed timeframe coupled with steady oil content gains in future years suggests that an externality was introduced into canola production influencing this trend – new and improved varieties along with better agronomic practices.
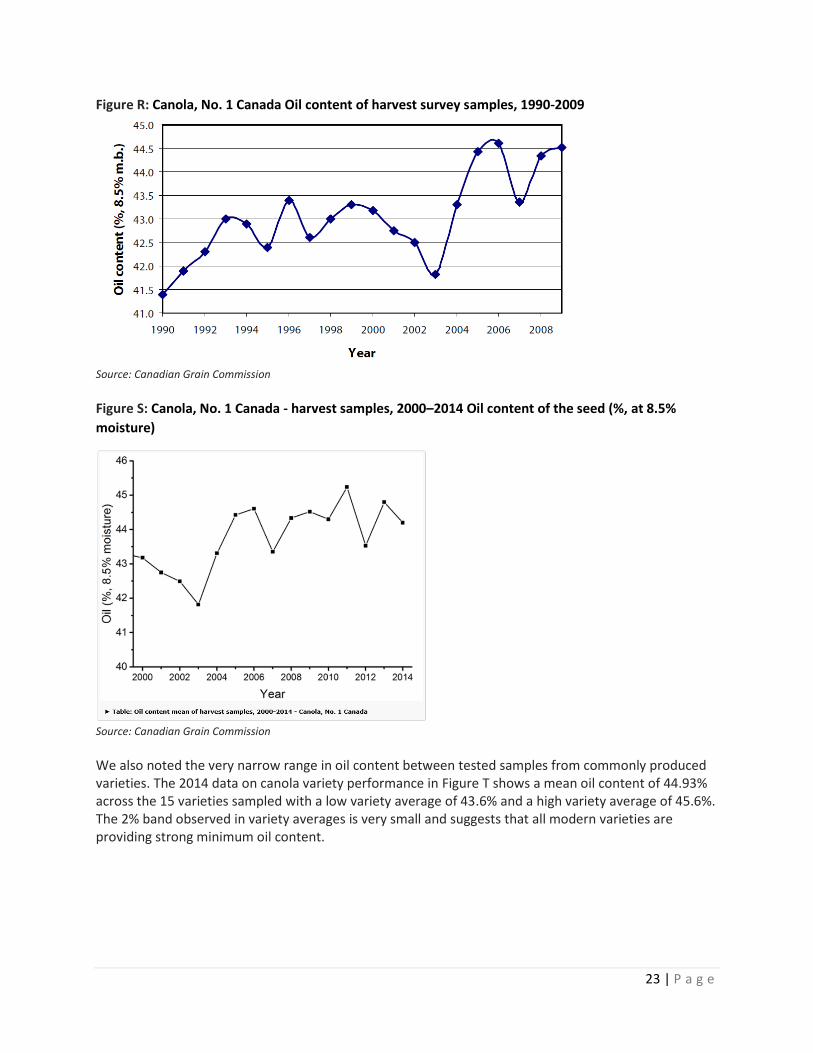
23 | P a g e
Figure R: Canola, No. 1 Canada Oil content of harvest survey samples, 1990-2009
Source: Canadian Grain Commission
Figure S: Canola, No. 1 Canada - harvest samples, 2000–2014 Oil content of the seed (%, at 8.5%
moisture)
Source: Canadian Grain Commission
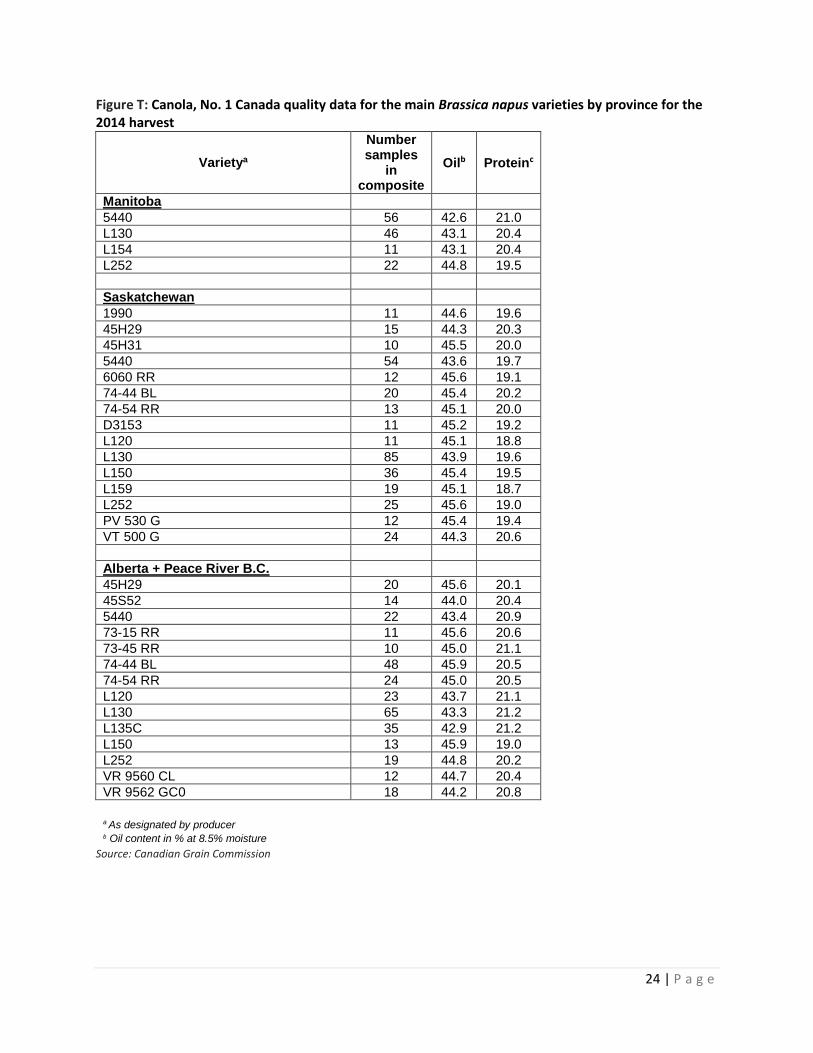
We also noted the very narrow range in oil content between tested samples from commonly produced varieties. The 2014 data on canola variety performance in Figure T shows a mean oil content of 44.93% across the 15 varieties sampled with a low variety average of 43.6% and a high variety average of 45.6%. The 2% band observed in variety averages is very small and suggests that all modern varieties are providing strong minimum oil content.
24 | P a g e
Figure T: Canola, No. 1 Canada quality data for the main Brassica napus varieties by province for the 2014 harvest
Varietya
Number samples
in composite
Oilb Proteinc
Manitoba
5440 56 42.6 21.0
L130 46 43.1 20.4
L154 11 43.1 20.4
L252 22 44.8 19.5
Saskatchewan
1990 11 44.6 19.6
45H29 15 44.3 20.3
45H31 10 45.5 20.0
5440 54 43.6 19.7
6060 RR 12 45.6 19.1
74-44 BL 20 45.4 20.2
74-54 RR 13 45.1 20.0
D3153 11 45.2 19.2
L120 11 45.1 18.8
L130 85 43.9 19.6
L150 36 45.4 19.5
L159 19 45.1 18.7
L252 25 45.6 19.0
PV 530 G 12 45.4 19.4
VT 500 G 24 44.3 20.6
Alberta + Peace River B.C.
45H29 20 45.6 20.1
45S52 14 44.0 20.4
5440 22 43.4 20.9
73-15 RR 11 45.6 20.6
73-45 RR 10 45.0 21.1
74-44 BL 48 45.9 20.5
74-54 RR 24 45.0 20.5
L120 23 43.7 21.1
L130 65 43.3 21.2
L135C 35 42.9 21.2
L150 13 45.9 19.0
L252 19 44.8 20.2
VR 9560 CL 12 44.7 20.4
VR 9562 GC0 18 44.2 20.8
a As designated by producer b Oil content in % at 8.5% moisture
Source: Canadian Grain Commission
25 | P a g e
Environment
Of the various factors discussed in this report, environmental conditions are likely to have the greatest
influence on oil content, even more so than genetics4. The two main environmental factors influencing
oil content are soil moisture and temperature. Prithchard et al studied the impact of environmental
variables on oil content and found that high rainfall and cooler temperatures allowed for a longer
maturation phase, which in turn allowed for longer oil accumulation in the seed, resulting in higher oil
content5.
Early seeding enables the plants to take advantage of spring moisture, but additional moisture following
flowering is also key. Walton, Ping and Bowden found a strong correlation between yield and oil content
and post-flowering rainfall. Their findings are similar to those of Jensen et al, who found that oil content
fell from 43.3% to 39.9% when comparing well-watered plants vs those under drought conditions6.
Walton, Ping and Bowden’s overall conclusion was that rainfall/moisture had greater impact on oil
content more so than temperature but they also found that temperature played a role.
High temperatures during development and maturation of the canola plant have also been shown to
negatively impact oil content. Sharp increases in temperature from flowering to maturity have been
shown to hasten maturity, thereby shortening the time for oil accumulation in the seed and lowering its
overall oil content7. The same study not only highlighted the impact of temperature on the overall oil
content, but also how it influenced the composition of the oil, with higher temperatures resulting in
higher linolenic acid and lower oleic acid.
Environmental stresses, especially after flowering has been shown to have a significant impact on
overall oil content. Canola producers felt this first hand in 2003 when hot, dry temperatures, including
during the both the day and night, dropped the average oil content down to 41.8%. Cooler, wetter
weather the following growing year helped improve oil content average to 43.3%. Fluctuations in
environmental factors throughout the subsequent growing years continue to influence the average oil
content.
With environmental factors being a key variable in oil content, and taking into account the general
improvement in genetics to improve higher oil content canola even under stressful environmental
conditions, we find that producers have relatively few tools to directly influence oil content. This
conclusion is yet another aspect to keep in mind as producers weigh the options on whether or not
component pricing adds value at farm gate.
4 https://www.dekalb.ca/_uploads/documents/Agronomic_Information/CanolaArchive/what_affects_canola_oil.pdf 5 Prithchard, F.M., Eagles, H.A., Norton, R.M., Salisbury, P.A., and M. Nicolas. Environmental Effects on Seed Composition of Victorian Canola. 6 Jensen, C.R., Mogensen, V. O., Mortensen, G., Fieldsend, J.K., Milford, G.F.I., Andersen, M.N. and Thage. J.H., (1996). Seed glucosinolate, oil and protein contents of field grown rape (Brassica napus) affected by soil drying and evaporative demand. Field Crop Research. 47, 93-105 7 Fayyaz-ul-Hassan, Hakoomat Ali, Mumtaz Akhtar Cheema, and Abdul Manaf. Effects of Environmental variation on canola content and fatty acid composition of canola cultivars.
26 | P a g e
Agronomic Practices
Less is known about the effects of agronomic practices on oil content versus growing conditions and variety advancements. There are known factors that may influence quality and oil content from an agronomic perspective, but it is still somewhat limited in a farmer’s ability to influence greatly.
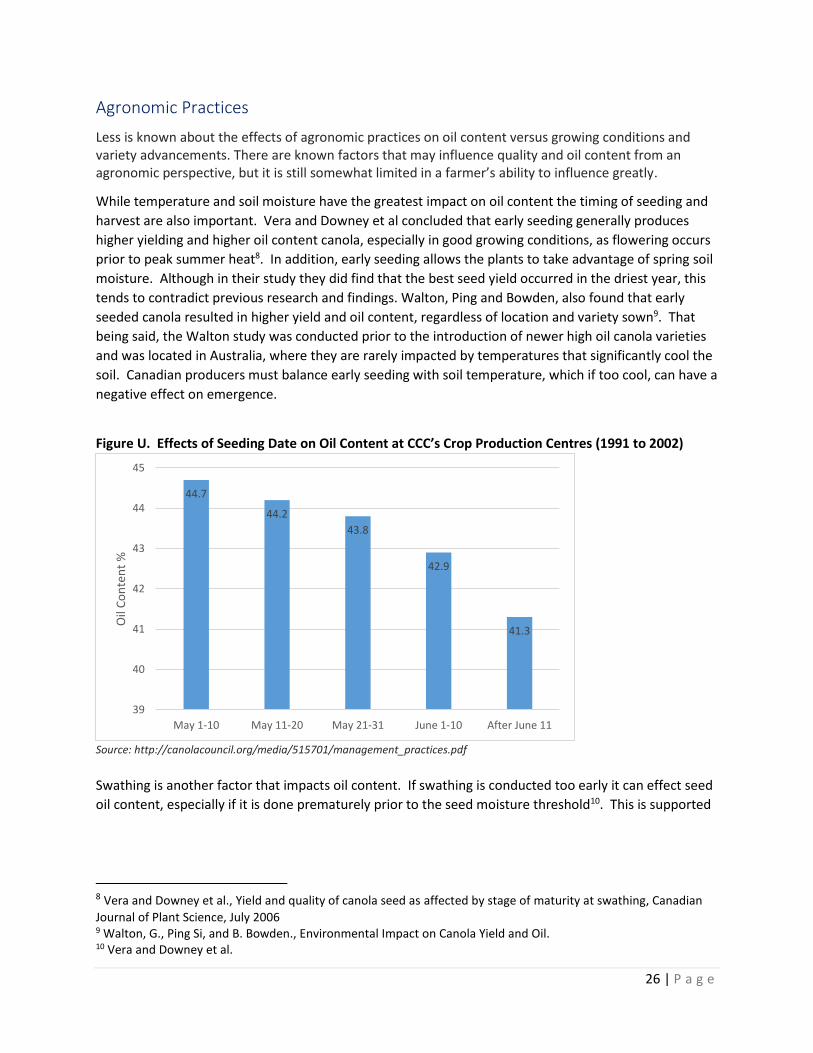
While temperature and soil moisture have the greatest impact on oil content the timing of seeding and
harvest are also important. Vera and Downey et al concluded that early seeding generally produces
higher yielding and higher oil content canola, especially in good growing conditions, as flowering occurs
prior to peak summer heat8. In addition, early seeding allows the plants to take advantage of spring soil
moisture. Although in their study they did find that the best seed yield occurred in the driest year, this
tends to contradict previous research and findings. Walton, Ping and Bowden, also found that early
seeded canola resulted in higher yield and oil content, regardless of location and variety sown9. That
being said, the Walton study was conducted prior to the introduction of newer high oil canola varieties
and was located in Australia, where they are rarely impacted by temperatures that significantly cool the
soil. Canadian producers must balance early seeding with soil temperature, which if too cool, can have a
negative effect on emergence.
Figure U. Effects of Seeding Date on Oil Content at CCC’s Crop Production Centres (1991 to 2002)
Source: http://canolacouncil.org/media/515701/management_practices.pdf
Swathing is another factor that impacts oil content. If swathing is conducted too early it can effect seed
oil content, especially if it is done prematurely prior to the seed moisture threshold10. This is supported
8 Vera and Downey et al., Yield and quality of canola seed as affected by stage of maturity at swathing, Canadian
Journal of Plant Science, July 2006 9 Walton, G., Ping Si, and B. Bowden., Environmental Impact on Canola Yield and Oil. 10 Vera and Downey et al.
44.7
44.2
43.8
42.9
41.3
39
40
41
42
43
44
45
May 1-10 May 11-20 May 21-31 June 1-10 After June 11
Oil
Co
nte
nt
%
27 | P a g e
through data produced by the Canola Council of Canada which showed later swathing, when seed colour
is 60-70% changed, resulted in a 1% increase in oil content11.
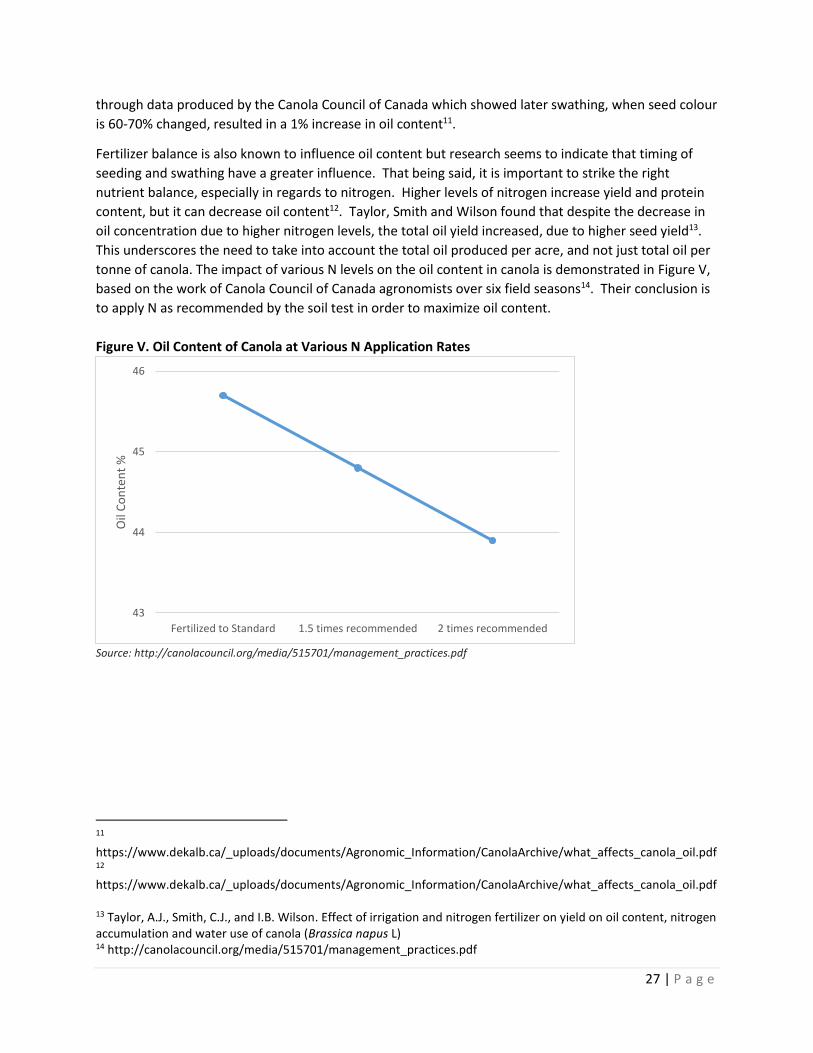
Fertilizer balance is also known to influence oil content but research seems to indicate that timing of
seeding and swathing have a greater influence. That being said, it is important to strike the right
nutrient balance, especially in regards to nitrogen. Higher levels of nitrogen increase yield and protein
content, but it can decrease oil content12. Taylor, Smith and Wilson found that despite the decrease in
oil concentration due to higher nitrogen levels, the total oil yield increased, due to higher seed yield13.
This underscores the need to take into account the total oil produced per acre, and not just total oil per
tonne of canola. The impact of various N levels on the oil content in canola is demonstrated in Figure V,
based on the work of Canola Council of Canada agronomists over six field seasons14. Their conclusion is
to apply N as recommended by the soil test in order to maximize oil content.
Figure V. Oil Content of Canola at Various N Application Rates
Source: http://canolacouncil.org/media/515701/management_practices.pdf
11 https://www.dekalb.ca/_uploads/documents/Agronomic_Information/CanolaArchive/what_affects_canola_oil.pdf 12 https://www.dekalb.ca/_uploads/documents/Agronomic_Information/CanolaArchive/what_affects_canola_oil.pdf 13 Taylor, A.J., Smith, C.J., and I.B. Wilson. Effect of irrigation and nitrogen fertilizer on yield on oil content, nitrogen accumulation and water use of canola (Brassica napus L) 14 http://canolacouncil.org/media/515701/management_practices.pdf
43
44
45
46
Fertilized to Standard 1.5 times recommended 2 times recommended
Oil
Co
nte
nt
%
28 | P a g e
Section 3: Implementation Issues
Sampling/Testing
Moving to component pricing would likely require industry investment in equipment for testing and
administration. Given the size and volume of canola and other grains moving through the Canadian
system, the test required to determine the oil content would need to be a “driveway” test, able to be
administered accurately and in minimal time as the grain is being delivered.
The Australian driveway test uses a near-infrared (NIR) system that takes a very short time on clean seed
and measures protein, oil and moisture. Producers are paid on the basis of the NIR at the time of
delivery. Each of the grain handlers will either use the NIR supplier (FOSS) supplied calibrations or
develop their own. The Australian Oilseeds Federation (AOF) ensures the accuracy of NIR through a
“test check” or “ring test” program which is applied to all participating labs. The variation rate of the
testing is very low (an average variation of 0.39 of one percent across the 15 participating labs as of the
July 2015 report) and reported monthly on the AOF website15. Test results are rarely disputed.
The Canadian Grain Commission (CGC) has also considered rapid methods of testing oil content,
including 3 Near-infrared (NIR) spectrometers, two Fourier Transform (FT-NIR) systems, Pulse nuclear
magnetic resonance (NMR) and an ultrapycnometer. They found oil content could be quickly
determined, but controls were necessary to ensure consistency between techniques and parameters.16
Any move to component pricing would require guidelines that emphasize consistent standards. The
testing equipment tested by the CGC was the DICKEY-john filter which costs $16,000-$20,000 and the
FOSS6500 NIR which is priced at $80,00017.
There are also a number of elevators and crushers conducting driveway tests currently for oil content in
canola. Based on the numerous interviews conducted, these tests are done by exporters in particular to
understand if rail cars delivered to port from various regions can meet the minimum oil content
specification from buyers and if not, a basic means to blend at port with higher content canola to meet
the contract terms. While these tests are not tied to pricing per se, we infer from this activity that tests
are relatively accurate and companies comfortable with the results.
Given the lack of dispute of driveway testing in the Australia and the EU, we do not think this would be
an issue in Canada either. However, significant costs would likely be added to the system for testing
equipment, training and infrastructure needed for every delivery point which would undoubtedly make
its way back into either pricing or potentially additional fees. Producers should be aware that a portion
of these costs would likely be borne by them.
Storage/Segregation
Storage both on farm and off of higher oil canola requires slightly different storage parameters than
lower oil canola in order to prevent spoilage. While other factors like moisture content and
temperature play an important role in the safe storage of canola, it has been found that the higher the
15 Australian Oilseeds Federation. Test Check Program. http://www.australianoilseeds.com/Technical_Info/test_check_program 16 Canadian Grain Commission: Measurement of Oil Content by Rapid Analytical Technique 17 Veronique J. Barthet, Programs Manager Oilseeds, Grain Research Laboratory, CGC
29 | P a g e
oil content, the less dry matter there is, making it more prone to spoilage than lower oil canola. Sun,
Jian et al, found that higher oil canola, under the same storage conditions and following the guidelines
recommended by the Canadian Grain Commission for low oil canola, had the same or shorter safe
storage times.18 They also determined that higher oil canola needed to be stored with lower moisture
content than lower oil canola. For every 1% higher oil content, a decrease in the safe moisture level by
0.1% was required19. For example, canola with 48% oil should be stored at 0.5% lower moisture than
canola with 43% oil20. In addition, Sun, Jian et al found that higher oil canola had a lower thermal
conductivity than lower oil canola, thereby taking longer to dissipate heat and cool down, and increasing
the risk of spoilage. Based on these findings it would be safe to assume that higher oil canola would
require more hands on management time than lower oil canola if storage is required for any length of
time.
In order to try and capture more value from the higher oil canola, additional storage facilities may need
to be added to segregate it from the lower oil content. Investing in additional storage for segregation
was not seen as cost recoverable from end use customers for all of the companies interviewed, meaning
that the value chain would either need to bear these costs if it implemented a component pricing
system, or simply not engage in segregation despite adoption of a premium-discount schedule.
Basis
While many producers are looking to create value with a component pricing system, industry feedback
indicates that basis level would adjust for the competitive nature of the canola market and bring it back
into equilibrium to where competition among buyers sits. So if oil content was added in as a factor, we
expect the basis will adjust to these new fixed elements. In other words no additional money or value
will be added to system despite a premium or discount being paid.
As previously noted, there is very little if any opportunity to capture a premium from the export market
for segregating product. If a component pricing system were put into place, it would be expected that
grain handlers would adjust the basis to compensate for the premiums paid to the producers given their
inability to pass these costs on to customers. As such, there would be very little net benefit to the
producer, as no extra value would be added to the system.
The canola market is highly competitive. Grain handlers and crush facilities routinely bid up the basis (or
lower it) to secure the product they want. Moving to a component pricing system would see the spread
between competitive basis levels narrow since the market was fixing a major factor that is a variable
today. By reducing the wider range in basis that one typically sees in the market today, we anticipate
that less opportunity would exist for producers to capitalize on variability in company approaches to
pricing in a less fixed environment.
18 Sun, K., Jian, F., Jayas, D.S., and N.D.G White. Quality changes in high and low oil content canola during storage: Part 1 – Safe storage time under constant temperatures. 19 Mills, J.T. and M. Hartman. Storage of Canola. http://www1.agric.gov.ab.ca/$department/deptdocs.nsf/all/crop1301#seed 20 Mills, J.T. and M. Hartman. Storage of Canola. http://www1.agric.gov.ab.ca/$department/deptdocs.nsf/all/crop1301#seed
30 | P a g e
Industry Views
Producer Groups
The Alberta Canola Producers Commission supports component pricing of canola seed as in their view it
provides for “the efficient transmission of end user demand signals.”21 The Manitoba Canola Growers
Association see the issue differently. As lower average oil content producers, the organization opposes
buying on oil content. However, the most important consideration for Manitoba producers is the
baseline as they expect the higher the baseline, the greater the negative impact on Manitoba producers.
The Canadian Canola Growers Association has yet to take an official position on the issue, though they
have investigated it a number of times. The lack of consensus among provincial canola producer
organizations has in large part made it difficult to pursue the matter further.
The difference in average oil contents in combination with producers’ inability to significantly influence
oil content puts Manitoba producers at a disadvantage compared to those in Saskatchewan and Alberta
when considering a system that would both reward and discount producers based on oil content.
Without the ability to directly and proactively manage oil content, the premium-discount schedule is
arbitrary although we would expect over time that some variables, such as land price, would being to
price in this variation if the difference in oil content among provinces or regions were to increase
further.
Exporters
Canola is generally exported as bulk product and as such there is very little willingness by our export
markets to pay a premium for a bulk commodity, regardless of whether it has high oil content. As well,
Canada’s export markets are generally price takers, again, making it difficult to extract a premium from
them. Australian exporters have found it challenging to extract additional value from their export
markets. Given that Australian and Canadian grain handlers export to shared markets, Canadian grain
handlers may face the same challenge, unable to draw additional value for higher oil canola.
While canola prices reflect the global market, most buyers buy based on previous experiences, paying
on price rather than on bonification. The price paid is based on an assumed oil yield stipulated in their
contracts, adjusting their bids in future contracts if necessary. If the grain handlers are unable to secure
a premium for canola from the export markets, this could be reflected by lowering the basis in order to
mitigate their losses.
Crushers
All crusher respondents indicated that crush profitability is heavily dependent on the availability and
quality of the canola seed within their catchment area. This was especially noteworthy for crusher
interviewees as there are far fewer crush plants in Western Canada than elevators, meaning there is
much less opportunity to be selective about what region to buy canola from if it were profitable to truck
longer distances.
Most interviewees said they were highly unlikely to have dedicated ‘runs’ for high oil content canola, as
the cost and time to separate high from low oil content would not result in increased profitability. Some
remarked that they had limited trials in the past on offering premiums/discounts for higher oil content,
21 ACPC official position
31 | P a g e
but in the end these pilot projects were abandoned as they had simply increased administrative and
operating costs with no payback for the industry. Most crushers felt that a bonification system would
likely result in increased costs if implemented across Western Canada that would need to be passed
through to producers because there was no apparent value being created through the segregation.
The industry consensus was component pricing increases costs in handling canola for no additional
value, and complicates a relatively simple marketing system. Most industry interviewees felt
bonification would undermine some of the key advantages the Canadian canola industry currently
enjoys which makes it a profitable commodity for producers and industry alike.
32 | P a g e
Section 4: International Experience
Major canola producing countries include Australia, Canada, the European Union, China, India, Russia,
Ukraine and the United States. Worldwide production has been in the 60 to 70 million metric ton
(MMT) range for the past few years, making canola the second largest oilseed by volume.
Roughly 20 percent of production is traded internationally every year. Canada, Australia and Ukraine
are the largest exporters. The European Union (EU) exports a small percentage of their rapeseed output
while Australia exports nearly 75 percent of its output.
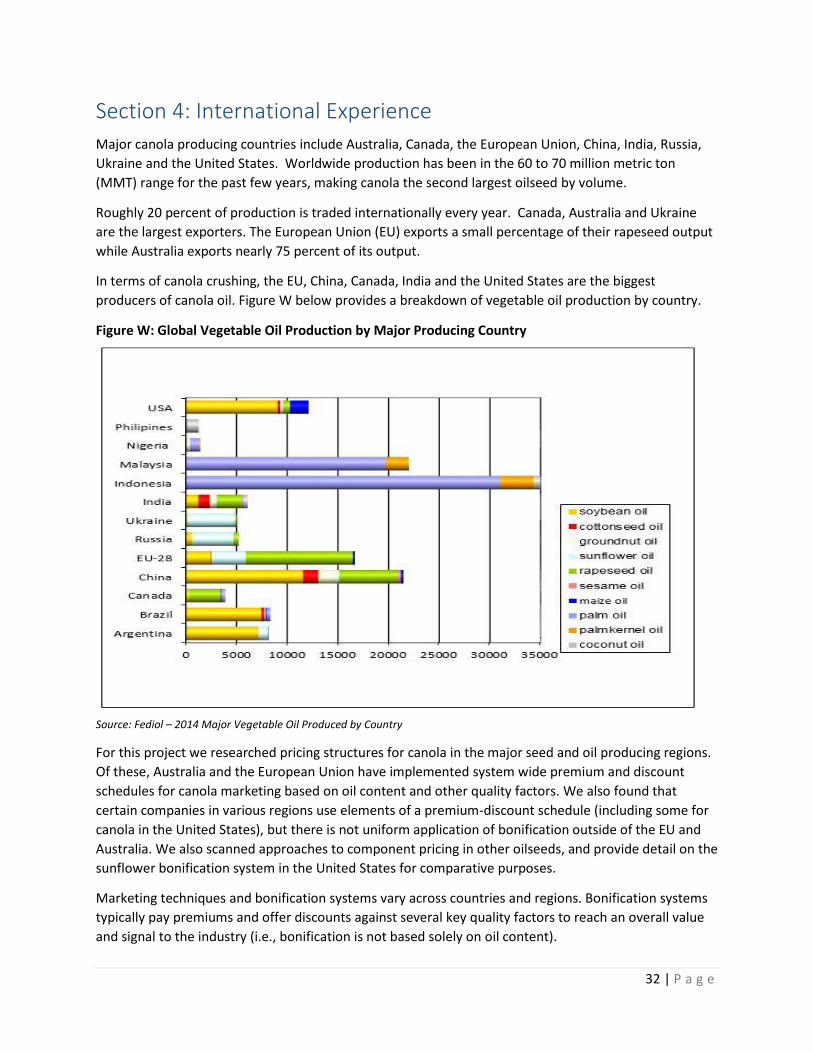
In terms of canola crushing, the EU, China, Canada, India and the United States are the biggest
producers of canola oil. Figure W below provides a breakdown of vegetable oil production by country.
Figure W: Global Vegetable Oil Production by Major Producing Country
Source: Fediol – 2014 Major Vegetable Oil Produced by Country
For this project we researched pricing structures for canola in the major seed and oil producing regions.
Of these, Australia and the European Union have implemented system wide premium and discount
schedules for canola marketing based on oil content and other quality factors. We also found that
certain companies in various regions use elements of a premium-discount schedule (including some for
canola in the United States), but there is not uniform application of bonification outside of the EU and
Australia. We also scanned approaches to component pricing in other oilseeds, and provide detail on the
sunflower bonification system in the United States for comparative purposes.
Marketing techniques and bonification systems vary across countries and regions. Bonification systems
typically pay premiums and offer discounts against several key quality factors to reach an overall value
and signal to the industry (i.e., bonification is not based solely on oil content).
33 | P a g e
While the summary below of bonification systems in Australia, the EU and the United States is
instructive, there are a number of factors which complicate simple comparisons. Standards and
baselines for different quality criteria are diverse and typically shaped to fit the production realities of
the region in question. Translating this experience to the Canadian market may or may not be relevant,
and we try to draw out these considerations in the discussion of each market.
The following provides a summary of canola and sunflower marketing techniques used in Australia,
some EU countries and the United States.
Australia
Canola is Australia’s most important oilseed and the third largest crop grown in the country. Australia
represents about five percent of the world canola production. Production levels have increased and
quality improvements are noticeable. Increased production has resulted in a larger percentage of the
crop being exported, mainly to the European Union. Other key markets include China, Japan and
Pakistan. Importers expect to receive 42% oil content, but few, if any, are reportedly willing to pay for it
according to those interviewees either based in Australia or familiar with its market.
Australia implemented a bonification system for oil content in canola in the 1980s to incent producer
selection of varieties with greater oil content and to encourage breeders to target oil content as an
important quality factor. This was in large part because Australian canola lagged behind other
production regions for oil content and it was affecting their ability to acquire market share with
international buyers. The base oil content selected at that time was 40%. In 2002, the industry decided
to increase the base oil content level to 42%.
The system has been in place for around 3 decades and is not likely to change in the near future given
familiarity and acceptance. However, respondents noted that informal discussions regularly occur
among the industry questioning if bonification is still needed since the original objective to increase oil
content has mainly been achieved.
The logic behind Australia’s bonification system is that producers who get paid or punished for oil
content will select varieties and adopt agronomic practices that deliver on higher oil percentages. In
addition, processors extract more oil from varieties that have a higher oil content and, in theory, margin
is gained against fixed costs by crushing the same volume of seed but accumulating a higher volume of
oil.
In practice, a mandated bonification system to create or redistribute value has a number of risks
attached to it. In the Australian experience, while the main goal of increasing oil content has been met,
importers have not shown any willingness to establish premium-discount schedules on the basis of oil
content. Some respondents complained of the inflexibility of the Australian system from a pricing
perspective and suggested that this has affected their ability to grow market share in importing
countries because they are unable to pass on the costs of the system. We also heard that sampling,
testing and segregation costs are considerable. Trust in the sampling and testing among value chain
participants has not been a problem, despite the fact that driveway tests have significantly large
standard deviations.
Australia’s grain handling system is also not well set up for segregation (whole of crop is delivered to
port with very little inland storage) so high oil canola that could potentially have value in an export
34 | P a g e
market is mixed with other canola due to lack of separate storage facilities. Since the system has been in
place for decades and considering that segregation has not occurred to any extent at all, we conclude
there is no return on investment for handlers/exporters to segregate high and low oil content canola.
As a result, grain handlers look for regional quality differences to try to capture value in an efficient, bulk
handling point of view.
Australia’s standards also incorporate several other quality factors into a bonification schedule beyond
oil content, including free fatty acid (FFA), moisture, defective kernels, damaged kernels, sprouted
kernels, and impurities or admixture. Again, this clearly demonstrates that oil content alone is not an
exclusive pricing variable but one among many.
Premium/Discount Schedule
Oil content and the other quality factors just noted influence the final prices received by producers.
These take the form of premiums and discounts against the canola price. We note that oil content is the
only criteria where a premium is possible – all others carry discounts if maximums are exceeded which
in our view constitutes a considerable risk for producers. Following are the schedules for several quality
factors for canola in Australia:
- Oil Content: 42% base - premium is 1.5% per 1% increase over base; reduction is 1.5% for 1%
decrease from base;
- Free Fatty Acid: 1.0% base - 2% deduction per 1% increase over the base; can be rejected if over
2.5%;
- Moisture: 8.0% maximum - 2% deduction per 1% over the maximum;
- Defective: 10% maximum - 0.5% deduction per 1% over the maximum;
- Damaged (part of defective): 3.0% maximum - 0.5% deduction per 1% over the maximum, can
be rejected if over 10%;
- Sprouted (part of defective): 5.0% maximum - 0.5% deduction per 1% over the maximum;
- Impurities: 3.0% maximum - 1% deduction per 1% up to 4%; 2% deduction per 1% over 4%;
Environment
We have already discussed how environmental factors can significantly impact canola quality.
Australia’s canola growing climate is less erratic than Canada’s growing climate, providing greater
impact from those management tools producers have at their disposal to try and achieve higher oil
content. Variety selection in particular would likely have more impact in Australia than Canada for this
reason.
In addition, Australia has a longer growing season which provides additional time for the oil to fill,
providing those producers an environmental advantage to Canadian producers. This is, however, is not
a producer management practice, but rather, an environmental reality.
Results
The bonification system has been in place for around 30 years and has undoubtedly met its original
objective of increasing oil content. Australia's oil content increased from an average of 40% in 2002 to
35 | P a g e
44% in 2012, surpassing the new 42% oil content base set in 2002. The minimum oil content reported in
2002 was 34% and the maximum was 44%, while in 2012 those figures were 37% and 46.5%
respectively.
However, protein content in the meal byproduct is also an important consideration. Protein content
ranged from 36% to 44.5% with an average of 40% in 2002. In 2012, protein content ranged from 36.5%
to 43%, with a 39% average. Canola already trades at a significant discount to soybean meal given lower
protein levels. Pressure on protein content from a bonification system could have this unintended effect
which would affect crusher margin. We would in turn expect merchandisers to factor this into pricing.
With 75 percent of Australia’s canola production exported, grain handlers face risk under the current
system. Australian grain handlers pay the premium or discount on oil content, but are not able to
recapture a premium in the export market primarily because of competition from other markets. This
typically results in a lower starting cash basis in order to manage the risk of having to pay an oil
premium, but not being able to capture it from export customers. Management to export destinations
on a regional basis is also a tool exporters utilize to draw canola from areas that best match an
importers minimum oil requirements and minimize premium costs. As a result, Australian producers end
up paying for the administrative costs of the system without actually being able to capture significant
value for oil content.
At the same time, overall oil content in canola in Australia has increased, making it a more desirable
product in the international marketplace and erasing most of the quality disadvantage that Australia
experienced at the turn of the century. It is clear that breeders received and acted upon the industry’s
signal to increase oil content in new varietals. Producers selected those varieties in response to the
marketing system rewarding higher oil content. Even though starting cash basis is lower to balance off
premiums for oil content, Australian producers have accepted it as an equitable system to reward or
punish for the quality of canola produced.
European Union
The major oilseed produced in Europe is rapeseed/canola. Europe accounts for about one-third of
global canola production and it represents a large percentage of the continent's oilseed production.
Rapeseed is followed by sunflower oil and then soybean oil in terms of quantity of oil produced.
Almost all of Europe's canola production stays within the continent. Around one-percent is exported.
Crush capacity is around 24 MMT. After all is said and done Europe is a net importer of canola. As a
result, the bonification system is mainly an internal issue. EU canola producers do not face the same
competitive pressures that Canadian or Australian producers do. The EU producer can focus solely on
the relationship with merchandisers within their growing region. This results in value being driven
predominantly by the EU crushing industry. Since freight and varying quality (including oil content)
parameters from other regions is not a major consideration for EU inland crushers, the emphasis on oil
content premiums can be much more pronounced.
The bonification framework developed in the 1980s and early 1990s as the EU revised its agricultural
policies for rapeseed. Like in Australia, EU producers and crushers supported the system to increase oil
content and breeders and producers began focusing on developing and growing better yielding and
higher quality varieties.
36 | P a g e
The Matif/Euronext futures contract was established in 1994 and included three quality components of
oil content, moisture and admixture with premiums and discounts. Today, most producers hedge their
rapeseed production and the schedules are well known and accepted. From a producer perspective, the
system does provide value in that the payment is based on the quality of rapeseed produced. There is a
strong argument under European conditions that the processor gets exactly what it pays for and
producers are treated fairly if they manage for oil content.
A rapeseed futures contracts on the MATIF/Euronext that can apply to all origins underpins the
expected basic quality of rapeseed production in the European Union and is set by the following
standard quality criteria:
- Oil Content: 40%
- Water Content (moisture): 9%
- Impurities (dockage): 2%
- Double Zero Variety
- Sound / Fair / Merchantable Quality
In addition to basic quality, the rapeseed must conform to the following futures contract factors:
- Water Content (moisture) - maximum 10%
- Impurities (dockage) - maximum 3%
- Oleic acidity - maximum 2%
- Erucic acid content - maximum 2%
- Glucosinolates content - maximum 25 micromoles
- Conventional rapeseed - no genetically modified organisms
The Federation of Oils, Seed and Fats Association (FOFSA) contract for United Kingdom rapeseed
marketing is similar to the Euronext requirements, but differs slightly. The key quality criteria are the
same, but it allows for up to 35 micromoles glucosinolates and sets a moisture range of maximum 10%
and a minimum 6%.
Additionally, Fediol, the EU Oil and Protein Meal Industry organization, recommends the following
specifications for non-EU origin rapeseed:
- 40% oil content basis; moisture of 9% with a maximum 10% and minimum 6%; admixture basis
at 2% with a maximum 4%.
Interestingly Ukrainian rapeseed imports are based on a 44% oil content, but the market value is
adjusted to match the 40% basis used within the European Union. This is very similar to what happens in
the Canadian market today, with basis levels reflecting oil content value in higher oil content regions,
and importers adjusting bids to reflect experience with oil content from various origins.
37 | P a g e
Premium and Discount Schedule
European industry implements bonification on three key quality factors, oil content, water content and
impurities. Thus, European producers do not just market on oil content, but it is a key factor. Following
is the commonly used premium and discount schedule for Euronext based on settlement prices for
European rapeseed:
- Oil Content: 40% base - 1.5% increase per 1% additional oil; 1.5% reduction per 1% less oil
- Water Content: 9% base - 0.5% increase per 1% less water; 1.0% reduction per 1% more water
- Impurities: 2% base - 0.5% increase per 1% less impurities; 1.0% reduction per 1% more
The FOFSA schedule offers a slight variation to Euronext:
- Oil Content: 40% base - 1.5% increase per 1% additional oil; 1.5% reduction per 1% less oil
- Water Content: 9% base - 1.0% increase per 1% less water; 1.0% reduction per 1% more water
- Impurities: 2% base - 1.0% increase per 1% less impurities; 2.0% reduction for 2.1 to 3.0%; 4.0%
reduction for 3.1 to 4.0%; negotiation on discount for impurities above 4.0%
ADM’s public premium and discount schedule in the EU follows and includes a bonification even when
factors fall outside of contractually agreed values of 9% max moisture, 4% max admixture, 2% max
erucic acid and 2% FFA. It is important to note that quality factors exceeding the maximums can be
rejected by the purchaser.
- Oil Content: 40% base - 1.5% increase per 1% additional oil; 1.5% reduction per 1% less oil
- Water Content – 9% base – 0.5% increase per 1% less water to 6%; no premium below 6%;
drying cost deducted above 9%; 9 to 12.49% is a 1.3% reduction per 1% more water; 12.5 to
16.49% is 1.4% reduction per 1% more water; 16.5% and above is a 1.5% reduction per 1%;
o Another schedule for moisture used the same values for 6% to 9% but then stated a
1.5% reduction per 1% from 9 to 10%; 2% reduction per 1% from 10 to 10.5% and a
2.5% reduction per 1% for 10.5% to 11%;
- Impurities: 2% base – 0.5% increase per 1% less impurities, 2.1 to 4% is a 1% reduction per 1%
increase; 4% to 5.9% is a 2% reduction per 1%; 6% and above is a 3% reduction per 1%;
- Erucic Acid: 2% maximum – 7% reduction per 1% from 2.0 to 2.99%, 10% reduction per 1% from
3.0 to 4.99% and a 15% reduction per 1% at 5% and above;
- Free Fatty Acid: 2% maximum – 2% reduction per 1% from 2.0 to 2.99%; 2.5% reduction per 1%
from 3.0 to 4.99% and a 3% reduction per 1% at 5% and above;
- Chlorophyll in the oil: 30 ppm maximum base – 1% reduction for level between 31 to 35 ppm;
2% reduction for 36 to 40 ppm, 2.5% reduction for 41 to 45 ppm, 3% reduction for 46 to 50
ppm;
38 | P a g e
Testing
FOFSA procedures are the standard for testing. FOFSA requires the buyer to collect duplicate samples,
seal and analyze them for key quality criteria for each individual consignment to receive an original
certificate. The buyer is to complete testing within 21 consecutive days from the receipt of goods and
pass the results to the seller. If the buyer does not share results within this time period, a 0.25%
allowance is provided to the buyer for up to two weeks and then increases to 0.5% per week until
results provided.
FOFSA contracts utilize a Standard Contractual Methods List for oil, moisture, admixture, erucic acid,
Free Fatty Acid (FFA) and glucosinolates analysis.
In its public terms, ADM states that it collects 0.39 to 0.75 euros per metric ton from the seller to cover
sampling and analysis in Germany. Flat fees are also used and are normally around 25 euros. Additional
analysis costs the applicant around 25 euros. Lot sizes for analysis are typically 250 MT.
Results
In 2015, Euronext began discussions to increase the oil content basis from 40% to 42% to better reflect
the quality traded in the physical market. Several producer groups pushed back on changing the base
level (even though starting cash basis is lowered to reflect the higher oil content in the physical market)
and the initiative ended.
The industry objective to increase oil content via the bonification system has occurred. The average oil
content has risen from around 40% in the early 1990s to around 45% in recent years. Plant breeders
have typically been supportive of the system as it sets a clear target and message on value
considerations for marketing their hybrids to producers. Producers have responded to the premium
allowance to grow higher oil content varieties.
The rapeseed meal component has increased in value given the EU market for protein while oil has seen
its economic importance drop. The current bonification system doesn’t allow for the market to
compensate for this situation. Under a true market scenario, oil premiums would be removed due to
market signals, but currently oil premiums are still being paid and as some interviewees indicated
crushers are not able to adjust to the new meal demand without paying a penalty for oil.
There is some concern in the EU that a bonification system actually removes transparency. If a producer
is looking at a futures contract that is not based on market averages, the value is understated and may
not represent the true competitiveness of that crop against another alternative that doesn’t utilize
premiums and discounts. For example if Euronext is set at 40% base, but a producer generally produces
44% oil – is the 4% premium which is a 6% increase in price taken into full consideration? This has given
rise to unnecessarily complex calculations by producers on the relative profitability of canola versus
other cropping alternatives, clearly an unintended consequence of their bonification system.
United States
Canola is mainly grown in the northern region, just south of the Canadian border. Spring canola
accounts for the vast majority of production, encompassing at least 75 percent of acreage. Winter
canola, mainly grown in the central plains (Oklahoma, Kansas and Colorado), represents the remaining
portion. Winter canola production has increased in the central plains) in recent years.
39 | P a g e
Yield is the main factor receiving attention in US programs and processors have a good understanding of
the quality they will receive to adjust their purchasing signals. Canola industry representatives were not
aware of any concerns regarding oil content received, or concerns on behalf of producers that they were
not getting fair value for oil content.
A base or low oil content in the US northern tier crop would be less than 40%, but industry generally
expects a higher oil content level. The industry has not signaled a concern about low oil content in the
US crop to warrant a shift in marketing practices.
Canola produced in the northern growing region has oil content that is slightly below Canada’s level.
Northern tier canola marketing mimics Canada's system and will likely continue to do so. The US
industry has talked about a bonification type system, but the discussion has never gained traction as
concerns exist about the inclusion of potential discounts more than offsetting the potential premiums,
as well as producers having to pay the additional costs for administration.
Premium and Discount Schedule
While not required by law, ADM processing has implemented a public bonification schedule in the
central plains for several years for winter canola. In general, the schedule sets a 3 to 4% base zone area
for oil content and provides a 1% premium above 42% and an increasing discount scale below the free
zone. For example, the first 1% of oil content below the base zone is a 3% discount, the second 1% of oil
content is discounted 4% and anything below the first two oil content percentage levels is discounted
5%.
Moisture is also on a discount schedule with 1% reduction between 10 to 10.5%, 2% for 10.6%, 3% for
10.7%, 4% for 10.8%, 5% for 10.9% and 6% for 11 to 11.5%. Any deliveries above 11.5% are subject to
rejection. Discounts are also in place for distinctly green factors, heat damage, other damage, stones,
and inconspicuous admixtures.
Northstar Agri Industries in Minnesota implemented a premium canola contract based on varieties
delivered. The objective was to expand the sourcing radius as well as incent higher oil content.
Northstar’s plant became operational in 2012.
The contract provided a 5% premium over the spot price for specific canola hybrids and only up to a
certain volume per acre. The average oil content for those varieties was reportedly 48 percent, which is
nearly five percentage points above the Manitoba five year average. While premiums by variety
occurred, no one was aware of discounts being implemented with these programs.
Northstar operated independently for three years and utilized an oil incentive program during that
period. The plant was acquired by CHS in July 2015 and it isn’t clear if premiums will still be offered.
Results
The interconnectedness of the US and Canadian canola industries and the dominance of Canadian
canola production in North America means that the US will likely follow Canada’s marketing scheme.
The US typically has a slightly lower oil content than Canada, so US producers would receive a lower
value and incentive to produce canola assuming the same criteria and similar prices on both sides of the
border.
40 | P a g e
The US industry is sophisticated, competitive and has a good understanding of where quality exists.
Interviewees felt that basis levels reflect quality differentials in the marketplace and an indirect
premium is occurring to regions producing higher oil content.
Other oilseeds in the international marketplace
Sunflowers are marketed on an oil content basis in Australia, the United States and Europe. Sunflowers
are similar to canola in that roughly 80% of the seed value is the oil content. However, a major
differentiating factor between the oilseeds is sunflowers have a confectionary and bird seed market
competing with the food market, where canola does not. As such, a bonification system to attract higher
oil content for crush in competition with other options is logical.
In the US, a 2% premium and discount applies to the price for each 1% above or below a 40% oil content
base.
Australia’s sunflower contract incorporates a bonification schedule as follows:
- Oil content – 40% base – 1.5% premium/deduction for each 1% above/below 40%
- Free Fatty Acid – 2% base – 2% deduction for each 1% over the base; rejectable over 3.0%
- Moisture – 9.0% maximum – 2% deduction for each 1% over maximum
- Broken or split – 7.0% maximum – 0.5% deduction for each 1% over maximum
- Defective – 10% maximum – 0.5% deduction for each 1% over maximum
- Damaged – 3% maximum – 0.5% deduction for each 1% over maximum; rejectable over 10%
- Sprouted – 5% maximum – 0.5% deduction for each 1% over maximum
- Impurities – 4.0% maximum – 1.0% deduction for each 1% to 4%, 2% deduction for each 1% over
4%;
In Europe, Fediol's recommended specifications for non-EU sunflowers is 44% oil content basis, moisture
basis of 9% with a maximum 10% allowance, admixture basis of 2% with a maximum 4% and a free fatty
acid level of 2% with a maximum of 3%. There is no indication that a formal incentive based system is in
place for sunflowers. ADM does have a public bonification system for its sunflower purchases as
follows:
- Oil content: 44% base – 1.5% premium and discount per 1% above and below 44%
- Moisture: 9% maximum – 0.5% premium per 1% less water to 6%; moisture below 6% is treated
as 6% moisture content;
- Admixture: 2% maximum – 0.5% premium per 1% less admixture; 1% reduction per 1% to 4%;
Sunflowers delivered exceeding these scales can be rejected or settled on the following scale:
- Moisture – 9 to 10% - 1.5% reduction per 1%; 10 to 10.5% - 2% reduction per 1%; 10.5% to 11%
is a 2.5% reduction per 1%
- Admixture – 4 to 6% - 2.0% reduction per 1%; 6% and above – 3% reduction per 1%
41 | P a g e
- Free Fatty Acid – 2% reduction per 1% from 2 to 3%; 2.5% reduction per 1% at 3% and above;
Soybeans are the most produced oilseed worldwide, but it is mainly grown as a protein crop. The
soybean industry is investing funds in testing procedures to better measure value and has developed
some new varieties with oil quality to compete with canola oil. This will create new competition for
canola oil as the secondary soybean oil is priced against canola oil to compete in the marketplace. Our
research did not uncover a bonification system for soybeans.
42 | P a g e
Section 5: Modelling Factors
In addition to the in-depth qualitative research above, modelling and analysis were also conducted to
determine the potential impact of a component pricing system for canola in Western Canada based on
historical quality statistics in the three main producing provinces. The following charts and brief
descriptions are a summary of the detailed modelling and analysis that has been provided to SaskCanola
as part of this project.
Oil Content Distribution
The first 8 charts are dedicated to a review of the distribution of oil content percentages by province
and then as a Western Canadian average. If we assume that a component pricing system in Canada were
based on 43% oil content (anything above would exceed Manitoba’s 5 year average), these charts give
us an appreciation for the level and extent to which premiums and discounts over/under 43% would be
experienced in various jurisdictions.
Looking at the overall distribution across Western Canada over the past 5 years, we find that roughly
1/3rd of the crop falls below 43% and 2/3rd above 43%. Given our arguments in the Market Factors
section above that there is ‘no new net money for Canada’ to capture by instituting a component pricing
system, this compels us to make certain assumptions in our modelling. Firstly, if a component pricing
system were put in place, the amount paid in premiums would need to be offset by the amount of
discounts. We assume that in the real market this offset would occur by lowering the basis overall in
order to implement a 1.5% above base and 1.5% below base for each percentage point as we see in
Australia and the EU (rather than severely punishing those in a discount to pay for all the premiums).
Regarding the latter, the assumption that there is no new net money is born out in the debate in the EU
over whether they should raise the base oil content in the bonification system from 40% to 44% to
reflect the actual marketplace. At the moment many rightly argue that there is no transparency in the
EU’s bonification system because it is based on a fictitious base that is in no way reflective of the current
average oil content, and basis pricing by crushers and elevators reflect that fact (i.e., it is significantly
lower). Clearly European producers would not simply receive 6% less in price if the base were moved up
(1.5% for each of the 4 percentage points), we would see the cash basis increase to balance back to
reflect the competitive price at farm gate for that region taking into account the variety of factors typical
to canola pricing. This is an extremely important point for Saskatchewan’s producers to consider – cash
basis will be lowered, or raised, to absorb the premium/discount schedule for oil content and balance
price back out at the expected current price/tonne in a given region.
For illustrative purposes, however, we have modelled the discounts to completely offset the premiums
in order to demonstrate the magnitude by which basis levels would likely be adjusted. We have done
this by modelling the overall extent of a premium or discount for any given year by region (i.e., the
percent of the crop above or below 43%). This is indicative of the overall premiums or discounts that
farmers would have experienced if a component pricing system had been in place over the past 15
years.
Before we discuss these results further, a few comments on the oil content distribution of the following
charts will be helpful. Firstly, the majority of Manitoba’s canola crop falls between 41% to 45%. Amounts
above and below that range over time roughly balance out, although samples above 45% have become
43 | P a g e
more common in recent years. For Saskatchewan, the bulk of the crop sits in the 43% to 47% range, with
a roughly equivalent amount of samples falling above and below those amounts. Of particular note in
Saskatchewan is the highs are getting higher (i.e., there are more samples 49%+ than seen in the past)
and the block of samples above 47% is widening against those samples below 43%. In Alberta, the
average is also in the 43% to 47%, however there is a much larger proportion of samples falling below
43% than above. This analysis demonstrates that Saskatchewan consistently produces the highest oil
content canola across the prairies.
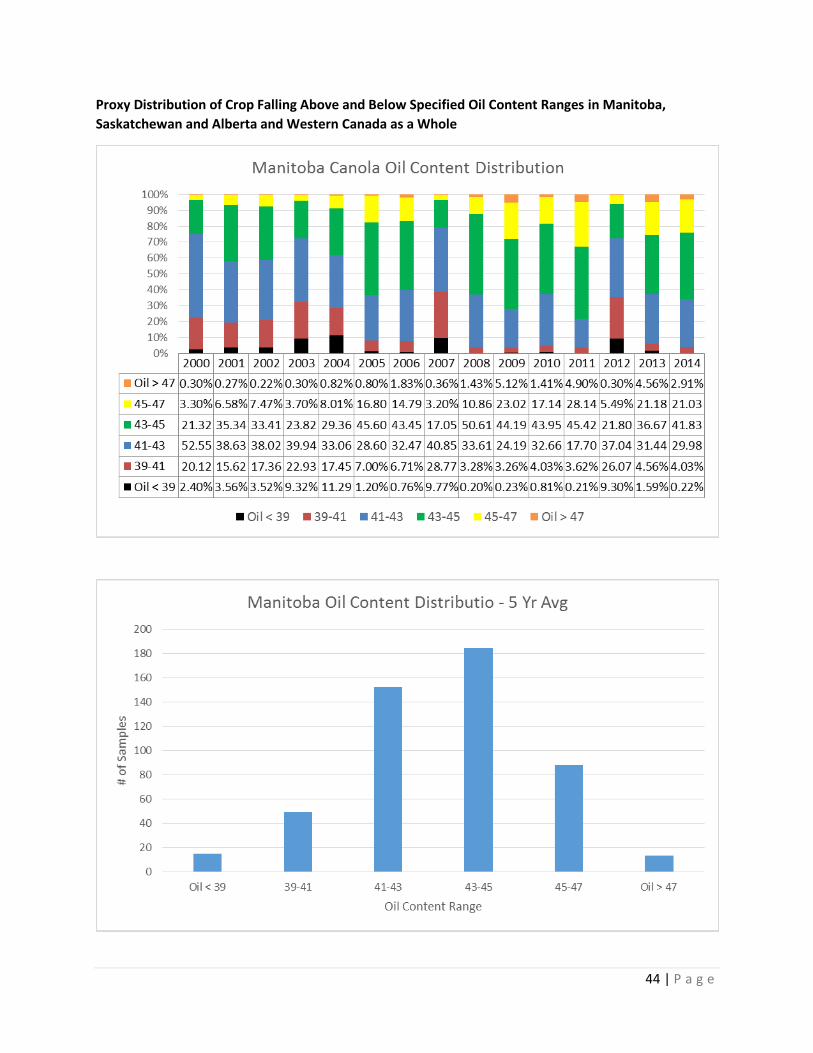
44 | P a g e
Proxy Distribution of Crop Falling Above and Below Specified Oil Content Ranges in Manitoba,
Saskatchewan and Alberta and Western Canada as a Whole
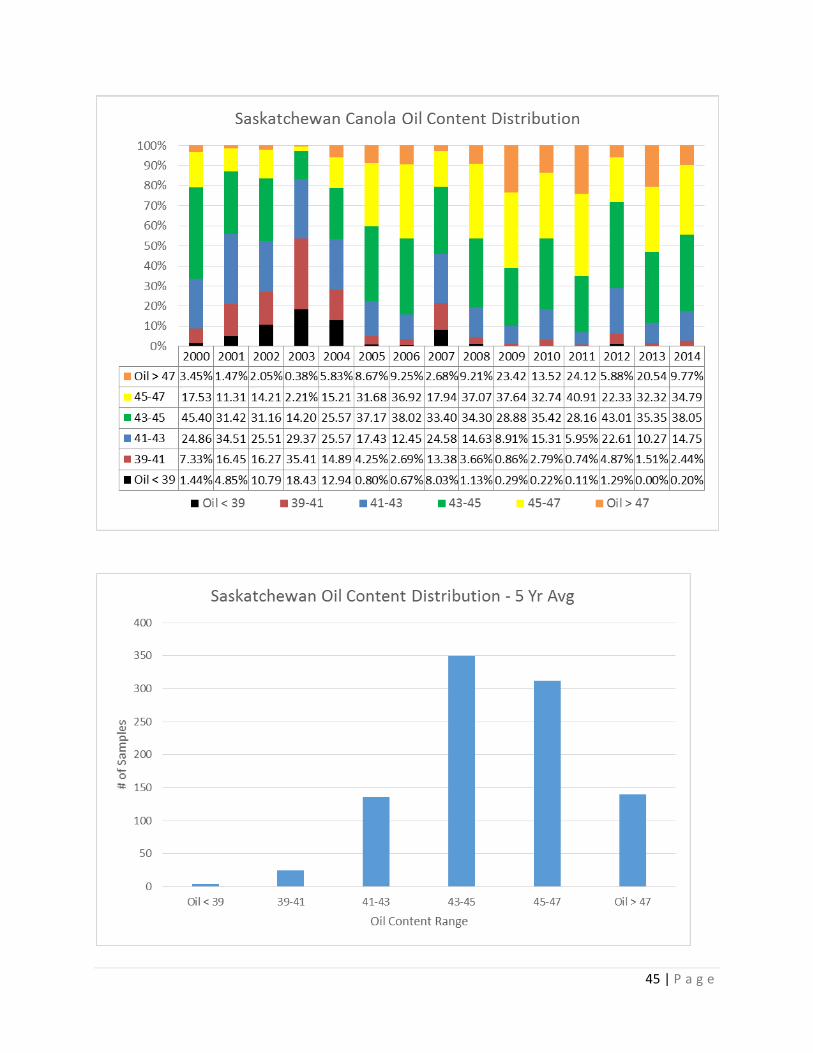
45 | P a g e
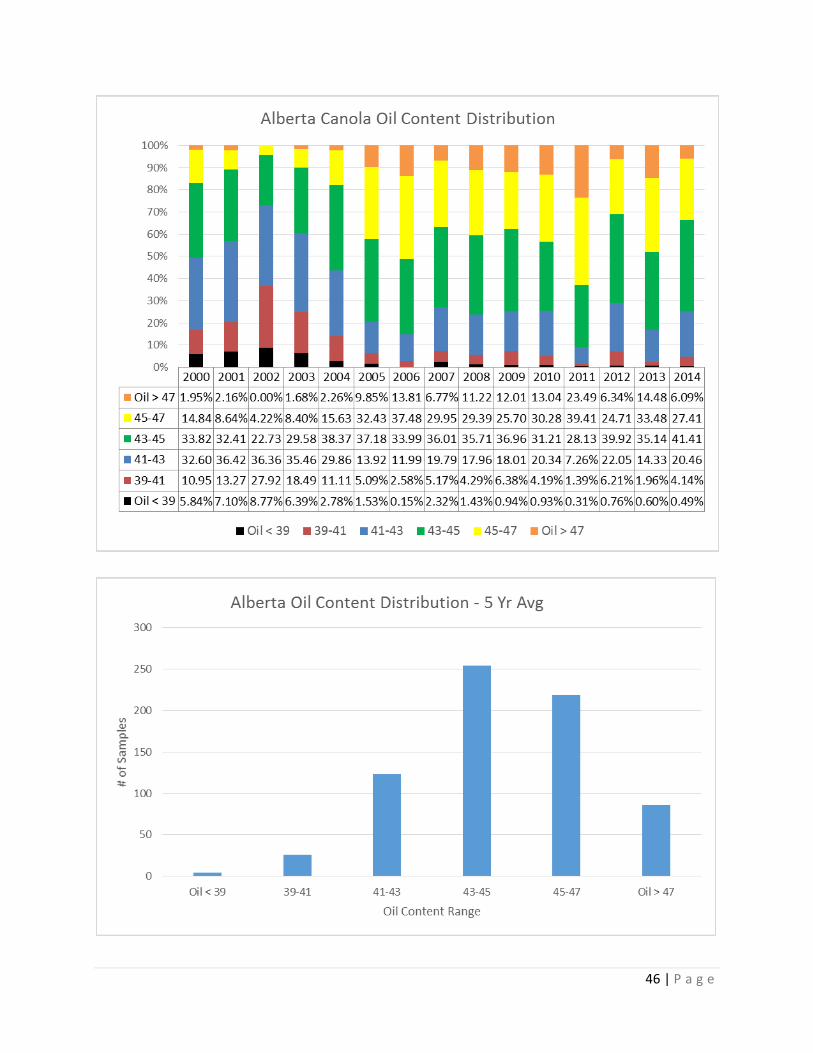
46 | P a g e
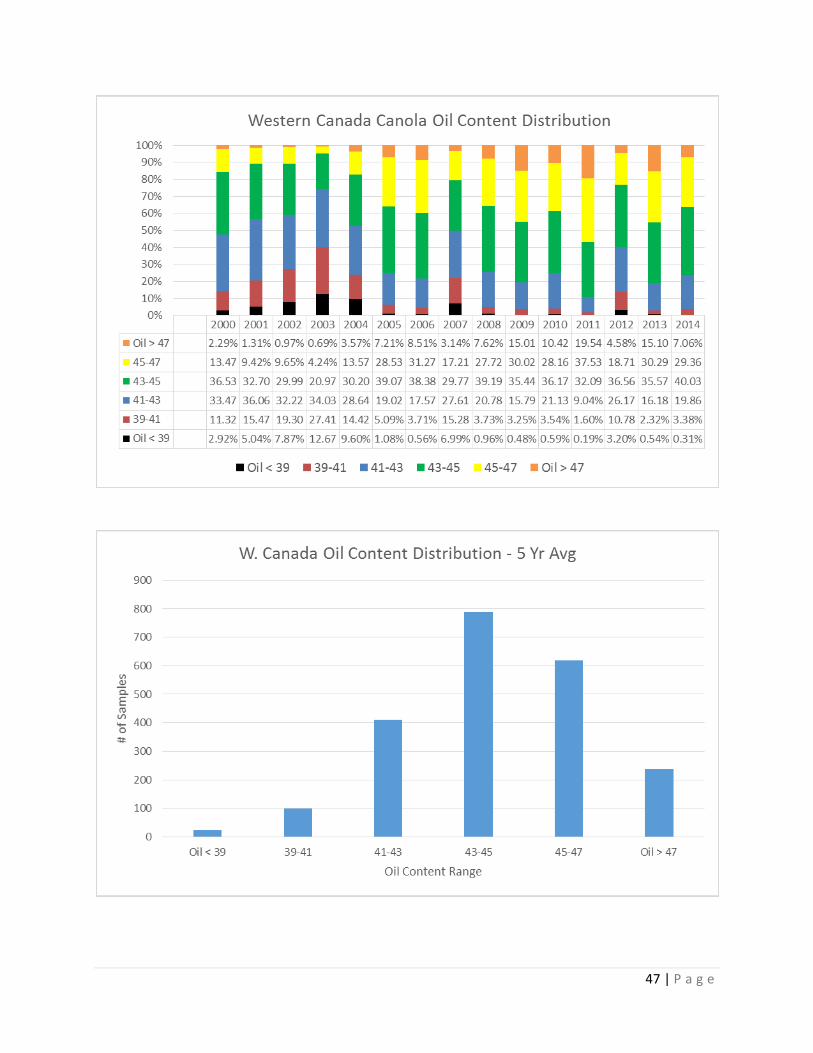
47 | P a g e
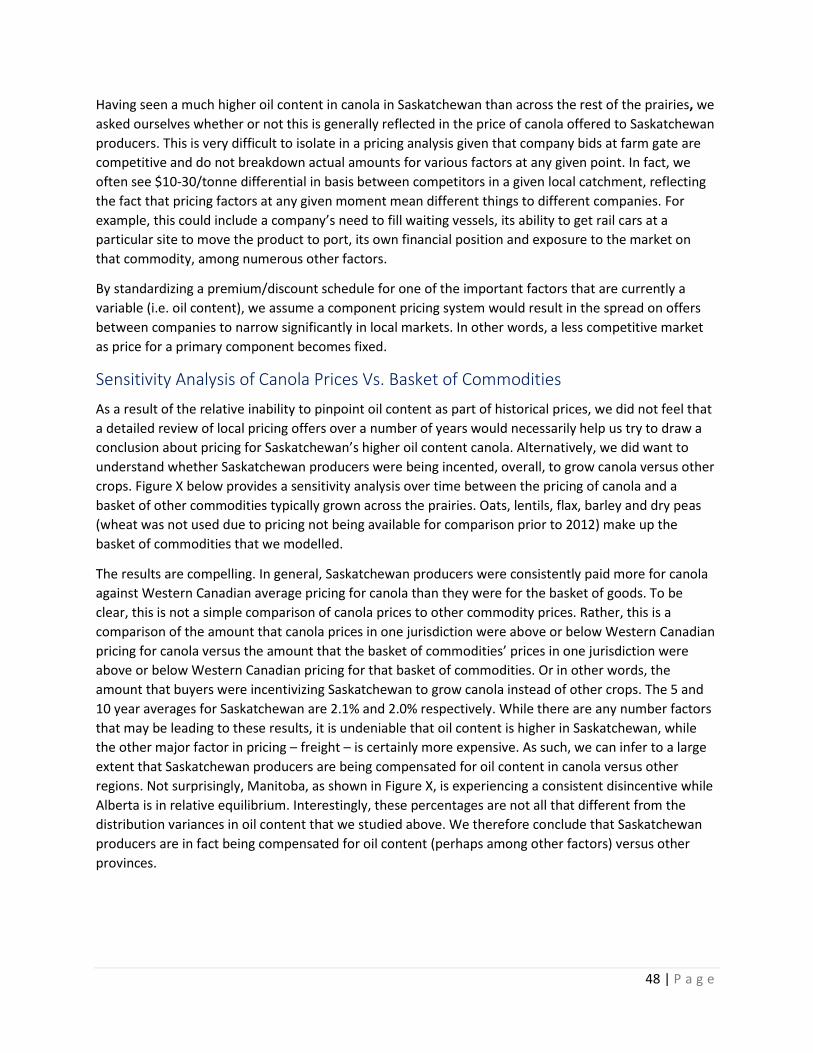
48 | P a g e
Having seen a much higher oil content in canola in Saskatchewan than across the rest of the prairies, we
asked ourselves whether or not this is generally reflected in the price of canola offered to Saskatchewan
producers. This is very difficult to isolate in a pricing analysis given that company bids at farm gate are
competitive and do not breakdown actual amounts for various factors at any given point. In fact, we
often see $10-30/tonne differential in basis between competitors in a given local catchment, reflecting
the fact that pricing factors at any given moment mean different things to different companies. For
example, this could include a company’s need to fill waiting vessels, its ability to get rail cars at a
particular site to move the product to port, its own financial position and exposure to the market on
that commodity, among numerous other factors.
By standardizing a premium/discount schedule for one of the important factors that are currently a
variable (i.e. oil content), we assume a component pricing system would result in the spread on offers
between companies to narrow significantly in local markets. In other words, a less competitive market
as price for a primary component becomes fixed.
Sensitivity Analysis of Canola Prices Vs. Basket of Commodities
As a result of the relative inability to pinpoint oil content as part of historical prices, we did not feel that
a detailed review of local pricing offers over a number of years would necessarily help us try to draw a
conclusion about pricing for Saskatchewan’s higher oil content canola. Alternatively, we did want to
understand whether Saskatchewan producers were being incented, overall, to grow canola versus other
crops. Figure X below provides a sensitivity analysis over time between the pricing of canola and a
basket of other commodities typically grown across the prairies. Oats, lentils, flax, barley and dry peas
(wheat was not used due to pricing not being available for comparison prior to 2012) make up the
basket of commodities that we modelled.
The results are compelling. In general, Saskatchewan producers were consistently paid more for canola
against Western Canadian average pricing for canola than they were for the basket of goods. To be
clear, this is not a simple comparison of canola prices to other commodity prices. Rather, this is a
comparison of the amount that canola prices in one jurisdiction were above or below Western Canadian
pricing for canola versus the amount that the basket of commodities’ prices in one jurisdiction were
above or below Western Canadian pricing for that basket of commodities. Or in other words, the
amount that buyers were incentivizing Saskatchewan to grow canola instead of other crops. The 5 and
10 year averages for Saskatchewan are 2.1% and 2.0% respectively. While there are any number factors
that may be leading to these results, it is undeniable that oil content is higher in Saskatchewan, while
the other major factor in pricing – freight – is certainly more expensive. As such, we can infer to a large
extent that Saskatchewan producers are being compensated for oil content in canola versus other
regions. Not surprisingly, Manitoba, as shown in Figure X, is experiencing a consistent disincentive while
Alberta is in relative equilibrium. Interestingly, these percentages are not all that different from the
distribution variances in oil content that we studied above. We therefore conclude that Saskatchewan
producers are in fact being compensated for oil content (perhaps among other factors) versus other
provinces.
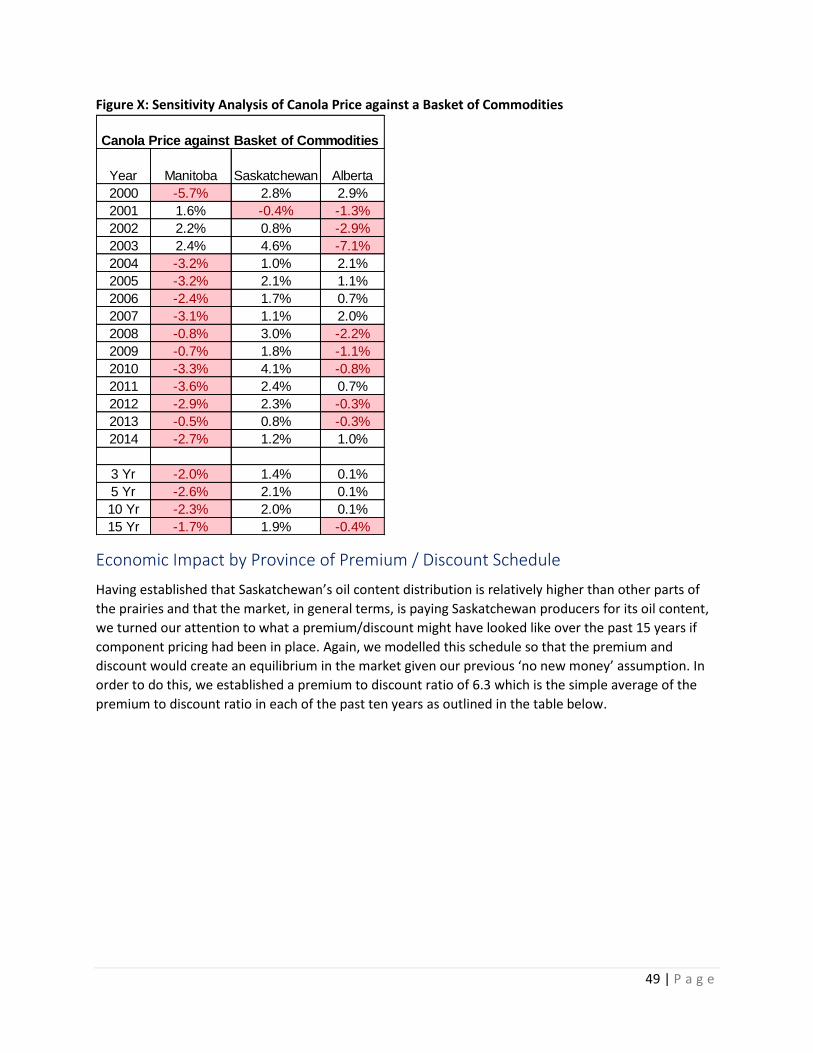
49 | P a g e
Figure X: Sensitivity Analysis of Canola Price against a Basket of Commodities
Economic Impact by Province of Premium / Discount Schedule
Having established that Saskatchewan’s oil content distribution is relatively higher than other parts of
the prairies and that the market, in general terms, is paying Saskatchewan producers for its oil content,
we turned our attention to what a premium/discount might have looked like over the past 15 years if
component pricing had been in place. Again, we modelled this schedule so that the premium and
discount would create an equilibrium in the market given our previous ‘no new money’ assumption. In
order to do this, we established a premium to discount ratio of 6.3 which is the simple average of the
premium to discount ratio in each of the past ten years as outlined in the table below.
Year Manitoba Saskatchewan Alberta
2000 -5.7% 2.8% 2.9%
2001 1.6% -0.4% -1.3%
2002 2.2% 0.8% -2.9%
2003 2.4% 4.6% -7.1%
2004 -3.2% 1.0% 2.1%
2005 -3.2% 2.1% 1.1%
2006 -2.4% 1.7% 0.7%
2007 -3.1% 1.1% 2.0%
2008 -0.8% 3.0% -2.2%
2009 -0.7% 1.8% -1.1%
2010 -3.3% 4.1% -0.8%
2011 -3.6% 2.4% 0.7%
2012 -2.9% 2.3% -0.3%
2013 -0.5% 0.8% -0.3%
2014 -2.7% 1.2% 1.0%
3 Yr -2.0% 1.4% 0.1%
5 Yr -2.6% 2.1% 0.1%
10 Yr -2.3% 2.0% 0.1%
15 Yr -1.7% 1.9% -0.4%
Canola Price against Basket of Commodities
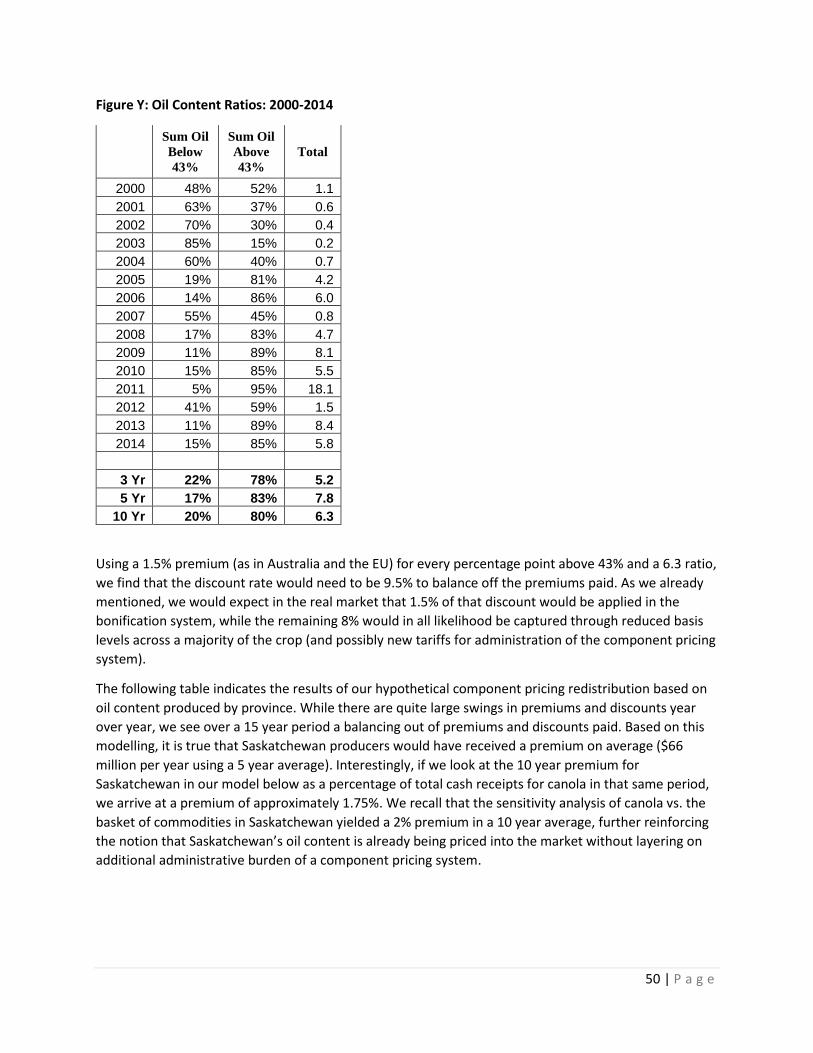
50 | P a g e
Figure Y: Oil Content Ratios: 2000-2014
Sum Oil
Below
43%
Sum Oil
Above
43%
Total
2000 48% 52% 1.1
2001 63% 37% 0.6
2002 70% 30% 0.4
2003 85% 15% 0.2
2004 60% 40% 0.7
2005 19% 81% 4.2
2006 14% 86% 6.0
2007 55% 45% 0.8
2008 17% 83% 4.7
2009 11% 89% 8.1
2010 15% 85% 5.5
2011 5% 95% 18.1
2012 41% 59% 1.5
2013 11% 89% 8.4
2014 15% 85% 5.8
3 Yr 22% 78% 5.2
5 Yr 17% 83% 7.8
10 Yr 20% 80% 6.3
Using a 1.5% premium (as in Australia and the EU) for every percentage point above 43% and a 6.3 ratio,
we find that the discount rate would need to be 9.5% to balance off the premiums paid. As we already
mentioned, we would expect in the real market that 1.5% of that discount would be applied in the
bonification system, while the remaining 8% would in all likelihood be captured through reduced basis
levels across a majority of the crop (and possibly new tariffs for administration of the component pricing
system).
The following table indicates the results of our hypothetical component pricing redistribution based on
oil content produced by province. While there are quite large swings in premiums and discounts year
over year, we see over a 15 year period a balancing out of premiums and discounts paid. Based on this
modelling, it is true that Saskatchewan producers would have received a premium on average ($66
million per year using a 5 year average). Interestingly, if we look at the 10 year premium for
Saskatchewan in our model below as a percentage of total cash receipts for canola in that same period,
we arrive at a premium of approximately 1.75%. We recall that the sensitivity analysis of canola vs. the
basket of commodities in Saskatchewan yielded a 2% premium in a 10 year average, further reinforcing
the notion that Saskatchewan’s oil content is already being priced into the market without layering on
additional administrative burden of a component pricing system.
51 | P a g e
Figure Z: 15 Year Hypothetical Premium-Discount Output for 43% Base Component Pricing 2000-2014
($000s) Manitoba Saskatchewan Alberta
Western Canada
2000 $ (28,573) $ 4,125 $ (4,840) $ (29,287)
2001 $ (17,423) $ (26,055) $ (25,686) $ (69,164)
2002 $ (24,567) $ (37,410) $ (65,646) $ (127,623)
2003 $ (61,219) $ (140,963) $ (35,996) $ (238,178)
2004 $ (54,991) $ (34,422) $ 1,289 $ (88,123)
2005 $ 1,391 $ 9,682 $ 10,966 $ 22,039
2006 $ 1,333 $ 18,923 $ 19,329 $ 39,584
2007 $ (107,554) $ (20,761) $ 13,717 $ (114,598)
2008 $ 4,569 $ 31,432 $ 26,821 $ 62,822
2009 $ 10,787 $ 59,476 $ 22,504 $ 92,767
2010 $ 5,095 $ 47,730 $ 26,136 $ 78,961
2011 $ 13,261 $ 105,263 $ 67,033 $ 185,557
2012 $ (126,220) $ 37,917 $ 28,911 $ (59,392)
2013 $ 6,552 $ 79,731 $ 48,323 $ 134,606
2014 $ 7,642 $ 63,323 $ 28,951 $ 99,915
3 Yr $ (37,342) $ 60,324 $ 35,395 $ 58,376
5 Yr $ (18,734) $ 66,793 $ 39,871 $ 87,930
10 Yr $ (18,314) $ 43,272 $ 29,269 $ 54,226
15 Yr $ (24,661) $ 13,199 $ 10,787 $ (674)
Additional Considerations
The following analysis covers additional elements that we considered in our modelling. These figures are
provided as reference points for the reader on other key factors that may not have been discussed in
detail in the narrative above, but are also clearly important items in the broader discussion on
component pricing.
Canada Oil Production Increases - Yield vs Oil Content
As mentioned in the introduction of this report, the Canola Council of Canada past three strategic plans
focused on yield and production targets. We therefore wanted to test the hypothesis if yield gains would
outstrip oil content gains when looking at value to the producer.
The chart below suggests that over the short and long term, yield gains have resulted in greater oil
production across Canada than oil content improvements. Obviously increases in either factor increase
overall oil production across the prairies and results in an economic gain for the industry.
However, a focus on yield results in a system that already rewards increased oil production through
payment via each metric tonne delivered. Looking at the years 2000-2004 we find average oil content
was 42.42% while 2010-2014 the average was 44.84%. Similarly, yield also increased where 2000-2004
had an average of .4852MT/acre while 2010-2014 the average was .712MT/acre.
If we were to consider a 1,500 acre farm at $400/tonne and oil representing 80% of the value per tonne,
the following table maps out the impact of this historical yield increase versus oil content. Through this
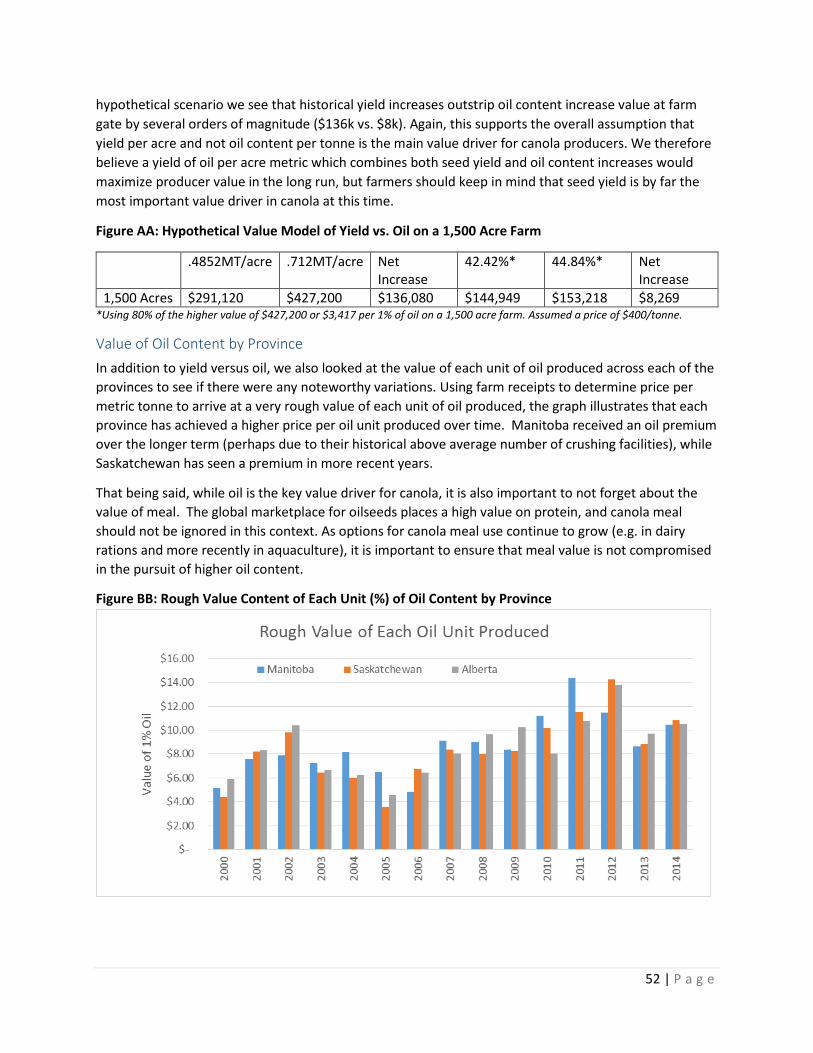
52 | P a g e
hypothetical scenario we see that historical yield increases outstrip oil content increase value at farm
gate by several orders of magnitude ($136k vs. $8k). Again, this supports the overall assumption that
yield per acre and not oil content per tonne is the main value driver for canola producers. We therefore
believe a yield of oil per acre metric which combines both seed yield and oil content increases would
maximize producer value in the long run, but farmers should keep in mind that seed yield is by far the
most important value driver in canola at this time.
Figure AA: Hypothetical Value Model of Yield vs. Oil on a 1,500 Acre Farm
.4852MT/acre .712MT/acre Net Increase
42.42%* 44.84%* Net Increase
1,500 Acres $291,120 $427,200 $136,080 $144,949 $153,218 $8,269 *Using 80% of the higher value of $427,200 or $3,417 per 1% of oil on a 1,500 acre farm. Assumed a price of $400/tonne.
Value of Oil Content by Province
In addition to yield versus oil, we also looked at the value of each unit of oil produced across each of the
provinces to see if there were any noteworthy variations. Using farm receipts to determine price per
metric tonne to arrive at a very rough value of each unit of oil produced, the graph illustrates that each
province has achieved a higher price per oil unit produced over time. Manitoba received an oil premium
over the longer term (perhaps due to their historical above average number of crushing facilities), while
Saskatchewan has seen a premium in more recent years.
That being said, while oil is the key value driver for canola, it is also important to not forget about the
value of meal. The global marketplace for oilseeds places a high value on protein, and canola meal
should not be ignored in this context. As options for canola meal use continue to grow (e.g. in dairy
rations and more recently in aquaculture), it is important to ensure that meal value is not compromised
in the pursuit of higher oil content.
Figure BB: Rough Value Content of Each Unit (%) of Oil Content by Province
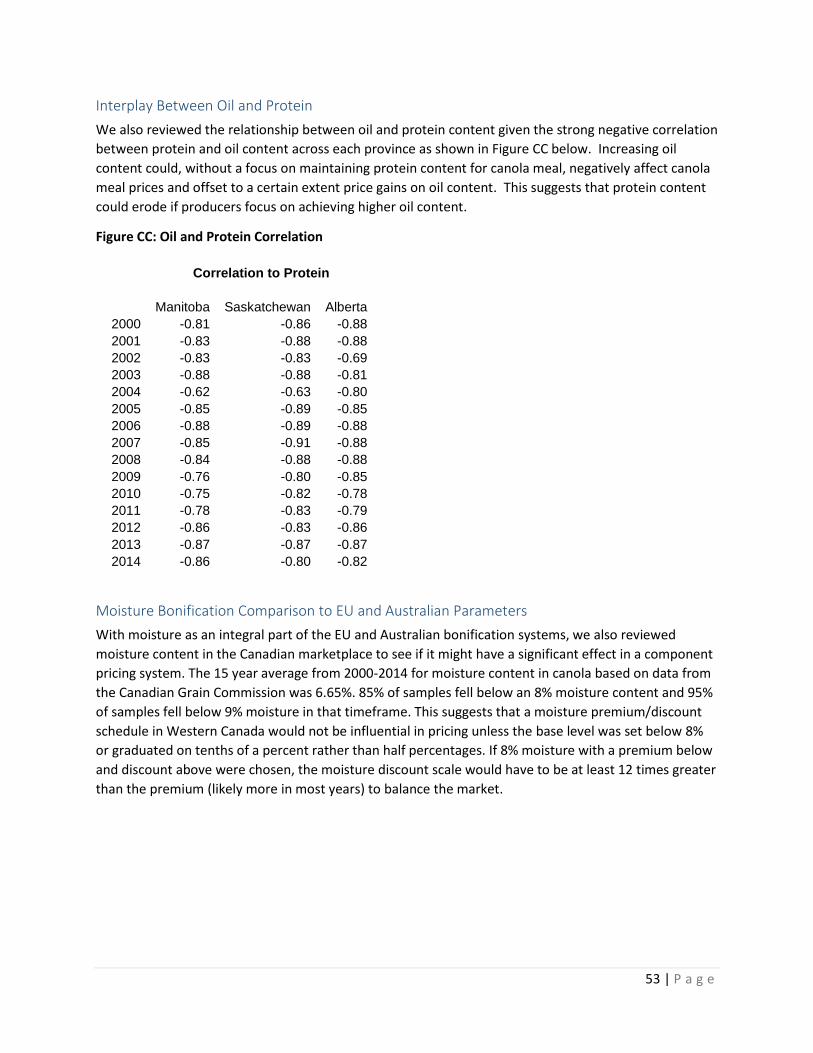
53 | P a g e
Interplay Between Oil and Protein
We also reviewed the relationship between oil and protein content given the strong negative correlation
between protein and oil content across each province as shown in Figure CC below. Increasing oil
content could, without a focus on maintaining protein content for canola meal, negatively affect canola
meal prices and offset to a certain extent price gains on oil content. This suggests that protein content
could erode if producers focus on achieving higher oil content.
Figure CC: Oil and Protein Correlation
Correlation to Protein
Manitoba Saskatchewan Alberta
2000 -0.81 -0.86 -0.88
2001 -0.83 -0.88 -0.88
2002 -0.83 -0.83 -0.69
2003 -0.88 -0.88 -0.81
2004 -0.62 -0.63 -0.80
2005 -0.85 -0.89 -0.85
2006 -0.88 -0.89 -0.88
2007 -0.85 -0.91 -0.88
2008 -0.84 -0.88 -0.88
2009 -0.76 -0.80 -0.85
2010 -0.75 -0.82 -0.78
2011 -0.78 -0.83 -0.79
2012 -0.86 -0.83 -0.86
2013 -0.87 -0.87 -0.87
2014 -0.86 -0.80 -0.82
Moisture Bonification Comparison to EU and Australian Parameters
With moisture as an integral part of the EU and Australian bonification systems, we also reviewed
moisture content in the Canadian marketplace to see if it might have a significant effect in a component
pricing system. The 15 year average from 2000-2014 for moisture content in canola based on data from
the Canadian Grain Commission was 6.65%. 85% of samples fell below an 8% moisture content and 95%
of samples fell below 9% moisture in that timeframe. This suggests that a moisture premium/discount
schedule in Western Canada would not be influential in pricing unless the base level was set below 8%
or graduated on tenths of a percent rather than half percentages. If 8% moisture with a premium below
and discount above were chosen, the moisture discount scale would have to be at least 12 times greater
than the premium (likely more in most years) to balance the market.
54 | P a g e
Section 6: Conclusion & Recommendations
In this report we have studied a number of factors to determine if Saskatchewan producers should
advocate for a component pricing system in canola. This assessment has included international and
domestic market factors, production factors, implementation matters, international experience with
component pricing for canola in other jurisdictions, a review of relevant historical quality statistics and
modelling of various elements that would potentially impact a component pricing system. Our research
and analysis has included both quantitative methodologies (statistical review and modelling) as well as
qualitative methods (interviews and literature research).
On international market factors, we have seen that canola is a relatively homogenous product (i.e., bulk
commodity), has readily available substitutes, has a concentrated group of importing countries and is a
price taker in international markets. These market perspectives were consistently echoed by
respondents in our qualitative research. We have found through our extensive interviews that it is
unlikely that international and domestic buyers would pay a premium in contracts for segregation costs
of high oil content canola over the normal bulk market. At the same time, we have also found that
buyers are pricing in oil content in their bids and expectations of oil content from various countries, and
that minimum oil content requirements in contracts are commonplace. In other words, buyers are
paying for oil, alongside a number of other factors, but unwilling to reduce the efficiencies of a high
volume bulk supply chain to get higher oil content feedstock through a more segregated marketplace
based on oil content.
With respect to domestic market factors, we have discussed the financial necessity of crush plant high
cost fixed assets drawing from the surrounding growing region for as much of their feedstock as possible
which leads to typically strong bids from crushers in those regions where these plants are situated.
While oil content is surely a factor in their profitability, they have demonstrated that they will normally
purchase whatever canola is ultimately available in the draw area. In addition, with respect to crusher
profitability, we understand that questions about component pricing tend to be raised at times when
crush margins widen. The dramatic variability of crush margins should in itself demonstrate that there is
not a structural advantage to crushers versus exporters who strongly compete for producer deliveries.
We have also discussed the similar rigidities of companies operating elevator networks for the export of
bulk seed, and the focus of efficient high volume throughput in their margin structure. In this
assessment we have demonstrated that truck freight is a strong inhibitor of longer haul procurement by
either crushers or elevators in order to try and acquire higher oil content canola beyond their normal
catchment area. As such, we find that competition for canola in any given growing region is the most
important factor to ensuring that farmers are getting full value for their product and removing any
opportunity for upstream players to arbitrage oil content variations between growing regions.
Regarding production factors, we have reviewed quality characteristics observed in Western Canadian
canola over the past 15 years. There is a clear upward trend for oil content in the prairies with a
significant and sustained jump in oil content roughly ten years ago. This coincides with known
improvements in commercially available genetics (supported by advancements ever since) which we
believe have been a key factor in reducing year to year, and region to region variability on oil content. In
reviewing oil content statistics we have also observed that there is not as much north-south variability in
oil content as originally thought, and have suggested that there is perhaps more variability east-west in
55 | P a g e
recent experience in Western Canada. We have also reviewed studies on agronomic practices that can
affect oil content and have noted that there are relatively few items that producers have direct control
over to influence oil content. Ultimately, environment has been shown to be the greatest factor on oil
content.
In looking to experience with bonification systems for canola in other jurisdictions such as the EU and
Australia, we highlighted that these systems have both premiums and discounts, and include other
factors beyond oil content in their premium-discount schedules. We have observed that pricing in these
systems do not necessarily have any more transparency to them given basis levels are adjusted to reflect
the expected transaction price with end users in that region taking into account the multitude of factors
which influence pricing. In the case of the EU, we have also noted that it is a domestically driven market
with different market pressures (i.e., more local in nature and not having to compete with other
producing origins to the same extent as Canada) and Canadian producers should be prudent about
drawing direct comparisons between these two markets. In the case of Australia, we have found in our
interviews that component pricing has had a positive impact in increasing oil content (the main
objective), but has not resulted in any premiums for their product in the international marketplace (e.g.,
they do not segregate high and low oil content canola). In fact, we had some comments that the fixed
pricing for oil content in Australia created some inflexibility that may be affecting market share in some
importing countries.
From an implementation perspective, we have discussed the strong potential for additional costs for
administering a bonification program which would need to be borne by the value chain when they are
unable to capture higher value from customers to cover these costs. Producers will be exposed to those
expenses being passed on and should be wary of adding additional costs into a system that would not
result in more financial benefits being paid by end users beyond what we currently experience in the
marketplace.
In our research on oil content distribution we observed that Saskatchewan has a typically higher average
oil content distribution over other provinces and Manitoba in particular. Through a sensitivity analysis
comparing the average price of canola in Saskatchewan to the rest of Western Canada and modelling
that against the average price of a basket of commodities, we have found that Saskatchewan’s canola
producers are being paid by the market to grow canola. Furthermore, we found that this incentive is
roughly equivalent to the average higher oil content found in Saskatchewan versus the rest of the
prairies. While there is no way to draw a direct cause and effect to this outcome, we believe that the
correlation is clear and that elimination of other potential factors that could produce this result
demonstrates that oil content is likely a significant factor.
When modelling the possible outcome of a hypothetical premium and discount schedule for
Saskatchewan we found that there is likely going to be a significant adjustment downwards of cash basis
levels and a certain redistribution of wealth away from some producers to pay for higher oil content
grown by others. Over a longer timeframe, we demonstrated that the premiums would end up
delivering a relatively low payback to Saskatchewan farmers taking into account the peaks and valleys of
oil content year over year. Finally, we strongly argue and demonstrate in the modelling that yield is a
much greater value driver for producers than oil content (by several orders of magnitude). As such, a
focus on oil content in a component pricing system may be sending the wrong signal to producers from
a profit making perspective. Instead, we find that a focus on oil yield per acre over oil content per tonne
56 | P a g e
would maximize producer value. In this we find the Canola Council of Canada’s last three strategic plans
have focused on yield, which ultimately drives both producer and industry profitability better than any
other metric.
Recommendations
With little to no ability to capture premiums for component pricing through segregated markets, we
believe that a bonification system would result in both a redistribution among certain producers as well
as absorption of the premiums and implementation costs through a downward adjustment of basis
levels. We understand that the major objective for proponents of a ‘pay for oil’ system in Canada are to
ensure that producers are receiving the full value of the canola they are producing, but we do not
believe that this would actually be accomplished through bonification. As a result, we have two key
recommendations that should help producers determine from time to time if they are getting paid the
full value for the crop grown.
1) In our view, Saskatchewan producers are more likely to receive the full value for their canola if
they have strong and numerous competitive bids for their crop in any given growing region.
Therefore, we believe it would be worthwhile to review from time to time the local bid
competition for canola across the province and determine if there are any gaps in the
competitive landscape. We anticipate that while the majority of local areas will have at least 3
or 4 bids, there are many that will have upwards of 8 bids. Shedding light on any local
competition inefficiencies and determining what action may be taken to ensure this does not
result in poor value for local producers should help alleviate problem spots. In addition, we also
think it is worthwhile for producer organizations to adopt policies and program activities that
could help promote and enhance competition for farm gate canola.
2) With respect to competition abroad and the potential for international arbitrage of Canadian
canola versus other origins we recommend that producer organizations periodically assess
values for Canadian canola prices vs Australian and Black Sea prices FOB tide water to key
competitive markets like China, UAE, Pakistan, Mexico and Japan. One could then work back
from FOB tide water to determine the relative value of rents being taken versus the average
inland transaction price from various regions. Like local pricing, there are many variables at play
and certain assumptions or conclusions will need to be drawn about other key pricing factors in
international transactions (e.g., ocean freight, time of year, supply and demand, quality, etc.).
The objective is to determine if Canadian producers are receiving full value for their canola
versus internationally competitive product in order to ascertain if there are any rents being
drawn by downstream partners that are unusual versus other origins. Again, this would not
necessarily result in a direct cause and effect type of analysis, but it should allow for general
conclusions to be made about the efficiency of the market to share profits from end use
customers back to farm gate.
57 | P a g e
APPENDIX A – Questionnaire
Industry Questionnaire for SaskCanola Component Pricing Project
Background: There has been a longstanding discussion among all segments of the value chain on
whether component pricing would be beneficial for the Canadian canola industry. Producers in
particular are interested in whether or not this would enhance revenue opportunities for them as the
pricing signal shifts away from straight yield/grade to include other elements such as oil content. This, of
course, implies that alongside the potential for a premium would be the reality of a discount if a
shipment did not meet the base oil content specification. It also has the potential to change the
direction of variety improvements, and all the implications that this may hold, given that producers
would no longer be focused on varieties delivering yield/grade alone.
SaskCanola, the provincial producer organization for canola in Saskatchewan, has engaged New West
Public Affairs (NWPA) to conduct an extensive research project to better understand the challenges and
benefits of component pricing as identified by industry. This in turn will be an important reference point
for the organization as it determines its own position on whether component pricing for canola is in
their producer membership’s best interests.
We have developed a short questionnaire that discusses a number of aspects of this topic, and we
would like to have your perspective on them. We should note that any answers or information that you
provide to us will be shared only in an amalgamated format and not for attribution to either individuals
or the organizations they represent. This approach also extends to our client, SaskCanola (in other
words, we will not be sharing individual thoughts and comments with them to maintain confidentiality
to improve the quality and forthrightness of our discussion and your response overall).
1. End use customer demand
a. If you are selling bulk seed, how often is oil content a quality characteristic in your
contracts with end use customers?
b. What countries are demanding this? Are they willing to pay a premium for high oil
content? Do you typically suffer a discount or contract penalties if the shipment doesn’t
meet this spec?
c. Have these “high oil” markets ever commented on the effect on meal or other quality
characteristics?
d. How does this affect the futures markets? Would significant adjustments need to be
made to those standard contracts? Are there examples in other crops that we can learn
from (e.g., protein in wheat)?
e. From your perspective, would whole of market adoption of component pricing give
canola an advantage or disadvantage with customers in relation to substitute products
such as soybeans? In what markets? Is there a risk of losing market share others?
58 | P a g e
2. Producer supply
a. What is the effect of canola oil content on crusher profitability? In other words, what is
the general impact of every percentage increase or decrease to rates of return for
canola crushers or exporters? What is the current “standard” oil content you’d expect
from canola in Canada in general?
b. Has your company (or are you aware of companies) ever had oil content as part of the
quality characteristics in grower contracts for canola or other oilseeds? Was this in
certain regions only? Was it to supply a specific crush facility, or did this also include
product destined for bulk seed export?
c. What was the general experience with them? What was the grower reaction? Did you
have discounts as well as premiums? How did this compare to standard grade/volume
contracts?
d. Was their additional administration or operations for these contracts? E.g., did you bin
separately? What kind of expense did you go to for testing equipment? Did producers
bring samples in as part of their marketing before contracting? Was it worth the
additional effort for the company? How about for the producer?
e. We know there’s regional variability on oil content in canola, how would you handle this
if the whole value chain agreed to adopt component pricing? What are the risks for low
oil content regions in particular?
f. Do you think it is possible to implement localized component pricing, for example in
north and central Alberta or Saskatchewan only? Why or why not?
g. What is your perspective on incorporating oil content into grading standards?
3. Testing procedures and analysis
a. The Canadian Grain Commission (CGC) has done some work on testing methodologies
and have determined that there are two types that can be used to equate to a driveway
test. The first is Nuclear Magnetic Resonance (NMR) and the second is Near Infrared
Reflectance (NIR). Wet chemistry is used to calibrate the two. Have you heard of either
method?
i. Have you used them before? What were the drawbacks? What were the
benefits?
ii. Can they be used effectively and rapidly?
iii. Do you think either of these methods has the required degree of accuracy upon
which to base a driveway test to verify the quality characteristic for a contract?
59 | P a g e
b. The cost based on CGC research for each was estimated at:
i. NIR – Dickie John $16-$20k, with a grinder necessary for the sample
ii. NIR - $100k
iii. NMR - $60k – once calibrated, should last about a year before needing re-
calibration
c. Do the above costs seems reasonable?
d. Would the costs eventually be borne by the producers to implement this across the
country? How?
4. System Wide Considerations
a. Do you believe moving to this method of pricing will result in increased transparency in
the price of canola and its products throughout the value chain?
b. When taken over a longer period of time, do you think this will result in any revenue
increase for producers and/or other segments of the value chain?
c. Component pricing for canola (and other crops) has been implemented in other
countries, do you have any insight as to how it may be working in those jurisdictions?
d. What are the competitive pressures vis-à-vis other regions of the world in this respect
(i.e., if other growing regions aren’t doing this how would this affect a Canadian system
based on oil content pricing)?
e. Within your company, do you think there is any difference in position on component
pricing when canola is being used for the domestic market vs being exported for
international ones?
f. Given your experience with marketing and utilizing canola, are there issues we have not
considered?
Overall, do you believe moving towards a component pricing system based on oil content will be
beneficial for the industry?
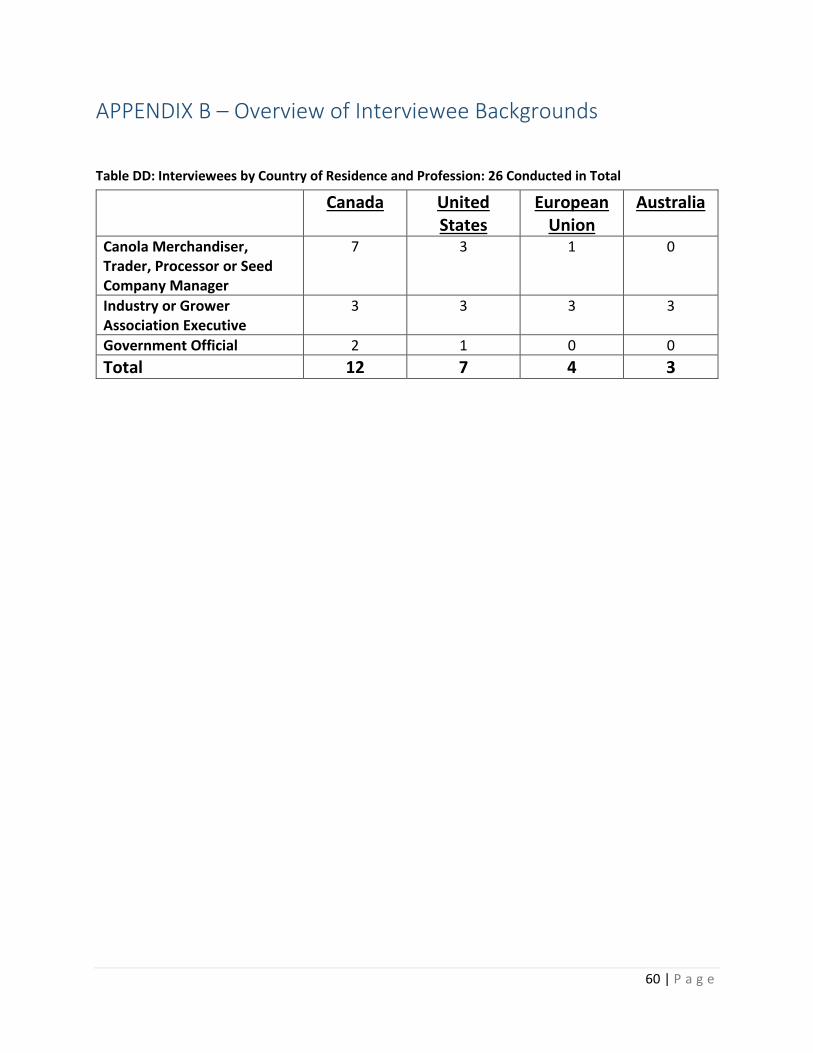
60 | P a g e
APPENDIX B – Overview of Interviewee Backgrounds
Table DD: Interviewees by Country of Residence and Profession: 26 Conducted in Total
Canada United States
European Union
Australia
Canola Merchandiser, Trader, Processor or Seed Company Manager
7 3 1 0
Industry or Grower Association Executive
3 3 3 3
Government Official 2 1 0 0
Total 12 7 4 3
61 | P a g e
APPENDIX C – Select Bibliography
Agricultural Commodities Market in India, World Vegetable Oil Fundamentals for 2014-15 -
http://prasoonmathur.blogspot.ca/2015/02/world-vegetable-oils-fundamentals-for.html
Australian Oilseeds Federation, Test Check Program -
http://www.australianoilseeds.com/Technical_Info/test_check_program
Canadian Canola Growers Association. Component Pricing Deck, Steve Pratte
Canadian Canola Growers Association. Information Note, Component Pricing of Canola Based on Oil
Content - http://www.ccga.ca/PolicyDevelopment/Documents/CCGA%20Information%20Note%20-
%20Component%20Pricing%20(June%202014).pdf
Canadian Grain Commission. Harvest and Export Quality Reports, Western Canadian Canola 2000
Canadian Grain Commission. Harvest and Export Quality Reports, Western Canadian Canola 2001
Canadian Grain Commission. Harvest and Export Quality Reports, Western Canadian Canola 2002
Canadian Grain Commission. Harvest and Export Quality Reports, Western Canadian Canola 2003
Canadian Grain Commission. Harvest and Export Quality Reports, Western Canadian Canola 2004
Canadian Grain Commission. Harvest and Export Quality Reports, Western Canadian Canola 2005
Canadian Grain Commission. Harvest and Export Quality Reports, Western Canadian Canola 2006
Canadian Grain Commission. Harvest and Export Quality Reports, Western Canadian Canola 2007
Canadian Grain Commission. Harvest and Export Quality Reports, Western Canadian Canola 2008 -
http://www.grainscanada.gc.ca/canola/harvest-recolte/2008/hqc08-qrc08-eng.htm
Canadian Grain Commission. Harvest and Export Quality Reports, Western Canadian Canola 2009 -
http://www.grainscanada.gc.ca/canola/harvest-recolte/2009/hqc09-qrc09-eng.htm
Canadian Grain Commission. Harvest and Export Quality Reports, Western Canadian Canola 2010 -
http://www.grainscanada.gc.ca/canola/harvest-recolte/2010/hqc10-qrc10-eng.htm
Canadian Grain Commission. Harvest and Export Quality Reports, Western Canadian Canola 2011 -
http://www.grainscanada.gc.ca/canola/harvest-recolte/2011/hqc11-qrc11-eng.htm
Canadian Grain Commission. Harvest and Export Quality Reports, Western Canadian Canola 2012 -
http://www.grainscanada.gc.ca/canola/harvest-recolte/2012/hqc12-qrc12-eng.htm
Canadian Grain Commission. Harvest and Export Quality Reports, Western Canadian Canola 2013 -
http://www.grainscanada.gc.ca/canola/harvest-recolte/2013/hqc13-qrc13-en.htm
Canadian Grain Commission. Harvest and Export Quality Reports, Western Canadian Canola 2014 -
http://www.grainscanada.gc.ca/canola/harvest-recolte/2014/hqc14-qrc14-1-en.htm
Canola Council of Canada. Current Canola Oil, Meal and Seed Prices -
http://www.canolacouncil.org/markets-stats/statistics/current-canola-oil,-meal,-and-seed-prices/
62 | P a g e
Canola Council of Canada. Management Practices to increase oil content in your canola crop -
http://canolacouncil.org/media/515701/management_practices.pdf
Canola Council of Canada. Nitrogen Fertilizer Management - http://www.canolacouncil.org/canola-
encyclopedia/fertilizer-management/nitrogen-fertilizer-management/#nitrogen5
Gao., J., Thelen, K.D., Min, D.H., Smith, S., Hao, X. and R. Gehl. Effects of Manure and Fertilizer
Applications on Canola Oil Content and Fatty Acid Composition -
https://dl.sciencesocieties.org/publications/aj/abstracts/102/2/790
Fayyaz-ul-Hassan, Hakoomat Ali, Mumtaz Akhtar Cheema and Abdul Manaf. Effects of Environmental
Variation on Oil Content and Fatty Acid Composition of Canola Cultivars -
http://www.bzu.edu.pk/jrscience/vol16no2/9.pdf
Monsanto. Agronomic Spotlight -
https://www.dekalb.ca/_uploads/documents/Agronomic_Information/CanolaArchive/what_affects_can
ola_oil.pdf
Pritchard, F.M., Eagles, H.A., Norton, R.M., Salisbury, P.A. and M. Nicolas. Environmental effects on seed
composition of Victorian canola - http://www.publish.csiro.au/?paper=EA99146
Taylor, A.J., Smith, C.J. and I. B. Wilson. Effect of irrigation and nitrogen fertilizer on yield, oil content,
nitrogen accumulation and water use of canola (Brassica napus L.) -
http://link.springer.com/article/10.1007%2FBF01052393
The Government of Manitoba, Department of Agriculture. Canola Sector -
http://www.gov.mb.ca/agriculture/market-prices-and-statistics/crop-
statistics/pubs/crop_canola_sector.pdf
The Union of Concerned Scientist. The Future of Biofuels Part3: Biodiesel -
http://blog.ucsusa.org/jeremy-martin/the-future-of-biofuels-part-3-biodiesel
United States Department of Agriculture, Foreign Agricultural Service. Table 03: Major Vegetable Oils:
World Supply and Distribution (Commodity View) -
http://apps.fas.usda.gov/psdonline/psdreport.aspx?hidReportRetrievalName=BVS&hidReportRetrievalI
D=533&hidReportRetrievalTemplateID=5
Walton, G., Ping, S. and B., Bowden . Environmental Impact on Canola Yield and Oil -
http://www.regional.org.au/au/gcirc/2/136.htm
Zhao-Hui Wang, Sheng-Xiu Li and Sukhdev Malhi. Effects of fertilization and other agronomic measures
on nutritional quality of crops - http://onlinelibrary.wiley.com/doi/10.1002/jsfa.3084/pdf