Embed Size (px)
Citation preview

FINAL REPORT
ECONOMIC VALUATIONIQOLIQOLI - TOURISM STUDY SUPPORT
(Fiji)
Isoa KOROVULAVULATanya O’GARRA
Patrick FONGRusiate RATUNIATA
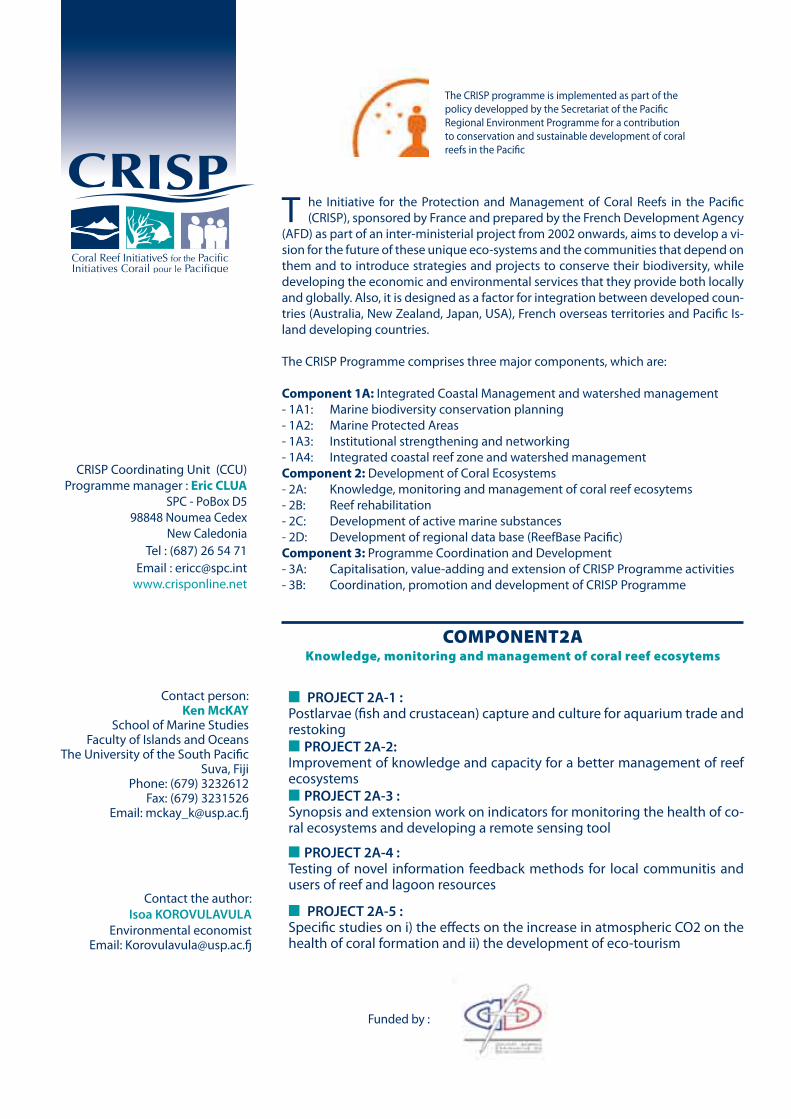
COMPONENT 2A - Project 2A2 Knowledge, monitoring, management and
beneficial use of coral reef ecosystems
January 2008
Funded by :
COMPONENT2A Knowledge, monitoring and management of coral reef ecosytems
Contact person: Ken McKAY
School of Marine StudiesFaculty of Islands and Oceans
The University of the South PacificSuva, Fiji
Phone: (679) 3232612Fax: (679) 3231526
Email: [email protected]
T he Initiative for the Protection and Management of Coral Reefs in the Pacific (CRISP), sponsored by France and prepared by the French Development Agency
(AFD) as part of an inter-ministerial project from 2002 onwards, aims to develop a vi-sion for the future of these unique eco-systems and the communities that depend on them and to introduce strategies and projects to conserve their biodiversity, while developing the economic and environmental services that they provide both locally and globally. Also, it is designed as a factor for integration between developed coun-tries (Australia, New Zealand, Japan, USA), French overseas territories and Pacific Is-land developing countries.
The CRISP Programme comprises three major components, which are:
Component 1A: Integrated Coastal Management and watershed management- 1A1: Marine biodiversity conservation planning - 1A2: Marine Protected Areas- 1A3: Institutional strengthening and networking- 1A4: Integrated coastal reef zone and watershed managementComponent 2: Development of Coral Ecosystems- 2A: Knowledge, monitoring and management of coral reef ecosytems- 2B: Reef rehabilitation- 2C: Development of active marine substances- 2D: Development of regional data base (ReefBase Pacific)Component 3: Programme Coordination and Development- 3A: Capitalisation, value-adding and extension of CRISP Programme activities- 3B: Coordination, promotion and development of CRISP Programme
The CRISP programme is implemented as part of the policy developped by the Secretariat of the Pacific Regional Environment Programme for a contribution to conservation and sustainable development of coral reefs in the Pacific
CRISP Coordinating Unit (CCU)Programme manager : Eric CLUA
SPC - PoBox D5 98848 Noumea Cedex
New CaledoniaTel : (687) 26 54 71
Email : [email protected]
n PROJECT 2A-1 :Postlarvae (fish and crustacean) capture and culture for aquarium trade and restokingn PROJECT 2A-2:Improvement of knowledge and capacity for a better management of reef ecosystemsn PROJECT 2A-3 :Synopsis and extension work on indicators for monitoring the health of co-ral ecosystems and developing a remote sensing tool
n PROJECT 2A-4 :Testing of novel information feedback methods for local communitis and users of reef and lagoon resources
n PROJECT 2A-5 :Specific studies on i) the effects on the increase in atmospheric CO2 on the health of coral formation and ii) the development of eco-tourism
Contact the author: Isoa KOROVULAVULA
Environmental economistEmail: [email protected]
1
TABLE OF CONTENTS Page
Acknowledgement .......................................................................................................... 3
Executive Summary.......................................................................................................... 5
1 Introduction ............................................................................................................... 8 1.1 Objective............................................................................................................10
1.2 Research Team...................................................................................................10
2 Method: economic valuation approaches applied in the study.................... 11 2.1 Total Economic Value Framework......................................................................12
2.1.1 Use Values ........................................................................................................................................... 13 2.1.1.1 Direct Use.................................................................................................................................... 13 2.1.1.2 Indirect Use.................................................................................................................................. 13
2.1.2 Non-Use Values .................................................................................................................................. 14 2.1.2.1 Option Value................................................................................................................................ 14 2.1.2.2 Quasi-Option Value ..................................................................................................................... 14 2.1.2.3 Bequest Value .............................................................................................................................. 14 2.1.2.4 Existence Value ........................................................................................................................... 15
3 Results – Literature Review and Data Gathered................................................. 16 3.1 Total Economic Value of Coral Reef ..................................................................18
3.1.1 Coral Reef Use Values ..................................................................................................................... 18 3.1.1.1 Direct Use Value.......................................................................................................................... 18 3.1.1.2 Indirect Use Value....................................................................................................................... 31
3.1.2 Coral reefs Non-Use Values ............................................................................................................ 32 3.1.2.1 Option values ............................................................................................................................... 32 3.1.2.2 Existence values........................................................................................................................... 33 3.1.2.3 Bequest values ............................................................................................................................. 33
3.2 Total Economic Value of Mangrove ..................................................................35 3.2.1 Mangrove Use Values ...................................................................................................................... 35
3.2.1.1 Direct Use Value.......................................................................................................................... 35 3.2.1.2 Indirect Use Value....................................................................................................................... 35
3.2.2 Mangrove Non-Use Value .............................................................................................................. 36 3.3 Total Economic Value of Beaches and Coastal Areas ......................................37 3.4 Summary of Key Economic Valuation Methods Applied to Quantify TEV ..........38
4 Discussion and Conclusion ................................................................................... 42
5 Recommendation................................................................................................... 43
References....................................................................................................................... 46
ANNEX 1 QOLIQOLI AND TOURISM ECONOMIC VALUATION PROJECT QUESTIONNAIRE ........ 49 Table 1 Summary of the Key iqoliqoli Biophysical systems…………………………………………………. 15 Table 2 Economic Valuation of Saleable Assets (fish and invertebrates…………………………………21 Table 3 Tourism Expenditure 2000-2003………………………………………………………………………….30 Table 4 Overseas Tourists Undertaking Non-organised activities (%) in a Iqoliqoli……………………....30 Table 5 Proportion (%) of Overseas Visitors Undertaking Non-Organised Activities 1999-2003……….31 Table 6 Summary of the Key Findings…………………………………………………………………………….40
2
Figure 1 Fiji Traditional Customary Fishing Ground ‘Qoliqoli’ in Fiji…………………...………………………4 Figure 2 Typical iqoliqoli’s biophysical, socioeconomic and institutional attributes…………………..…9 Figure 3 Total Economic Value…………………………………………………………………………………….12 Figure 4 Biophysical Features of the iqoliqoli with its different Economic Values……………………….17 Figure 5 Iqoliqolis along the coral coast………………………………………………………………….……..26 Figure 6 Economic Value and Economic Valuation Methods……………………………………………...39 Figure 7 Proposed compensation framework if the current Qoliqoli Bill ..………………………………..44 Figure 8 Key requirements for compensation ...………………………………..……………….……………..45
3
Acknowledgement We appreciate the assistance, contribution and constructive comments provided by the following people in the compilation of this report:
• Professor Bill Aalbersberg (Institute of the Applied Sciences, The University of the South Pacific;
• Dr Tracy Berno (Department of Tourism and Hospitality, The University of the South Pacific);
• Associate Professor Richard Brown (School of Economics, The University of Queensland)
• Mr Dick Smith (Chairman of Fiji Hoteliers Association) • Mr Reddy (Department of Lands, Government of Fiji) • Mr Aisake Batibasaga (Department of Fisheries, Government of Fiji)
4
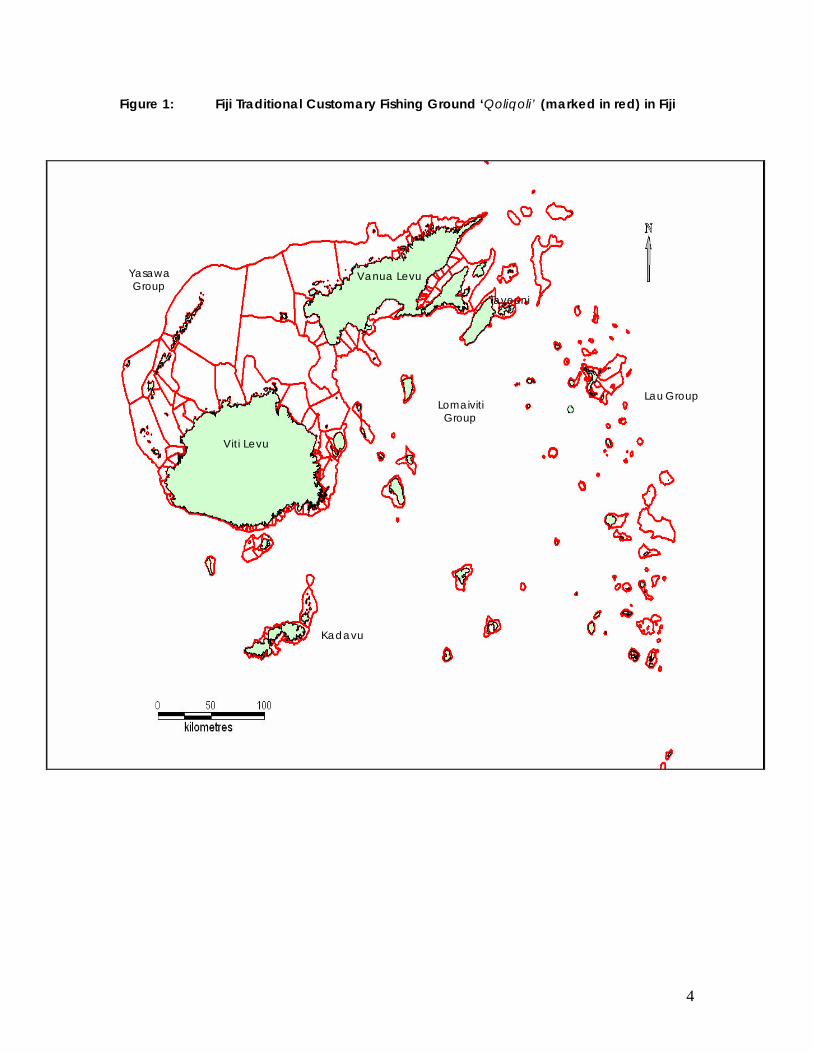
Figure 1: Fiji Traditional Customary Fishing Ground ‘Qoliqoli’ (marked in red) in Fiji
Viti Levu
Vanua Levu
Kadavu
Lau Group
Taveuni
Yasawa Group
Lomaiviti Group
5
Executive Summary
The primary aim of this study is to determine the value of natural assets that
affect the two key stakeholders in the tourism industry the Fijian taukei ni
vanua/iqoliqoli owners and the resort owners. Figure 1 illustrates the entire
iqoliqoli in Fiji. The underlying factor that led to this study was the possible and
potential positive and negative implications of the impending iqoliqoli Bill
legislation may have on the tourism industry. Moreover the study is one of the first
steps to seek some means at which the overall harmonious relationship between
Fijian taukei ni vanua/i qoliqoli and resorts can be maintained.
The three sites that were identified for the study were:
§ The Coral Coast which is along the south western coast of Viti Levu (Old
but still a vibrant tourism activity area in Fiji);
§ The tourism areas and iqoliqoli on the island of Kadavu (new tourism
development area – one of the outer islands located on south of Fiji); and
§ Mamanuca island resorts to the South-west of Nadi Airport.
The only site out of three sites that had relevant data on saleable natural assets
of the iqoliqoli was the eleven iqoliqoli along the Corals Coast. The other two sites
Kadavu and the Mamanucas had inadequate data available. The biological
data was collected from Coral Cay assessments in 2005.
The Total Economic Value (TEV) framework was used for the literature review and
the analysis of data. It is important to note that a full economic valuation of Fiji’s
natural resources has not been carried out. This report indicates that there are
gaps and a more in-depth economic valuation ought to be done for coral reef,
mangrove and related ecosystems.
The various economic valuation studies and report reviewed in this study show
that production approach and replacement cost method are used to quantify
6
the monetary direct and indirect use value respectively. Contingent Valuation
Method and Benefit Transfer methods are used to quantify non-use values.
The following are the findings based on the primary objectives of the study.
The eleven iqoliqoli along the Coral Coast indicate saleable assets (fish and
invertebrates) or its direct use value based on two scenarios of MSY ranged from
F$3,001,422.02 to F$8,025,022.29 per Km2 per year in scenario A (or F$30,014.22 to
F$80,250.02 per hectare per year) and F$75,723.07 to F$547,998.90 per Km2 per
year in scenario B (or F$757.23 to F$5,480 per hectare per year). In addition the
direct use value of mangrove is about US$11,000 a hectare (Hamilton and
Snedaker eds. in Brown et al. 1993).
The coral reef system as reported by various studies elsewhere has a total
economic value which includes tangible and intangible assets in the range of
US$1,373 per hectare to US$1.02 million per hectare. There were inadequate
data to make such valuation in Fiji, but assuming tangible value to be a major
component of total economic value, the lower limits are in good agreement.
Most international calculations of the TEV is in the range of US$7,000 to US$12,000
per hectare.
The approximate average economic value of the use of marine resources and
ecosystem by tourists namely swimming, snorkelling, scuba diving, reef walking
and kayaking/ canoeing/ water sports fishing (as determined by the information
in the Fiji International Visitor survey) is estimated to range from be F$74.08 million
a year, or F$171.20 per visitor per year to F$335.05 million or F$777.74 per visitor
per year (based on 2003 Tourist data).
The non-use value (option, quasi-option, bequest and existence values) cannot
be calculated because of inadequate information and data as well as time
constraint in relation to this specific study. However, according to Sisto (1999)
based on the application of benefit transfer valuation method the disturbance
7
regulation of coral reef and mangrove in Fiji are approximately F$307.2 million
and F$105 million respectively.
In future there is a real need to conduct in-depth economic valuation studies on
the indirect use values, option values, existence values and bequest values of
coral reef, mangrove and related ecosystems in order to fully capture the TEV of
iqoliqoli. This can only be done if reliable and relevant biological and
socioeconomic data are available.
The specific resort survey in Fiji had a poor response and better co-operation by
resorts would lead to more accurate data on tourist resource use per area.
8
1 Introduction
The main purpose of the economic valuation study is to provide a framework
that can be used as a basis for discussing compensation in relation to the
iqoliqolqi development issues. In this case the focus is on tourism development
and activities. The iqoliqoli is the customary fishing ground which extends from
the high-tide water mark along the shoreline to the most outer reef crest (that is it
can be either a fringing or a barrier reef). Hence, a iqoliqoli may consist of the
following biophysical features: shoreline with mudflats and/or beaches;
mangrove ecosystem, fringing reef system, lagoon and barrier reef system.
According to the Qoliqoli Bill (2006) iqoliqoli is defined as the any area of seabed
or soil under the waters, sand, reef, mangrove swamp, river, stream or wetland or
any other area, recognised and determined within customary fishing grounds
under the Fisheries Act or as clarified in accordance with this Act, and includes
any customary fishing grounds reclaimed before or any qoliqoli area reclaimed
after the commencement of this Act.
The report is divided into six major sections. The first section is an introduction to
the objectives and scope of the study. The second describe the method that
was applied in the research particularly the framework at which the required
information was reviewed and assessed. The third section is the result and
discussion of the outcomes of the investigation. The fourth section specifically
sums up the result of the findings as it relates to the objective of the study. The
fifth section puts forward recommendation on how some critical aspects of
economic valuation need to be carried out in future in order to come up with
more reliable and realistic economic values of coral reef and related
ecosystems. In addition this section also proposes a framework at which a
formula of compensation of iqoliqoli can be explored and be used for further
discussion.
In order to develop a meaningful framework for the development of a iqoliqoli
compensation formula it is important that key factors and issues are identified
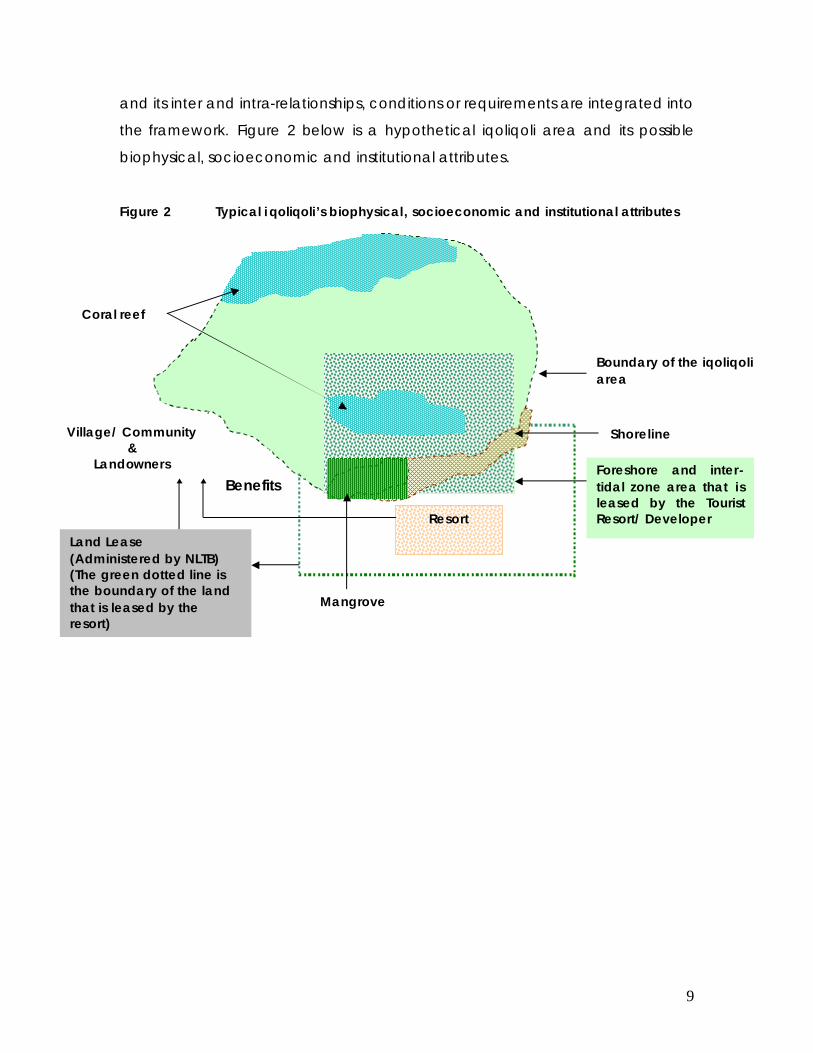
9
and its inter and intra-relationships, conditions or requirements are integrated into
the framework. Figure 2 below is a hypothetical iqoliqoli area and its possible
biophysical, socioeconomic and institutional attributes.
Figure 2 Typical i qoliqoli’s biophysical, socioeconomic and institutional attributes
Boundary of the iqoliqoli area
Foreshore and inter-tidal zone area that is leased by the Tourist Resort/ Developer
Mangrove
Coral reef
Shoreline
Land Lease (Administered by NLTB) (The green dotted line is the boundary of the land that is leased by the resort)
Resort
Village/ Community &
Landowners Benefits
10
1.1 Objective
The principal objectives of the study are to:
• Carry out an economic valuation of three representatives iqoliqoli based
on saleable assets (fish and invertebrates) to provide a range of values
per area unit. Evaluation will be based on existing biological surveys and
market costs.
• Carry out an evaluation of a coral reef system that combines sale-able
assets as well as internationally accepted intangible (service) values. A
survey of such studies done internationally will be undertaken and
valuations adjusted based on Fiji economic realities.
• Carry out a separate evaluation of the iqoliqoli based on tourist use. This
will be done by looking at how many tourists use the iqoliqoli different
ways and what value this brings to the industry.
1.2 Research Team The economic valuation study team were Patrick Fong, Rusiate Ratuniata, Tanya
O’Garra and Isoa Korovulavula.
11
2 Method: economic valuation approaches applied in the study
A literature review was conducted on economic valuation specifically on coral
reefs, coastal ecosystems and tourism. A survey questionnaire was sent to a
number of resorts to gather information on tourist use of coastal and marine
ecosystems (refer to Annex 1). For the Coral Coast case study the Coral Cay
biological data provided the principal basis for the valuation of the tangible
saleable marine resource assets.
The consultancy examined three sites as a case study for this exercise. The three
sites that have been identified are:
• The Coral Coast which is along the south western coast of Viti Levu (Old
but still a vibrant tourism activity area in Fiji);
• The tourism areas and iqoliqoli on the island of Kadavu (new tourism
development area – one of the outer islands located on south of Fiji); and
• Mamanuca island resorts south-west of Nadi airport, a major tourism
destination.
The coral coast has all relevant biological and socioeconomic data to enable
the quantification of monetary value of all the tangible assets. The following
were iqoliqoli that were part of the study along the coral coast located on the
south-western part of Viti Levu. They are: Korolevu-i-Wai; Vanua Ko Conua kei
Naivikikabuta; Vanua ko Yavusauna kei Voua; Yavusa ko Burenitu; Yavusa ko
Nadruku; Vanua ko Madudu; Vanua ko Nasigatoka; Vanua ko Tabanivono I Ra;
Yavusa Ketenamasi, Leweitaqalulu, Tacini, Nalotawa, Lewei; Yavusa Noi
Naculaca and Vanua of Komave comprising of Yavusa Vusu.
The tourism areas and iqoliqoli on the island of Kadavu cannot be adequately
covered in this study because of the lack of tourism, biological and
12
socioeconomic data. There was also poor response from resort owners in
completing the questionnaires that were sent to them.
The tourist resorts Mamanucas and Yasawas provided some data but not
adequate to gauge reliable tourist use values specifically of the iqoliqoli.
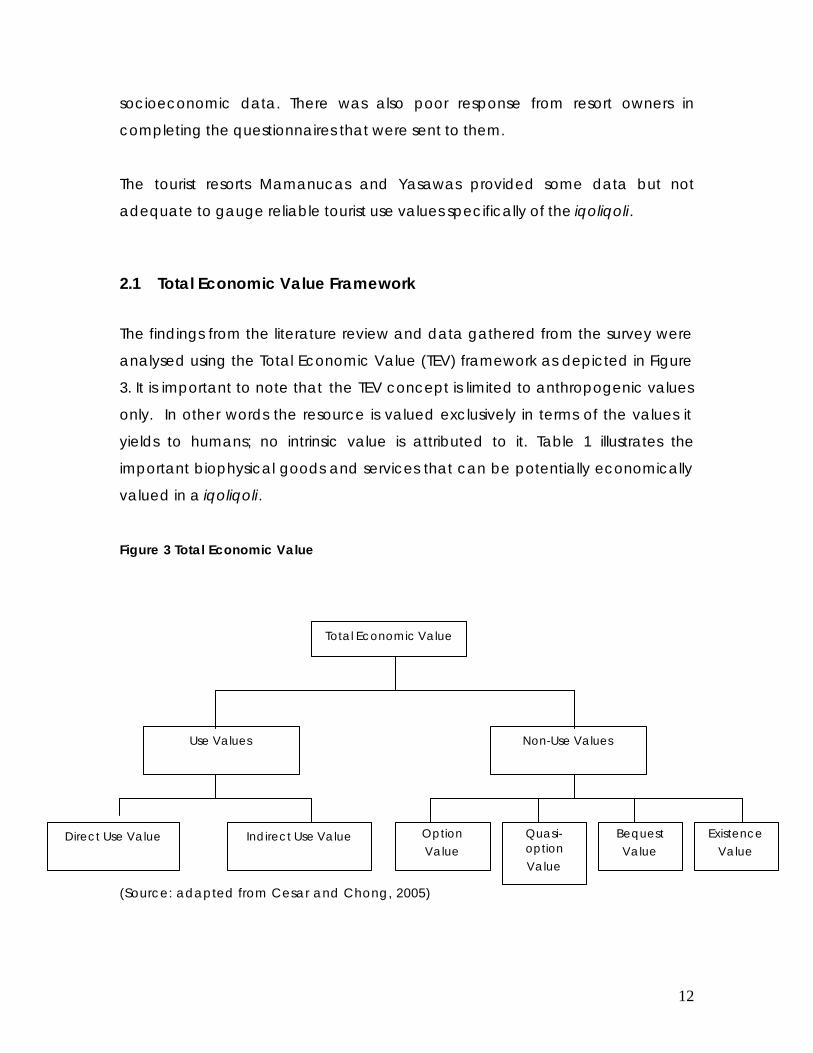
2.1 Total Economic Value Framework
The findings from the literature review and data gathered from the survey were
analysed using the Total Economic Value (TEV) framework as depicted in Figure
3. It is important to note that the TEV concept is limited to anthropogenic values
only. In other words the resource is valued exclusively in terms of the values it
yields to humans; no intrinsic value is attributed to it. Table 1 illustrates the
important biophysical goods and services that can be potentially economically
valued in a iqoliqoli.
Figure 3 Total Economic Value
(Source: adapted from Cesar and Chong, 2005)
Bequest Value
Option Value
Non-Use Values Use Values
Quasi-option Value
Indirect Use Value Direct Use Value Existence Value
Total Economic Value
13
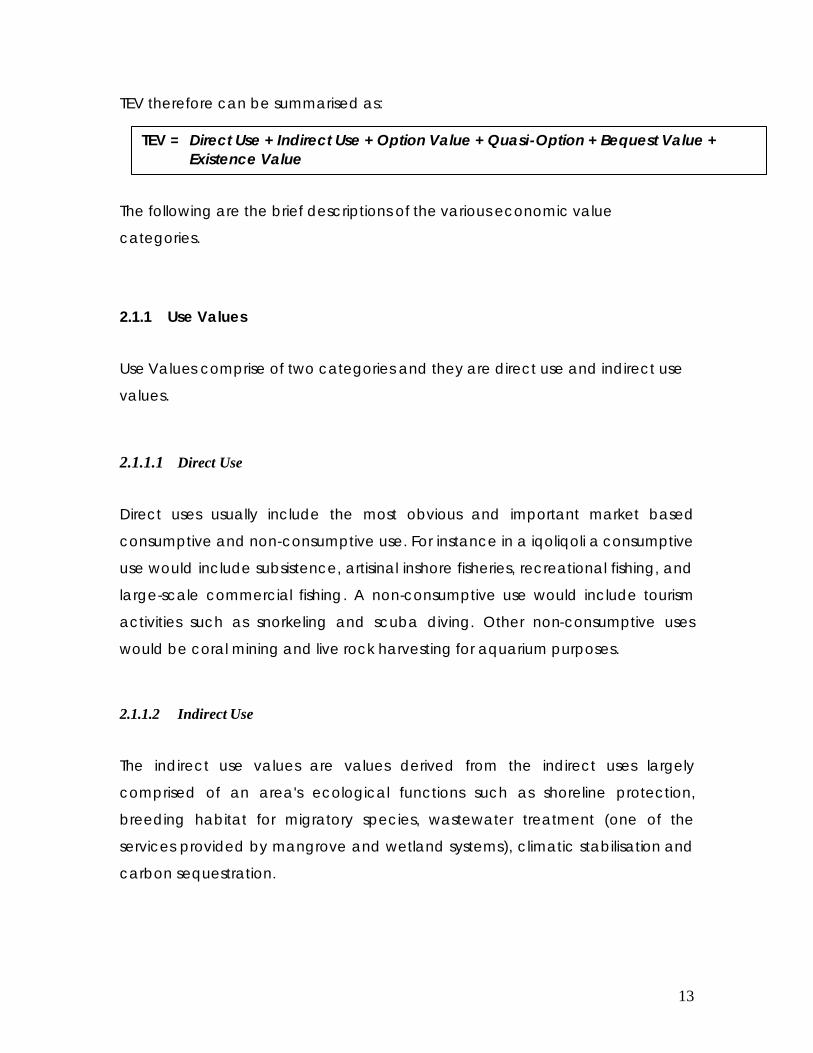
TEV therefore can be summarised as:
The following are the brief descriptions of the various economic value
categories.
2.1.1 Use Values
Use Values comprise of two categories and they are direct use and indirect use
values.
2.1.1.1 Direct Use
Direct uses usually include the most obvious and important market based
consumptive and non-consumptive use. For instance in a iqoliqoli a consumptive
use would include subsistence, artisinal inshore fisheries, recreational fishing, and
large-scale commercial fishing. A non-consumptive use would include tourism
activities such as snorkeling and scuba diving. Other non-consumptive uses
would be coral mining and live rock harvesting for aquarium purposes.
2.1.1.2 Indirect Use
The indirect use values are values derived from the indirect uses largely
comprised of an area's ecological functions such as shoreline protection,
breeding habitat for migratory species, wastewater treatment (one of the
services provided by mangrove and wetland systems), climatic stabilisation and
carbon sequestration.
TEV = Direct Use + Indirect Use + Option Value + Quasi-Option + Bequest Value + Existence Value
14
2.1.2 Non-Use Values
Nonuse values are derived independently of any current or expected future
contact with the resource itself or with the tangible services that it provides. Non-
Use values are categorized into four categories and they are option, quasi-
option, bequest and existence values.
2.1.2.1 Option Value
Option value is the value an individual attaches to keep alive the possibility of
one day to be able to benefit from the resource. Therefore since it is the value
attached to potential use, its current non-use value is attributable to its potential
use value in future. An example of this would be the potential of extracting and
developing a pharmaceutical product sometime in the future from a natural
resource which may not be used or consumed at all in the present time by
people.
2.1.2.2 Quasi-Option Value
Quasi-Option Value is related to option value. The only difference is the emphasis
of uncertainty and irreversibility. In other words quasi-option value is the value
attached by delaying any action or decision that would cause irreversible
degradation.
2.1.2.3 Bequest Value
Bequest value is the value an individual place on his/ her satisfaction attributed
to the continued existence of a biophysical resource for future possible benefit of
others, either known or unknown to him or her.
15
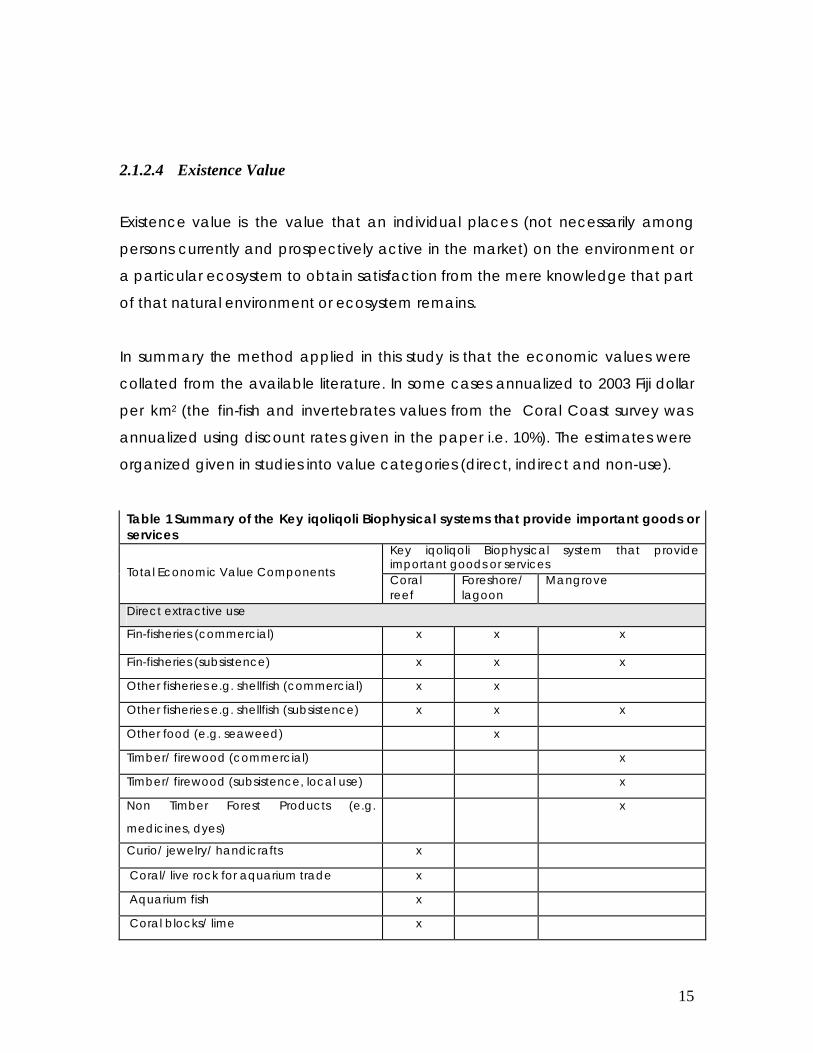
2.1.2.4 Existence Value
Existence value is the value that an individual places (not necessarily among
persons currently and prospectively active in the market) on the environment or
a particular ecosystem to obtain satisfaction from the mere knowledge that part
of that natural environment or ecosystem remains.
In summary the method applied in this study is that the economic values were
collated from the available literature. In some cases annualized to 2003 Fiji dollar
per km2 (the fin-fish and invertebrates values from the Coral Coast survey was
annualized using discount rates given in the paper i.e. 10%). The estimates were
organized given in studies into value categories (direct, indirect and non-use).
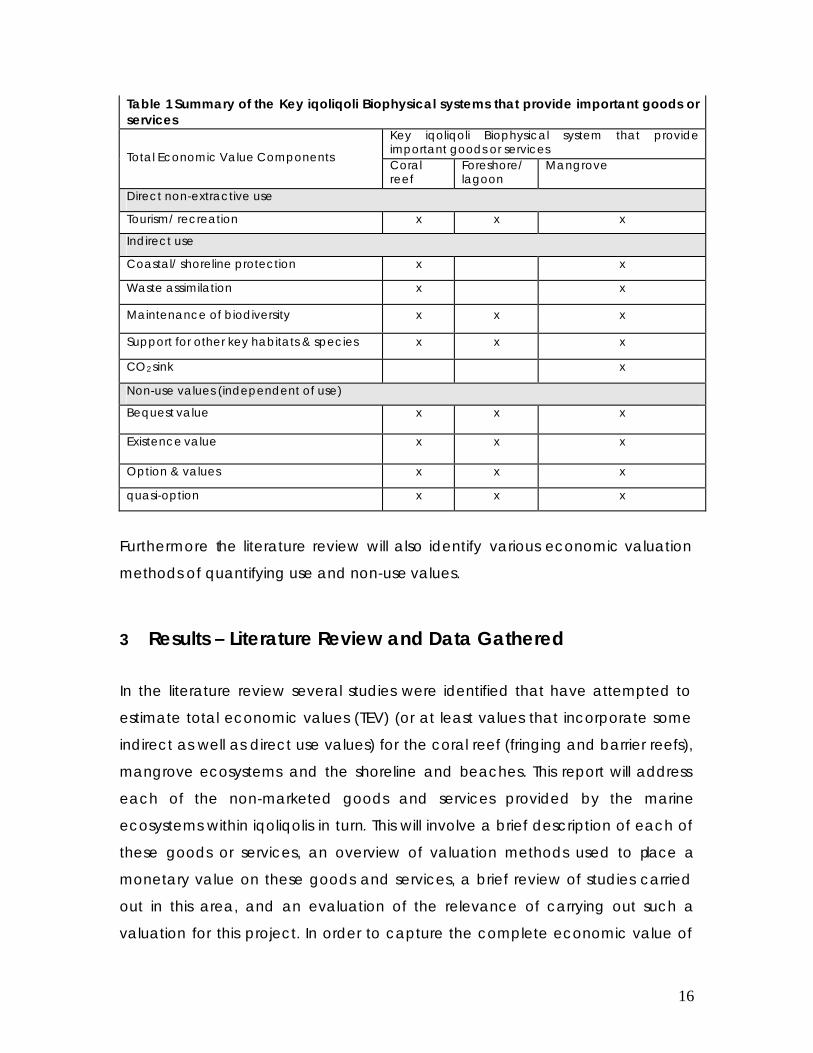
Table 1 Summary of the Key iqoliqoli Biophysical systems that provide important goods or services
Key iqoliqoli Biophysical system that provide important goods or services
Total Economic Value Components Coral reef
Foreshore/ lagoon
Mangrove
Direct extractive use
Fin-fisheries (commercial) x x x
Fin-fisheries (subsistence) x x x
Other fisheries e.g. shellfish (commercial) x x
Other fisheries e.g. shellfish (subsistence) x x x
Other food (e.g. seaweed) x
Timber/ firewood (commercial) x
Timber/ firewood (subsistence, local use) x
Non Timber Forest Products (e.g.
medicines, dyes)
x
Curio/ jewelry/ handicrafts x
Coral/ live rock for aquarium trade x
Aquarium fish x
Coral blocks/ lime x
16
Table 1 Summary of the Key iqoliqoli Biophysical systems that provide important goods or services
Key iqoliqoli Biophysical system that provide important goods or services
Total Economic Value Components Coral reef
Foreshore/ lagoon
Mangrove
Direct non-extractive use
Tourism/ recreation x x x
Indirect use
Coastal/ shoreline protection x x
Waste assimilation x x
Maintenance of biodiversity x x x
Support for other key habitats & species x x x
CO2 sink x
Non-use values (independent of use)
Bequest value x x x
Existence value x x x
Option & values x x x
quasi-option x x x
Furthermore the literature review will also identify various economic valuation
methods of quantifying use and non-use values.
3 Results – Literature Review and Data Gathered
In the literature review several studies were identified that have attempted to
estimate total economic values (TEV) (or at least values that incorporate some
indirect as well as direct use values) for the coral reef (fringing and barrier reefs),
mangrove ecosystems and the shoreline and beaches. This report will address
each of the non-marketed goods and services provided by the marine
ecosystems within iqoliqolis in turn. This will involve a brief description of each of
these goods or services, an overview of valuation methods used to place a
monetary value on these goods and services, a brief review of studies carried
out in this area, and an evaluation of the relevance of carrying out such a
valuation for this project. In order to capture the complete economic value of
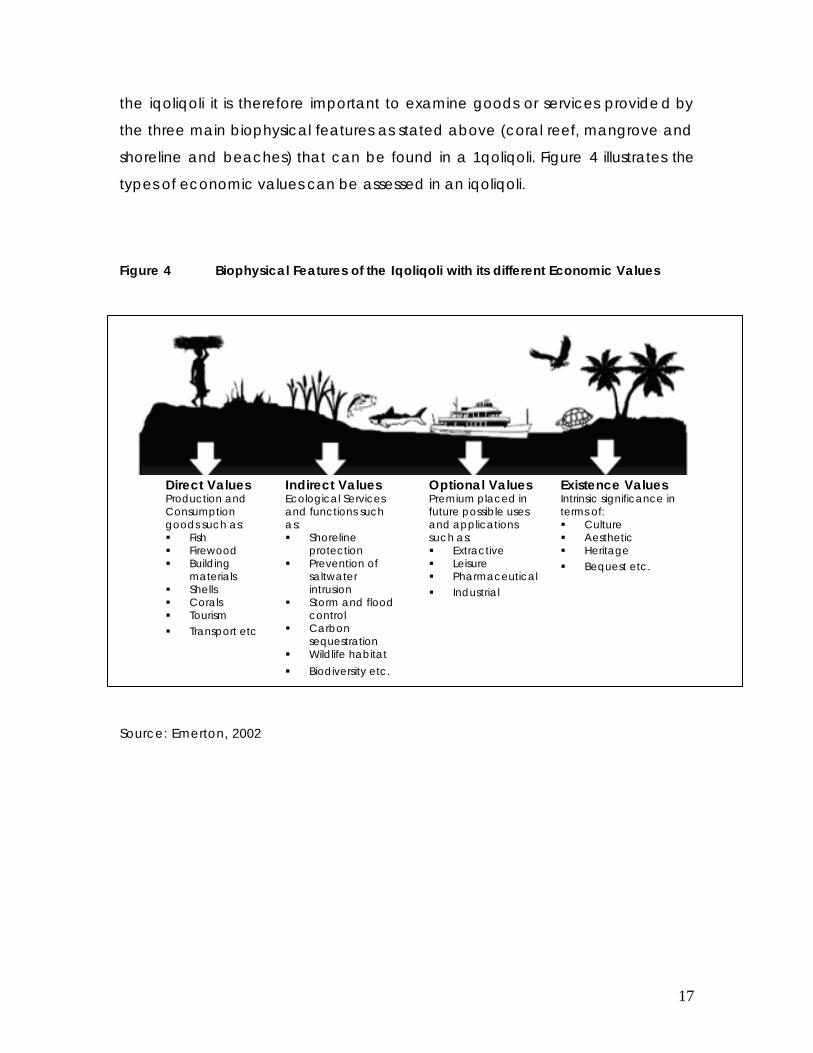
17
the iqoliqoli it is therefore important to examine goods or services provided by
the three main biophysical features as stated above (coral reef, mangrove and
shoreline and beaches) that can be found in a 1qoliqoli. Figure 4 illustrates the
types of economic values can be assessed in an iqoliqoli.
Figure 4 Biophysical Features of the Iqoliqoli with its different Economic Values
Source: Emerton, 2002
Direct Values Production and Consumption goods such as: § Fish § Firewood § Building
materials § Shells § Corals § Tourism § Transport etc
Indirect Values Ecological Services and functions such as: § Shoreline
protection § Prevention of
saltwater intrusion
§ Storm and flood control
§ Carbon sequestration
§ Wildlife habitat
§ Biodiversity etc.
Optional Values Premium placed in future possible uses and applications such as: § Extractive § Leisure § Pharmaceutical § Industrial
Existence Values Intrinsic significance in terms of: § Culture § Aesthetic § Heritage § Bequest etc.
18
3.1 Total Economic Value of Coral Reef
3.1.1 Coral Reef Use Values
3.1.1.1 Direct Use Value
For this study the main direct use values that had available data were fisheries,
recreational and tourism. Fisheries data were primarily financial market values
associated with harvesting fish from an area. In addition recreation and tourism
data were market values based on expenditures by tourist and visitors on the use
of the coastal and marine environment for recreational purposes.
3.1.1.1.i Fisheries
Because of the limited data available as well as time constraint the most
practical and logically means to elicit the monetary value of the direct use value
of the qoliqoli in terms of fisheries was to use of the marine biological survey
findings that were conducted by Coral Cay Conservation. They key areas that
were used for the monetary valuation were anthropocentric value of marine
resources. These were fin-fish and invertebrates. The fin-fish data were collected
by using belt transect methodology.1
The total number of fin-fish and invertebrates collected in the sub-sample of the
iqoliqoli was extrapolated to cover the total iqoliqoli hectares.
1 The belt transect methodology as applied by Coral Cay Conservation allows comparison of relative abundances across the region. The method is non-extractive and as such has no detrimental impact to fish populations in the area. Using the same 100 metre tape, four 5 metre wide by 20 metre long sections were surveyed (centred on the transect line) (Raines, P. et al. 2005). A 5-meter gap was left un-surveyed between sections to make each section a distinct statistical unit (Raines, P. et al. 2005). Absolute numbers of fish, target species, and families were recorded (Raines, P et al. 2005). A similar method was utilised for sampling invertebrate taxa (Raines, P. et al. 2005). Four 2 metres wide by 20 metres sections were surveyed (centred on the transect line) (Raines, P. et al. 2005). Again, a 5-metre gap was left un-surveyed between sections. The smaller survey area was a compromise to the increased time required to complete accurate invertebrate census per unit area (Raines, P. et al. 2005).
19
The value of saleable assets (i.e. fin-fish and invertebrates) was calculated by
multiplying the biomass of fin-fish and invertebrates in the iqoliqoli (assessed by
Coral Cay Conservation) by the market price. This aggregate amount is the
value if all consumptive marine resources are fished and sold thus there will be
literally none left. This in turn would mean that there will be no more economic
value of the iqoliqoli for the following year and in perpetuity. In other words
valuing the whole fin-fish and invertebrates stock would be incorrect. Hence
what is valued is the percentage of the total fin-fish stock and invertebrates (as
measured by Coral Cay) consumed or sold by local communities. However the
data for this is not available. For this reason the sustained biological yield of 3.4
tonnes of fisheries in a qoliqoli per Km2 per year based on Jennings and Polunin
1995 findings of six iqoliqoli in Fiji was applied to determine the economic value
of each of the iqoliqoli along the Coral Coast. They also reported that taking
more than 5 percent of the biomass in a given year lead to increased stress to
the ecosystem.“There are thus good reasons for adopting a quicker and more
simple valuation techniques using Maximum Sustainable Yields (MSYs) although
commonly sought MSYs are sensitive to assumptions. However, by multiplying
MSY by appropriate market or substitute prices this method can provide
adequate estimates this method can provide adequate estimates of reef
productivity values” (Spurgeon, 1992: 530).
Table 2 provides the result of the economic valuation of saleable assets (fish and
invertebrates) and their monetary values per area unit. The unit in this study is
squared kilometres. The key focus of this study is the Coral Coast iqoliqolis as
illustrated in Figure 5. The gross present value was calculated based on the
discount rate of 10% for a 99 years lease. The discount rate2 was based on the
2 There are two main reasons why discounting is used. First is to do with time preference. This basically means that individuals prefer to enjoy benefits sooner, and costs later, rather than the other way round. A cost or benefit of a given amount has a lower subjective value, the later it arises. This may be due to a myopia, an urgent need for gratification (e.g. because of poverty or greed), or the belief that future consumption will be greater (and therefore the marginal utility of a given unit of consumption will be less). These factors apply to private individuals. Governments, acting in a rational and enlightened way on behalf of their citizens, may also have social time preference, for example where they expect future incomes to be greater, where $1 now is worth more to society than the same in the future. Second, is to do with opportunity cost of capital. This is means that a sum of money is worth more now than the same amount in future because it can be employed productively, e.g. invested profitably, or lent for interest. In this case the discount rate is the inverse of the rate of
20
current lending and government bond rates. The municipal price for the various
saleable assets in the iqoliqoli that were assessed was based on the market price
from fishing outlets in Sigatoka, Nadi, Suva and Lautoka.
For each iqoliqoli, two calculations were performed, one assuming that 3.4 tonnes of
biomass can be harvested or extracted per Km2 per year and the other that 5 percent of
the total biomass can be extracted per year. The resulting figures will be give a range of
present value per year.
interest. Funds used on a project which generates a given return on some future date could have been used to generate returns immediately. A discount rate reminds us of this alternative use of funds. Discounting assists the rational allocation of capital between uses that have different temporal profiles. (Source: OECD. Economic Development Institute of the World Bank, 1995)
21
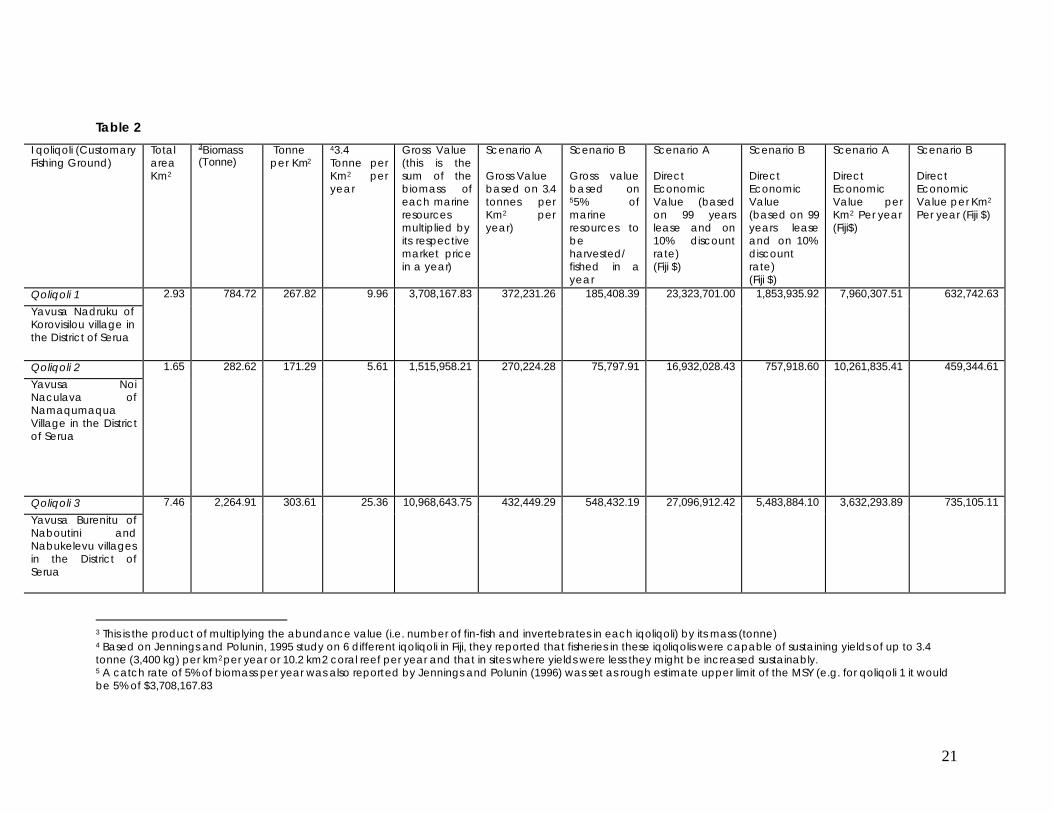
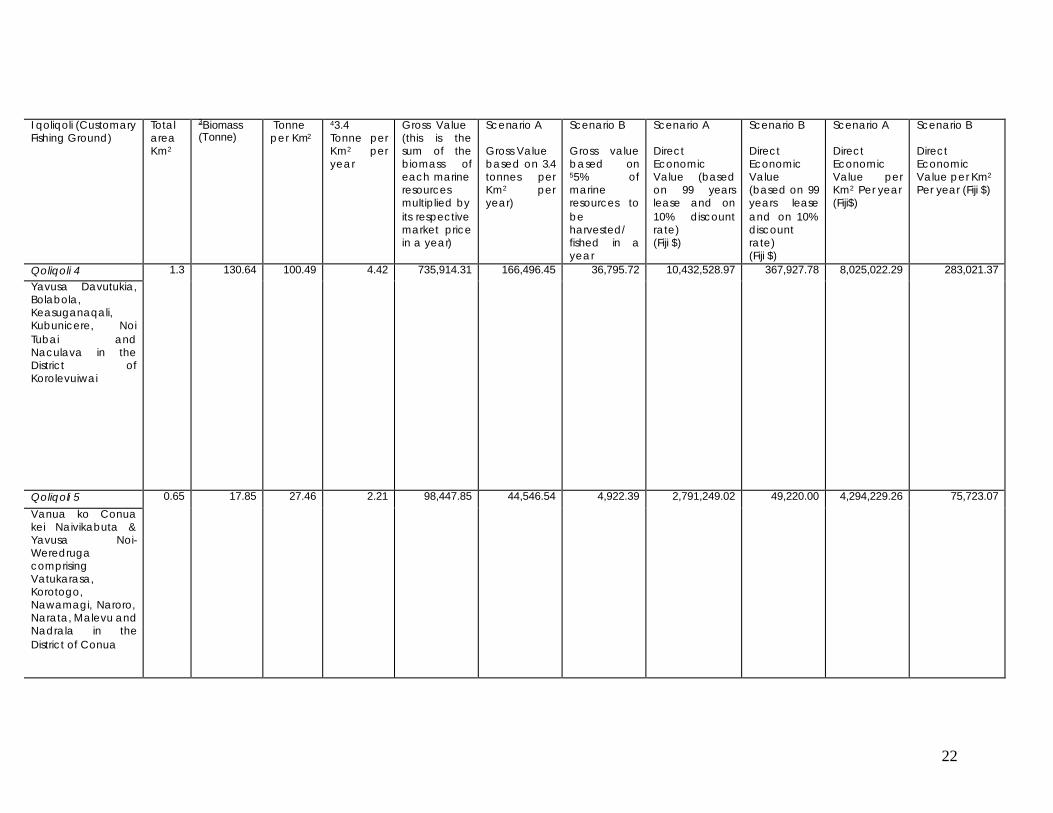
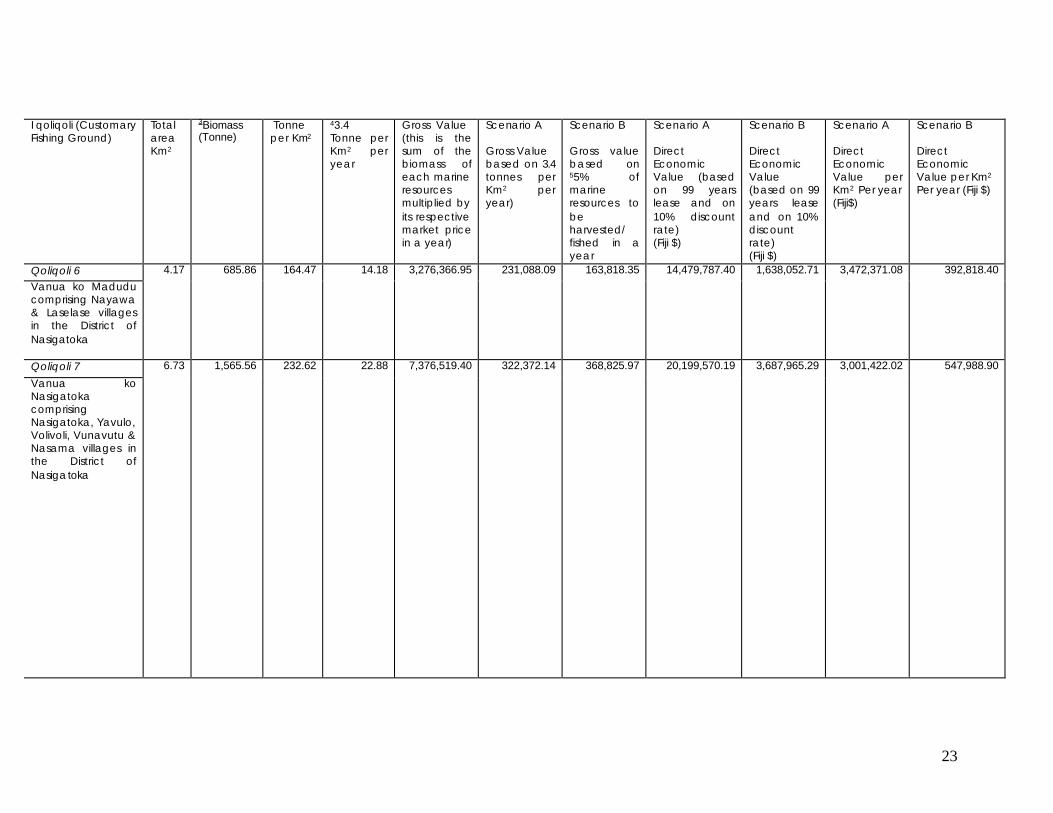
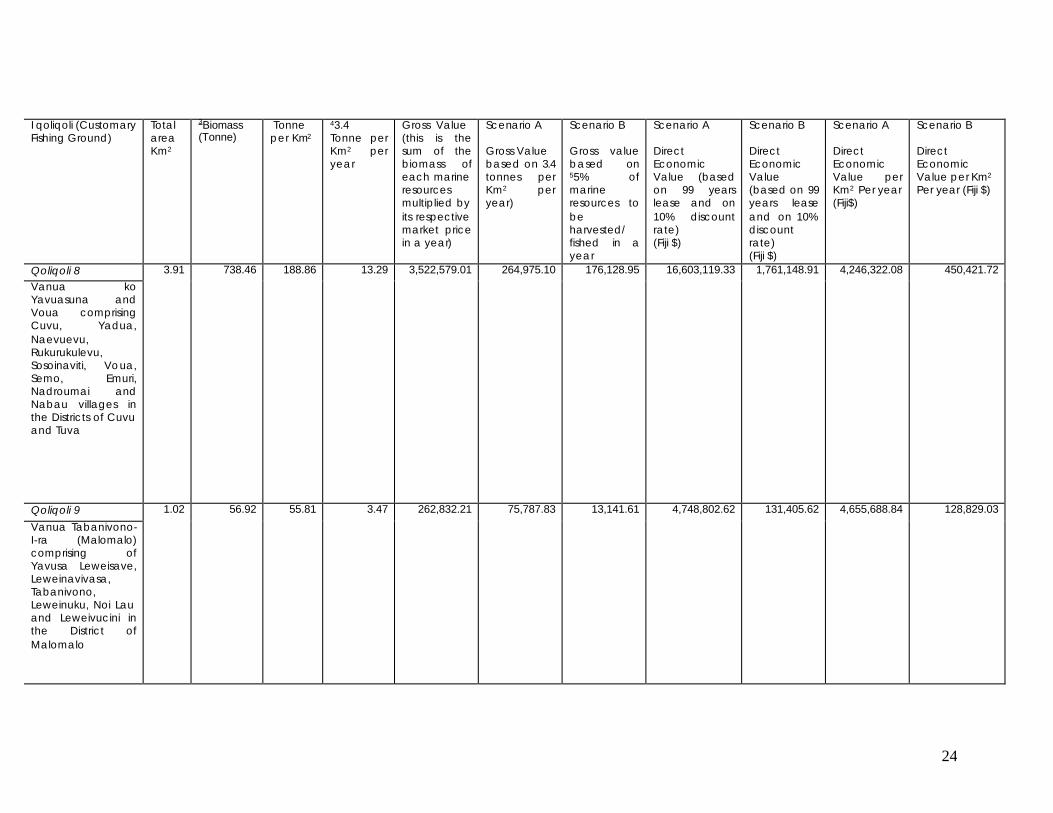
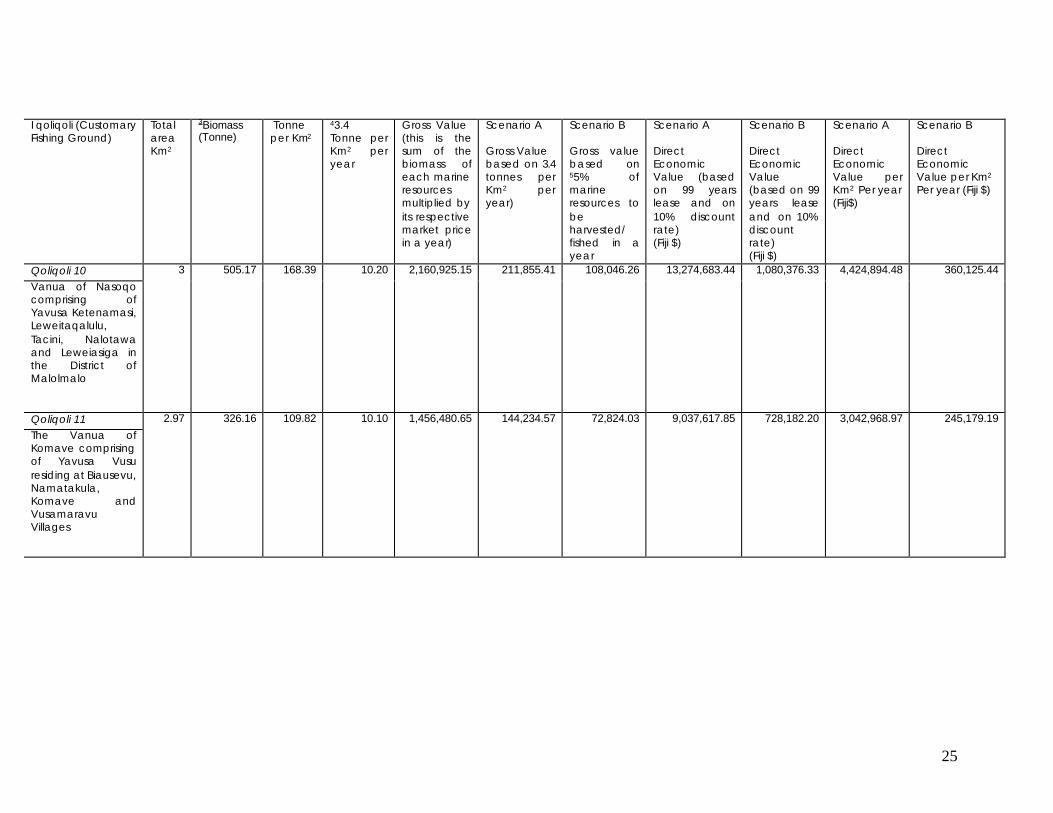
Table 2
I qoliqoli (Customary Fishing Ground)
Total area Km2
3Biomass (Tonne)
Tonne per Km2
43.4 Tonne per Km2 per year
Gross Value (this is the sum of the biomass of each marine resources multiplied by its respective market price in a year)
Scenario A Gross Value based on 3.4 tonnes per Km2 per year)
Scenario B Gross value based on 55% of marine resources to be harvested/ fished in a year
Scenario A Direct Economic Value (based on 99 years lease and on 10% discount rate) (Fiji $)
Scenario B Direct Economic Value (based on 99 years lease and on 10% discount rate) (Fiji $)
Scenario A Direct Economic Value per Km2 Per year (Fiji$)
Scenario B Direct Economic Value per Km2 Per year (Fiji $)
Qoliqoli 1
Yavusa Nadruku of Korovisilou village in the District of Serua
2.93 784.72 267.82 9.96 3,708,167.83 372,231.26 185,408.39 23,323,701.00 1,853,935.92 7,960,307.51 632,742.63
Qoliqoli 2
Yavusa Noi Naculava of Namaqumaqua Village in the District of Serua
1.65 282.62 171.29 5.61 1,515,958.21 270,224.28 75,797.91 16,932,028.43 757,918.60 10,261,835.41 459,344.61
Qoliqoli 3
Yavusa Burenitu of Naboutini and Nabukelevu villages in the District of Serua
7.46 2,264.91 303.61 25.36 10,968,643.75 432,449.29 548,432.19 27,096,912.42 5,483,884.10 3,632,293.89 735,105.11
3 This is the product of multiplying the abundance value (i.e. number of fin-fish and invertebrates in each iqoliqoli) by its mass (tonne) 4 Based on Jennings and Polunin, 1995 study on 6 different iqoliqoli in Fiji, they reported that fisheries in these iqoliqolis were capable of sustaining yields of up to 3.4 tonne (3,400 kg) per km2 per year or 10.2 km2 coral reef per year and that in sites where yields were less they might be increased sustainably. 5 A catch rate of 5% of biomass per year was also reported by Jennings and Polunin (1996) was set as rough estimate upper limit of the MSY (e.g. for qoliqoli 1 it would be 5% of $3,708,167.83
22
I qoliqoli (Customary Fishing Ground)
Total area Km2
3Biomass (Tonne)
Tonne per Km2
43.4 Tonne per Km2 per year
Gross Value (this is the sum of the biomass of each marine resources multiplied by its respective market price in a year)
Scenario A Gross Value based on 3.4 tonnes per Km2 per year)
Scenario B Gross value based on 55% of marine resources to be harvested/ fished in a year
Scenario A Direct Economic Value (based on 99 years lease and on 10% discount rate) (Fiji $)
Scenario B Direct Economic Value (based on 99 years lease and on 10% discount rate) (Fiji $)
Scenario A Direct Economic Value per Km2 Per year (Fiji$)
Scenario B Direct Economic Value per Km2 Per year (Fiji $)
Qoliqoli 4 Yavusa Davutukia, Bolabola, Keasuganaqali, Kubunicere, Noi Tubai and Naculava in the District of Korolevuiwai
1.3 130.64 100.49 4.42 735,914.31 166,496.45 36,795.72 10,432,528.97 367,927.78 8,025,022.29 283,021.37
Qoliqoli 5
Vanua ko Conua kei Naivikabuta & Yavusa Noi-Weredruga comprising Vatukarasa, Korotogo, Nawamagi, Naroro, Narata, Malevu and Nadrala in the District of Conua
0.65 17.85 27.46 2.21 98,447.85 44,546.54 4,922.39 2,791,249.02 49,220.00 4,294,229.26 75,723.07
23
I qoliqoli (Customary Fishing Ground)
Total area Km2
3Biomass (Tonne)
Tonne per Km2
43.4 Tonne per Km2 per year
Gross Value (this is the sum of the biomass of each marine resources multiplied by its respective market price in a year)
Scenario A Gross Value based on 3.4 tonnes per Km2 per year)
Scenario B Gross value based on 55% of marine resources to be harvested/ fished in a year
Scenario A Direct Economic Value (based on 99 years lease and on 10% discount rate) (Fiji $)
Scenario B Direct Economic Value (based on 99 years lease and on 10% discount rate) (Fiji $)
Scenario A Direct Economic Value per Km2 Per year (Fiji$)
Scenario B Direct Economic Value per Km2 Per year (Fiji $)
Qoliqoli 6 Vanua ko Madudu comprising Nayawa & Laselase villages in the District of Nasigatoka
4.17 685.86 164.47 14.18 3,276,366.95 231,088.09 163,818.35 14,479,787.40 1,638,052.71 3,472,371.08 392,818.40
Qoliqoli 7
Vanua ko Nasigatoka comprising Nasigatoka, Yavulo, Volivoli, Vunavutu & Nasama villages in the District of Nasigatoka
6.73 1,565.56 232.62 22.88 7,376,519.40 322,372.14 368,825.97 20,199,570.19 3,687,965.29 3,001,422.02 547,988.90
24
I qoliqoli (Customary Fishing Ground)
Total area Km2
3Biomass (Tonne)
Tonne per Km2
43.4 Tonne per Km2 per year
Gross Value (this is the sum of the biomass of each marine resources multiplied by its respective market price in a year)
Scenario A Gross Value based on 3.4 tonnes per Km2 per year)
Scenario B Gross value based on 55% of marine resources to be harvested/ fished in a year
Scenario A Direct Economic Value (based on 99 years lease and on 10% discount rate) (Fiji $)
Scenario B Direct Economic Value (based on 99 years lease and on 10% discount rate) (Fiji $)
Scenario A Direct Economic Value per Km2 Per year (Fiji$)
Scenario B Direct Economic Value per Km2 Per year (Fiji $)
Qoliqoli 8 Vanua ko Yavuasuna and Voua comprising Cuvu, Yadua, Naevuevu, Rukurukulevu, Sosoinaviti, Voua, Semo, Emuri, Nadroumai and Nabau villages in the Districts of Cuvu and Tuva
3.91 738.46 188.86 13.29 3,522,579.01 264,975.10 176,128.95 16,603,119.33 1,761,148.91 4,246,322.08 450,421.72
Qoliqoli 9
Vanua Tabanivono-I-ra (Malomalo) comprising of Yavusa Leweisave, Leweinavivasa, Tabanivono, Leweinuku, Noi Lau and Leweivucini in the District of Malomalo
1.02 56.92 55.81 3.47 262,832.21 75,787.83 13,141.61 4,748,802.62 131,405.62 4,655,688.84 128,829.03
25
I qoliqoli (Customary Fishing Ground)
Total area Km2
3Biomass (Tonne)
Tonne per Km2
43.4 Tonne per Km2 per year
Gross Value (this is the sum of the biomass of each marine resources multiplied by its respective market price in a year)
Scenario A Gross Value based on 3.4 tonnes per Km2 per year)
Scenario B Gross value based on 55% of marine resources to be harvested/ fished in a year
Scenario A Direct Economic Value (based on 99 years lease and on 10% discount rate) (Fiji $)
Scenario B Direct Economic Value (based on 99 years lease and on 10% discount rate) (Fiji $)
Scenario A Direct Economic Value per Km2 Per year (Fiji$)
Scenario B Direct Economic Value per Km2 Per year (Fiji $)
Qoliqoli 10 Vanua of Nasoqo comprising of Yavusa Ketenamasi, Leweitaqalulu, Tacini, Nalotawa and Leweiasiga in the District of Malolmalo
3 505.17 168.39 10.20 2,160,925.15 211,855.41 108,046.26 13,274,683.44 1,080,376.33 4,424,894.48 360,125.44
Qoliqoli 11 The Vanua of Komave comprising of Yavusa Vusu residing at Biausevu, Namatakula, Komave and Vusamaravu Villages
2.97 326.16 109.82 10.10 1,456,480.65 144,234.57 72,824.03 9,037,617.85 728,182.20 3,042,968.97 245,179.19
26
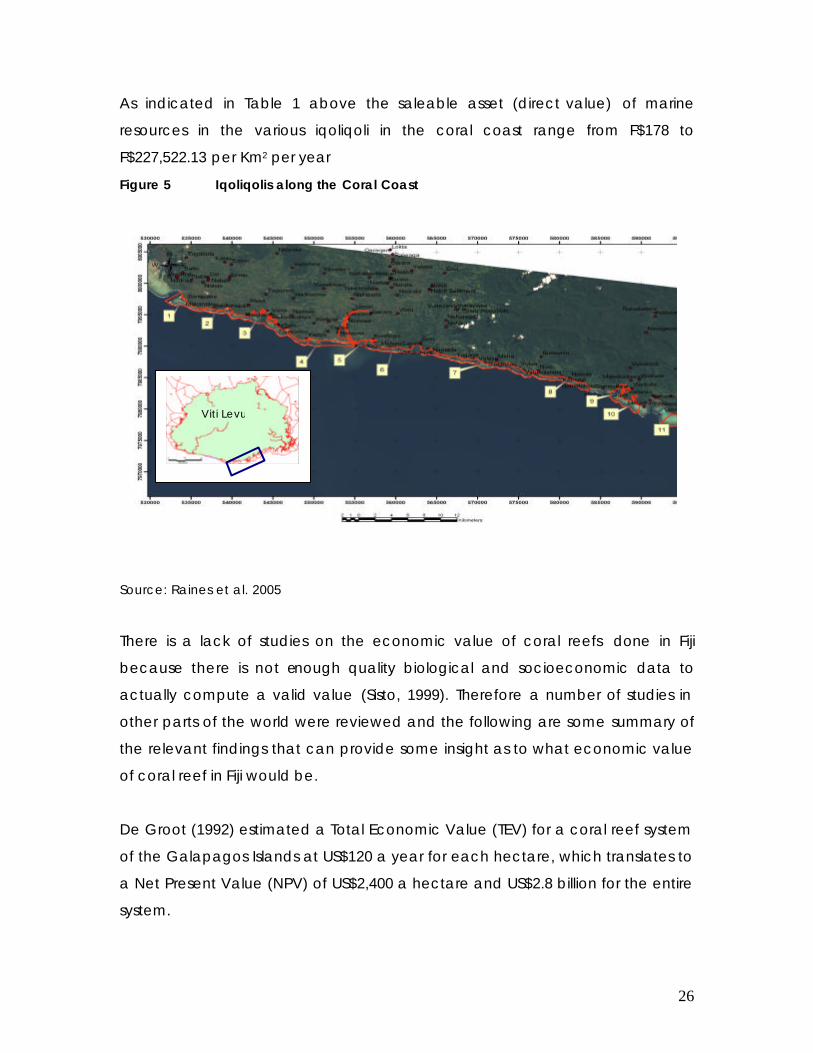
As indicated in Table 1 above the saleable asset (direct value) of marine
resources in the various iqoliqoli in the coral coast range from F$178 to
F$227,522.13 per Km2 per year
Figure 5 Iqoliqolis along the Coral Coast
Source: Raines et al. 2005
There is a lack of studies on the economic value of coral reefs done in Fiji
because there is not enough quality biological and socioeconomic data to
actually compute a valid value (Sisto, 1999). Therefore a number of studies in
other parts of the world were reviewed and the following are some summary of
the relevant findings that can provide some insight as to what economic value
of coral reef in Fiji would be.
De Groot (1992) estimated a Total Economic Value (TEV) for a coral reef system
of the Galapagos Islands at US$120 a year for each hectare, which translates to
a Net Present Value (NPV) of US$2,400 a hectare and US$2.8 billion for the entire
system.
Viti Levu
27
Gustavson (1998) estimated the Net Present Value (NPV) of tourism, fishing and
coastal protection of Montego Bay, Jamaica at US$273 million to $US702 million.
The area of the Marine Park is 1,530 hectares, implying a value of US$397,000 to
US$1,020,000 for each hectare of protected area. For Indonesian coral reefs,
Cesar (1996) estimated a NPV for fishing, tourism and coastal protection of
US$1,373 to US$11,619 a hectare.
Costanza et al. (1998) made an estimate of TEVs for all the earth’s ecosystems,
based on considerable extrapolation from published studies, and these
estimates need to be treated with caution. For coral reefs, Costanza et al.
estimated a value of US$6,076 each year for each hectare.
The value of Florida Keys National Marine Sanctuary was valued in 1990 at
US$50,000 a hectare NPV and at US$44.6 billion NPV in total (NOAA 1995).
Davis (2001) undertook an economic analysis of the Solitary Islands Marine Park in
New South Wales and concluded that the park produced annual net benefits of
A$5,746,700.
3.1.1.1.ii Commercial Tourism
A study of the Virgin Islands National Park in 1981, conducted by Posner,
Cuthbertson et al, examined the direct economic costs and benefits associated
with tourism and recreational use of the Virgin Islands National Park. Total costs of
US$2.1 million, were offset by US$23.3 million a year (US$3.3 million direct benefits
and US$20 million indirect benefits).
Gustavson (1998) has estimated the NPV of the value of recreation and tourism
for Montego Bay coral reefs. The NPV was found to be US$315 million a year,
based on 1996 data. This study included accommodation, food and beverage,
entertainment, transportation, retail and miscellaneous services. Unlike other
studies, the value of US$315 million is a net value, and, therefore, takes account
28
of the costs of providing recreational goods and services, as well as direct
expenditure. The total coral reef area within Montego Bay is estimated to be
42.65 hectares. Recreation and tourism are, therefore, worth approximately
US$7.4 million a hectare of coral reef.
It is also possible to separate out the value of different components of tourism
and recreation. For example, Dixon et al. (1992) estimated the value of dive-
based tourism in the Bonaire Marine Park, located in the Caribbean Sea. This
study found that gross revenue generated in 1991 was US$23.2 million, comprising
expenditure on hotels, dive operations, air transport on the local airline and other
purchases. This study also explored relationships between coral cover, species
density and stress on sites used for diving to identify a function of damage versus
diver numbers.
3.1.1.1.iii Recreation
Recreation values are often included with tourism values, although this may lead
to an underestimate of recreation values of local communities.
The non-market valuation techniques called travel cost method was applied to
estimate the value of recreation in the Great Barrier Reef. The net economic
value for domestic and international tourists visiting the reef region was A$144
million a year, with net economic value for Australian visitors A$117.5 million, and
for international visitors A$26.7 million. This figure includes all visitors to the reef
region. It is worth noting that the net economic value for only those visitors that
intended to see, or had seen, coral sites, was A$106 million a year.
The value of recreational services provided by Fiji coral reefs, lagoons and
beaches, may be assessed on the basis of expenses undertaken by users. In
1994, visitors to Fiji brought in F$420 million in foreign exchange earnings
(Lockhart, l998). How much of this should be attributed to the recreational
29
services provided by coral reefs, lagoons and beaches depend partly on the
motives bringing visitors to Fiji (Sisto, 1999).
Visitors coming to Fiji to visit family and friends, to attend school or undergo
training cannot be said to be attracted to Fiji primarily because of the
recreational opportunities provided by coral reefs, lagoons and beaches,
although they might be enjoying those services incidentally (Sisto, 1999). Business
travellers and conference participants, similarly, do not come to Fiji see to enjoy
beach and water-based activities, although they might do so incidentally. It
could, however, be argued that Fiji’s pleasant environment is a reason why
conferences are organised here in the first place. To be conservative, however,
attention in this valuation exercise is restricted to holiday-makers who constituted
84 percent (Ministry of Tourism, Culture, Heritage and Civil Aviation, 2003) of the
total number of visitors.
Data are available for visitor surveys on what percentage of visitors use coral
reefs for various recreational activities. What is difficult to determine is what
percent of visitor expenditure (in terms of days stayed or choosing to visit Fiji at
all) is due to the availability of these activities. Based on Tourism data from the
year 2003, the upper bound which include swimmers (64.8%), reef walkers (3.5%)
and fishers (1.8%) comes to 70.1 percent in a given year. On the lower bound,
assuming half of the scuba divers come specifically for this activity plus a small
percentage of others might come to 615.5percent.
Hence the estimated economic value of tourist recreation would be the range
between the lower and upper bounds. This would be 15.5% x 84% x $569million
which is about F$74.08million annually or $171.20 per person per year and 70.1% x
84% x $569 which amounts to F$335.05 million annually or F$774.74 per visitor per
year (per person for both recreation values are based on the total arrivals in 2003
of 430,800).
6 This is assuming that some or even all reef walkers are also scuba divers
30
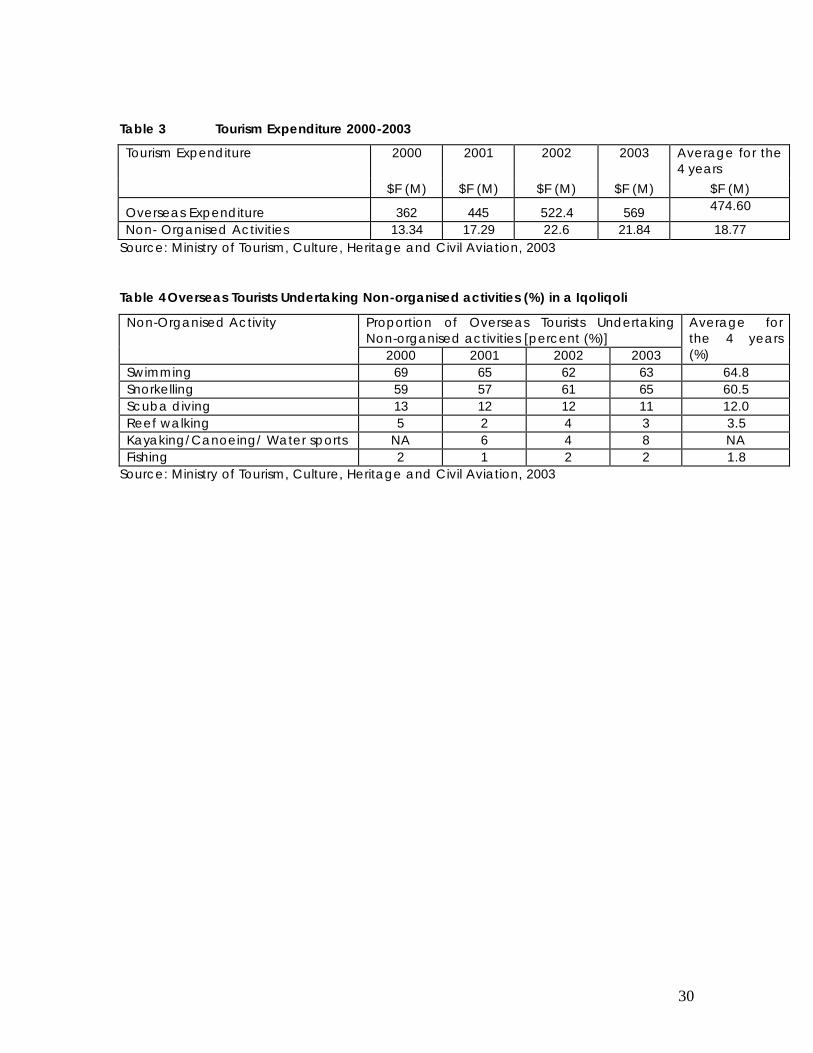
Table 3 Tourism Expenditure 2000-2003
2000 2001 2002 2003 Average for the 4 years
Tourism Expenditure
$F (M) $F (M) $F (M) $F (M) $F (M)
Overseas Expenditure 362 445 522.4 569 474.60
Non- Organised Activities 13.34 17.29 22.6 21.84 18.77 Source: Ministry of Tourism, Culture, Heritage and Civil Aviation, 2003
Table 4 Overseas Tourists Undertaking Non-organised activities (%) in a Iqoliqoli
Proportion of Overseas Tourists Undertaking Non-organised activities [percent (%)]
Non-Organised Activity
2000 2001 2002 2003
Average for the 4 years (%)
Swimming 69 65 62 63 64.8 Snorkelling 59 57 61 65 60.5 Scuba diving 13 12 12 11 12.0 Reef walking 5 2 4 3 3.5 Kayaking/Canoeing/ Water sports NA 6 4 8 NA Fishing 2 1 2 2 1.8
Source: Ministry of Tourism, Culture, Heritage and Civil Aviation, 2003
31
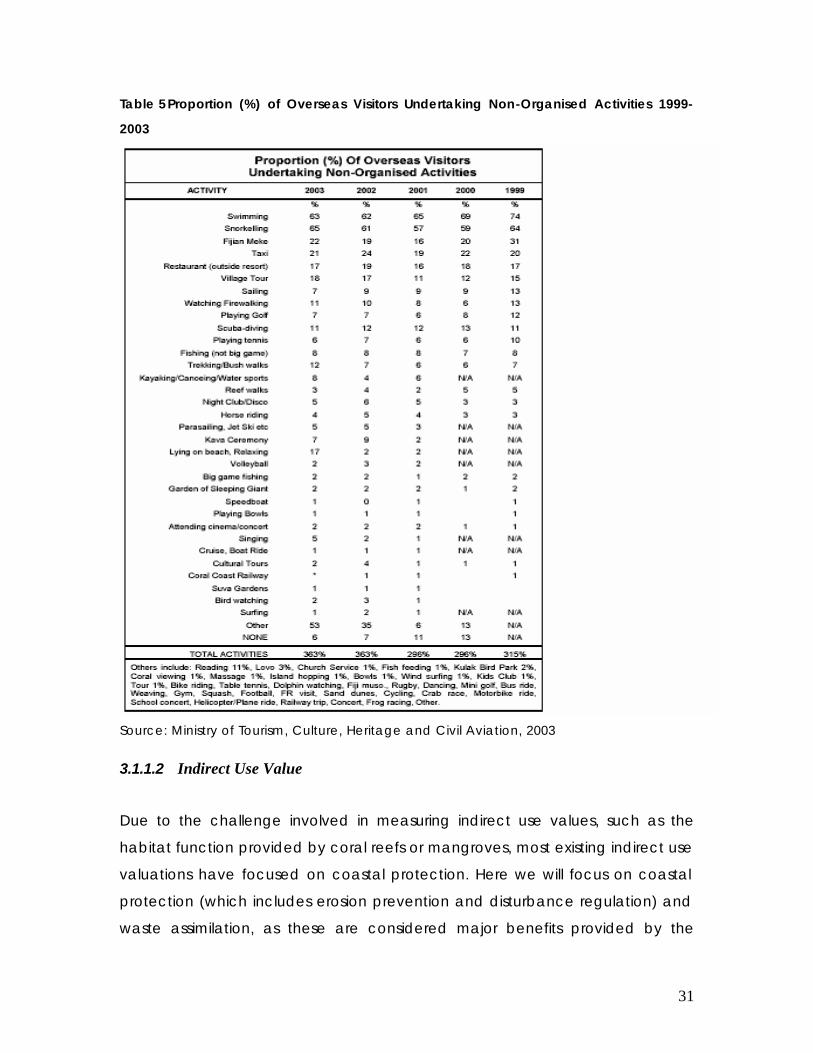
Table 5 Proportion (%) of Overseas Visitors Undertaking Non-Organised Activities 1999-
2003
Source: Ministry of Tourism, Culture, Heritage and Civil Aviation, 2003
3.1.1.2 Indirect Use Value
Due to the challenge involved in measuring indirect use values, such as the
habitat function provided by coral reefs or mangroves, most existing indirect use
valuations have focused on coastal protection. Here we will focus on coastal
protection (which includes erosion prevention and disturbance regulation) and
waste assimilation, as these are considered major benefits provided by the
32
marine ecosystems in Fiji. Other important indirect use values, such as habitat
and biological control, will be assessed in terms of impacts on fisheries.
Coral reefs provide protection to shorelines and human settlements from floods,
storms and erosion. The economic value of this protection can be estimated
either by valuing the cost of damage to land and homes, when the ecosystem is
removed (damage cost approach), or valuing the cost of replacing the coral
reef with protective infrastructure (replacement cost approach), or valuing the
cost of averting damage to land and homes (avertive expenditure approach).
The coastal protection function of coral reefs was estimated at US$275,000 per
km of shoreline per year (in 1994). According to Sisto (1999) coastal protection
services of coral reefs were assessed by Costanza and co-authors (1997) at
US$2,750 per ha per year. Zann and co-authors (1998) put the number of coral
reefs in Fiji at 1,000, but provide no measure of their surface area, so the value
presented by Costanza cannot be used directly.
3.1.2 Coral reefs Non-Use Values
3.1.2.1 Option values
Option values are not considered relevant to this study, as they typically apply to
unique ecosystems (e.g. those with endemic species, or those containing the last
remaining numbers of a particular species) which are in danger of being
completely destroyed. This does not apply to Fiji, which has low endemism, and is
not under threat of having all it’s ecosystems of one type being destroyed.
33
3.1.2.2 Existence values
These refer to the value associated with the actual existence of an asset (e.g.
ecosystem, cultural heritage) independent of one’s use of the asset. For this
reason, existence values are considered “non-use values”. Valuation of
existence values is a highly contested topic in environmental and resource
economics, and benefit transfer exercises are not recommended at present
(Adger et al, 2002). Furthermore, most existence valuation studies have been
carried out in the US or other developed countries, and it is not considered viable
to transfer such values to countries such as Fiji. In a summary of these developed-
country values, Pearce (1993) indicates that non-use values for wild species
range from US$12 to US$64 per person per year, and for wilderness areas range
from US$9 to US$107 per person per year. Studies of existence values of marine
resources are scant: Spash et al (2000) used the contingent valuation method to
estimate non-use values associated with marine parks in Jamaica and Curacao,
and found non-use values to come to US$2.08/yr per person (Curacao) and
US$3.24/yr per person in Jamaica.
Constanza et al (1997) estimate an overall non-use value, which they term
“cultural value” for coral reefs, which comes to a tiny US$100/km/yr (in 1994 US$).
They provide no such value for mangroves. It is considered that this value is only
indicative of the lack of studies undertaken in this area, and does not reflect the
true non-use value associated with marine resources worldwide. It is not
considered appropriate to use this value to obtain estimates for Fiji.
3.1.2.3 Bequest values
Bequest values represent the value attached to preserving an ecosystem for use
by future generations, independent of one’s own use of the ecosystem. These
are considered of particular relevance in Fiji, given the importance that people
attach to their way of life (Turner, 2000). The pilot study for the Navakavu
34
Valuation Project, coordinated by Tanya O’ Garra, confirmed that bequest
values were indeed very significant drivers of local preferences associated with
protection of iqoliqoli ecosystems. For this reason, these must be considered an
important value associated with iqoliqolis in Fiji.
There have been few studies to value bequest value. Hargreaves-Allen (2004)
estimated the bequest value associated with coral reefs in the Wakatobi Marine
Park in Sulawesi, using a CV survey. The bequest value was estimated at Rp
412,000 per km2 or approximately US$412 per km2 or US$4 per hectare (Present
Value of Rp91 million or approximately US$91,000), a fifth of that associated with
all the reef’s benefits. More recent studies include: Ruijgrok (2006) and Togridou
et al (2006). These have yet to be reviewed.
Valuation of bequest values would require a full contingent valuation survey. This
involves a questionnaire in which respondents are asked for their ‘willingness to
pay’ for a hypothetical scenario, in this case: the protection of their iqoliqoli for
future generations (independent of one’s own use of the iqoliqoli). Such a study
is being carried out at present as part of the Tanya O’ Garra’s Navakavu
Valuation study; however results are not yet available.
As noted previously, this valuation is only relevant for this project, if the iqoliqoli
were to be destroyed, or if the lease were to have no expiry date. In this case,
future generations would not be able to benefit from the iqoliqoli, and these
losses would need to be taken into account. Otherwise, future generations will
still be able to benefit from the iqoliqoli, and valuation of bequest values would
be irrelevant.
35
3.2 Total Economic Value of Mangrove
3.2.1 Mangrove Use Values
3.2.1.1 Direct Use Value
For mangrove systems in Bintuni Bay, Indonesia, Ruitenbeek (1992) estimated a
value of US$4800 a hectare and a total of US$961 to US$1,495 million for the
entire system (quoted in Cartier & Ruitenbeek 1999). Only 15 percent to 35
percent of this amount is direct use value, so the majority of value is not usually
identified as market values.
3.2.1.2 Indirect Use Value
Mangroves and coastal littoral vegetation provide protection to agricultural land
and human settlements from floods, storms and erosion. The economic value of
this protection can be estimated either by:
• valuing the cost of damage to land and homes, when the ecosystem is
removed (damage cost approach); or
• valuing the cost of replacing the mangrove with protective infrastructure
(replacement cost approach); or
• valuing the cost of averting damage to land and homes (avertive
expenditure approach).
The coastal protection function mangroves were estimated at US$170,100 per km
of shoreline per yr (in 1994 US$).
Mangroves and sea-grass beds have a waste assimilation function. They
effectively process inadequately treated sewage and other waste, by absorbing
excess nutrients, before this enters the sea (and affects fisheries and health).

36
Valuation of this function would be carried out using the replacement cost
approach, by which the value of the mangrove and sea-grass bed waste
assimilation function would be estimated as the value of the waste treatment
system needed to replace it. Constanza et al. (1997) place the value of waste
treatment function of mangroves at US$66,960/km /yr (in 1994 US$).
Given the short timescale for this project, a proper valuation will not be possible
and values provided in Constanza et al (1997) will provide the most acceptable
approximation. However, as noted with the coastal protection function, this
valuation is only appropriate if there is to be any mangrove clearance.
Otherwise, this function will continue to provide benefits to local communities.
3.2.2 Mangrove Non-Use Value
For this particular study non-use value of mangroves cannot be incorporated to
the overall assessment of TEV. This is because first, there are very few studies
conducted in most parts of the world specifically on the non-use values of
mangroves. Hence, there was the data available was not adequate.
Mangrove option values are not considered relevant to this study, as they
typically apply to unique ecosystems (e.g. those with endemic species, or those
containing the last remaining numbers of a particular species) which are in
danger of being completely destroyed. This does not apply to Fiji, which has low
endemism, and is not under threat of having all it’s ecosystems of one type
being destroyed.
On the whole therefore, in terms of the TEV of mangrove the following are some
key findings. An earlier study of mangroves in India estimated a TEV of over
US$11,000 a hectare (Dixon 1989). Similar estimates of $US15,000, US$11,000 and
US$13,000 a hectare were made for mangrove systems in Trinidad, Fiji and Puerto
37
Rico respectively, but these estimates may only include direct uses of fishing,
forestry and tourism (Hamilton and Snedaker eds. quoted in Brown et al. 1993).
Padma Lal (1989) in her study on mangrove compensation in Fiji reported the
economic value for compensating reclamation of mangroves in Fiji were as
follows: for the Central Division is F$2,939 per hectare; F$217 per hectare in
Western Division; and F$209 per hectare in the Northern division. This economic
value was solely based on use values and non-use values were not accounted
for. Hence it is thus important to note that this the main difference of the
economic values reported by Padma and Brown et, al.
3.3 Total Economic Value of Beaches and Coastal Areas
Compared to the number of studies valuing the direct uses of coral reefs and
mangroves (e.g. fisheries and tourism), there are very few studies valuing the
coastal protection function of marine and coastal ecosystems, and most of
these value the protective function of coral reefs in particular (see McKenzie et
al, 2005; Gustavson, 2000; Cesar, 1996).
Constanza et al. (1997), estimates of the economic value of the world’s
ecosystems were assessed using a benefit transfer approach (for more
information on benefits transfer see Bateman et al, 2002).
The mangrove and coral reef stated above were values used in Sisto (1998) to
obtain estimates of the value of coastal protection provided by coral and
mangroves in Fiji specifically. These values, however, should only be considered
broadly indicative, as they were obtained by aggregating values from across
the world. The coastal protection function of coral reefs and mangroves in Fiji
would ideally be carried out as an independent exercise, using any of the
valuation approaches outlines above, and the Constanza et al (1997) values
simply used for comparison and validation. At present, there is a large-scale
project at SOPAC (under Paula Holland) which is seeking to value the coastal
38
protection function of marine ecosystems around the Pacific. This study would be
a valid source of economic values.
In this particular study, economic valuation of the coastal protection functions
will only be relevant in those cases where this function is threatened. This would
only occur if the coral reef and/ or mangrove were to be destroyed. It is
considered that destruction of the coral reef is highly unlikely (unless coral mining
is to take place); however, the coastal protection function would be seriously
compromised if mangrove clearance were to take place. In this case, valuation
of this function would be warranted.
It was not possible within 2-month timescale to conduct a proper economic
valuation for this study. If more funding is provided, a Fiji-specific study could be
performed using estimates of the extent of coastal erosion in areas where there
has been mangrove clearance, and value the land lost (using land lease prices).
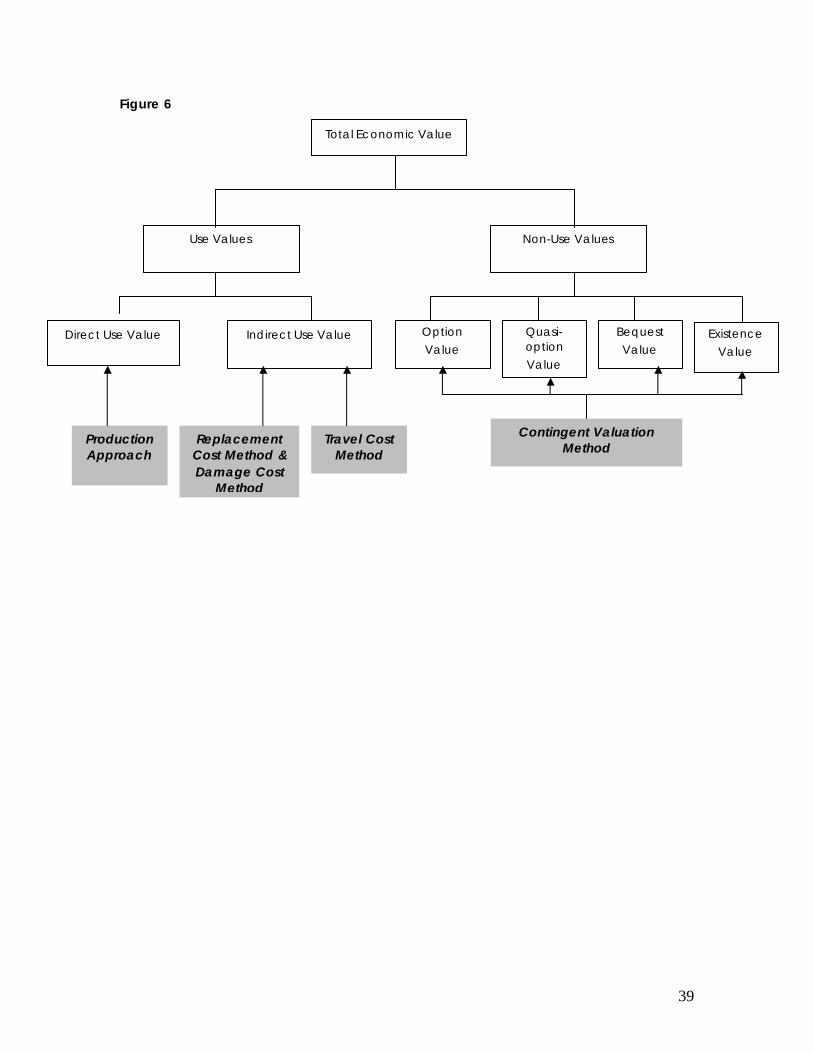
3.4 Summary of Key Economic Valuation Methods Applied to Quantify TEV
In the coral reef and mangrove valuation literature reviewed above, these are
the most frequently used methods.
§ Production Approach - this based on observable changes in the market
and market transactions.
§ Travel Cost Method (TCM) – this is based on economic interpretations of
behaviour; relating to travel and tourism. Real and hypothetical markets.
§ Replacement Cost Method (RC) – this is the cost of replacing an
ecosystem function if when system is unable to provide it (e.g. coastal
protection);
§ Damage Cost Method; and
§ Contingent Valuation Method (CVM) this is based on hypothetical
markets, can be used for use and non-use value or the expressions of
value.
39
Figure 6
Bequest Value
Option Value
Non-Use Values Use Values
Quasi-option Value
Indirect Use Value Direct Use Value Existence Value
Total Economic Value
Production Approach
Replacement Cost Method & Damage Cost
Method
Travel Cost Method
Contingent Valuation Method
40
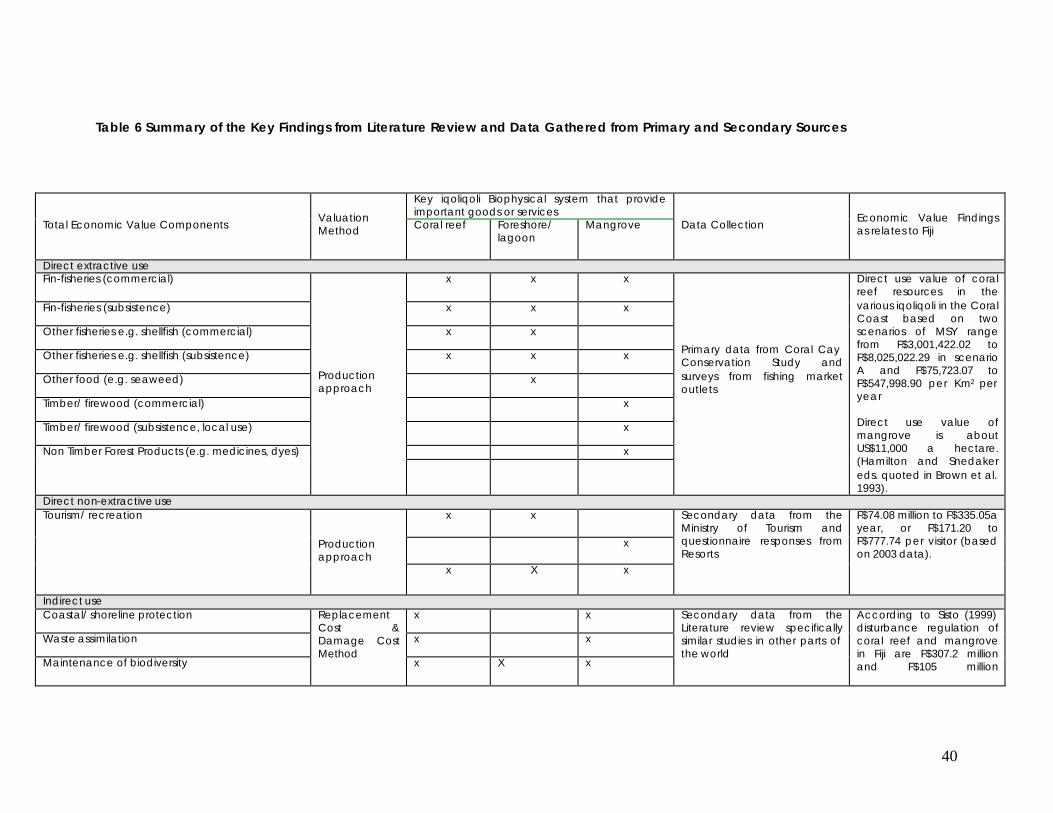
Table 6 Summary of the Key Findings from Literature Review and Data Gathered from Primary and Secondary Sources
Key iqoliqoli Biophysical system that provide important goods or services
Total Economic Value Components Valuation Method Coral reef Foreshore/
lagoon
Mangrove Data Collection Economic Value Findings as relates to Fiji
Direct extractive use Fin-fisheries (commercial) x x x
Fin-fisheries (subsistence) x x x
Other fisheries e.g. shellfish (commercial) x x
Other fisheries e.g. shellfish (subsistence) x x x
Other food (e.g. seaweed) x
Timber/ firewood (commercial) x
Timber/ firewood (subsistence, local use) x
x Non Timber Forest Products (e.g. medicines, dyes)
Production approach
Primary data from Coral Cay Conservation Study and surveys from fishing market outlets
Direct use value of coral reef resources in the various iqoliqoli in the Coral Coast based on two scenarios of MSY range from F$3,001,422.02 to F$8,025,022.29 in scenario A and F$75,723.07 to F$547,998.90 per Km2 per year Direct use value of mangrove is about US$11,000 a hectare. (Hamilton and Snedaker eds. quoted in Brown et al. 1993).
Direct non-extractive use x x
x
Tourism/ recreation
Production approach
x X x
Secondary data from the Ministry of Tourism and questionnaire responses from Resorts
F$74.08 million to F$335.05a year, or F$171.20 to F$777.74 per visitor (based on 2003 data).
Indirect use Coastal/ shoreline protection x x
Waste assimilation x x
Maintenance of biodiversity
Replacement Cost & Damage Cost Method
x X x
Secondary data from the Literature review specifically similar studies in other parts of the world
According to Sisto (1999) disturbance regulation of coral reef and mangrove in Fiji are F$307.2 million and F$105 million
41
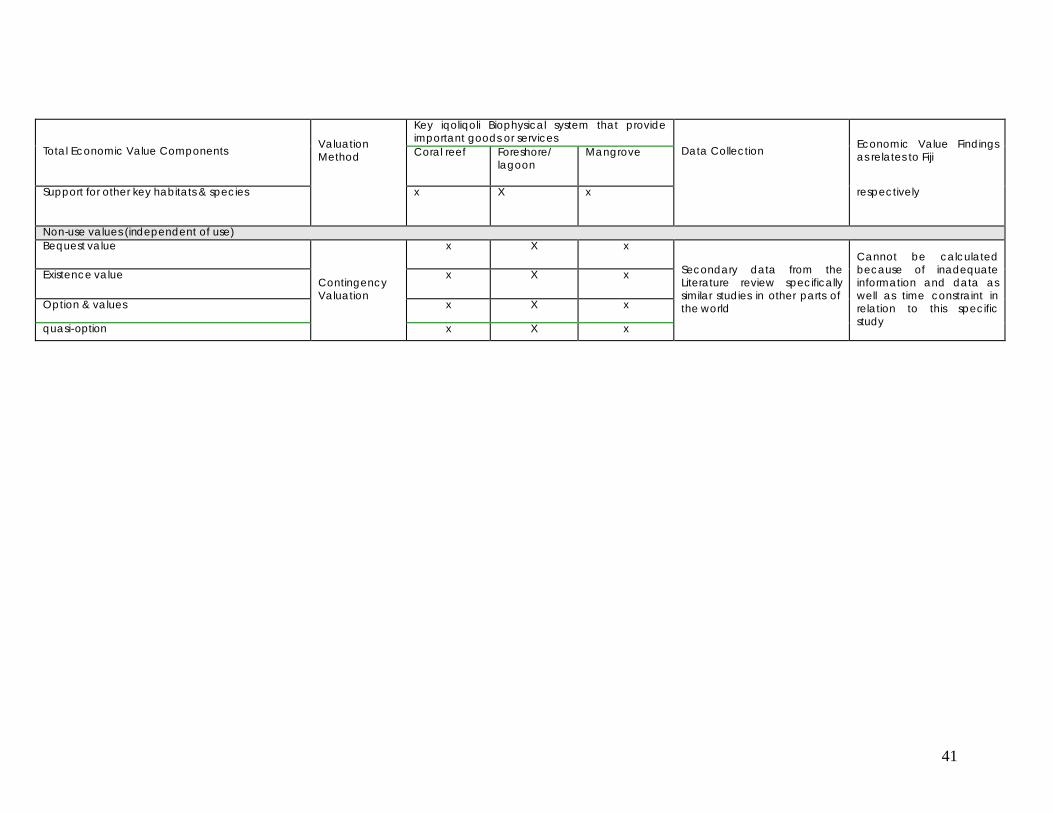
Key iqoliqoli Biophysical system that provide important goods or services
Total Economic Value Components Valuation Method Coral reef Foreshore/
lagoon
Mangrove Data Collection Economic Value Findings as relates to Fiji
Support for other key habitats & species x X x
respectively
Non-use values (independent of use) Bequest value x X x
Existence value x X x
Option & values x X x
quasi-option
Contingency Valuation
x X x
Secondary data from the Literature review specifically similar studies in other parts of the world
Cannot be calculated because of inadequate information and data as well as time constraint in relation to this specific study
4 Discussion and Conclusion
The eleven iqoliqoli along the Coral Coast indicate saleable assets (fish and
invertebrates) or its direct use value based on two scenarios of MSY ranged from
F$3,001,422.02 to F$8,025,022.29 in scenario A (or F$30,014.22 to F$80,250.02 per
hectare per year) and F$75,723.07 to F$547,998.90 per Km2 per year in scenario B
(or F$757.23 to F$5,480 per hectare per year).
The coral reef system as reported by various studies elsewhere has a saleable
and economic value which include tangible and intangible between the range
of US$1,373 per hectare to US$1.02 million per hectare. As indicated in saleable
assets of vertebrates and invertebrates along the Coral Coast the saleable value
of coral reef system will be determined on the quality of health of reef system
and the abundance of marine resources in given site or iqoliqoli. For this reason
the biophysical condition of a coral reef system can only be assess through a
proper biological and ecological baseline assessment.
The most logical way to value the use of marine resources and ecosystem by
tourists is to use the proportion of holiday maker’s expenditure in the following
non-organised activities namely swimming, snorkelling, scuba diving, reef walking
and kayaking/ canoeing/ water sports fishing. These non-organised activities are
referred as recreational activities. These are estimated to be F$177.20 to F$777.74
per visitor per year.
Based on numerous other economic valuation studies, the direct use values from
the fisheries and tourism are much higher than non-use values (as long as the
coral reef and related ecosystem or habitats are not destroyed) and these can
be used as a basis for compensation valuation.
43
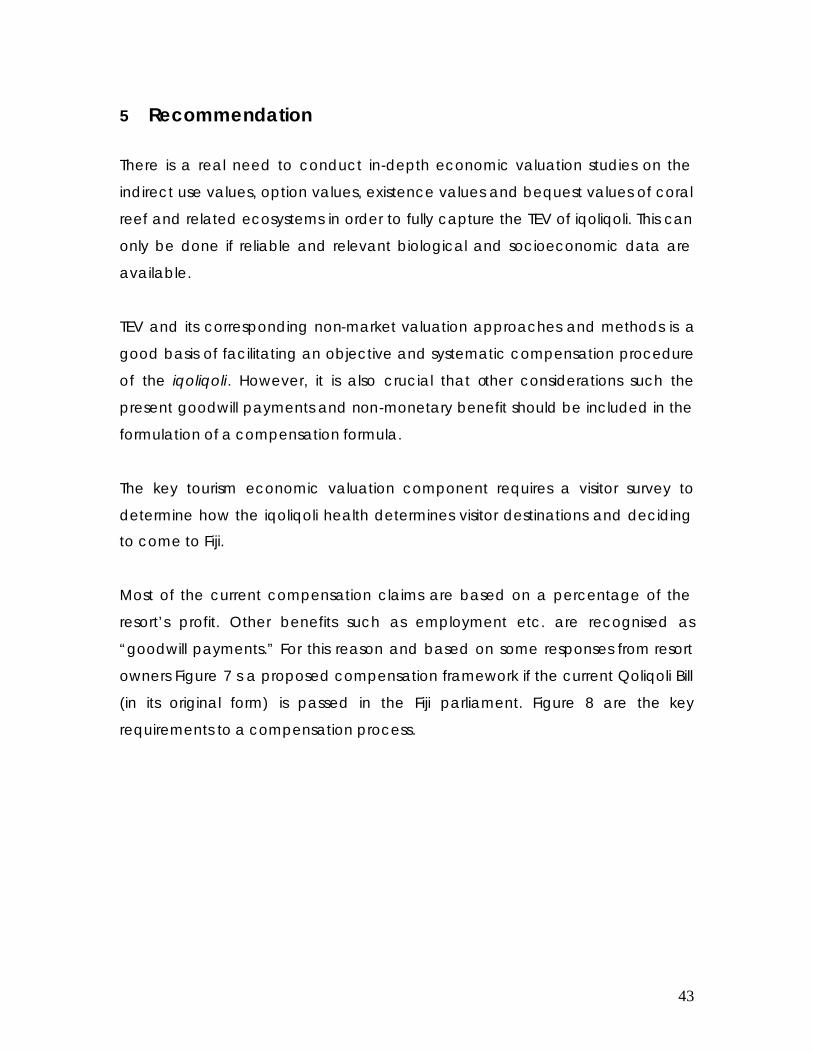
5 Recommendation
There is a real need to conduct in-depth economic valuation studies on the
indirect use values, option values, existence values and bequest values of coral
reef and related ecosystems in order to fully capture the TEV of iqoliqoli. This can
only be done if reliable and relevant biological and socioeconomic data are
available.
TEV and its corresponding non-market valuation approaches and methods is a
good basis of facilitating an objective and systematic compensation procedure
of the iqoliqoli. However, it is also crucial that other considerations such the
present goodwill payments and non-monetary benefit should be included in the
formulation of a compensation formula.
The key tourism economic valuation component requires a visitor survey to
determine how the iqoliqoli health determines visitor destinations and deciding
to come to Fiji.
Most of the current compensation claims are based on a percentage of the
resort’s profit. Other benefits such as employment etc. are recognised as
“goodwill payments.” For this reason and based on some responses from resort
owners Figure 7 s a proposed compensation framework if the current Qoliqoli Bill
(in its original form) is passed in the Fiji parliament. Figure 8 are the key
requirements to a compensation process.
44
Figure 7 Proposed compensation framework if the current Qoliqoli Bill (in its original
form)is passed in the Fiji parliament
Boundary of the iqoliqoli area
Land, foreshore and inter-tidal zone area that will be leased by the Tourist Resort/ Developer
Village/ Community
Mangrove
Coral reef
Shoreline
Land Lease (Administered by NLTB) (The green dotted line is the boundary of the land that is leased by the resort)
Resort
Landowners
Benefits
A Area of the iqoliqoli area (hectares or Km2) Total Economic Value A of all goods and services provided by the various marine resources and ecosystems in the iqoliqoli.
A1 This is the leased area in the iqoliqoli area for tourist outdoor water activities (e.g. snorkelling, swimming etc.). Assumption: Once the area A1 is leased iqoliqoli owners cannot have access to it for both subsistence and commercial fishing Compensation for the leased foreshore area and inshore area = $ Marine resources and affected ecosystems per hectare x A1/A– foreshore lease – benefits provided by resorts. The result should then be discounted over the duration of the lease. Key Requirement: The biological and socioeconomic data are available.
Benefits § Employment § Community hall, church
building and village infrastructure
§ Education (primary, secondary)
§ Cash benefits § Free sea transport e.g.
Tiger 4 and Malolo Cat § Financial contribution to
village/ mataqali/ Yavusa obligations
§ Providing scuba equipment for fishing
A
A1
Income from rent
45
Figure 8 Key requirements for compensation
Identification and analysis of key stakeholders and their interest and roles/ institutional function
Identification of the net benefits that the Tourist development will contribute to the enhancement welfare of the landowners and livelihood of the affected community (ies), the developer and Government
Availability of biophysical and socioeconomic data of the iqoliqoli
Identification and information of the proposed lease area(s) and its related tenure conditions
Application of appropriate economic valuation
approaches and tools to measure the potential damage
cost and opportunity cost
Use the economic value to negotiate compensation
46
References Adger et al (2002) ‘Tropical forest values in Mexico’, in Valuing the Environment in Developing Countries, David Pearce, Corin Pearce and Charles Palmer (editors), Edward Elgar: Cheltenham, UK Bateman, I., Carson, R.T., Day, B., Hanemann, M., Hanley, N., Hett, T., Jones-Lee, M., Loomes, G., Mourato, S., Ozdemiroglu, E., Pearce, D.W., Sugden, R., and Swanson, J., (2002) Economic Valuation with Stated Preference Techniques: A Manual, Edward Elgar: Cheltenham, UK. Brown, K., Pearce, D., Perrings, C. and Swanson, T. (1993) Economics and the Conservation of Global Biodiversity, Working Paper No. 2, Global Environment Facility, Washington D.C. Cesar H (1996) Economic Analysis of Indonesian Coral Reefs. The World Bank, Washington DC. Cesar H and Chong CK (2004) ‘Economic Valuation and Socioeconomics of Coral Reefs: Methodological issues and three case studies’, p14-40 in Ahmed M, Chong CK and Cesar, H. (Eds) Economic Valuation and Policy Priorities for Sustainable management of coral reef, WorldFish Centre Conference Proceedings 70 Constanza R., d’Arge, R., de Groot, R., Farber, S., Grasso, M., Hannon, B., Naeem, S., Limburg, K., Paruelo, J., O’Neill, R.V., Raskin, R., Sutton, P. and Van den Belt, M. (1997) ‘The value of the world’s ecosystem services and natural capital’, Nature, 387, 253-260 de Groot, R.S. (1992) Functions of nature: evaluation of nature in environmental planning, management and decision making, Wolters-Noordhoff. (Reported in Cartier and Ruitenbeck 1999). Dixon, J.A., Scura, L.F. and van’t Hof T. (1992) Meeting Ecological and Economic Goals: The case of Marine Parks in the Caribbean (Publisher unknown). Emerton, L., 1999. Economic tools for the management of marine protected areas in eastern Africa. IUCN World Conservation Union, Nairobi. Gustavson K. (2000) 'Values Associated with the Local Use of the Montego Bay Marine Park', in Gustavson, K., Huber, R.M. and Ruitenbeek, J. (eds) Integrated Coastal Zone Management of Coral Reefs: Decision Support Modelling, Report for the World Bank, Washington D.C, U.S. Hargreaves-Allen, V. (2004) 'Estimating the Total Economic Value of Coral Reefs for Residents of Sampela, a Bajau Community in Wakatobi Marine National, Sulawesi. A Case Study’, MSc Thesis, Imperial College London: UK
47
Jennings, S and Polunin N.V.C., (1995) Comparative size and composition of yield from six Fijian reef fisheries. Journal of applied ecology, Vol. 46: 28-46. Jennings, S and Polunin N.V.C., (1996) Effects of fishing effort and catch rate upon the structure and biomass of Fijian reef fish communities. Journal of applied ecology, Vol. 33: 400-412. Lal, P. N. (1989) ‘Report on the Mangrove Re-compensation System in Fiji,’ Fiji Government, Fiji Lal, P.N. (1990) ‘Conservation or Conversion on Mangroves in Fiji: An Ecological Economic Analysis,’ Environment and Policy Institute East-West Centre, Occasional Paper No. 11, Hawaii Lal, P.N and Cerelala, A. (2005) ‘Financial and Economic Analysis of Wild Harvest and Cultured Live Coral and Rock in Fiji,’ Foundation of the Peoples of the South Pacific International (FSPI), South Pacific Regional Environment Programme (SPREP), Government of Fiji. Laws of Fiji, Act [Cap 158], Chapter 158, Fisheries. Government of Fiji. McKenzie, E., Woodruff, A. and McClennen, C. (2005) 'Economic Assessment of the True Costs of Aggregate Mining in Majuro Atoll, Marshall Islands', SOPAC Technical Report, December 2005 Ministry of Agriculture, Forests and Fisheries, (1993) Annual Report 1992. Fiji Fisheries Division. Fiji Government Ministry of Agriculture, Forests and Fisheries, (1999) Annual Report 1998. Fiji Fisheries Division. Fiji Government. Ministry of Forests and Fisheries, (2002) Annual Report 2001. Fiji Fisheries Department . Fiji Government. Ministry of Forests and Fisheries, (2005) Annual Report 2004. Fiji Fisheries Department. Fiji Government. Ministry of Tourism, Culture, Heritage and Civil Aviation, (2001) 2000 Fiji International Visitor Survey Summary Report, Stollznow Research, Government of Fiji Ministry of Tourism, Culture, Heritage and Civil Aviation, (2002). 2001 Fiji International Visitor Survey Summary Report, Stollznow Research, Government of Fiji
48
Ministry of Tourism, Culture, Heritage and Civil Aviation, (2003). 2002 Fiji International Visitor Survey Summary Report, Stollznow Research, Government of Fiji Ministry of Tourism, Culture, Heritage and Civil Aviation, (2004). 2003 Fiji International Visitor Survey Summary Report, Stollznow Research, Government of Fiji Pearce, D. (1993) Economic Values and the Natural World, Earthscan: London, UK Posner, B. Cutherbertson, C et al. (1981) Economic Impact Analysis of Virgin Islands National Park, Great Barrier Reef Marine Park Authority, Townsville. Qoliqoli Bill, No. 12. Government of Fiji. Raines, P., Comley, J. and Rowlands, G. (2005) The Coral Coast, Viti Levu, Fiji. A Marine Resource Assessment. Coral Cay Conservation, Ministry of Tourism, Culture and Heritage and Civil Aviation, Fiji Ruijgrok, E.C.M. (2006) ‘The three economic values of cultural heritage: a case study in the Netherlands’, Journal of Cultural Heritage, 7, 206–213 Spash, C., ten Bosch, J.D.W., Westmacott, S. and Ruitenbeek, J. (2000) 'Lexicographic preferences and the contingent valuation of coral reef biodiversity in Curacao and Jamaica', in Gustavson, K., Huber, R.M. and Ruitenbeek, J. (eds) Integrated Coastal Zone Management of Coral Reefs: Decision Support Modeling, Report for the World Bank, Washintgon D.C.:U.S. Sisto, N. (1999) ‘The economic valuation of Fiji’s major natural ecosystems’, The Journal of Pacific Studies, Vol. 23, 1, 71-90 Spurgeon, J.P.G., (1992) The Economic Valuation of Coral Reefs. Marine Pollution Bulletin 24 (11): 529-536. Spurgeon, J.P.G., (1998) The Socio-economic Costs and Benefits of Coastal Habitat Rehabilitation and Creation. Marine Pollution Bulletin 37 (8-12): 373-382. Togridou, A., Howardas, T. and Pantis, J.D. (2006) ‘Determinants of visitors' willingness to pay for the National Marine Park of Zakynthos, Greece’, Ecological Economics, (in press) Turner, R.K. (2000) ‘The place of economic values in environmental valuation’, In: Bateman, I.J., Willis, K.G. (Eds.), Valuing Environmental Preferences, Oxford University Press, Oxford
49
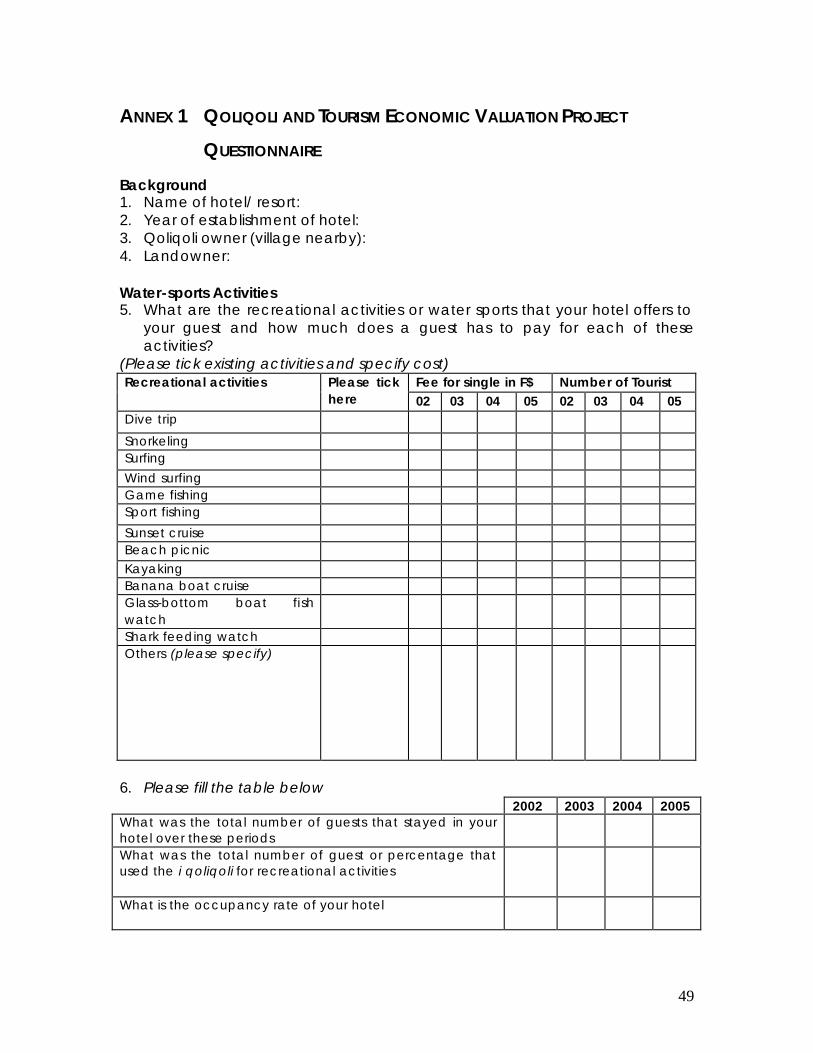
ANNEX 1 QOLIQOLI AND TOURISM ECONOMIC VALUATION PROJECT
QUESTIONNAIRE
Background 1. Name of hotel/ resort: 2. Year of establishment of hotel: 3. Qoliqoli owner (village nearby): 4. Landowner: Water-sports Activities 5. What are the recreational activities or water sports that your hotel offers to
your guest and how much does a guest has to pay for each of these activities?
(Please tick existing activities and specify cost) Fee for single in F$ Number of Tourist Recreational activities Please tick
here 02 03 04 05 02 03 04 05 Dive trip
Snorkeling Surfing
Wind surfing Game fishing Sport fishing
Sunset cruise Beach picnic Kayaking Banana boat cruise Glass-bottom boat fish watch
Shark feeding watch Others (please specify)
6. Please fill the table below
2002 2003 2004 2005 What was the total number of guests that stayed in your hotel over these periods
What was the total number of guest or percentage that used the i qoliqoli for recreational activities
What is the occupancy rate of your hotel
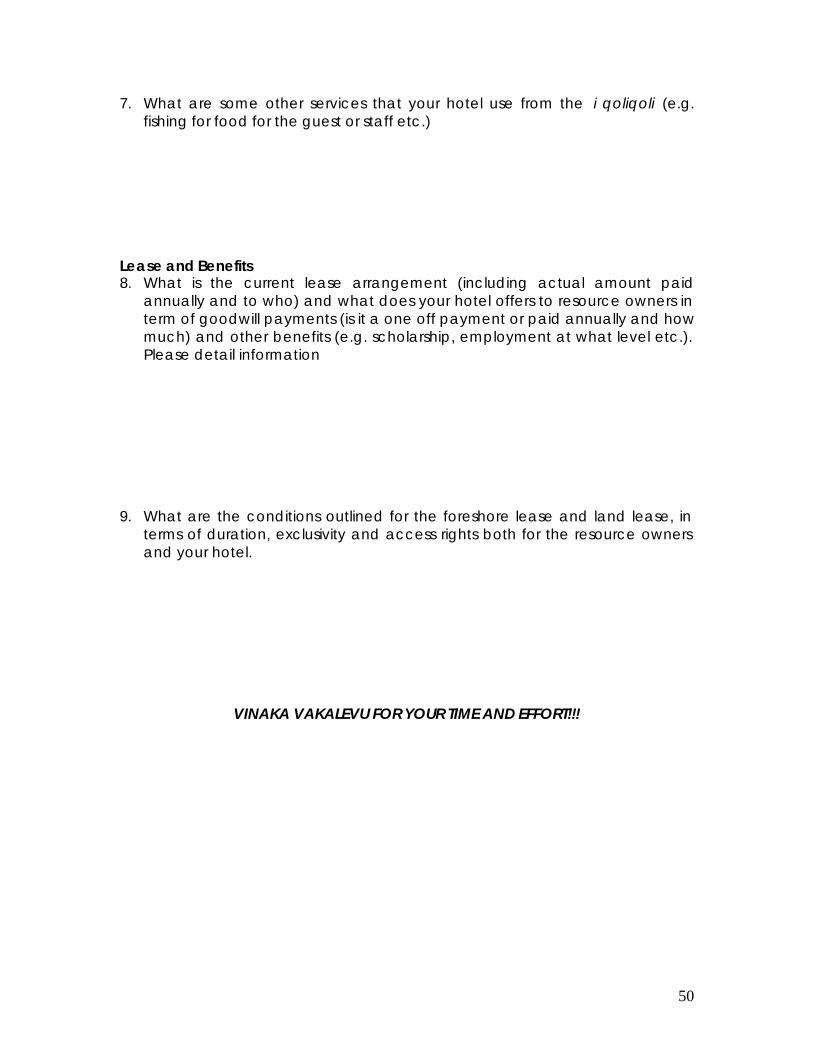
50
7. What are some other services that your hotel use from the i qoliqoli (e.g. fishing for food for the guest or staff etc.)
Lease and Benefits 8. What is the current lease arrangement (including actual amount paid
annually and to who) and what does your hotel offers to resource owners in term of goodwill payments (is it a one off payment or paid annually and how much) and other benefits (e.g. scholarship, employment at what level etc.). Please detail information
9. What are the conditions outlined for the foreshore lease and land lease, in
terms of duration, exclusivity and access rights both for the resource owners and your hotel.
VINAKA VAKALEVU FOR YOUR TIME AND EFFORT!!!