Embed Size (px)
Citation preview

Compliance and EnforcementTransformation Steering Group
Kickoff meeting Jan 7, 2011
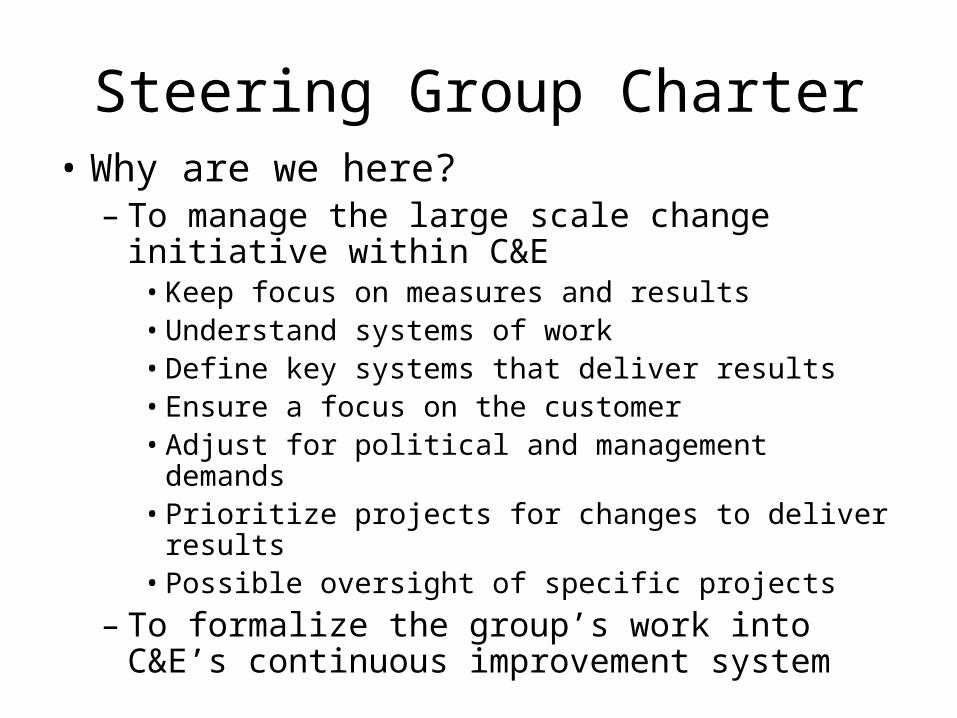
Steering Group Charter• Why are we here?
– To manage the large scale change initiative within C&E
• Keep focus on measures and results• Understand systems of work• Define key systems that deliver results• Ensure a focus on the customer• Adjust for political and management demands• Prioritize projects for changes to deliver results• Possible oversight of specific projects
– To formalize the group’s work into C&E’s continuous improvement system
Steering Group Charter
• The group will be successful if…
– selected projects address key systems; are supported by solid analysis, clearly showing why they are the priority; and especially how desired results are maximized.
– selected projects are realistic and feasible
C&E’s Transformation Framework• Need for change?
– burning platform• staffing, remaining problems getting harder, etc.
– desire to excel (Monitor article)– Miller’s notion of public service and giving
• How to change?– focus on results (demanded by stakeholders)– understand widgets, systems and customers– prioritize systems based on results– form effective teams to test, refine and deliver
projects • change must live within the bounds of stakeholder
expectations – employ proper change process and team tools

Change Concepts
We only get change in three ways:1. Improve a widget
2. Improve a process
3. Create a new process or widget
All change is affected by teams working on discrete projects, with deliverables and deadlines.
Widget:• Something created by work, which can be given to
someone else to achieve a desired outcome.
• Widgets must meet the following four rules:– Widgets are things – cars, permits, contracts, licenses, NOVs– Widgets are deliverables – rules, regulations, articles, pamphlets– Widgets can be counted – invoices, permits, vendor lists, meetings– Widgets are specific – inspection reports, training classes
• Widgets come in two types: those you can see such as reports, permits, licenses; and those that are invisible such as answers, meetings, assessments.
• Widgets are the link between our “factory” and our customers.

Systems:
Processes (including the inputs, suppliers, and employees who work in the processes) that produce widgets for customers in order to achieve some desired result or outcome.
Customers:
• End users of our widgets• The people we had in mind when we designed the
widget. • They will personally use the widget to achieve a desired
outcome. • There could be multiple customers who have competing
interests. • The customer is the link between our widgets and our
outcomes.
• Note that “the public” or taxpayers are only our customers when they use our widgets. More often our customers are those we regulate.
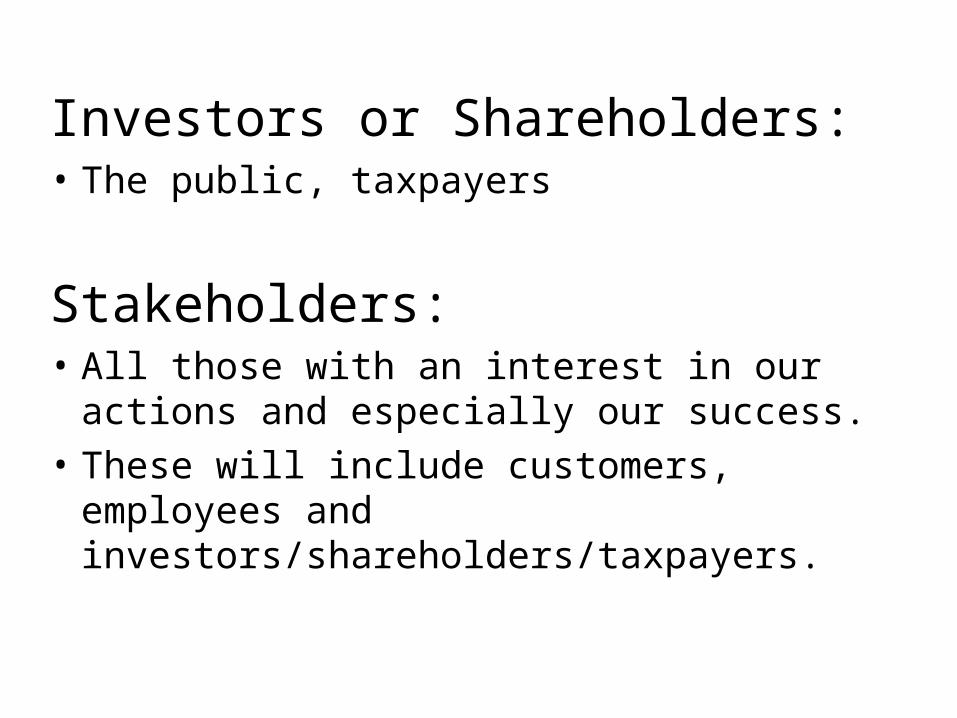
Investors or Shareholders: • The public, taxpayers
Stakeholders: • All those with an interest in our actions
and especially our success.
• These will include customers, employees and investors/shareholders/taxpayers.
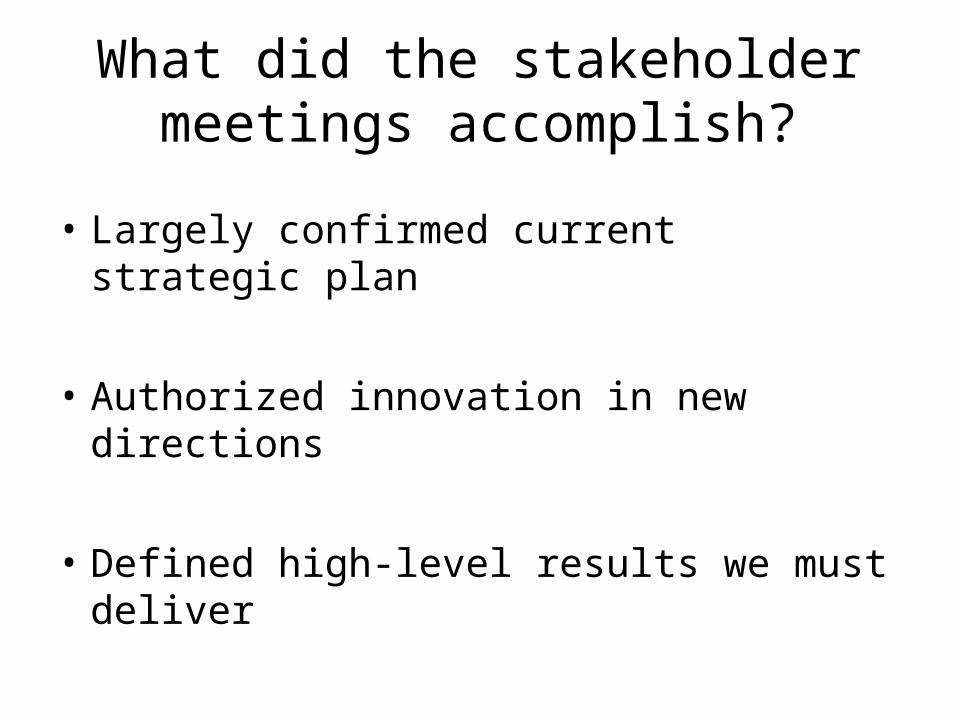
What did the stakeholder meetings accomplish?
• Largely confirmed current strategic plan
• Authorized innovation in new directions
• Defined high-level results we must deliver
C&E’s widgets, systems and the results they lead to
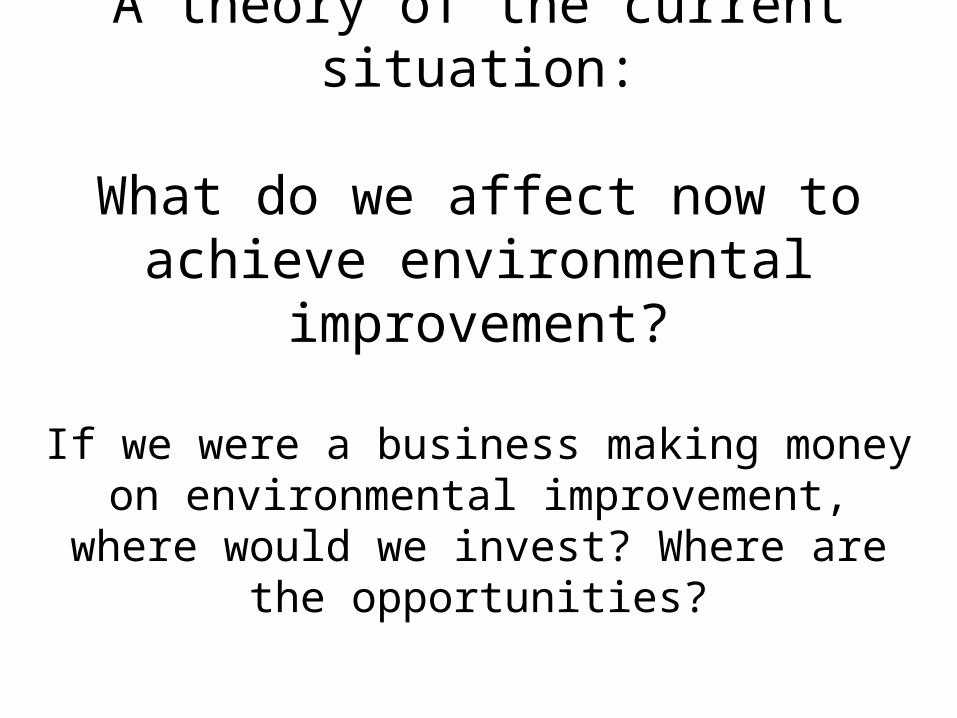
A theory of the current situation:
What do we affect now to achieve environmental improvement?
If we were a business making money on environmental improvement, where would we
invest? Where are the opportunities?

no influence – out of state
limited influence – mobile sources
Small sources
Large sources
Reduction
over time
Universe of actors ++++++++++++++++
Universe of actors +++++++++++++++++++++++++++++++++++++++++++++++++++++++++++++++++++++++++++++++++++++++++++++++++++++++++++++++++++++++++++++++++++++++++++++++++++++++++++++++++++++++++++++++++++++++++++++++++++++++++++++++++++
+++++
Reductions possible through complianceHigh influence – limited potential
High influence and potential Reduction
over time
Reduc
tion
over
time
TOTAL IMPACT ON ENVIRONMENT
Data to understand the current situation:
Comparison of resource levels
Are we critically short, over-invested or in the middle
compared to other states?
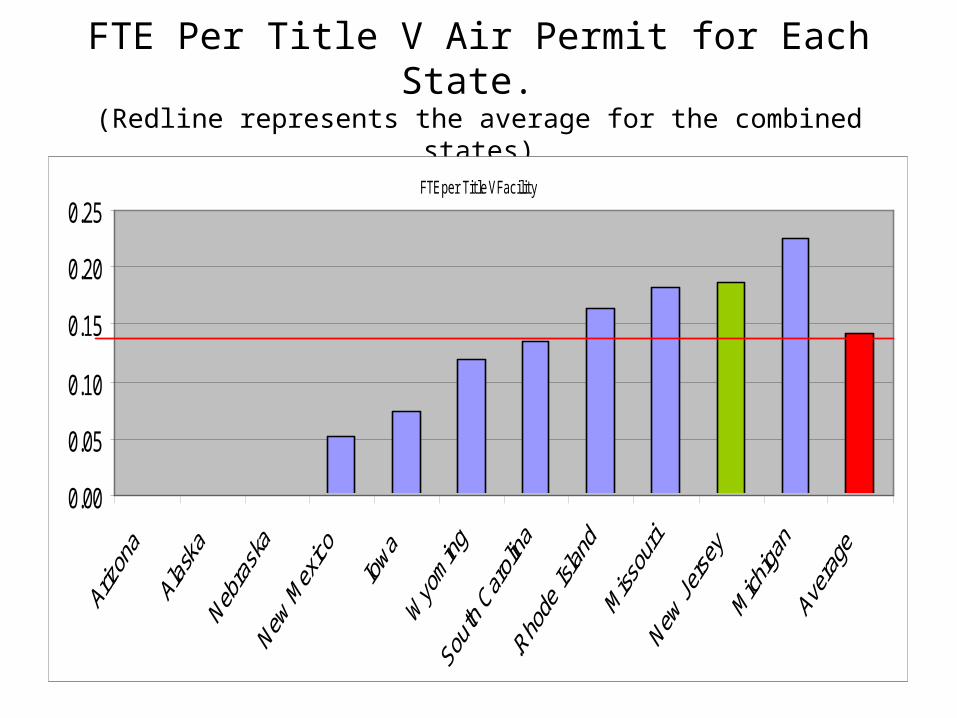
FTE Per Title V Air Permit for Each State. (Redline represents the average for the combined states)
FTE per Title V Facility
0.00
0.05
0.10
0.15
0.20
0.25
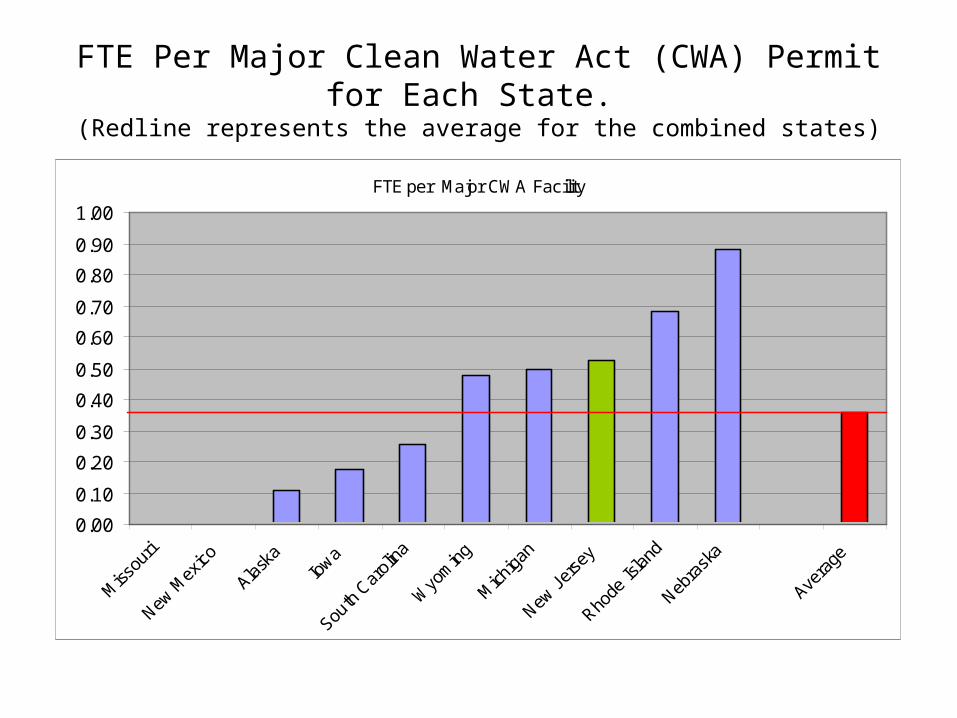
FTE Per Major Clean Water Act (CWA) Permit for Each State.
(Redline represents the average for the combined states)
FTE per Major CWA Facility
0.00
0.10
0.20
0.30
0.40
0.50
0.60
0.70
0.80
0.90
1.00
Miss
ouri
New M
exico
Alask
aIo
wa
South
Car
olina
Wyo
min
g
Mich
igan
New J
erse
y
Rhode
Isla
nd
Nebra
ska
Avera
ge
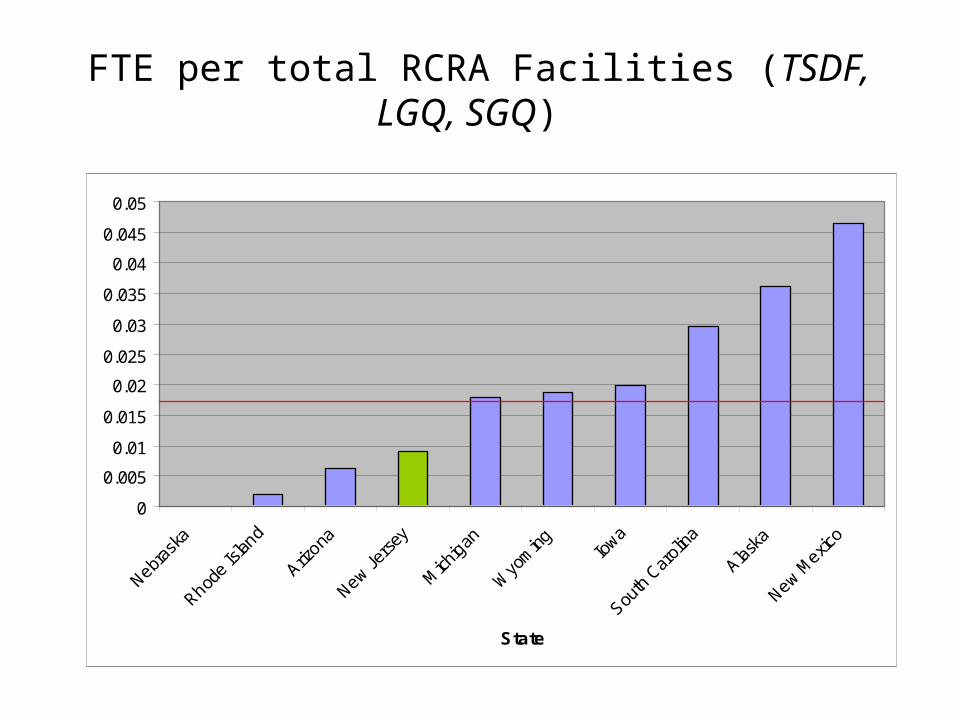
FTE per total RCRA Facilities (TSDF, LGQ, SGQ)
0
0.005
0.01
0.015
0.02
0.025
0.03
0.035
0.04
0.045
0.05
Nebras
ka
Rhode
Islan
d
Arizona
New Jers
ey
Mich
igan
Wyo
ming Io
wa
South
Car
olina
Alaska
New Mexic
o
State
Data to understand the current situation:
Analysis of time investment as reported in NJEMS
Where do we spend most of our time? What does this say about
key systems?
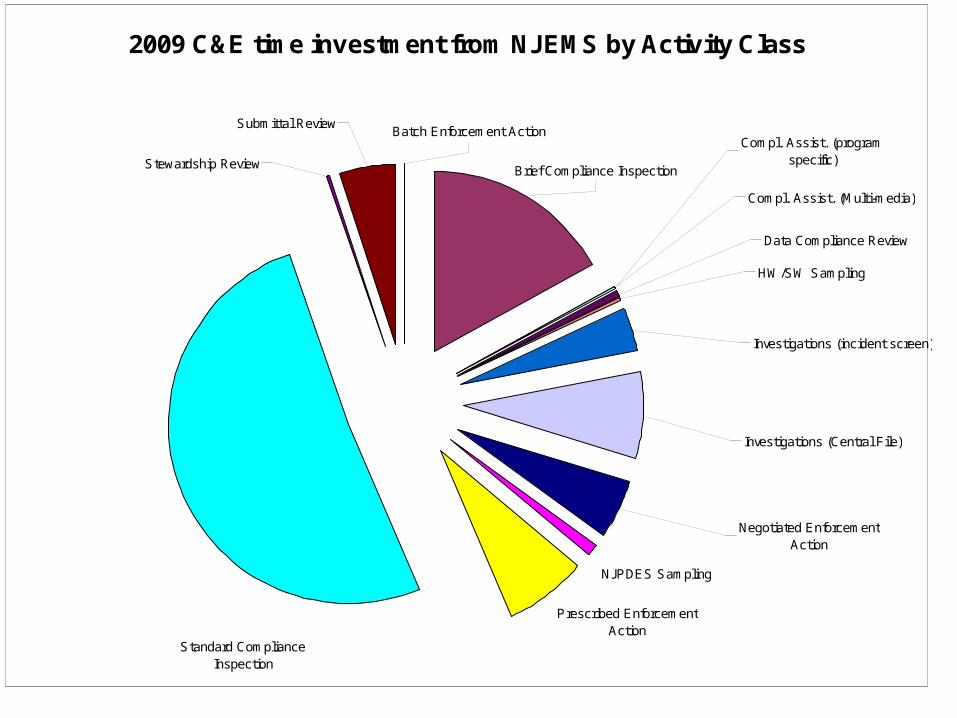
2009 C&E time investment from NJEMS by Activity Class
Prescribed Enforcement Action
NJPDES Sampling
Standard Compliance Inspection
Submittal Review
Stewardship Review
Compl. Assist. (program specific)
Data Compliance Review
HW/SW Sampling
Investigations (Central File)
Investigations (incident screen)
Negotiated Enforcement Action
Batch Enforcement Action
Brief Compliance Inspection
Compl. Assist. (Multi-media)
Data to understand new efforts:
Analysis of compliance rates and stewardship.
What is the compliance value of stewardship?
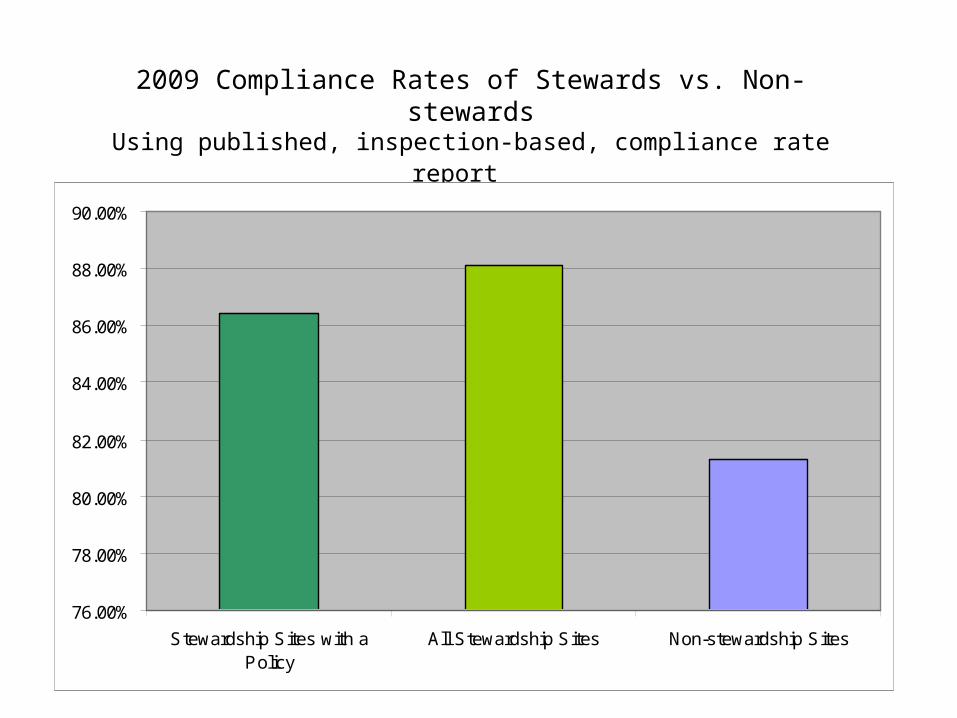
2009 Compliance Rates of Stewards vs. Non-stewardsUsing published, inspection-based, compliance rate report
76.00%
78.00%
80.00%
82.00%
84.00%
86.00%
88.00%
90.00%
Stewardship Sites with aPolicy
All Stewardship Sites Non-stewardship Sites

Percent of checklist requirements found In Compliance (IC) in 2009for: Air; Hazardous waste; Solid Waste; Water Quality; Water Supply
In Compliance
66.00%
68.00%
70.00%
72.00%
74.00%
76.00%
78.00%
80.00%
Stewardship Sites with aPolicy
All Stewardship Sites Non-stewardship Sites
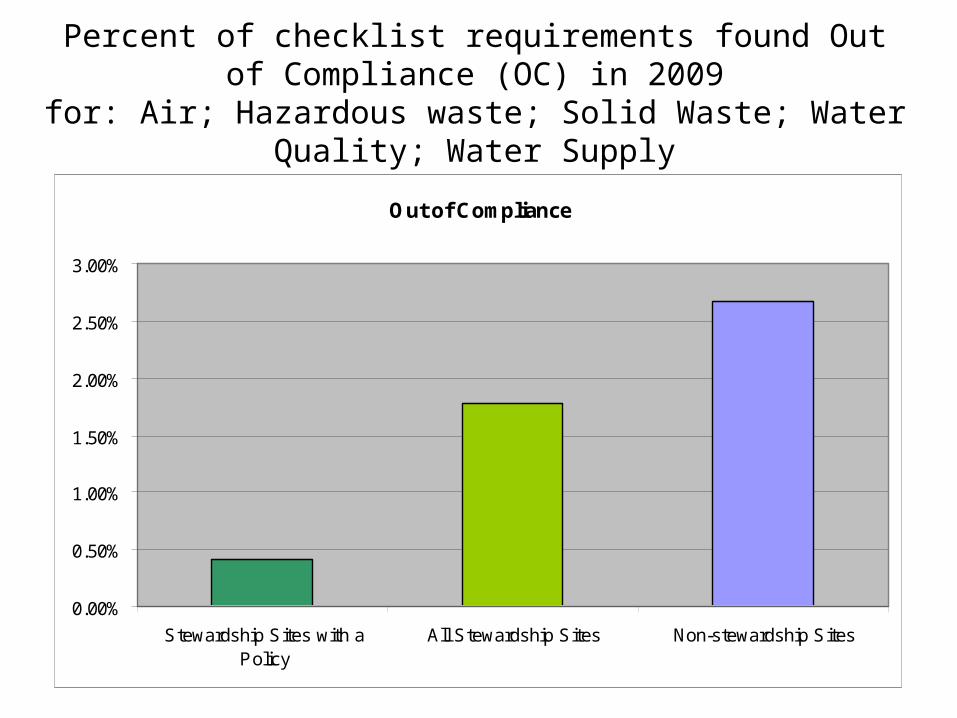
Percent of checklist requirements found Out of Compliance (OC) in 2009
for: Air; Hazardous waste; Solid Waste; Water Quality; Water Supply
Out of Compliance
0.00%
0.50%
1.00%
1.50%
2.00%
2.50%
3.00%
Stewardship Sites with aPolicy
All Stewardship Sites Non-stewardship Sites
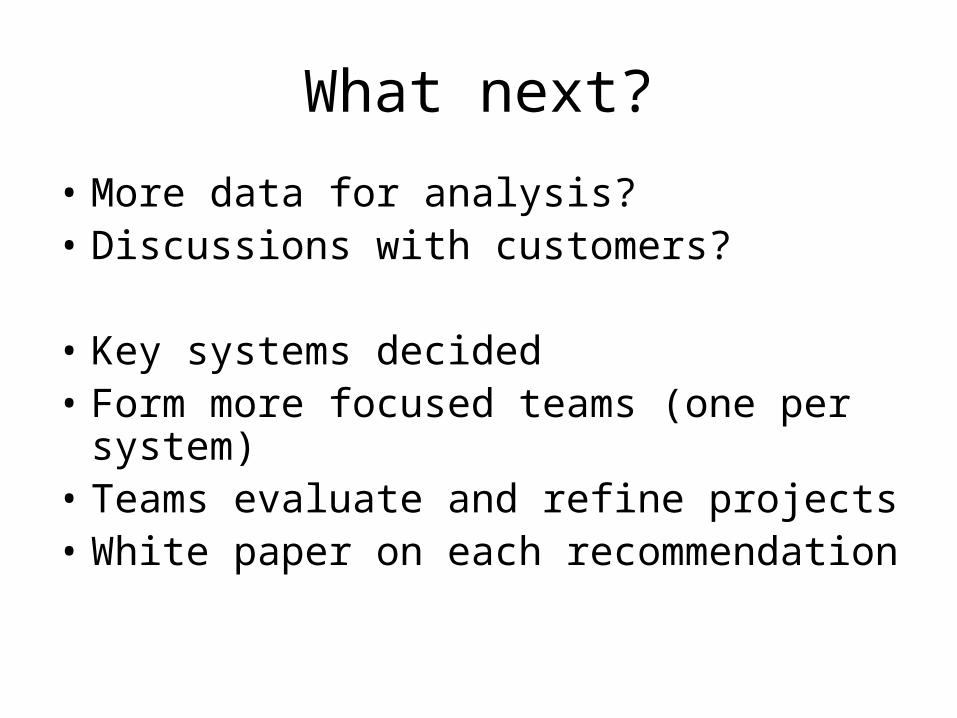
What next?
• More data for analysis? • Discussions with customers?
• Key systems decided • Form more focused teams (one per
system)• Teams evaluate and refine projects• White paper on each recommendation