Embed Size (px)
Citation preview
Univers
ity of
Cap
e Tow
n
LINEAR LIBRARY C01 0068 4546
I 1111111111111111 ~ .. - --
COMPLEXES OF IRON<III) WITH DERIVATIVES
OF 8-QUINOLINOL
A thesis submitted to the
UNIVERSITY OF CAPE TOWN
in fulfilment of the requirements for the degree of
MASTER OF SCIENCE
BY
CORINNE GOLDEN
B.Sc. (Hons) (Cape Town)
Department of Analytical Science University of Cape Town Rondebosch 7700 Republic of South Africa August 1981
I <IID WI I
I
A to
B. •
The copyright of this thesis vests in the author. No quotation from it or information derived from it is to be published without full acknowledgement of the source. The thesis is to be used for private study or non-commercial research purposes only.
Published by the University of Cape Town (UCT) in terms of the non-exclusive license granted to UCT by the author.
Univers
ity of
Cap
e Tow
n
Univers
ity of
Cap
e Tow
n
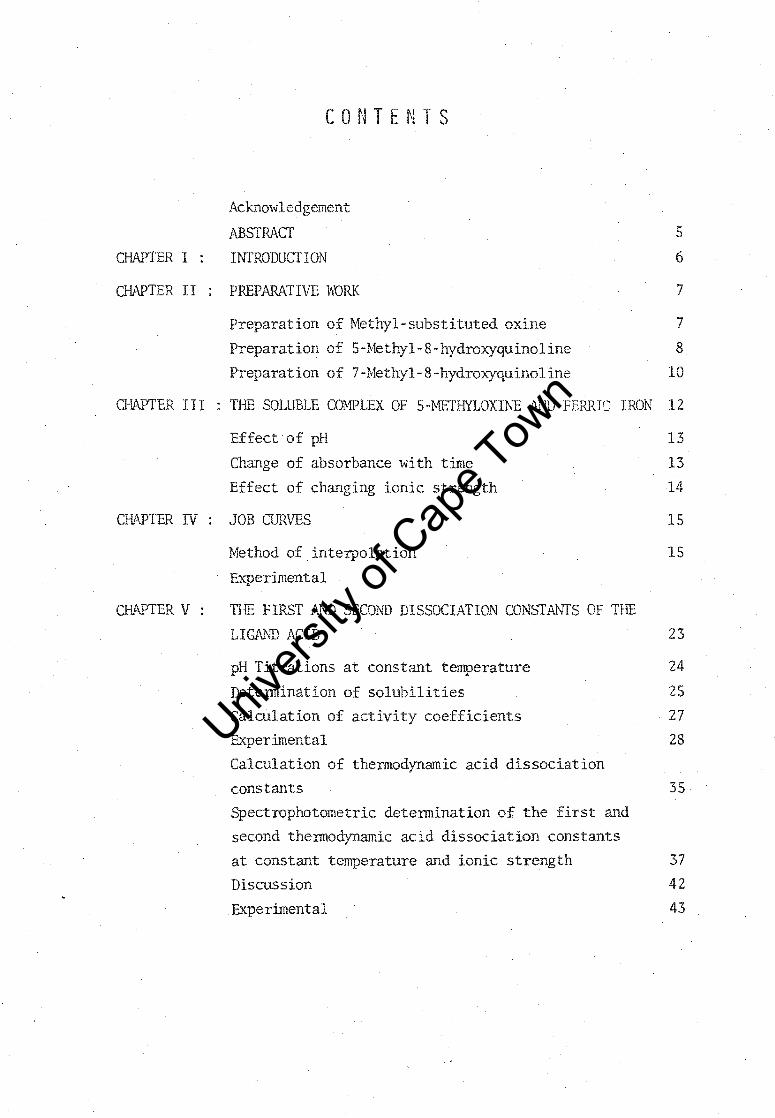
C 0 N.T ENT S
Acknowledgement
ABSTRACT
CHAPTER I : INfRODUCTION
5
6
CHAPTER II : PREPARATIVE WORK 7
7
8
Preparation of Methyl-substituted oxine
Preparation of 5-Methyl-8-hydroxyquinoline
Preparation of 7-Methyl-8-hydroxyquinoline 10
CHAPTER III THE SOLUBLE COMPLEX OF 5-METHYLOXINE At'JD FERRIC IRON 12
CHAPTER IV
CHAPTER V
Effect· of pH
Change of absorbance with time
Effect of changing ionic strength
JOB CURVES
Method of interpolation
Experimental
THE FIRST AND SECOND DISSOCIATION CONSTANfS OF THE
LIGM1D ACID
pH Titrations at constant temperature
Determination of solubilities
Calculation of activity coefficients Experimental
Calculation of thermodynamic acid dissociation
13
13
14
15
15
23
24
25
27
28
constants 35
Spectrophotometric determination of the first and
second thermodynamic acid dissociation constants
at constant temperature and ionic strength 37
Discussion 42
Experimental 43
CONTENTS
I . . . II:
III
CURVES
v ACID
at constant
constant T<:>11'''''<:>" ... .,
constants
5
6
7
7
8
13
15
15
23
25

CHAPTER VI
CHAPTER VII
CHAPTER VI II
CHAPTER IX :
CHAPTER X
THEffi.1JDYNAMIC FORMATION CONSTANTS OF COMPLEXES
OF IRON (III) AND METHYL-SUBSfITUTED 8-HYDROXY-
QUINOLINES
The molar absorption coefficients, e: , of the
complexes Summary of data used in calculations
CALCULATION OF VALUES OF KT FOR THE FOruvtl\TION OF
IRON COMPLEXES
Thermodynamic formation constants obtained by calculation using equation lS
DISCUSSION
APPENDIX
1. Derivation of the relationship giving KT
for the complex of iron(III) and S-hydroxyquinoline
2. Derivation of a relationship giving an approximate value for the 'molar absorption coefficient of the complex
REFERENCES
53
57
59
61
62
67
69
69
72
73

Acknowledgements
I should like to thank my supervisor, Professor H.M.N.H. Irving, for
. all his help and guidance, and for introducing me to this field of
chemistry •...
I should also like to thank Mrs Anne Alhadeff for t)~ing my thesis and . . . '.
Tony Jutzen for' his· invaluable assistance in the laboratory.·

A B S TR Pt C T
5.
ABSfRACf
The o,rganic ligands 5- and 7- methyl-S-hydroxyquinoline have been
synthesised and shown to form. green, water soluble, 1:1 complexes with
iron(III) and thus to possess the same composition as the complexes with
S-hydroxyquinoline and 2-methyl-S-hydroxyquinoline previously reported.
Thermodynamic formation constants for the 1:1 complexes of 2-, 5- ,and
7-methyl-8-hydroxyquinoline with iron(III) have been determined
-1 3 spectrophotometricallyas 5.5. x 101~, 2.9 X 10¹⁵ and 3.6 x 10¹⁵ mole dm
respectively at 25. O°C and I = O.1M.
When compared with the value 8.5 x lOl~ for 8-hydroxyquinolineitself the
results support the theory that methyl substitution affects the stability
of these complexes by increasing the basicity of the nitrogen atom.
The lesser stability of the 2-methyl complex, however, indicates an
opposing steric effect of a bulky substituent in the 2-position.

CHP,PTER I
I NT ROD UC T ION· .'

C HAP T E R I I
PRE PAR A T I V E W 0 R K
6.
CHAPTER I
INTRODUCTION
8-Hydroxyquinoline (HOx;Oxine) reacts with ferric ions in dilute
mineral acid medium to give a soluble green complex.
The formation of this complex has been used in the indirect absorptio
metric determb.ation of magnesium [1]. An acid solution of the magnesium
oxinate is treated with ferric ion, and the concentration of the green
complex so formed is determined absorptiometrically. In 1949 Sandell and
Spindler [2] showed that the complex had a one: one mole ratio, and
detennined the value of the thermodynamic formation constant, KT FeOx
defined by
I (1)
It was observed that various methyl-substituted oxines also gave green
coloured complexes, and it was clearly of interest to find the composition
of these complexes, and to see how methyl substitution has affected
their stability. The methyl group would be eJliPected to increase the
basicity of the nitrogen atom, which would result in an increase in the
stability of the complex. There may, however, be an opposing steric
effect of a methyl group in the 2-position [3].
7.
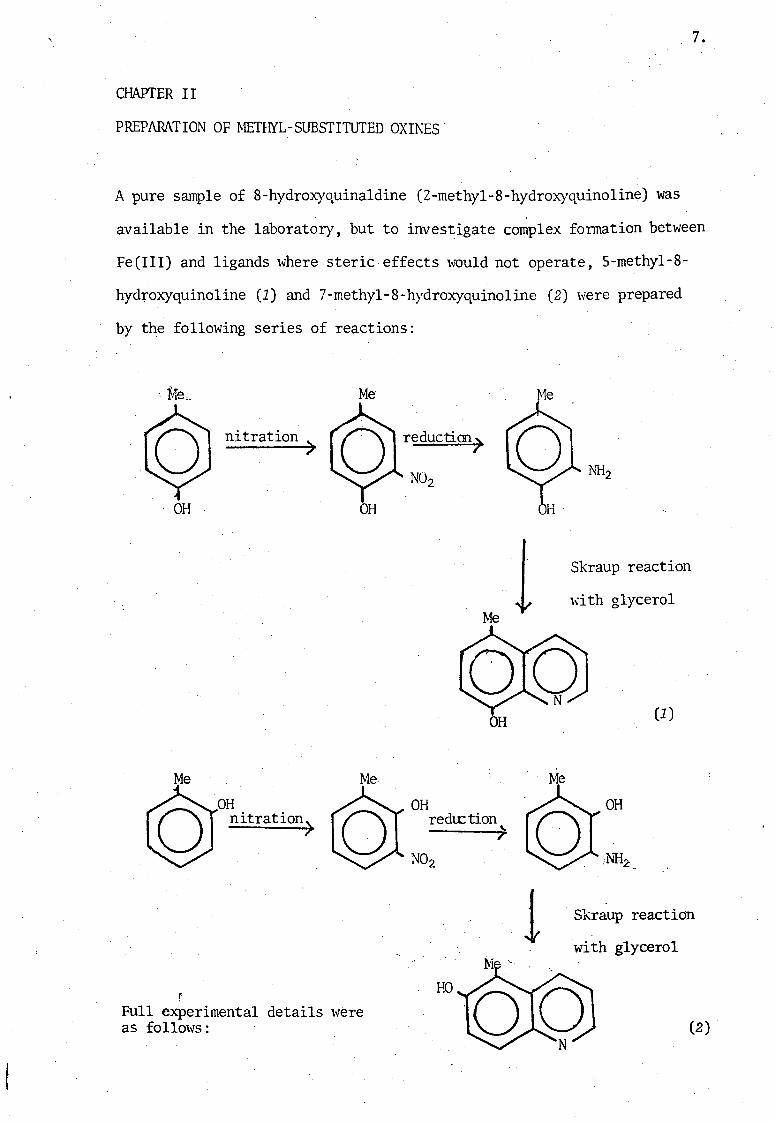
CHAPTER II
PREPARATION OF METHYL-SUBSTITUTED OXINES
A pure sample of 8-hydroxyquina1dine (2-methyl-8-hydroxyquino1ine) was
available in the laboratory, but to investigate complex formation between
Fe(III) and ligands where steric effects would not operate, S-methyl-8-
hydroxyquinoline (1) and 7-methyl-8-hydroxyquino1ine (2) were prepared
by the following series of reactions:
OH
Me
nitration)
OH nitration)
Me
OH
Me
Full experimental details were as follows:
reductim)
OH
OH redu:tion
" 7
HO
Me
Skraup reaction
\d th glycerol
(1)
1 . Skraup reaction
with glycerol
(2)
8.
A. ~reparation of S-Methyl-8-hydroxyquinoline
(i) Preparation of o-Nitro-p-cresol. p-Cresol (200 g) was dissolved
in benzene (400 g), To this solutionwas added over l-H h a mixture of
concentrated HN03 (200 ml) and water (300 ml). The reaction mixture
was stirred continuously and its temperature kept below 20°C. As the
reaction proceeded the solution became a dark red-brmvn colour. Finally
the solution was transferred to a separating funnel and the lmver nitric
acid layer run off. The benzene solution was then steam distilled.
The benzene came over first and, as it contained only small quantities of
the nitro-compound, it was discarded. The desired compound eventually
collected as a brilliant yellow solid ·\\'hich was filtered off and dried.
(Yield 94.7 g, 33.2%)
(ii) Reduction of Chnitro- p-cresol. The nitro-compound (94.7 g)
and ethanol (140 ml) together with some Raney nickel were placed in a
pressure bottle. l~ile the bottle was agitated hydrogen gas was led in
for 48 hours. The apparatus was not adapted to show the amount of hydrogen
absorbed, and so thin layer chromatograms were run at intervals; after 48
hours most of the nitro-compound had been reduced. At this stage the
reduction was stopped and it was hoped that any nitro-compound still
remaining in the mixture could be used as an oxidant in the subsequent
Skraupreaction.
While being cooled some. of the base had crystallized out and a small amount
of ether was added to redissolve it. The Raney nickel ,.,ras filtered off
on a sintered glass filter and the filtrate divided into three portions
which were worked up separately. Alcohol and ether were evaporated off
using a Buchi rotary evaporator and the crude base collected.
9.
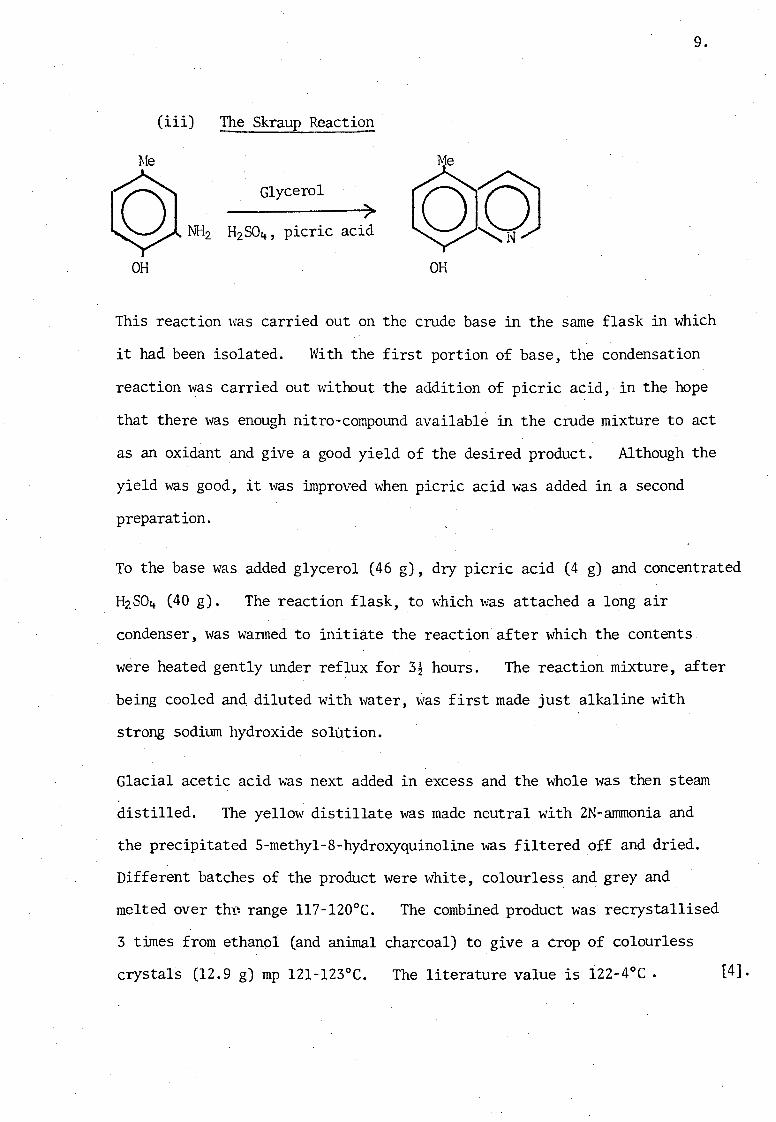
(iii) The Skraup Reaction
~le
Glycerol
> NH2 H2SO4 , picric acid
OH OH
This reaction was carried out on the crude base in the same flask in which
it had been isolated. With the first portion of base, the condensation
reaction was carried out without the addition of picric acid, in the hope
that there was enough nitro-compound available in the crude mixture to act
as an oxidant and give a good yield of the desired product. Although the
yield was good, it was improved when picric acid was added in a second
preparation.
To the base was added glycerol (46 g), dry picric acid (4 g) and concentrated
The reaction flask, to which was attached a long air
condenser, was warmed to initiate the reaction after which the contents
were heated gently under reflux for 3! hours. The reaction mixture, after
being cooled and diluted with water, was first made just alkaline with
strong sodium hydroxide solution.
Glacial acetic acid was next added in excess and the whole was then steam
distilled. The yellow distillate was made neutral with 2N-ammonia and
the precipitated S-methyl-S-hydroxyquinoline was filtered off and dried.
Different batches of the product were white, colourless and grey and
melted over th~ range l17-l20°C. The combined product was recrystallised
3 times from ethanol (and animal charcoal) to give a crop of colourless
crystals (12.9 g) mp l2l-l23°C. The literature value is i22-4°C . [4] .
10.
B. Preparation of 7-Methyl-8-hydroxyquinoline
Ci) Preparation of 3- and S-nitro-o ·cresols [S, 6]. A mixture
of concentrated nitric acid (107 ml) and glacial acetic acid (300 ml)
was stirred in a freezing mixture at -15°C while a mixture of o-cresol
(100 g) and glacial acetic acid (100 ml) \vas added in the course of 2 hours
when a thick magma of crystals separated. After standing for 2 hours
in the freezing mixture, the whole was poured into water,( S litre).
The crystals which separated were collected and submitted to steam distill-
ation.
Crude 3-nitro-o-cresol containing a 'small proportion of 3,S-dinitro-o
cresol distilled first and was COllected, filtered and submitted to steam
distillation again. S-nitro-o-cresol with a little 3,5-dinitro-o-cresol
then remained in the flask as an oil. The crude distillate was steam
distilled and the various fractions (200 ml) were collected and after being
dried their melting points were taken.
The first fractions gave deposits of deep yellow plates of nearly pure
3-nitro-o-cresol (49 g; 34%; 63.65°C), the last gave pure 3, S-dinitro-o
cresol in well-defined colourless prisms [5,6].
(ii) Reduction of the nitro compound. The nitro-compound (46.1 g)
and ethanol (300 ml) together with some Raney nickel were placed in a
pressure bottle. while this was continuously shaken hydrogen gas was led
in until no more was absorbed. A small amount of ether ,,,as added to
dissolve the base which had crystallized out in the bottle on cooling.
After filtering off the Raney nickel, the alcohol and ether were removed
by evaporation under reduced pressure, and the crude base isolated.
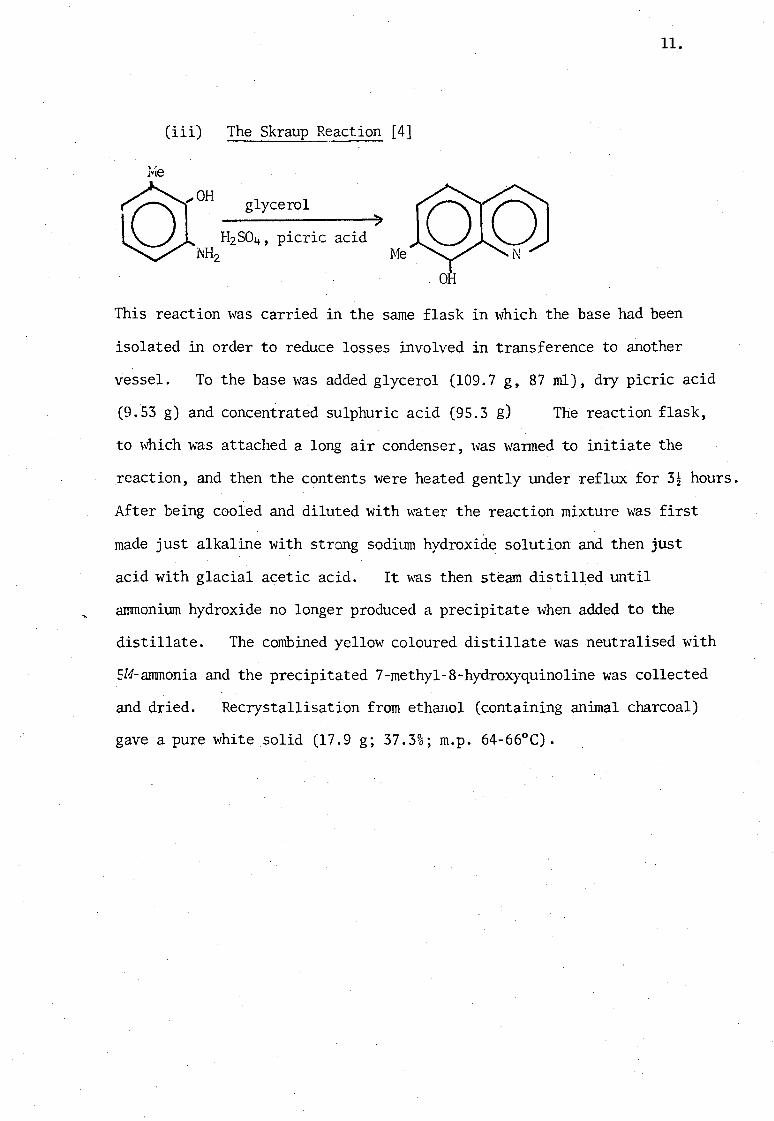
(iii) The Skraup Reaction [4]
J.le
" glycerol rQroH o H2SO4 , picric ~H2
)
acid Me
11.
This reaction was carried in the same flask in which the base had been
isolated in order to reduce losses involved in transference to another
vessel. To the base was added glycerol (109.7 g, 87 rnl), dry picric acid
(9.53 g) and concentrated sulphuric acid (95.3 g) The reaction flask,
to which was attached a long air condenser, was warmed to initiate the
reaction, and then the contents were heated gently under reflux for 3~ hours.
After being cooled and diluted with water the reaction mixture was first
made just alkaline with strong sodium hydroxide solution and then just
acid with glacial acetic acid. It was then stearn distilled until
ammonium hydroxide no longer produced a precipitate when added to the
distillate. The combined yellow coloured distillate was neutralised with
5M-ammonia and the precipitated 7-methyl-8-hydroxyquinoline was collected
and dried. Recrystallisation from ethanol (containing animal charcoal) .
gave a pure white solid (17.9 g; 37.3%; m.p. 64-66°C).

C HAP T E R I I I
THE SOWBl£ CQlVPLEX OF 5-rlffHYLOXINE AND FERRIC ION
12.
CHAPTER III
THE SOLUBLE COMPLEX OF 5-IvlETHYLOXlNE Al\;TI FERRIC ION
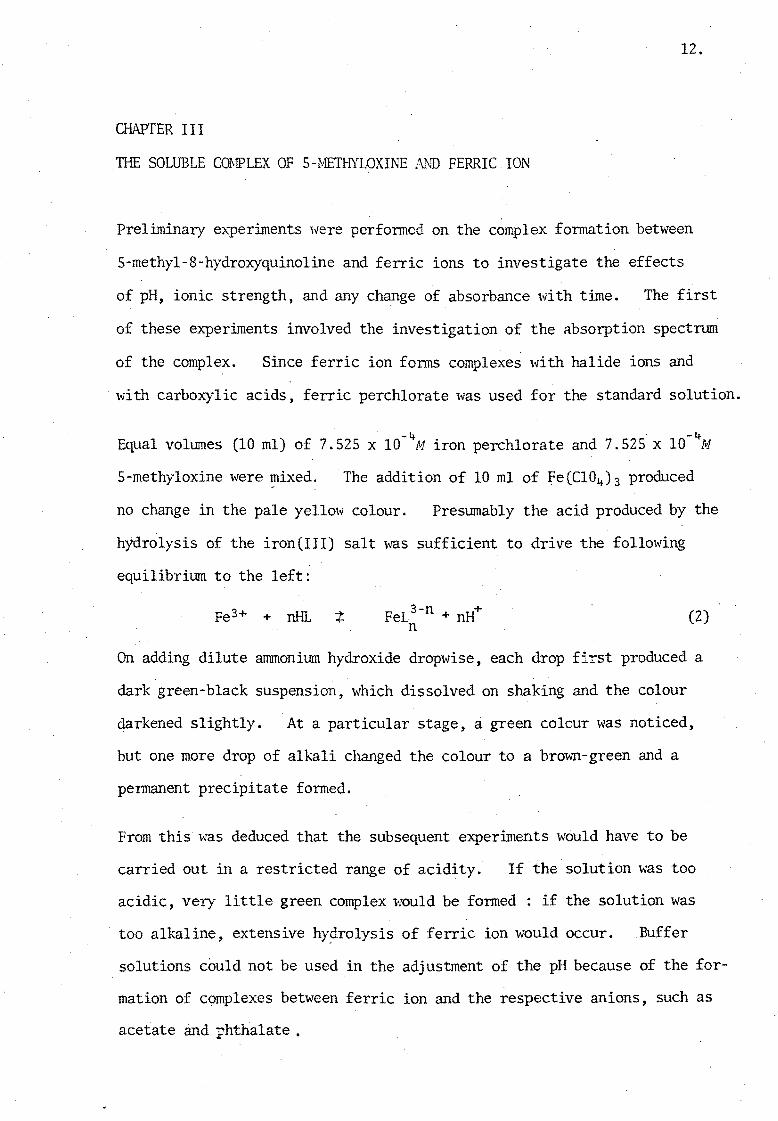
Preliminary e:x-periments were perfonned on the complex fonnation between
5-methyl-8-hydroxyquinoline and ferric ions to investigate the effects
of pH, ionic strength, and any change of absorbance ,,,ith time. The first
of these experiments involved the investigation of the absorption spectrum
of the complex. Since ferric ion fonns complexes 'vi th halide ions and
with carboxylic acids, ferric perchlorate was used for the standard solution.
. -~ . -4 Equal volumes (10 ml) of 7.525 x 10 M iron perchlorate and 7.525 x 10 M
5-methyloxine were ~ixed. The addition of 10 ml of Fe(ClOq )3 produced
no change in the pale yellow colour. Presumably the acid produced by the
hydrolysis of the iron(III) salt was sufficient to drive the following
equilibrium to the left:
Fe3+ + nHL FeL 3-n + nH+ n
(2)
On adding dilute ammonium hydroxide dropwise, each drop first produced a
dark green-black suspension, which dissolved on shaking and the colour
darkened slightly. At a particular stage, a green colour was noticed, I
but one more drop of alkali cl1anged the colour to a brown-green and a
permanent precipitate fonned.
From this was deduced that the subsequent experiments llJould have to be
carried out in a restricted range of acidity. If the solution \vas too
acidic, very little green complex l\'ould be fonned : if the solution was
too alkaline, extensive hy~rolysis of ferric ion would occur. Buffer
solutions could not be used in the adjustment of the pH because of the for-
mation of complexes between ferric ion and the respective anions, such as
acetate and phthalate •
13.
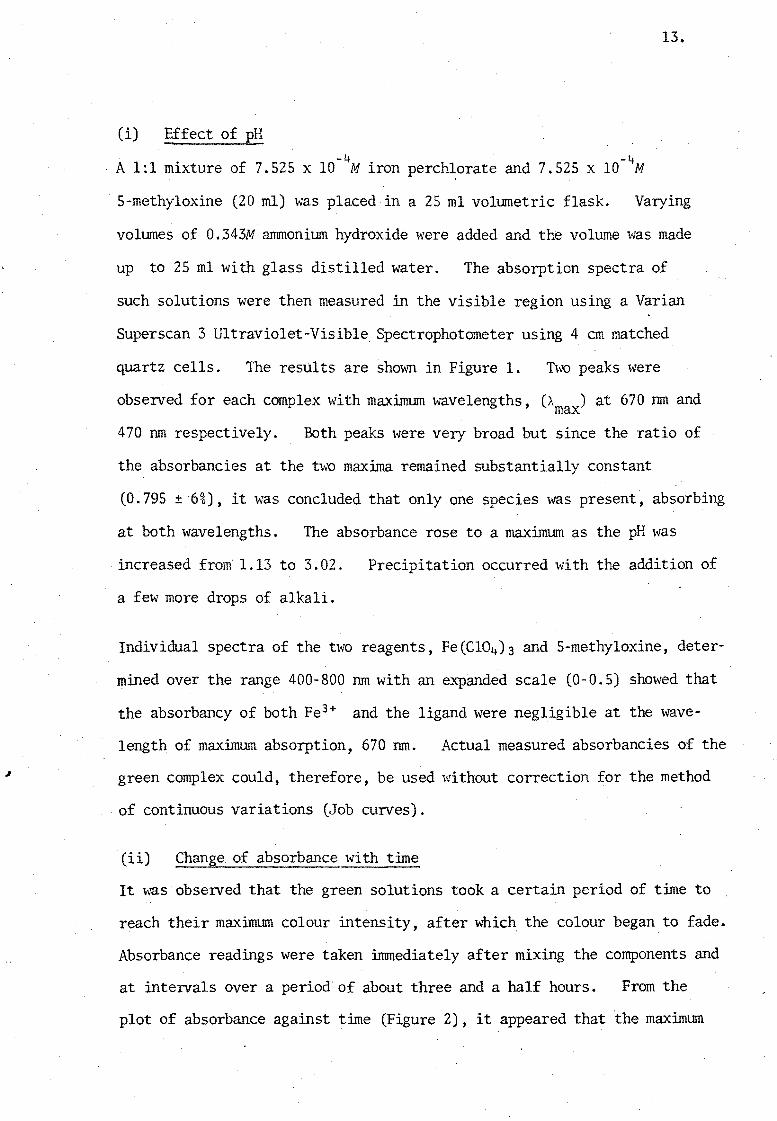
(i) Effect of P!i . -4 -4
. A 1:1 mixture of 7.525 x 10 M iron perch~orate and 7.525 x 10 M
5-methyloxine (20 ml) was placed in a 25 ml volumetric flask. Varying
volumes of O •. 343M ammonium hydroxide were added and the volume was made
up to 25 ml with glass distilled water. The absorption spectra of
such solutions were then measured in the visible region using a Varian
Superscan 3 Ultraviolet-Visible Spectrophotometer using 4 cm matched
quartz cells. The results are shown in Figure 1. Two peaks \.,rere
obseIVed for each complex with maximum wavelengths, (A ) at 670 nm and max 470 nm respectively. Both peaks were very broad but since the ratio of
the absorbancies at the t\.,ro maxima remained substantially constant
(0.795 ±'6%), it was concluded that only one species was present, absorbing
at both wavelengths. The absorbance rose to a maximum as the pH was
increased from 1.13 to 3.02. Precipitation occurred with the addition of
a few more drops of alkali.
Individual spectra of the two reagents, Fe(Cl04)3 and 5-methyloxine, deter
mined over the range 400-800 nm with an expanded scale (0-0.5) showed that
the absorbancy of both Fe 3+ and the ligand were negligible at the wave
length of maximum absorption, 670 nm. Actual measured absorbancies of the
green complex could, therefore, be used without correction for the method
of continuous variations (Job cUIVes).
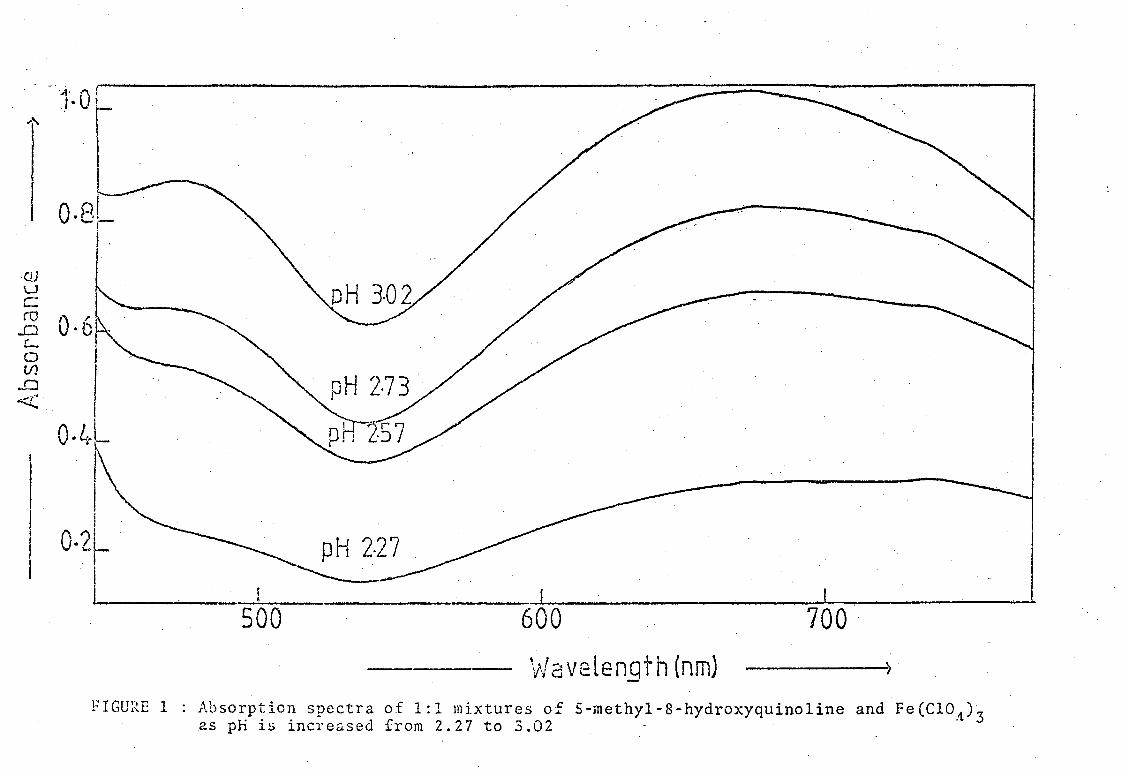
(ii) Change of absorbance with time
It was obseIVed that the green solutions took a certain period of time to
reach their maximum colour intensity, after which the colour began to fade.
Absorbance readings were taken immediately after mixing the components and
at inteIVals over a period of about three and a half hours. From the
plot of absorbance against time (Figure 2), it appeared that the maximum
... :\
!
r o.8l i '
CJ.) u C
lj o· 6r I t-
o (/)
..0 <:(
i
I I
O·L .. I_ I I i
I O.2~
L I I 500 600 700
- \l/avelength (nm) ------------------~1 ,.
FIGURE 1 Absorption spectra of 1:1 mixtures of 5-methyl-8-hydroxyquinoline and Fe(CIOA)3 25 pH is increased from 2.27 to 3.02
0-73
E c o t:"''-D
~d
OJ U c d
..0 La V)
..0 «
o o
0·67, r t I ( -1
o 5 10 15 20 25
FIGURE Z
Time (min)
Plot of chanRe in absorbance with time of 1:1 ~ixture of ~ 8.01 x lO-4M solutions o~ S-mcthyla-hydroxyquinoline and Fe(CIO,)-.
~ ~

OJ LJ C ro
..0 C-o tt>
..0 ro 01 0 -'
0·15.--.
0·10
~~
.0-05
o 50 100
Time (min.) ---->
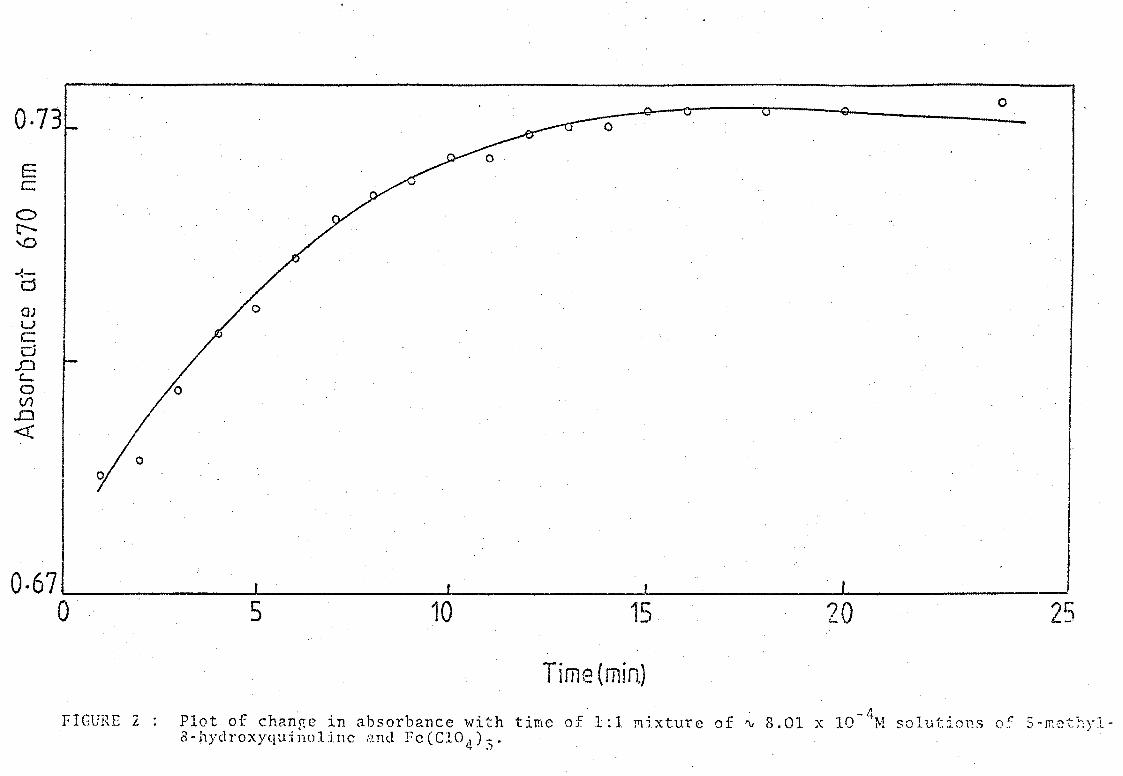
FIGURE 3 Plot of the log of absorbance at 670 nm against time of the I: I mixture of S-methyl-
. 8-hfdroxyquinol~ne an~ Fe(Cl04l 3".fter reaching maXlmum colour IntensIty.
14.
colour was attained approximately twenty minutes after mixing. Thereafter
decomposition appeared to follow first order kinetics over the first b~o-
hour period (Figure 3). The rate of decomposition was 3.9 x 10- 4
absorbance units per minute over this period. Thus over the brief time
required to take a reading decomposition could be regarded as negligible.
All subsequent readings were taken t\{enty minutes after mixing. Similar
plots of absorbance against time were made for complexes of each of the
methyl homologues of 8-hydroxyquinoline as well as for that of 8-hydroxy
quinoline itself. The green complexes were found to behave similarly and
to be relatively stable. The complex formed by 2-methyloxine was
exceptional in ~hat the green colour began to disappear almost immediately
after mixing .
(iii) Effect of changing the ionic strength.
7.025 g (0.5 mole) of sodium perchlorate was added to 100 ml of a 1 : 1
mixture of iron(lll) and 5-methyloxine. As expected, the pH and absorbance
of the mixture were both altered greatly by the change in ionic strength,
confirming that it would thus be necessary to maintain this constant
throughout all the subsequent experiments This could be achieved by
making up all solutions in perchloric acid of a constant, knO\~ strength,
and by the appropriate addition of sodium perchlorate.

CHAPTER IV
JOB OJRVES
CHAPTER IV
JOB OJRVES
15.
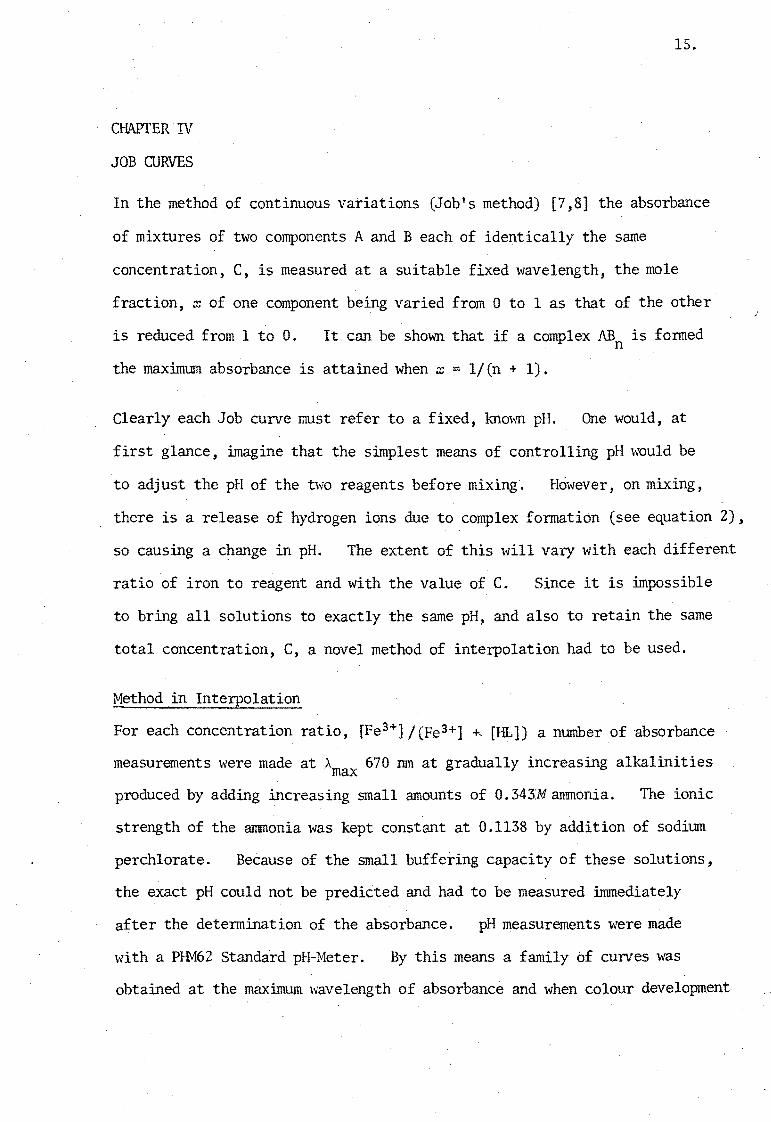
In the method of continuous variations (Job's method) (7,8] the absorbance
of mixtures of two components A and B each of identically the same
concentration, C, is measured at a suitable fixed wavelength, the mole
fraction, x of one component being varied from 0 to 1 as that of the other
is reduced from 1 to O. It can be shov.'ll that if a complex ABn is fonned
the maximum absorbance is attained when x = l/(n + 1).
Clearly each Job curve must refer to a fixed, knOv.'ll pH. One would, at
first glance, imagine that the simplest means of controlling pH would be
to adjust the pH of the two reagents before mixing. However, on mixing,
there is a release of hydrogen ions due to complex formation (see equation 2),
so causing a change in pH. The extent of this will vary with each different
ratio of iron to reagent and with the value of C. Since it is impossible
to bring all solutions to exactly the same pH, and also to retain the same
total concentration, C, a novel method of interpolation had to be used.
Method in Interpolation
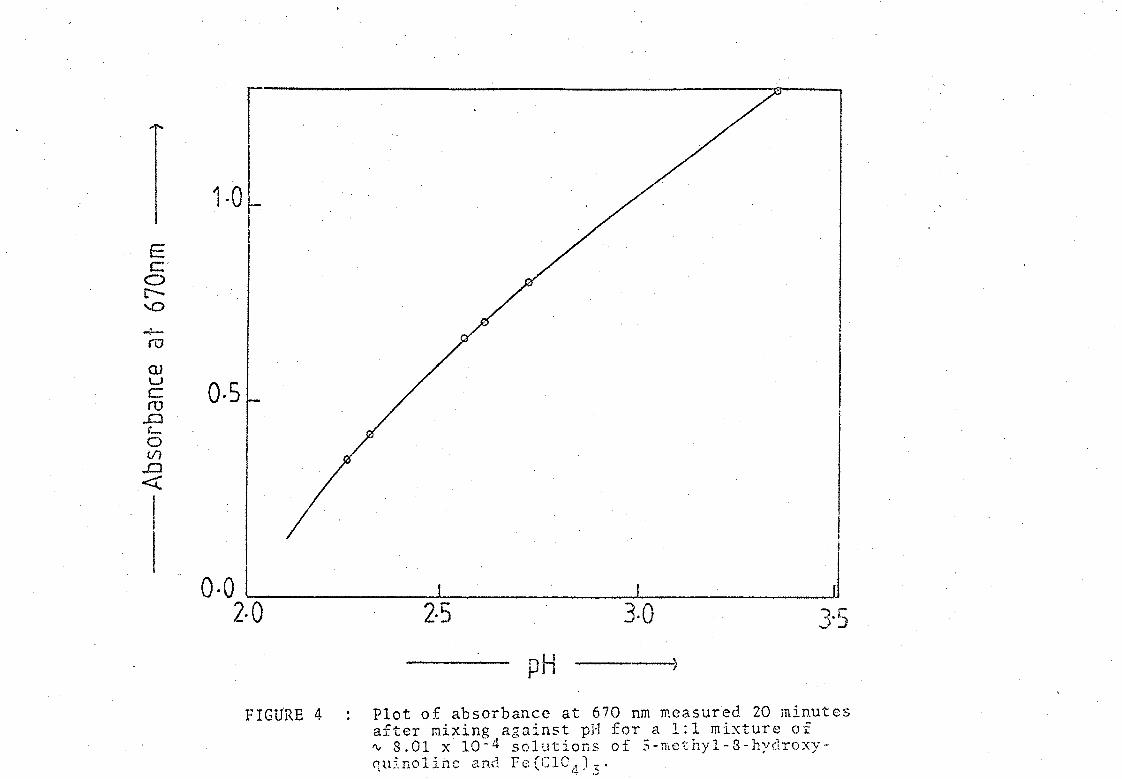
For each concentration ratio, [Fe 3+]/(Fe3+] ~ [Hb]) a nuw~er of absorbance
measurements were made atA 670 nm at gradually increasing alkalinities max produced by adding increasing small amounts of 0.343:M ammonia. The ionic
strength of the ammonia was kept constant at 0.1138 by addition of sodium
perchlorate. Because of the small buffering capacity of these solutions,
the exact pH could not be predicted and had to be measured immediately
after the determination of the absorbance. pH measurements were made
with a PHM62 Standard pH-Meter. By this means a family bf curves was
obtained at the maximum \vavelength of absorbance and when colour development
E c
0 c--'-D
.....}-
ro
OJ u c ro
..,.C) L-a VI
.,.Cl
<C
I
1·0
0·5
0-0 2-0
FIGU'RE 4
2·5 3·0 3-5
pH --'--1
Plot of absorbance at 670 nm measured 20 minutes after mixing against pH for a 1:1 mixture of ~ 8.01 x 10- 4 solutions of 5-mcthyl-B-hydroxyquinoline and Fe(CICn)~'
~ ~
~
I I i I
QJ o.J u I r-0-
ro ... CJ c.... 0 (/)
.D <C
Q.2r 0
0
! I
I
2-4· 2-6
pH --..... --.-------~ _ 3+ 3+ o r 1"' e ] / ( [F e ] + [HL ]) = O. 6
3+ ~+ Q) [Fe ]/([Fe.)) + [EL]) = 0.2
FIGURE 5 l)lot ot':': V':'ll·:l"""l.-J.'on o·f '11"'Ol'1J"11C" -:.1- (;','0 ]'f'll '.']'-i-;~ "'J'1 ,Cr'I' ? (·lir·r:r.l·C·1~- ~-"'-:-~O<) of _ (), w <.1. A (. ",t .... ') "\. '-" .:t. \,., \,' " ! • *.,.. .. \. .1 l'}' .. \.. ~ ,.l...l........ J. I.... ,~- ... -- ..... ...
fFe 3+]/([Fe 3+] -I- [IlL)). ( To avoitl confusion on].y 2: sets :;rc shO·":ll).
16.
no longer increased :one curve for each molar ratio of iron to ~igand
thus relating the variation in absorbance to pH. An example of one of
these curves is shown in Fil?,ure 4, and the appearance of other such sets
is shown in Figure S.
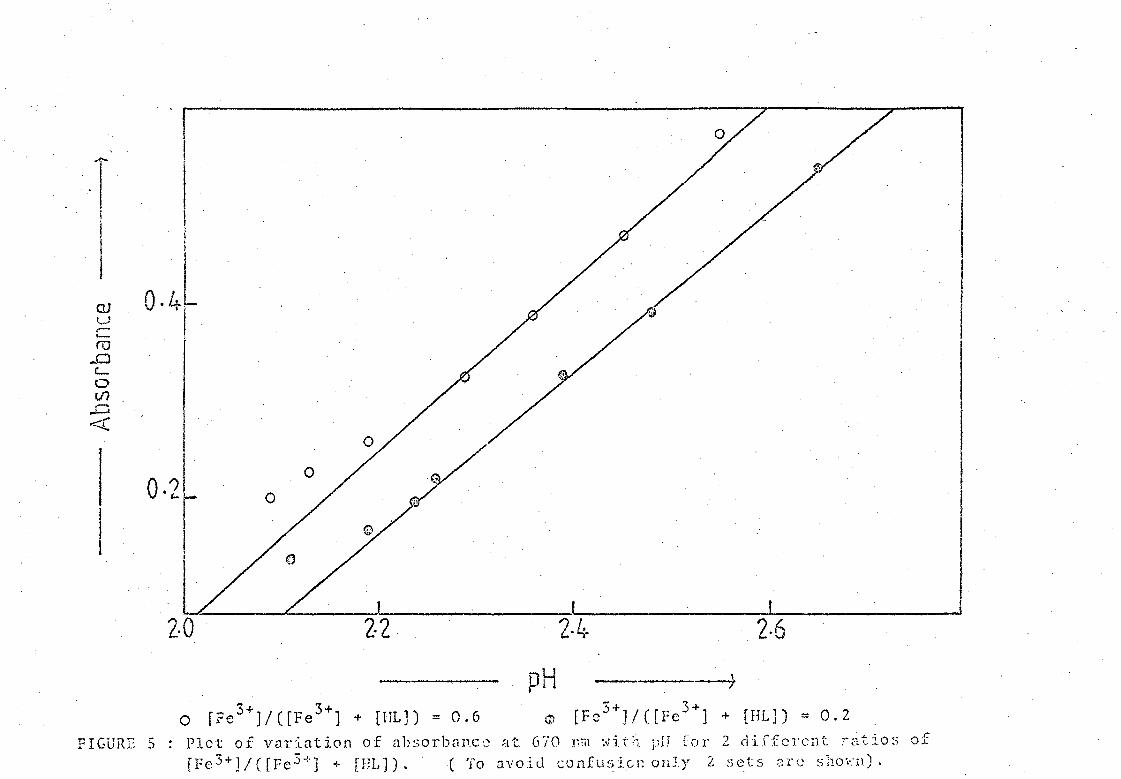
From these curves it was a simple matter to interpolate the absorbancies
corresponding to any arbitrarily chosen pH for each mixture of reagents
of known molar ratio, thereby providing the required data for a series of
Job's curves. (See Table 1). The complete set of results for all these
measurements are given in Tables 2-8 in the experimental section. Two
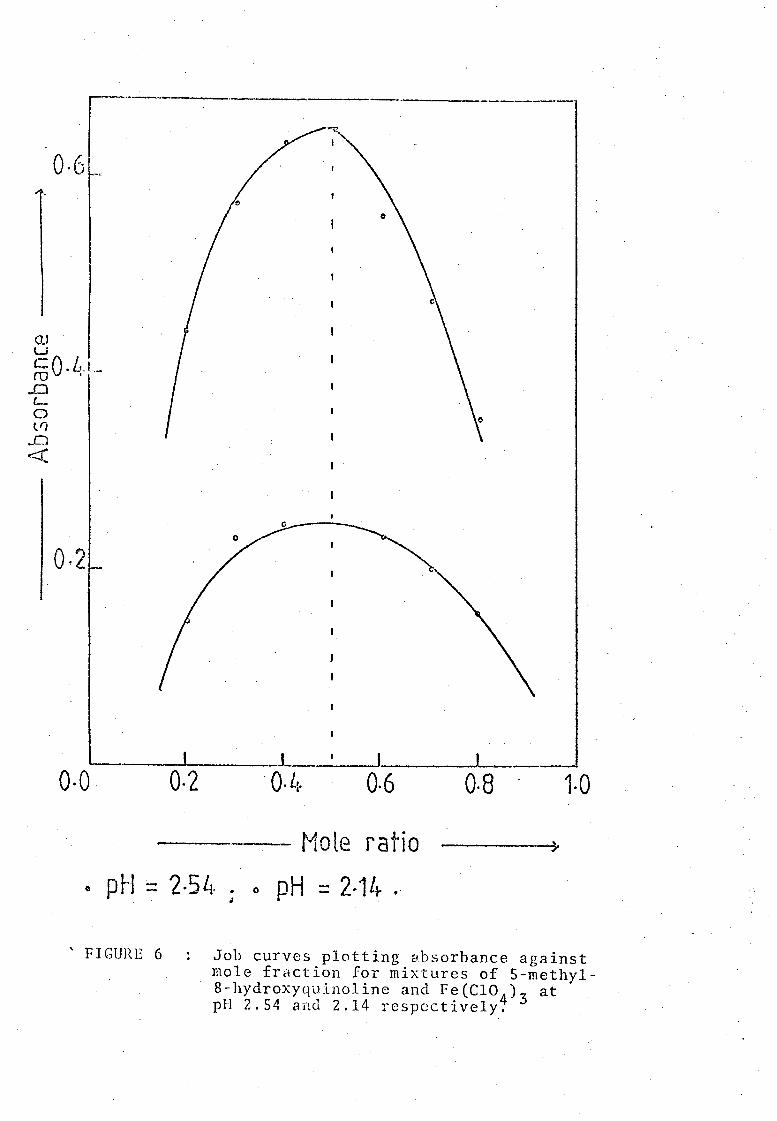
such Job's curves for pH 2.14 and 2.54 are shrnvn in Figure 6.
In each case a maximum was attained for the mole fraction 0.5. This
proved conclusively that the complex formed had the 1 : 1 composition
corresponding to the formula Fe(S-methyloxine)2+ If the formula of the
complex had been Fe(S-methyloxine)~ the maximum of the curve would have
come at the mole ratio 0.33. This was obviously not the case.
· ,------'------0·6' ~"
OJ Li
CO·L"L_ ro . ..0 Co Vi
.D <C
0·2
0·0
'~ ,
0·2 0·4. 0·6 0·8 1-0
---- Mole ratio
e pH::: '2·5 4· ; 0 pH = 2 ·1 l1o .-
, FIGURE 6 Job curves plotting absorbance against mole fraction for mixtures of 5-methyl-8-hydroxyquinoline and Fe(CI0
4)3 at
pH 2.54 and 2.14 respectively.
17.
EXPERIMENTAL
Solutions of iron perchlorate (8.0119 x 10- 4M) and 5-methyl-8-hydroxyquino
line (8.0119 x 10⁻⁴M) were mixed in varying proportions to a total volume
of 20 ml. The amounts of ammonia sho,vU in the tables were introduced
with a pipette, and the solutions'were made up to 25 ml with glass
distilled water. Absorbance measure~ents were taken in a 4 an quartz
cell at 670 nm twenty minutes after initial mixing and the pH "vas measured
aftenvards. Each of the following tables refers to a particular value of
the ratio [Fe3+] / ([Fe 3+] + [HL]).
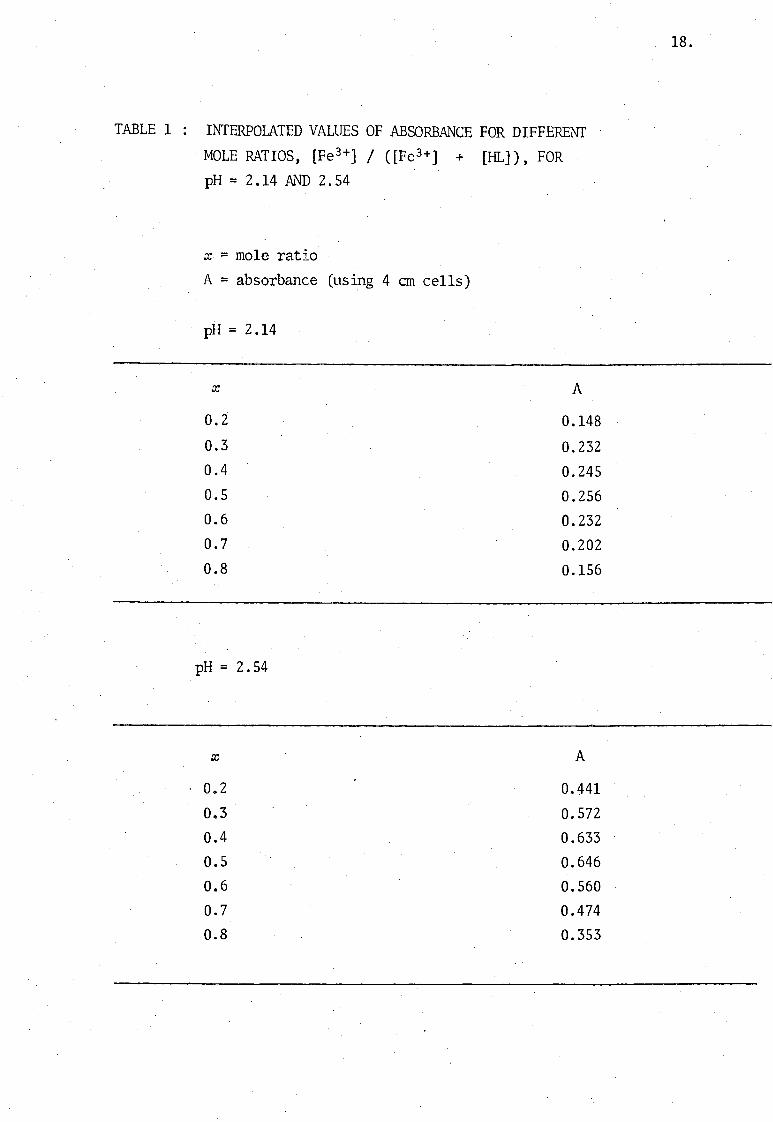
TABLE 1 INTERPOLATED VALUES OF ABSORBANCE FOR DIFFERENT
MOLE RATIOS, [Fe 3+] / ([Fe 3+] + [HL]), FOR
pH = 2.14 AND 2.54
x = mole ratio
A = absorbance (using 4 em cells)
pH = 2.14
x A
0.2 0.148
0.3 0.232 0.4 0.245 0.5 0.256 0.6 0.232 0.7 0.202 0.8 0.156
pH = 2.54
x A
0.2 0.441
0.3 0.572 0.4 0.633
0.5 0.646
0.6 0.560
0.7 0.474 0.8 0.353
18.

TABLES 2 - 8 EXPERIMENTAL RESULTS FOR DIFFERENT VALUES OF TI-ffi MOLAR
RATIO [Fe3+]f([Fe3+] + [t:L]) = 0.2
TABLE 2 [Fe3+]/([Fe3+] + [HL]) = 0.2
16 m1 of ligand solution:
4 m1 of Fe3+ solution
Volume of ammonia Absorbance pH
added / mI.
3.60 0.536 2.65
3.55 0.391 2.48
3.50 0.324 2.39
3.45 0.218 2.26
3.40 0.195 2.24
3.35 0.166 2.19
3.30 0.137 2.11
TABLE 3 : [Fe3+]f([Fe3+] + [HL]) = 0.3
14 ml of ligand solution
6 ml of Fe3 solution
Volume of ammonia Absorbance pH
added / m1
3.60 0.703 2.66
3.55 0.553 2.52
3.50 0.472 2.43
3.45 0.303 2.26
3.40 0.278 2.22
3.30 0.207 2.07
19.
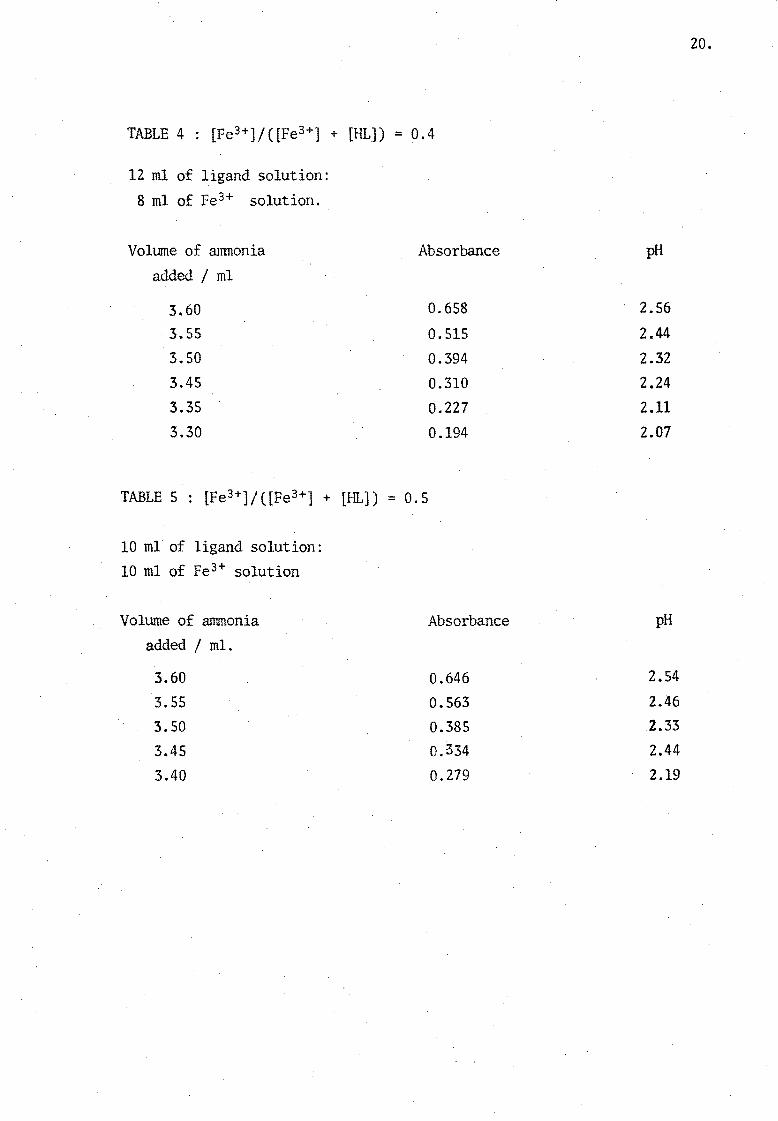
TABLE 4 : [Fe3+] / ([Fe3+] + [HL]) = 0.4
12 ml of ligand solution: 8 ml of Fe 3+ solution.
Volume of runmonia Absorbance
added / rnl
3.60 0.658
3.55 0.515 3.50 0.394 3.45 0.310 3.35 0.227 3.30 0.194
TABLE 5 : [Fe3+]/([Fe3+] + [HL]) = 0.5
10 ml of ligand solution: 10 ml of Fe 3+ solution
Volume of ammonia
added / mI.
3.60 3.55 3.50 3.45 3.40
Absorbance
0.646 0.563 0.385 0.334
0.279
20.
pH
2.56
2.44
2.32 2.24 2.11
2.07
pH
2.54
2.46 _2.33
2.44 2.19
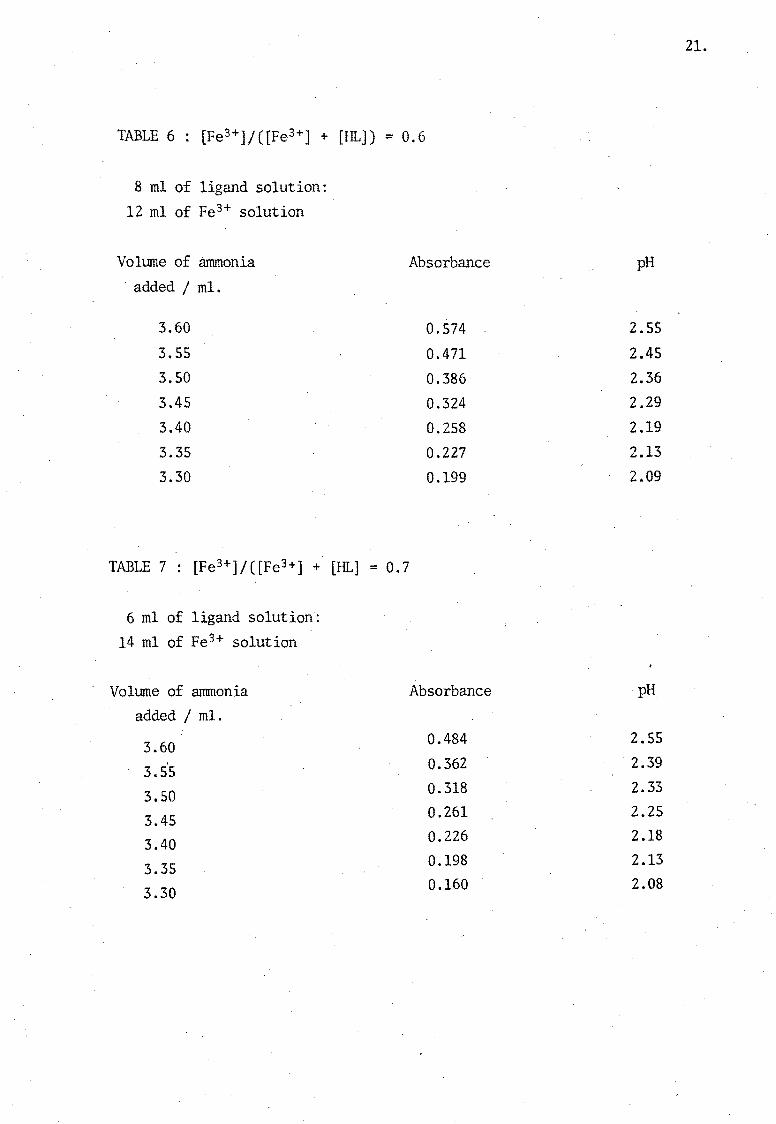
TABLE 6 : [Fe3+] / ([Fe3+] + [HL]) = 0.6
8 ml of ligand solution:
12 ml of Fe 3+ solution
Volume of ammonia Absorbance
added / mI.
3.60 0.574
3.55 0.471
3.50 0.386
3.45 0.324
3.40 0.258
3.35 0.227
3.30 0.199
TABLE 7 : [Fe3+]/([Fe3+] + [HL] = 0.7
6 ml of ligand solution:
14 ml of Fe3+ solution
Volume of ammonia
added / mI.
3.60
3.55
3.50
3.45
3.40
3.35
3.30
Absorbance
0.484
0.362
0.318
0.261
0.226
0.198
0.160
pH
2.55
2.45
2.36
2.29
2.19
2.13
2.09
pH
2.55
2.39
2.33
2.25
2.18
2.13
2.08
21.
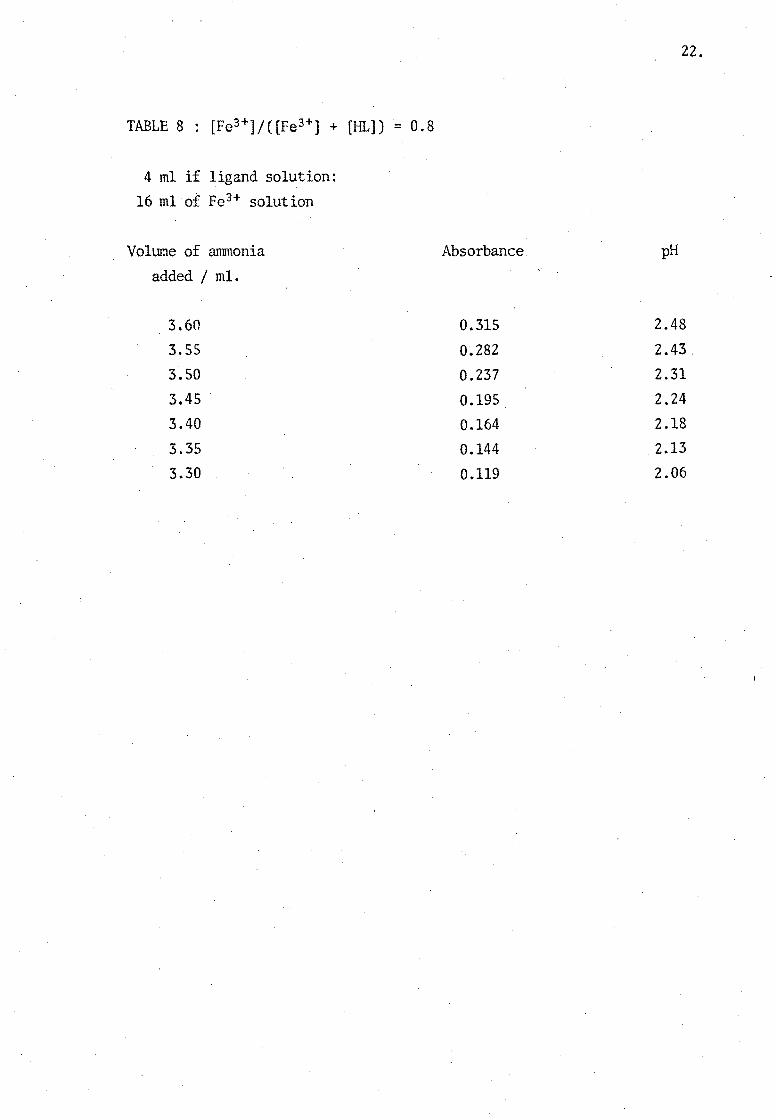
TABLE 8 : [Fe3+]/C[Fe3+] + [HL]) = 0.8
4 m1 if ligand solution:
16 m1 of Fe3+ solution
Volume of ammonia
added / mI.
3.60
3.55
3.50 3.45 .
3.40
3.35
3.30
Absorbance.
0.315
0.282
0.237
0.195
0.164
0.144
0.119
22.
pH
2.48
2.43.
2.31
2.24
2.18
2.13
2.06
CHAPTER V
THE FIRST AND SECOND THERf'lDDYNAMIC DISSOCIATION
CONSTANTS OF THE LIGAND ACID

23.
01APTER V
THE FIRST AND SECOND THERMODYNAMIC DISSOCIATION CONSTfu~TS OF THE LIGAND ACID.
In order to calculate values of {Ox-} needed for substitution in equation
(1) it is necessary to determine the first and second acid dissociation
constants of the ligand acid H20x+
In the equilibria
-H+
+ H+
OH 08
+ (H20x ) (HOx) (Ox-)
or T T . Kl,Ox K
+ 2,Ox -H20x ,
HOx Ox
we define
{H+}{HJx} (aH+) [HOx]fo KT = = (3) 1 ,Ox + + {H29x } 1rI20x Jf1
and {H+}{Ox-} + -
T (aH [Ox ]f1 KZ Ox = = ,
{HOx} (4) [HOx]fo
24.
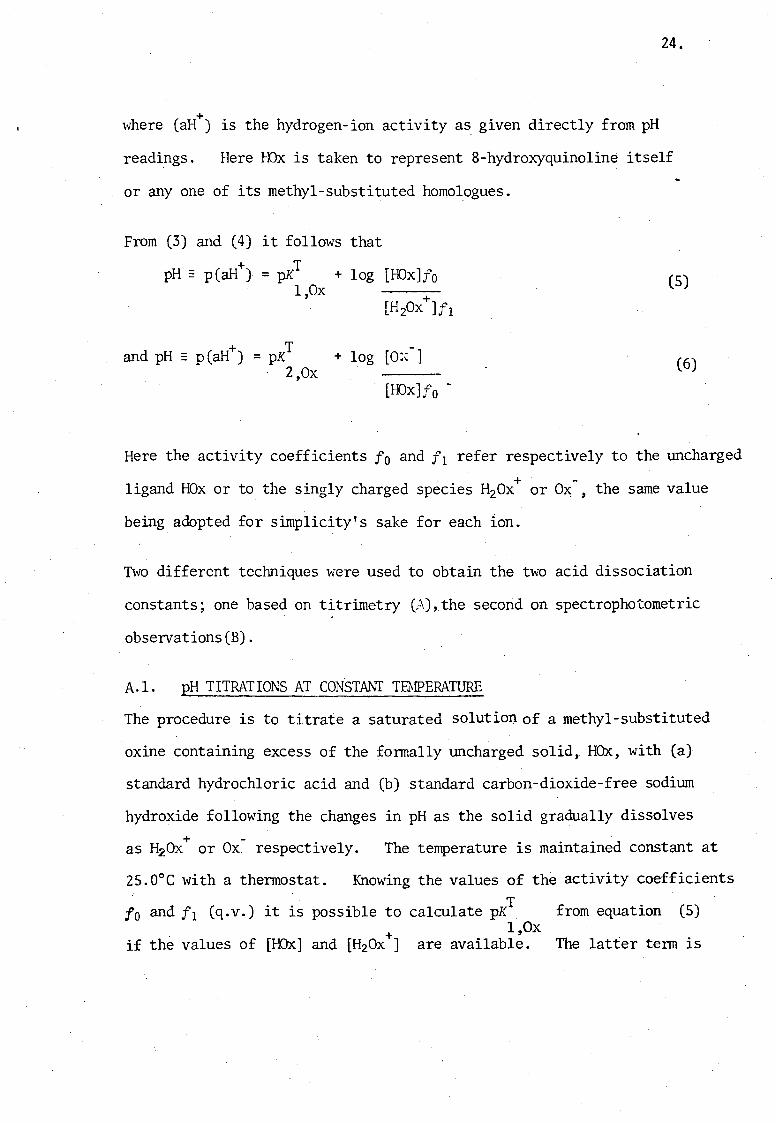
+ where (aH ) is the hydrogen-ion activity as given directly from pH
readings. Here rDx is taken to represent 8-hydroxyquinoline itself
or anyone of its methyl-substituted homologues.
From (3) and (4) it follows that
+ T pH :: p (aH ) = pK I,Ox
+ T and pH :: p(aH ) = pK 2,Ox
+ log [illx]fo +
[HzOx ]f1
+ log [O:~ -]
[I--Dx]fo -
(5)
(6)
Here the activity coefficients fo and f1 refer respectively to the uncharged
ligand HOx or to the singly charged species H20x+ or O~-, the same value
being adopted for simplicity's sake for each lone
1'\vo different techniques were used to obtain the two acid dissociation
constants; one based on titrimetry (.r'\) ,.the second on spectrophotometric . .
observations(B).
A.I. pH TITRATIONS AT CONSTANT TBIPERATURE
The procedure is to titrate a saturated solution of a methyl-substituted
oxine containing excess of the formally uncharged solid, HOx, with (a)
standard hydrochloric acid and (b) standard carbon-dioxide-free sodium
hydroxide following the changes in pH as the solid gradually dissolves + -as H2 0x or Ox respectively. The temperature is maintained constant at
25.0° C with a thermostat. Knowing the values of the acti vi ty coefficients T
fo and f1 (q.v.) it is possible to calculate pK . from equation (5) + 1,Ox
if the values of [HOx] and [H20x] are available. The latter term is
25.
assumed to be equivalent to the concentration of acid added and
. [HOx] will be constant throughout and equal to the solubility of the
formally uncharged ligand acid - since the solution remains saturated
throughout.
Similar pKT follows from equation (6) and a knowledge of the 2,Ox
magnitude of [Ox-] which is taken to be equal to the concentration of alkali
added.
The first step is therefore to determine the solubility of the uncharged
species [HOx] at the temperature of measurement.
. A. 2. DET~~INATION OF SOLUBILITIES
The solubilities in water of 2-, 5-, and 7-methyl-8-hydroxyquinolines were
determined by the analysis of saturated aqueous solutions. This was
to be carried out by bromination (by bromate in the presence of excess
bromide), a method previously used for the determination of oxine itself
and a number of its metal complexes, notably aluminium tris-oxinate,
Al (Ox) 3'
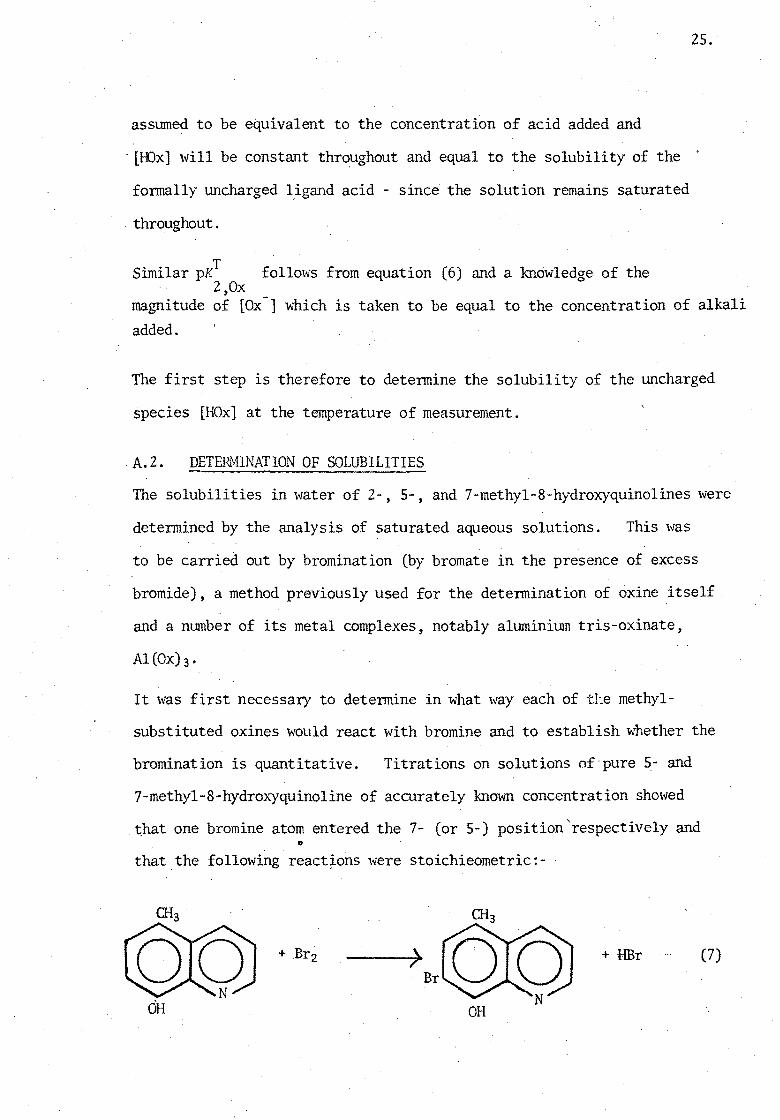
It \\"as first necessary to determine in what way each of :the methyl-
substituted oxines would react with bromine and to establish whether the
bromination is quantitative. Titrations on solutions of . pure 5- and
7-methyl-8-hydroxyquinoline of accurately known concentration showed
that one bromine atom entered the 7- (or 5-) position'respectively and
that.the following react~ons were stoichieometric:-
> + HEr
Br
OH OH
(7)
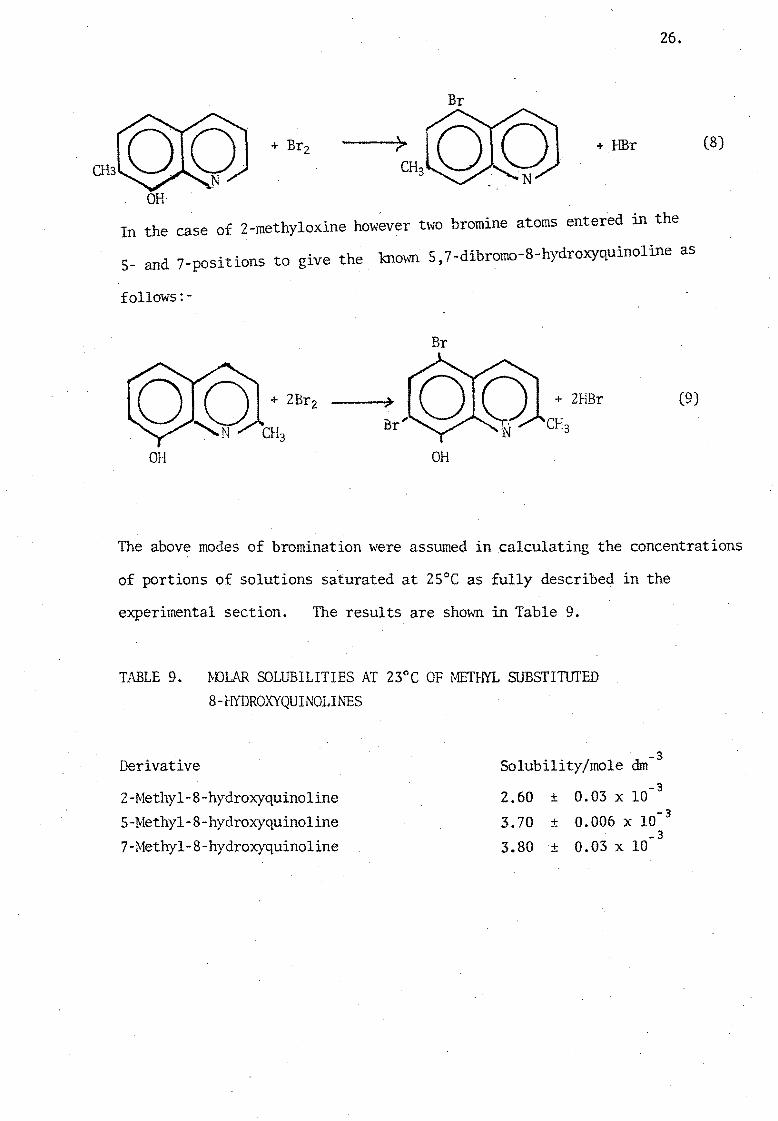
26.
Br
+ HBr (S)
OR
In the case of 2-methyloxine however two bromine atoms entered in the
.' to gl've the knmm 5,7-dibromo-8-hydroxyquinoline as 5- and 7-posltlons
follows:-
Br
+ 2HBr (9)
OH OH
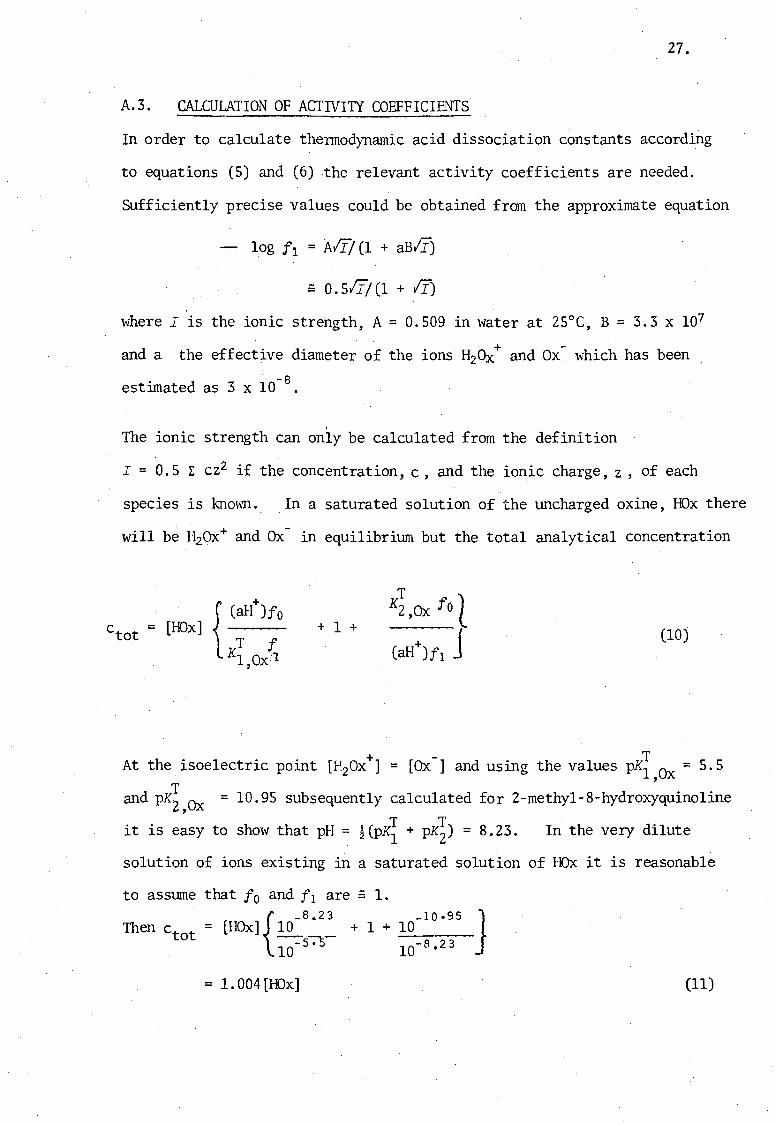
The above modes of bromination were assumed in calculating the concentrations
of portions of solutions saturated at 25°C as fully described in the
experimental section. The results are shown in Table 9.
TABLE 9. MJLAR SOLUBILITIES AT 23°C OF METHYL SUBSTITIITED 8:- I-lYDROXYQU I NOL I l'.'ES
Derivative
2 -l'v1ethyl-S-hydroxyquinoline
S-Methyl-S-hydroxyquinoline 7-Methyl-S-hydroxyquinoline
Solubility/mole dm-3
2.60 ± 0.03 x 10⁻³
3.70 ± 0.006 x 10- 3
_3 3.80 ± 0.03 x 10
27.
A. 3. CALCULATION OF ACTIVITI COEFFICIENTS
In order to calculate thermodynamic acid dissociation constants according
to equations (5) and (6) the relevant activity coefficients are needed.
Sufficiently precise values could be obtained from the approximate equation
- log f1 = Alii (1 + aBII)
== 0.55/(1 + If)
where I is the ionic strength, A = 0.509 in \"ater at 25°C, B = 3.3 X 10⁷
and a the effective diameter of the ions H2Ox+ and Ox- which has been
estlinated as 3 x 10-s.
. The ionic strength can only be calculated from the definition
I = O. 5 ~ cz2 if the concentration, c, and the ionic charge, z ,of each
species is kno~n. In a saturated solution of the uncharged oxine, HOx there
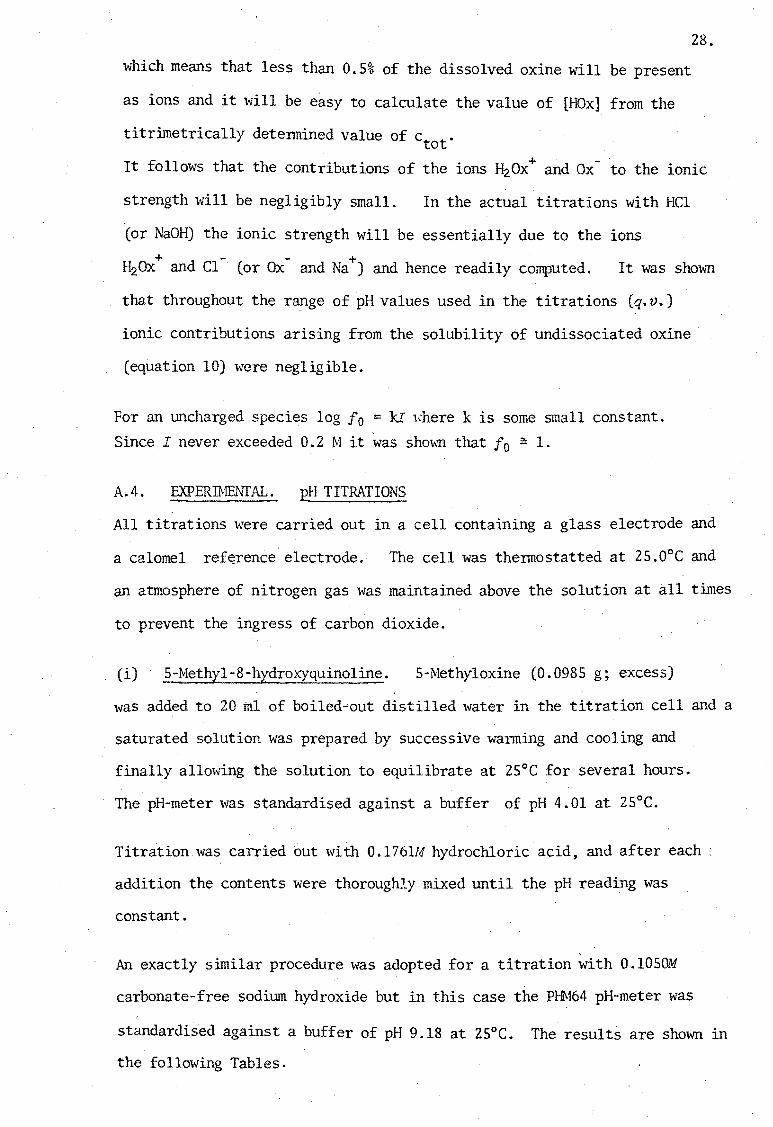
will be H20x+ and Ox- in equilibrium but the total analytical concentration
= [HOx] {
(aH+)fo
T f Kl Ox.1 ,
+ 1 + (10)
At the isoelectric point [H20x+] = [Ox-] and using the values pKi,ox = 5.5
and PK~,ox = 10.95 subsequently calculated for 2-methyl-8-hydroxyquinoline T T it is easy to show that pH = ~(pKl + pK2) = 8.23. In the very dilute
solution of ions existing in a saturated solution of HOx it is reasonable
to assume that fa and fl are == 1.
Then Ctot = [HOx]{lO-S~~ + 1 + 10-10
•95 J
10-5.~ 10- 8 • 23
= 1.004[HOx] (11)
which means that less than 0.5% of the dissolved oxine will be present
as ions and it will be easy to calculate the value of [HOx] from the
titrimetrically determined value of c . tot
28.
It follows that the contributions of the ions HzOx+ and Ox- to the ionic
strength will be negligibly small. In the actual titrations with HCl
(or NaOH) the ionic strength will be essentially due to the ions + - - + HzOx and Cl (or Ox and Na ) and hence readily computed. It was shown
that throughout the range of pH values used in the titrations (q.v.)
ionic contributions arising from the solubility of undissociated oxine
(equation 10) were negligible.
For an uncharged species log fo c kI where k is some small constant.
Since I never exceeded 0.2 M it was sho\\1l1 that fo :: 1.
A.4. EXPERIMENTAL. E,H TITRATIONS
All titrations were carried out in a cell containing a glass electrode and
a calomel ref~rence electrode. The cell was thermostatted at 2S.0°C and
an atmosphere of nitrogen gas was maintained above the solution at all times
to prevent the ingress of carbon dioxide.
(i) i-Methyl-8-hydroxyquinoline. S-Methyloxine (0.0985 g; excess)
was added to 20 ml of boiled-out distilled water in the titration cell and a
saturated solution was prepared by successive Walining and cooling and
finally allowing the solution to equilibrate at 25°C for several hours.
The pH-meter was standardised against a buffer of pH 4.01 at 25°C.
Titration was carried out with 0.1761M hydrochloric acid, and after each:
addition the contents were thoroughly mixed until the pH reading was
constant.
An exactly similar procedure was adopted for a titration with 0.105OM
carbonate-free sodium hydroxide but in this case the PHM64 pH-meter was
standardised against a buffer of pH 9.18 at 25°G. The results are shown in
the following Tables.

TABLE 10.
Observation
1
2
3
4
5
6
7 8
9
10
TABLE 11.
Observation
20
21 22
23 24
25
26
27
29.
PH READINGS FOR TITRATION OF 0.0985 g 5-METIf'(L-8-
HYDROXYQUINOLINE WITH 0.1761M HC1 AT 25°C
Volume of HC1/m1 pH Observation Volume of HC1/ml
0.00 6.04 11 1.55
0.02 5.70 12 1.60
0.05 5.70 13 2.00 0.10 4.91 14 2.30
0.15 4.63 IS 2.80 0.20 4.46 16 3.30 0.30 4.25 17 3.50
0.60 3.92 18 3.70
1.00 3.69 19 3.80 • 1.50 3.63
PH REI\DINGS FOR TITRATION OF 0.0901 g ·5-ME'THYL-8-HYDRO:x.'Y
QUINOLINE WIlli 0.1050M NaOH AT 25°C.
Volume of HCL/m1 pH Observation Volume of HC1/m1
0.00 6.31 28 2.45
0.05 9.59 29 3.45
0.10 10.21 30 4.65 0.15 10.35 31 5.85 0.25 10.64 32 7.15 0.40 10.85 33 8.35
0.65 11.09 34 9.55 .
1.45 11.38 35 10.22
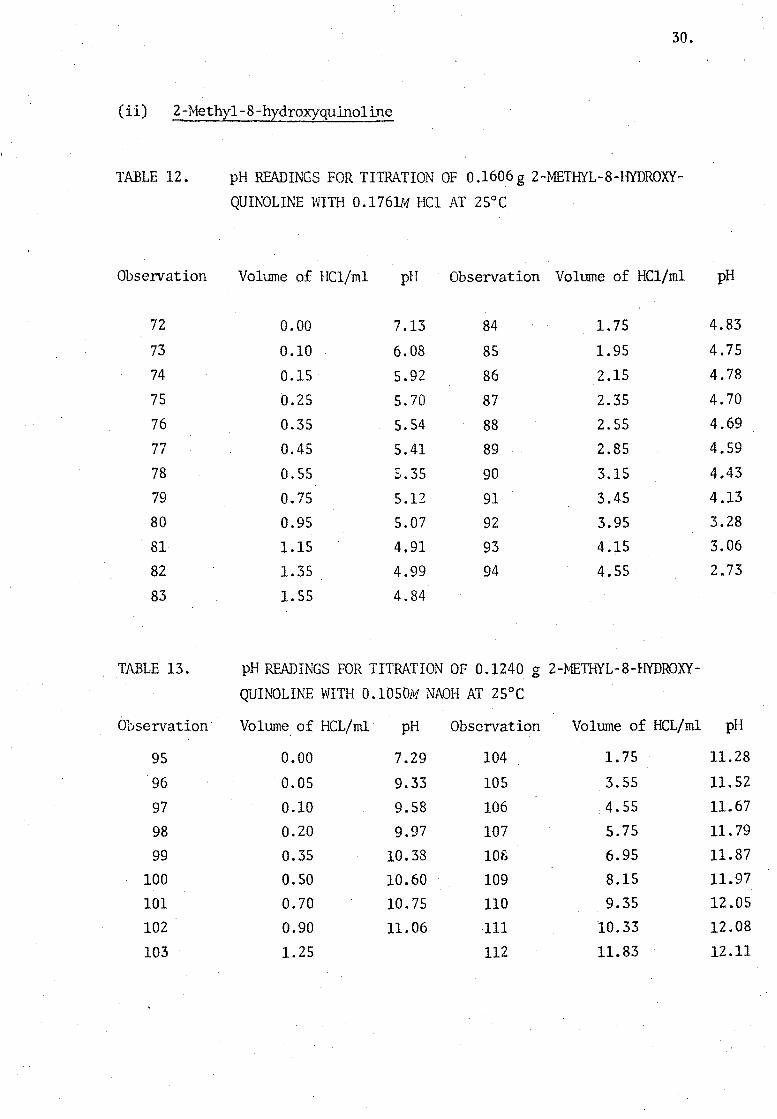
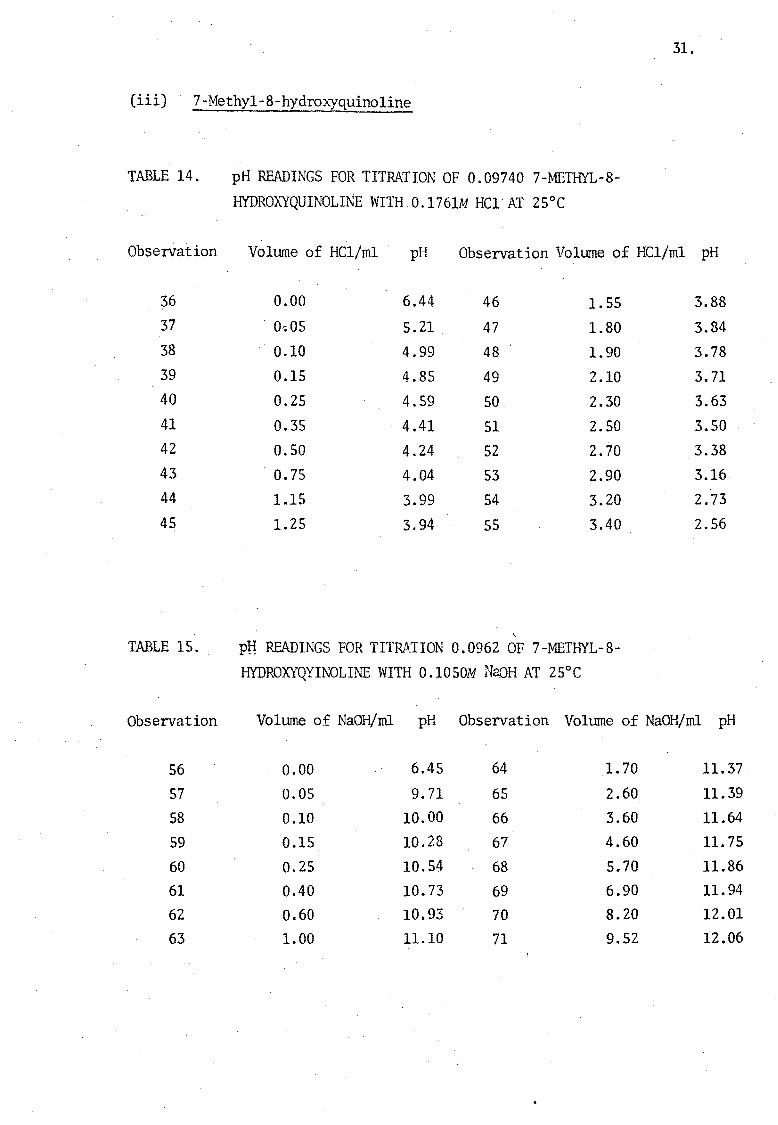
An identical procedure was adopted with Cii) 2-methyl-8-hydroxyquino1ine
and (iii) 7-methyl-8-hydroxyquinoline giving the results summarised in
Tables 12, 13, 14 and 15.
pH
3.59
3.57
3.48 3.42
3.35
3.09
2.78
2.57 2.50
pH
11.60
11.73 11.81 11.90
11.96 12.01
12.05 12.06
30.
(ii) 2-Methyl-8-hydroxyquino1ine
TABLE 12.
Observation
72
73
74
75
76
77
78
79
80
81
82
83
TABLE 13.
Observation·
95
96
97 98
99 100
101 102
103
pH READINGS FOR TITRATION OF 0.1606 g 2-METHYL-8-HYDROXY
QUINOLINE WITH 0.1761M HC1 AT 25°C
Volume of HC1/m1 pH Observation Volume of HC1/m1
0.00 7.13 84 1. 75
0.10 6.08 85 1.95
0.15 5.92 86 2.15
0.25 5.70 87 2.35
0.35 5.54 88 2.55
0.45 5.41 89 2.85
0.55 5.35 90 3.15
0.75 5.12 91 3.45
0.95 5.07 92 3.95
LIS 4.91 93 4.15
1.35 4.99 94 4.55
1.55 4.84
pH READINGS FOR TITRATION OF 0.1240 g 2-METHYL-8-HYDROXY-
QUINOLINE WITH O.1050M NAOH AT 25°C
Volume of HCL/ml pH Observation Volume of HCL/m!
0.00 7.29 104 1. 75
0.05 9.33 105 3.55
0.10 9.58 106 4.55
0.20 9.97 107 5.75
0.35 10.38 lOS 6.95
0.50 10.60 109 8.15
0.70 10.75 110 9.35
0.90 11.06 111 10.33
1.25 112 11.83
pH
4.83
4.75
4.78
4.70
4.69
4.59
4.43
4.13
3.28
3.06
2.73
pH
11.28
11.52
11.67
11.79
11.87 11.97 12.05 12.08
12.11
31.
(iii) 7-Methyl-8-hydroxyquino1ine
TABLE 14. pH READINGS FOR TITRATION OF 0.09740 7-METHYL-8-
HYDROXYQUINOLINE WITH 0.1761M He1 AT 25°C
Observation Volume of HC1/m1 pH Observation Volume of HC1/ml pH
36 0.00 6.44 46 1. 55 3.88 37 . 0,.05 5.21 47 1.80 3.84 38 0.10 4.99 48 1.90 3.78 39 0.15 4.85 49 2.10 3.71 40 0.25 4.59 50 2.30 3.63 41 0.35 4.41 51 2.50 3.50 42 0.50 4.24 52 2.70 3.38 43 0.75 4.04 53 2.90 3.16 44 1.15 3.99 54 3.20 2.73 45 1.25 3.94 55 3.40 2.56
, TABLE 15. pH READINGS FOR TITRATION 0.0962 OF 7-METHYL-8-
HYDROXYQYINOLI:r-.~ WITH 0.1050M NaoH AT 25°C
Observation Volume of NaOH/ml pH Observation Volume of NaOH/ml pH
56 0.00 6.45 64 1. 70 11.37
57 0.05 9.71 65 2.60 11.39
58 0.10 10.00 66 3.60 11.64
59 0.15 10.28 67 4.60 11. 75
60 0.25 10.54 68 5.70 11.86
61 0.40 10.73 69 6.90 11.94
62 0.60 10.93 70 8.20 12.01
63 1.00 11.10 71 9.52 12.06
32.
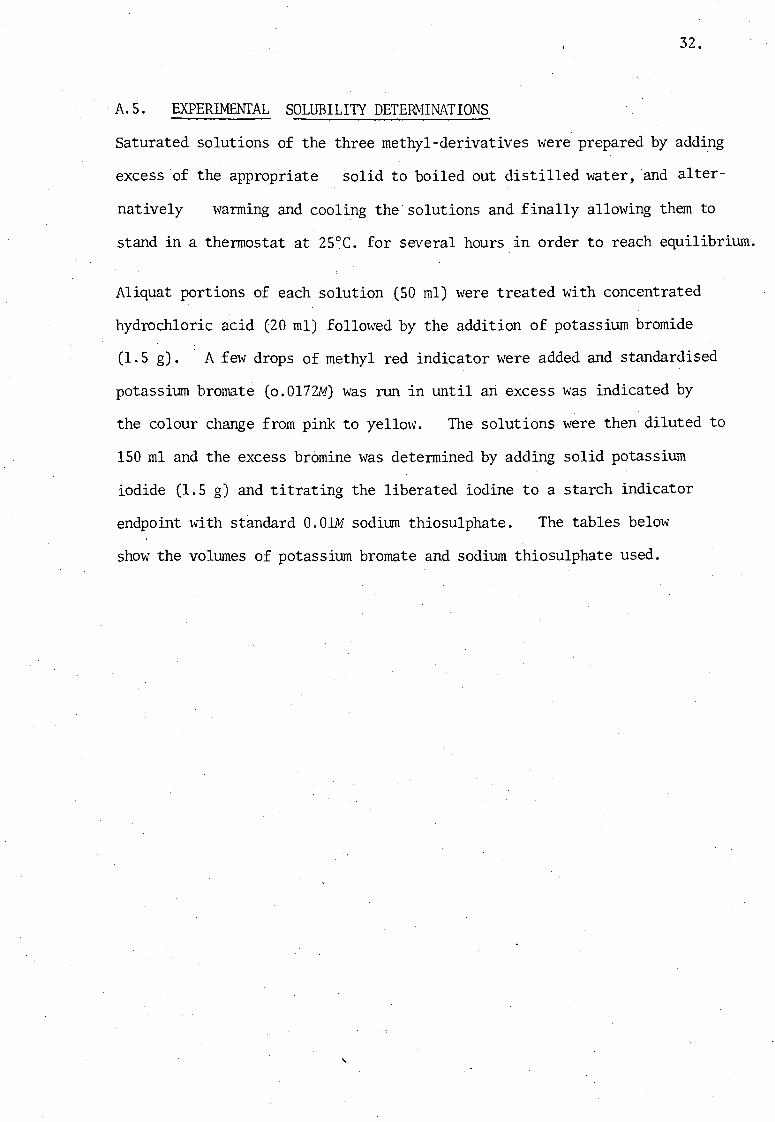
A. 5. EXPERIMENTAL SOLUBILITY DETERrvlINATIONS
Saturated solutions of the three methyl-derivatives were prepared by adding
excess of the appropriate solid to boiled out distilled ''later, 'and alter-
natively warming and cooling the solutions and finally allowing them to
stand in a thermostat at 25°C. for several hours in order to reach equilibrium.
Aliquat portions of each solution (50 ml) were treated with concentrated
hydrochloric acid (20 ml) followed by the addition of potassium bromide
(1.5 g). A few drops of methyl red indicator were added and standardised
potassium bromate (o.0172M) was run in until an excess was indicated by
the colour change from pink to yellow. The solut ions ''lere then diluted to
150 ml and the excess bromine was determined by adding solid potassium
iodide (1.5 g) and titrating the liberated iodine to a starch indicator
endpoint with standard O.OlM sodium thiosulphate. The tables below
show the volumes of potassium bromate and sodium thiosulphate used.
,
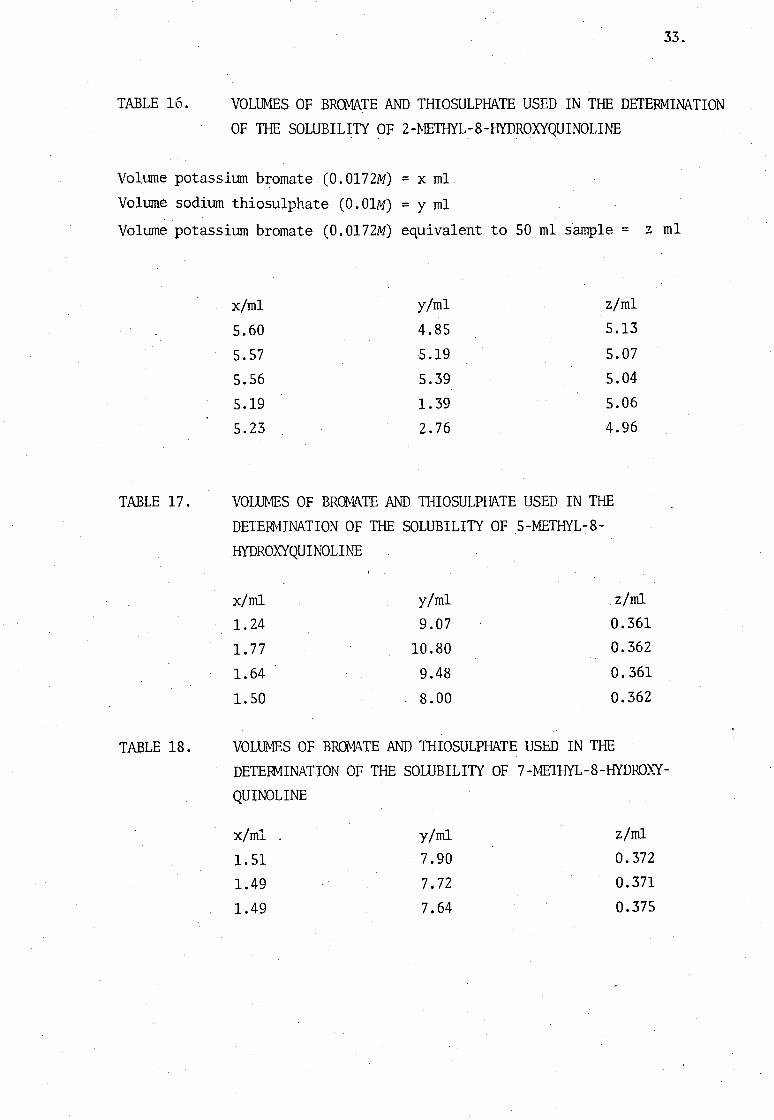
TABLE 16.
33.
VOLUMES OF BROMATE AND THIOSULPHATE USED IN THE DEI'ERt'1INATION
OF THE SOLUBILITY OF 2-METHYL~8-HYDROXYQUINOLINE
Vo1lwe potassium bromate (0.0172M) = x m1
Volume sodium thiosu1phate (O.OlM) = Y m1
Volume potassium bromate (0. 0172M) equivalent to 50 m1 sample = z m1
TABLE 17.
TABLE 18.
x/m1 y/m1 z/m1
5.60 4.85 5.13
5.57 5.19 5.07
5.56 5.39 5.04
5.19 1.39 5.06
5.23 2.76 4.96
VOLUMES OF BROMATE AND TI-IIOSULPHATE USED IN THE
DETERt'vIiNATION OF THE SOLUBILITY OF 5-METHYL-8-
.HYDROXYQUINOLINE
x/m1 y/m1 z/ml
1. 24 9.07 0.361
1. 77 10.80 0.362
1.64 9.48 0.361
1. 50 8.00 0.362
VOLUMES OF BROMATE AND TI-IIOSULPHATE USED IN THE
DETERMINATION OF THE SOLUBILITY OF 7-METHYL-8-HYDROx~
QUINOLINE
x/ml y/m1 z/ml
1. 51 7.90 0.372
1.49 7.72 0.371
1.49 7.64 0.375
34.
From the above results the mean volumes of potassium bromate (0.Ol72M)
which are equivalent to 50 ml aliquot portions of 2-, 5- and
7-methyloxines were calculated to be 5.05 ± 0.06, 0.36 ±" 0.001 and
37 ± 0.003 ml respectively. From equations (7), and (9) it can be
seen that one mole of bromine reacts with one mole of both 5-methyloxine
and 7-methyloxine, and that 2 moles of bromine react ,..!ith one mole of
2-methyloxine. Since bromine is rele.ased from bromate in the following
\\13.y :
- + + 5 Br x 6H ~ 3Br2 +
The solubility of each methyl derivatiye may be calculated in moles
per litre. These results are sur.iliarized in Table 9 above.
35.
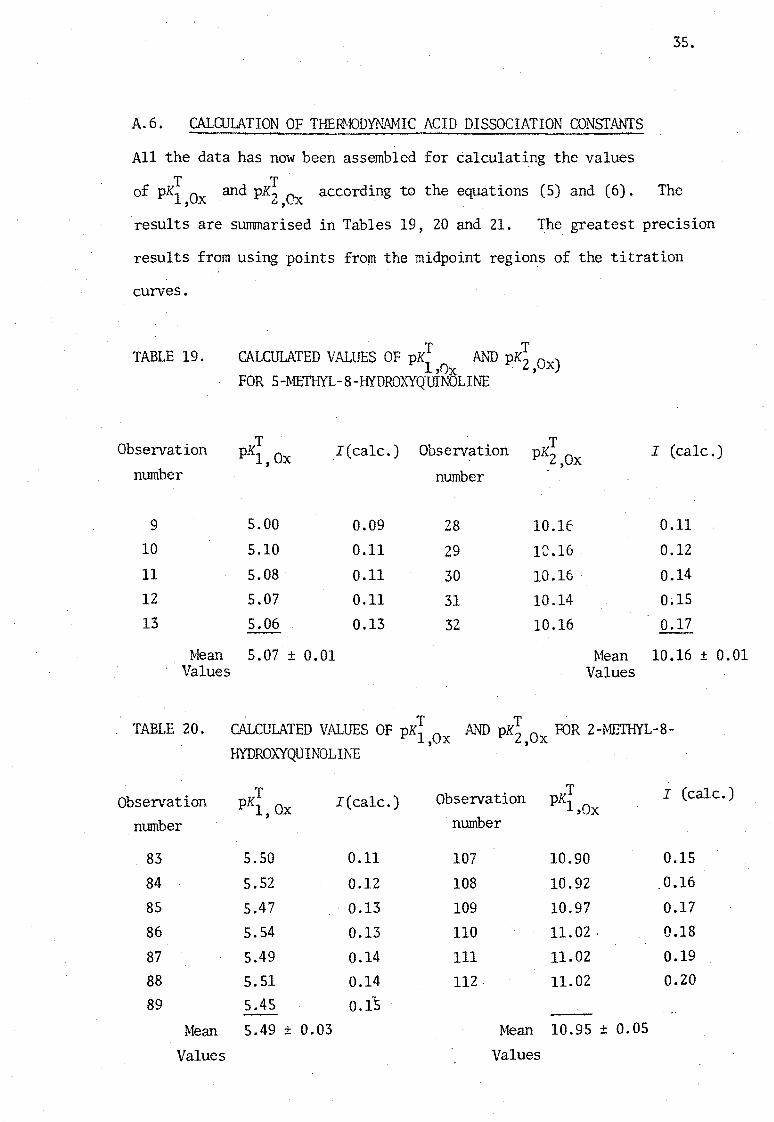
A.6. CALCULATION OF THERMODYNAMIC ACID DISSOCIATION CONSTANTS
All the data has now been assembled for calculating the values T T of pK1 0 and pK~~, according to the equations (5) and (6). The
, x (., " .. :A
results are summarised in Tables 19, 20 and 21. The greatest precision
results from using points from the midpoint regions of the titration
curves.
TABLE 19. . T T
CALCULATED VALUES OF pK1· M'D pK2 Ox) ,()x ,
FOR 5-METHYL-8-HYDROXYQlJINOLINE
Observation T I(ca1c.) Observation T I (calc.) pK1,Ox pK2,Ox number number
9 5.00 0.09 28 10.1E 0.11 10 5.10 0.11 29 12.16 0.12 11 5.08 0.11 30 10.16 0.14 12 5.07 0.11 31 10.14 0.15 13 5.06 0.13 32 10.16 0.17
Mean 5.07 ± 0.01 Mean 10.16 ± 0.01 Values Values
TABLE 20. CALCULATED VALUES OF pKi,ox T .
AND pKZ ,Ox FOR 2-METHYL-8-HYDROXYQUINOLINE
Observation T I(ca1c.) Observation pKT I (calc.) pK1, Ox 1,Ox
mnnber . number
83 5.50 0.11 107 10.90 0.15
84 5.52 0.12 108 10.92 0.16
85 5.47 0.13 . 109 10.97 0.17
86 5.54 0.13 110 11. 02 . 0.18
87 5.49 0.14 111 11.02 0.19
88 5.51 0.14 112 11.02 0.20
89 5.45 0.15
Mean 5.49 ± 0.03 Mean 10.95 ± 0.05
Values Values
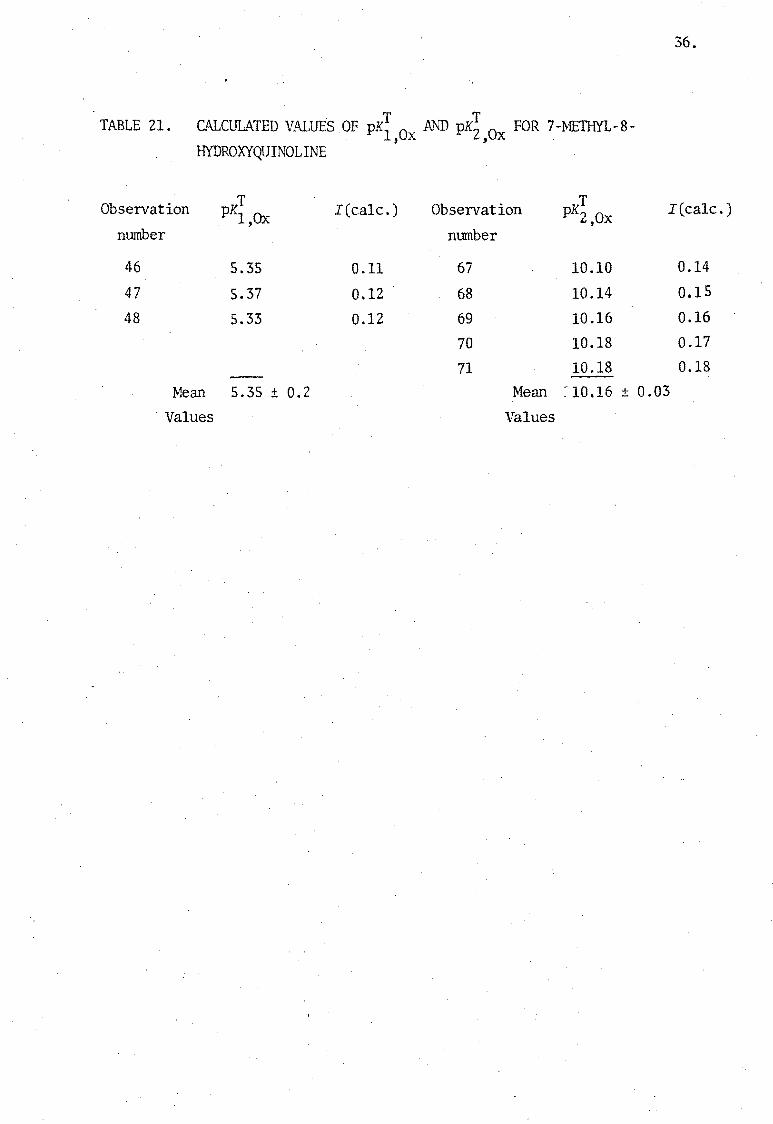
TABLE 21. CALCULATED VALUES OF pKI,ox Mrn PK~ ,Ox FOR 7 -IvIETHYL- 8-
HYDROXYQUINOLINE
Observation T I(ca1c.) Observation T
pK10x pKZ ,Ox ,
number number
46 5.35 0.11 67 10.10
47 5.37 0.12 68 10.14
48 5.33 0.12 69 10.16
70 10.18
71 10.18
36.
I(ca1c.)
0.14
0.15
0.16
0.17
0.18
Mean 5.35 ± 0.2 Mean ~ 10.16 ± 0.03
. Values Values
37.
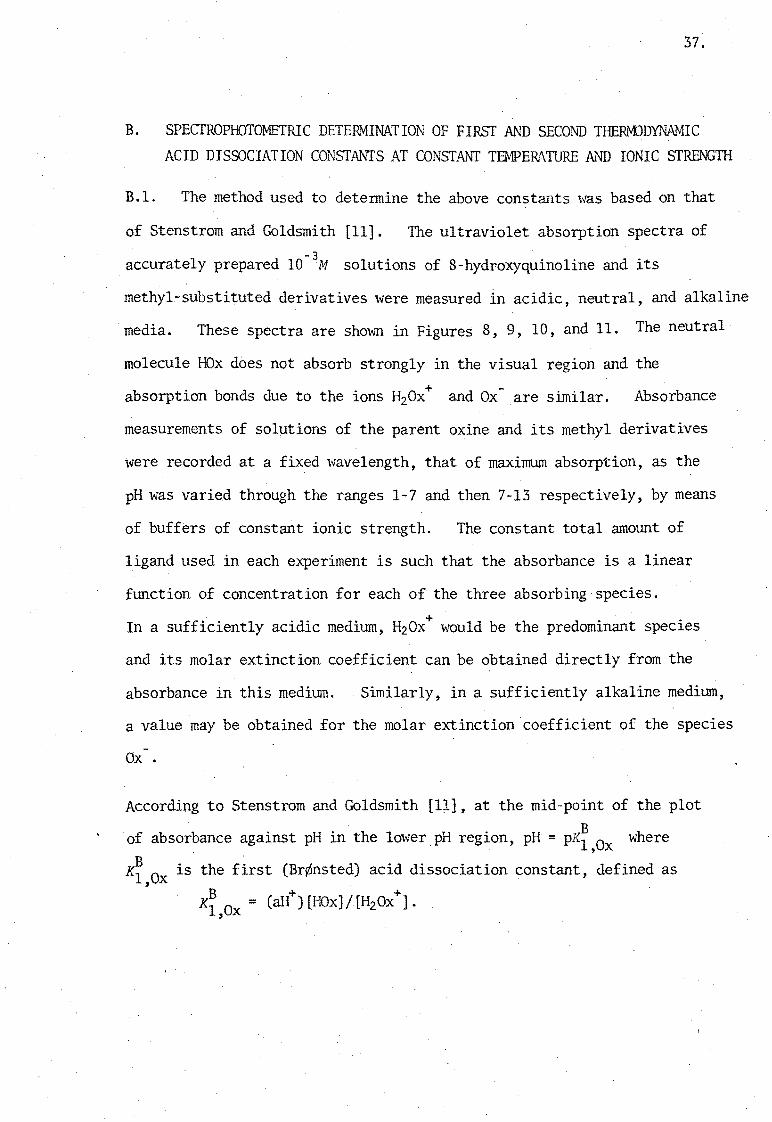
B. SPECTROPHOTOMETRIC DETERMINATION OF FIRST AND SECON~ THERMODYNAMIC ACID DISSOCIATION CONSTANTS AT CONSTANT TEMPERATURE AND IONIC STRENGTH
B.!. The method used to detennine the above constants 'vas based on that
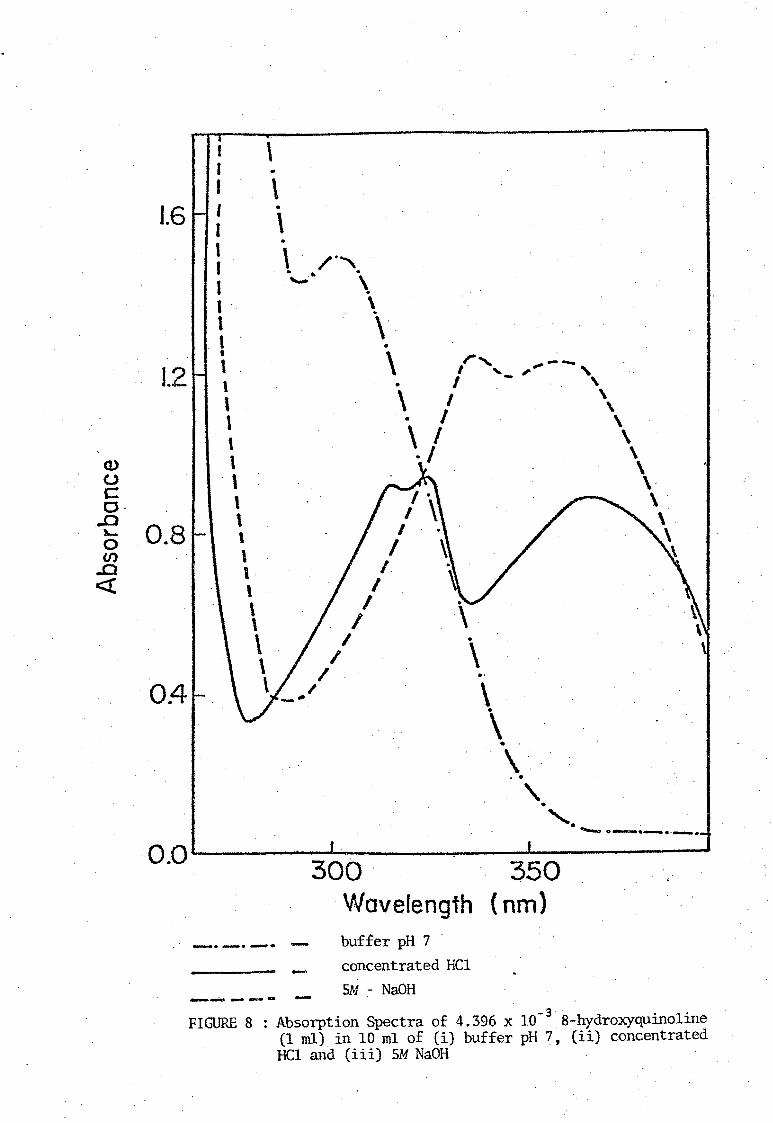
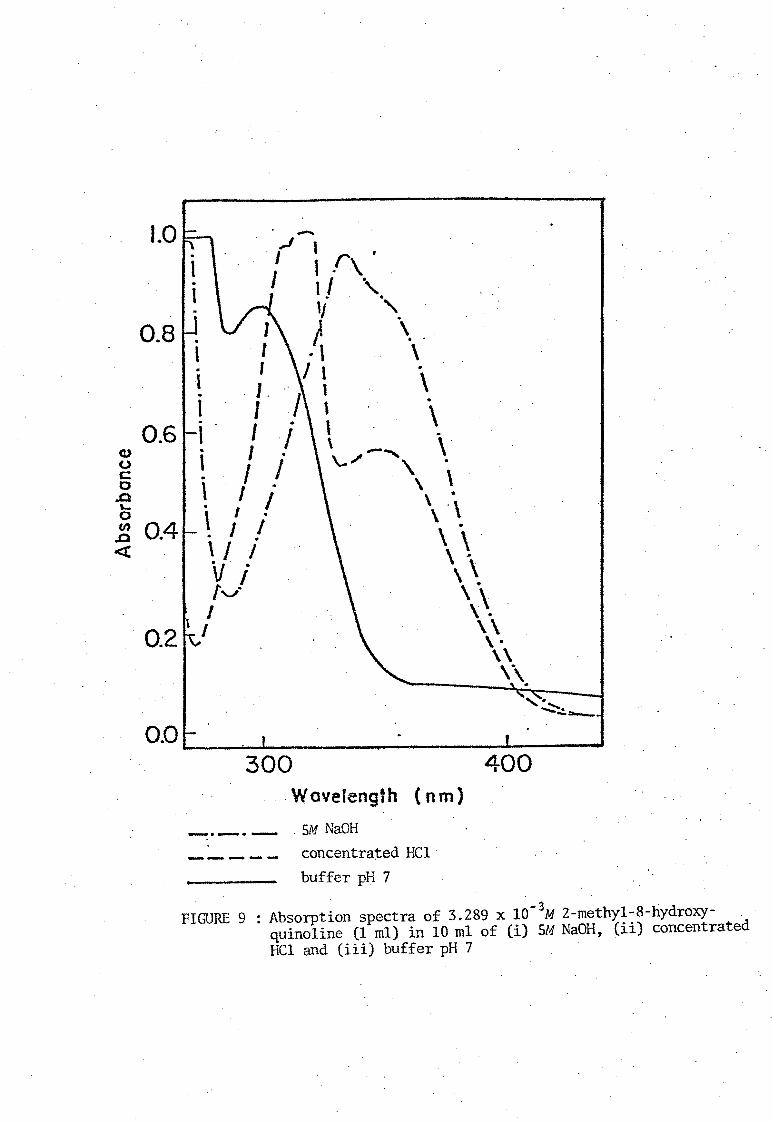
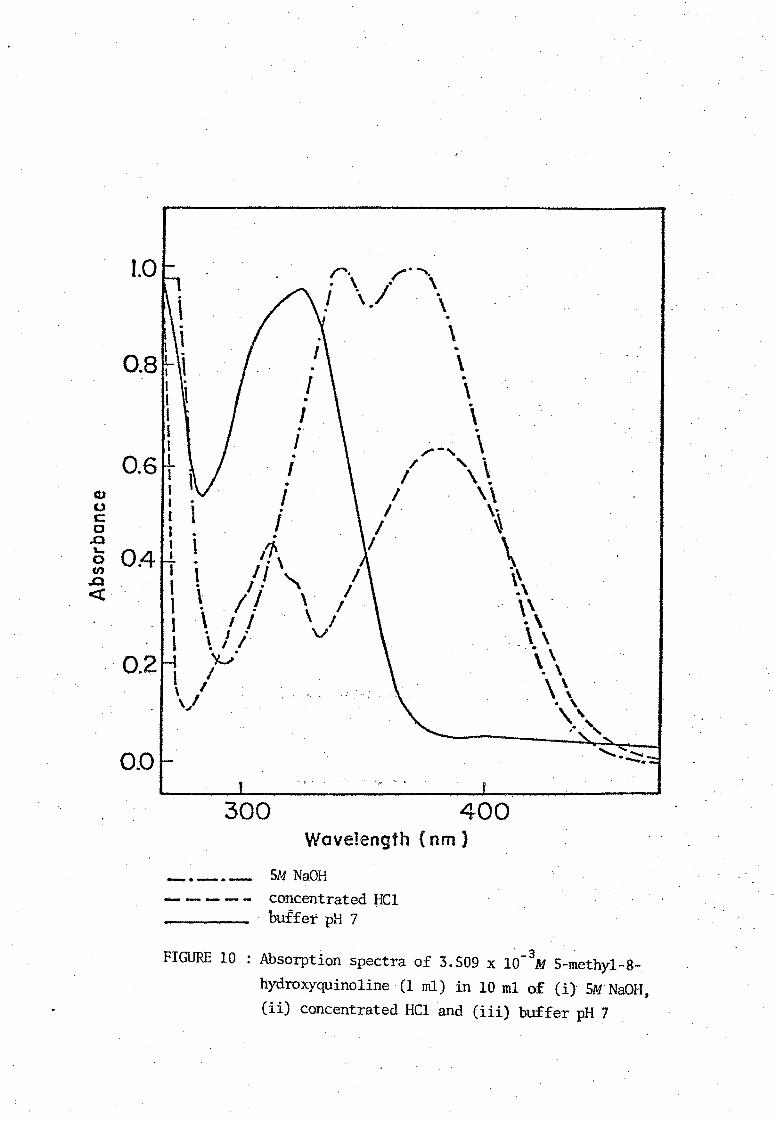
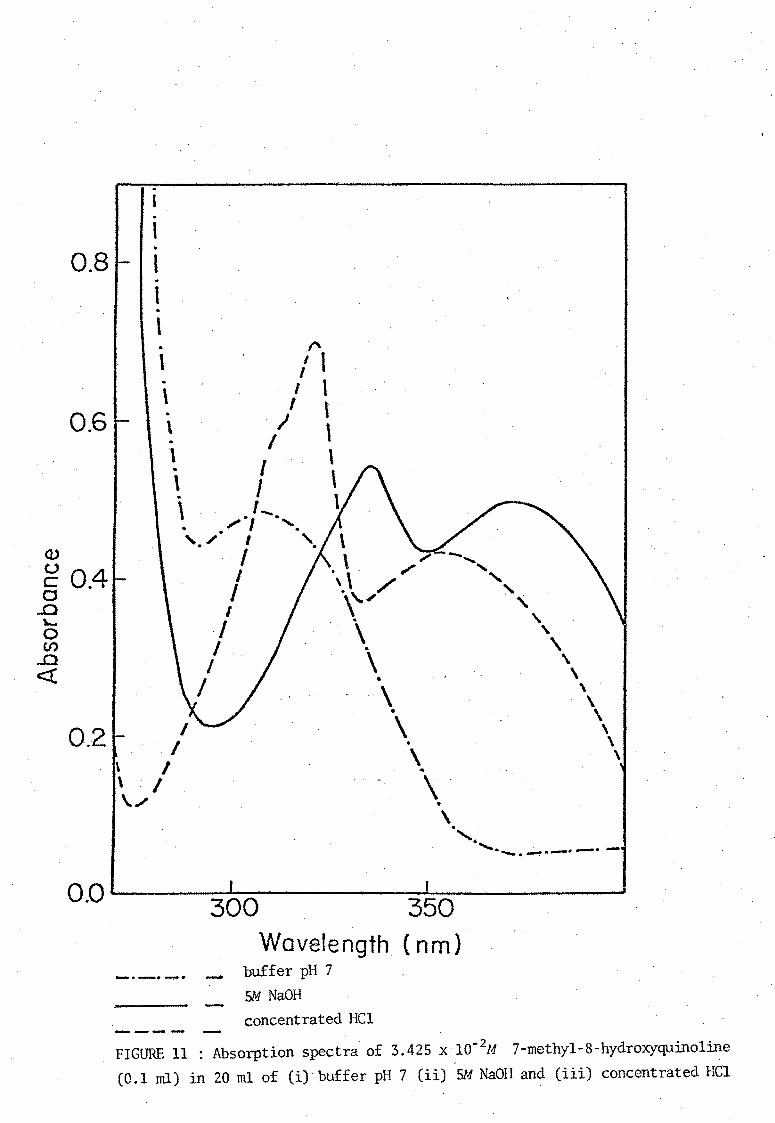
of Stenstrom and Goldsmith [11]. The ultraviolet absorption spectra of
accurately prepared 10-3M solutions of 8-hydroxyquinoline and its
methyl-substituted derivatives were measured in acidic, neutral, and alkaline
media. These spectra are shown in Figures 8, 9, 10, and 11. The neutral
molecule HOx does not absorb strongly in the visual region and the
absorption bonds due to the ions H20x+ and Ox- are similar. Absorbance
measurements of solutions of the parent oxine and its methyl derivatives
were recorded at a fixed wavelength, that of maximum absorption, as the
pH was varied through the ranges 1-7 and then 7-13 respectively, by means
of buffers of constant ionic strength. The constant total amount of
ligand used in each experiment is such that the absorbance is a linear
function of concentration for each of the three absorbing species.
In a sufficiently acidic medium, H20x+ would be the predominant species
and its molar extinction coefficient can be obtained directly from the
absorbance in this medium. Similarly, in a sufficiently alkaline medium,
a value may be obtained for the molar extinction coefficient of the species
Ox •
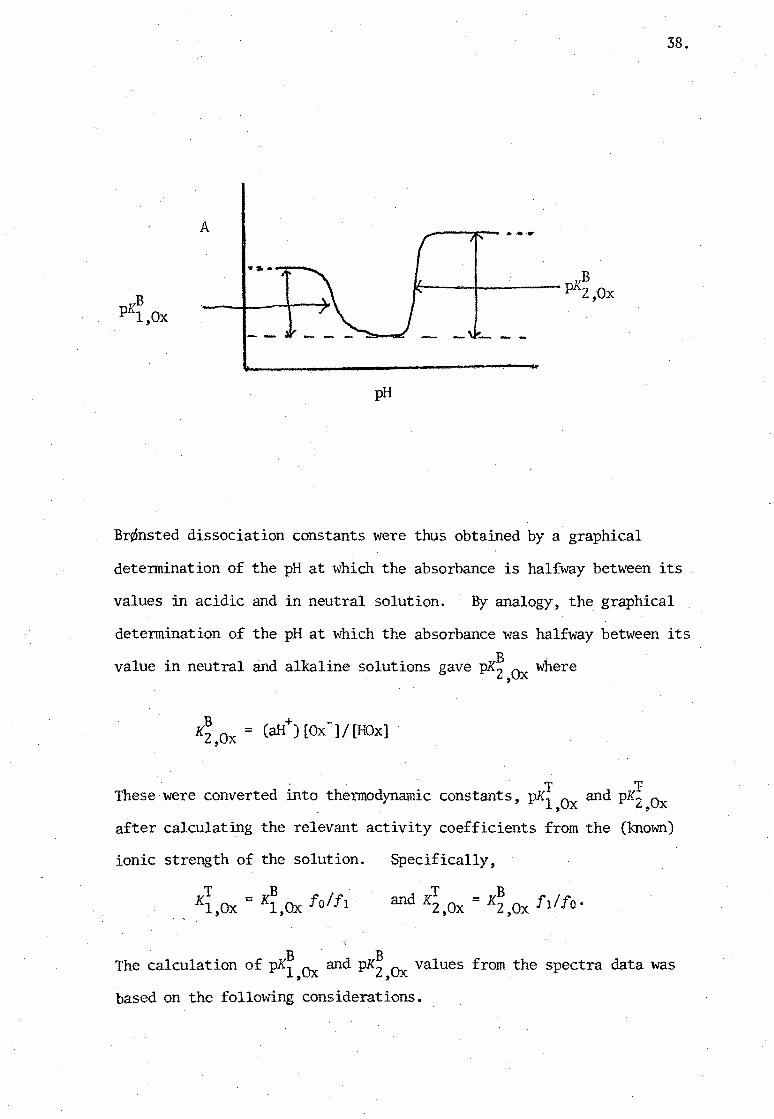
According to Stenstrom and Goldsmith [11], at the mid-point of the plot B of absorbance against pH in the lower pH region, pH = pKl,Ox where
X~ Ox is the first (Br¢nsted) acid dissociation constant, defined as , B + +
Xl,Ox = (aH )[HOx) l[H20x ].
Q) (,) c o·
..0 'o (J)
..a «
1.6
1.2
0.8
0.4
I I J I I I I I I . 1
. 1 , 1 1 , 1 , \ t ,
\ .. \ . \ • \ . /." . '... .
"",,' \ . \ . Y . \
r, ,. __ , '" , • I - , \ I' \\ . I \ \ / \ ./ \
\ \.
, I
~ I
\ \. \ \
\ / \ I \ I , I \ \ I \ I \ // --
. \ .. \ . \
•
\ . . , • ' .. ~o~ ......... __ •
o.o~------~------~--~--------~ 300' 350
........ ---- --..- .... Wavelength (nm) buffer pH 7 .
concentrated HCl SM :- NaOH
FIGURE 8 : Absorption Spectra of 4.396 x 10-38-hydroxyquinoline (1 ml) in 10 ml of Ci) buffer pH 7, (ii) concentrated HCl and (iii) SM NaOH
-,,.I'r · J
1· \ 11 \,. lj "
0.8 . I~ \. . I . \ \ . I 1 •
! I ' \ I \ . 0.6 1 . i \ \
g ! I i ,-"-... ,, \ o \ I A \ \
-e "I! \ .\ ~ 0.4 \ I I \\ .\ <t ~I i \"
V i \ \ {'J" \ •
I \\ \ . . 02 I \ \ . \ .
1.0
\\ \\.
,. ~.
0.0 --
~ __ ~~ __________________ -L------~
300
_ . ..-. -.-..
...... __ ...... -.
. Wavelength (n m)
. 5M NaOH concentrated HCl .
buffer pH 7
400
FIGURE 9 : Absorption spectra of 3.289 x 10⁻³M 2-rnethyl-8-hydroxyquinoline (1 rnl) in 10 rnl of (i) 5M NaOH, (ii) concentrated HCl and (iii) buffer pH 7
cu o c:: C .Q
"
r· / ....... , \ /a \ I \. . \
1.0
. . \ \ .
0.8 ~ \ \. I . , I 1 • I J \ 1 .~ • t I /_, \
0.6 ~ i ,/ '\ \ I i I \ \ I ° , \.
I I , .. ~
C5 0.4 (/)
I . , I \ . ~! I~\ I 1 1/" I \\ .Q
«
0.2
0.0
I \ 'i \ I .\ I .. /. \' \\\ . 1\ I I' . 1 \Ii v ._'-\
''l.J0 \. \
\ ,/,. \'\ ~ " .' .',
300 400 Wavelength (nm )
.......... __ .. 5M NaOH concentrated HC1 buffet pH 7
, -3 FIGURE 10 : Absorption spectra of 3.509 x 10 M 5~methy1-8-
hydroxyquinoline· (1 ml) in 10 m1 of (iJ 5M NaOH, (ii) concentrated HC1 and (iii) buffer pH 7
· I · 0.8 1 · t · I
/', I
. , 0.6
\ I 1 . I \ \ I . I \ \ \ . I \ ~ I \ \ I-. ,., ....... '. /. I \ - ..... Q)
u c 0.4
I I I
. \ . /'
'.\ /' " "-'" o
...a l-o U)
..0 «
0.2 I I
\ I \ . I \/
/
I I
I I
\'" \ . \ .. \
•
\ . \
~
\ • \
" \. , \
'\ \
\ \ \
\ \ \
0.0 -----=3~O:-:;::O:------~3~50-:::---------i
..... -.~. Wavelength (nm)
_ buffer pH 7
SM NaOH concentrated Hel
. FIGURE 11 : Absorption spectra of 3.425 x 10⁻²M 7-methyl-8-hydroxyquinoline (0.1 ml) in 20 ml of (i) buffer pH 7 (ii) 5M NaOH and (iii) concentrated Hel
A
pH
~--- "' .. '. B
It----I---~- pK2 ,Ox
38.
Br¢nsted dissociation constants were thus obtained by a graphical
detennination of the pH at which the absorbance is halfway between its
values in acidic and in neutral solution. By analogy, the graphical
detennination of the pH at which the absorbance was halfway between its B value in neutral and alkaline solutions gave pK2,Ox where
T 'V These were converted into thennodynamic constants, pKl 0 and pK':' 0 , x t., x
after calculating the relevant activity coefficients from the (known)
ionic strength of the solution. Specifically,
The calculation of PK~ Ox and PK~ Ox values from the spectra data was , , based on the following considerations.

Consider the general equilibrium
HOx
If c is the total concentration of the ligand in all its forms, and
EH20X ' EHOx and EOX are the molar extinction coefficients of the
39.
+ -species H20x2, HOx and Ox , then for a 1 cm cell the measured absorbance
at a particular wavelength is
+ [HOX]EHOx +
In an acidic medium, the term [Ox-] becomes negligible. ,
+ Thus c = [H20x ] + [HOx]
+ [HOX]EHOx
and so c = [HOx) {[aH+]. + 11 ,kB J
. 1,Ox
and A = [HOx] { [aH+]£H Ox . J!!. 2 . l .. Ox
(12)
(13)
(14)
40.
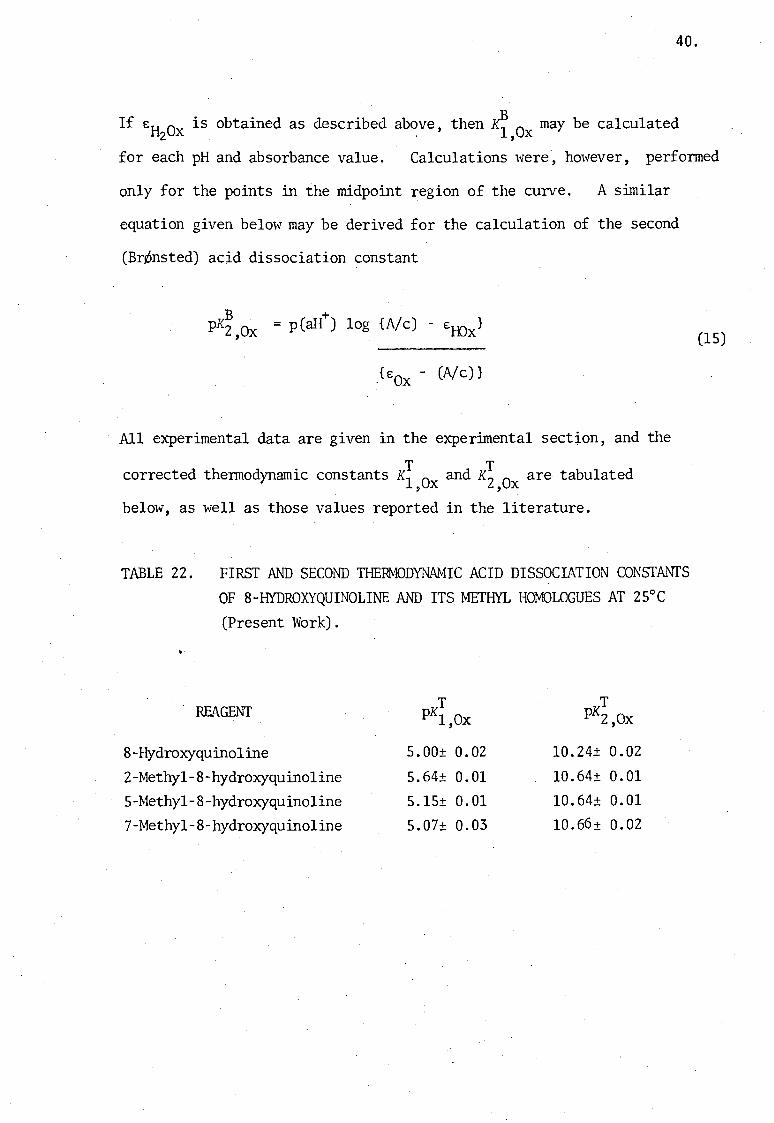
If eH20X is obtained as described above, then ~,ox may be calculated
for each pH and absorbance value. Calculations were, however, perfonned
only for the points in the midpoint region of the curve. A similar
equation given below may be derived for the calculation of the second
(Br¢nsted) acid dissociation constant
B + pK2,Ox = p(aH ) log {A/c) - £HOx}
All experimental data are given in the experimental section, and the
corrected thermodynamic constants Ki,ox and K~,ox are tabulated
below, as well as those values reported in the literature.
TABLE 22. FIRST AND SECOND THERMODYNAMIC ACID DISSOCIATION CONSTANTS
OF S-HYDROXYQUINOLINE AND ITS METHYL HOMOLOGUES AT 25°C
(Present Work) .
..
REAGENT T
pKl,Ox T
pK2 ,Ox
S-Hydroxyquinoline s.OO± 0.02 10.24± 0.02
2-Methyl-S-hydroxyquinoline s.64± 0.01 10.64± 0.01
s-Methyl-S-hydroxyquinoline s.lS± 0.01 10.64± 0.01
7-Methyl-S-hydroxyquinoline s.07± 0.03 10.66± 0.02
(15)
41.
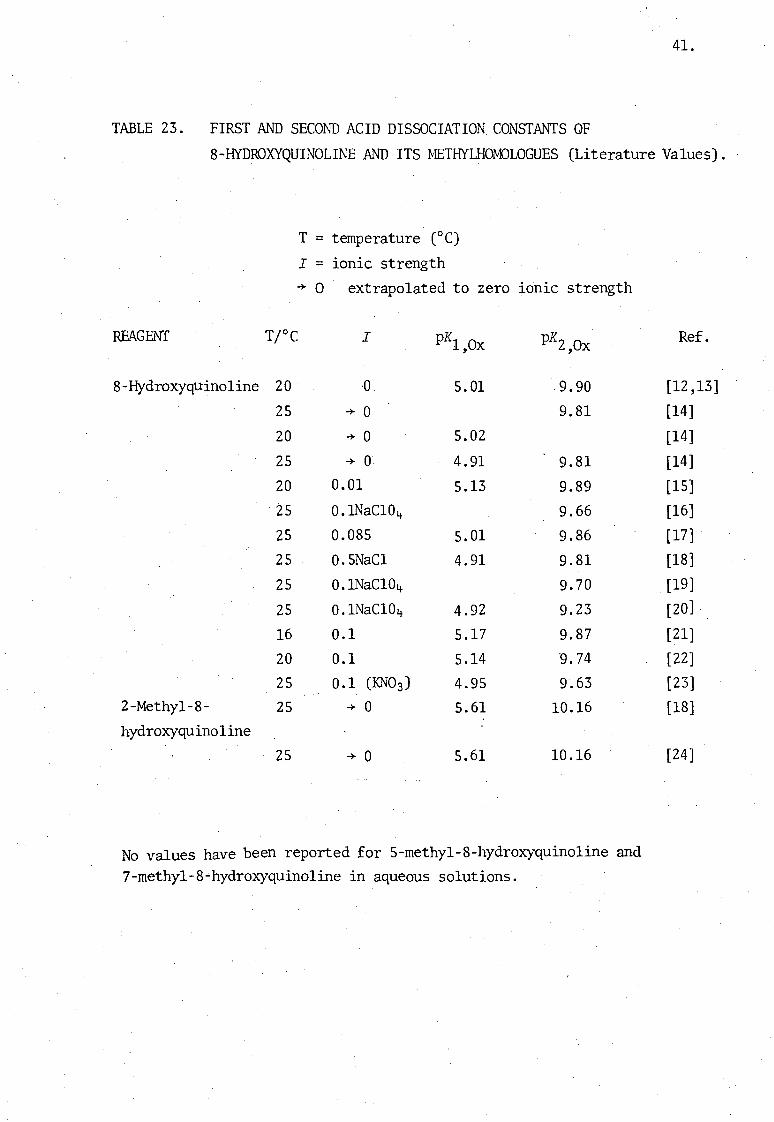
TABLE 23. FIRST AND SECO~~ ACID DISSOCIATION CONSTANTS OF
S-HYDROXYQUINOLINE AND ITS fvIETHYLHOM)LOGUES (Literature Values).
T = temperature (OC)
I = ionic strength -+- 0 extrapolated to zero ionic strength
REAGENT TrC I pK1 ,Ox pK2 ,Ox
S-Hydroxyquino1ine 20 ·0 5.01 .9.90
25 -+- 0 9.S1
20 -+- 0 5.02
25 -+- 0 4.91 9.S1
20 0.01 5.13 9.S9
25 0.INaC104 9.66
25 0.OS5 5.01 9.S6
25 0.5NaC1 4.91 9.S1
25 0.INaC104- 9.70
25 0.lNaC104 4.92 9.23
16 0.1 5.17 9.S7
20 0.1 5.14 9.74
25 0.1 (KN03) 4.95 9.63 2-Methy1-S- 25 -+- 0 5.61 10.16 hydroxyquinoline
25 -+- 0 5.61 10.16
No values have been reported for 5-methy1-S-hydroxyquino1ine and 7-methy1-S~hydroxyquino1ine in aqueous solutions.
Ref.
[12,13]
[14]
[14]
[14]
[15]
[16]
[17]
[IS]
[19]
[20]
[21]
[22]
[23]
[IS]
[24 ]
42.
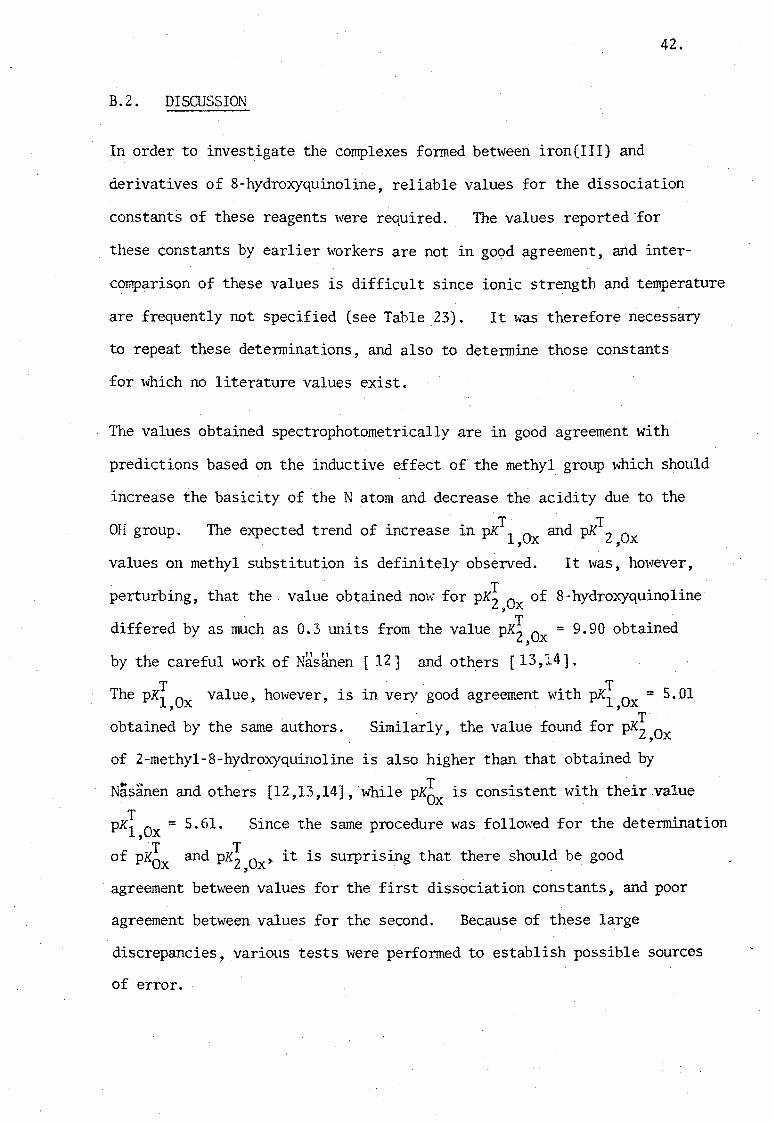
B.2. DISCUSSION
In order to investigate the complexes formed between iron(III) and
derivatives of S-hydroxyquinoline, reliable values for the dissociation
constants of these reagents \vere required. The values reported 'for
these constants by earlier workers are not in good agreement, and inter
comparison of these values is difficult since ionic strength and temperature
are frequently not specified (see Table 23). It lvas therefore necessary
to repeat these determinations, and also to determine those constants
for which no literature values exist.
The values obtained spectrophotometrically are in good agreement with
predictions based on the inductive effect of the methyl group which should
increase the basicity of the N atom and decrease the acidity due to the
OH group. The expected trend of increase in PKTl,ox and pKT2,ox
values on methyl substitution is definitely observed. It was, however,
perturbing, that the value obtained now for PK~jOX of S-hydroxyquinoline
differed by as much as 0.3 units from the value PK~,ox = 9.90 obtained
by the careful work of NasMen [ 12] and oth.ers [13,14].
The PKi Ox value, however, is , in very good agreement with pKi Ox = 5.01 , obtained by the same authors. Similarly, the value found for PK~ Ox , of 2-methyl-S-hydroxyquinoline is also higher than that obtained by
Nasanen and others [12,13,14] ,while PK6x is consistent with their .value T pKl,Ox = 5.61. Since the same procedure was followed for the determination
of PK;x and PK~,ox' it is surprising that there should be good
agreement between values for the first dissociation constants, and poor
agreement between values for the second. Because of these large
discrepancies,various tests were performed to establish possible sources
of error.
43.
The calibration of the wavelength and.absorbance scale of the spectro
photometer was checked by measuring the absorbance of a known concentration
of highly pure potassiwn chromate in a.a5M potassium hydroxide.
From this value, the molar extinction coefficient was evaluated at the
absorbance maximum, 371 nm, and found to be 4826 m2. mol-I, comparing
favourably with the value of 4815 )112 mol- 1 quoted at 375 run by Gillam,
Stem and Tinunons [25]. In addition, pH measurements on the pH M64
research pH meter were compared by obtaining readings of the same
buffer solutions on a second pH meter. These readings were found to be
consistent. Measurements were also carried out with a different glass
electrode to make sure that this was' not faulty.
Since no instrumental reasons were found to throw doubt on the validity
of the present measurements of PK~,ox there seems no reason for rejecting
these and they have been adopted in the calculation of formation constants
of the complexes of oxines with iron (I II) . At the same time it must
be admitted that no explanation can be put forward for the lower values
obtained by earlier workers.
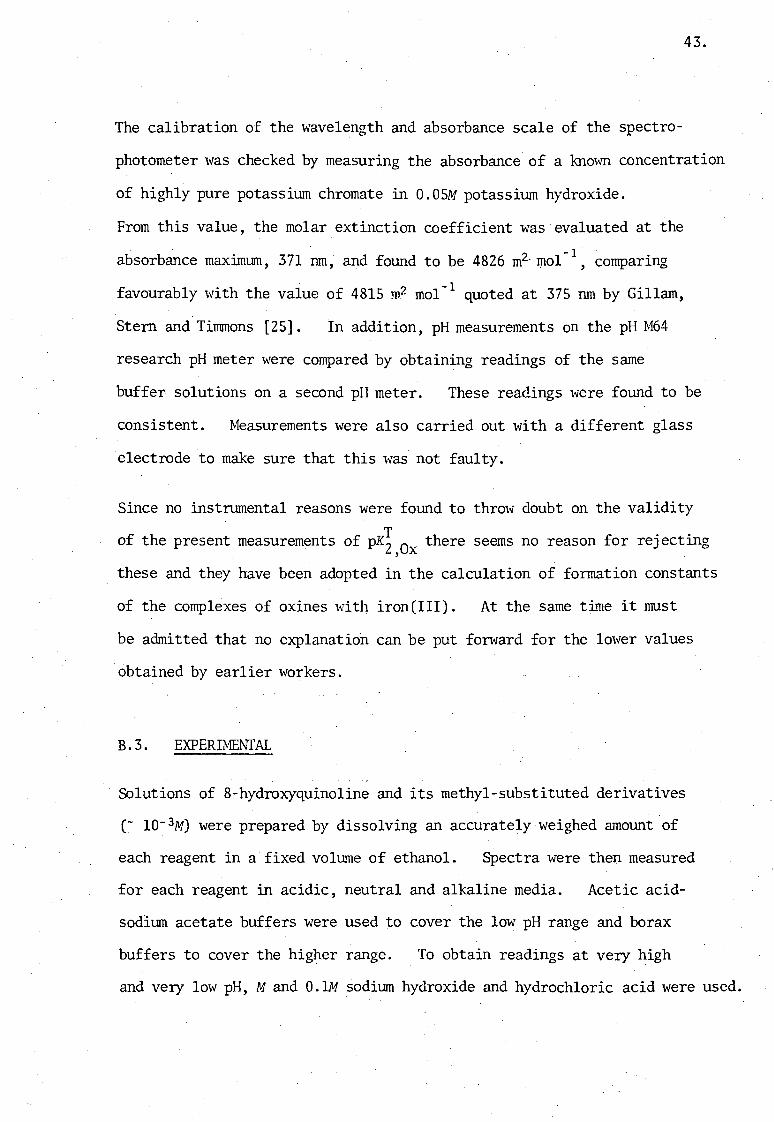
B.3. EXPERI~lAL
Solutions of 8-hydroxyquinoline and its methyl-substituted derivatives
(~ la- 3M) were prepared by dissolving an accurately weighed amount of
each reagent in a fixed volume of ethanol. Spectra were then measured
for each reagent in acidic, neutral and alkaline media. Acetic acid-
sodium acetate buffers were used to cover the low pH range and borax
buffers to cover the higher range. To obtain readings at very high
and very low pH, M and a.1M sodium hydroxide and hydrochloric acid were used.
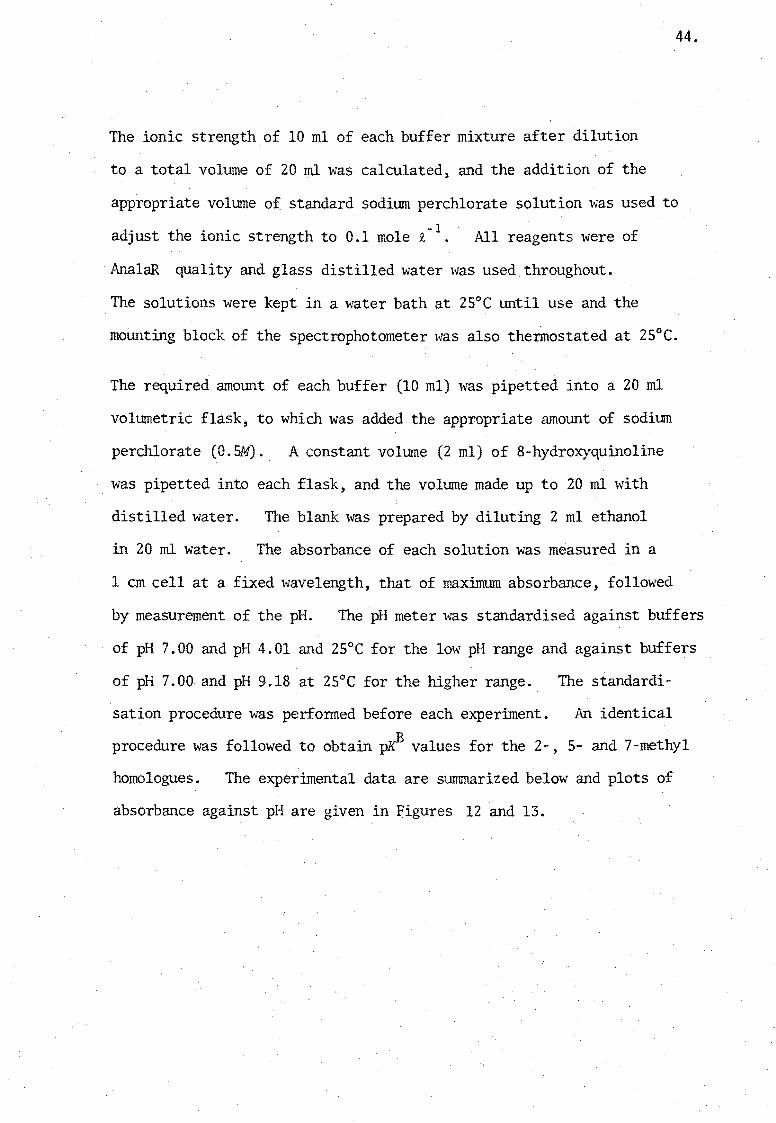
44.
The ionic strength of 10 ml of each buffer mixture after dilution
to a total volume of 20 m1 was calculated, and the addition of the
appropriate volume o£ standard sodium perchlorate solution was used to
adjust the ionic strength to 0.1 mole i-I. All reagents were of
AnalaR quality and glass distilled water lvas used throughout •
. The solutions \-vere kept in a water bath at 25°C until use and the
mounting block of the spectrophotometer was also thermostated at 25°C.
The required amount of each buffer (10 ml) was pipetted into a 20 ml
volumetric flask, to which was added the appropriate amount of sodium
perchlorate (O.SM). A constant volume (2 ml) of 8-hydroxyquinoline
was pipetted into each flask, and the volume made up to 20 m1 with
distilled water. The blank was prepared by diluting 2 ml ethanol
in 20 m1 water. The absorbance of each solution was measured in a
1 em cell at a fixed wavelength, that of maximum absorbance, followed
by measurement of the pH. The pH meter was standardised against buffers
of pH 7.00 and pH 4.01 and 25°C for the low pH range and against buffers
of pH 7.00 and pH 9.18 at 25°C for the higher range. The standardi-
sation procedure was performed before each experiment. An identical
procedure was followed to obtain pKB values for the 2-, 5- and 7-methyl
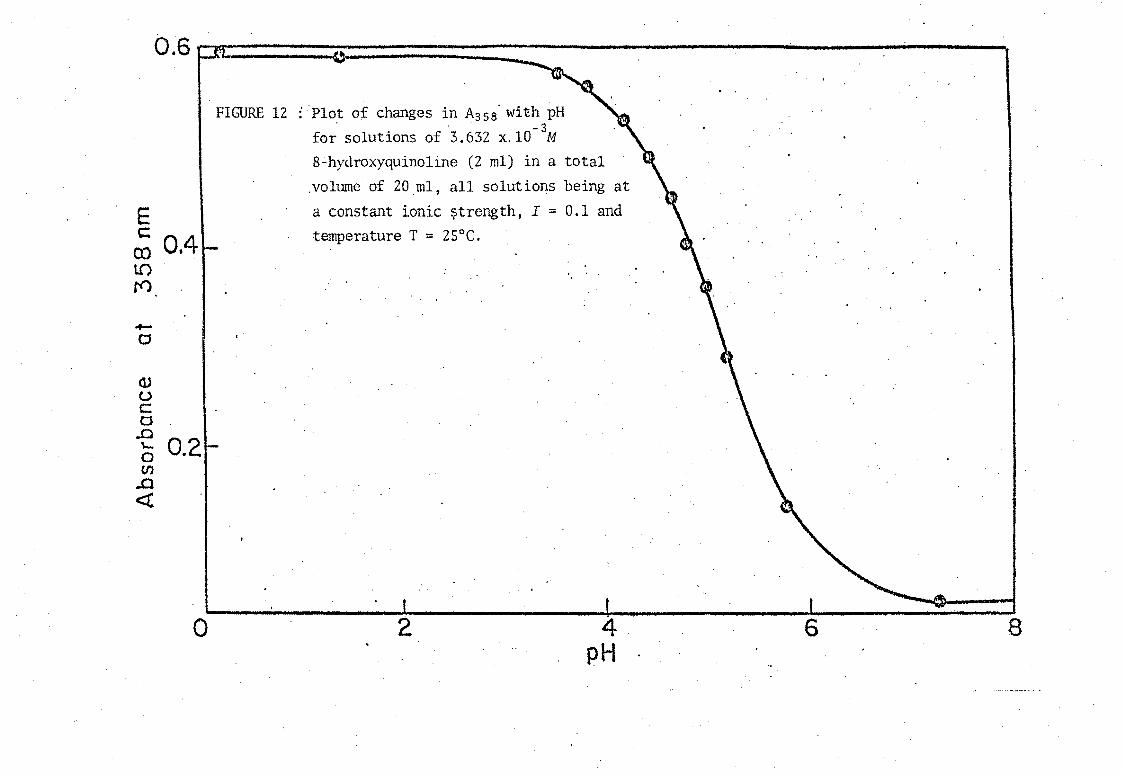
homologues. The experimental data are summarized below and plots of
absorbance against pH are given in Figures 12 and 13.
O· ·6 1 · (:rf:: ,,:: ..:..
E c: ro 0.4 to t<)
of-
a
d) u c: a
-e 0.2 0 (I)
.0 <t
o
FIGURE 12 : Plot of changes in A358' with pH . . -3
for solutions of 3.632 x.lO M
8-hydroxyquinoline (2 ml) in a total
.volume of 20ml, all solutions being at
a constant ionic ~trength, I = 0.1 and temperature T = 25°C.
2 4 pH
6 8

1.0 r------------.---~-------
E c: 0.8
N to r0
+-0
(1.) u c 0 .0 .... 0 (()
..0 «
0.6
0.4
0.2
6.00 8.00 10.00 12.00 14.00
pH FIGURE 13 : Plot of chapges in A3S2 with pH for solutions of
. - - 3 3.632 x 10 M 8-hydroxyquinoline (2 ml) in a total
volume of 20 ml, all solutions being at a constant
ionic strength, I = 0.1 and temperature T = 25°C
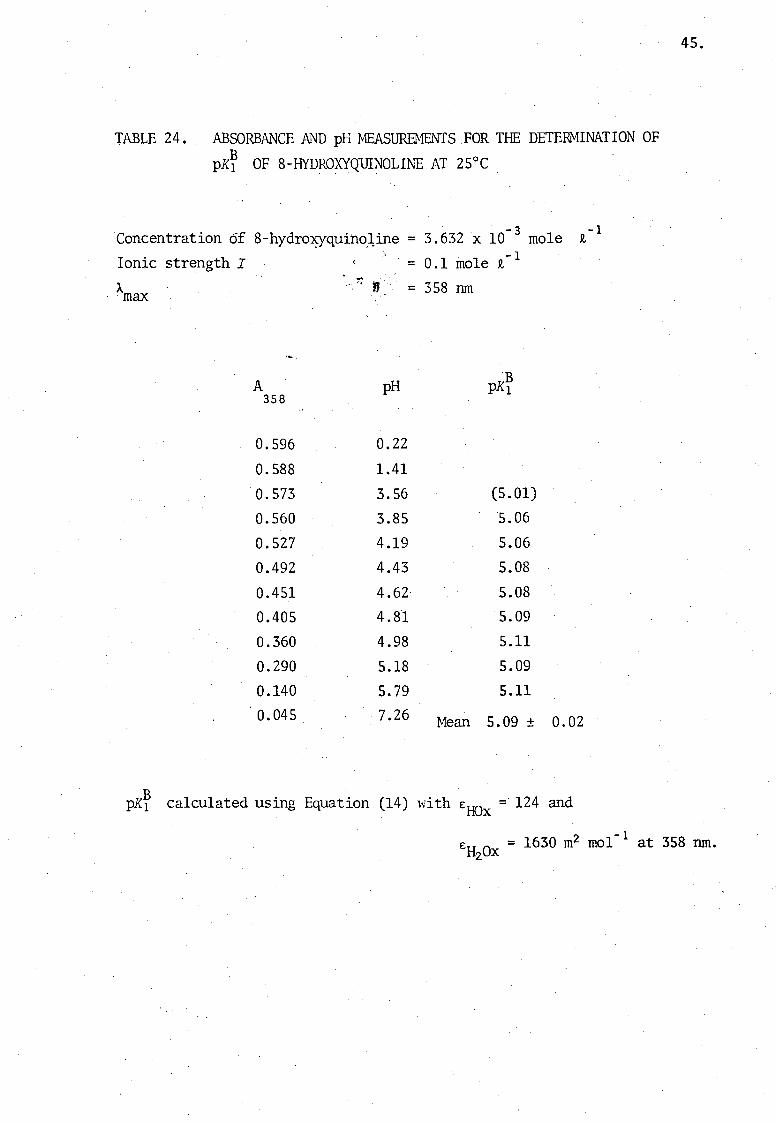
TABLE 24. ABSORBAl'JCE AND pH MEASURB1E1'I'TSFOR THE DETER1VlINATION OF
PK~ OF 8-HYDRO)(yQlJINOLINE AT 25°C
- 3 -1 Concentration 6£ 8-hydrQ)cyquiho,~ine = 3.632 x 10 mole ~
Ionic strength I
A . max
A 358
0.596
0.588
0.573
0.560
0.527
0.492
0.451
0.405
0.360
0.290
0.140
0.045
= 0.1 mole ~-l -.~. ".. = 358 nm
pH -B
pK1
0.22
1.41
3.56 (5.01)
3.85 5.06
4.19 5.06
4.43 5.08
4.62 5.08
4.81 5.09
4.98 5.11
5.18 5.09
5.79 5.11
7.26 Mean 5.09 ± 0.02
PK~ calculated using Equation (14) lvith £HOx = 124 and
45.
2 -1 £H20x = 1630 m mol at 358 nm.
46.
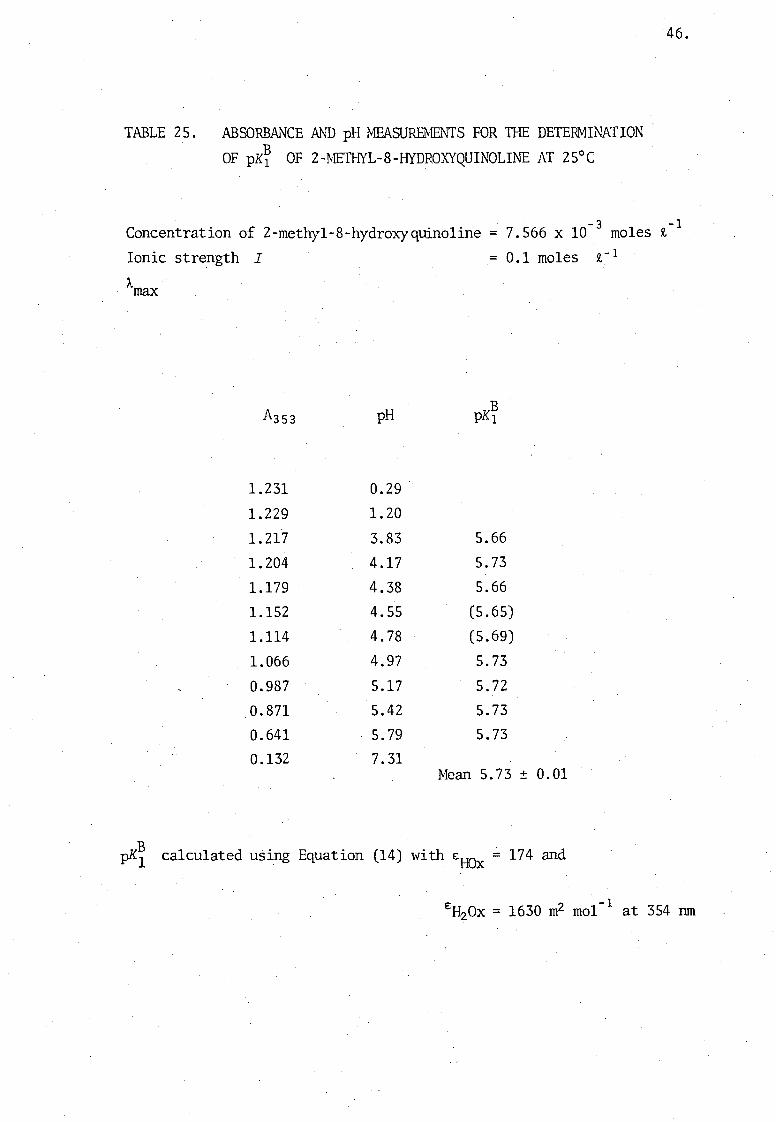
TABLE 25. ABSORBANCE AND pH MEASUID1EI\1'fS FOR THE DETER1V1INATION .
OF PK~ OF 2-METHYL-8-HYDROXYQUINOLINE AT 25°C
Concentration of 2-methyl-8-hydroxyquino1ine = 7.566 x 10- 3 moles ~-1 Ionic strength I = 0.1 moles ~-1
Amax
pH
1.231 0.29
1.229 1.20
1.217 3.83 5.66
1.204 4.17 5.73
1.179 4.38 5.66
1.152 4.55 (5.65)
1.114 4.78 (5.69)
1.066 4.97 5.73
0.987 5.17 5.72
0.871 5.42 5.73
0.641 5.79 5.73
0.132 7.31 Mean 5.73 ± 0.01
pK~ calculated using Equation (14) with £HOx ~ 174 and

TABLE 26. ABSORBANCE Ai''lJ) pH MEASUREMEPiTS FOR THE DETEPMlNATION OF
PK~ OF 5-METHYL-8-HYDROXYQUINOLlNE AT 25°C
Concentration of 5-methyl-8-hydroxyquinoline = 3.509 x 10- 3 moles ~-l Ionic Strength I
"max
A382
0.617
0.616
0.596
0.591
0.571.
0.546
0.515
0.474
0.423
0.366
0.282
0.169
0.046
pH
0.17
1.18
3.80
3.94
4.14
4.35
4.57
4.76
4.94
5.14
5.38
5.75
7.28
::: 0.1 moles ~-l
= 382 nm
p~
(5.21)
(5.20)
5.24
5.24 Mean
5.23 5.24 ± 0.01
5.25
5.23
(5.19)
P~ calculated using Equation (14) with €HOx = 131 and
47.
2 -1 E:H20X
= 1755 m mol at 382 nm.
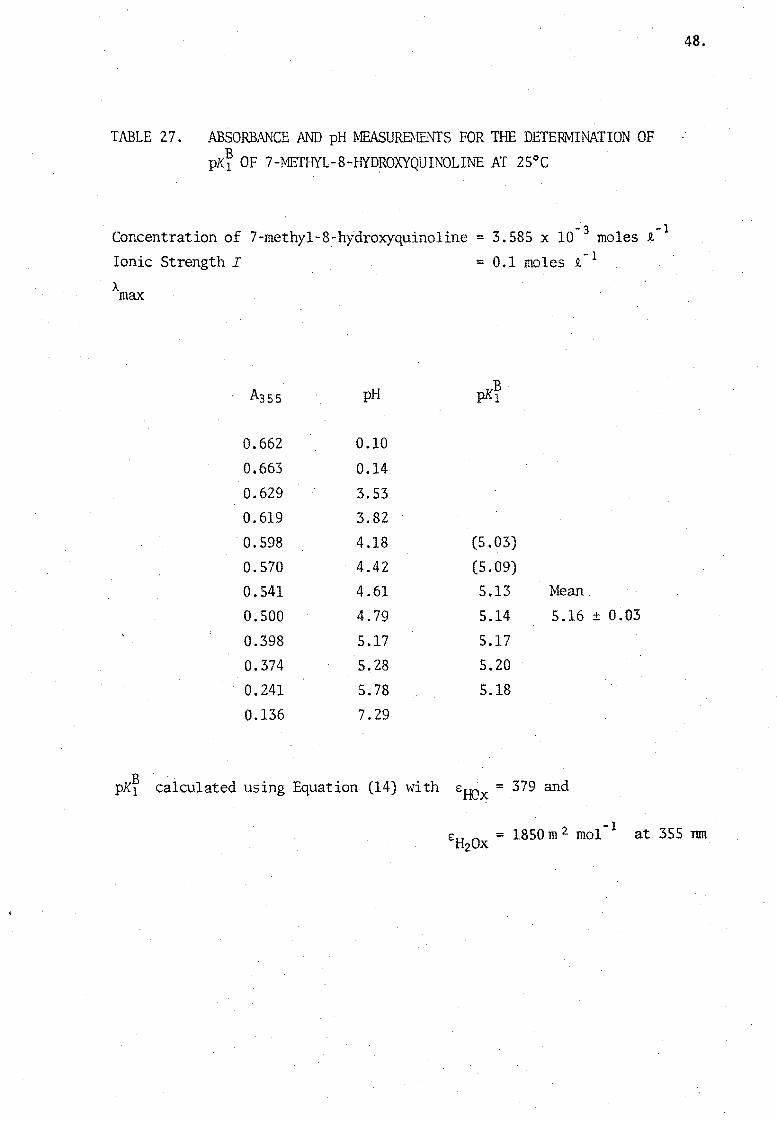
TABLE 27. ABSORBANCE AND pH lvIEASURBIEt\JTS FOR THE DETERtvtlNATION OF
PK~ OF 7-METHYL-8-rNDROXYQUINOLI~~ AT 25°C
Concentration of 7-methyl-8-hydroxyquino1ine = 3.585 x 10- 3 moles ~-l Ionic Strength I = 0.1 moles £-1
A max
A355 pH pK~
0.662 0.10
0.663 0.14
0.629 3.53
0.619 3.82 . 0.598 4.18 (5.03)
0.570 4.42 (5.09)
0.541 4.61 5.13 Mean
0.500 4.79 5.14 5.16 ± 0.03
0.398 5.17 5.17
0.374 5.28 5.20
0.241 5.78 5.18
0.136 7.29
PK~ calculated using Equation (14) with eHQx =379 and
48.
-1 eHzOx
= 1850 m 2 mol at 355 Inn
49.
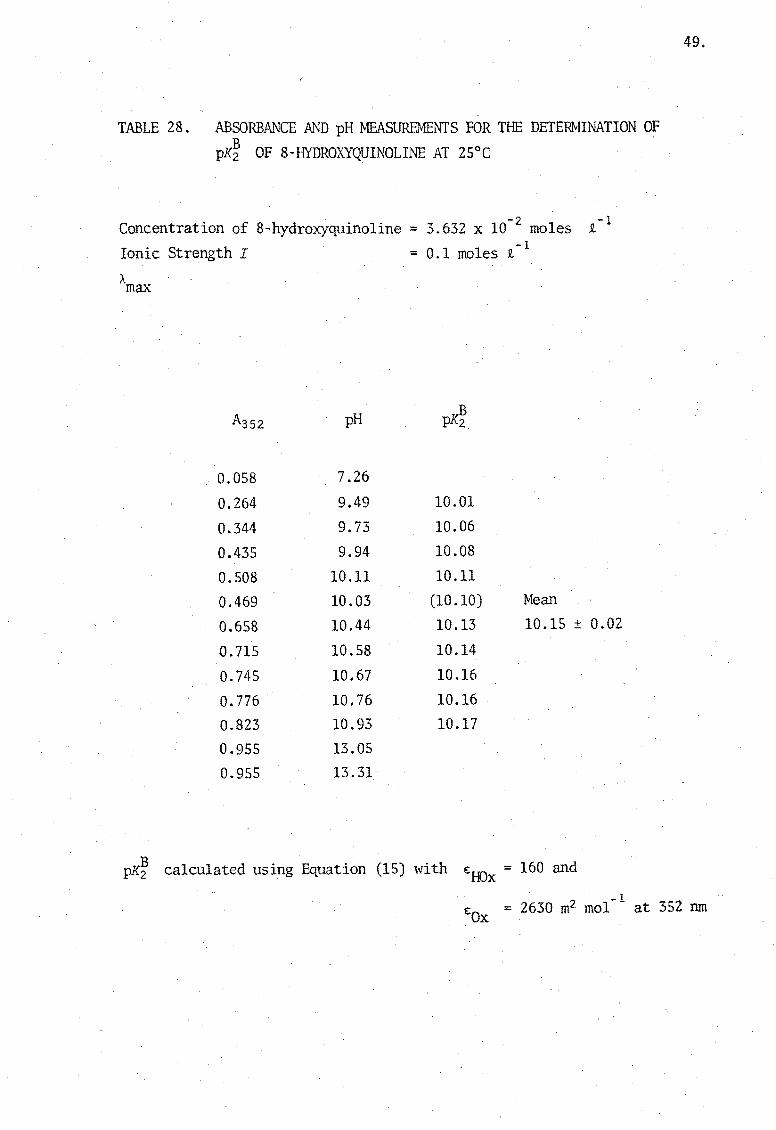
TABLE 28. ABSORBANCE AND pH MEASUREMENTS FOR THE DETERtvIINATIONOF
PK~ OF 8-HYDROXYQUINOLlNE AT 25°C .
Concentration of 8-hydroxyquinoline = 3.632 x 10⁻² moles ~-l Ionic Strength I = 0.1 moles £,-1
"max
pH
0.058 7.26
0.264 9.49 10.01
0.344 9.73 10.06
0.435 9.94 10.08
0.508 10.11 10.11
0.469 10.03 (10.10) Mean
0.658 10.44 10.13 10.15 ± 0.02
0.715 10.58 10.14
0.745 10.67 10.16
0.776 . 10.76 10.16
0.823 10.93 10.17
0.955 13.05
0.955 13.31
PK~ calculated using Equation (15) with EHOx = 160 and
, -1 EOX = 2630 m2 mol at 352 nm
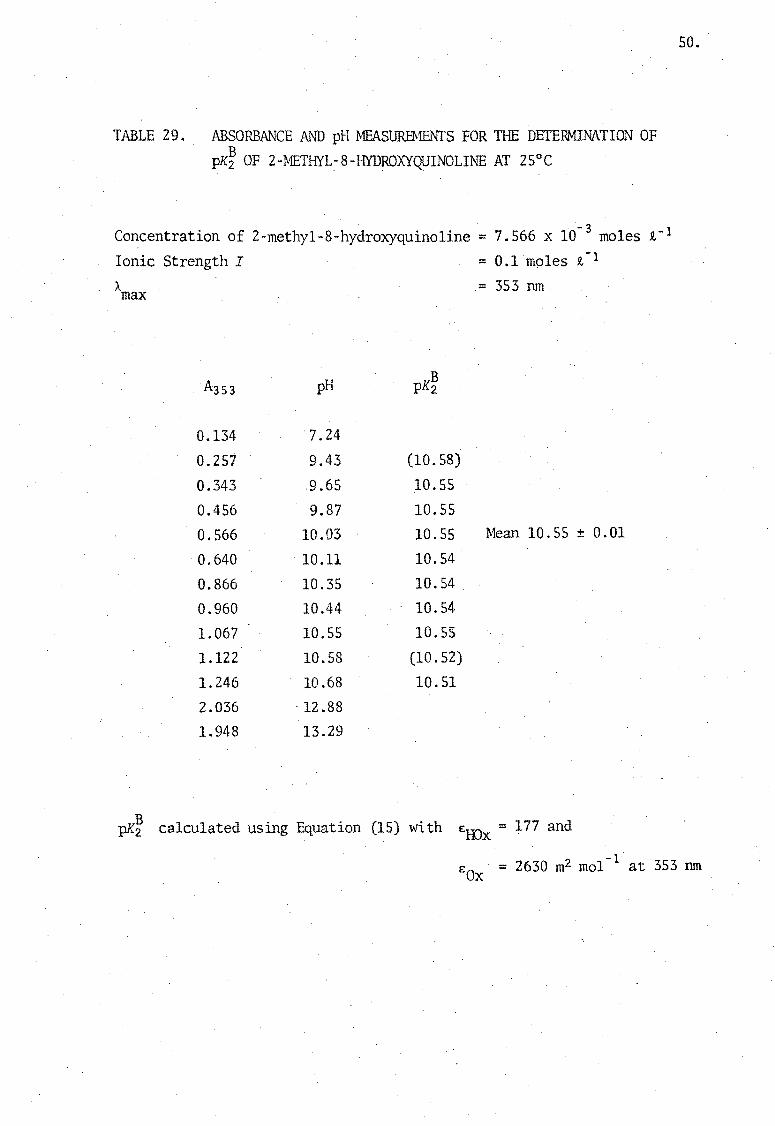
TABLE 29. ABSORBANCE AND pH MEASUREMENTS FOR THE DETE~INATION OF
PK~ OF 2-METHYL~8-HYDROXYQUINOLINE AT 25°C
Concentration of 2-methyl-8-hydroxyquinoline = 7.566 x 10- 3 moles 11.- 1
Ionic Strength I
A max
A353
0.134
0.257
0.343
0.456
0.566
0.640
0.866
0.960
1.067
1.122
1.246
'2.036
1.948
pH
7.24
9.43
9.65
9.87 10.03
10.11
10.35
10.44
10.55
10.58
10.68
12.88 13.29
B pK2
(10.58)
10.55
10.55
10.55
10.54
10.54
10.54
10.55
(10.52)
10.51
= 0.1 moles 1- 1
= 353 run
Mean 10.55 ± 0.01
pK~ calculated using Equation (15) with e:mx = 177 and
so.
-1 e:Ox = 2630 m2 mol at 353 nm

TABLE 30. ABSORBANCE AND pH MEASUm1E~TS FOR THE DEfERJ'vIINATION OF
PK~ OF 5-METHYL-8-HYDROXYQUINOLINE AT 25°C
Concentration of 5-methyl-8-hydroxyquino1ine = 3.535 x 10- 3 moles 1-1
. -1 Ionic Strength I ::: 0.1 moles 1
= 370 nm
pH
0.094 7.35
0.195 9.55
0.249 9.76
0.329 9.97
0.403 10.15 (10. SO)
0.415 10.23 10.56
0.555 10.48 10.55
0.618 ,....~ . 10.11,58 10.54 Mean 10.55 ± 0.01 ,-
0.686 10.71 10.55
0.700 1p.74 10.55
0.760 10.87 (10.57)
1.085 13~16
1.102 13.45
pK~ Calculated using Equation (15) with EHOx = 266 and
51.
2 -1 Eax = 3095 rr; mol at 370 nm.
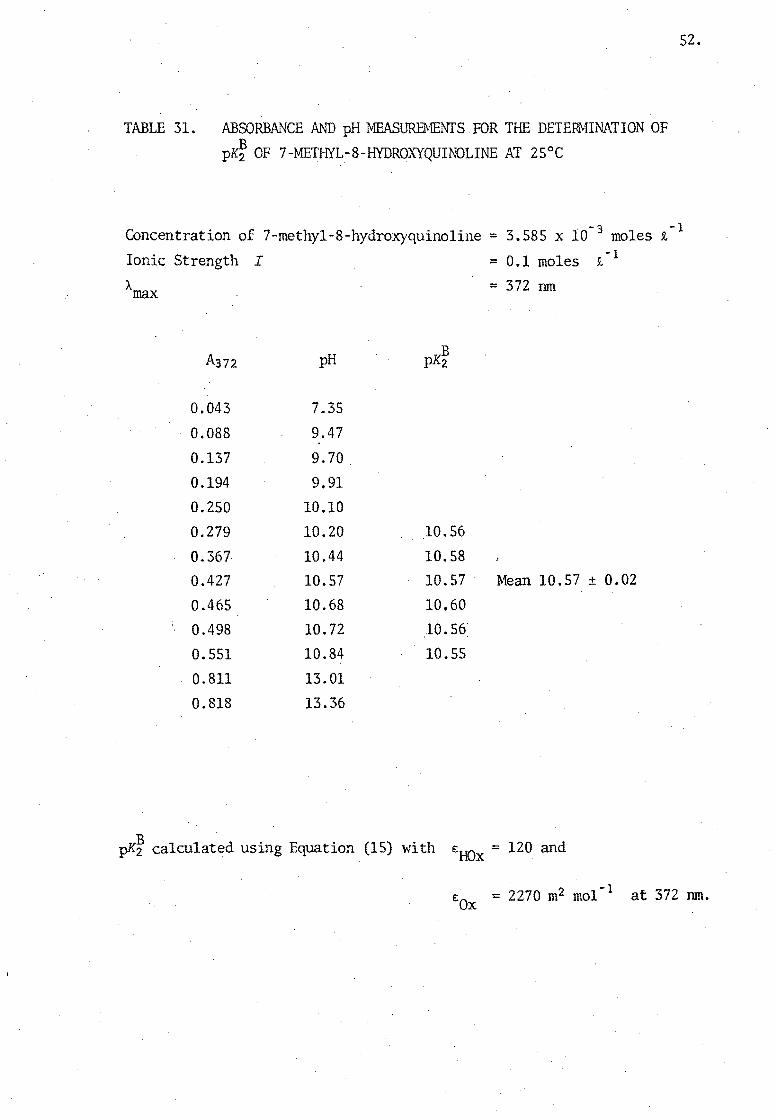
TABLE 31. ABSORBANCE AND pH MEASLTREt-1ENfS . FOR THE DETERMINATION OF
PK~ OF 7-METHYL-S-HYDROXYQUINOLINE AT 25°C
52.
Concentration of 7-methy1-S-hydroxyquino1ine = 3.5S5 x 10- 3 moles t- 1
Ionic Strength I = 0.1 moles t- 1
"max = 372 nm
A372 pH B pK2
0.043 7.35
0.088 9.47
0.137 9.70
0.194 9.91
0.250 10.10
0.279 10.20 10.56
0.367- 10.44 10.58
0.427 10.57 10.57 Mean 10.57 ± 0.02
0.465 10.68 10.60
0.498 10.72 10.56
0.551 10.84 10.55
0.811 13.01
0.818 13.36
pK~ calculated using Equation (15) with EHO = 120 and x .
2 -1 EOX = 2270 m mol at 372 nm.
CHAPTER VI '
THEPJlODYNPNIC FO~ATION CONSTPJffS KT OF COftPLEXES OF IRONCIID AND
~ETHYL-SLTISTITL1ED 8-HYDROXYQUINOLINES
" ..
CHAPTER VI
TIlliRl\;lODYNAJvlIC FORMATION CONSTANTS XT OF COMPLEXES OF IRON(III) AND
METHYL-SUBSTITUTED 8-HYDROXYQUINOLINES
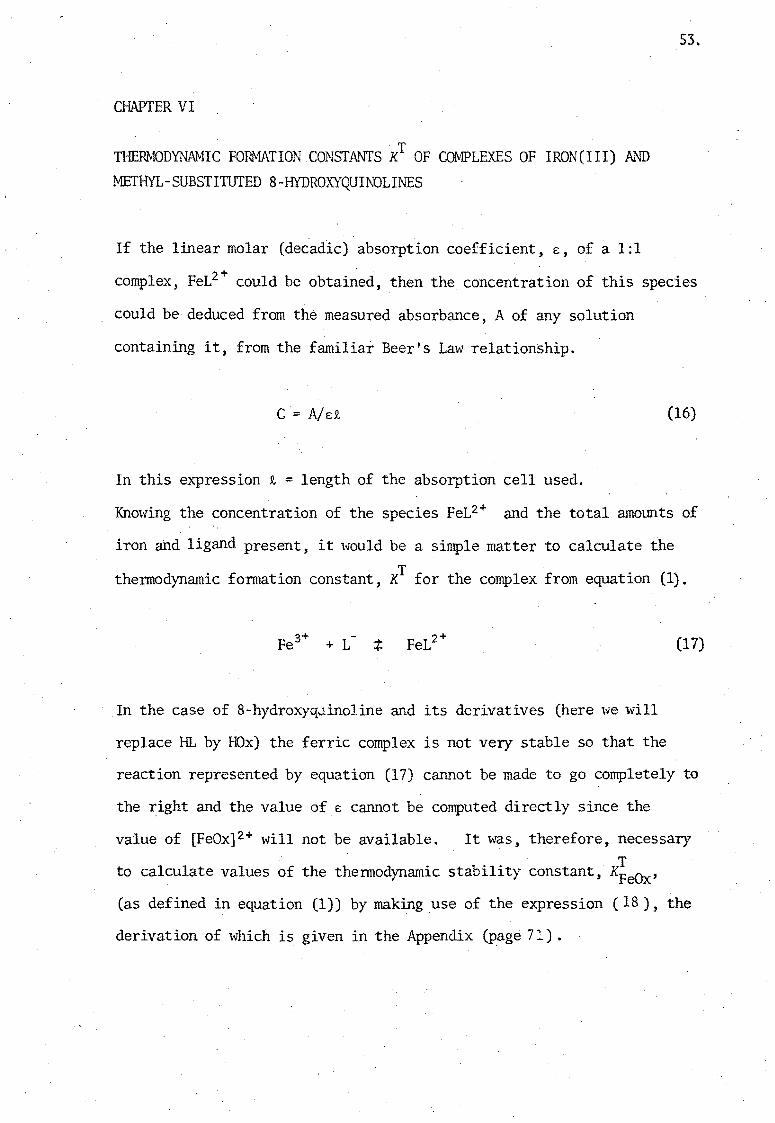
53.
If the linear molar (decadic) absorption coefficient, e:, of a 1:1
complex, FeL2+ could be obtained, then the concentration of this species
could be deduced from the measured absorbance, A of any solution
containing it, from the familiar Beer's Law relationship.
C = A/e:9.
In this expression 9. = length of the absorption cell used.
(16)
Knmving the concentration of the species FeL2+ and the total amounts of
iron and ligand present, it would be a simple matter to calculate the
thermodynamic formation constant, xT for the complex from equation (1).
(17)
In the case of 8-hydroxyq",linoline and its derivatives (here we \\Till
replaceHL by HOx) the ferric complex is not very stable so that the
reaction represented by equation (17) cannot be made to go completely to
the right and the value of E cannot be computed directly since the
value of [FeOx]2+ will not be available. It was, therefore, necessary
to calculate values of the thermodynamic stability constant, xieOx' (as defined in equation (1)) by making use of the expression (18), the
derivation of which is given in the Appendix (page 7:) .

where c = [Fe]tot = sum of the molar concentrations of ferric iron
in all its forms in the solution
b = [L]tot = total concentration of S-methyloxine [HL]
A = measured absorbance
E: = molar absorption coefficient for the complex FeOx2 +
i = length of the cell I
f n= ~ctivity coefficient of an n-valent ion
XT T T T . T f d Ox = K 1,OxKZ,Ox where KI,Ox and KZ,Ox are the irst an
second thermodynamic dissociation constants for the acid
Q =
54.
(18)
It can be seen from equation (4) that if the molar absorption coefficient
E: for the complex were known, as lvell as the two thermodynamic dissociation
constants for the methyl-substituted oxines, it lvould be possible to
calculate KT from the absorbance measurements and the known concentrations,
c and b.
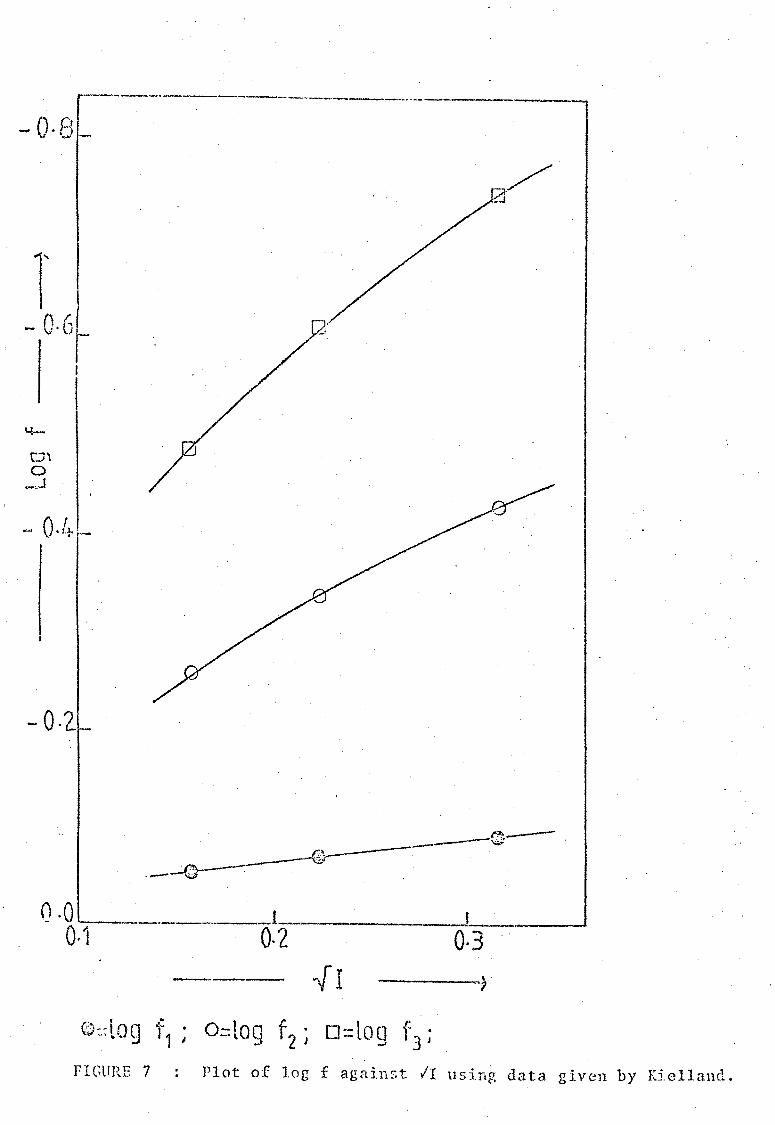
A series of calculations of c, b and of Q were made for each of the 43
data points (a,pH). The complete set of data is given in Table 33.
(Full exper:imental details are given later). The values of the activity
- 0-8-
1'1 -0.+
I
I
- 0·2
---_._-------
o ·0 .... ____ . ____ . ___ l ______ . __ -.!.f ___ ----I
0·1 0·2 0·3 {I ____ to
1
FIGURE ., Plot of log f against II using data given by Kielland.
SS.
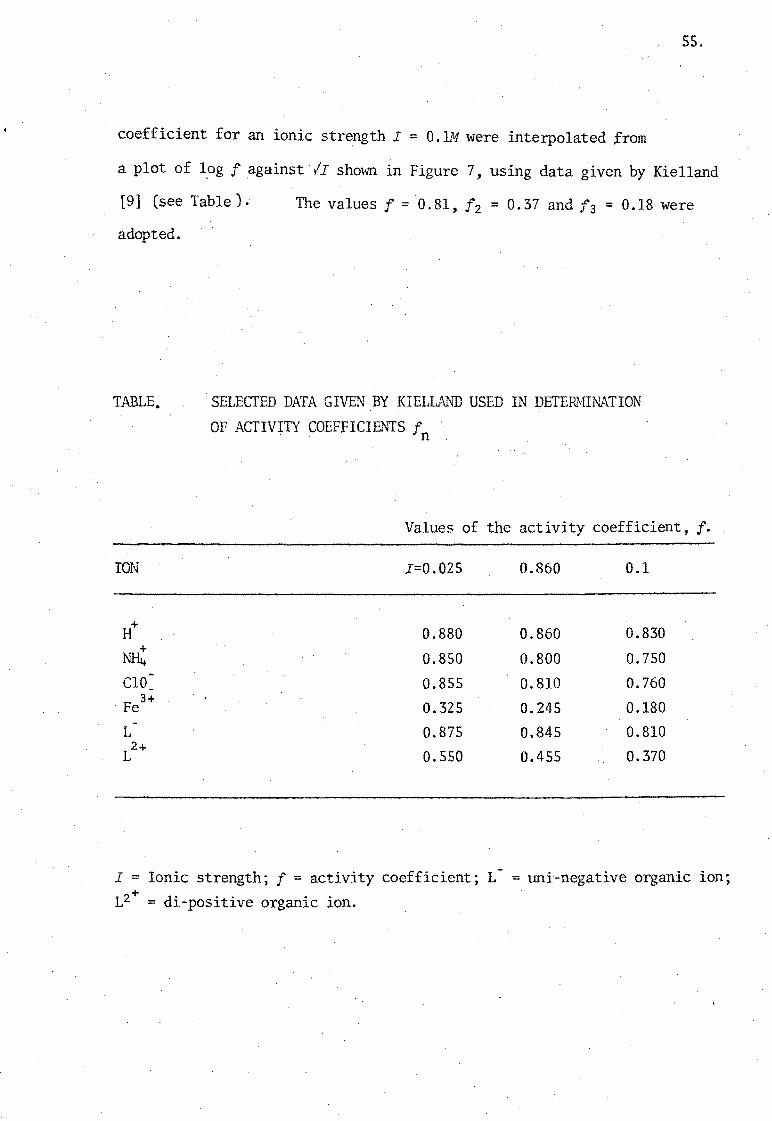
coefficient for an ionic strength I = 0.1M were interpolated from
a plot of 1.og I against II shown in Figure 7, using data given by Kielland
[9] (see Table). The values I = 0.81, 12 = 0.37 and f3 = 0.18 were
adopted.
TABLE.
ION
H+
+ NH4 CIO -Fe3+
L 2+
L
SELECl'ED DATA GIVEN BY KIELLAND USED IN DETERNlNATION
OF ACTIVITY COEFFICIENTS In
Values of the activity coefficient, I.
I=0.02S 0.860 0.1
0.880 0.860 0.830
0.850 0.800 0.750
0.855 0.810 0.760
0.325 0.245 0.180
0.875 0.845 0.810
0.550 0.455 0.370
I ::::: Ionic strength; I = activity coefficient; L = uni-negative organic ion; L2+ = di-positive organic ion.
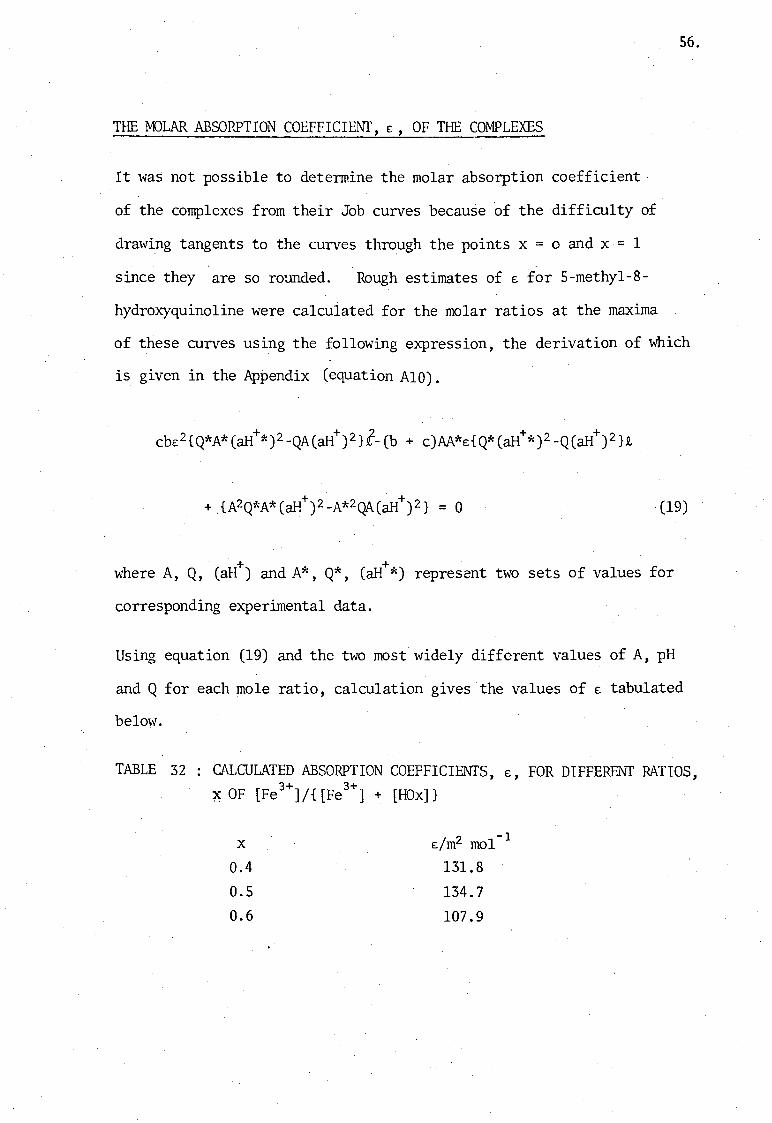
THE M)LAR ABSORPTION COEFFICIENT, e:, OF THE COMPLEXES
It was not possible to determine the molar absorption coefficient
of the complexes from their Job curves because of the difficulty of
drm.,ring tangents to the curves through the points x = 0 and x = 1
since they are so rounded. Rough estimates of E for S-methyl-8-
hydroxyquinoline were calculated for the molar ratios at the maxima
56.
of these curves using the following expression, the derivation of which
is given in the Appendix (equation AID).
(19)
where A, Q, (aH+) and A*, Q*, (aH+*) represent two sets of values for
corresponding eA~erimental data.
Using equation (19) and the two most widely different values of A, pH
and Q for each mole ratio, calculation gives the values of E tabulated
belm.,r.
TABLE 32 CALCULATED ABSORPTION COEFFICIENTS, E, FOR DIFFERENT RATIOS, 3+ 3+
~ OF [Fe ]/{[Fe ] + [HOx]}
X 2 -1 Elm mol
0.4 131.8
0.5 134.7 0.6 107.9
57.
EXPERIMENTAL
Preparation of Solutions
(a) Stock Ferric Perchlorate Solution. (Ferric perchlorate (9.8777 g)
was dissolved in O.11S3M perchloric acid (200 ml). This was
standardized against EDTA solution, freshly prepared by weight from
Anala R reagent. The appropriate portion of this solution was diluted
with 0.l1S3M HCl04 to prepare the 8.0422 x lO-"M i.;orking solution.
The exact strength of the perchloric acid was detennined by titration against O.lN sodium carbonate.
(b) Stock Solutions of 8-Hydroxyguinoline and its Methyl-Substituted -4 Derivatives. These solutions (-10 M) were prepared by
dissolving an accurately weighed amount of each reagent in a fixed volume
of O.11S3M HCl04 •
DETERMINATION OF KT
As preliminary experiments, absorption spectra of the complexes of each
ligand in turn 'with ferric ion iv-ere measured. From these spectra were
obtained the maximum wavelength of absorption, A of each metal-ligand max complex. Other preliminary experiments included the plotting of graphs
indicating changes of absorbance with time. From these it was concluded
that for all the complexes except the. 2-methyl one, maximum colour was
attained at approximately 20 minutes after addition of anmonia.
Consequently absorbance readings for these complexes were taken 20
minutes after mixing. In the case of the complex of 2-methyloxine
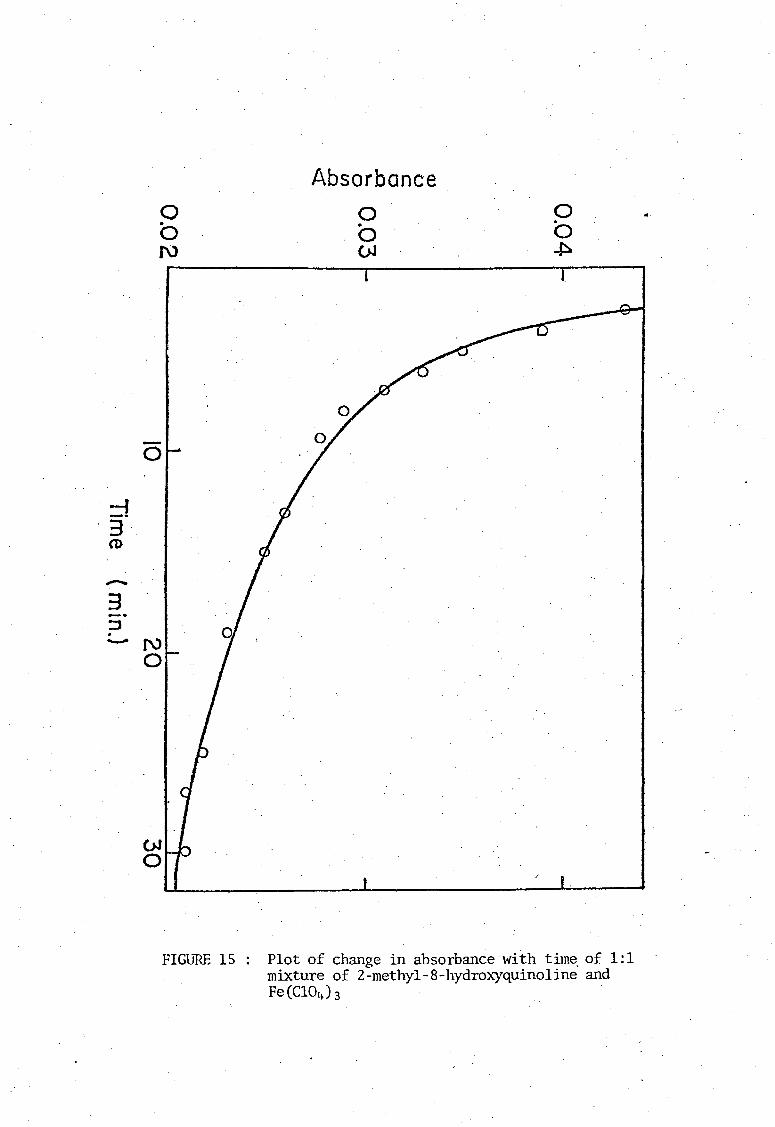
and Fe(III), a similar plot (see Fig.IS ) showed immediate signs of colour
fading. Hence all measurements for this complex ,,,,ere taken as soon as
(1) u c a
..0
0.5
0.4
0.3
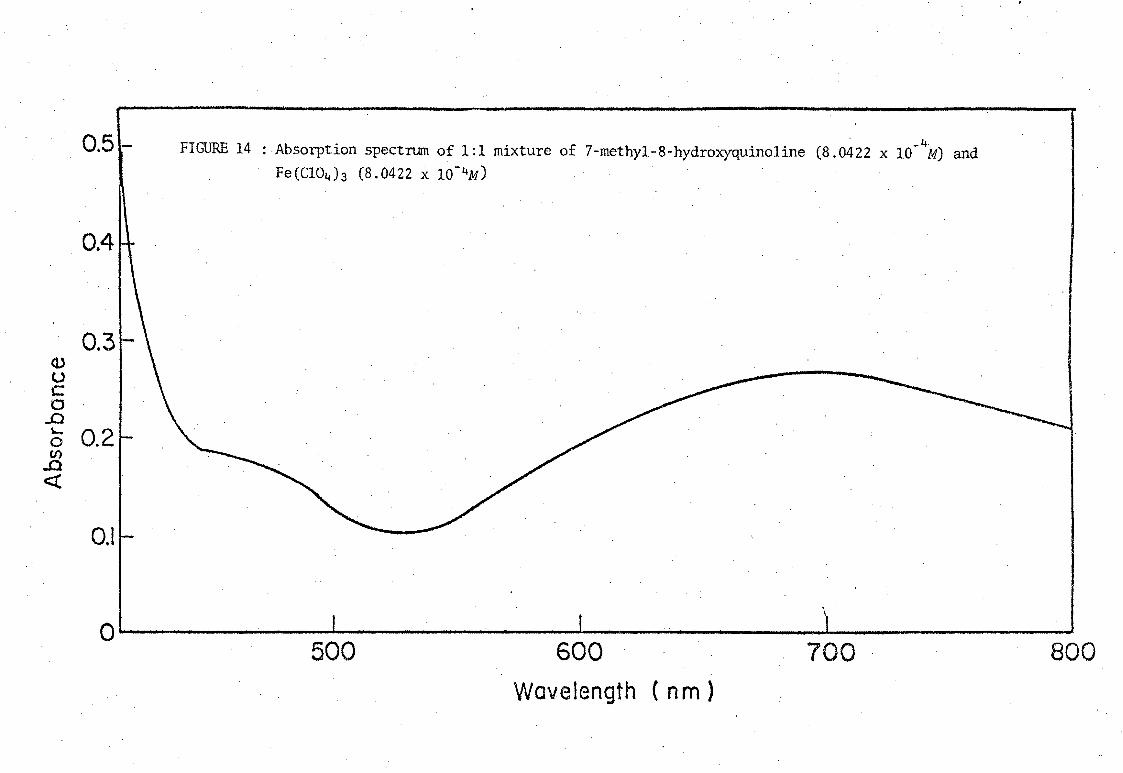
FIGURE 14 : Absorption spectrum of 1:1 mixture of 7-methyl-8-hydroxyquinoline (8.0422 x 10⁻⁴M) and Fe(C104)3 (8.0422 x 10- 4M)
~ 0.2 U')
.0 c::t:
0.1
i
o I 500 600 700 800
Wavelength (nm)
=f 3 CD
~
3 ::J . -
o b N
N 0
(}J
o
FIGURE 15
Absorbance
o b (}J
o b ~
Plot of change in absorbance with time, of 1:1 mixture of 2-methy1-S-hydroxyquino1ine and Fe (C104 h
58.
possible after the addition of the ammonia.
For each ligand, three solutions were prepared, containing different . 3+ 3+
ratios of [Fe ]/ ([Fe ] + [HOx]). Calculations were performed to
determine the ionic strength of 20 ml of each solution in a total
volume of 25 rnl, taking into consideration all the ions present.
The addition of the appropriate amount of sodium perchlorate was used to
adjust the ionic strength of each sample to 0.1 mol £-1. For each
ratio of ligand to iron, a number of absorbance measurements were made at
the maximum wavelength of absorption and gradually increasing alkalinities
adjusted by adding increasingly small amounts of dilute ammonia. The
required amount of each solution (20 ml) was pipetted into a 25 ml
volumetric flask. To this was added a small volume of dilute ammonia
and the volume made up to 25 rnl with distilled water. All absorbance
measurements were taken in a 4 ern quartz cell and were immediately
followed by pH readings.
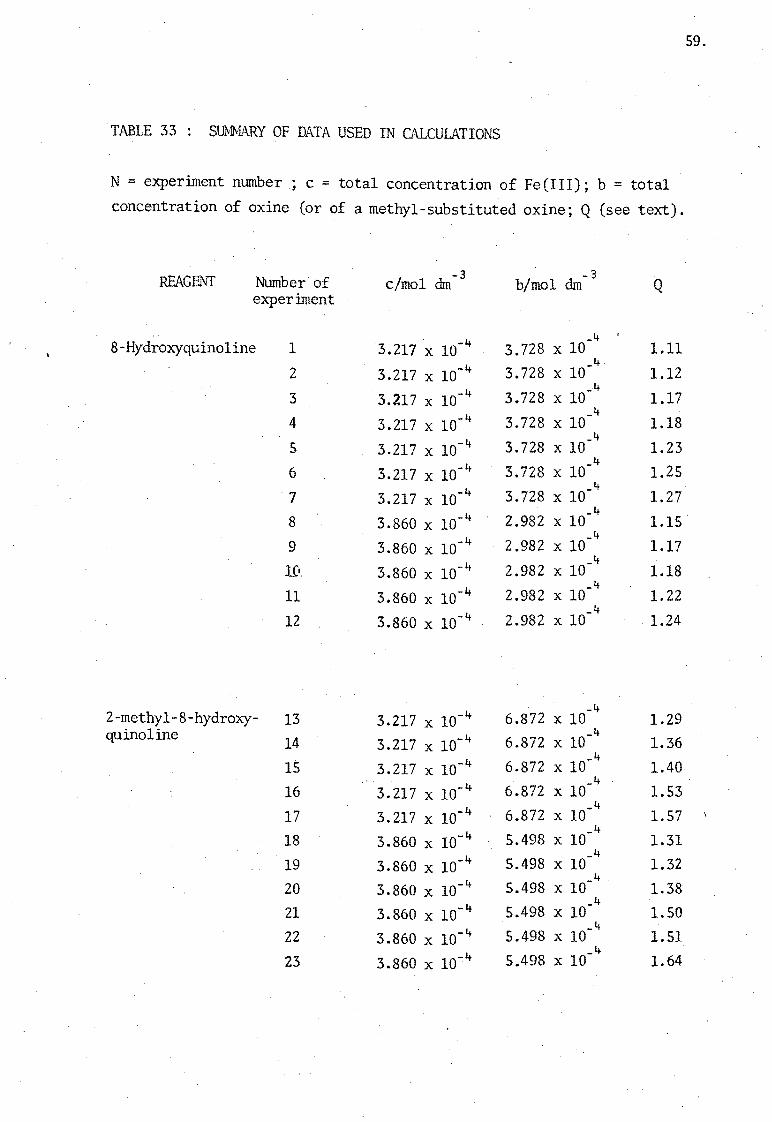
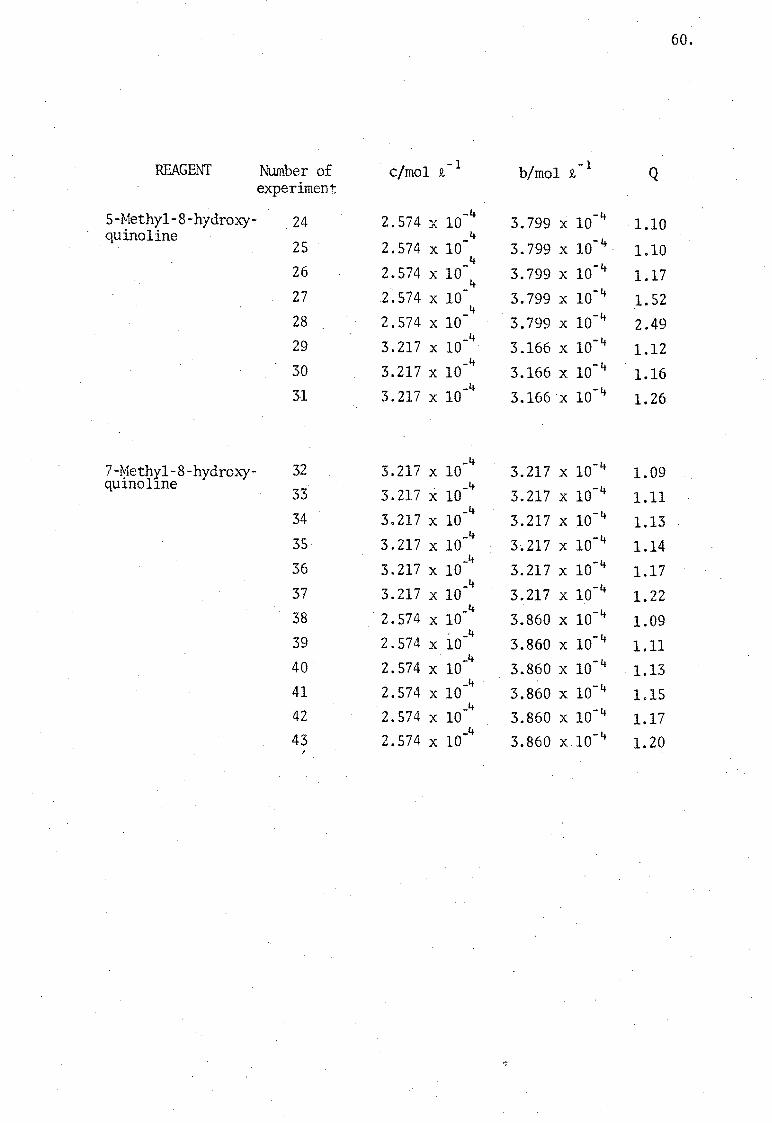
TABLE 33: SUMMARY OF DATA USED IN CALCULATIONS
N = experiment number; c = total concentration of Fe(III); b = total
concentration of oxine (or of a methyl-substituted oxine; Q (see text).
REAGENT Number of elmo1 dm experiment
-3 . -3 blmo1 dm Q
_4 ,
8-Hydroxyquino1ine 1 -4 3.728 x 10 1.11 3.217 x 10 -4
_4 1.12 2 3.217 x 10 3.728 x 10
3 . 4 3.217 x 10- 3.728 x 10
_4 1.17
-4 _It
4 3.217 x 10 3.728 x 10 1.18 -It
_4 5 3.217 x 10 3.728 x 10 1.23
-4 _4
1.25 6 3.217 x 10 3.728 x 10
7 3.217 x 10 -4 3.728 x 10 _4
1.27
8 3 -4 .860 x 10 2.982 x 10 _4
1.15 3 -4
_4 9 .860 x 10 2.982 x 10 1.17
3 -4 _4
10. .860 x 10 2.982 x 10 1.18 3 -4
_4 11 .860 x 10 2.982 x 10 1.22
_It 12 3 -4 2.982 x 10 1.24 .860 x 10
3.217 X 10⁻⁴ -4 2-methyl-8-hydroxy- 13 6.872 x 10 1.29 quinoline -4
_4 14 3.217 x 10 6.872 x 10 1.36
15 3.217 x 10⁻⁴ 6.872 x 10 _4
1.40 3 -4
_4 16 .217 x 10 6.872 x 10 1.53
17 3.217 x 10 -4 6.872 x 10 _4
1.57
18 .3.860 x 10- 4 5.498 x 10 _4
1.31 -4
_4 19 3.860 x 10 5.498 x 10 1.32
3 -4 _4
20 .860 x 10 5.498 x 10 1.38 _4
21 -4 5.498 :x 10 1.50 3.860 x 10 22 3 -4 .860 x 10 5.498 :x 10
_4 1.51
23 3.860 X 10~4 5.498 x 10 _4
1.64
59.
60.
REAGENT :Nt.unber of elmo1 Q. -1
blmo1 ,Q, -1
Q experiment
5-J.'v1ethyl-8-hydroxy- -4 . -4 24 2.574 x 10 3.799 x 10 1.10
quinoline -4 3.799 X 10- 4 . 25 2.574 x 10 1.10
-4 3.799 X 10- 4 26 2.574 x 10 1.17 4
27 .2~574 x 10 - 3.799 X 10- 4 1.52 4
. 3.799 X 10- 4 28 2.574 x 10 2.49 29
_4 -4 3.217 x 10 3.166 x 10 1.12 30 3.217 x 10
_4 3.166 x 10- 4 1.16
31 -4 3.166·x 10- It 3.217 x 10 1.26
32 -4 3.217 x 10- 4 7-~ethyl-8-hydroxy- 3.217 x 10 1.09
qUlnollne 33 3.217 x 10
_4 3.217 X 10- 4 1.11
34 _4
3.217 x 10- 4 3.217 x 10 1.13 35 3.217 x 10
_4 3.217 x 10- 4 1.14
_4 3.217 X 10⁻⁴ 36 3.217 x 10 . 1.17
37 3.217 x 10 _4
3.217 x 10- 4 1.22 _4
3.860 x 10- 4 38 ·2.574 x 10 1.09 39 2.574 x 10
_4 3.860 x 10- 4 1.11
_4 3.860 x 10- 4 40 2.574 x 10 1.13
_4 3.860 x 10- 4 41 2.574 x 10 1.15
_4 3.860 x 10- 4 42 2.574.x 10 1.17
_4 3.860 x 10- 4 43 2.574 x 10 1. 20 ,
C HAP T E R VII
CALCULATION OF VALUES OF KT FOR THE FORMATION OF IRON COf1PLEXES

61.
CALCULATION OF VALUES OF KT FOR THE FORMATION OF IRON COMPLEXES, FeOx2+
All the data are now available for calculating the thennodynamic fonnation
f h . 0 2+ f h· constants 0 t e specIes Fe x rom the above spectrop otometrlc
measurements by employing all the data points (A,pH). These calculations
were performed for three slightly different assumed values of the
linear decadic absorption coefficient,s. In each case the standard
deviation, s, of the set of measurements was calculated' and the value
of sto be used in the later calculations was selected from that which
T gave the best precision for pK .
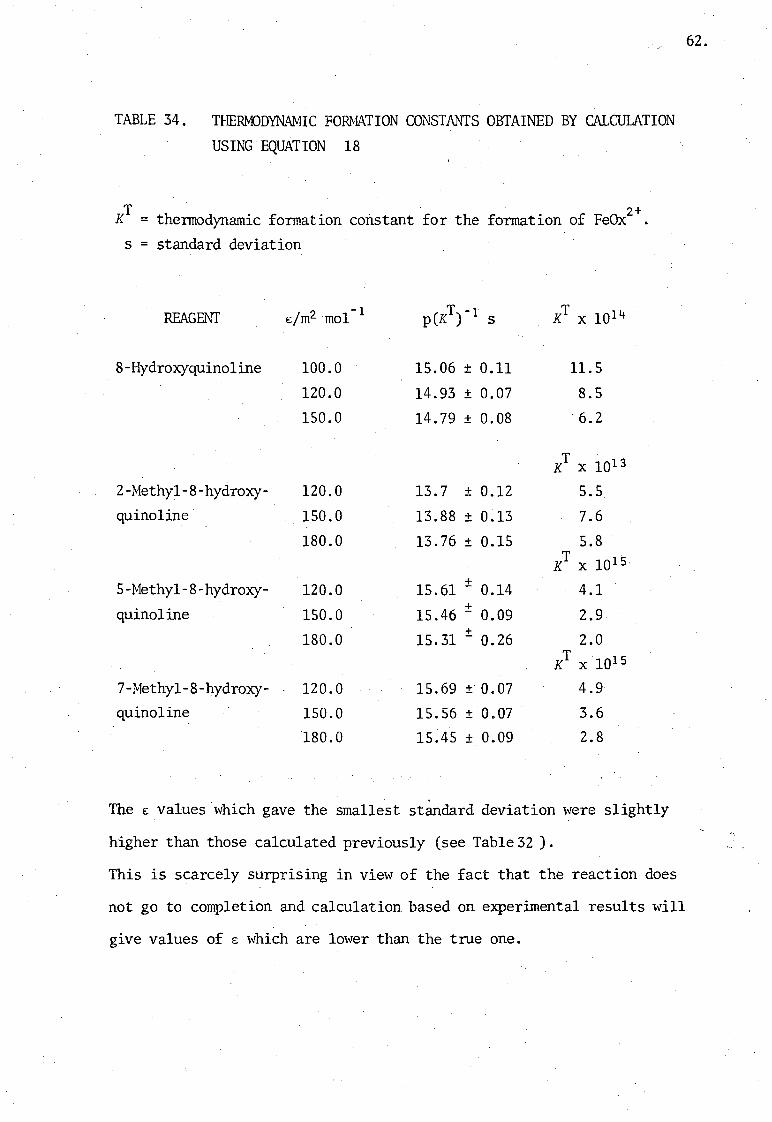
TABLE 34. THEOODYNAMIC FORMATION CONSTAl'ITS OBTAINED BY CALCULATION
USING EQUATION 18
KT = thermodynamic formation constant for the formation of FeOx2+
s = standard deviation
REAGENT E/m2 mo1 -1 T -1 p(K) 5 KT X 1014
8-Hydroxyquino1ine 100.0 15.06 ± 0.11 11.5
120.0 14.93 ± 0.07 8.S
150.0 14.79 ± 0.08 6.2
KT x 1013
2-Methyl-8-hydroxy- 120.0 13.7 ± 0.12 5.5
quinoline 150.0 13.88 ± 0.13 7.6
180.0 13.76 ± 0.15 5.8 T .
K X 1015
5-Nethyl-8-hydroxy- 120.0 + 15.61 - 0.14 4.1
quinoline 150.0 + 15.46 - 0.09 2.9
180.0 + 15.31 - 0.26 2.0 KT x 1015
7-r-iethyl-8-hydroxy- 120.0 15.69 ± 0.07 4.9
quinoline 150.0 15.56 ± 0.07 3.6
180.0 15.45 ± 0.09 2.8
The E values which gave the smallest standard deviation were slightly
higher than those calculated previously (see Table 32 ).
This is scarcely surprising in view of the fact that the reaction does
not go to completion and calculation based on exper~enta1 results will
give values of £: which are lower than the true one.
62.
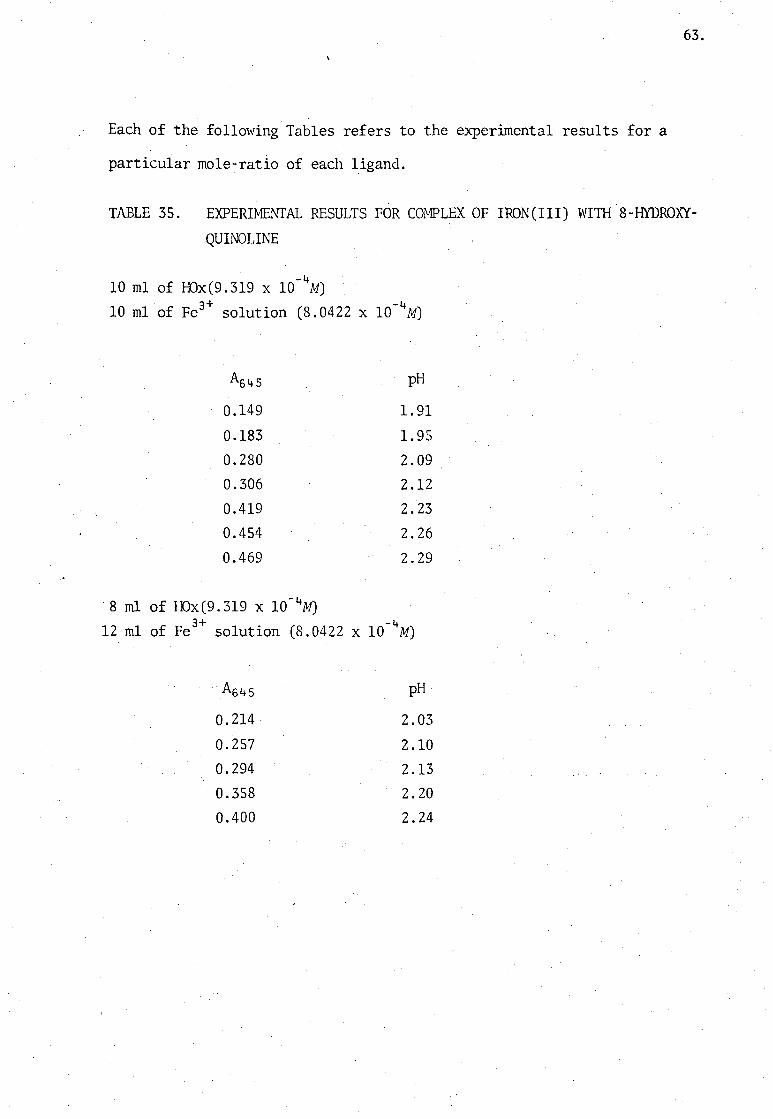
Each of the following Tables refers to the experimental results for a
particular mole-ratio of each ligand.
63.
TABLE 35. EXPERIMUrI'AL RESULTS FOR COMPLEX OF IRON(III) WITH 8-HYDROXY
QUINOLINE
-4 10 ml of HOx(9.3l9 x 10 M)
3+ -4 10 ml of Fe solution (8.0422 x 10 M)
A645 pH
0.149 1. 91
0.183 1. 95
0.280 2.09
0.306 2.12
0.419 2.23
0.454 2.26
0.469 2.29
·8 m1 of HOx(9.3l9 x 10-4M) 3+ -4
12 ml of Fe solution (8.0422 x 10 M)
. A645 pH
0.214 2.03
0.257 2.10
0.294 2.13
0.358 2.20
0.400 2.24
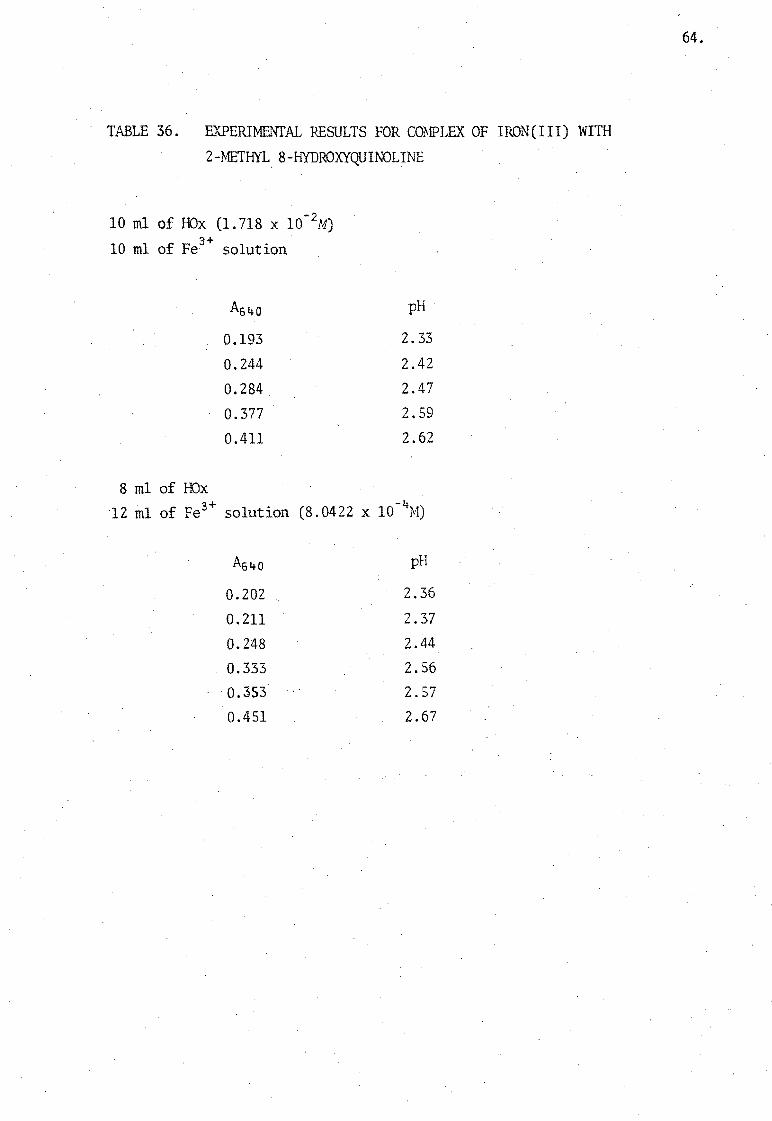
TABLE 36. EXPERIMENfAL RESULTS FOR COMPLEX OF IRON(III) WITH
2-~ffiTHYL 8-HYDROXYQUINOLINe
10 ml of HOx (1.718 x 10- 2M)
10 ml of Fe3+ solution
A640
0.193
0.244
0.284
0.377
0.411
8 ml of HOx
pH .
2.33
2.42
2.47
2.59
2.62
'12 m1 of Fe3+ solution (8.0422 x 10 -4rvl)
A640 pH
0.202 2.36
0.211 2.37
0.248 2.44
0.333 2.56
, 0.353 2.57
0.451 2.67
64.
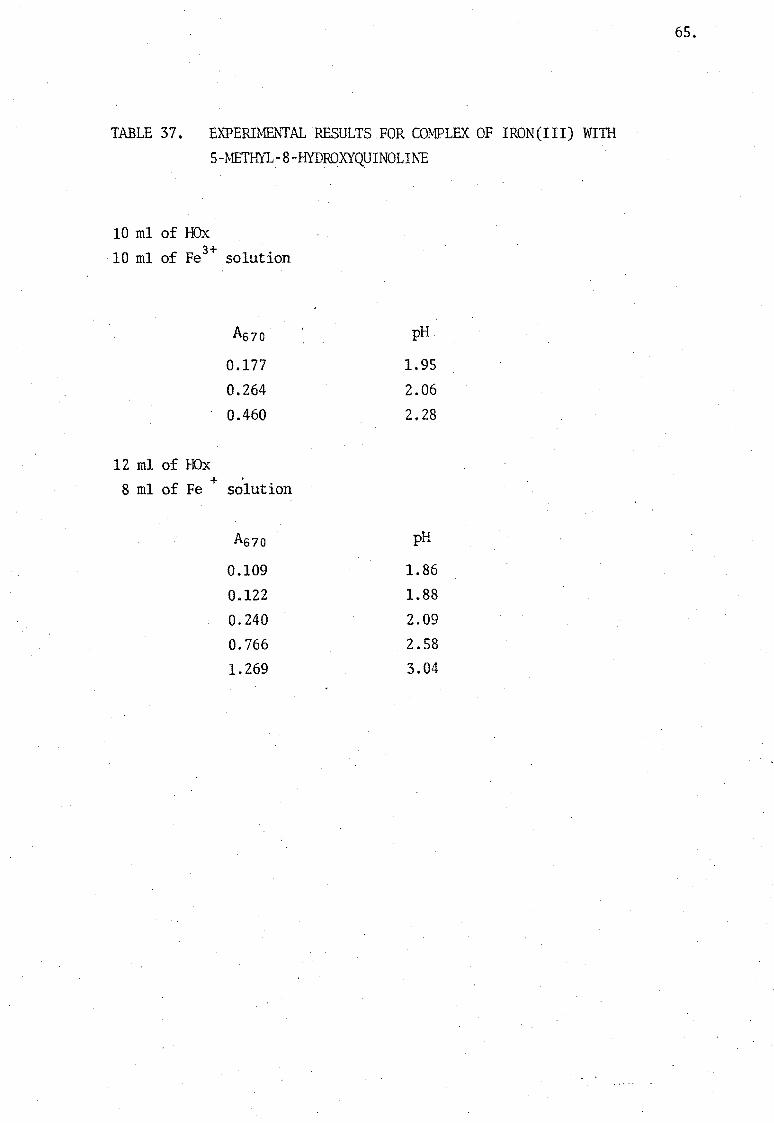
TABLE 37. EXPERIMENTAL RESULTS .FOR COMPLEX OF IRON(III) WIrn
5-METHYL-8-HYDROXYQUINOLli\1E
10 ml of HOx 10 ml of Fe3+ solution
A670 pH
0.177 1.95
0.264 2.06
0.460 2.28
12 m1 of BOx
8 ml of Fe + solution
A670 pH
0.109 1.86
0.122 1.88
0.240 2.09
0.766 2.58
1.269 3.04
65.
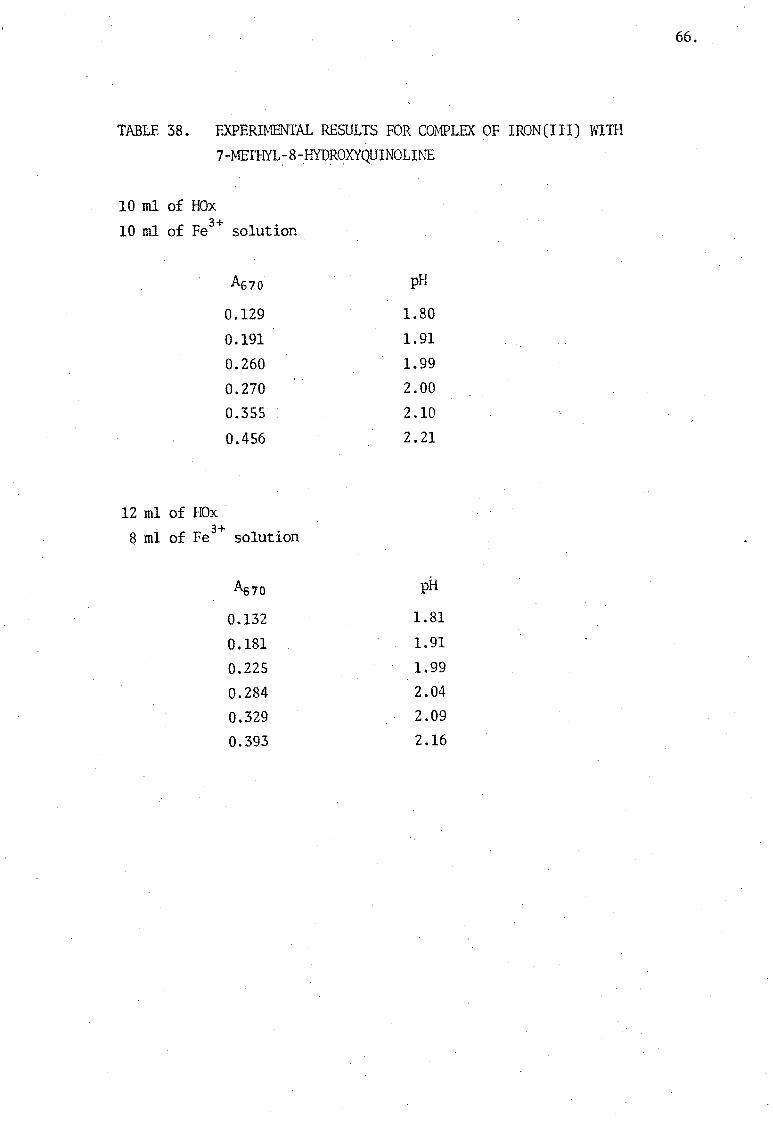
TABLE 38. EXPERIMENTAL RESULTS .FOR COIv1PLEX OF IRON(III) WITH
7 -MEfHYL:-8-HYDROXYQUINOLINE
10 m1 of HOx
10 m1 of Fe3+ solution
A670
0.129
0.191
0.260
0.270
0.355
0.456
12 m1 of HOx
8 mi of Fe3+ solution
0.132
0.181
0.22S
0.284
0.329
0.393
pH
1.80
1.91
1.99
2:00
2.10
2.21
pH 1.81
1.91
1.99
2.04
2.09
2.16
66.

.. C HAP T E R VIII
DISCUSSION
CHAPTER Vlll
DISCUSSION
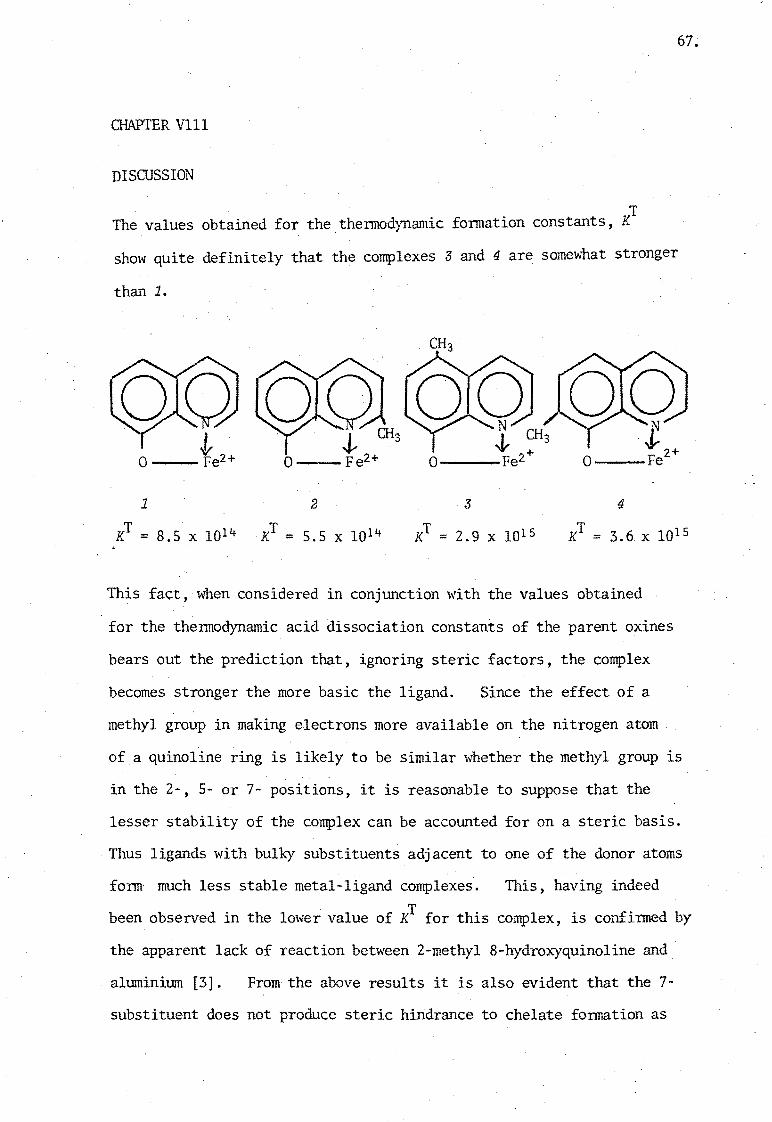
T The values obtained for the,thermodynamic formation constants, X
67.
show quite definitely that the complexes 3 and 4 are somewhat stronger
than 1.
0--- 0---
1 2 3 4 T .
X = 8.5 X 10¹⁴ xT = 5.5 x 10¹⁴ xT = 2.9 x 10¹⁵ xT = 3.6. x 1015
This fact, when considered in conjunction with the values obtained
for the thermodynamic acid dissociation constants of the parent oxines
bears out the prediction that, ignoring steric factors, the complex
becomes stronger the more basic the ligand. Since the effect of a
methyl group in making electrons more available on the nitrogen atom
of a quinoline ring is likely to be similar whether the methyl group is ..
in the 2-, 5- or 7- positions, it is reasonable to suppose that the
lesser stability of the complex can be accounted for on a steric basis.
Thus ligands with bulky substituents adjacent to one of the donor atoms
form much less stable metal-ligand complexes. This, having indeed
been observed in the lmier value of xT for this complex, is confirmed by
the apparent lack of reaction between 2-methyl 8-hydroxyquinoline and .
aluminium [3]. From the above results it is also evident that the 7-
substituent does not produce steric hindrance to chelate formation as
is observed in the case of the 2-substituent. Although.the.above
formulae are written as if the metal atom were unsolvated it will be
realised that the iron will be in octahedral coordination with the 0- and .
N- atoms of the chelating ligand and four water molecules. Models show
that a 7-substituent will not approach within Van der Waal radii of the
solvated cation whereas any 2-substituent will interfere sterically
'vith the primary water coordinated to it. This effect has been thoroughlY
investigated and is supported by many measurements of stability constants
of e.g. substituent oxines and cations such as Mg2+, Zn2+, UO~+ [27].
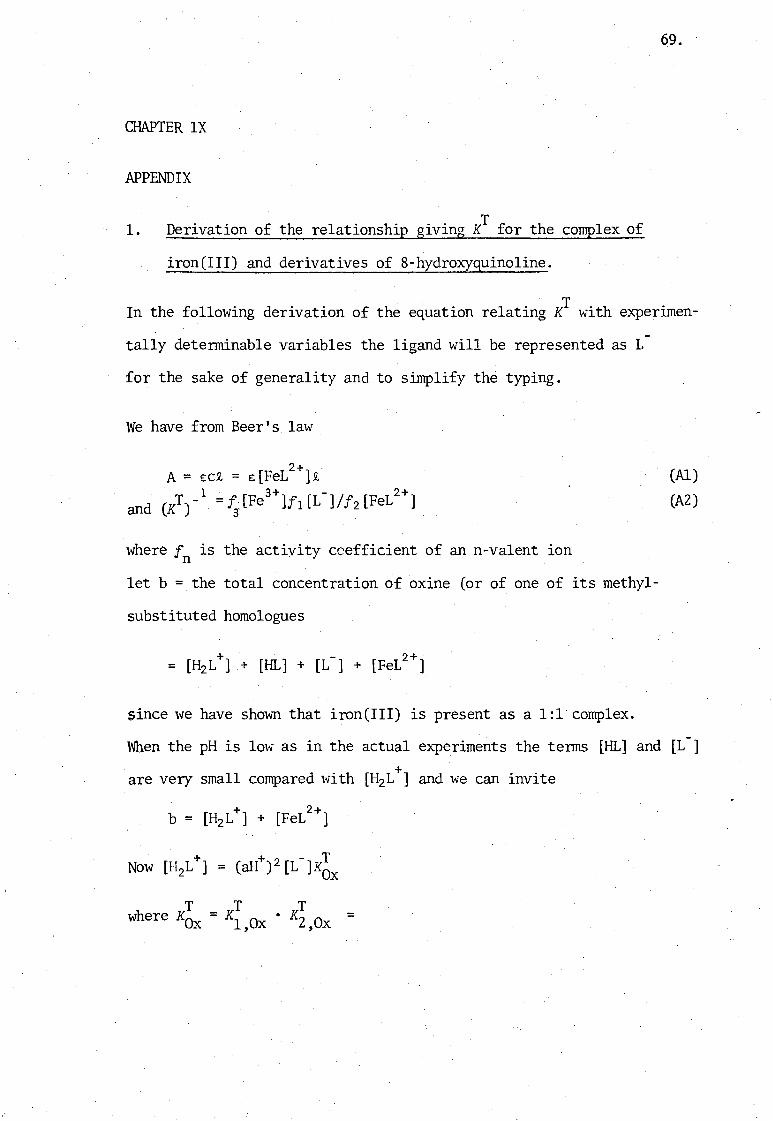
CHAPTER IX
APPENDIX
1. Derivation of the relationship giving KT for the complex of
iron(rII) and derivatives of 8-hydroxyquinoline.
69.
In the following derivation of the equation relating KT with experimen
tally determinable variables the ligand will be represented as L-
for the sake of generality and to simplify the typing.
We have from Beer's law
where in is the activity ccefficient of an n-valent ion
let b = the total concentration of oxine (or of one of its methyl-
substituted homologues
since we have shown that iron(III) is present as a 1:1 complex.
(Al)
(A2)
When the pH is low as in the actual experiments the terms [HL] and [L-]
are very small compared with [H2L+] and we can invite
+ 2+ b = [H2L ] + [FeL ]
Now [H2L+] = (aI--t)2[L-]K~x
T T • KT where KOx = Kl,Ox 2,Ox =
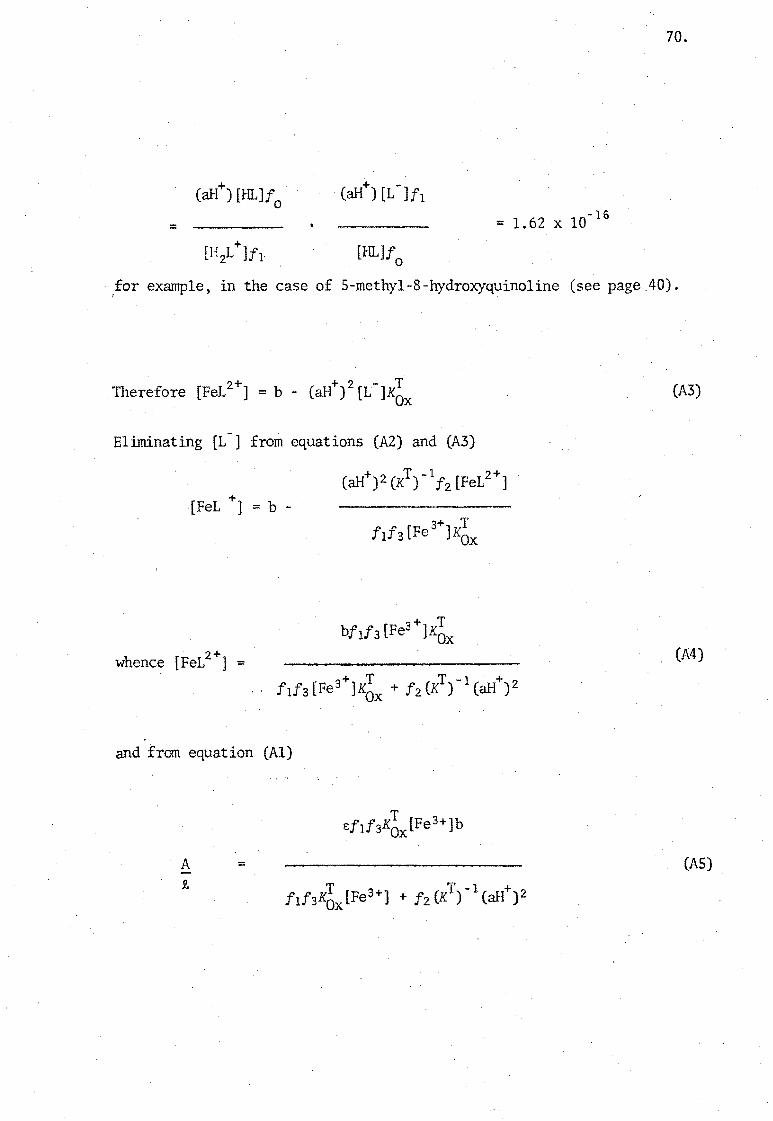
70.
= = 1.62 X 10- 16
[HL]f o
(
for example, in the case of 5-methyl-8-hydroxyquinoline (see page.40).
. 2+ + 2 - T Therefore [FeL ] = b - (aH) [L ]KOx
Eliminating [L-] from equations (A2) and (A3)
(aH+) 2 (KT)-lf2 [FeL2+] + [FeL ] = b -
and from equation (AI)
A 9.
=
CA3)
CA4)
(AS)
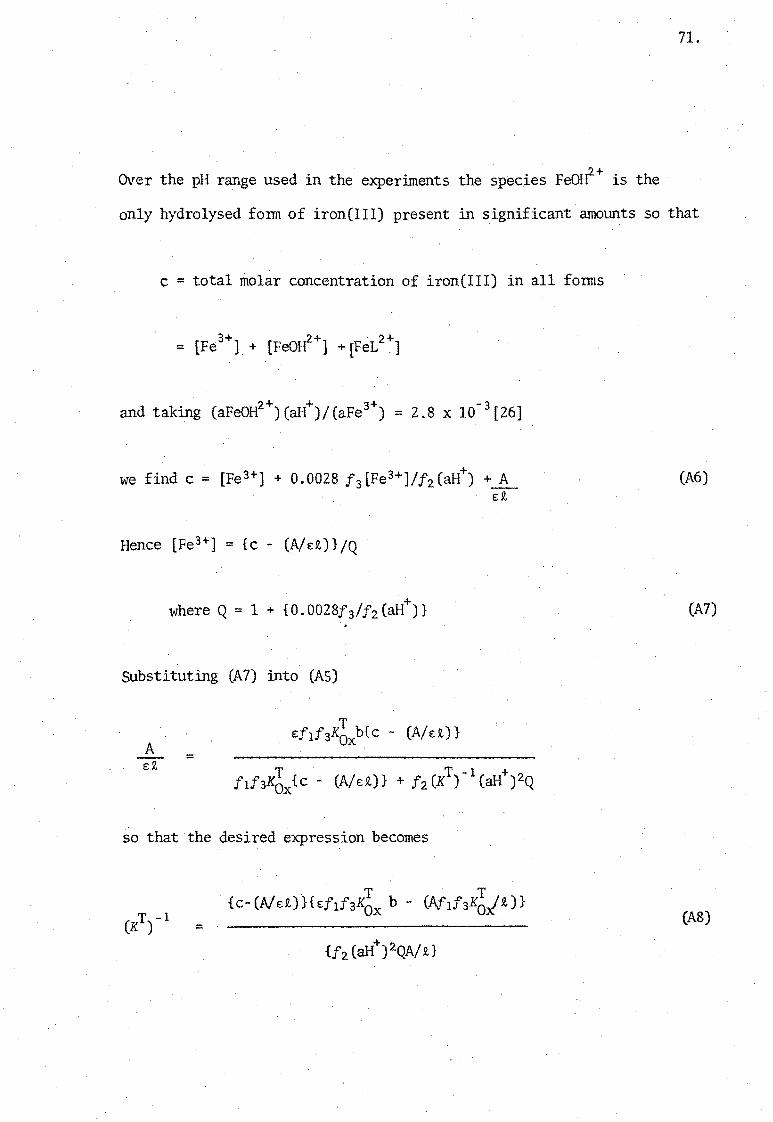
71.
Over the pH range used in the experiments the species FeOW+ is the
only hydrolysed fonn of iron(III) present in significant amounts so that
c = total molar concentration of iron(III) in all forms
3+ 2+ 2+ = [Fe ] + [FeOH ] +[FeL ,]
2+ + 3+ -3 . and taking (aFeOH )(aH )/(aFe ) = 2.S x 10 [26]
(A6)
Hence [Fe3+] = {c - (Ne:9..)}/Q
+ where Q = 1 + {0.002Sf3/f2(aH )} (A7)
Substituting (A7) into (AS)
=
so that the desired expression becomes
= (AS)
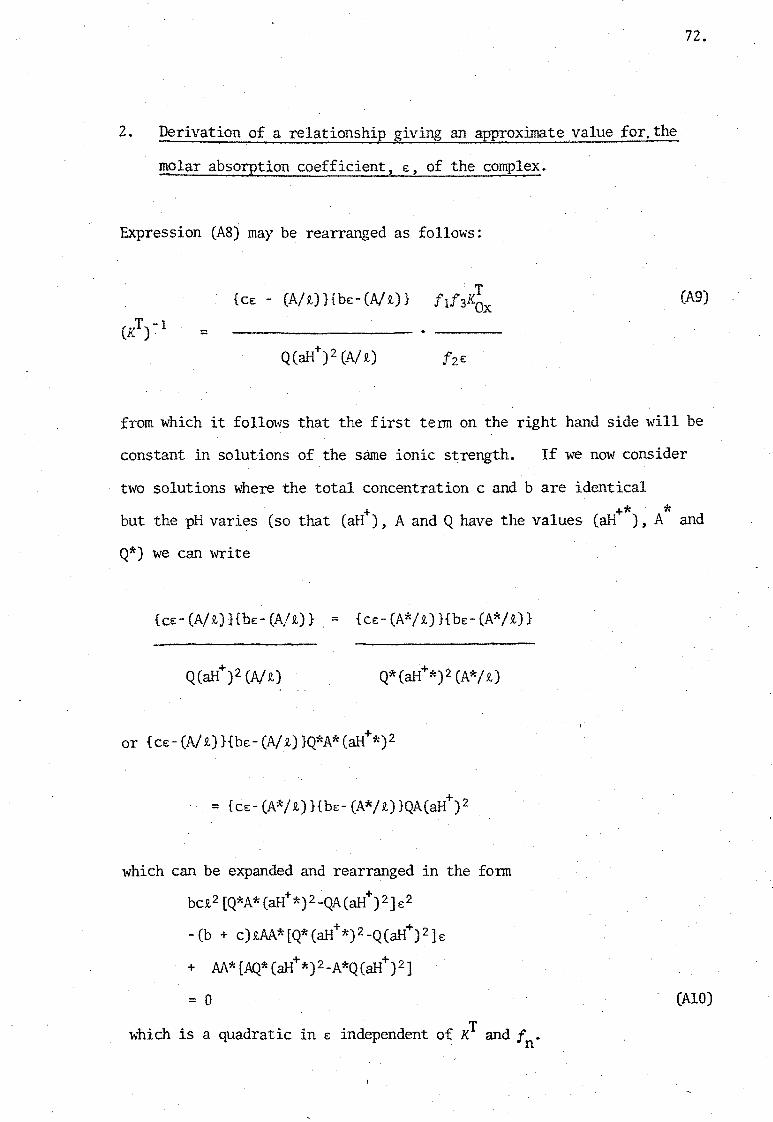
2. Derivat~onof a relationship giving an approximate value for. the
~olar absorption coefficient, £,of the complex.
Expression (AS) may be rearranged as follows:
=
72.
(A9)
from which it follows that the first term on the right hand side will be
constant in solutions of the same ionic strength. If we now consider
two solutions where the total concentration c and b are identical + +* * but the pH varies (so that (aH ), A and Q have the values (aH ), A and
Q*) we can write
{c£- (AI R.) Hb£- (AI R.)} = {c£- (A*/1) Hb£- (A* 11)}
+ = {c£-(A*IR.)}{bE-(A*/t)}QA(aH )2
which can be expanded and rearranged in the fom
bct2[Q*A*(aH+*)2-QA(aH+)2)£2
+ + -(b + c)R.AA*[Q*(aH *)2_Q(aH )2]£
+ AA*[AQ*(aH+*)2_A*Q(aH+)2]
= 0
Which is a quadratic in £ independent of KT and f . . n
(AlO)

REFERENCES
REFERENCES
1. E. B. Sandell, "Colorimetric Detenninations of Traces of Metals",
3rd ed., Interscience, New York (1959).
2. E.B. Sandell and D.C. Spindler, J. Amer. Chem. Soc.~ 71 (1949)
3806-9.
3. J.P. Phillips and H.P. Price, J. Amer. Chem. Soc.~ 73 (1951)
. 4414-5.
4. Noe1ting, Chem. Ber.~ 23 (1890) 3666.
5. J. Gibson, J. Chem. Soc.~ 127 (1925) 44.
73.
6. L. Spiegel, N .. Munb1it and H. Kaufman, Chem. Ber.~ 39 (1906) 3240.
7. P. Job, Ann. chim .. , 9 (1928) 113.
8. W.C. Vosburgh and G.R. Cooper, J. Amer. Chern. Soc.~ 63 (1941) 437.
9. J. Kie11and, J. Amer. Chem. Soc.~ 59 (1937) 1675.
10. H.S. Harned and B.B. Owen, "The Physical Chemistry of Electrolyte
Solutions" ,3rd ed., Q-lapman and Hall, London (1958).
II. W. StenstrOm and N. Goldsmith, J. Phys. Chem. ~ 30 (1926) 1683.
" " 12. R. Nasanen, Acta Chem. Scand. ~ 6 (1952) 352.
" " 13. R. Nasanenand V .. Pentt inen , Acta Chem. Sccmd. ~ 6 (1952) 837.
" " 14. R. Nasanen, P. Lumme and A.L. Muku1a, Acta Chem.~ Sccmd.~ 5 (1951) 1199.
15. A. Albert and A. Hampton, J. Chem. Soc.~ (1954) 505; A.A1bert, Biochem. J. ~ ,54 (1953) 646; A. Albert, M. I. Gibson and S.D. Rubbo,
Brit. J. expo Path.~ 34 (1953) 9.
16. D. Dyrssen, Svensk Kem. Tidskr.~ 66 (1954) 234; D. Dyrssen, Svensk Kern.
Tidskr.~ 64 (1952) 213; D. Dyrssen, Svensk Kem. Tidskr.~ 67 (1955) 711.
17. R. Trujillo and F. Brito, Anales real espan. Fis. Quim.~ 53 (1957) 313.
18. J. Tsau, S. Matsouo, P. Clerc and R. Benoit, Bull. Soc. Chim. F~ce~
(1967) 1039.
19. \ G.K. Schweitzer and M.M. Anderson, J. Inorg. Nuclear Chem.~ 30 (1968) 1057 .
•
20. S. Takata, E. Kyuno and R. Tsuchiya, Bull. Chern. Soc. Japan~
41 (1968) 2416.
2l. D.N. Hague and M.S. Zetter, Trans. Faraday. Soc. ~ 66 (1970)
22. S. Oki, Ana l. Chim. Acta~ 50 (1970) 465.
23. G. Anderegg, Belv. Chima Acta~ 57 (1974) 1340.
" " 24. R. Nasanen, Suomen Kern. ~ 28 (1955) 123.
74.
1176.
25. A.E. Gillam, E.S. Stern and C.J. Timmons, "An Introduction to Electronic Absorption Spectroscopy", 3rd Ed. Edwin Arnold London,1970.
26. T.D. Turnquist & E.B. Sandell, Anal. Chim. Acta~ 42 (1968) 239.
27. H. Irving and L.D. Pettit, Anal. Chima Acta~ (Proc. Feig1 Symposium), 1962, pp. 122-130.


![Photochemical & Photobiological Sciences€¦ · The photophysics and photochemistry of ruthenium(II)-polypyridine complexes [Ru(NN) 3] 2+ (NN= 2,2’-bipyridine and its derivatives)](https://img.pdfslide.us/doc/110x75/5f0f931d7e708231d444d6cd/photochemical-photobiological-sciences-the-photophysics-and-photochemistry.jpg)


![Abstract A bit of Ligand Field Theory Iron(II) Hexammine [Fe(NH 3 ) 6 ] 2+ Finding optimal parameters for spin-state changes in Iron(II) amine complexes](https://img.pdfslide.us/doc/110x75/56649ca35503460f94963a02/abstract-a-bit-of-ligand-field-theory-ironii-hexammine-fenh-3-6-2.jpg)


![Iron Complexes for Hydrogen Activation and Catalytic … · complex [(CyPNP)FeCl 2] (10) have been synthesized and fully characterised. Unfortunately, when these complexes were tested](https://img.pdfslide.us/doc/110x75/5b9a2ba709d3f207308d42f2/iron-complexes-for-hydrogen-activation-and-catalytic-complex-cypnpfecl-2.jpg)