Embed Size (px)
Citation preview

Complex climate controls on 20th century oak growth
in Central-West Germany
DAGMAR A. FRIEDRICHS,1,2 ULF BUNTGEN,3 DAVID C. FRANK,3 JAN ESPER,3
BURKHARD NEUWIRTH1 and JORG LOFFLER1
1 Department of Geography, University of Bonn, Meckenheimer Allee 166, 53115 Bonn, Germany
2 Corresponding author ([email protected])
3 Swiss Federal Research Institute WSL, Zurcherstrasse 111, 8903 Birmensdorf, Switzerland
Received February 13, 2008; accepted September 11, 2008; published online December 5, 2008
Summary We analyze interannual to multi-decadal
growth variations of 555 oak trees from Central-West
Germany. A network of 13 pedunculate oak (Quercus
robur L.) and 33 sessile oak (Quercus petraea (Matt.)
Liebl.) site chronologies is compared with gridded tem-
perature, precipitation, cloud-cover, vapor pressure and
drought (i.e., Palmer Drought Severity Index, PDSI)
fluctuations. A hierarchic cluster analysis identifies three
groups for each oak species differentiated by ecologic
settings. When high precipitation is primarily a charac-
teristic for one Q. robur and one Q. petraea cluster, the
other clusters are more differentiated by prevailing
temperature conditions. Correlation analysis with precip-
itation and vapor pressure reveals statistically significant
(P � 0.05) correlations for June (r = 0.51) and annual
(r = 0.43) means. Growth of both species at dry sites
correlates strongly with PDSI (r = 0.39, P � 0.05), and
weakly with temperature and cloud-cover. In natural
stands, Q. robur responds more strongly to water deple-
tion than Q. petraea. Twenty-one-year moving correla-
tions show positive significant growth response to both
PDSI and precipitation throughout the 20th century,
except for the 1940s – an anomalously warm decade
during which all oak sites are characterized by an
increased growth and an enhanced association with vapor
pressure and temperature. We suggest that the wider oak
rings that are exhibited during this period may be
indicative of a nonlinear or threshold-induced growth
response to drought and vapor pressure, and run counter
to the general response of oak to drought and precipita-
tion that normally would result in suppressed growth in a
warmer and drier environment. As the wide rings are
formed during the severe drought period of the 20th
century, a complex model seems to be required to fully
explain the widespread oak growth. Our results indicate
uncertainty in estimates of future growth trends of
Central European oak forests in a warming and drying
world.
Keywords: dendroclimatology, drought, global warming,Quercus petraea (Matt.) Liebl., Quercus robur L., tree-rings.
Introduction
Global climate change is projected to lead to a temperature
increase in Central Europe between 2.3 and 5.3 �C in the
21st century, accompanied by an overall decrease of sum-
mer precipitation (Christensen et al. 2007). Both these fac-
tors would subsequently result in a long-term shift towards
drier conditions with an increased likelihood of extreme
droughts (Schar et al. 2004). Such changes will likely cause
a decline in forest growth productivity and increased tree
mortality (Thomas et al. 2002), with subsequent implica-
tions on terrestrial carbon sequestration (Kurz et al. 2007).
Beside the uncertainties related to the wide range of future
climate estimates, a variety of biotic and abiotic factors
influencing tree growth in temperate climates (Kozlowski
and Pallardy 1997) complicate our understanding of the
interactions between biotic ecosystems and their abiotic
environments. In contrast to the higher elevations, where
tree growth is mainly limited by a single climatic factor
(Korner 1998), radial growth of trees in low-elevation tem-
perate forests reflects the interplay of temperature, precipita-
tion and radiation both before and during the growth
season. Additional disturbances derive from biotic and
other exogenous factors. It is therefore necessary to explore
a variety of climatic parameters in more integrated
approaches to understand the complex relationships
between climate variability and tree physiologic responses
in temperate forests.
To date, relationships between temperature, precipitation
and annual growth of Quercus robur L. and Quercus
petraea (Matt.) Liebl., which in terms of surface area and
economic value are important Central European forest
Tree Physiology 29, 39–51
doi:10.1093/treephys/tpn003
� The Author 2008. Published by Oxford University Press. All rights reserved.For Permissions, please email: [email protected]
Dow
nloaded from https://academ
ic.oup.com/treephys/article/29/1/39/1658944 by guest on 11 February 2022
species (Ellenberg 1996), have been intensively studied (e.g.,
Kelly et al. 1989, Becker et al. 1994, Bridge et al. 1996). The
occurrence of the so-called pointer years (Schweingruber
et al. 1990) across Europe has been explained by tempera-
ture and precipitation anomalies (Neuwirth et al. 2007)
associated with changing atmospheric circulation patterns
(Kelly et al. 2002). However, several ‘time-series’ studies
in temperate Central European forests show only moderate
coherency between oak growth and temperature and pre-
cipitation (Pilcher and Gray 1982, Bonn 1998, Lebourgeois
et al. 2004), indicating that these parameters alone do not
place strict limits on radial growth. In this regard, the
simultaneous consideration of various climatic parameters
that, for example, appear to be relevant in model simula-
tions (Nemani et al. 2003), may be particularly helpful to
provide a comprehensive interpretation of climate change
impacts on larger scale plant growth (Esper et al. 2002).
Ecophysiologic studies focusing on stomatal conductance,
photosynthetic activity and hydraulic conductivity (Epron
and Dreyer 1993, Gieger and Thomas 2005, Breda et al.
2006) and dendroclimatologic analyses (Levy et al. 1992,
Becker et al. 1994) have demonstrated differences in the
drought response of Q. robur and Q. petraea (Thomas et al.
2002).Quercus petraea is known tobemoredrought tolerant.
The overall objective of this study was to assess the influ-
ence of various climatic parameters on growth of Q. robur
and Q. petraea. A network of 13 Q. robur sites (149 trees)
and 33 Q. petraea sites (406 trees) has been established in
temperate Central-West German forests to compare oak
growth and climate under different site ecologic conditions.
We compare species growth trends and cluster sites of sim-
ilar growth behavior, separated for each species. Our sec-
ond objective was to identify the dominant climatic
factors influencing oak growth. Beside temperature and
precipitation, we analyzed the influence of cloud-cover,
vapor pressure and drought conditions, as expressed in
the Palmer Drought Severity index (PDSI), on radial
growth. We hypothesized that these climate parameters
would explain growth variations beyond the influences of
temperature and precipitation and therefore help to assess
climate controls on oak growth in widespread temperate
forests. Our third objective was to assess temporal stability
of growth responses to 20th century climate variability.
Materials and methods
Study area
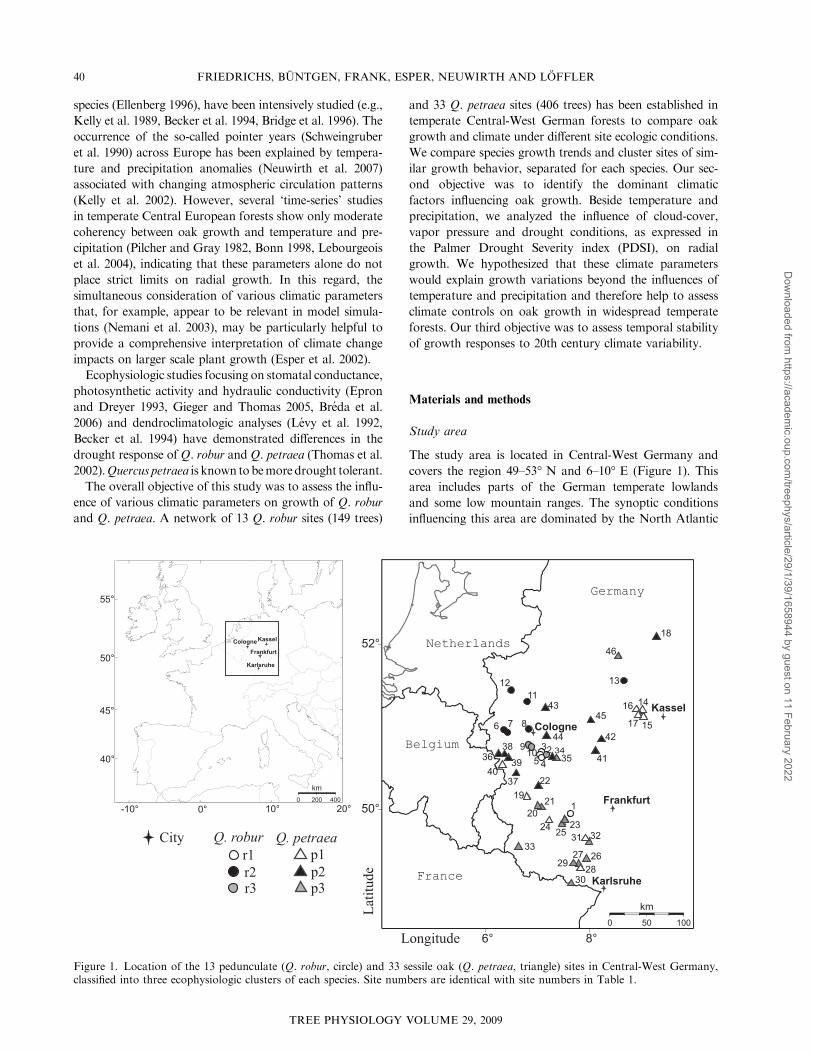
The study area is located in Central-West Germany and
covers the region 49–53� N and 6–10� E (Figure 1). This
area includes parts of the German temperate lowlands
and some low mountain ranges. The synoptic conditions
influencing this area are dominated by the North Atlantic
Figure 1. Location of the 13 pedunculate (Q. robur, circle) and 33 sessile oak (Q. petraea, triangle) sites in Central-West Germany,classified into three ecophysiologic clusters of each species. Site numbers are identical with site numbers in Table 1.
TREE PHYSIOLOGY VOLUME 29, 2009
40 FRIEDRICHS, BUNTGEN, FRANK, ESPER, NEUWIRTH AND LOFFLER
Dow
nloaded from https://academ
ic.oup.com/treephys/article/29/1/39/1658944 by guest on 11 February 2022

Oscillation during winter, whereas more localized pressure
cells occur during summer (Hurrell et al. 2003, Raible
et al. 2006). For a comprehensive analysis of complex
climate–growth interactions across Central-West Germany,
oak sites were selected to represent the full climatologic
range from temperate, moist oceanic conditions to colder
and drier continental settings. The mean annual tempera-
ture of the study region over the period 1961–1990 is
9.1 �C ranging from 6.7 to 11.7 �C. The mean annual
precipitation sum is 808 mm and ranges from 450 to
1452 mm (for detailed information about the climate
parameters see Table 2).
Table 1. Description and characteristics of the 46 site chronologies. Species: QURO = Quercus robur, QUPE = Quercus petraea;
Period (> 3 trees); MSL = mean site segment length (years); AGR = average growth rate (mm year�1); Rbar and EPS (Expressed
Population Signal) are calculated over 30 years lagged by 15 years; Elev. = Elevation (m a.s.l.); AWC = available water capacity:
1 = low (60–110 mm), 2 = mean (110–170 mm), 3 = high (170–240 mm) and 4 = very high (> 240 mm); n/a = not applicable;
Asp. = Aspect: N north, NE northeast, NW northwest, E east, W west, S south, SE southeast and SW southwest; a.Temp. = annual
temperature means; a.Prec. = annual precipitation sums; the last column indicates the cluster to which a site is grouped,
Clu. = cluster.
Site Latitude/longitude Species Period MSL AGR Rbar EPS Elev. AWC Asp. a.Temp. a.Prec. Clu.
1 49.94N/7.63E QURO 1778–2005 182 2.01 0.45 0.92 510 3 – 8.9 716 r1
2 50.72N/7.09E QURO 1847–2002 138 1.58 0.58 0.94 150 1 – 9.9 780 r3
3 50.71N/7.09E QURO 1833–2002 148 1.87 0.58 0.90 120 3 – 9.9 780 r1
4 50.67N/7.05E QURO 1832–2005 153 1.73 0.60 0.94 170 3 – 9.9 780 r1
5 50.67N/7.05E QURO 1850–2005 150 1.97 0.43 0.83 170 3 – 9.9 780 r1
6 50.93N/6.42E QURO 1835–2005 147 2.17 0.40 0.87 105 3 – 9.7 897 r2
7 50.92N/6.42E QURO 1766–2005 195 1.57 0.58 0.93 100 4 – 9.7 897 r2
8 51.05N/6.80E QURO 1865–2005 128 2.34 0.61 0.94 45 3 – 10.3 830 r2
9 50.79N/6.84E QURO 1861–2005 142 1.45 0.53 0.91 160 2 – 9.7 835 r3
10 50.79N/6.85E QURO 1855–2005 162 1.43 0.46 0.85 160 4 – 9.7 835 r3
11 51.32N/6.79E QURO 1850–2005 141 2.23 0.57 0.94 40 2 – 10.4 819 r2
12 51.46N/6.49E QURO 1812–2005 173 2.00 0.56 0.93 30 3 – 10.2 761 r2
13 51.58N/8.67E QURO 1799–2005 176 1.78 0.53 0.91 260 1 – 8.3 825 r2
14 51.17N/8.97E QUPE 1839–2005 159 1.51 0.48 0.93 290 2 SE 8.1 748 p1
15 51.16N/9.08E QUPE 1844–2005 159 1.34 0.57 0.93 350 1 S 8.4 748 p1
16 51.16N/9.08E QUPE 1856–2005 148 1.38 0.53 0.93 380 2 S 8.4 748 p1
17 51.16N/9.08E QUPE 1851–2005 148 1.64 0.47 0.87 390 2 S 8.4 748 p1
18 52.10N/9.30E QUPE 1809–2004 193 1.77 0.57 0.93 205 n/a – 8.8 783 p2
19 50.12N/6.88E QUPE 1825–2004 174 1.49 0.54 0.92 430 n/a SW 9.2 748 p1
20 50.05N/7.07E QUPE 1849–2005 150 1.71 0.58 0.93 370 n/a SW 9.4 734 p3
21 50.04N/7.07E QUPE 1831–2005 170 1.19 0.41 0.84 370 n/a S 9.4 734 p3
22 50.30N/7.01E QUPE 1832–2005 166 1.64 0.54 0.95 480 n/a E 8.8 778 p2
23 49.88N/7.58E QUPE 1813–2005 182 1.60 0.37 0.85 500 n/a S 8.9 716 p3
24 49.87N/7.23E QUPE 1661–2005 342 0.92 0.50 0.90 510 n/a E 8.6 770 p1
25 49.85N/7.47E QUPE 1824–2005 176 1.39 0.47 0.91 420 n/a SE 8.7 747 p3
26 49.38N/7.87E QUPE 1819–2005 177 1.45 0.56 0.93 500 1 SW 9.2 721 p3
27 49.30N/7.75E QUPE 1708–2005 288 1.18 0.60 0.94 400 n/a NW 9.3 727 p3
28 49.26N/7.81E QUPE 1717–2005 282 0.88 0.59 0.93 480 2 SW 9.3 727 p1
29 49.24N/7.79E QUPE 1715–2005 257 1.12 0.35 0.85 490 2 S 9.3 727 p3
30 49.06N/7.64E QUPE 1713–2005 246 1.32 0.60 0.95 390 2 – 9.5 721 p3
31 49.61N/7.92E QUPE 1805–2005 192 0.96 0.55 0.94 500 1 NE 9.3 696 p1
32 49.62N/9.72E QUPE 1840–2005 164 1.02 0.49 0.93 500 1 SW 9.3 696 p3
33 49.52N/6.61E QUPE 1649–2005 276 1.14 0.48 0.89 290 n/a E 9.5 806 p3
34 50.66N/7.24E QUSP 1863–2004 119 1.92 0.66 0.96 230 2 W 9.3 769 p2
35 50.67N/7.25E QUSP 1863–2004 126 1.44 0.57 0.94 355 2 N 9.3 769 p3
36 50.67N/6.33E QUSP 1846–2004 152 1.40 0.55 0.93 320 2 N 8.0 1146 p2
37 50.44N/6.57E QUPE 1868–2004 135 1.52 0.49 0.91 560 3 E 8.0 958 p2
38 50.68N/6.28E QUPE 1809–2004 170 1.46 0.55 0.93 440 1 NE 8.7 1058 p2
39 50.62N/6.41E QUSP 1812–2004 181 1.49 0.51 0.84 400 2 NW 8.0 1057 p2
40 50.57N/6.36E QUPE 1847–2004 153 1.26 0.64 0.95 490 2 SE 8.0 1057 p1
41 50.73N/8.12E QUPE 1750–2005 188 1.30 0.58 0.94 480 2 S 8.3 773 p2
42 50.87N/8.23E QUPE 1857–2005 144 1.14 0.42 0.90 480 2 S 8.2 793 p2
43 51.23N/7.11E QUPE 1863–2005 137 1.54 0.51 0.83 260 1 SW 10.1 860 p2
44 50.93N/7.14E QUPE 1820–2005 168 1.68 0.58 0.92 120 1 W 10.4 800 p2
45 51.10N/8.02E QUPE 1842–2005 147 1.25 0.43 0.84 470 1 SE 8.4 807 p2
46 51.89N/8.58E QUPE 1837–2005 164 1.55 0.52 0.90 110 2 N 9.5 751 p3
CLIMATE CONTROLS ON OAK GROWTH 41
TREE PHYSIOLOGY ONLINE at http://www.treephys.oxfordjournals.org
Dow
nloaded from https://academ
ic.oup.com/treephys/article/29/1/39/1658944 by guest on 11 February 2022

Tree data
During 2005 and 2006, we collected 13 Q. robur (149 trees)
and 33 Q. petraea sites (406 trees). In each site, two cores
were extracted from at least 12 dominant trees at breast
height (� 1.3 m above ground). All trees were sampled in
the so-called nature forest reserves that have been estab-
lished in old stands with less silvicultural influence (Balcar
1995, Schulte and Scheible 2005). The oaks are primarily
located in closed and mature stands often associated with
beech (Fagus sylvatica L.). While allQ. robur sites are found
on plateaus (< 5% slope), slopes of the Q. petraea sites
range between 5% and 40%, including a variety of aspects.
Soil analyses revealed predominant cambisols and luvisols
typical for temperate forests in Central-West Germany
(Schulte and Scheible 2005). The sites of the network exhi-
bit low (60–110 mm) to very high (> 240 mm) available
water capacity (AWC) (Table 1), determined using data
from various soil parameters. The network ranges from
30 to 560 m a.s.l. The sites located in the north-western
part (Nos. 6–8, 11 and 12 in Figure 1) represent the low-
lands with the warmest temperatures and the highest pre-
cipitation. In contrast, coldest temperatures occur at the
higher elevation sites in the western and central parts of
the research area, accompanied by increased precipitations
(for ecologic site information see Table 1). Southern and
eastern sites generally receive less precipitation.
Meteorologic data
For growth/climate response analyses (Frank and Esper
2005a), gridded (0.1 · 0.1�) monthly temperature means
and precipitation sums (CRUTS1.2, Mitchell et al. 2004),
monthly cloud-cover percentage, vapor pressure
(0.5 · 0.5�; CRUTS2.1, Mitchell and Jones 2005) and the
self-calibrated PDSI (0.5 · 0.5�; van der Schrier et al.
2006) were used. All parameters were expressed as anoma-
lies during the 1961–1990 period and significance levels con-
servatively corrected for lag-1 autocorrelation (Trenberth
1984). Values from the four closest grid-boxes were aver-
aged for Pearson’s correlation analyses with the tree-ring
chronologies, whereas the mean climate series of all grids
were used for redundancy analysis (RDA). Cloud-cover
data were only used from 1950 to 2002, as earlier data rep-
resent little more than the average seasonal cycle.
Tree-ring analysis
Tree-rings of each core were measured to the nearest
0.01 mm using the program TSAPWin (Rinn 2003). Two
radii were averaged to one tree series and dating errors
were corrected on a site-by-site basis using the program
COFECHA (Holmes 1983). The raw measurement series
were aligned by cambial age to best describe age-related
growth trends (Fritts 1976), using the program ARSTAN
(Cook 1985). The resulting Regional Curves (RCs) were
analyzed for species- and site-specific differences (Esper
et al. 2003). Standardization was applied to remove non-
climatic, tree-age-related growth trends from the raw data.
For the preservation of interannual to centennial-scale
variability, series were individually detrended using
300-year cubic smoothing splines with 50% frequency-
response cutoff equal to 300 years (Cook and Peters
1981). Indices were then calculated as ratios from the esti-
mated growth curves and series averaged using a bi-weight
robust mean (Cook 1985) to form variance adjusted site
chronologies (Frank et al. 2007b), truncated at < 3 trees.
Signal strength of the site chronologies was assessed
using a moving window approach of the interseries correla-
tion (Rbar) and the expressed population signal (EPS). The
Rbar is a measure of common variance between single ser-
ies, which does not specifically consider changes in sample
replication, whereas EPS, considering both Rbar and sam-
ple replication, is a measure that determines how well a
chronology, based on a finite number of trees, represents
the theoretical population chronology from which it has
been drawn (Wigley et al. 1984).
Cluster analysis was performed to identify homogeneous
subsets within the tree-ring network (for details on this par-
ticular dataset, see Friedrichs et al. 2008). The hierarchic
clustering proceeded in stepwise calculations leading from
n clusters of one object (tree site) to one cluster containing
all objects (Jongman et al. 1987). Using Ward’s method, the
cluster variance, calculated as mean squared Euclidian
distance, was evaluated for each cluster and the sum
of all clusters represented the overall variance within the
clusters. This procedure maximizes the variance among
clusters, whereas the variance within clusters is minimized
(Bahrenberg et al. 2003).
Table 2. Correlations between the five climate parameters using
unfiltered (upper right) and 20-year low-pass filtered data (bold
numbers illustrate significant – P � 0.05 – relationships), and
mean, minimum and maximum values of each climate parameter
(precipitation (Prec.) in mm; temperature (Temp.) in �C; PDSI
from 4.0 to �4.0 = extreme wetness to extreme drought;
cloud-cover in %; vapor pressure in Pa) for the annual period;
the vegetation period (April–September, A–S); and summer
period (June–August, J–A). Values are calculated over the
period 1961–1990. Minimum and maximum values are absolute.
Prec. Temp. PDSI CC VP
Prec. �0.08 0.68 0.61 0.17
Temp. 0.19 �0.17 �0.36 0.79
PDSI 0.55 �0.33 0.53 0.09
CC 0.07 �0.09 0.72 �0.06VP 0.39 0.94 �0.03 0.06
Annual mean 808 9.1 0.25 75 9.4
minimum 450 6.7 �3.66 64 8.4
maximum 1452 11.7 4.45 83 10.7
A–S mean 423 14.1 0.11 68 11.8
minimum 177 11.6 �4.00 51 10.6
maximum 736 16.6 4.13 78 13.4
J–A mean 282 16.7 0.12 66 13.5
minimum 94 13.8 �4.00 43 11.8
maximum 464 20.3 4.35 80 15.6
42 FRIEDRICHS, BUNTGEN, FRANK, ESPER, NEUWIRTH AND LOFFLER
TREE PHYSIOLOGY VOLUME 29, 2009
Dow
nloaded from https://academ
ic.oup.com/treephys/article/29/1/39/1658944 by guest on 11 February 2022

Growth/climate response analysis
The classified sites of the cluster analysis were averaged and
the ‘mean cluster chronologies’ were considered for
growth/climate analysis. For a detailed growth/climate
response assessment, Pearson’s correlations were computed
over the maximum period of each climate parameter over a
17-month window fromMay of the year before tree growth
until September of the current year. The five climate param-
eters, temperature, precipitation, vapor pressure, cloud-
cover and PDSI, were additionally averaged to various
seasonal means: March–May, April–September, June–
August, September–October and June (year before
growth)–July (year of growth), and annual means. The
RDAwas applied to detect themost important growth influ-
encing climate variables that were extracted from monthly
and annual data of all climate parameters over the common
time interval of 1951–2000, using the program CANOCO
(Version 4.5, ter Braak and Smilauer 2002). The RDA is a
multivariate ‘direct’ gradient analysis and its ordination axes
are constrained to represent linear combinations of supplied
environmental variables (Legendre and Legendre 1998). Sig-
nificant (P < 0.05) climate variables were obtained using a
MonteCarlo permutation-based forward selection.The tem-
poral stability of growth/climate relationships was analyzed
using 21-year moving correlation windows. This window-
length is a compromise between isolating signal changeswith
the highest possible temporal resolution and having enough
data-points to estimate the signal.
Results
Growth trends and clusters
The average growth rates per tree (AGR) of Q. robur and
Q. petraea were 1.88 mm (range 0.93–3.08) and 1.36 mm
(range 0.69–2.64), respectively. During the first 100 years,
differences in AGR of Q. robur and Q. petraea (2.00 and
1.38 mm year�1) are even more distinct. The RCs of both
species (Figure 2A) confirm these differences that are typical
of species with varying life spans. Initially, Q. robur reveals
enhanced growth (2.56 mm year�1) in comparison to
Q. petraea (< 2 mm year�1; Figure 2A), while in the follow-
ing years growth rates become more similar (Figure 2A).
Both species show age-related growth trends, a widely
known association between decreasing ring diameter and
increasing tree age. Trees of Q. robur are younger (mean
age: 156 years) than trees of Q. petraea (mean age:
183 years). The mean site segment length (MSL, number
Figure 2. (A) Mean growth trends (the RCs) of the 46 sites after aligning all measurement series by cambial age (light gray). Mean RCswere calculated from Q. robur (black) and Q. petraea (gray). (B) Temporal distribution of the 149 Q. robur series (black) and 406 Q.petraea series (gray), with each bar representing one tree. (C) The 46 site chronologies (light gray) after 300-year spline detrending, themean of Q. robur (black) and the mean of Q. petraea (gray).
CLIMATE CONTROLS ON OAK GROWTH 43
TREE PHYSIOLOGY ONLINE at http://www.treephys.oxfordjournals.org
Dow
nloaded from https://academ
ic.oup.com/treephys/article/29/1/39/1658944 by guest on 11 February 2022

of rings per core) ranges from 71 to 272 and from 99 to
363 years, respectively (Figure 2B).
The oak network is characterized by a continuous reduc-
tion in sample replication over the 19th century, with 18
trees reaching back to 1700. After the 300-year spline
detrending, fairly common growth variations between the
Quercus chronologies are obtained (Figure 2C). Quercus
robur and Q. petraea have mean Rbar and EPS values of
all site chronologies of 0.30 and 0.37, and 0.95 and 0.98,
respectively. Although EPS values slightly decrease toward
the record’s earlier portions, they generally remain above
the frequently applied threshold of 0.85 (Wigley et al.
1984), and suggest robust mean chronologies.
To identify sites with similar and different variations in
growth, to achieve a higher signal coherency within the data,
and to reach a better understanding of tree responses to
environmental conditions, three clusters of common growth
patterns are compiled for each species. The clusters vary in
the numbers of site chronologies included (r = Q. robur,
p = Q. petraea, r1 = 4, r2 = 6, r3 = 3, p1 = 9,
p2 = 12 and p3 = 12) and in their ecologic settings. Most
of the Q. robur sites are located in the north-western part of
the research area, characterized by higher temperatures
(Figure 1). Sites of r2 represent north-western lowlands with
high precipitation, whereas sites of r1 and r3 are located
between the western and central low mountain ranges.
The p1 includes sites of the eastern and southern parts, char-
acterized by less precipitation and slightly cooler tempera-
tures compared to the other parts of the research area.
Sites growing under more rain-laden conditions in the wes-
tern and central low mountains primarily occur in p2. In
contrast, warmer and drier growth conditions of southern
sites dominate p3 (details in Table 1).
Spatial patterns of growth/climate responses
The five climate parameters that are used for comparison
with tree growth are cross-correlated and thus are not fully
independent. The highest correlation is observed between
temperature and vapor pressure (0.79), and it increases to
0.94 when low-pass filtering the data (Table 2). This strong
positive relation is induced by the physical dependency of
vapor pressure values on temperature variation. The direct
influence of the amount of precipitation on the strength
and frequency of droughts leads to a strong positive coupling
between precipitation and PDSI (0.68). A consistent increase
ordecrease in theclimatecorrelationvaluesbetweentheunfil-
tered and low-pass filtered data is not observed (Table 2).
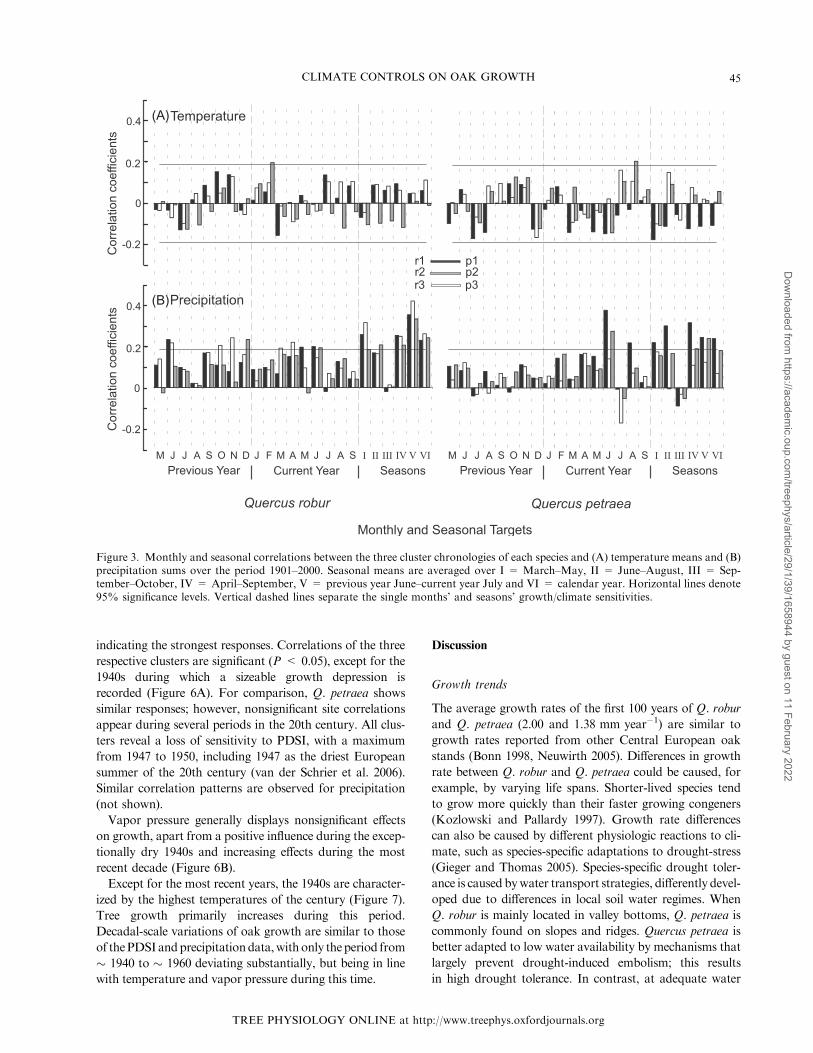
Correlation analyses with the six clusters (Figure 3A)
indicate weak temperature influences on tree growth, as
the results are mostly nonsignificant (significance is defined
with P � 0.05). Coherence between growth and precipita-
tion is generally positive and stronger in comparison to
temperature (Figure 3B). While June is the month with
the most relevant rainfall for growth of Q. petraea, months
of the previous year, winter and spring also influence
growth of Q. robur. The cumulative effect of single month
precipitation sums, such as March, April and May, leads
to notably higher correlations with the seasonal means. Pre-
cipitation sums of previous year June–July most frequently
influence tree growth (r1, r2, r3, p1 and p3), including the
overall highest correlation (r = 0.44)with the north-western
lowland cluster r2.Only p2, including the high-elevation sites
in the western and central low mountains, shows no signifi-
cant response to precipitation.
Comparison among the growth rates and the cloud-cover
data reveals small influences. Previous year August
cloudiness and conditions of spring and of the previous year
June–July period partly influence growth of r1, r3 and p1.
All correlations between p2, p3, r2 and cloud-cover data
are insignificant (Figure 4A).
In contrast, PDSI conditions strongly influence growth of
all Q. robur sites (Figure 4B). Drought conditions in spring
and summer are most relevant with the highest correlation
between April PDSI and r2 (r = 0.39). In comparison, sig-
nificant response of Q. petraea is only found in p1 with
highest correlation in June (r = 0.29). The p2 and p3 reveal
nonsignificant correlations with PDSI suggesting that
drought sensitivity separates the oak species more strictly
than the other climate parameters.
In addition, significant correlations are found for
monthly and seasonal vapor pressures in both species,
including generally positive growth responses to increasing
pressure (r1, r2, p2 and p3). Annual and previous June–July
pressure values have strong influence on growth (Figure
4C). Vapor pressure even influences growth of p2, whereas
other climate parameters show no effect.
The RDA confirms water supply as the most important
growth influence and explains 48% of growth variability
by the selected climate parameters, with April PDSI
(17%) being most influential (Figure 5). Spring conditions
of PDSI, precipitation and cloud-cover are positively
correlated with the first axis, and all cluster chronologies
have a positive loading on the first axis, which explains
38% of the total dataset variance, indicating that both spe-
cies are affected in a similar way by regional climate.
Annual temperature and vapor pressure have high scores
on the second (orthogonal) RDA axis, which accounts
for 6% of the total variance. Overall, growth variations
between the clusters are verified by the clusters’ position
on the second axis, but species-specific differences cannot
be detected. However, the stronger response of Q. petraea
(p1) to summer than of Q. robur (r1, r2 and r3) to spring
drought, shown in the correlation analysis, is also found.
Temporal response changes
To explore temporal changes in the relationships between
the various climatic parameters and tree growth, moving
window correlations were applied between the oak clusters
and gridded instrumental data. Results for PDSI and the
six clusters are generally positive, with the Q. robur clusters
44 FRIEDRICHS, BUNTGEN, FRANK, ESPER, NEUWIRTH AND LOFFLER
TREE PHYSIOLOGY VOLUME 29, 2009
Dow
nloaded from https://academ
ic.oup.com/treephys/article/29/1/39/1658944 by guest on 11 February 2022
indicating the strongest responses. Correlations of the three
respective clusters are significant (P < 0.05), except for the
1940s during which a sizeable growth depression is
recorded (Figure 6A). For comparison, Q. petraea shows
similar responses; however, nonsignificant site correlations
appear during several periods in the 20th century. All clus-
ters reveal a loss of sensitivity to PDSI, with a maximum
from 1947 to 1950, including 1947 as the driest European
summer of the 20th century (van der Schrier et al. 2006).
Similar correlation patterns are observed for precipitation
(not shown).
Vapor pressure generally displays nonsignificant effects
on growth, apart from a positive influence during the excep-
tionally dry 1940s and increasing effects during the most
recent decade (Figure 6B).
Except for the most recent years, the 1940s are character-
ized by the highest temperatures of the century (Figure 7).
Tree growth primarily increases during this period.
Decadal-scale variations of oak growth are similar to those
of thePDSIandprecipitationdata,withonly theperiod from
� 1940 to � 1960 deviating substantially, but being in line
with temperature and vapor pressure during this time.
Discussion
Growth trends
The average growth rates of the first 100 years of Q. robur
and Q. petraea (2.00 and 1.38 mm year�1) are similar to
growth rates reported from other Central European oak
stands (Bonn 1998, Neuwirth 2005). Differences in growth
rate between Q. robur and Q. petraea could be caused, for
example, by varying life spans. Shorter-lived species tend
to grow more quickly than their faster growing congeners
(Kozlowski and Pallardy 1997). Growth rate differences
can also be caused by different physiologic reactions to cli-
mate, such as species-specific adaptations to drought-stress
(Gieger and Thomas 2005). Species-specific drought toler-
ance is caused bywater transport strategies, differently devel-
oped due to differences in local soil water regimes. When
Q. robur is mainly located in valley bottoms, Q. petraea is
commonly found on slopes and ridges. Quercus petraea is
better adapted to low water availability by mechanisms that
largely prevent drought-induced embolism; this results
in high drought tolerance. In contrast, at adequate water
Figure 3. Monthly and seasonal correlations between the three cluster chronologies of each species and (A) temperature means and (B)precipitation sums over the period 1901–2000. Seasonal means are averaged over I = March–May, II = June–August, III = Sep-tember–October, IV = April–September, V = previous year June–current year July and VI = calendar year. Horizontal lines denote95% significance levels. Vertical dashed lines separate the single months’ and seasons’ growth/climate sensitivities.
CLIMATE CONTROLS ON OAK GROWTH 45
TREE PHYSIOLOGY ONLINE at http://www.treephys.oxfordjournals.org
Dow
nloaded from https://academ
ic.oup.com/treephys/article/29/1/39/1658944 by guest on 11 February 2022

availability, Q. robur uses the available water to a great
extent; this results in higher growth rates and lowered water
use efficiency (Ponton et al. 2001).
Spatial patterns of growth responses
No growth dominating climate parameters, such as summer
temperatures at higher elevations (Buntgen et al. 2005,
2007, 2008, Esper et al. 2005a, 2005b, Frank and Esper
2005a, 2005b) appear in this study. Growth of Q. robur and
Q. petraea depends on both soil and atmospheric moisture.
Drought conditions, precipitation and vapor pressure
values are found to be most important for growth, whereas
cloud-cover and temperature have only little impact on
tree-ring growth.
We found a range of cluster-specific responses to PDSI
and precipitation that provided a more detailed picture of
drought stress. When drought can have significant impacts
on all Q. robur clusters, only p1 of the Q. petraea clusters
responds significantly. Beside the well-known higher
drought sensitivity of Q. robur (Cochard et al. 1992, Levy
et al. 1992), different response patterns between both species
under temperate forest conditions are noteworthy. Quercus
robur responds to the conditions from previous year autumn
until the end of the growth period with highest sensitivity in
spring (March–May). The responding cluster of Q. petraea
Figure 4. Monthly and seasonal correlations between the three cluster chronologies of each species and (A) cloud-cover, (B) PDSI and(C) vapor pressure over the period 1901–2002. Cloud-cover correlations refer to the 1950–2002 period. Seasonal means are averagedover I = March–May, II = June–August, III = September–October, IV = April–September, V = previous year June–current yearJuly and VI = calendar year. Horizontal lines denote 95% significance levels. Vertical dashed lines separate the single months’ andseasons’ growth/climate sensitivities.
46 FRIEDRICHS, BUNTGEN, FRANK, ESPER, NEUWIRTH AND LOFFLER
TREE PHYSIOLOGY VOLUME 29, 2009
Dow
nloaded from https://academ
ic.oup.com/treephys/article/29/1/39/1658944 by guest on 11 February 2022

is primarily controlled by summer droughts (Figures 4B and
5, also found for precipitation in Figure 3B). Therefore, cli-
mate in the year before ring formation is primarily relevant
for Q. robur (Figures 3 and 4). These lag-responses indicate
the importance of carbohydrate storage (Kozlowski and
Pallardy 1997) that is mainly modulated via tree physiologic
processes during previous year summer and autumn (Barba-
roux and Breda 2002). Mobilization of the stored carbohy-
drates during current year spring is essential for ring
formation, as oak earlywood vessels are already determined
before or at the time of bud burst (Barbaroux and Breda
2002), a typical feature of ring-porous deciduous trees
(Dougherty et al. 1979, Hacke and Sauter 1996, Garcıa-
Gonzalez and Fonti 2006).
Not only the previous year PDSI and precipitation, but
also hydroclimatic spring, mainly March and April, condi-
tions affect all Q. robur sites and clusters (Figures 3B, 4B
and 5). Positive growth responses demonstrate the impor-
tance of water supply at the beginning of the growing season
(Garcıa-Gonzalez andEckstein 2003). ForQ.petraea, signif-
icant coherence with rainfall variations is primarily found in
summer (Figures 3B, 4B and 5). Sufficient moisture content
is essential for increased cambial activity resulting in wide
tree-rings, a characteristic feature described for numerous
deciduous stands across the European continent (Hughes
et al. 1978, Bridge et al. 1996, Rozas 2005, Ufnalski 2006,
Griggs et al. 2007, Neuwirth et al. 2007). Hence, the signifi-
cant correlation of annual precipitation sums with Q. robur
represents the combined impact of months influencing early-
wood (previous autumn–winter and current spring) and late-
wood growth (late spring and summer), whereas the
significant correlations ofQ. petraea are found with summer
months.
Beside these differences in species-specific climate sensi-
tivity, variations in response intensity and seasonality are
found among the clusters of Q. petraea. Overall drier site
conditions of p1 located in the eastern and southern part
of the research area (Table 1) lead to higher drought sensi-
tivity in comparison to site conditions of p2. Although the
AWC is not high, p2 is the only cluster where neither
precipitation (Figure 3B) nor PDSI (Figure 4B) signifi-
cantly influence growth. The combination of cool tempera-
tures and high precipitation likely causes moderate growth
conditions in p2, representing sites of the western and cen-
tral low mountains (Table 1). Oaks of p3, mainly located in
the warm southern part of the research area, respond to
precipitation and not to PDSI as p1 does. Explanation of
differences between the cluster responses by means of the
available ecologic site information remains tentative. We
suggest that the mean AWC of p3 suffices to endure
drought events without any significant growth reductions,
however, growth rates are still positively controlled by high
precipitation.
Quercus robur clusters show only small differences in the
intensity of climate responses; r1 reacts slightly less sensitive
to water supply than r2 and r3. However, AWC ranges
from medium to high among the clusters r1–r3 (Table 1).
Although PDSI and precipitation data are associated, their
specific properties obviously lead to different effects on tem-
perate forest growth. As the strength and frequency of
drought depends on the amount of precipitation and local
temperature, and on the rate of soil–water depletion, PDSI
is a better measure for growth conditions than precipitation
alone (Esper et al. 2007a). The PDSI broadly represents
water availability: when sufficient moisture exists, the sto-
mata can dilate, allowing for greater photosynthetic activity
(Kozlowski and Pallardy 1997). When precipitation reveals
no persistence between years, lag-1 autocorrelation is 0.09
calculated over the 1902–2000 period (mean of all station
data), interannual persistence is high in PDSI (0.57) and
is found in the tree-ring data (0.50, 1902–2000, mean of
all values) in the same order.
The strong growth controls of vapor pressure are not
only induced by the vapor pressures’ dependence on tem-
perature, because several significant vapor pressure influ-
ences are found (Figure 4C) in which direct temperature
impact on growth is negligible (Figure 3A). Effects of vapor
pressure on growth of both species are assumed to reflect a
change in stomatal conductance related to a vapor pressure
deficit. Decreasing vapor pressure means increasing vapor
pressure deficit among leaves and air inducing partial sto-
mata closure (Oren et al. 1999), which in turn leads to
Figure 5. The RDA calculated from the species cluster chro-nologies and the monthly and annual climate parameters for theperiod 1951–2000. The vectors (arrows) represent the significantclimate factors; the longer the vector the more important theclimate parameter. PDSI = Palmer Drought Severity Index,P = precipitation, T = temperature, C = cloud-cover andV = vapor pressure; the numbers represent the months (e.g.,4 = April and 13 = annual value). The correlation between thevariables is illustrated by the cosine of the angle between twovectors. Vectors pointing in nearly the same direction indicate ahigh positive correlation, vectors pointing in opposite directionshave a high negative correlation, and vectors crossing at rightangles relate to a near zero correlation (Legendre and Legendre1998).
CLIMATE CONTROLS ON OAK GROWTH 47
TREE PHYSIOLOGY ONLINE at http://www.treephys.oxfordjournals.org
Dow
nloaded from https://academ
ic.oup.com/treephys/article/29/1/39/1658944 by guest on 11 February 2022

decreasing photosynthesis and thus growth reductions
(Kozlowski and Pallardy 1997). The growth response to
vapor pressure, however, varies between the species-specific
clusters. The only significant climate response of the wetter
and colder sites integrated in p2 is the sensitivity to atmo-
spheric water conditions, whereas the drier sites integrated
in p1 mainly reveal soil moisture signals but no reaction
to vapor pressure changes. Quercus robur clusters r1 and
r2 respond to atmospheric and soil water conditions,
whereas growth of r3 depends solely on PDSI fluctuations,
with no vapor pressure signal being found.
Temporal response shifts
Twenty-one-year moving correlations between radial oak
growth and climate parameters (precipitation, PDSI, vapor
pressure and temperature) demonstrate temporal instability
in their relationships. The intensity of growth/climate
responses varies over time, most likely due to climate change
and tree physiologic threshold effects (Rozas 2005, Geßler
et al. 2007). Significant positive correlations between PDSI
and oak growth are interrupted during the exceptionally
warm 1940s. When both PDSI and precipitation values
declined during this period, radial growth increased
(Figure 7). This reaction seems to be related to a positive
response between growth and temperature during an excep-
tional warm period, which seems physiologically difficult to
explain. There is, however, also a possibility that distur-
bance signals from changes in human activity, such as
increased use of firewood, during World War II could have
contributed to changes in site competition and stand
dynamics. Furthermore, a reduction in the quality of instru-
mental station measurements (e.g., number of gaps) is
reported for this period (Auer et al. 2007). Between 1945
and 1949 a concentration of missing data exists in 22 out
of 26 time-series. When such data uncertainty obscures the
relationship between tree-ring and instrumental data, quan-
tification of such error remains challenging (Frank et al.
2007a). Overall, the 1940s were somehow exceptional during
the 20th century, as this period of rapid oak growth is
characterized by extraordinary high vapor pressure and
low PDSI values, indicating high atmospheric but low soil
water availability. Decreasing vapor pressure deficit between
leaf and air results in decreasing transpiration rates (Oren
et al. 1999) and high stomatal conductance (Breda et al.
2006), which promote water savings, photosynthesis and
growth. Note that this effect of vapor pressure is associated
with high temperatures. These conditions contrast with
other periods of severe droughts and growth depressions
(e.g., 1970s and ca. 1920) that are characterized by low pre-
cipitation rather than by high temperatures (Figure 7).
In summary, the growth increase under warm and dry
climate conditions in the 1940s emphasizes the complex
Figure 6. Twenty-one-year moving correlation analysis between (A) annual PDSI and (B) annual vapor pressure and the three species-specific cluster chronologies (Q. robur, dark gray line I; Q. petraea, light gray line II) plus the mean chronology of Q. robur (CM, boldblack line III). Horizontal lines denote 95% significance levels.
48 FRIEDRICHS, BUNTGEN, FRANK, ESPER, NEUWIRTH AND LOFFLER
TREE PHYSIOLOGY VOLUME 29, 2009
Dow
nloaded from https://academ
ic.oup.com/treephys/article/29/1/39/1658944 by guest on 11 February 2022

climate factors influencing growth rates of temperate for-
ests. Although obvious influences of biotic factors were
not detected in our data, they can obscure the effect of cli-
mate conditions (Esper et al. 2007b). Repeated defoliation
by lepidopteron larvae, for example, which occurs in certain
time intervals, can additionally affect the growth of oaks
(Thomas et al. 2002). Our analysis of the temporal stability
in growth/climate responses illustrates that warmer and
drier conditions predicted for the near future will not neces-
sarily lead to suppressed oak growth, as described for beech
(Geßler et al. 2007), particularly if vapor pressure increases
with increasing temperature.
Conclusions
We detail growth variability separated for Q. robur and Q.
petraea in a new oak network from Central-West Germany.
The overall response to climate is modulated by species dif-
ferences and site ecology. No coherent growth response to a
single climate parameter is evident, water supply as quanti-
fied by the PDSI, precipitation and vapor pressure is most
relevant. Consideration of PDSI and vapor pressure data
allows an improved assessment of climate-dependent
growth variations. The parameters PDSI and vapor pres-
sure used for comparison between growth and climate,
explained regional-scale growth patterns and allowed
annual ring formation to be elucidated for those sites where
no response to temperature and precipitation was obvious.
Both parameters will gain importance in a warmer and
drier climate as predicted by climate models. Quercus robur
will suffer more in the future, as it is more sensitive to cli-
mate, especially drought stress, than Q. petraea. However,
the estimation of effects of summer warming on oak pro-
ductivity in temperate forest remains difficult, as we identi-
fied an area-wide growth increase despite extraordinary
warm conditions during the 1940s.
Acknowledgments
D.A.F. was supported by the German Federal Environmental
Foundation (DBU). U.B. and D.C.F. were supported by the EC
project Millennium (Grant No. 017008). J.E. was supported via
the Oeschger Centre for Climate Change Research (Bern,
Switzerland). We thank anonymous reviewers for their comments.
References
Auer, I., R. Bohm, A. Jurkovic et al. 2007. HISTALP –
historical instrumental climatological surface time series of
the greater alpine region. Int. J. Climatol. 27:17-46.
Bahrenberg, G., E. Giese and J. Nipper. 2003. Statistische
Methoden in der Geographie 2. Multivariate Statistik. B.G.
Teubner, Stuttgart, 415 p.
Figure 7. (A) Ring-width chronologies of the three species-specific clusters (Q. robur, dark gray; Q. petraea, light gray) plus the meanchronology CM of all clusters (black). Twentieth century climate variations of the parameters; (B) PDSI (black) and precipitation(gray); and (C) vapor pressure (black) and temperature (gray) after 10-year low-pass filtering. Vertical dashed lines define the periodwith extraordinary climate/growth relationships.
CLIMATE CONTROLS ON OAK GROWTH 49
TREE PHYSIOLOGY ONLINE at http://www.treephys.oxfordjournals.org
Dow
nloaded from https://academ
ic.oup.com/treephys/article/29/1/39/1658944 by guest on 11 February 2022

Balcar, P. 1995. Naturwaldreservate in Rheinland-Pfalz: For-
schungsergebnisse aus dem Beispiel ‘‘Rotenberghang’’. AFZ
50:108–109.
Barbaroux, C. and N. Breda. 2002. Contrasting distribution and
seasonal dynamics of carbohydrate reserves in stem wood of
adult ring-porous sessile oak and diffuse-porous beech trees.
Tree Physiol. 22:1201–1210.
Becker, M., T.M. Nieminen and F. Geremia. 1994. Short-term
variations and long-term changes in oak productivity in
northeastern France. The role of climate and atmospheric
CO2. Ann. For. Sci. 51:477–492.
Bonn, S. 1998. Dendrokologische Untersuchung der Konkur-
renzdynamik in Buchen/Eichen-Mischbestanden und zu
erwartende Modifikationen durch Klimaanderungen. For-
stwissenschaftliche Beitrage Tharandt. Dresden, 226 p.
Breda, N., R. Huc, A. Granier and E. Dreyer. 2006. Temperate
forest trees and stands under severe drought: a review of
ecophysiological responses, adaption processes and long-term
consequences. Ann. For. Sci. 63:625–644.
Bridge, M.C., P.E. Gasson and D.F. Cutler. 1996. Dendrocli-
matological observations on trees at Kew and Wakehurst
place: event and pointer years. Forestry 69:263–269.
Buntgen, U., J. Esper, D. Frank, K. Nicolussi and M.
Schmidhalter. 2005. A 1052-year tree-ring proxy for Alpine
summer temperatures. Clim. Dyn. 25:141–153.
Buntgen, U., D. Frank, R.J. Kaczka, A. Verstege, T. Zwijacz-
Kozica and J. Esper. 2007. Growth responses to climate in a
multi-species tree-ring network in theWesternCarpathianTatra
Mountains, Poland and Slovakia. Tree Physiol. 27:689–702.
Buntgen, U., D. Frank, R. Wilson, M. Carrer, C. Urbinati and
J. Esper. 2008. Testing for tree ring divergence in the
European Alps. Glob. Change Biol. 14:2443–2453.
Christensen, J.H., B. Hewitson, A. Busuioc et al. 2007. Regional
climate projections. In Climate Change 2007. The Physical
Science Basis. Contribution of Working Group I to the
Fourth Assessment Report of the Intergovernmental Panel on
Climate Change. Eds. S. Solomon, D. Qin, M. Manning, Z.
Chen, M. Marquis, K.B. Averyt, M. Tignor and H.L. Miller.
Cambridge University Press, Cambridge, UK and New York,
NY, pp 847-941.
Cochard, H., N. Breda, A. Granier and G. Aussenac. 1992.
Vulnerability to air embolism of three European oak species
(Quercus petraea (Matt.) Liebl., Q. pubescens Willd., Q. robur
L.). Ann. For. Sci. 49:225–233.
Cook, E.R. 1985. A time series analysis approach to tree-ring
standardization. Dissertation. University of Arizona, Tuscon
AZ, 183 p.
Cook, E.R. and K. Peters. 1981. The smoothing spline: a new
approach to standardizing forest interior tree-ring width series
for dendroclimatic studies. Tree-Ring Bull. 41:45–53.
Dougherty, P.M., R.O. Teskey, J.E. Phelps and T.M. Hinckley.
1979. Net photosynthesis and early growth trends of a
dominant white oak (Quercus alba L.). Plant Physiol.
64:930–935.
Ellenberg, H. 1996. Vegetation Mitteleuropas mit den Alpen in
okologischer, dynamischer und historischer Sicht. Eugen
Ulmer Verlag, Stuttgart, 1096 p.
Epron, D. and E. Dreyer. 1993. Long-term effects of drought on
photosynthesis of adult oak trees (Quercus petraea (Matt.)
Liebl. and Quercus robur L.) in a natural stand. New Phytol.
125:381–389.
Esper, J., E.R. Cook and F.H. Schweingruber. 2002. Low-
frequency signals in long tree-ring chronologies and the
reconstruction of past temperature variability. Science
295:2250–2253.
Esper, J., E.R. Cook, P.J. Krusic, K. Peters and F.H. Schwe-
ingruber. 2003. Tests of the RCS method for preserving
low-frequency variability in long tree-ring chronologies. Tree-
Ring Res. 59:81–98.
Esper, J., D. Frank, R.J.K. Wilson and K.R. Briffa. 2005a.
Effect of scaling and regression on reconstructed temperature
amplitude for the past millennium. Geophys. Res. Lett. 32,
doi: 10.1029/2004GL021236.
Esper, J., R.J.S. Wilson, D. Frank, A. Moberg, H. Wanner and
J. Luterbacher. 2005b. Climate: past ranges and future
changes. Quat. Sci. Rev. 24:2164–2166.
Esper, J., D. Frank, U. Buntgen, A. Verstege, J. Luterbacher and
E. Xoplaki. 2007a. Long-term drought severity variations in
Morocco.Geophys.Res.Lett. 34, doi: 10.1029/2007GL030844.
Esper, J., U. Buntgen, D. Frank, D. Nievergelt and A. Liebhold.
2007b. 1200 years of regular outbreaks in alpine insects. Proc.
R. Soc. B 274:671–679.
Frank, D. and J. Esper. 2005a. Characterization and climate
response patterns of a high-elevation, multi-species tree-ring
network for the European Alps. Dendrochronologia 22:
107–121.
Frank, D and J. Esper. 2005b. Temperature reconstructions and
comparisons with instrumental data from a tree-ring network
for the European Alps. Int. J. Climatol. 25:1437–1454.
Frank, D., U. Buntgen, R. Bohm, M. Maugeri and J. Esper.
2007a. Warmer early instrumental measurements versus
colder reconstructed temperatures: shooting at a moving
target. Quat. Sci. Rev. 26:3298–3310.
Frank, D., J. Esper and E.R. Cook. 2007b. Adjustment for proxy
number and coherence in a large-scale temperature reconstruc-
tion. Geophys. Res. Lett. 34, doi: 10.1029/2007GL030571.
Friedrichs, D.A., B. Neuwirth, M. Winiger and J. Loffler. 2008.
Methodologically induced differences in oak site classifica-
tions in a homogeneous tree-ring network. Dendrochronolo-
gia, doi: 10.1016/j.dendro.2008.02.001.
Fritts, H.C. 1976. Tree rings and climate. Academic Press,
London, 567 p.
Garcıa-Gonzalez, I. and D. Eckstein. 2003. Climatic signal of
earlywood vessels of oak on a maritime site. Tree Physiol.
23:497–504.
Garcıa-Gonzalez, I. and P. Fonti. 2006. Selecting earlywood
vessels to maximize their environmental signal. Tree Physiol.
26:1289–1296.
Geßler, A., C. Keitel, J. Kreuzwieser, R. Matyssek, W. Seiler
and H. Rennenberg. 2007. Potential risks for European beech
(Fagus sylvatica L.) in a changing climate. Trees 21:1–11.
Gieger, T. and F.M. Thomas. 2005. Differential response of two
Central European oak species to single and combined stress
factors. Trees 19:607–618.
Griggs, C., A. DeGaetano, P. Kuniholm and M. Newton. 2007.
A regional high-frequency reconstruction of May–June pre-
cipitation in the north Aegean from oak tree rings, A.D.
1089–1989. Int. J. Climatol. 27:1075–1089.
Hacke, U. and J.J. Sauter. 1996. Xylem dysfunction during
winter and recovery of hydraulic conductivity in diffuse-
porous and ring-porous trees. Oecologia 105:435–439.
Holmes, R.L. 1983. Computer-assisted quality control in tree-
ring dating and measurements. Tree-Ring Bull. 43:69–78.
Hughes, M.K., B. Gray, J. Pilcher, M. Baillie and P. Leggett.
1978. Climatic signals in British Isles tree-ring chronologies.
Nature 272:605–606.
50 FRIEDRICHS, BUNTGEN, FRANK, ESPER, NEUWIRTH AND LOFFLER
TREE PHYSIOLOGY VOLUME 29, 2009
Dow
nloaded from https://academ
ic.oup.com/treephys/article/29/1/39/1658944 by guest on 11 February 2022

Hurrell, J.W., Y. Kushnir, G. Ottersen and M. Visbeck. 2003.
An overview of the North Atlantic Oscillation. Geophys.
Monogr. 1–35.
Jongman, R.H.G., C.J.F. ter Braak and O.F.R. van Tongeren.
1987. Data analysis in community and landscape ecology.
Centre for Agricultural Publishing and Documentation,
Wageningen, 299 p.
Kelly, P.M., M.A.R. Munro, M.K. Hughes and C.M. Goodess.
1989. Climate and signature years in west European oaks.
Nature 340:57–60.
Kelly, P.M., H.H. Leuschner, K.R. Briffa and I.C. Harris. 2002.
The climatic interpretation of pan-European signature years
in oak ring-width series. The Holocene 12:689–694.
Korner, C. 1998. A re-assessment of high elevation treeline
positions and their explanation. Oecologia 115:445–459.
Kozlowski, T.T. and S.G. Pallardy. 1997. Growth control in
woody plants. Academic Press, San Diego, California, 641 p.
Kurz, W.A., G. Stinson and G. Rampley. 2007. Could increased
boreal forest ecosystem productivity offset carbon losses from
increased disturbances? Philos. Trans. R. Soc. B, doi:10.1098/
rstb.2007.2198.
Lebourgeois, F., G. Cousseau and Y. Ducos. 2004. Climate–
tree–growth relationships of Quercus petraea Mill. stand in
the forest of Berce (‘‘Futaie des Clos’’, Sarthe, France). Ann.
For. Sci. 61:361–372.
Legendre, P. and L. Legendre. 1998. Numerical ecology.
Elsevier, New York, 870 p.
Levy, G., M. Becker and D. Duhamel. 1992. A comparison of the
ecology of pedunculate and sessile oaks: radial growth in the
centre and the northwest ofFrance. For. Ecol.Manag. 55:51–63.
Mitchell, T.D. and P.D. Jones. 2005. An improved method of
constructing a database of monthly climate observations and
associated high-resolution grids. Int. J. Climatol. 25:693–712.
Mitchell, T.D., T.R. Carter, P.D. Jones, M. Hulme and M. New.
2004. A comprehensive set of high-resolution grids of monthly
climate for Europe and the globe: the observed record (1901–
2000) and 16 scenarios (2001–2100). Tyndell Centre for
Climate Change Research Working Paper 55, 25 p.
Nemani, R.R., C.D. Keeling, H. Hashimoto, W.M. Jolly, S.C.
Piper, C.J. Tucker, R.B. Myneni and S.W. Running. 2003.
Climate-driven increases in global terrestrial net primary
production from 1982 to 1999. Science 300:1560–1563.
Neuwirth, B. 2005. Klima/Wachstums-Beziehungen zentraleur-
opaischer Baume von 1901 bis 1971 – Eine dendroklimato-
logische Netzwerkanalyse. Dissertation. Geographisches
Institut der Universitat Bonn, 151 p.
Neuwirth, B., F.H. Schweingruber and M. Winiger. 2007.
Spatial patterns of central European pointer years from
1901 to 1971. Dendrochronologia 24:79–89.
Oren, R., J.S. Sperry, G.G. Katul, D.E. Pataki, B.E. Ewers,
N. Phillips and K.V.R. Schafer. 1999. Survey and synthesis of
intra- and interspecific variation in stomatal sensitivity to
vapour pressure deficit. Plant Cell Environ. 22:1515–1526.
Pilcher, J.R. and B. Gray. 1982. The relationships between oak
tree growth and climate in Britain. J. Ecol. 70:297–304.
Ponton, S., J.L. Dupouey, N. Breda, F. Feuillat, C. Bodenes and
E. Dreyer. 2001. Carbon isotope discrimination and wood
anatomy variations in mixed stands of Quercus robur and
Quercus petraea. Plant Cell Environ. 24:861–868.
Raible, C.C., C. Casty, J. Luterbacher et al. 2006. Climate
variability – observations, reconstructions, and model simu-
lations for the Atlantic-European and Alpine region from
1500–2100 AD. Clim. Change 79:9–29.
Rinn, F. 2003. TSAP-Win. Time series analysis and presentation
for dendrochronology and related applications. Version 0.53
forMicrosoftWindows. User Reference. RinntechHeidelberg,
Heidelberg, 91 p.
Rozas, V. 2005. Dendrochronology of pedunculate oak (Quercus
robur L.) in an old-growth pollarded woodland in northern
Spain: tree-ring growth responses to climate. Ann. For. Sci.
62:209–218.
Schar, C., P.L. Vidale, D. Luthi, C. Frei, C. Haberli, M.A.
Liniger and C. Appenzeller. 2004. The role of increasing
temperature variability in European summer heatwaves.
Nature 427:332–336.
Schulte, U. and A. Scheible. 2005. Atlas der Naturwaldzellen
in Nordrhein-Westfalen. B.o.s.s. Druck und Medien, Kleve,
171 p.
Schweingruber, F.H., D. Eckstein, F. Serret-Bachet and O.U.
Braker. 1990. Identification, presentation and interpretation
of event years and pointer years in dendrochronology.
Dendrochronologia 8:9–39.
ter Braak, C.J.F and P. Smilauer. 2002. CANOCO reference
manual and CanoDraw for Windows user’s guide: software
for canonical community ordination (version 4.5). Micro-
computer Power. Ithaca, NY, 500 p.
Thomas, F.M., R. Blank and G. Hartmann. 2002. Abiotic and
biotic factors and their interactions as causes of oak decline in
Central Europe. For. Pathol. 32:277–307.
Trenberth, K. 1984. Some effects of finite sample size and
persistence on meteorological statistics. Part I: autocorrela-
tions. Mon. Weath. Rev. 112:2359–2368.
Ufnalski, K. 2006. Teleconnection of 23 modern chronologies of
Quercus robur and Q. petraea from Poland. Dendrobiology
55:51–56.
van der Schrier, G., K.R. Briffa, P.D. Jones and T.J. Osborn.
2006. Summer moisture variability across Europe. J. Clim.
19:2818–2834.
Wigley, T.M.L., K.R. Briffa and P.D. Jones. 1984. On the
average of value of correlated time series, with applications in
dendroclimatology and hydrometeorology. J. Clim. Appl.
Meteorol. 23:201–213.
CLIMATE CONTROLS ON OAK GROWTH 51
TREE PHYSIOLOGY ONLINE at http://www.treephys.oxfordjournals.org
Dow
nloaded from https://academ
ic.oup.com/treephys/article/29/1/39/1658944 by guest on 11 February 2022