Embed Size (px)
Citation preview

Copyright © 2014 Pearson Education
Chapter 15
Audit Sampling for
Tests of Controls
and Substantive
Tests of
Transactions
Copyright © 2014 Pearson Education 15-2
Explain the concept of representative
sampling.
Distinguish between statistical and
nonstatistical sampling and between
probabilistic and nonprobabilistic sample
selection.
Select representative samples.
Prepare the post-closing trial balance

Copyright © 2014 Pearson Education 15-3
Define and describe audit sampling for
exception rates.
Use nonstatistical sampling in tests of
controls and substantive tests of
transactions.
Define and describe attributes sampling and
a sampling distribution.
Use attributes sampling in tests of controls
and substantive tests of transactions.
Copyright © 2014 Pearson Education
Explain the concept of
representative sampling.
15-4
1

Copyright © 2014 Pearson Education 15-5
A representative sample is one in which
the characteristics in the sample of audit
interest are approximately the same as
those of the population.
In practice, an auditor can increase the
likelihood of a representative sample by
using care in designing the sampling
process and selection, and evaluating
the results.

Copyright © 2014 Pearson Education 15-6
Sampling risk is the risk that an auditor
reaches an incorrect conclusion because
the sample is not representative of the
population.
Nonsampling risk is the risk that the
Auditor reaches an incorrect conclusion
for any reason not related to sampling risk.

Copyright © 2014 Pearson Education 15-7
Adjust
sample
size
Use
appropriate
sample
selection
method
Sampling Risk Meter
Step 1 Step 2

Copyright © 2014 Pearson Education
Distinguish between statistical and nonstatistical sampling and between probabilistic and
nonprobabilistic sample selection.
15-8
2

Copyright © 2014 Pearson Education 15-9
Similarities of both approaches:
Plan the
sample
Select the
sample and
perform the
tests
Evaluate the
results
Step 1
Step 2
Step 3

Copyright © 2014 Pearson Education 15-10
Differences in approach:
Statistical sampling allows the quantification
of sampling risk in planning the sample (Step 1)
and evaluating the results (Step 3)
In nonstatistical sampling those items that
the auditor believes will provide the most
useful information are selected
Copyright © 2014 Pearson Education 15-11
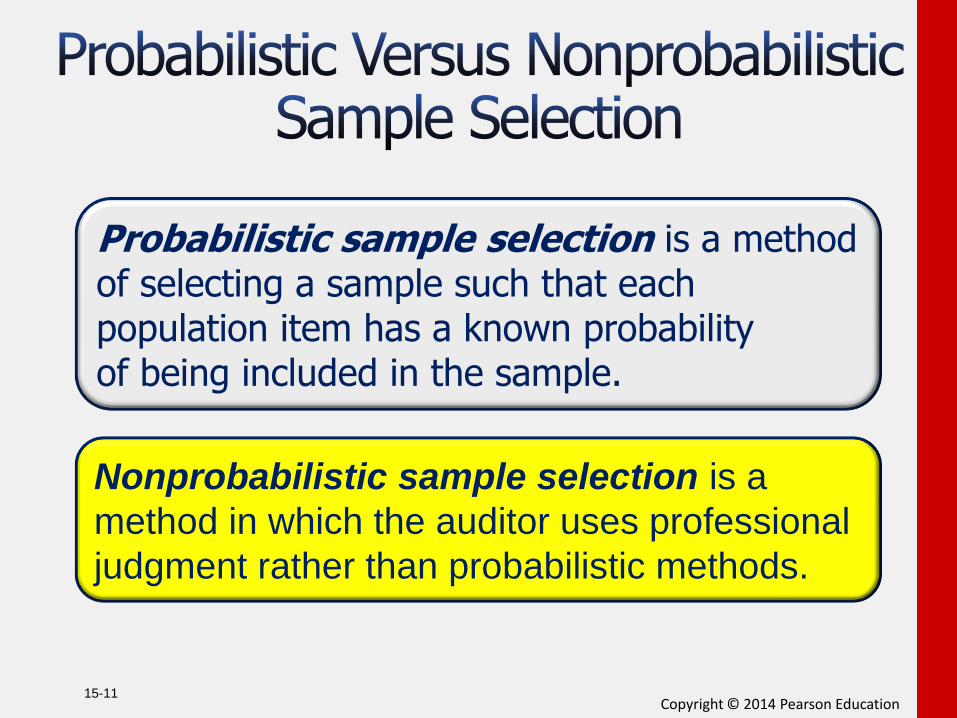
Probabilistic sample selection is a method of selecting a sample such that each population item has a known probability of being included in the sample.
Nonprobabilistic sample selection is a
method in which the auditor uses professional
judgment rather than probabilistic methods.

Copyright © 2014 Pearson Education 15-12
Nonprobabilistic selection methods:
1. Block sample selection
2. Haphazard sample selection

Copyright © 2014 Pearson Education 15-13
Probabilistic selection methods:
1. Simple random sample selection
2. Systematic sample selection
3. Probability proportional to size sample selection

Copyright © 2014 Pearson Education 15-14
Block sample selection is the selection
of several items in sequence.
Haphazard sample selection is the
selection of items without any conscious
bias on the part of the auditor.

Copyright © 2014 Pearson Education
Select representative samples.
15-15
3

Copyright © 2014 Pearson Education 15-16
A simple random sample is one in which
every possible combination of elements
in the population has an equal chance
of constituting the sample.
Random number tables
Computer generation of random numbers
offers several advantages
time savings
reduced risk of error
automatic documentation

Copyright © 2014 Pearson Education 15-17
Random number tables
Computer generation of random
numbers offers several advantages
•time savings
•reduced risk of error
•automatic documentation

Copyright © 2014 Pearson Education 15-18
Systematic sample selection:
The auditor calculates an interval and
then selects the items for the sample
based on the size of the interval.
The interval is determined by dividing
the population size by the number of
sample items desired.

Copyright © 2014 Pearson Education 15-19
Probability proportional to size:
A sample is taken where the probability
of selecting any individual population item
is proportional to its recorded amount (PPS).
Divide the population into subpopulations and
take larger samples from the subpopulations
with larger sizes.

Copyright © 2014 Pearson Education
Define and describe audit sampling for exception rates.
15-20
4

Copyright © 2014 Pearson Education 15-21
The occurrence rate, or exception rate,
is the percent of items in the population
containing the characteristic or specific
attribute of interest to the total number
of population items.
Copyright © 2014 Pearson Education 15-22
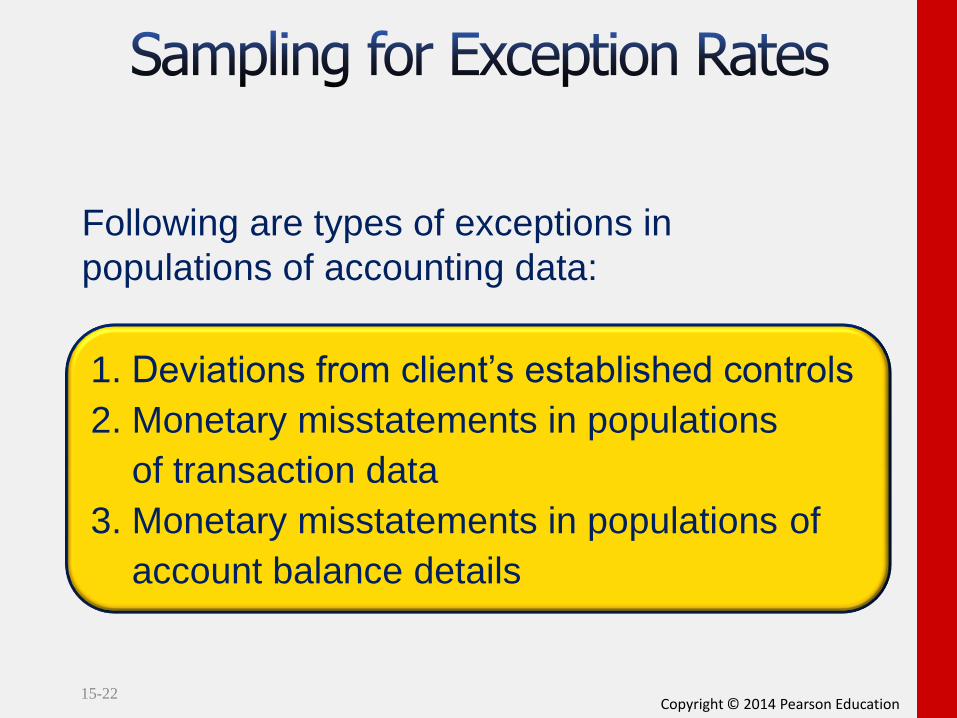
Following are types of exceptions in
populations of accounting data:
1. Deviations from client’s established controls
2. Monetary misstatements in populations
of transaction data
3. Monetary misstatements in populations of
account balance details
Copyright © 2014 Pearson Education
Use nonstatistical sampling in
tests of controls and substantive tests of transactions.
15-23
5
Copyright © 2014 Pearson Education 15-24
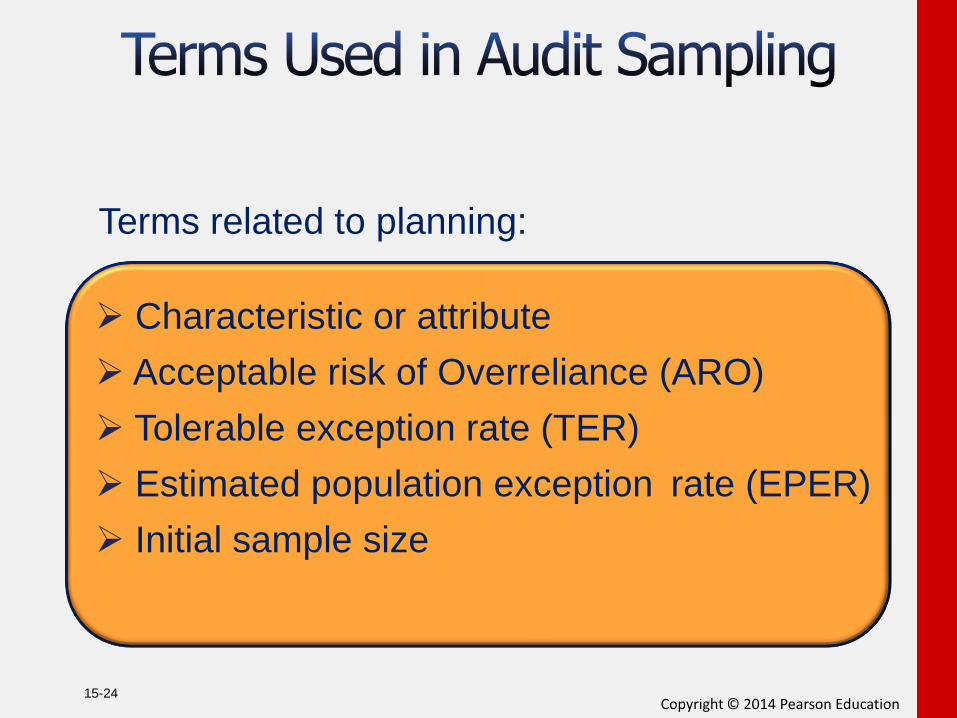
Terms related to planning:
Characteristic or attribute
Acceptable risk of Overreliance (ARO)
Tolerable exception rate (TER)
Estimated population exception rate (EPER)
Initial sample size

Copyright © 2014 Pearson Education 15-25
Terms related to evaluating results:
Exception
Sample exception rate (SER)
Computed upper exception rate (CUER)

Copyright © 2014 Pearson Education 15-26
State the
objectives
of the
audit test.
Decide
whether
audit
sampling
applies.
Define
attributes
and
exception
conditions
Define the
population
Define the
sampling
unit
Step 1 Step 2 Step 3
Step 4 Step 5

Copyright © 2014 Pearson Education 15-27
Specify
the
tolerable
exception
rate.
Specify
acceptable
risk of
overreliance
Estimate the
population
exception
rate.
Determine
the initial
sample size
Step 6 Step 7
Step 8 Step 9

Copyright © 2014 Pearson Education 15-28
Select the
sample
Perform the
audit
procedures
Step10 Step 11

Copyright © 2014 Pearson Education 15-29
Generalize
from the
sample to
the
population
Analyze
exceptions
Decide the
acceptability
of the
population
Step 12
Step 13 Step 14

Copyright © 2014 Pearson Education 15-30
Copyright © 2014 Pearson Education 15-31

Copyright © 2014 Pearson Education 15-32
Effect on initial Type of change sample size
Increase acceptable risk of overreliance
Increase tolerable risk rate
Increase estimated population exception rate
Increase population size (minor)

Copyright © 2014 Pearson Education 15-33
Revise TER or ARO
Expand the sample size
Revise assessed control risk
Communicate with the audit
committee or management
Copyright © 2014 Pearson Education 15-34
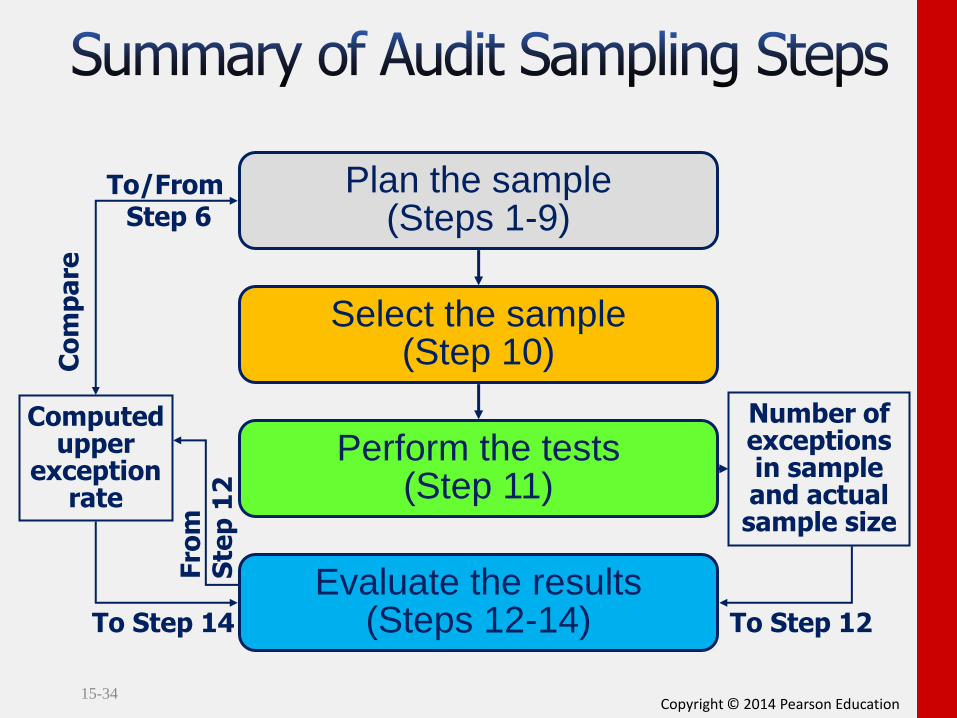
Plan the sample (Steps 1-9)
Select the sample (Step 10)
Perform the tests (Step 11)
Evaluate the results (Steps 12-14)
Number of exceptions in sample and actual sample size
To Step 12
To/From Step 6
Computed upper
exception rate
Co
mp
are
Fro
m
Ste
p 1
2
To Step 14

Copyright © 2014 Pearson Education
Define and describe attributes sampling and a sampling distribution.
15-35
6

Copyright © 2014 Pearson Education 15-36
The statistical sampling method most
commonly used for tests of controls
and substantive tests of transactions
is attributes sampling.

Copyright © 2014 Pearson Education 15-37
A frequency distribution of the results
of all possible samples of a specified size
that could be obtained from a population
containing some specific parameters.
Attributes sampling is based on the
binomial distribution.

Copyright © 2014 Pearson Education 15-38
Copyright © 2014 Pearson Education 15-39
7
Copyright © 2014 Pearson Education 15-40
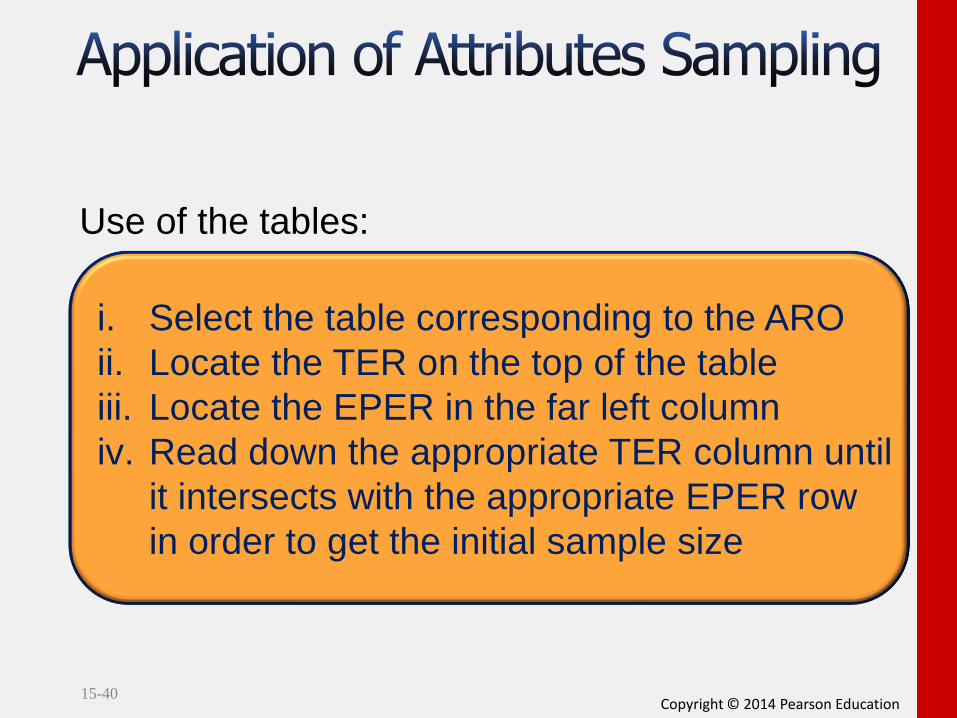
Use of the tables:
i. Select the table corresponding to the ARO
ii. Locate the TER on the top of the table
iii. Locate the EPER in the far left column
iv. Read down the appropriate TER column until
it intersects with the appropriate EPER row
in order to get the initial sample size

Copyright © 2014 Pearson Education 15-41
Effect of population size:
Population size is a minor consideration
in determining sample size
Representativeness is ensured by the sample
selection process more than by sample size

Copyright © 2014 Pearson Education 15-42
Select the sample
Perform the audit procedures
Evaluate the results

Copyright © 2014 Pearson Education 15-43

Copyright © 2014 Pearson Education 15-44
Copyright
All rights reserved. No part of this publication may be reproduced,
stored in a retrieval system, or transmitted, in any form or by any
means, electronic, mechanical, photocopying, recording, or otherwise,
without the prior written permission of the publisher. Printed in the
United States of America.