Embed Size (px)
Citation preview
193
References Adamski J J and Finnegan K T. (2002) New Perspectives on Access 2002. Course Technology, Thomson Learning. Florence, Kentucky, US. ABCB. (2006). Building Code of Australia 2006. Volumes 1 and 2. Australian Building Codes Board. Canberra. ABS. (1990). Australian National Accounts. Input Output Tables 1986-87. Table 9. Direct Requirements Coefficients. Australian Bureau of Statistics. Cat. No. 5209.0 AGPS. Canberra. ABS. (1996). Australian National Accounts. Input Output Tables 1992-93. Table 9. Direct Requirements Coefficients. Australian Bureau of Statistics. Cat. No. 5209.0 AGPS. Canberra. ABS. (1997). Australian National Accounts. Input Output Tables 1993-94. Table 9. Direct Requirements Coefficients. Australian Bureau of Statistics. Cat. No. 5209.0 AGPS. Canberra. ABS. (1999). Australian National Accounts. Input Output Tables 1994-95. Australian Bureau of Statistics. Cat. No. 5209.0 AGPS. Canberra. ABS. (2000). Australian National Accounts: Concepts, Sources and Methods. Chapter 9. Australian Bureau of Statistics. Cat. No. 5216.0 AGPS. Canberra.
ABS. (2001a). Australian National Accounts. Input Output Tables 1996-97. Table 9. Direct Requirements Coefficients. Australian Bureau of Statistics. Cat. No. 5209.0. AGPS. Canberra. ABS. (2001b). Australian National Accounts. Input Output Tables. Product Tables. 1996-97. Cat. No. 5215. AGPS. Canberra. ABS (2002) 2001 Census of Population and Housing. Australian Bureau of Statistics. Canberra. ABS. (2003). Year Book Australia 2003. Population. Population projections. Cat. No. 1301.0. AGPS. Canberra. January. ABS (2005) 2005 Year Book Australia. Number 87. ABS Cat. No. 1301.0. ISSN 0312-4746. Australian Bureau of Statistics. Canberra. ABS (2006) Regional Population Growth Australia 2004-2005. Cat. No. 3218.0. Australian Bureau of Statistics. AGPS. Canberra. Adelaide City Council (2004) Residential Growth Plan 2004 – 2010. Strategy and Policy Committee. Dated 29th November. Available at URL: http://www.adelaidecitycouncil.com/adccwr/publications/policies_strategies/residential_growth_plan_2004-2010.pdf. Accessed 12th February 2007.
194
AGO (1999a) Australian Residential Building Sector Greenhouse Gas Emissions 1990-2010. Final Report. Australian Greenhouse Office. Commonwealth of Australia. ISBN 1876536 25 X. July. AGO (1999b) Australian Residential Building Sector Greenhouse Gas Emissions 1990-2010. Executive Summary Report. Australian Greenhouse Office. Commonwealth of Australia. ISBN 1876536 136. April.
AGO (2001) Greenhouse Challenge Factors and Methods Workbook Version 3 Australian Greenhouse Office. Commonwealth Government. Department of Environment & Heritage. December.
AGO (2005) AGO Methods and Factors Workbook. Tables 1 and 2. Australian Greenhouse Office. Department of Environment and Heritage. December.
AGO (2006) State and Territory Greenhouse Gas Inventories 2004. Australia’s National Greenhouse Accounts. Australian Greenhouse Gas Office. Department of the Environment and Heritage. Australian Government. URL: http://www.greenhouse.gov.au/inventory/stateinv/pubs/states2004.pdf . Accessed 22nd August 2006.
Ahammad H, Matysek A, Fisher B, Curtotti R, Gurney A, Jakeman G, Heyhoe E and Gunasekera D. (2006). Economic Impact of Climate Change Policy: The Role of Technology and Economic Instruments. ABARE research report 06.7. ISBN 1 920925 61 9. Canberra. July.
Alcorn A. (2006). Embodied Energy and CO2 Coefficients. Private Communication. Victoria University of Wellington. 20th July. Annotated telephone conversation. Allen Consulting (2006). Deep Cuts in Greenhouse Gas Emissions: Economic, Social and Environmental Impacts for Australia. Report to the Business Round Table on Climate Change. Dated March. Available at URL: http://www.businessroundtable.com.au Accessed 11th December 2006. Ambrose M, Salomonsson G and Burn S. (2002). Piping Systems Embodied Energy Analysis. CSIRO Manufacturing and Infrastructure Technology. Doc. 02/302. October.
Anderson G. (2003). Energy. Plans for new energy regulatory framework. Focus. Issue 11. June 2003. Allens, Arthur & Robinson. Australia. pp1-4. Australian Government. (2005). Fact Sheet. Energy Costs in Australia. October. Available at URL: http//www.investaustralia.gov.au/media/BS_Energy_costs_in_Australia_web.pdf. Accessed 8th December 2006. BBC. (1998). Over 150,000 still without power four weeks after Canadian ice. World: Monitoring. BBC News. URL: http://news.bbc.co.uk/1/hi/world/monitoring/52661.stm Accessed 6th January 2004.
195
Baird G. and Chan S.A. (1983). Energy Cost of Houses and Light Construction Buildings. New Zealand Energy Research and Development Committee. Report No. 76. November. Victoria University of Wellington. Bilsborough D. (2006). Buildings Issues Paper. Tackling Climate Change. South Australia’s Greenhouse Strategy. South Australian Government. URL: http://www.greenhouse.sa.gov.au/PDFs/buildings.pdr. Accessed 12th January 2007. BIS Shrapnel. (1994). Study to investigate the Alterations and Additions sector of the Housing Industry. BIS Shrapnel, Sydney. Blakers A. and Weber K. (2000). The Energy Intensity of Photovolatic Systems. Centre for Sustainable Energy Systems, Australian National University. URL: http://www.ecotopia.com/apollo2/prepbtoz.htm. Accessed 12th March 2004 Boustead I. and Hancock G. (1979). Handbook of Industrial Energy Analysis. Ellis Horwood, Chichester, UK. Bringezu S. (2003). Industrial Ecology and Material Flow Analysis: Basic Concepts, Policy Relevance and Some Case Studies. Wuppertal Institute Germany. Perspectives on Industrial Ecology. Bourg D and Erkman S (Eds) Greenleaf Publishing. pp 20-34. Brugmann J. and Jessup P. (1993). Cities for Climate Protection. International Council for Local Environmental Initiatives (ICLEI). Product Code: WS18. Brundtland G. (1987). Our Common Future. World Commission on Environment and Development. Commission of the Future. Australian Edition. Oxford University Press. Building Commission. (2006). Number of demolitions of a dwelling by Region. Pulse Intelligence from every angle. URL: www.pulse.buildingcommission.com.au Accessed 5th January 2007. Bullard C. and Herendeen R. (1975). The energy cost of goods and services. Energy Policy. 3 (4) 268-278. Bullard C., Penner P. and Pilati D. (1978). Net energy analysis: handbook for combining process and input-output analysis. Resources and Energy. 1, 267-313. Bureau of Transport and Regional Economics. (2005). Is the World Running Out of Oil? A Review of the Debate. BTRE Working Paper 61.Department of Transport and Regional Services. Commonwealth Government of Australia. ISBN 1-877081-75-2. Burrows D.J. and McQueen I. (2002). 1999 Demolition Report. Adelaide Statistical Division. Spatial Planning Analysis and Research Branch. SA Planning. Department of Transport and Urban Planning. Government of South Australia. December. Bush S., Harris J. and Trieu L. (1997). Australian energy consumption and production. Historical trends and projections to 2009-10. ABARE Research Report 97.2. Commonwealth of Australia.
196
Bush S., Dickson A., Harman J. and Anderson J. (1999). Australian Energy: Market Development & Projections to 2014-15. Australian Bureau of Agricultural and Resource Economics (ABARE) Research Report 99.4. March. Campbell I. (2006). Greenhouse Gas Accounts show Australia is still on target for 108 per cent. Media Release C107/06. Australian Minister for the Environment and Heritage. 23 May. Callendar G.S. (1938). "The Artificial Production of Carbon Dioxide and Its Influence on Climate." Quarterly J. Royal Meteorological Society 64: 223-40. Case K and Fair R. (2007). Principles of Economics. 8th Edition. Prentice Hall. Ceuvas-Cubria C. and Riwoe D. (2006). Australian Energy. National and State Projections to 2029-30. Australian Bureau of Agricultural and Resource Economics (ABARE) Research Report 06.26. ISBN 1 920925 81 3. Canberra. December. City of Melbourne. (2006). Materials Selection in Green Buildings and the CH2 Experience. Technical Research Paper 09. May. City of Newcastle. (2002). Greenhouse Action in Newcastle (GAIN) Plan. Newcastle City Council, New South Wales. Clark D, Treloar G and Blair R. (2003). Estimating the Increasing Cost of Commercial Buildings in Australia due to Greenhouse Emissions Trading. Proceedings of the CIB 2003 International Conference on Smart and Sustainable Built Environment (SASBE 2003), Queensland University of Technology. CNN. (1998). Power outage hits Auckland hours after crisis declared over. World News Story Page. Dated March 27. URL:http://www.cnn.com/WORLD/9803/27/auckland.outage/. Accessed 7th January 2004. Cole R. (1998). Emerging Trends in Building Assessment Method, Building Research & Information. 26(1). pp3-16. January. Commonwealth of Australia. (1994). Guidelines on Accounting Policy for Valuation of Assets of Government Trading Enterprises using Current Valuation Methods. Performance Monitoring Report. Steering Committee on National Performance Monitoring of Government Trading Enterprises. ISBN 0 642 22137 5. October. Also available at URL: http://www.pc.gov.au/ic/research/perfmon/deprival/index.html Commonwealth of Australia. (2006). Uranium Mining, Processing and Nuclear Energy — Opportunities for Australia?, Report to the Prime Minister by the Uranium Mining, Processing and Nuclear Energy Review Taskforce, December. ISBN 0-9803115-0-0 978-0-9803115-0-1. Congressional Budget Office (2005). The Macroeconomic and Budgetary Effects of Hurricanes Katrina abd Rita: An Update. Dated 29th September. The Congress of the United States. URL: http://www.cbo.gov/ftpdocs/66xx/doc6669/09-29-EffectsOfHurricanes.pdf. Accessed 22nd June 2007. Cordell. (1997). Building Cost Guide. Commercial Industrial. Victoria April 1997. Volume 27 Issue 2. Cordell Building Information Services.
197
Crawford R. (2005). Validation of the Use of Input-output Data for Embodied Energy Analysis of the Australian Construction Industry. Journal of Construction Research, Vol. 6 (1) pp71-90. Crawford R. and Treloar G. (2006). Life-cycle energy analysis of domestic hot water systems in Melbourne, Australia. Proceedings of 40th Annual Conference of the Architectural Science Association. Adelaide. November. pp397-403. CSIRO. (2001). Climate Change. Projections for Australia. CSIRO Atmospheric Research. Available at URL: http://www.dar.csiro.au/publications/projections2001.pdf. Accessed 16th January 2004. CSIRO. (2002). Demand-Side Response and the Electricity Network. Factsheet, CSIRO Energy Technology. URL: http://www.det.csiro.au/factsheets/demandside.htm. Accessed 24th January 2004. D’Amato A. (1990) Agora: What Obligation does Our Generation Owe to the Next? An Approach to Global Environmental Responsibility. American Journal of International Law. Vol. 84. pp190-198. Denlay J. (2007). Private Communication. 29th May. Manager, Demand Side Management. Energy Division. Department of Transport, Engineering and Infrastructure. South Australian Government. Department for Environment & Heritage. (2003). Digital Cadastral Data Base (DCDB). Fact Sheet 9. Mapland Publication. Government of South Australia. URL: http//:www.denr.sa.gov.au/mapland/pdfs/fact9.pdf. Accessed 8th January 2007. Department of Housing & Regional Planning. (1995). AMCORD: a national resource document for residential development: Practice Notes. Commonwealth Government, Canberra, AGPS. Department of the Premier and Cabinet. (2004). South Australia’s Strategic Plan - Creating Opportunity. Government of South Australia. March. URL: http://www.stateplan.sa.gov.au/home.php. Accessed 14th February 2007. Dickson A, Akmal M. and Thorpe S. (2003). Australian Energy – National and State Projection to 2019-2020. ABARE eReport 03.10 for the Ministerial Council on Energy, Canberra. June.
Dovers S.R. and Handmer J.W. (1992). Uncertainty, sustainability and change. Global Environmental Change, 2, pp 262-276. Droege P. (2004). Renewable Energy and the City. Encyclopedia of Energy. Cleveland C and Ayres R (Eds). Volume 5. Elsevier. pp 301-311. Energy Efficiency and Greenhouse Working Group. (2003). Towards a National Framework for Energy Efficiency – Issues and Challenges. Discussion Paper. Ministerial Council on Energy. Council of Australian Governments. November. Enkvist P, Naucler T and Rosander J. (2007) A Cost Curve for Greenhouse Gas Reduction. The McKinsey Quarterly. No.1. McKinsey and Company, Stockholm.
198
EPA. (2001). Barriers and Opportunities for Re-use and Recycling of Clean Fill and Building and Demolition Waste. The South Australian Environment Protection Agency. Consultancy Report. Nolan-ITU Pty Ltd. March. ESIPC. (2003). Annual Planning Report. Electricity Supply Industry Council. South Australia. June. ESIPC. (2006). Annual Planning Report. Electricity Supply Industry Council. South Australia. June. URL: http://www.esipc.sa.gov.au/site/page.cfm?u=269 Accessed 12th January 2007. Essential Services Commission of South Australia. (2006). Performance of South Australian Energy Retail Market. SA Energy Retail Market 05-06. November. Fargher P.J. (1979). Chapter 1. Background and Approaches. Footings and Foundations for Small Buildings in Arid Climates, with Special Reference to South Australia. Fargher P.J., Woodburn J.A. and Selby J. (Eds). Institution of Engineers with The University of Adelaide, Department of Adult Education. Fargher P.J. (2006). Private Communication. 4th December. Annotated telephone conversation. Fava J., Consoli F., Denison R., Dickson K., Mohin T. and Vigon B. (Eds). (1993). A Conceptual Framework For Life-Cycle Impact Assessment. Workshop Report. Pensacola, Society of Environmental Toxicology and Chemistry (SETAC). Fay, R., (1999) Comparative life cycle energy studies of typical Australian suburban dwellings. Ph.D. thesis, Faculty of Architecture, Building and Planning, University of Melbourne. Flyvbjerg B. (2004). Five Misunderstandings about Case-Study Research. Qualitative Research Practice. Seale C, Giampietro G, Gubrium J. and Silverman D. (Eds). Chapter 27. London and Thousand Oaks, CA: Sage. pp 420-434. Foran B., Lenzen M. and Dey C. (2005). Balancing Act - A triple bottom line analysis of the Australian economy. Volume 1. University of Sydney and CSIRO. Available at URL: http://www.cse.csiro.au/research/balancingact/ Accessed 20th February 2007. Fox W. (2000) Towards an Ethics (or at Least a Value Theory) of the Built Environment. Ethics and the Built Environment. Ed: W. Fox. London and New York. Routledge. pp 207-221. Fox.W (2006) Architecture, Ethics, and the Theory of Responsive Cohesion. Proceedings of the Australian & New Zealand Architectural Science Association (ANZAScA) 40th Annual Conference 'Challenges for architectural science in changing climates' 22-25 November 2006. pp 1-8. Guinee J.B. (2002). Handbook on Life Cycle Assessment – Operational Guide to the ISO Standards. Kluwer Academic Publishers. The Netherlands.
199
Gupta R. (2005). Investigating the potential for local carbon emission reductions: Developing a GIS-based Domestic Energy, Carbon counting and Reduction Model (DECoRuM). Proceedings of the 2005 Solar World Congress. 6-12 August 2005, Orlando, Florida, USA. Hall P. (2002). Cities of Tomorrow. An intellectual history of urban planning and Design in the Twentieth Century. Blackwell Publishing. Oxford. Hammond G. and Jones C. (2006). Inventory of Carbon and Energy (ICE). Version 1.4 Beta. Department of Mechanical Engineering. University of Bath. Hardin G. (1968) The Tragedy of the Commons, Science. Vol.162. (December) no.3859. 1243-1248. Hill R.K. (1978). Gross Energy Requirements of Building Materials. Proceedings of a Conference on Energy Conservation in the Built Environment. Department of Environment, Housing and Community Development. March. Hölzl W. (2005) Tangible and intangible sunk costs and the entry and exit of firms in a small open economy: the case of Austria. Applied Economics. 37. 2429-2243. Huxhold W.E. (1991). An Introduction to Urban Geographic Information Systems. pp 251 – 258, ISBN 0195065352 Oxford University Press. New York. IFIAS. (1974). International Federation of Institutes of Advanced Study. Workshop on Methodology and Conventions of Energy Analysis. Report 6. Stockholm. December. IEA. (2006). Key World Energy Statistics. International Energy Agency. Paris. URL: http://library.iea.org/textbase/nppdf/free/2006/key2006.pdf. Accessed 20th February 2007. IPCC. (2000). Emissions Scenarios. 2000. Special Report of the Intergovernmental Panel on Climate Change. Nebojsa Nakicenovic and Rob Swart (Eds.) Cambridge University Press, UK. pp 570. IPCC. (2001). Climate Change 2001: Synthesis Report. Working Group I – Summary for Policy Makers. Third Assessment Report of the Intergovernmental Panel on Climate Change. Cambridge University Press, New York. IPCC. (2007). Climate Change2007: the Physical Science Basis. Summary for Policy Makers. Contribution of Working Group 1 to the Fourth Assessment Report of the Intergovernmental Panel on Climate Change. Geneva. Switzerland. February. URL: http://ipcc-wg1.ucar.edu/wg1/docs/WG1AR4_SPM_Approved_05Feb.pdf Accessed 23rd February 2007. ISO 14040. (2006). ISO 14040 Environmental Management – Life Cycle Assessment – Principles and Framework. Technical Committee TC 207/SC 5. International Standards Organisation. Geneva. James D. (1980). The Energy Content of Australian Production. Research Paper No. 208.. School of Economic and Financial Studies. Macquarie University. April. ISBN No. 0 85837 413 7.
200
Jones P., Williams J. and Lannon S. (2000). Planning for a Sustainable City: an Energy and Environmental Prediction Model. Journal of Environmental Planning and Management, 43(6), pp 855-872. Jones P., Lannon S. and Williams J. (2001). Modelling Building Energy Use at Urban Scale. Proceedings of the 7th International Building Performance Simulation Association (IPSA). Rio de Janeiro, Brazil. August. pp 175-180. Judd K. (2004). Personal Communication. Dowell Windows, Pooraka, South Australia. 15 March. Kellett J. and Pullen S. (2007). Prospects for Greenhouse Reduction in Buildings using Energy Performance Contracting. Proceedings of the Australian Institute of Building Surveyors (AIBS) International Conference. Adelaide. March. pp 192-209. Khor A.M. (2003). Cracking in Adelaide’s Housing due to Expansive Soil Movement. Final Year Building Research Project Dissertation. Bachelor of Construction Management & Economics. University of South Australia. Kohler N. (2006). A European Perspective on the Pearce Report: Policy and Research. Building Research & Information. Forum. 34 (3), 287-294. Kohler N. and Chini A. (2005). Resource-productive Materials Use. Issues Paper. Proceedings of the 2005 World Sustainable Building Conference (SB05). Tokyo. 27-19 September. Kohler N. and Yang W. (2007) Long-term Management of Building Stocks. Building Research & Information. 35(4), 351-362. Kohler N., Schwaiger B., Barth B. and Koch M. (1997). Mass flow, energy flow and costs of the German building stock. Institut für Industrielle Bauproduktion (ifib) Universität Karlsruhe (TH). URL: http://www.ubka.uni-karlsruhe.de/cgi-bin/psview?document=1997/architektur/5 Accessed 12th February 2006. Land Services Group. (2004a). Equivalent Main Areas (for residential buildings). Provided by Gavin Lyons, Senior Adviser, Audit and Compliance, Department of Administrative and Information Services, Land Services Group, Government of South Australia. 13 February. Land Services Group. (2004b). Land Ownership and Tenure System (LOTS) Manual. Provided by Gavin Lyons, Senior Adviser, Audit and Compliance, Department for Administrative and Information Services (DAIS), Land Services Group, Government of South Australia. 13 February. Lawson B. (1996). Building Materials, Energy and the Environment: Towards Ecologically Sustainable Development. Royal Australian Institute of Architects. Red Hill. ACT. Lemon M. (Ed). (1999). Exploring Environmental Change using an Integrative Method. Gordon & Breach Science Publishers, Amsterdam.
201
Lenzen M. (1998). Primary energy and greenhouse gases embodied in Australian final consumption: an input-output analysis. Energy Policy. Vol. 26, No. 6, pp.495-506. Lenzen M. (2001). A Generalized Input-Output Multiplier Calculus for Australia. Economic Systems Research. Vol. 13, No.1. p 74. Lenzen M. (2003) Environmentally Important Paths, Linkages and Key Sectors in the Australian Economy. Structural Change and Economic Dynamics Vol. 14 (1), pp1-34. Lenzen M. and Dey C. (2000). Truncation error in embodied energy analyses of basic iron and steel products. Energy. 25 (6) pp 577-585. Lenzen M. and Treloar G. (2004) Endogenising Capital: a Comparison of Two Methods. Journal of Applied Input-Output Analysis. Vol. 10. pp1-11. Leontif W. (1941). The Structure of the American Economy, 1919-1939. Oxford University Press, U.K. Leontif W. (1966). Input-Output Economics. Oxford University Press. New York. Llewellyn P. (2006). Private Communication. South Australian Timber Development Association. 29th August. Local Government Association of South Australia. (2004). Home Page. URL: http://www.lga.sa.gov.au/site/page.cfm?u=209 Modified 11th August 2006. Accessed 29th October 2006. Maitland J. (2005). Personal Communication regarding Lochiel Park Green Residential Development, Campbelltown, South Australia. 15th March. Mather A. and Chapman K. (1995). Environmental Resources. Longman Scientific and Technical, United Kingdom. Matsumoto H., Kimura R., Fujita Y. and Lun Y. (2006). Embodied Energy Consumption of Buildings Based on the Input-Output Analysis. Proceedings of the International Building Performance Simulation Association (IBPSA) Australasia Conference. pp 88-95. Adelaide, Australia. November. McLennan Magasanik (2004) National Energy Efficiency Target. Report to the Sustainable Energy Authority Victoria. National Framework for Energy Efficiency. Ref. J1086. 23rd August. URL: http://www.nfee.gov.au Miller R.E. and Blair P.D. (1985). Input-Output Analysis: Foundations and Extensions. Prentice-Hall, Englewood Cliffs, New Jersey. Mitchell P.W. (1984). Structural Analysis of Footings on Expansive Soil. PhD Thesis. The University of Adelaide. MRET Review Panel. (2003). Renewable Opportunities, A Review of the Operation of the Renewable Energy (Electricity) Act 2000. Executive Summary. Department of Environment and Heritage. Commonwealth Government of Australia. Available at URL: http://www.mretreview.gov.au/report/index.html
202
Myors P., O’Leary R. and Helstroom R. (2005). Multi-unit Residential Building Energy & Peak Demand Study. Energy News. Vol 23. No. 4. pp 113-116. Ness D.A. and Field M.S. (2003). Cradle to Cradle Carpets and Cities. Proceedings of CIB 2002 International Conference on Smart and Sustainable Built Environment. QUT, Brisbane. November. Newman P. and Kenworthy J. (1989). Cities and Automobile Dependence – a Sourcebook. Gower Technical. England. Nicolson C., Payne T. and Wallace J. (2003). State of the Environment Report for South Australia 2003. Environment Protection Authority. Government of South Australia. November. O’Connor R. and Henry E.W. (1975). Input-Output Analysis and its Applications. Griffin’s Statistical Mongraphs & Courses No. 36. Charles Griffin and Company. Office of the Valuer-General. (2003). Land Use Codes. Department for Administrative and Information Services (DAIS), Land Services Group, Government of South Australia. 4 April. Okpala D.C. (2001). Spatial Information: The Basic Tool for Sustainable Human Settlements Development Planning and Management. Proceedings of the International Conference on Spatial Information for Sustainable Development. Institution of Surveyors of Kenya (ISK), the International Federation of Surveyors (FIG) and the United Nations Human Settlements Programme UN-HABITAT. Nairobi, Kenya. October. URL: http://www.fig.net/pub/proceedings/nairobi/program.htm Oliphant M. (2003). South Australian Residential Sector Baseline Study of Energy Consumption. Final Report. State Energy Research Advisory Committee. Government of South Australia. January. Oliphant M. (2004). Inner City Residential Energy Performance. Final Report. State Energy Research Advisory Committee. Government of South Australia. June. Owen R (2007) Irreversibility, Endogenous Sunk Costs, “News” and Evolutionary Economic Methodology. Working Paper No. 42. The American University of Paris. Published by the Trustee Fund for the Advancement of Scholarship. 24th January. Owens S. (1986). Energy, Planning and Urban Form. Pion, London. Oxera (2006). Modelling the macroeconomic effects of energy policies. Report prepared for Department of Trade and Industry. August. Oxera Consulting Ltd. UK. Available at URL: http://www.dti.gov.uk/files/file35875.pdf Accesses 16th February 2007. Pareto Assoc.P/L. (2004). A Demand Side Response Facility for the National Electricity Market – Trial Undertaken by Energy Users Association of Australia. Reporting Consultant’s Independent Assessment. April. Available at URL: http://www.euaa.com.au. Accessed 2nd June 2005.
203
Pearce D (2003) The Social and Economic Value of Construction. The Construction Industry’s Contribution to Sustainable Development. New Construction and Innovation Strategy Panel (nCRISP). London. UK. Available at URL: http://ncrisp.steel-sci.org/Publications/SocialandEconomicValue_FR03%281%29.pdf Accessed 3rd March 2007. Perkins A. (2001). The Influence of Urban Form on Life Cycle Transport and Housing Energy and Greenhouse Gas Emissions. PhD thesis. School of Geoinformatics, Building & Planning, University of South Australia. Perkins A, Hamnett S, Zito R and Pullen S. (2007) Ecological Footprint of the City of Adelaide: Life Cycle Transport and Housing Energy Use and Emissions of City Centre Apartment Residents compared with Suburban Residents. Report for Adelaide City Council. School of Natural and Built Environments, University of South Australia. Persse J.N. and Rose D.M.(1994). House Styles in Adelaide – A Pictorial History. Australian Institute of Valuers Incorporated and the Real Estate Institute of South Australia. Pikusa S. (1986). The Adelaide House 1836 – 1901 The evolution of principal dwelling types. Wakefield Press. South Australia. Pullen S. (1995). Embodied Energy of Building Materials in Houses. Masters thesis. School of Architecture, The University of Adelaide. January. Pullen S. (1996). Data Quality of Embodied Energy Methods. Proceedings of Embodied Energy: the current state of play Seminar. Deakin University, 28/29 November. Pullen S. (2000a). Energy used in the construction and operation of houses. Architectural Science Review, Vol. 43, No. 2, June, pp 87-94 Pullen S. (2000b). Estimating the Embodied Energy of Timber Building Products, Journal of the Institute of Wood Science. Vol. 15 No. 3 (Issue 87) Summer 2000. pp 147-151. Pullen S., Troy P., Holloway D. and Bunker R. (2002). Estimating Energy Consumption in the Urban Environment with a focus on Embodied Energy. Proceedings of ANZAScA 2002. 36th Annual Conference of the Australia & New Zealand Architectural Science Association. November 1-4. Deakin University, Geelong, Australia. Pullen S., Varley C., Bruce D., Perkins A. and Lee H. (1998). Evaluating the Energy Requirements of Urban Water Systems. School of Geoinformatics, Planning & Building, University of South Australia, ISBN 0 86803 280 8. March. Pullen S. and Varley C. (1997). Interim Report on Embodied Energy Coefficient of Softwood Timber. Collaborative Research Project between the University of Adelaide and the National Emphasis on the Use of Timber, Embodied Energy Component of Project. School of Architecture, The University of Adelaide. April. Randolph B, Holloway D, Pullen S and Troy P. (2007). The Environmental Impacts of Residential Development: Case Studies of 12 Estates in Sydney. Report by the City Futures Research Centre, Faculty of the Built Environment, University of NSW. March.
204
Rawlinson. (1997). Rawlinson’s Australian Construction Handbook. 15th Edition. Rawlhouse Publishing Pty Ltd. RMIT. (1998). Life Cycle Inventory Data. CRC for Waste Management and Pollution Control Ltd. Centre for Design at RMIT. URL: ttp://simapro.rmit.edu.au/lca/datadownloads.html RMIT. (2006). Scoping Study into Improving the Environmental Sustainability of Building Materials. Discussion Paper. Prepared for the Department of the Environment and Heritage, Commonwealth Government of Australia by the Centre for Design at RMIT University, Melbourne. August. Rowings J. and Walker R. (1984). Construction Energy Usage. Construction Engineering and Management ,110, no. 4, pp 447-458. RTA. (2004) Typical Cross Sections and Standard Pavement Details. Roads and Traffic Authority New South Wales. URL: http://www.rta.nsw.gov.au/doingbusinesswithus/designdocuments/xsections/md.ptb.details_010.pdf Rypkema. D. (2005). Economics, Sustainability and Historic Preservation. The National Trust Annual Conference. Portland, Oregon. October. Available at URL: http://www.nationaltrust.org/advocacy/case/Rypkema_Speech_on_Sustainability_in_Portland.pdf. Accessed 27th February 2007. SA Govt. (1998). South Australian Energy Flows 1996/1997. Flow Chart. Office of Energy Policy. Department of Primary Industries and Resources. Government of South Australia. April. SA Govt. (2006a). Metropolitan Adelaide Planning Strategy. Appendix 4. Residential Metropolitan Development Program. Government of South Australia. August. ISBN 0759000921 SA Govt. (2006b). Climate Change and Greenhouse Reduction Bill 2006. House of Assembly – No 83. Ref. HA GP 130-B OPC 82. Government of South Australia. 6th December. SA Govt. (2007). Saving Energy in Your Home. Sustainable Energy Programs. Energy Division. Department of Transport, Energy and Infrastructure. Government of South Australia. URL: www.sustainable.energy.sa.gov.au. Accessed 8 January 2007. SAHT. (1972). Annual Report 1972. South Australian Housing Trust. Government of South Australia. Saman W., Bruno F. and Pullen, S. (2002). Evaluation of Life Cycle Energy Consumption of Washing Machines, Dryers and Dishwashers and their Contribution to the Home Life Cycle Energy Consumption. Division of Information Technology, Engineering and the Environment Report, University of South Australia, June. Schiller G. (2007). Urban Infrastructure: Challenges for Resource Efficiency in the Building Stock. Building Research & Information. 35(4), 399-411.
205
See P. (1998). Construction Energy in Residential Building, Unpublished Honours Thesis, School of Geoinformatics, Planning and Building, University of South Australia. Shalders G. (2007). Private Communication. Land Services Group. Department of Transport, Energy and Infrastructure. Government of South Australia. 8th March. Shergold P. (2007). Prime Ministerial Task Group on Emission Trading. Report. May. Commonwealth of Australia. ISBN 978-0-9803115-9. Available at URL: http://www.pmc.gov.au/publications/emissions/docs/emissions_trading_report.pdf Accesssed 20th June 2007. Shipworth D. (2002). A Stochastic Framework for Embodied Greenhouse Gas Emissions Modelling of Construction Materials. Building Research & Information. 30(1), 16-24. Shimoda Y. (2003). Adaptation measures for climate change and the heat island effect in Japan’s built environment. Building Research & Information. Volume 31, Number 3-4. May – August. pp 222-230. Steemers K. (2003). Energy and the city: density, buildings and transport. Energy and Buildings 35, pp 3-14. Stein R.G. (1979). The Energy Value of our Existing Stock of Buildings: Discussion Paper. Annals of the New York Academy of Sciences. 324 (1), 43–45. Stein R.G., Serber D. and Hannon. B. (1976). Energy Use for Building Construction. EDRA Report. Contract EY-76-S-02-271. Center for Advanced Computation, University of Illinois and Stein & Associates. New York. Suppiah R., Preston B., Whetton P., McInnes K., Jones R., Macadam I., Bathois J. and Kirono D. (2006). Climate Change under Enhanced Greenhouse Conditions in South Australia. Updated Report on Assessment of Climate Change, Impacts and Risk Management Strategies Relevant to South Australia. Climate Impacts and Risk Group, CSIRO. June. Sustainable Development Commission. (2006). Stock Take: Delivering improvements in existing housing. UK Government. July. URL: http://sd-commission.gov.uk/publications/download/Stock_Take_UK_Housingpdf. Accessed 12 January 2007. Tedesco L. and Thorpe E. (2003). Trends in Australian Energy Intensity: 1973-74 to 2000-01. Report No. 03.9. Australian Bureau of Agricultural and Resource Economics. June.
Todd J.A. and Curran.M.A. (Eds). (1999). Streamlined Life Cycle Assessment: A Report from the SETAC North America Streamlined LCA Workgroup. Society of Environmental Toxicology and Chemistry (SETAC) and SETAC Foundation for Environmental Education. July. Town Planning Committee (1962) Report on the Metropolitan Area of Adelaide 1962. Government of South Australia. Treloar G. (1994) Embodied Energy Analysis of the Construction of Office Buildings. Master of Architecture thesis, Deakin University, Geelong. October.
206
Treloar G. (1995). The Environmental Impact of Construction – A Case Study. Australia and New Zealand Architectural Science Association Monographs, No. 001, Sydney, November, 89. Treloar G. (1997). Extracting embodied energy paths from input-output tables: towards an input-output hybrid energy analysis method. Economic Systems Research 9(4), pp 375-91. Treloar G. (1998). A Complete Embodied Energy Analysis Framework. PhD thesis. Deakin University, Geelong. June. Treloar G (2006) Residential Building Materials List. Private Communication . Deakin University. 13th July. Treloar G., Fay R., Love P.E.D. and Iyer-Raniga U. (2000). Analysing the life-cycle energy of an Australian residential building and its householders. Building Research & Information. 28(3), pp 184-195. Treloar G., Love P. and Holt G. (2001a). Using National Input-output Data for Embodied Energy Analysis of Individual Residential Buildings. Construction Management and Economics 19, pp 49-61. Treloar G., Fay R., Ilozor B.D. and Love P.E.D. (2001b). An Analysis of the Embodied Energy of Office Buildings by Height. Facilities (5/6), pp 204-214. Treloar G., Love P. and Crawford R. (2004). Hybrid Life-Cycle Inventory for Road Construction and Use. Journal of Construction Engineering and Management. v130 no.1 Jan/Feb. pp 43-49.
Troy P. (1996). The Perils of Urban Consolidation. A discussion of Australian Housing and Urban Development Policies. Federation Press. Annandale. NSW. Troy P., Holloway D., Pullen S. and Bunker R. (2002). Toward Sustainability: an Adelaide Case Study. Urban Frontiers Program Research Paper No.14. June. University of Western Sydney.
Troy P, Holloway D, Pullen S & Bunker R. (2003) Embodied and Operational Energy Consumption in the City, Urban Policy and Research, 21(1). Troy P. and Smith N. (2000). Sustainable Transport for Sustainable Cities. Module 5 Land Use Issues. Prepared for the Warren Centre, Sydney University. December 18 . Tufte. E.R. (2001) The Visual Display of Quantitative Information. Graphics Press, Connecticut, USA. Tufte. E.R. (2003) Envisioning Information. 9th Edition. Graphics Press, Connecticut, USA. Tucker S.N., Salomonsson G.D., Treloar G.J., Macsporran C.M. and Flood, J. (1993). The Environmental Impact of Energy Embodied in Construction. Report prepared for RITE, Kyoto (DBCE DOC 93/39M), CSIRO, Highett.
207
Tucker S.N. and Treloar G.J. (1994). Energy Embodied in Construction and Refurbishment of Buildings. Proceedings of the First International Conference on Buildings and the Environment. CIB Task Group 8. Building Research Establishment, Watford, U.K. May. Turnbull M. (2007). Media Release. Minister for the Environment and Water Resources. Commonwealth Government. May. Ref. T55/07. Available at URL: http://www.environment.gov.au/minister/env/2007/pubs/mr03may307.pdf Tweedie M. (2005). Typical Maintenance Expenses over the Life of a Brick Veneer Dwelling Built after 1972. Final Year Dissertation. School of the Natural and Built Environment. University of South Australia. Walsh P.F. (1975). The Design of Residential Slabs-on-Ground. CSIRO Division of Building Research Technical Paper. Second series.No.5. 2nd Edition. Wang X H and Yang B Z. (2001) Fixed and Sunk Costs Revisited. Journal of Economic Education. Volume 31. No. 2. Spring. pp178-185. Washer M. (2005). Sustainable Cities. Report by the House of Representatives Standing Committee on Environment and Heritage. The Parliament of the Commonwealth of Australia. August. Accessed 10th January 2007 at URL: http://www.aph.gov.au/house/committee/environ/cities/report/fullreport.pdf Western Power. (2007). Underground Distribution Schemes. 5th Edition. Revision 2. August. Accessed 28th September 2007 at URL. www.westernpower.com.au/documents/technicalDocumentation/UDSManual.pdf Willet E. (2006). Regulating the National Energy Market. 17th Annual Power and Electricity Congress. Sydney. November. URL: http://www.aer.gov.au/content/item.phtml?itemId=707238&nodeId=14739186d67bf4ffa210414a84fbd18e&fn=20061128_Willett_17th%20Power%20Energy%20Congress.pdf Accessed 4th January 2007. Williamson T.J. (1997). Concepts of the Energy-Efficient House in the Temperate Regions of Australia: A Critical Review. Unpublished PhD thesis. Department of Architecture. The University of Adelaide. July. Williamson T.J., Coldicutt S. and Penny R.E.C. (1989). Thermal Comfort and Preferences in Housing: South and Central Australia. Sustainable Energy Research Advisory Committee (SENRAC) Project Report. Adelaide: Dept of Architecture, University of Adelaide. World Bank. (2001). Cultural Heritage and Development. A Framework for Action in the Middle East and North Africa. Orientations in Development Series. June. The International Bank for Reconstruction and Development. ISBN 0-8213-4938-4. Yang W. and Kohler N. (2005). Simulation of Evolution of the Chinese Building Stock. Proceedings of the 2005 World Sustainable Building Conference. Tokyo. 27-29 September. pp 1179 – 1186.
208
Appendix 1. Information on input-output techniques
The following information provides more detail of the input-output techniques used in the derivation of the indirect components of embodied energy coefficients used in this research.
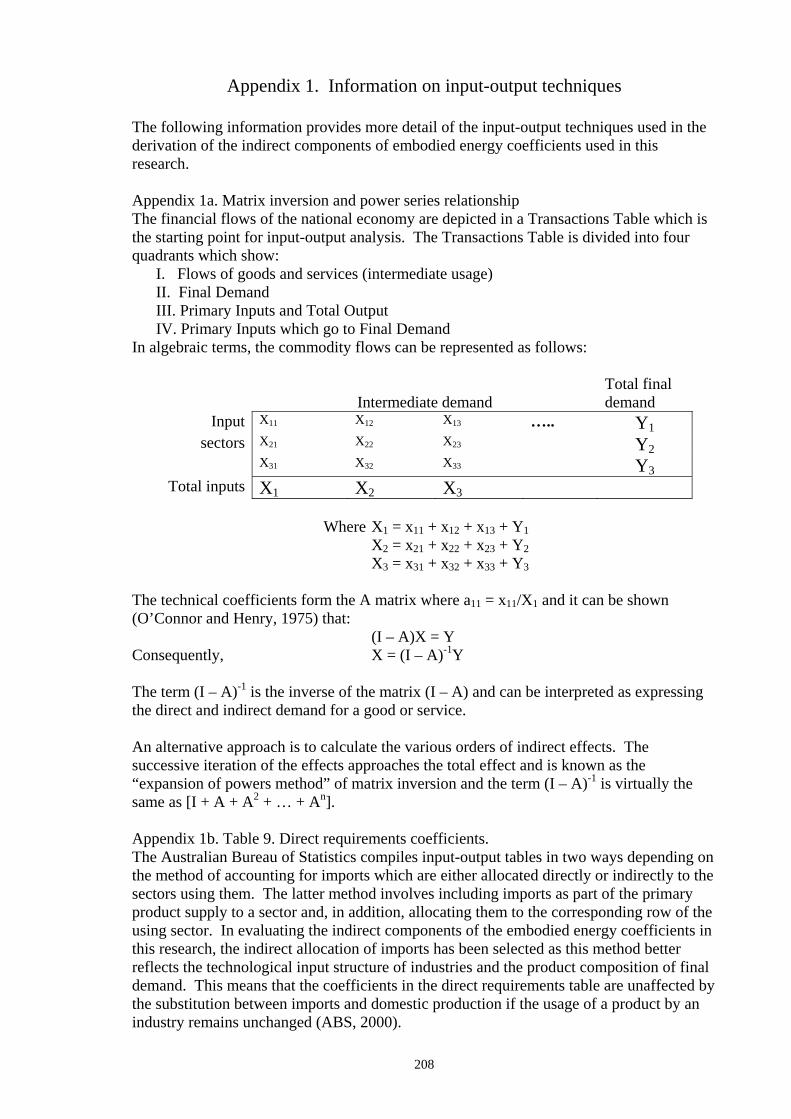
Appendix 1a. Matrix inversion and power series relationship The financial flows of the national economy are depicted in a Transactions Table which is the starting point for input-output analysis. The Transactions Table is divided into four quadrants which show:
I. Flows of goods and services (intermediate usage) II. Final Demand III. Primary Inputs and Total Output IV. Primary Inputs which go to Final Demand
In algebraic terms, the commodity flows can be represented as follows:
Intermediate demand
Total final demand
Input X11 X12 X13 ….. Y1 sectors X21 X22 X23 Y2
X31 X32 X33 Y3 Total inputs X1 X2 X3
Where X1 = x11 + x12 + x13 + Y1
X2 = x21 + x22 + x23 + Y2 X3 = x31 + x32 + x33 + Y3
The technical coefficients form the A matrix where a11 = x11/X1 and it can be shown (O’Connor and Henry, 1975) that: (I – A)X = Y Consequently, X = (I – A)-1Y The term (I – A)-1 is the inverse of the matrix (I – A) and can be interpreted as expressing the direct and indirect demand for a good or service. An alternative approach is to calculate the various orders of indirect effects. The successive iteration of the effects approaches the total effect and is known as the “expansion of powers method” of matrix inversion and the term (I – A)-1 is virtually the same as [I + A + A2 + … + An]. Appendix 1b. Table 9. Direct requirements coefficients. The Australian Bureau of Statistics compiles input-output tables in two ways depending on the method of accounting for imports which are either allocated directly or indirectly to the sectors using them. The latter method involves including imports as part of the primary product supply to a sector and, in addition, allocating them to the corresponding row of the using sector. In evaluating the indirect components of the embodied energy coefficients in this research, the indirect allocation of imports has been selected as this method better reflects the technological input structure of industries and the product composition of final demand. This means that the coefficients in the direct requirements table are unaffected by the substitution between imports and domestic production if the usage of a product by an industry remains unchanged (ABS, 2000).
209
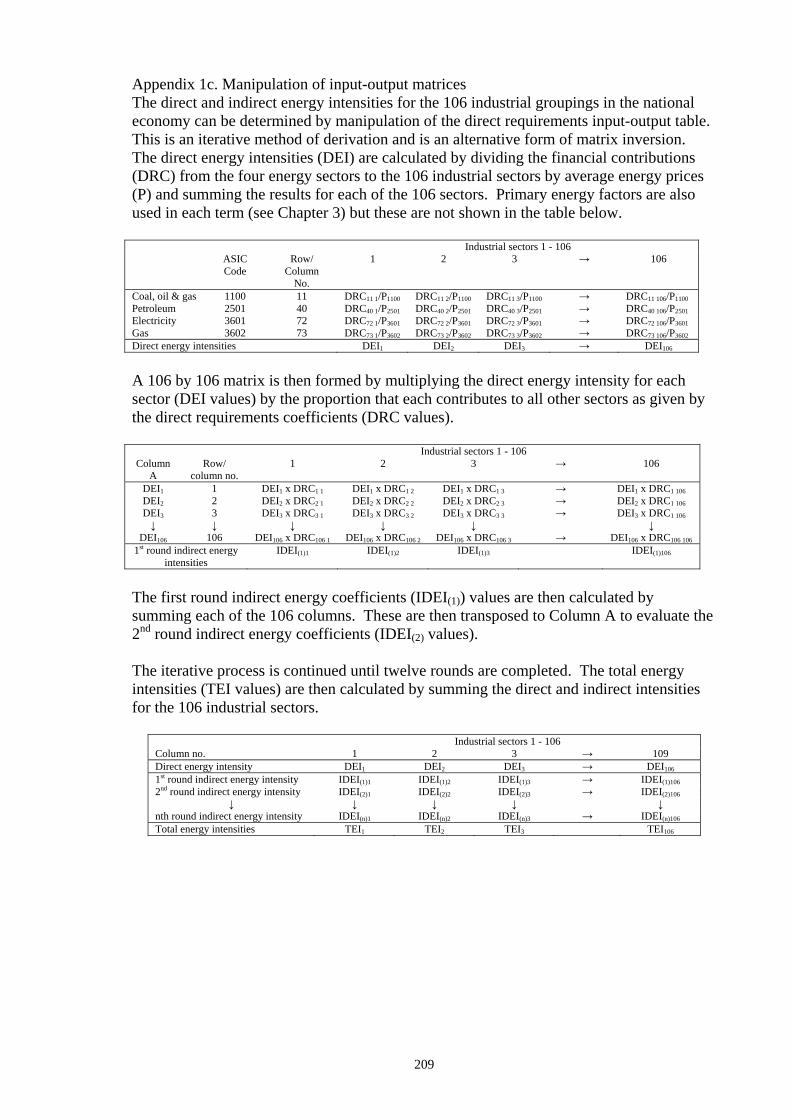
Appendix 1c. Manipulation of input-output matrices The direct and indirect energy intensities for the 106 industrial groupings in the national economy can be determined by manipulation of the direct requirements input-output table. This is an iterative method of derivation and is an alternative form of matrix inversion. The direct energy intensities (DEI) are calculated by dividing the financial contributions (DRC) from the four energy sectors to the 106 industrial sectors by average energy prices (P) and summing the results for each of the 106 sectors. Primary energy factors are also used in each term (see Chapter 3) but these are not shown in the table below. Industrial sectors 1 - 106 ASIC Row/ 1 2 3 → 106 Code Column
No.
Coal, oil & gas 1100 11 DRC11 1/P1100 DRC11 2/P1100 DRC11 3/P1100 → DRC11 106/P1100 Petroleum 2501 40 DRC40 1/P2501 DRC40 2/P2501 DRC40 3/P2501 → DRC40 106/P2501 Electricity 3601 72 DRC72 1/P3601 DRC72 2/P3601 DRC72 3/P3601 → DRC72 106/P3601
Gas 3602 73 DRC73 1/P3602 DRC73 2/P3602 DRC73 3/P3602 → DRC73 106/P3602 Direct energy intensities DEI1 DEI2 DEI3 → DEI106
A 106 by 106 matrix is then formed by multiplying the direct energy intensity for each sector (DEI values) by the proportion that each contributes to all other sectors as given by the direct requirements coefficients (DRC values).
Industrial sectors 1 - 106 Column
A Row/
column no. 1 2 3 → 106
DEI1 1 DEI1 x DRC1 1 DEI1 x DRC1 2 DEI1 x DRC1 3 → DEI1 x DRC1 106 DEI2 2 DEI2 x DRC2 1 DEI2 x DRC2 2 DEI2 x DRC2 3 → DEI2 x DRC1 106 DEI3 3 DEI3 x DRC3 1 DEI3 x DRC3 2 DEI3 x DRC3 3 → DEI3 x DRC1 106 ↓ ↓ ↓ ↓ ↓ ↓
DEI106 106 DEI106 x DRC106 1 DEI106 x DRC106 2 DEI106 x DRC106 3 → DEI106 x DRC106 106 1st round indirect energy
intensities IDEI(1)1 IDEI(1)2 IDEI(1)3 IDEI(1)106
The first round indirect energy coefficients (IDEI(1)) values are then calculated by summing each of the 106 columns. These are then transposed to Column A to evaluate the 2nd round indirect energy coefficients (IDEI(2) values). The iterative process is continued until twelve rounds are completed. The total energy intensities (TEI values) are then calculated by summing the direct and indirect intensities for the 106 industrial sectors.
Industrial sectors 1 - 106 Column no. 1 2 3 → 109 Direct energy intensity DEI1 DEI2 DEI3 → DEI106 1st round indirect energy intensity IDEI(1)1 IDEI(1)2 IDEI(1)3 → IDEI(1)106 2nd round indirect energy intensity IDEI(2)1 IDEI(2)2 IDEI(2)3 → IDEI(2)106
↓ ↓ ↓ ↓ ↓ nth round indirect energy intensity IDEI(n)1 IDEI(n)2 IDEI(n)3 → IDEI(n)106 Total energy intensities TEI1 TEI2 TEI3 TEI106
210
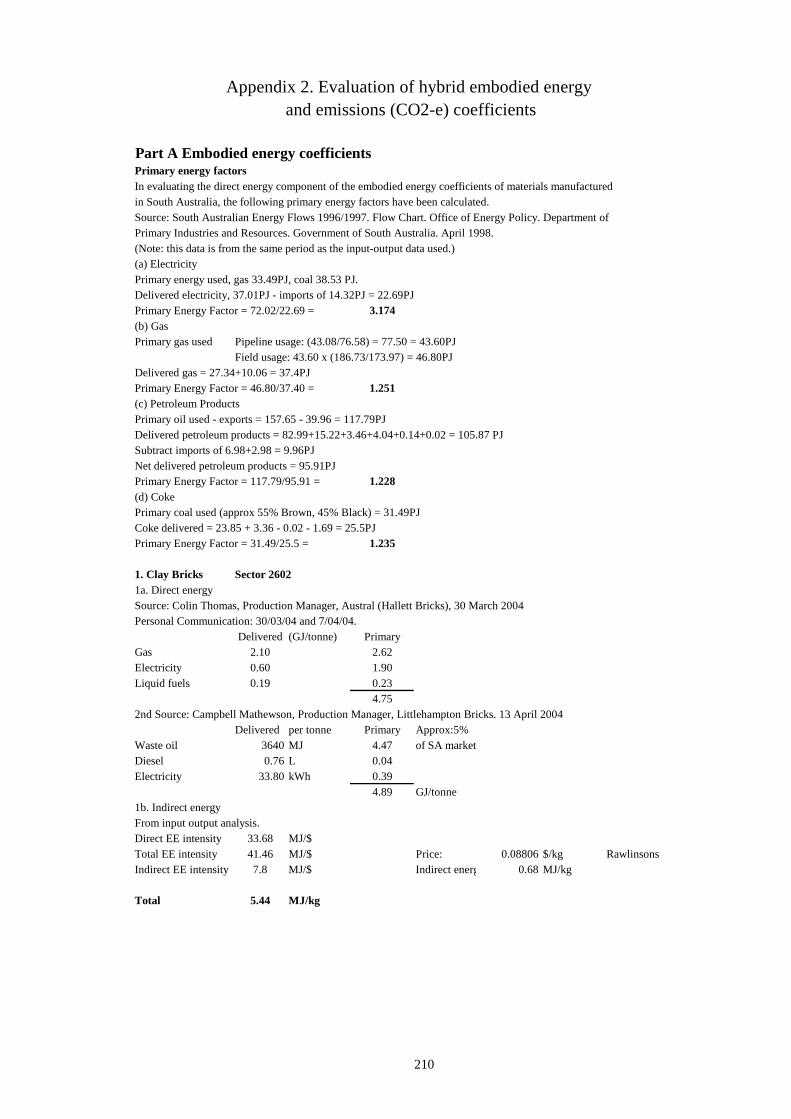
Part A Embodied energy coefficientsPrimary energy factorsIn evaluating the direct energy component of the embodied energy coefficients of materials manufacturedin South Australia, the following primary energy factors have been calculated.Source: South Australian Energy Flows 1996/1997. Flow Chart. Office of Energy Policy. Department of Primary Industries and Resources. Government of South Australia. April 1998. (Note: this data is from the same period as the input-output data used.)(a) ElectricityPrimary energy used, gas 33.49PJ, coal 38.53 PJ.Delivered electricity, 37.01PJ - imports of 14.32PJ = 22.69PJPrimary Energy Factor = 72.02/22.69 = 3.174(b) GasPrimary gas used Pipeline usage: (43.08/76.58) = 77.50 = 43.60PJ
Field usage: 43.60 x (186.73/173.97) = 46.80PJDelivered gas = 27.34+10.06 = 37.4PJPrimary Energy Factor = 46.80/37.40 = 1.251(c) Petroleum ProductsPrimary oil used - exports = 157.65 - 39.96 = 117.79PJDelivered petroleum products = 82.99+15.22+3.46+4.04+0.14+0.02 = 105.87 PJSubtract imports of 6.98+2.98 = 9.96PJNet delivered petroleum products = 95.91PJPrimary Energy Factor = 117.79/95.91 = 1.228(d) CokePrimary coal used (approx 55% Brown, 45% Black) = 31.49PJCoke delivered = 23.85 + 3.36 - 0.02 - 1.69 = 25.5PJPrimary Energy Factor = 31.49/25.5 = 1.235
1. Clay Bricks Sector 26021a. Direct energySource: Colin Thomas, Production Manager, Austral (Hallett Bricks), 30 March 2004Personal Communication: 30/03/04 and 7/04/04.
Delivered (GJ/tonne) PrimaryGas 2.10 2.62Electricity 0.60 1.90Liquid fuels 0.19 0.23
4.752nd Source: Campbell Mathewson, Production Manager, Littlehampton Bricks. 13 April 2004
Delivered per tonne Primary Approx:5% Waste oil 3640 MJ 4.47 of SA marketDiesel 0.76 L 0.04Electricity 33.80 kWh 0.39
4.89 GJ/tonne1b. Indirect energyFrom input output analysis. Direct EE intensity 33.68 MJ/$Total EE intensity 41.46 MJ/$ Price: 0.08806 $/kg RawlinsonsIndirect EE intensity 7.8 MJ/$ Indirect energ 0.68 MJ/kg
Total 5.44 MJ/kg
Appendix 2. Evaluation of hybrid embodied energy and emissions (CO2-e) coefficients
211
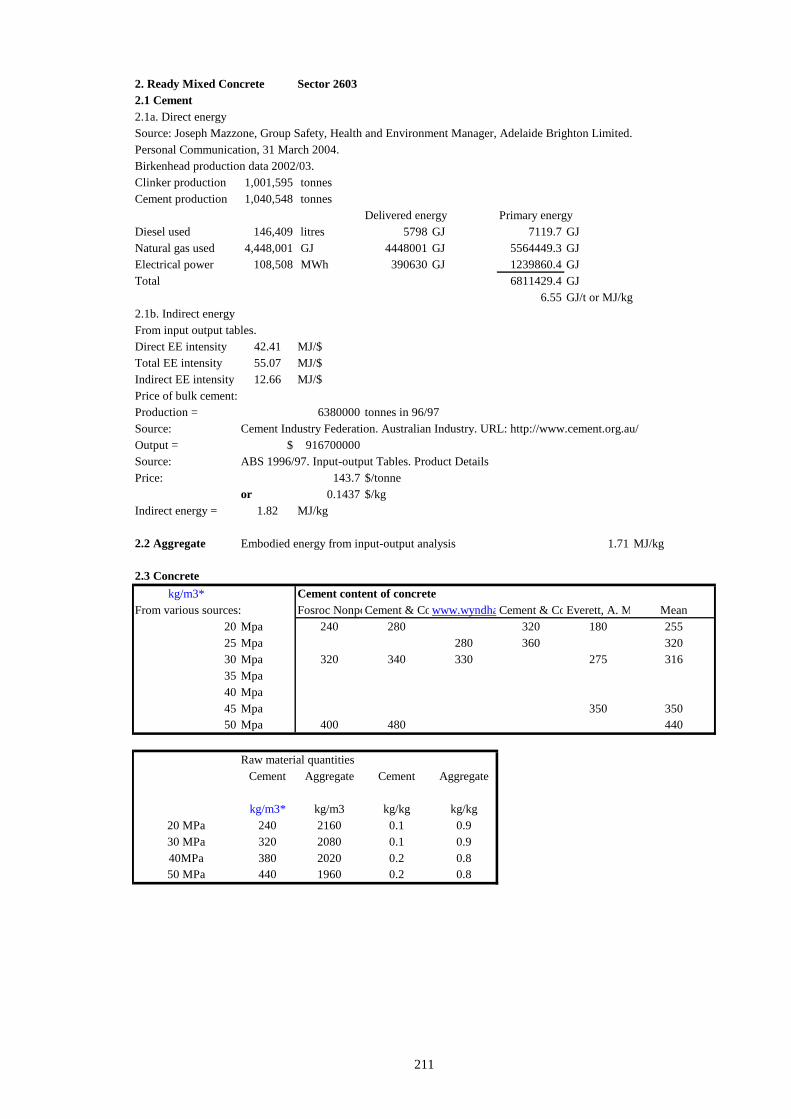
2. Ready Mixed Concrete Sector 26032.1 Cement2.1a. Direct energySource: Joseph Mazzone, Group Safety, Health and Environment Manager, Adelaide Brighton Limited. Personal Communication, 31 March 2004.Birkenhead production data 2002/03.Clinker production 1,001,595 tonnesCement production 1,040,548 tonnes
Delivered energy Primary energyDiesel used 146,409 litres 5798 GJ 7119.7 GJNatural gas used 4,448,001 GJ 4448001 GJ 5564449.3 GJElectrical power 108,508 MWh 390630 GJ 1239860.4 GJTotal 6811429.4 GJ
6.55 GJ/t or MJ/kg2.1b. Indirect energyFrom input output tables. Direct EE intensity 42.41 MJ/$Total EE intensity 55.07 MJ/$Indirect EE intensity 12.66 MJ/$Price of bulk cement:Production = 6380000 tonnes in 96/97Source: Cement Industry Federation. Australian Industry. URL: http://www.cement.org.au/Output = $ 916700000Source: ABS 1996/97. Input-output Tables. Product DetailsPrice: 143.7 $/tonne
or 0.1437 $/kgIndirect energy = 1.82 MJ/kg
2.2 Aggregate Embodied energy from input-output analysis 1.71 MJ/kg
2.3 Concretekg/m3* Cement content of concrete
From various sources: Fosroc NonpoCement & Cowww.wyndhaCement & CoEverett, A. M Mean20 Mpa 240 280 320 180 25525 Mpa 280 360 32030 Mpa 320 340 330 275 31635 Mpa40 Mpa45 Mpa 350 35050 Mpa 400 480 440
Raw material quantitiesCement Aggregate Cement Aggregate
kg/m3* kg/m3 kg/kg kg/kg20 MPa 240 2160 0.1 0.930 MPa 320 2080 0.1 0.940MPa 380 2020 0.2 0.850 MPa 440 1960 0.2 0.8
212
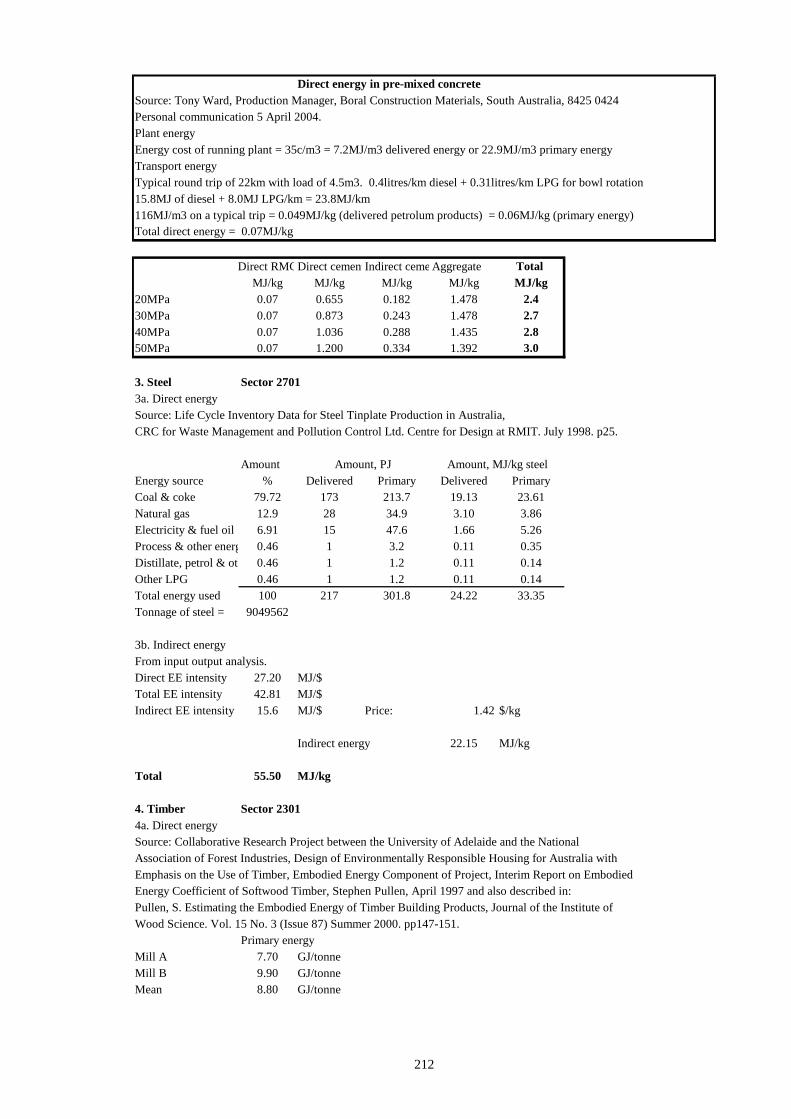
Direct energy in pre-mixed concreteSource: Tony Ward, Production Manager, Boral Construction Materials, South Australia, 8425 0424Personal communication 5 April 2004.Plant energyEnergy cost of running plant = 35c/m3 = 7.2MJ/m3 delivered energy or 22.9MJ/m3 primary energyTransport energyTypical round trip of 22km with load of 4.5m3. 0.4litres/km diesel + 0.31litres/km LPG for bowl rotation15.8MJ of diesel + 8.0MJ LPG/km = 23.8MJ/km116MJ/m3 on a typical trip = 0.049MJ/kg (delivered petrolum products) = 0.06MJ/kg (primary energy)Total direct energy = 0.07MJ/kg
Direct RMCDirect cementIndirect ceme Aggregate Total MJ/kg MJ/kg MJ/kg MJ/kg MJ/kg
20MPa 0.07 0.655 0.182 1.478 2.430MPa 0.07 0.873 0.243 1.478 2.740MPa 0.07 1.036 0.288 1.435 2.850MPa 0.07 1.200 0.334 1.392 3.0
3. Steel Sector 27013a. Direct energySource: Life Cycle Inventory Data for Steel Tinplate Production in Australia, CRC for Waste Management and Pollution Control Ltd. Centre for Design at RMIT. July 1998. p25.
AmountEnergy source % Delivered Primary Delivered PrimaryCoal & coke 79.72 173 213.7 19.13 23.61Natural gas 12.9 28 34.9 3.10 3.86Electricity & fuel oil 6.91 15 47.6 1.66 5.26Process & other energ 0.46 1 3.2 0.11 0.35Distillate, petrol & oth 0.46 1 1.2 0.11 0.14Other LPG 0.46 1 1.2 0.11 0.14Total energy used 100 217 301.8 24.22 33.35Tonnage of steel = 9049562
3b. Indirect energyFrom input output analysis. Direct EE intensity 27.20 MJ/$Total EE intensity 42.81 MJ/$Indirect EE intensity 15.6 MJ/$ Price: 1.42 $/kg
Indirect energy 22.15 MJ/kg
Total 55.50 MJ/kg
4. Timber Sector 23014a. Direct energySource: Collaborative Research Project between the University of Adelaide and the National Association of Forest Industries, Design of Environmentally Responsible Housing for Australia with Emphasis on the Use of Timber, Embodied Energy Component of Project, Interim Report on Embodied Energy Coefficient of Softwood Timber, Stephen Pullen, April 1997 and also described in: Pullen, S. Estimating the Embodied Energy of Timber Building Products, Journal of the Institute of Wood Science. Vol. 15 No. 3 (Issue 87) Summer 2000. pp147-151.
Primary energyMill A 7.70 GJ/tonneMill B 9.90 GJ/tonneMean 8.80 GJ/tonne
Amount, PJ Amount, MJ/kg steel
213
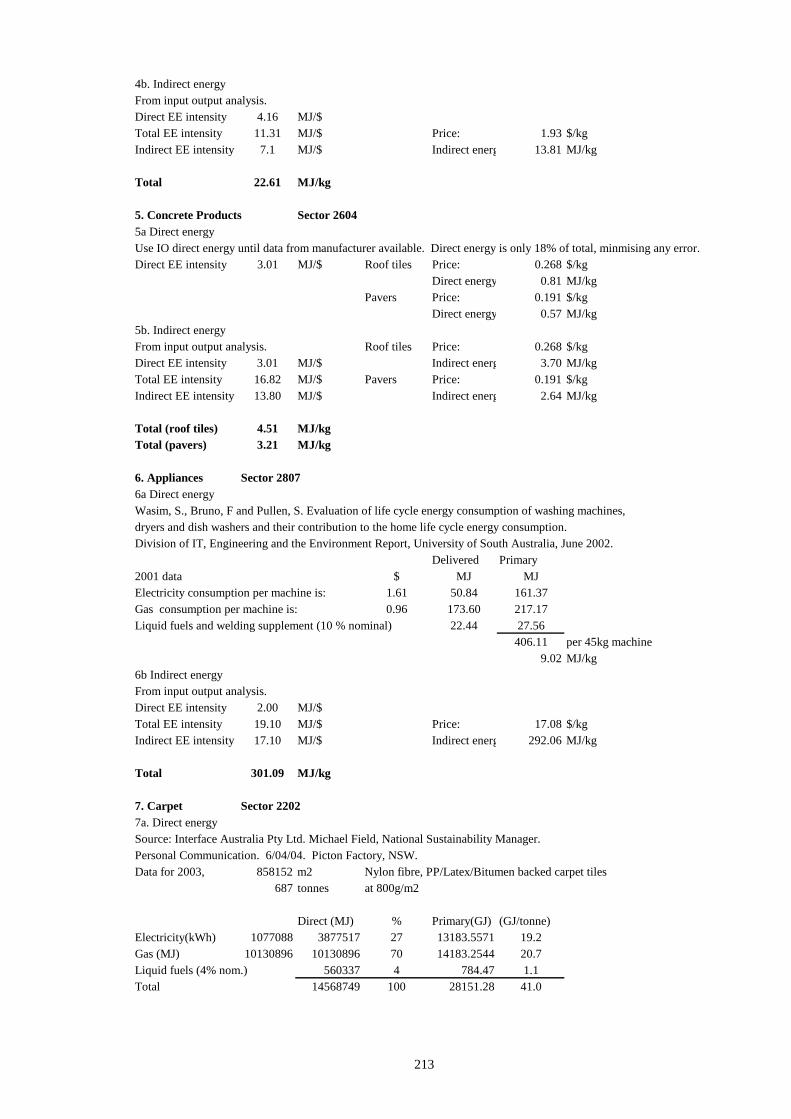
4b. Indirect energyFrom input output analysis. Direct EE intensity 4.16 MJ/$Total EE intensity 11.31 MJ/$ Price: 1.93 $/kgIndirect EE intensity 7.1 MJ/$ Indirect energ 13.81 MJ/kg
Total 22.61 MJ/kg
5. Concrete Products Sector 26045a Direct energyUse IO direct energy until data from manufacturer available. Direct energy is only 18% of total, minmising any error.Direct EE intensity 3.01 MJ/$ Roof tiles Price: 0.268 $/kg
Direct energy 0.81 MJ/kgPavers Price: 0.191 $/kg
Direct energy 0.57 MJ/kg5b. Indirect energyFrom input output analysis. Roof tiles Price: 0.268 $/kgDirect EE intensity 3.01 MJ/$ Indirect energ 3.70 MJ/kgTotal EE intensity 16.82 MJ/$ Pavers Price: 0.191 $/kgIndirect EE intensity 13.80 MJ/$ Indirect energ 2.64 MJ/kg
Total (roof tiles) 4.51 MJ/kgTotal (pavers) 3.21 MJ/kg
6. Appliances Sector 28076a Direct energyWasim, S., Bruno, F and Pullen, S. Evaluation of life cycle energy consumption of washing machines, dryers and dish washers and their contribution to the home life cycle energy consumption.Division of IT, Engineering and the Environment Report, University of South Australia, June 2002.
Delivered Primary2001 data $ MJ MJElectricity consumption per machine is: 1.61 50.84 161.37Gas consumption per machine is: 0.96 173.60 217.17Liquid fuels and welding supplement (10 % nominal) 22.44 27.56
406.11 per 45kg machine9.02 MJ/kg
6b Indirect energyFrom input output analysis. Direct EE intensity 2.00 MJ/$Total EE intensity 19.10 MJ/$ Price: 17.08 $/kgIndirect EE intensity 17.10 MJ/$ Indirect energ 292.06 MJ/kg
Total 301.09 MJ/kg
7. Carpet Sector 22027a. Direct energySource: Interface Australia Pty Ltd. Michael Field, National Sustainability Manager.Personal Communication. 6/04/04. Picton Factory, NSW.Data for 2003, 858152 m2 Nylon fibre, PP/Latex/Bitumen backed carpet tiles
687 tonnes at 800g/m2
Direct (MJ) % Primary(GJ) (GJ/tonne)Electricity(kWh) 1077088 3877517 27 13183.5571 19.2Gas (MJ) 10130896 10130896 70 14183.2544 20.7Liquid fuels (4% nom.) 560337 4 784.47 1.1Total 14568749 100 28151.28 41.0
214
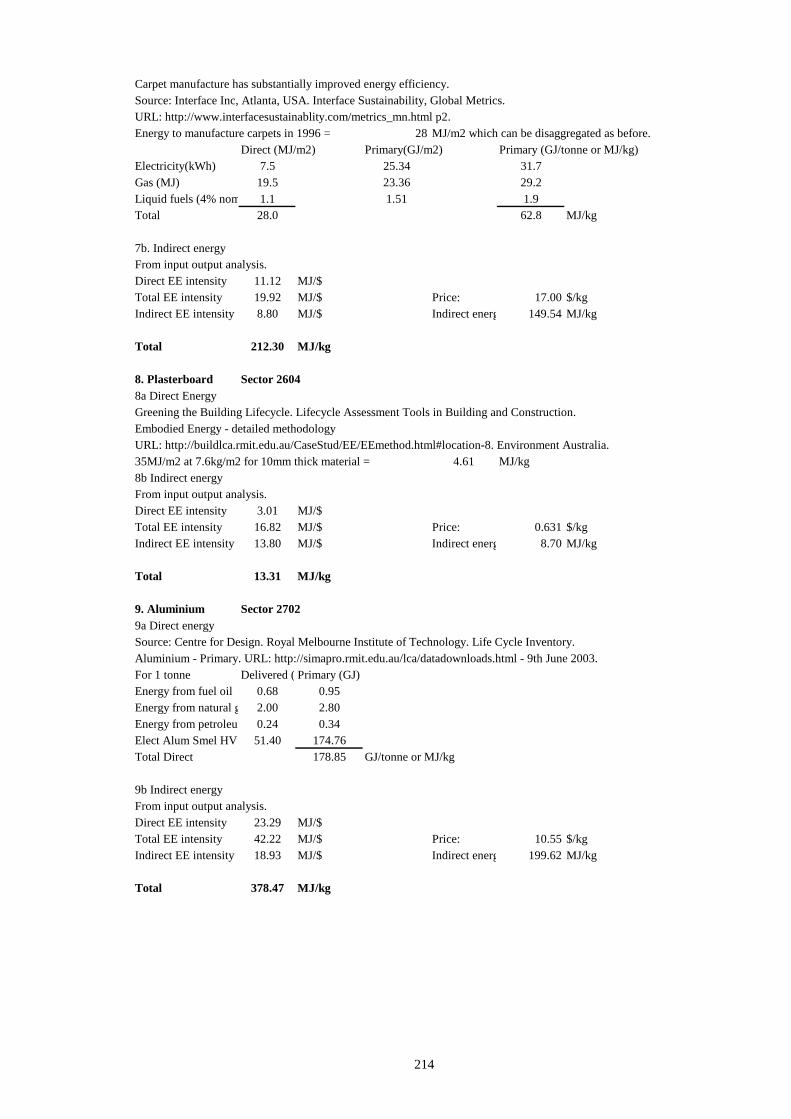
Carpet manufacture has substantially improved energy efficiency.Source: Interface Inc, Atlanta, USA. Interface Sustainability, Global Metrics. URL: http://www.interfacesustainablity.com/metrics_mn.html p2.Energy to manufacture carpets in 1996 = 28 MJ/m2 which can be disaggregated as before.
Direct (MJ/m2) Primary(GJ/m2) Primary (GJ/tonne or MJ/kg)Electricity(kWh) 7.5 25.34 31.7Gas (MJ) 19.5 23.36 29.2Liquid fuels (4% nom 1.1 1.51 1.9Total 28.0 62.8 MJ/kg
7b. Indirect energyFrom input output analysis. Direct EE intensity 11.12 MJ/$Total EE intensity 19.92 MJ/$ Price: 17.00 $/kgIndirect EE intensity 8.80 MJ/$ Indirect energ 149.54 MJ/kg
Total 212.30 MJ/kg
8. Plasterboard Sector 26048a Direct EnergyGreening the Building Lifecycle. Lifecycle Assessment Tools in Building and Construction. Embodied Energy - detailed methodology URL: http://buildlca.rmit.edu.au/CaseStud/EE/EEmethod.html#location-8. Environment Australia. 35MJ/m2 at 7.6kg/m2 for 10mm thick material = 4.61 MJ/kg8b Indirect energyFrom input output analysis. Direct EE intensity 3.01 MJ/$Total EE intensity 16.82 MJ/$ Price: 0.631 $/kgIndirect EE intensity 13.80 MJ/$ Indirect energ 8.70 MJ/kg
Total 13.31 MJ/kg
9. Aluminium Sector 27029a Direct energySource: Centre for Design. Royal Melbourne Institute of Technology. Life Cycle Inventory. Aluminium - Primary. URL: http://simapro.rmit.edu.au/lca/datadownloads.html - 9th June 2003.For 1 tonne Delivered ( Primary (GJ)Energy from fuel oil 0.68 0.95Energy from natural g 2.00 2.80Energy from petroleum 0.24 0.34Elect Alum Smel HV 51.40 174.76Total Direct 178.85 GJ/tonne or MJ/kg
9b Indirect energyFrom input output analysis. Direct EE intensity 23.29 MJ/$Total EE intensity 42.22 MJ/$ Price: 10.55 $/kgIndirect EE intensity 18.93 MJ/$ Indirect energ 199.62 MJ/kg
Total 378.47 MJ/kg
215
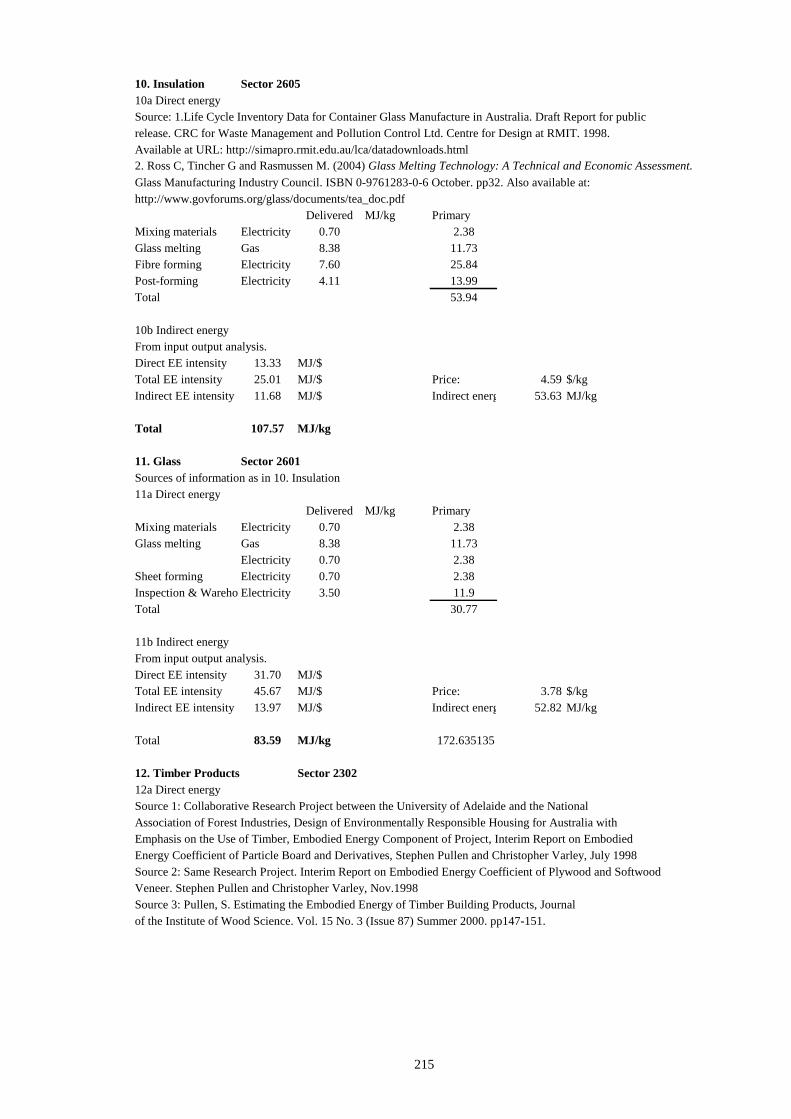
10. Insulation Sector 260510a Direct energySource: 1.Life Cycle Inventory Data for Container Glass Manufacture in Australia. Draft Report for public release. CRC for Waste Management and Pollution Control Ltd. Centre for Design at RMIT. 1998. Available at URL: http://simapro.rmit.edu.au/lca/datadownloads.html2. Ross C, Tincher G and Rasmussen M. (2004) Glass Melting Technology: A Technical and Economic Assessment. Glass Manufacturing Industry Council. ISBN 0-9761283-0-6 October. pp32. Also available at:http://www.govforums.org/glass/documents/tea_doc.pdf
Delivered MJ/kg PrimaryMixing materials Electricity 0.70 2.38Glass melting Gas 8.38 11.73Fibre forming Electricity 7.60 25.84Post-forming Electricity 4.11 13.99Total 53.94
10b Indirect energyFrom input output analysis. Direct EE intensity 13.33 MJ/$Total EE intensity 25.01 MJ/$ Price: 4.59 $/kgIndirect EE intensity 11.68 MJ/$ Indirect energ 53.63 MJ/kg
Total 107.57 MJ/kg
11. Glass Sector 2601Sources of information as in 10. Insulation11a Direct energy
Delivered MJ/kg PrimaryMixing materials Electricity 0.70 2.38Glass melting Gas 8.38 11.73
Electricity 0.70 2.38Sheet forming Electricity 0.70 2.38Inspection & Wareho Electricity 3.50 11.9Total 30.77
11b Indirect energyFrom input output analysis. Direct EE intensity 31.70 MJ/$Total EE intensity 45.67 MJ/$ Price: 3.78 $/kgIndirect EE intensity 13.97 MJ/$ Indirect energ 52.82 MJ/kg
Total 83.59 MJ/kg 172.635135
12. Timber Products Sector 230212a Direct energySource 1: Collaborative Research Project between the University of Adelaide and the National Association of Forest Industries, Design of Environmentally Responsible Housing for Australia with Emphasis on the Use of Timber, Embodied Energy Component of Project, Interim Report on Embodied Energy Coefficient of Particle Board and Derivatives, Stephen Pullen and Christopher Varley, July 1998 Source 2: Same Research Project. Interim Report on Embodied Energy Coefficient of Plywood and Softwood Veneer. Stephen Pullen and Christopher Varley, Nov.1998 Source 3: Pullen, S. Estimating the Embodied Energy of Timber Building Products, Journal of the Institute of Wood Science. Vol. 15 No. 3 (Issue 87) Summer 2000. pp147-151.
216
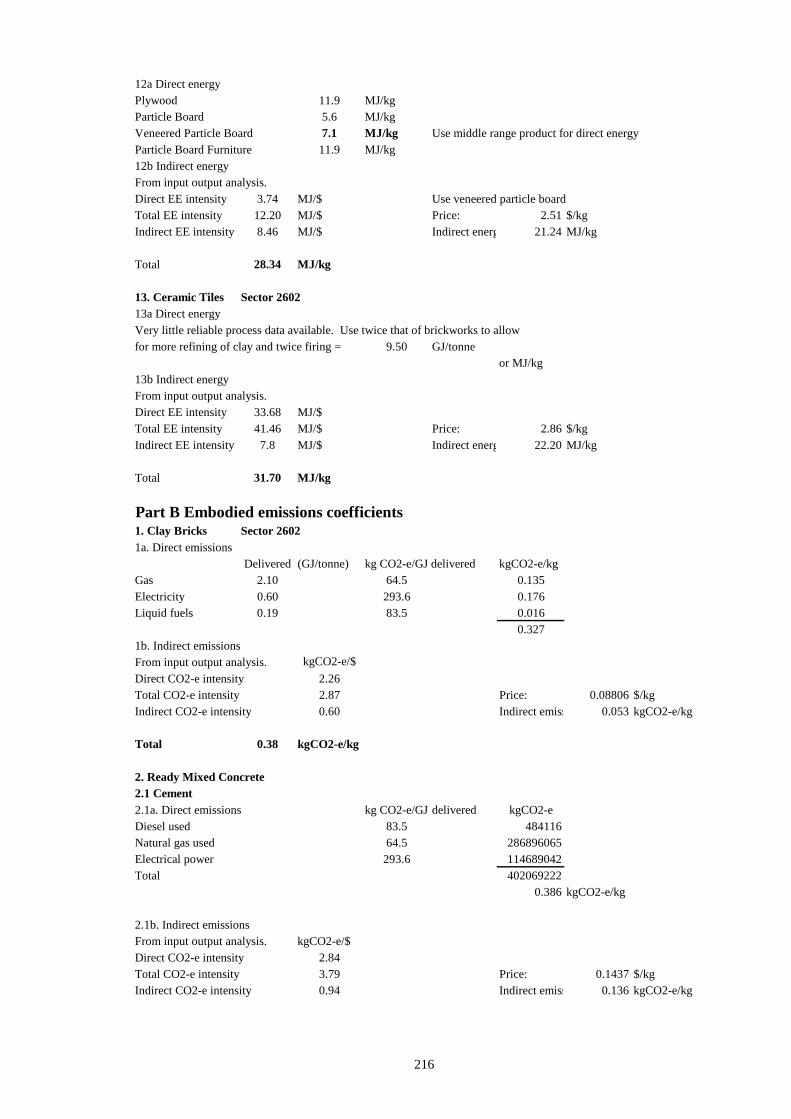
12a Direct energyPlywood 11.9 MJ/kgParticle Board 5.6 MJ/kgVeneered Particle Board 7.1 MJ/kg Use middle range product for direct energyParticle Board Furniture 11.9 MJ/kg12b Indirect energyFrom input output analysis. Direct EE intensity 3.74 MJ/$ Use veneered particle board Total EE intensity 12.20 MJ/$ Price: 2.51 $/kgIndirect EE intensity 8.46 MJ/$ Indirect energ 21.24 MJ/kg
Total 28.34 MJ/kg
13. Ceramic Tiles Sector 260213a Direct energyVery little reliable process data available. Use twice that of brickworks to allow for more refining of clay and twice firing = 9.50 GJ/tonne
or MJ/kg13b Indirect energyFrom input output analysis. Direct EE intensity 33.68 MJ/$Total EE intensity 41.46 MJ/$ Price: 2.86 $/kgIndirect EE intensity 7.8 MJ/$ Indirect energ 22.20 MJ/kg
Total 31.70 MJ/kg
Part B Embodied emissions coefficients1. Clay Bricks Sector 26021a. Direct emissions
Delivered (GJ/tonne) kg CO2-e/GJ delivered kgCO2-e/kgGas 2.10 64.5 0.135Electricity 0.60 293.6 0.176Liquid fuels 0.19 83.5 0.016
0.3271b. Indirect emissionsFrom input output analysis. kgCO2-e/$Direct CO2-e intensity 2.26Total CO2-e intensity 2.87 Price: 0.08806 $/kgIndirect CO2-e intensity 0.60 Indirect emiss 0.053 kgCO2-e/kg
Total 0.38 kgCO2-e/kg
2. Ready Mixed Concrete2.1 Cement2.1a. Direct emissions kg CO2-e/GJ delivered kgCO2-eDiesel used 83.5 484116Natural gas used 64.5 286896065Electrical power 293.6 114689042Total 402069222
0.386 kgCO2-e/kg
2.1b. Indirect emissionsFrom input output analysis. kgCO2-e/$Direct CO2-e intensity 2.84Total CO2-e intensity 3.79 Price: 0.1437 $/kgIndirect CO2-e intensity 0.94 Indirect emiss 0.136 kgCO2-e/kg
217
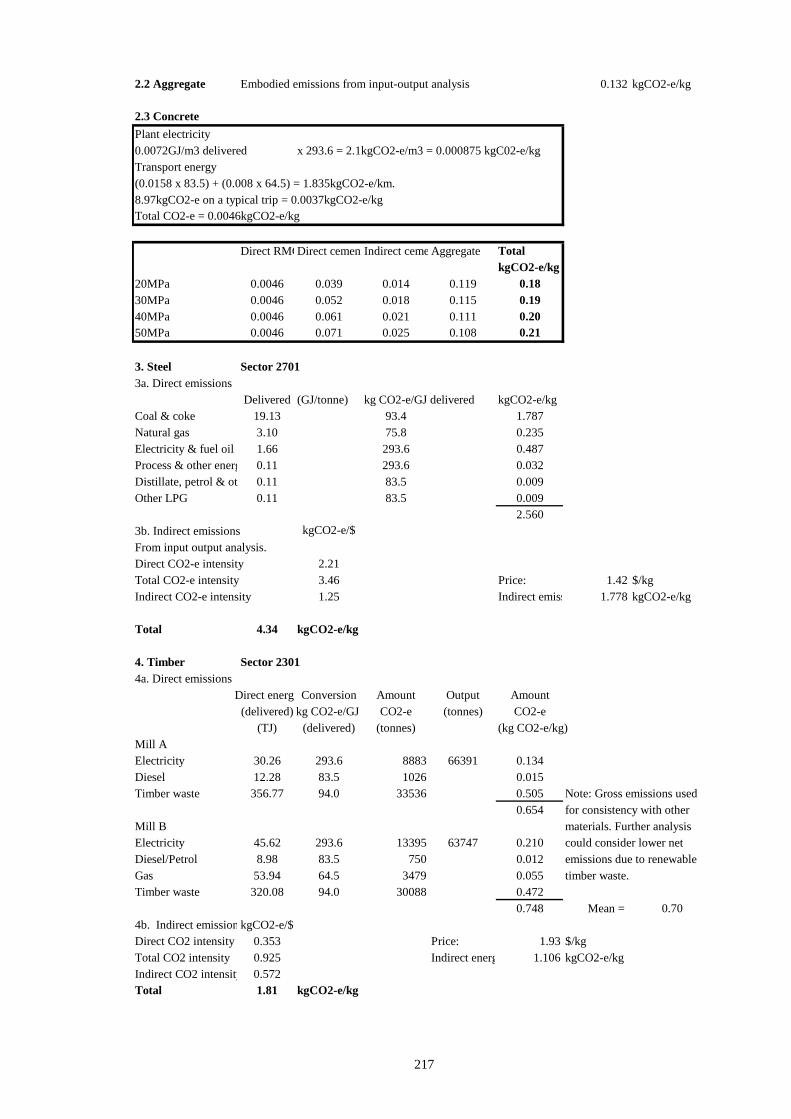
2.2 Aggregate Embodied emissions from input-output analysis 0.132 kgCO2-e/kg
2.3 ConcretePlant electricity0.0072GJ/m3 delivered x 293.6 = 2.1kgCO2-e/m3 = 0.000875 kgC02-e/kgTransport energy(0.0158 x 83.5) + (0.008 x 64.5) = 1.835kgCO2-e/km.8.97kgCO2-e on a typical trip = 0.0037kgCO2-e/kgTotal CO2-e = 0.0046kgCO2-e/kg
Direct RMCDirect cementIndirect ceme Aggregate Total kgCO2-e/kg
20MPa 0.0046 0.039 0.014 0.119 0.1830MPa 0.0046 0.052 0.018 0.115 0.1940MPa 0.0046 0.061 0.021 0.111 0.2050MPa 0.0046 0.071 0.025 0.108 0.21
3. Steel Sector 27013a. Direct emissions
Delivered (GJ/tonne) kg CO2-e/GJ delivered kgCO2-e/kgCoal & coke 19.13 93.4 1.787Natural gas 3.10 75.8 0.235Electricity & fuel oil 1.66 293.6 0.487Process & other energ 0.11 293.6 0.032Distillate, petrol & oth 0.11 83.5 0.009Other LPG 0.11 83.5 0.009
2.5603b. Indirect emissions kgCO2-e/$From input output analysis. Direct CO2-e intensity 2.21Total CO2-e intensity 3.46 Price: 1.42 $/kgIndirect CO2-e intensity 1.25 Indirect emiss 1.778 kgCO2-e/kg
Total 4.34 kgCO2-e/kg
4. Timber Sector 23014a. Direct emissions
Direct energyConversion Amount Output Amount(delivered) kg CO2-e/GJ CO2-e (tonnes) CO2-e
(TJ) (delivered) (tonnes) (kg CO2-e/kg)Mill A Electricity 30.26 293.6 8883 66391 0.134Diesel 12.28 83.5 1026 0.015Timber waste 356.77 94.0 33536 0.505 Note: Gross emissions used
0.654 for consistency with other Mill B materials. Further analysisElectricity 45.62 293.6 13395 63747 0.210 could consider lower net Diesel/Petrol 8.98 83.5 750 0.012 emissions due to renewable Gas 53.94 64.5 3479 0.055 timber waste.Timber waste 320.08 94.0 30088 0.472
0.748 Mean = 0.704b. Indirect emission kgCO2-e/$Direct CO2 intensity 0.353 Price: 1.93 $/kgTotal CO2 intensity 0.925 Indirect energ 1.106 kgCO2-e/kgIndirect CO2 intensity 0.572Total 1.81 kgCO2-e/kg
218
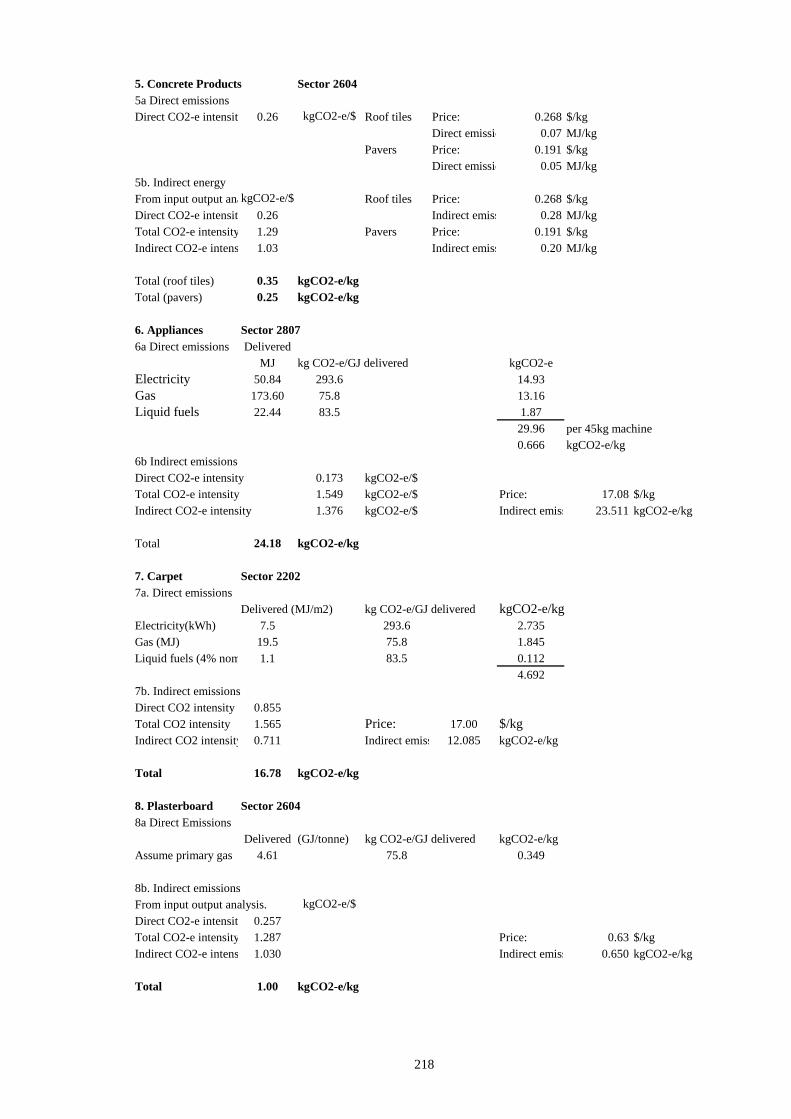
5. Concrete Products Sector 26045a Direct emissionsDirect CO2-e intensit 0.26 kgCO2-e/$ Roof tiles Price: 0.268 $/kg
Direct emissio 0.07 MJ/kgPavers Price: 0.191 $/kg
Direct emissio 0.05 MJ/kg5b. Indirect energyFrom input output anakgCO2-e/$ Roof tiles Price: 0.268 $/kgDirect CO2-e intensit 0.26 Indirect emiss 0.28 MJ/kgTotal CO2-e intensity 1.29 Pavers Price: 0.191 $/kgIndirect CO2-e intens 1.03 Indirect emiss 0.20 MJ/kg
Total (roof tiles) 0.35 kgCO2-e/kgTotal (pavers) 0.25 kgCO2-e/kg
6. Appliances Sector 28076a Direct emissions Delivered
MJ kg CO2-e/GJ delivered kgCO2-eElectricity 50.84 293.6 14.93Gas 173.60 75.8 13.16Liquid fuels 22.44 83.5 1.87
29.96 per 45kg machine0.666 kgCO2-e/kg
6b Indirect emissionsDirect CO2-e intensity 0.173 kgCO2-e/$Total CO2-e intensity 1.549 kgCO2-e/$ Price: 17.08 $/kgIndirect CO2-e intensity 1.376 kgCO2-e/$ Indirect emiss 23.511 kgCO2-e/kg
Total 24.18 kgCO2-e/kg
7. Carpet Sector 22027a. Direct emissions
Delivered (MJ/m2) kg CO2-e/GJ delivered kgCO2-e/kgElectricity(kWh) 7.5 293.6 2.735Gas (MJ) 19.5 75.8 1.845Liquid fuels (4% nom 1.1 83.5 0.112
4.6927b. Indirect emissionsDirect CO2 intensity 0.855Total CO2 intensity 1.565 Price: 17.00 $/kgIndirect CO2 intensity 0.711 Indirect emiss 12.085 kgCO2-e/kg
Total 16.78 kgCO2-e/kg
8. Plasterboard Sector 26048a Direct Emissions
Delivered (GJ/tonne) kg CO2-e/GJ delivered kgCO2-e/kgAssume primary gas 4.61 75.8 0.349
8b. Indirect emissionsFrom input output analysis. kgCO2-e/$Direct CO2-e intensit 0.257Total CO2-e intensity 1.287 Price: 0.63 $/kgIndirect CO2-e intens 1.030 Indirect emiss 0.650 kgCO2-e/kg
Total 1.00 kgCO2-e/kg
219
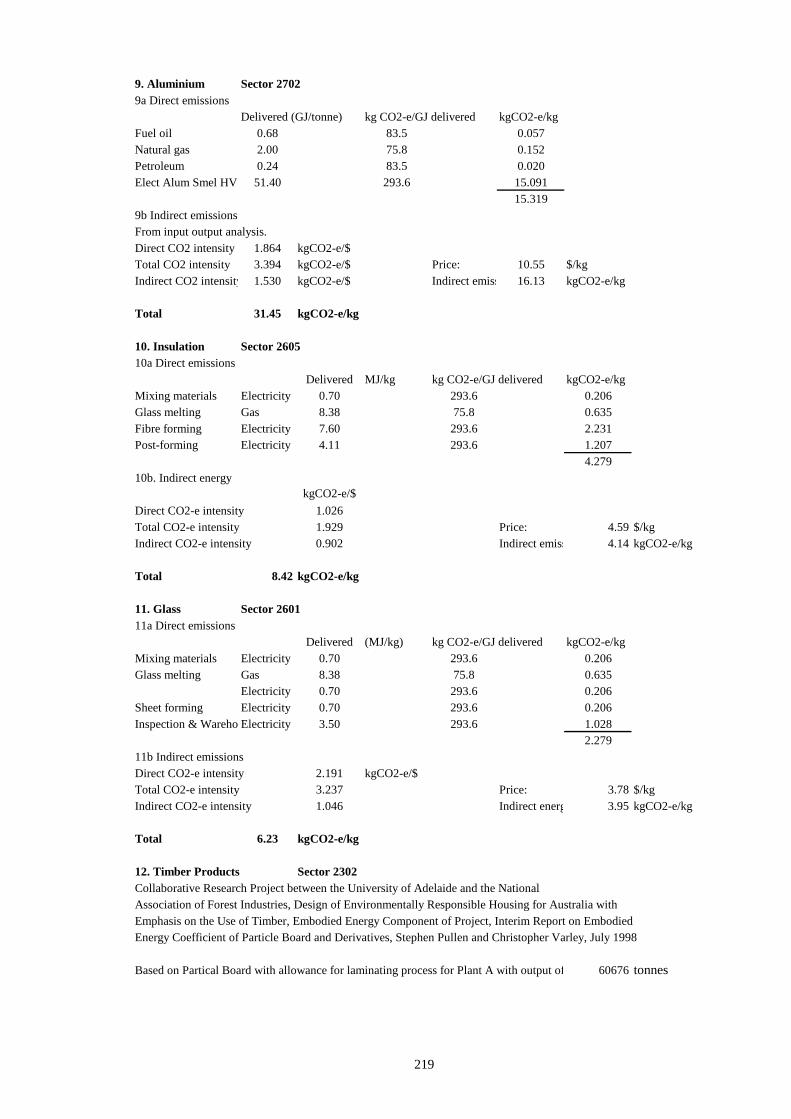
9. Aluminium Sector 27029a Direct emissions
Delivered (GJ/tonne) kg CO2-e/GJ delivered kgCO2-e/kgFuel oil 0.68 83.5 0.057Natural gas 2.00 75.8 0.152Petroleum 0.24 83.5 0.020Elect Alum Smel HV 51.40 293.6 15.091
15.3199b Indirect emissionsFrom input output analysis. Direct CO2 intensity 1.864 kgCO2-e/$Total CO2 intensity 3.394 kgCO2-e/$ Price: 10.55 $/kgIndirect CO2 intensity 1.530 kgCO2-e/$ Indirect emiss 16.13 kgCO2-e/kg
Total 31.45 kgCO2-e/kg
10. Insulation Sector 260510a Direct emissions
Delivered MJ/kg kg CO2-e/GJ delivered kgCO2-e/kgMixing materials Electricity 0.70 293.6 0.206Glass melting Gas 8.38 75.8 0.635Fibre forming Electricity 7.60 293.6 2.231Post-forming Electricity 4.11 293.6 1.207
4.27910b. Indirect energy
kgCO2-e/$Direct CO2-e intensity 1.026Total CO2-e intensity 1.929 Price: 4.59 $/kgIndirect CO2-e intensity 0.902 Indirect emiss 4.14 kgCO2-e/kg
Total 8.42 kgCO2-e/kg
11. Glass Sector 260111a Direct emissions
Delivered (MJ/kg) kg CO2-e/GJ delivered kgCO2-e/kgMixing materials Electricity 0.70 293.6 0.206Glass melting Gas 8.38 75.8 0.635
Electricity 0.70 293.6 0.206Sheet forming Electricity 0.70 293.6 0.206Inspection & Wareho Electricity 3.50 293.6 1.028
2.27911b Indirect emissionsDirect CO2-e intensity 2.191 kgCO2-e/$Total CO2-e intensity 3.237 Price: 3.78 $/kgIndirect CO2-e intensity 1.046 Indirect energ 3.95 kgCO2-e/kg
Total 6.23 kgCO2-e/kg
12. Timber Products Sector 2302Collaborative Research Project between the University of Adelaide and the National Association of Forest Industries, Design of Environmentally Responsible Housing for Australia with Emphasis on the Use of Timber, Embodied Energy Component of Project, Interim Report on Embodied Energy Coefficient of Particle Board and Derivatives, Stephen Pullen and Christopher Varley, July 1998
Based on Partical Board with allowance for laminating process for Plant A with output of 60676 tonnes
220
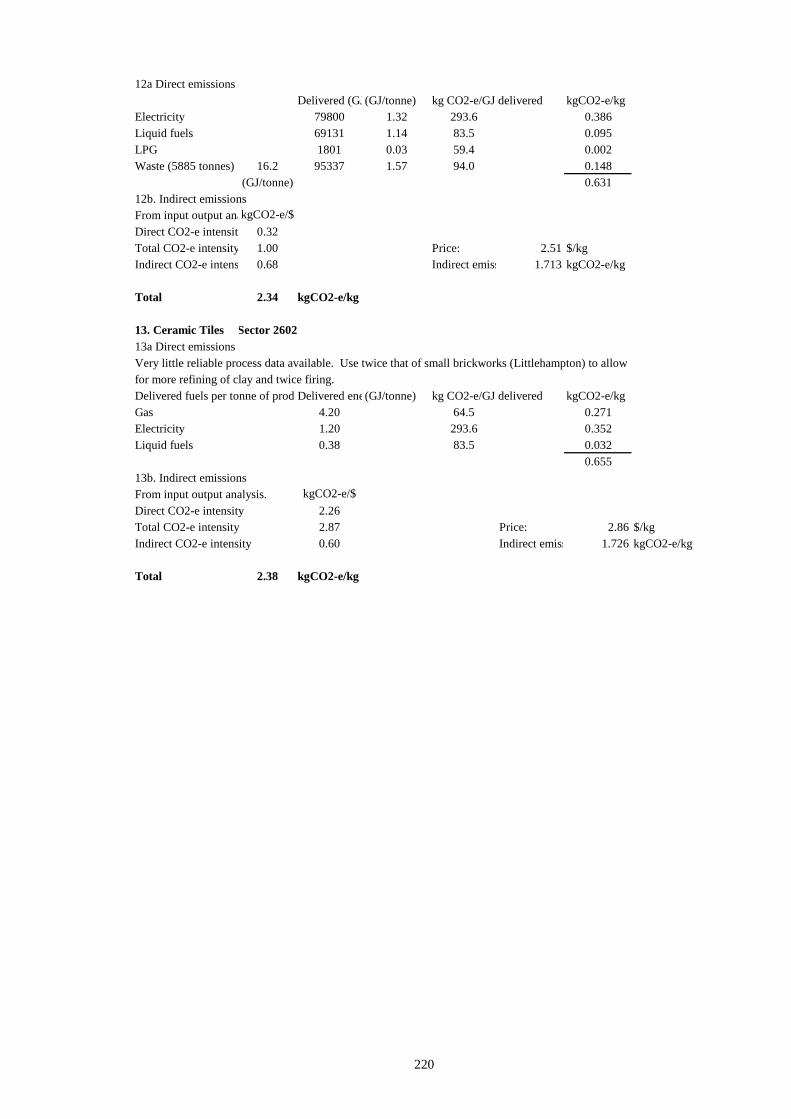
12a Direct emissionsDelivered (GJ(GJ/tonne) kg CO2-e/GJ delivered kgCO2-e/kg
Electricity 79800 1.32 293.6 0.386Liquid fuels 69131 1.14 83.5 0.095LPG 1801 0.03 59.4 0.002Waste (5885 tonnes) 16.2 95337 1.57 94.0 0.148
(GJ/tonne) 0.63112b. Indirect emissionsFrom input output anakgCO2-e/$Direct CO2-e intensit 0.32Total CO2-e intensity 1.00 Price: 2.51 $/kgIndirect CO2-e intens 0.68 Indirect emiss 1.713 kgCO2-e/kg
Total 2.34 kgCO2-e/kg
13. Ceramic Tiles Sector 260213a Direct emissionsVery little reliable process data available. Use twice that of small brickworks (Littlehampton) to allow for more refining of clay and twice firing.Delivered fuels per tonne of produDelivered ene(GJ/tonne) kg CO2-e/GJ delivered kgCO2-e/kgGas 4.20 64.5 0.271Electricity 1.20 293.6 0.352Liquid fuels 0.38 83.5 0.032
0.65513b. Indirect emissionsFrom input output analysis. kgCO2-e/$Direct CO2-e intensity 2.26Total CO2-e intensity 2.87 Price: 2.86 $/kgIndirect CO2-e intensity 0.60 Indirect emiss 1.726 kgCO2-e/kg
Total 2.38 kgCO2-e/kg
221
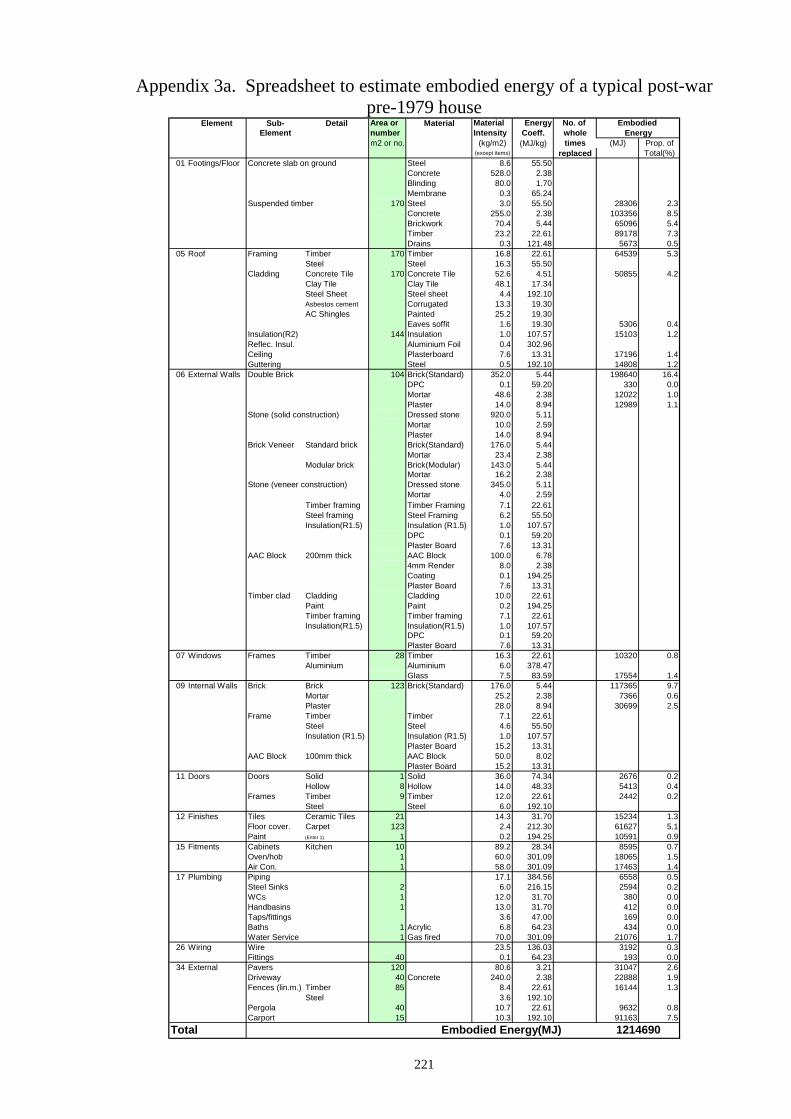
Appendix 3a. Spreadsheet to estimate embodied energy of a typical post-war pre-1979 house
Element Sub- Detail Area or Material Material Energy No. of Embodied Element number Intensity Coeff. whole Energy
m2 or no. (kg/m2) (MJ/kg) times (MJ) Prop. of(except items) replaced Total(%)
01 Footings/Floor Concrete slab on ground Steel 8.6 55.50Concrete 528.0 2.38Blinding 80.0 1.70Membrane 0.3 65.24
Suspended timber 170 Steel 3.0 55.50 28306 2.3Concrete 255.0 2.38 103356 8.5Brickwork 70.4 5.44 65096 5.4Timber 23.2 22.61 89178 7.3Drains 0.3 121.48 5673 0.5
05 Roof Framing Timber 170 Timber 16.8 22.61 64539 5.3Steel Steel 16.3 55.50
Cladding Concrete Tile 170 Concrete Tile 52.6 4.51 50855 4.2Clay Tile Clay Tile 48.1 17.34Steel Sheet Steel sheet 4.4 192.10Asbestos cement Corrugated 13.3 19.30AC Shingles Painted 25.2 19.30
Eaves soffit 1.6 19.30 5306 0.4Insulation(R2) 144 Insulation 1.0 107.57 15103 1.2Reflec. Insul. Aluminium Foil 0.4 302.96Ceiling Plasterboard 7.6 13.31 17196 1.4Guttering Steel 0.5 192.10 14808 1.2
06 External Walls Double Brick 104 Brick(Standard) 352.0 5.44 198640 16.4DPC 0.1 59.20 330 0.0Mortar 48.6 2.38 12022 1.0Plaster 14.0 8.94 12989 1.1Dressed stone 920.0 5.11Mortar 10.0 2.59Plaster 14.0 8.94
Brick Veneer Standard brick Brick(Standard) 176.0 5.44Mortar 23.4 2.38
Modular brick Brick(Modular) 143.0 5.44Mortar 16.2 2.38
Stone (veneer construction) Dressed stone 345.0 5.11Mortar 4.0 2.59
Timber framing Timber Framing 7.1 22.61Steel framing Steel Framing 6.2 55.50Insulation(R1.5) Insulation (R1.5) 1.0 107.57
DPC 0.1 59.20Plaster Board 7.6 13.31
AAC Block 200mm thick AAC Block 100.0 6.784mm Render 8.0 2.38Coating 0.1 194.25Plaster Board 7.6 13.31
Timber clad Cladding Cladding 10.0 22.61Paint Paint 0.2 194.25Timber framing Timber framing 7.1 22.61Insulation(R1.5) Insulation(R1.5) 1.0 107.57
DPC 0.1 59.20Plaster Board 7.6 13.31
07 Windows Frames Timber 28 Timber 16.3 22.61 10320 0.8Aluminium Aluminium 6.0 378.47
Glass 7.5 83.59 17554 1.409 Internal Walls Brick Brick 123 Brick(Standard) 176.0 5.44 117365 9.7
Mortar 25.2 2.38 7366 0.6Plaster 28.0 8.94 30699 2.5
Frame Timber Timber 7.1 22.61Steel Steel 4.6 55.50Insulation (R1.5) Insulation (R1.5) 1.0 107.57
Plaster Board 15.2 13.31AAC Block 100mm thick AAC Block 50.0 8.02
Plaster Board 15.2 13.3111 Doors Doors Solid 1 Solid 36.0 74.34 2676 0.2
Hollow 8 Hollow 14.0 48.33 5413 0.4Frames Timber 9 Timber 12.0 22.61 2442 0.2
Steel Steel 6.0 192.1012 Finishes Tiles Ceramic Tiles 21 14.3 31.70 15234 1.3
Floor cover. Carpet 123 2.4 212.30 61627 5.1Paint (Enter 1) 1 0.2 194.25 10591 0.9
15 Fitments Cabinets Kitchen 10 89.2 28.34 8595 0.7Oven/hob 1 60.0 301.09 18065 1.5Air Con. 1 58.0 301.09 17463 1.4
17 Plumbing Piping 17.1 384.56 6558 0.5Steel Sinks 2 6.0 216.15 2594 0.2WCs 1 12.0 31.70 380 0.0Handbasins 1 13.0 31.70 412 0.0Taps/fittings 3.6 47.00 169 0.0Baths 1 Acrylic 6.8 64.23 434 0.0Water Service 1 Gas fired 70.0 301.09 21076 1.7
26 Wiring Wire 23.5 136.03 3192 0.3Fittings 40 0.1 64.23 193 0.0
34 External Pavers 120 80.6 3.21 31047 2.6Driveway 40 Concrete 240.0 2.38 22888 1.9Fences (lin.m.) Timber 85 8.4 22.61 16144 1.3
Steel 3.6 192.10Pergola 40 10.7 22.61 9632 0.8Carport 15 10.3 192.10 91163 7.5
Total Embodied Energy(MJ) 1214690
Stone (solid construction)
222
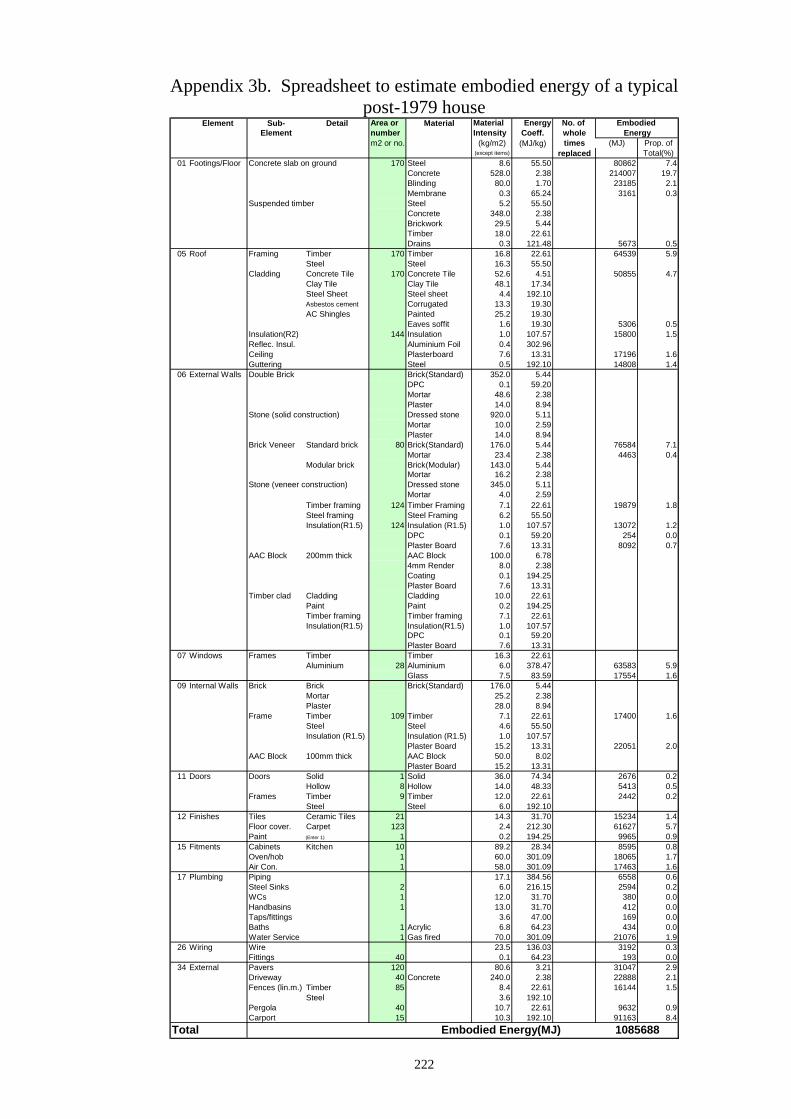
Appendix 3b. Spreadsheet to estimate embodied energy of a typical post-1979 house
Element Sub- Detail Area or Material Material Energy No. of Embodied Element number Intensity Coeff. whole Energy
m2 or no. (kg/m2) (MJ/kg) times (MJ) Prop. of(except items) replaced Total(%)
01 Footings/Floor Concrete slab on ground 170 Steel 8.6 55.50 80862 7.4Concrete 528.0 2.38 214007 19.7Blinding 80.0 1.70 23185 2.1Membrane 0.3 65.24 3161 0.3
Suspended timber Steel 5.2 55.50Concrete 348.0 2.38Brickwork 29.5 5.44Timber 18.0 22.61Drains 0.3 121.48 5673 0.5
05 Roof Framing Timber 170 Timber 16.8 22.61 64539 5.9Steel Steel 16.3 55.50
Cladding Concrete Tile 170 Concrete Tile 52.6 4.51 50855 4.7Clay Tile Clay Tile 48.1 17.34Steel Sheet Steel sheet 4.4 192.10Asbestos cement Corrugated 13.3 19.30AC Shingles Painted 25.2 19.30
Eaves soffit 1.6 19.30 5306 0.5Insulation(R2) 144 Insulation 1.0 107.57 15800 1.5Reflec. Insul. Aluminium Foil 0.4 302.96Ceiling Plasterboard 7.6 13.31 17196 1.6Guttering Steel 0.5 192.10 14808 1.4
06 External Walls Double Brick Brick(Standard) 352.0 5.44DPC 0.1 59.20Mortar 48.6 2.38Plaster 14.0 8.94Dressed stone 920.0 5.11Mortar 10.0 2.59Plaster 14.0 8.94
Brick Veneer Standard brick 80 Brick(Standard) 176.0 5.44 76584 7.1Mortar 23.4 2.38 4463 0.4
Modular brick Brick(Modular) 143.0 5.44Mortar 16.2 2.38
Stone (veneer construction) Dressed stone 345.0 5.11Mortar 4.0 2.59
Timber framing 124 Timber Framing 7.1 22.61 19879 1.8Steel framing Steel Framing 6.2 55.50Insulation(R1.5) 124 Insulation (R1.5) 1.0 107.57 13072 1.2
DPC 0.1 59.20 254 0.0Plaster Board 7.6 13.31 8092 0.7
AAC Block 200mm thick AAC Block 100.0 6.784mm Render 8.0 2.38Coating 0.1 194.25Plaster Board 7.6 13.31
Timber clad Cladding Cladding 10.0 22.61Paint Paint 0.2 194.25Timber framing Timber framing 7.1 22.61Insulation(R1.5) Insulation(R1.5) 1.0 107.57
DPC 0.1 59.20Plaster Board 7.6 13.31
07 Windows Frames Timber Timber 16.3 22.61Aluminium 28 Aluminium 6.0 378.47 63583 5.9
Glass 7.5 83.59 17554 1.609 Internal Walls Brick Brick Brick(Standard) 176.0 5.44
Mortar 25.2 2.38Plaster 28.0 8.94
Frame Timber 109 Timber 7.1 22.61 17400 1.6Steel Steel 4.6 55.50Insulation (R1.5) Insulation (R1.5) 1.0 107.57
Plaster Board 15.2 13.31 22051 2.0AAC Block 100mm thick AAC Block 50.0 8.02
Plaster Board 15.2 13.3111 Doors Doors Solid 1 Solid 36.0 74.34 2676 0.2
Hollow 8 Hollow 14.0 48.33 5413 0.5Frames Timber 9 Timber 12.0 22.61 2442 0.2
Steel Steel 6.0 192.1012 Finishes Tiles Ceramic Tiles 21 14.3 31.70 15234 1.4
Floor cover. Carpet 123 2.4 212.30 61627 5.7Paint (Enter 1) 1 0.2 194.25 9965 0.9
15 Fitments Cabinets Kitchen 10 89.2 28.34 8595 0.8Oven/hob 1 60.0 301.09 18065 1.7Air Con. 1 58.0 301.09 17463 1.6
17 Plumbing Piping 17.1 384.56 6558 0.6Steel Sinks 2 6.0 216.15 2594 0.2WCs 1 12.0 31.70 380 0.0Handbasins 1 13.0 31.70 412 0.0Taps/fittings 3.6 47.00 169 0.0Baths 1 Acrylic 6.8 64.23 434 0.0Water Service 1 Gas fired 70.0 301.09 21076 1.9
26 Wiring Wire 23.5 136.03 3192 0.3Fittings 40 0.1 64.23 193 0.0
34 External Pavers 120 80.6 3.21 31047 2.9Driveway 40 Concrete 240.0 2.38 22888 2.1Fences (lin.m.) Timber 85 8.4 22.61 16144 1.5
Steel 3.6 192.10Pergola 40 10.7 22.61 9632 0.9Carport 15 10.3 192.10 91163 8.4
Total Embodied Energy(MJ) 1085688
Stone (solid construction)
223
Appendix 4 Requests to the Land Services Group for Property Register data
224
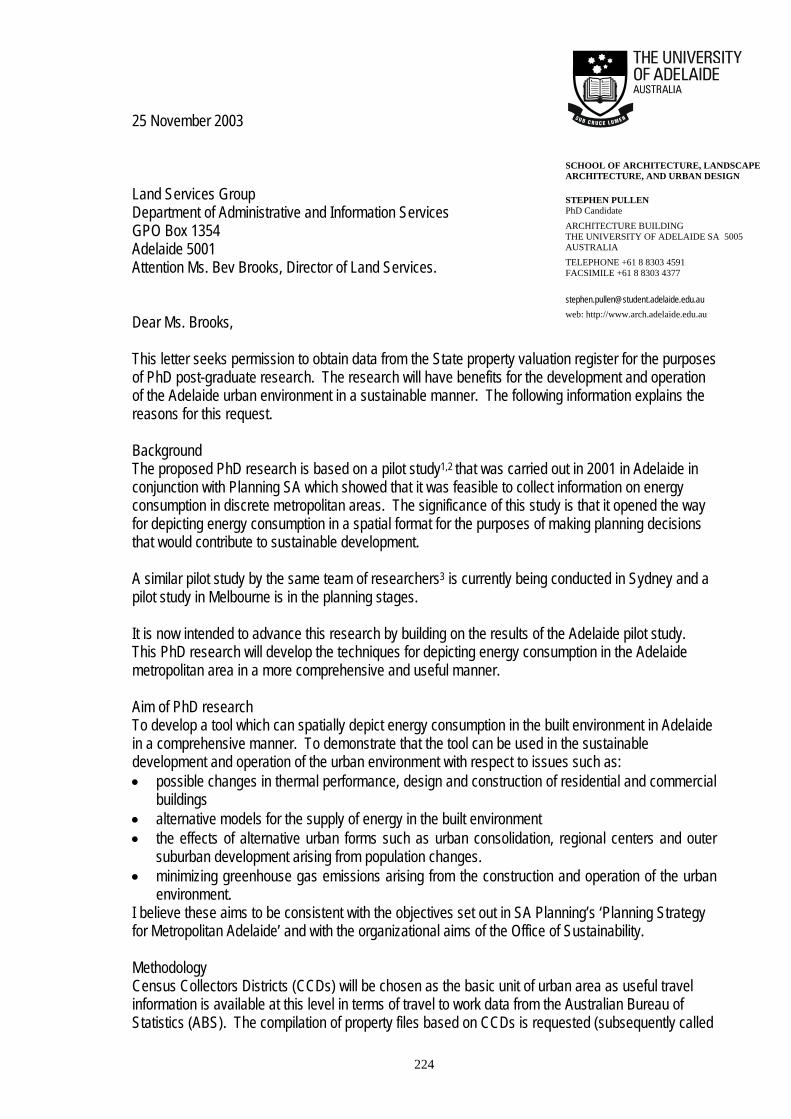
25 November 2003 Land Services Group Department of Administrative and Information Services GPO Box 1354 Adelaide 5001 Attention Ms. Bev Brooks, Director of Land Services. Dear Ms. Brooks, This letter seeks permission to obtain data from the State property valuation register for the purposes of PhD post-graduate research. The research will have benefits for the development and operation of the Adelaide urban environment in a sustainable manner. The following information explains the reasons for this request. Background The proposed PhD research is based on a pilot study1,2 that was carried out in 2001 in Adelaide in conjunction with Planning SA which showed that it was feasible to collect information on energy consumption in discrete metropolitan areas. The significance of this study is that it opened the way for depicting energy consumption in a spatial format for the purposes of making planning decisions that would contribute to sustainable development. A similar pilot study by the same team of researchers3 is currently being conducted in Sydney and a pilot study in Melbourne is in the planning stages. It is now intended to advance this research by building on the results of the Adelaide pilot study. This PhD research will develop the techniques for depicting energy consumption in the Adelaide metropolitan area in a more comprehensive and useful manner. Aim of PhD research To develop a tool which can spatially depict energy consumption in the built environment in Adelaide in a comprehensive manner. To demonstrate that the tool can be used in the sustainable development and operation of the urban environment with respect to issues such as: • possible changes in thermal performance, design and construction of residential and commercial
buildings • alternative models for the supply of energy in the built environment • the effects of alternative urban forms such as urban consolidation, regional centers and outer
suburban development arising from population changes. • minimizing greenhouse gas emissions arising from the construction and operation of the urban
environment. I believe these aims to be consistent with the objectives set out in SA Planning’s ‘Planning Strategy for Metropolitan Adelaide’ and with the organizational aims of the Office of Sustainability. Methodology Census Collectors Districts (CCDs) will be chosen as the basic unit of urban area as useful travel information is available at this level in terms of travel to work data from the Australian Bureau of Statistics (ABS). The compilation of property files based on CCDs is requested (subsequently called
SCHOOL OF ARCHITECTURE, LANDSCAPE ARCHITECTURE, AND URBAN DESIGN STEPHEN PULLEN PhD Candidate ARCHITECTURE BUILDING THE UNIVERSITY OF ADELAIDE SA 5005 AUSTRALIA TELEPHONE +61 8 8303 4591 FACSIMILE +61 8 8303 4377
[email protected] web: http://www.arch.adelaide.edu.au
225
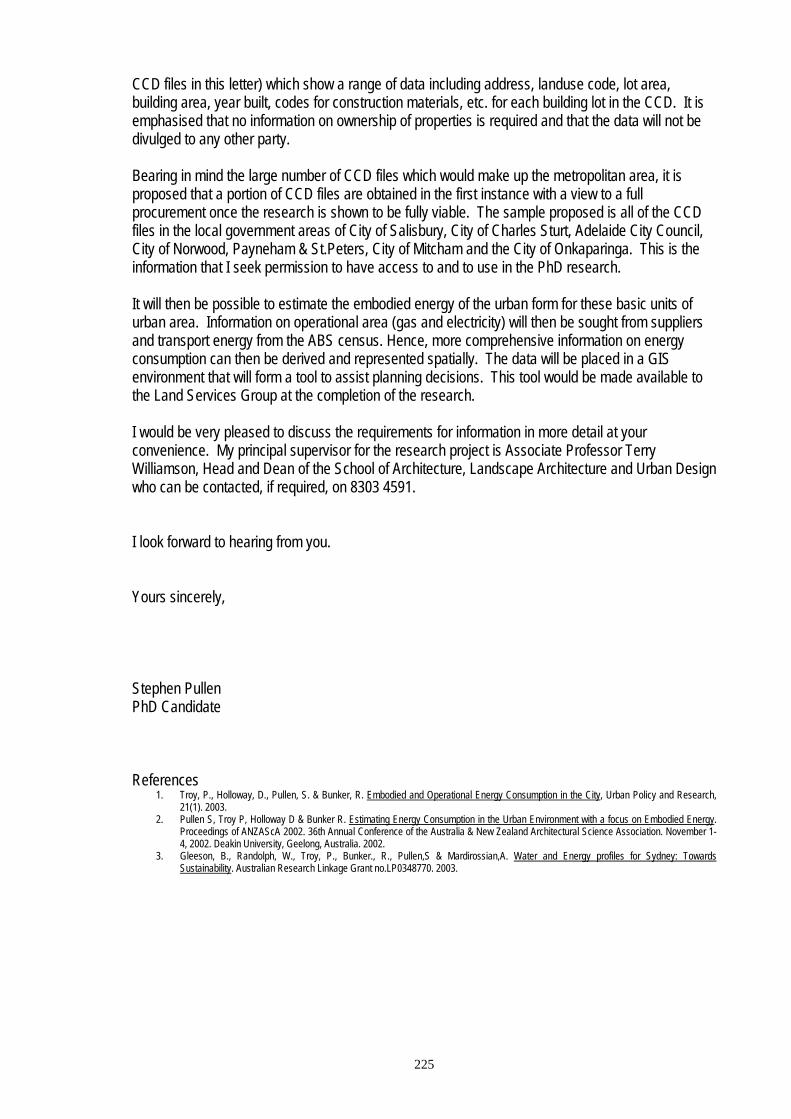
CCD files in this letter) which show a range of data including address, landuse code, lot area, building area, year built, codes for construction materials, etc. for each building lot in the CCD. It is emphasised that no information on ownership of properties is required and that the data will not be divulged to any other party. Bearing in mind the large number of CCD files which would make up the metropolitan area, it is proposed that a portion of CCD files are obtained in the first instance with a view to a full procurement once the research is shown to be fully viable. The sample proposed is all of the CCD files in the local government areas of City of Salisbury, City of Charles Sturt, Adelaide City Council, City of Norwood, Payneham & St.Peters, City of Mitcham and the City of Onkaparinga. This is the information that I seek permission to have access to and to use in the PhD research. It will then be possible to estimate the embodied energy of the urban form for these basic units of urban area. Information on operational area (gas and electricity) will then be sought from suppliers and transport energy from the ABS census. Hence, more comprehensive information on energy consumption can then be derived and represented spatially. The data will be placed in a GIS environment that will form a tool to assist planning decisions. This tool would be made available to the Land Services Group at the completion of the research. I would be very pleased to discuss the requirements for information in more detail at your convenience. My principal supervisor for the research project is Associate Professor Terry Williamson, Head and Dean of the School of Architecture, Landscape Architecture and Urban Design who can be contacted, if required, on 8303 4591. I look forward to hearing from you. Yours sincerely, Stephen Pullen PhD Candidate References
1. Troy, P., Holloway, D., Pullen, S. & Bunker, R. Embodied and Operational Energy Consumption in the City, Urban Policy and Research, 21(1). 2003.
2. Pullen S, Troy P, Holloway D & Bunker R. Estimating Energy Consumption in the Urban Environment with a focus on Embodied Energy. Proceedings of ANZAScA 2002. 36th Annual Conference of the Australia & New Zealand Architectural Science Association. November 1-4, 2002. Deakin University, Geelong, Australia. 2002.
3. Gleeson, B., Randolph, W., Troy, P., Bunker., R., Pullen,S & Mardirossian,A. Water and Energy profiles for Sydney: Towards Sustainability. Australian Research Linkage Grant no.LP0348770. 2003.
226
5 December 2003 Land Services Group Department of Administrative and Information Services GPO Box 1354 Adelaide 5001 Attention Ms. Bev Brooks, Director of Land Services. Dear Ms. Brooks, I refer to a letter sent to you dated 25 November 2003 from a PhD student by the name of Stephen Pullen requesting data from the State property valuation register for research purposes. I understand that Peter von der Borch, Senior Policy Officer of the Land Services Group has been in contact with Stephen asking for confirmation of this request from me. This to confirm that Stephen Pullen is a PhD candidate in the School of Architecture and is carrying out research into the energy consumption in the built environment in Adelaide. This research would be greatly facilitated by access to certain data held on the State property valuation register. The outcomes of the research would provide a greater understanding of energy consumption in Adelaide and the optimisation of the urban form for minimum environmental impact. I understand that no information on ownership of properties is required and that the data will not be divulged to any other party without permission of the Land Services Group. It would be appreciated if you would provide access to the data required and give permission for its use in this research project. Yours sincerely, Dr. Terry Williamson, Head and Dean of the School of Architecture, Landscape Architecture and Urban Design
SCHOOL OF ARCHITECTURE, LANDSCAPE ARCHITECTURE, AND URBAN DESIGN STEPHEN PULLEN PhD Candidate ARCHITECTURE BUILDING THE UNIVERSITY OF ADELAIDE SA 5005 AUSTRALIA TELEPHONE +61 8 8303 4591 FACSIMILE +61 8 8303 4377
[email protected] web: http://www.arch.adelaide.edu.au
227
21 January 2004 Department of Environment and Heritage GPO Box 550 Adelaide, SA 5033 Attention Kym Nicolson. Dear Mr. Nicolson,
Re: Coordinates for Land Parcels as part of a PhD Research Project
This letter follows my telephone enquiry about obtaining x and y coordinates for land parcels defined by specified Valuation Numbers. I enclose a CD ROM containing an Access file with 254165 Valuation Numbers in metropolitan Adelaide for which I seek the coordinates (A dBaseIV version is also available should this be preferred). This will enable me to represent certain attributes for the land parcels in ArcView software. I would be grateful if you could provide me with the coordinates as discussed. I am assuming that the coordinates will represent the centroids of the land parcels. The data from the land parcels was obtained from the Land Services Group and they are aware of my request to you for the coordinates (ref. Kathryn Bercic, 8226 3997). The research project will define energy consumption in the Adelaide metropolitan area in a holistic way including embodied energy of buildings. It is intended that the resulting tool will be of benefit to designers and planners in minimising energy consumption and greenhouse gas emissions. I enclose a brief description of the project for your interest. I would be pleased to pick up the CD ROM from you offices to minimise delay. If this is not possible, please post to my home address: 23, Rokewood Avenue, Belair, SA 5052. Thank you for your assistance. I look forward to hearing from you. Yours sincerely Stephen Pullen PhD candidate
SCHOOL OF ARCHITECTURE, LANDSCAPE ARCHITECTURE, AND URBAN DESIGN STEPHEN PULLEN PhD Candidate ARCHITECTURE BUILDING THE UNIVERSITY OF ADELAIDE SA 5005 AUSTRALIA TELEPHONE +61 8 8303 4591 FACSIMILE +61 8 8303 4377
[email protected] web: http://www.arch.adelaide.edu.au
228
Research Project on the Environmental Performance Assessment of the Adelaide Urban Environment
Background The proposed PhD research is based on a pilot study1,2 that was carried out in 2001 in Adelaide in conjunction with Planning SA which showed that it was feasible to collect information on energy consumption in discrete metropolitan areas. The significance of this study is that it opened the way for depicting energy consumption in a spatial format for the purposes of making planning decisions that would contribute to sustainable development. A similar pilot study by the same team of researchers3 is currently being conducted in Sydney and a pilot study in Melbourne is in the planning stages. It is now intended to advance this research by building on the results of the Adelaide pilot study. This PhD research will develop the techniques for depicting energy consumption in the Adelaide metropolitan area in a more comprehensive and useful manner. Aim of PhD research To develop a tool which can spatially depict energy consumption in the built environment in Adelaide in a comprehensive manner. To demonstrate that the tool can be used in the sustainable development and operation of the urban environment with respect to issues such as: • possible changes in thermal performance, design and construction of residential and
commercial buildings • alternative models for the supply of energy in the built environment • the effects of alternative urban forms such as urban consolidation, regional centers and
outer suburban development arising from population changes. • minimizing greenhouse gas emissions arising from the construction and operation of
the urban environment. I believe these aims to be consistent with the objectives set out in SA Planning’s ‘Planning Strategy for Metropolitan Adelaide’ and with the organizational aims of the Office of Sustainability. Methodology Census Collectors Districts (CCDs) will be chosen as the basic unit of urban area as useful travel information is available at this level in terms of travel to work data from the Australian Bureau of Statistics (ABS). The compilation of property files based on CCDs is requested (subsequently called CCD files in this letter) which show a range of data including address, landuse code, lot area, building area, year built, codes for construction materials, etc. for each building lot in the CCD. It is emphasised that no information on ownership of properties is required and that the data will not be divulged to any other party. Bearing in mind the large number of CCD files which would make up the metropolitan area, it is proposed that a portion of CCD files are obtained in the first instance with a view to a full procurement once the research is shown to be fully viable. The sample proposed is all of the CCD files in the local government areas of City of Salisbury, City of Charles Sturt, Adelaide City Council, City of Norwood, Payneham & St.Peters, City of Mitcham and the City of Onkaparinga. This is the information that I seek permission to have access to and to use in the PhD research.
229
It will then be possible to estimate the embodied energy of the urban form for these basic units of urban area. Information on operational area (gas and electricity) will then be sought from suppliers and transport energy from the ABS census. Hence, more comprehensive information on energy consumption can then be derived and represented spatially. The data will be placed in a GIS environment that will form a tool to assist planning decisions. This tool would be made available to Government Departments at the completion of the research. I would be very pleased to discuss the requirements for information in more detail at your convenience. My principal supervisor for the research project is Associate Professor Terry Williamson, Head and Dean of the School of Architecture, Landscape Architecture and Urban Design who can be contacted, if required, on 8303 4591. References
4. Troy, P., Holloway, D., Pullen, S. & Bunker, R. Embodied and Operational Energy Consumption in the City, Urban Policy and Research, 21(1). 2003.
5. Pullen S, Troy P, Holloway D & Bunker R. Estimating Energy Consumption in the Urban Environment with a focus on Embodied Energy. Proceedings of ANZAScA 2002. 36th Annual Conference of the Australia & New Zealand Architectural Science Association. November 1-4, 2002. Deakin University, Geelong, Australia. 2002.
6. Gleeson, B., Randolph, W., Troy, P., Bunker., R., Pullen,S & Mardirossian,A. Water and Energy profiles for Sydney: Towards Sustainability. Australian Research Linkage Grant no.LP0348770. 2003.

Appendix 5. Codes used in the State Property Valuation Register
NOTE: Appendix 5 is included in the print copy of the thesis held in the University of Adelaide Library.
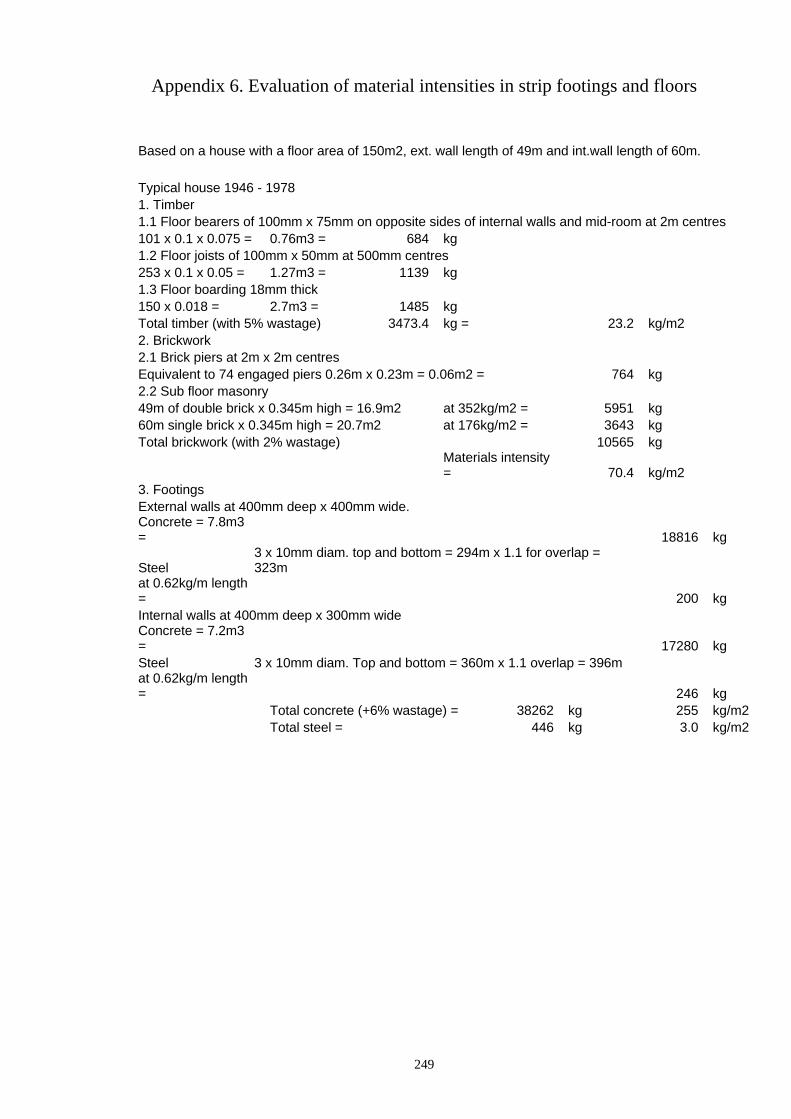
249
Appendix 6. Evaluation of material intensities in strip footings and floors
Based on a house with a floor area of 150m2, ext. wall length of 49m and int.wall length of 60m. Typical house 1946 - 1978 1. Timber 1.1 Floor bearers of 100mm x 75mm on opposite sides of internal walls and mid-room at 2m centres 101 x 0.1 x 0.075 = 0.76m3 = 684 kg 1.2 Floor joists of 100mm x 50mm at 500mm centres 253 x 0.1 x 0.05 = 1.27m3 = 1139 kg 1.3 Floor boarding 18mm thick 150 x 0.018 = 2.7m3 = 1485 kg Total timber (with 5% wastage) 3473.4 kg = 23.2 kg/m2 2. Brickwork 2.1 Brick piers at 2m x 2m centres Equivalent to 74 engaged piers 0.26m x 0.23m = 0.06m2 = 764 kg 2.2 Sub floor masonry 49m of double brick x 0.345m high = 16.9m2 at 352kg/m2 = 5951 kg 60m single brick x 0.345m high = 20.7m2 at 176kg/m2 = 3643 kg Total brickwork (with 2% wastage) 10565 kg
Materials intensity = 70.4 kg/m2
3. Footings External walls at 400mm deep x 400mm wide. Concrete = 7.8m3 = 18816 kg
Steel 3 x 10mm diam. top and bottom = 294m x 1.1 for overlap = 323m
at 0.62kg/m length = 200 kg Internal walls at 400mm deep x 300mm wide Concrete = 7.2m3 = 17280 kg Steel 3 x 10mm diam. Top and bottom = 360m x 1.1 overlap = 396m at 0.62kg/m length = 246 kg Total concrete (+6% wastage) = 38262 kg 255 kg/m2 Total steel = 446 kg 3.0 kg/m2
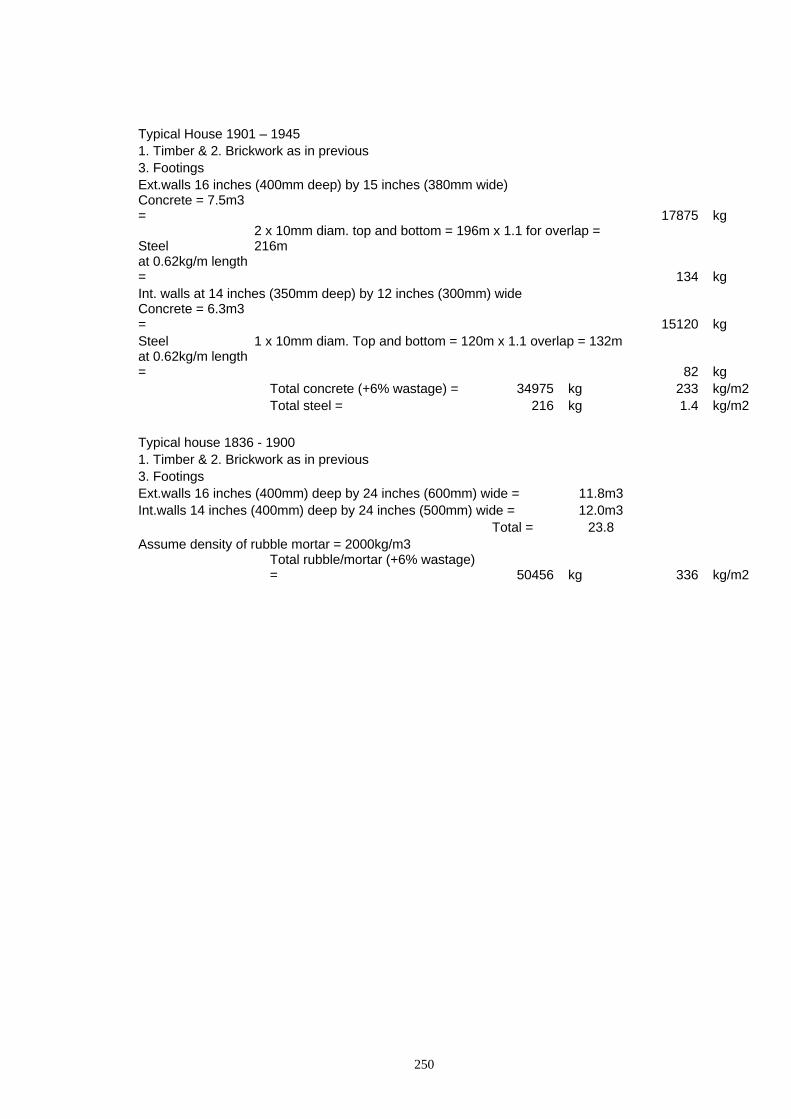
250
Typical House 1901 – 1945 1. Timber & 2. Brickwork as in previous 3. Footings Ext.walls 16 inches (400mm deep) by 15 inches (380mm wide) Concrete = 7.5m3 = 17875 kg
Steel 2 x 10mm diam. top and bottom = 196m x 1.1 for overlap = 216m
at 0.62kg/m length = 134 kg Int. walls at 14 inches (350mm deep) by 12 inches (300mm) wide Concrete = 6.3m3 = 15120 kg Steel 1 x 10mm diam. Top and bottom = 120m x 1.1 overlap = 132m at 0.62kg/m length = 82 kg Total concrete (+6% wastage) = 34975 kg 233 kg/m2 Total steel = 216 kg 1.4 kg/m2 Typical house 1836 - 1900 1. Timber & 2. Brickwork as in previous 3. Footings Ext.walls 16 inches (400mm) deep by 24 inches (600mm) wide = 11.8m3 Int.walls 14 inches (400mm) deep by 24 inches (500mm) wide = 12.0m3 Total = 23.8 Assume density of rubble mortar = 2000kg/m3
Total rubble/mortar (+6% wastage) = 50456 kg 336 kg/m2
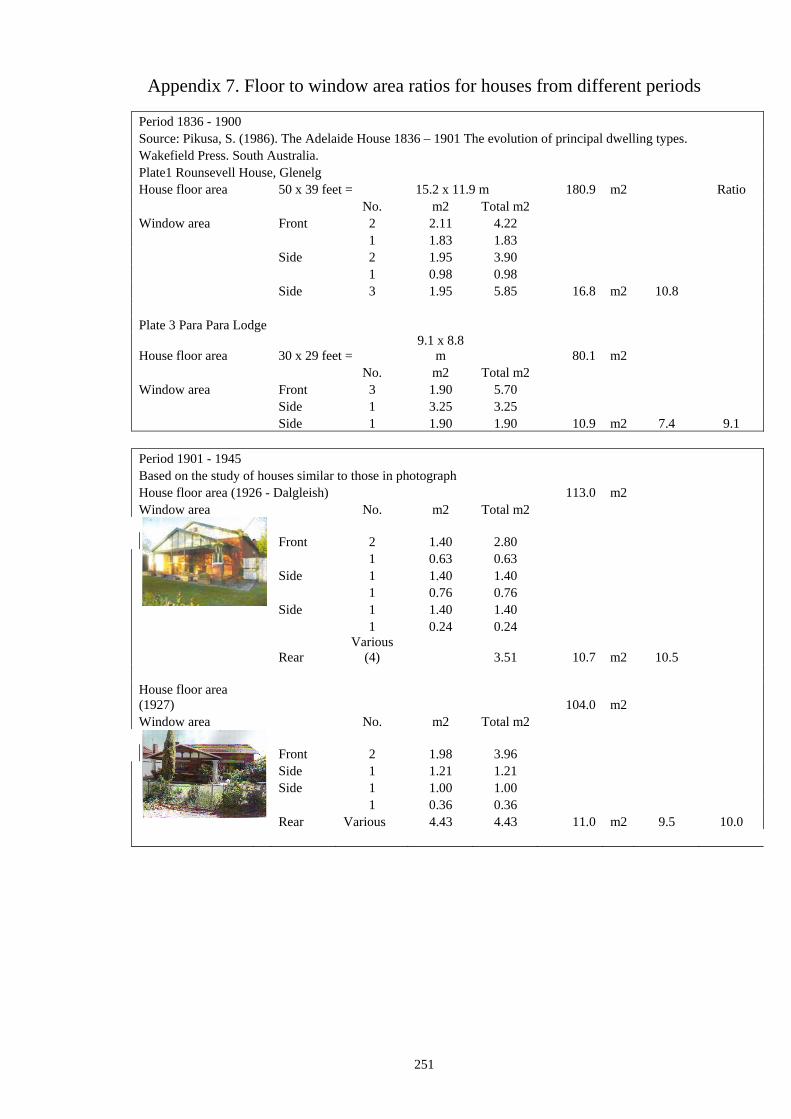
251
Appendix 7. Floor to window area ratios for houses from different periods
Period 1836 - 1900 Source: Pikusa, S. (1986). The Adelaide House 1836 – 1901 The evolution of principal dwelling types. Wakefield Press. South Australia. Plate1 Rounsevell House, Glenelg House floor area 50 x 39 feet = 15.2 x 11.9 m 180.9 m2 Ratio No. m2 Total m2 Window area Front 2 2.11 4.22 1 1.83 1.83 Side 2 1.95 3.90 1 0.98 0.98 Side 3 1.95 5.85 16.8 m2 10.8 Plate 3 Para Para Lodge
House floor area 30 x 29 feet = 9.1 x 8.8
m 80.1 m2 No. m2 Total m2 Window area Front 3 1.90 5.70 Side 1 3.25 3.25 Side 1 1.90 1.90 10.9 m2 7.4 9.1 Period 1901 - 1945 Based on the study of houses similar to those in photograph House floor area (1926 - Dalgleish) 113.0 m2 Window area No. m2 Total m2 Front 2 1.40 2.80 1 0.63 0.63 Side 1 1.40 1.40 1 0.76 0.76 Side 1 1.40 1.40 1 0.24 0.24
Rear Various
(4) 3.51 10.7 m2 10.5 House floor area (1927) 104.0 m2 Window area No. m2 Total m2 Front 2 1.98 3.96 Side 1 1.21 1.21 Side 1 1.00 1.00 1 0.36 0.36 Rear Various 4.43 4.43 11.0 m2 9.5 10.0
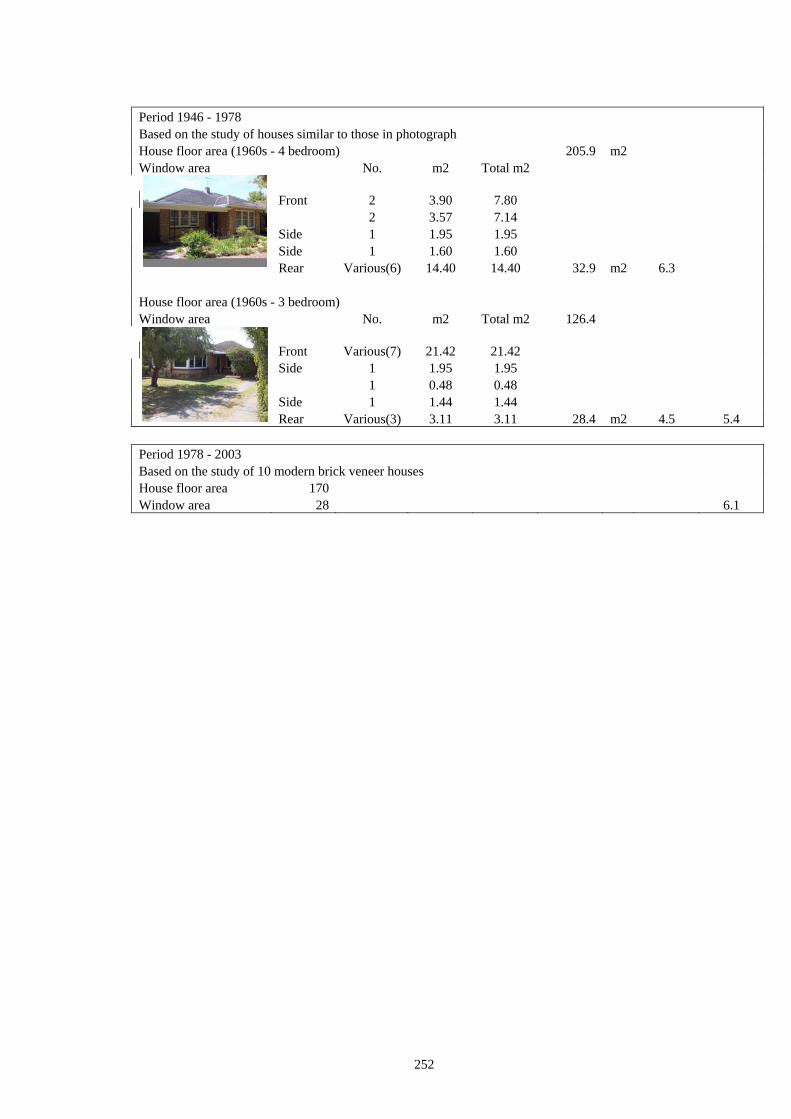
252
Period 1946 - 1978 Based on the study of houses similar to those in photograph House floor area (1960s - 4 bedroom) 205.9 m2 Window area No. m2 Total m2 Front 2 3.90 7.80 2 3.57 7.14 Side 1 1.95 1.95 Side 1 1.60 1.60 Rear Various(6) 14.40 14.40 32.9 m2 6.3 House floor area (1960s - 3 bedroom) Window area No. m2 Total m2 126.4 Front Various(7) 21.42 21.42 Side 1 1.95 1.95 1 0.48 0.48 Side 1 1.44 1.44 Rear Various(3) 3.11 3.11 28.4 m2 4.5 5.4 Period 1978 - 2003 Based on the study of 10 modern brick veneer houses House floor area 170 Window area 28 6.1
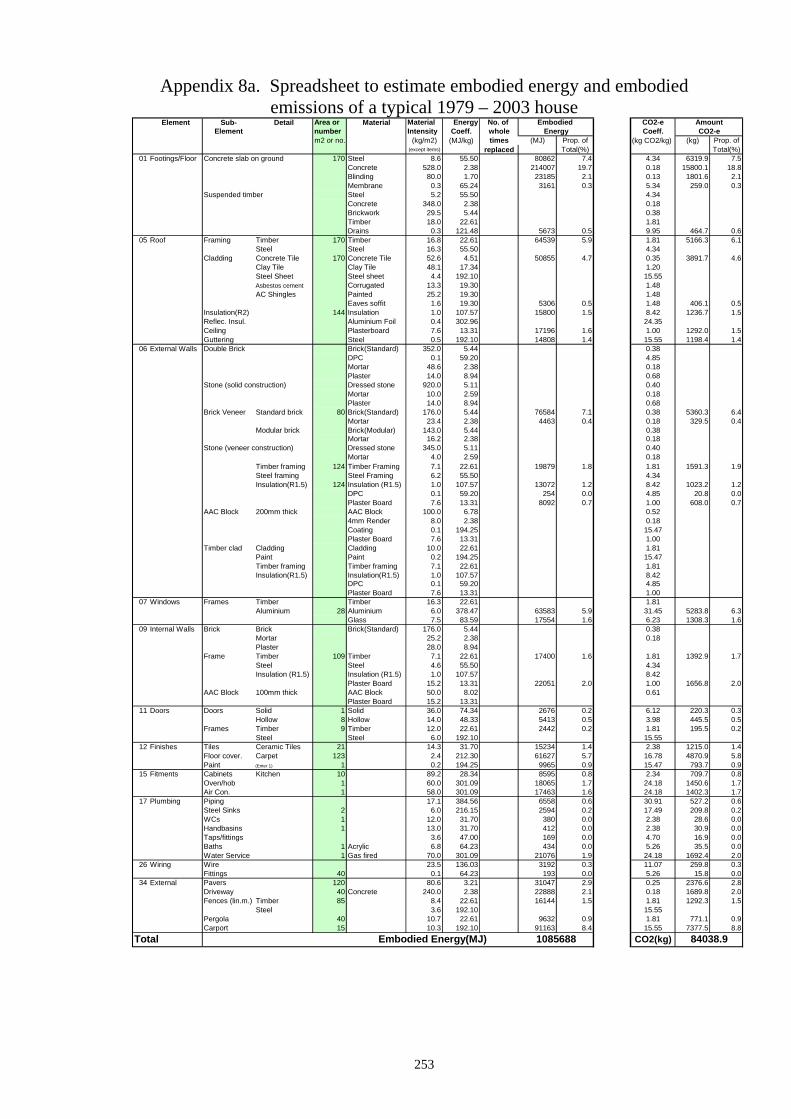
253
Appendix 8a. Spreadsheet to estimate embodied energy and embodied emissions of a typical 1979 – 2003 house
Element Sub- Detail Area or Material Material Energy No. of Embodied CO2-e AmountElement number Intensity Coeff. whole Energy Coeff. CO2-e
m2 or no. (kg/m2) (MJ/kg) times (MJ) Prop. of (kg CO2/kg) (kg) Prop. of(except items) replaced Total(%) Total(%)
01 Footings/Floor Concrete slab on ground 170 Steel 8.6 55.50 80862 7.4 4.34 6319.9 7.5Concrete 528.0 2.38 214007 19.7 0.18 15800.1 18.8Blinding 80.0 1.70 23185 2.1 0.13 1801.6 2.1Membrane 0.3 65.24 3161 0.3 5.34 259.0 0.3
Suspended timber Steel 5.2 55.50 4.34Concrete 348.0 2.38 0.18Brickwork 29.5 5.44 0.38Timber 18.0 22.61 1.81Drains 0.3 121.48 5673 0.5 9.95 464.7 0.6
05 Roof Framing Timber 170 Timber 16.8 22.61 64539 5.9 1.81 5166.3 6.1Steel Steel 16.3 55.50 4.34
Cladding Concrete Tile 170 Concrete Tile 52.6 4.51 50855 4.7 0.35 3891.7 4.6Clay Tile Clay Tile 48.1 17.34 1.20Steel Sheet Steel sheet 4.4 192.10 15.55Asbestos cement Corrugated 13.3 19.30 1.48AC Shingles Painted 25.2 19.30 1.48
Eaves soffit 1.6 19.30 5306 0.5 1.48 406.1 0.5Insulation(R2) 144 Insulation 1.0 107.57 15800 1.5 8.42 1236.7 1.5Reflec. Insul. Aluminium Foil 0.4 302.96 24.35Ceiling Plasterboard 7.6 13.31 17196 1.6 1.00 1292.0 1.5Guttering Steel 0.5 192.10 14808 1.4 15.55 1198.4 1.4
06 External Walls Double Brick Brick(Standard) 352.0 5.44 0.38DPC 0.1 59.20 4.85Mortar 48.6 2.38 0.18Plaster 14.0 8.94 0.68Dressed stone 920.0 5.11 0.40Mortar 10.0 2.59 0.18Plaster 14.0 8.94 0.68
Brick Veneer Standard brick 80 Brick(Standard) 176.0 5.44 76584 7.1 0.38 5360.3 6.4Mortar 23.4 2.38 4463 0.4 0.18 329.5 0.4
Modular brick Brick(Modular) 143.0 5.44 0.38Mortar 16.2 2.38 0.18
Stone (veneer construction) Dressed stone 345.0 5.11 0.40Mortar 4.0 2.59 0.18
Timber framing 124 Timber Framing 7.1 22.61 19879 1.8 1.81 1591.3 1.9Steel framing Steel Framing 6.2 55.50 4.34Insulation(R1.5) 124 Insulation (R1.5) 1.0 107.57 13072 1.2 8.42 1023.2 1.2
DPC 0.1 59.20 254 0.0 4.85 20.8 0.0Plaster Board 7.6 13.31 8092 0.7 1.00 608.0 0.7
AAC Block 200mm thick AAC Block 100.0 6.78 0.524mm Render 8.0 2.38 0.18Coating 0.1 194.25 15.47Plaster Board 7.6 13.31 1.00
Timber clad Cladding Cladding 10.0 22.61 1.81Paint Paint 0.2 194.25 15.47Timber framing Timber framing 7.1 22.61 1.81Insulation(R1.5) Insulation(R1.5) 1.0 107.57 8.42
DPC 0.1 59.20 4.85Plaster Board 7.6 13.31 1.00
07 Windows Frames Timber Timber 16.3 22.61 1.81Aluminium 28 Aluminium 6.0 378.47 63583 5.9 31.45 5283.8 6.3
Glass 7.5 83.59 17554 1.6 6.23 1308.3 1.609 Internal Walls Brick Brick Brick(Standard) 176.0 5.44 0.38
Mortar 25.2 2.38 0.18Plaster 28.0 8.94
Frame Timber 109 Timber 7.1 22.61 17400 1.6 1.81 1392.9 1.7Steel Steel 4.6 55.50 4.34Insulation (R1.5) Insulation (R1.5) 1.0 107.57 8.42
Plaster Board 15.2 13.31 22051 2.0 1.00 1656.8 2.0AAC Block 100mm thick AAC Block 50.0 8.02 0.61
Plaster Board 15.2 13.3111 Doors Doors Solid 1 Solid 36.0 74.34 2676 0.2 6.12 220.3 0.3
Hollow 8 Hollow 14.0 48.33 5413 0.5 3.98 445.5 0.5Frames Timber 9 Timber 12.0 22.61 2442 0.2 1.81 195.5 0.2
Steel Steel 6.0 192.10 15.5512 Finishes Tiles Ceramic Tiles 21 14.3 31.70 15234 1.4 2.38 1215.0 1.4
Floor cover. Carpet 123 2.4 212.30 61627 5.7 16.78 4870.9 5.8Paint (Enter 1) 1 0.2 194.25 9965 0.9 15.47 793.7 0.9
15 Fitments Cabinets Kitchen 10 89.2 28.34 8595 0.8 2.34 709.7 0.8Oven/hob 1 60.0 301.09 18065 1.7 24.18 1450.6 1.7Air Con. 1 58.0 301.09 17463 1.6 24.18 1402.3 1.7
17 Plumbing Piping 17.1 384.56 6558 0.6 30.91 527.2 0.6Steel Sinks 2 6.0 216.15 2594 0.2 17.49 209.8 0.2WCs 1 12.0 31.70 380 0.0 2.38 28.6 0.0Handbasins 1 13.0 31.70 412 0.0 2.38 30.9 0.0Taps/fittings 3.6 47.00 169 0.0 4.70 16.9 0.0Baths 1 Acrylic 6.8 64.23 434 0.0 5.26 35.5 0.0Water Service 1 Gas fired 70.0 301.09 21076 1.9 24.18 1692.4 2.0
26 Wiring Wire 23.5 136.03 3192 0.3 11.07 259.8 0.3Fittings 40 0.1 64.23 193 0.0 5.26 15.8 0.0
34 External Pavers 120 80.6 3.21 31047 2.9 0.25 2376.6 2.8Driveway 40 Concrete 240.0 2.38 22888 2.1 0.18 1689.8 2.0Fences (lin.m.) Timber 85 8.4 22.61 16144 1.5 1.81 1292.3 1.5
Steel 3.6 192.10 15.55Pergola 40 10.7 22.61 9632 0.9 1.81 771.1 0.9Carport 15 10.3 192.10 91163 8.4 15.55 7377.5 8.8
Total Embodied Energy(MJ) 1085688 CO2(kg) 84038.9
Stone (solid construction)
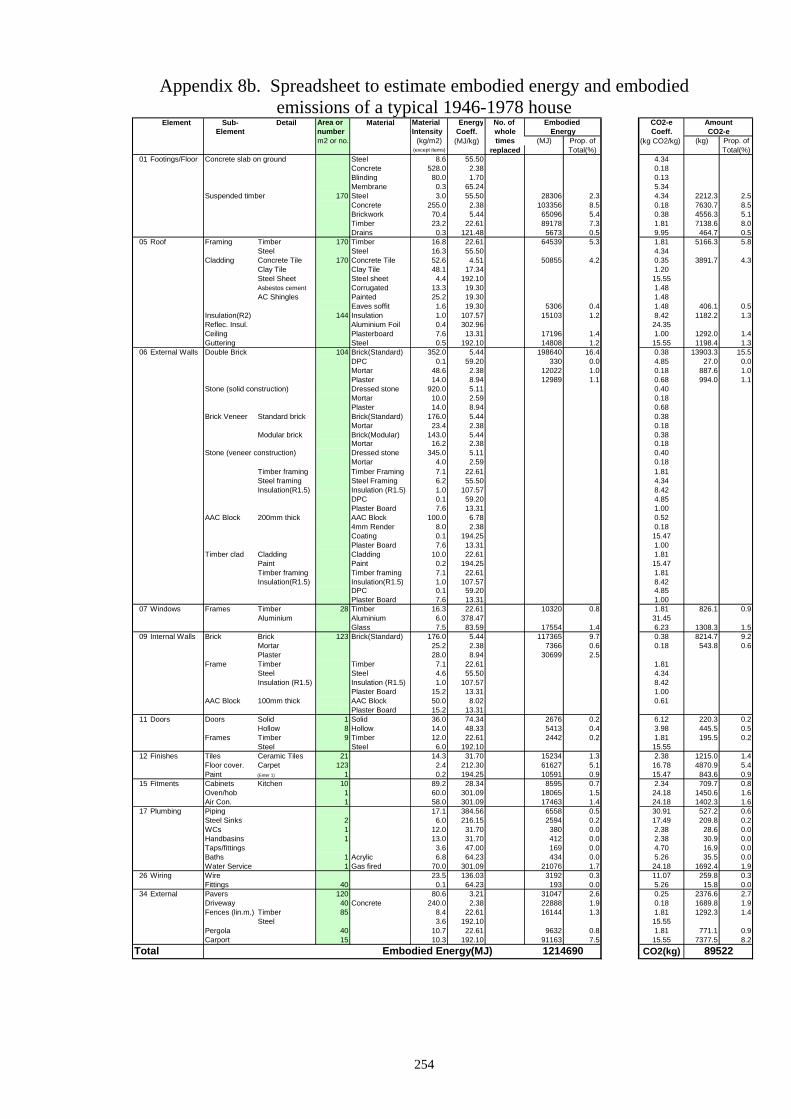
254
Appendix 8b. Spreadsheet to estimate embodied energy and embodied emissions of a typical 1946-1978 house
Element Sub- Detail Area or Material Material Energy No. of Embodied CO2-e AmountElement number Intensity Coeff. whole Energy Coeff. CO2-e
m2 or no. (kg/m2) (MJ/kg) times (MJ) Prop. of (kg CO2/kg) (kg) Prop. of(except items) replaced Total(%) Total(%)
01 Footings/Floor Concrete slab on ground Steel 8.6 55.50 4.34Concrete 528.0 2.38 0.18Blinding 80.0 1.70 0.13Membrane 0.3 65.24 5.34
Suspended timber 170 Steel 3.0 55.50 28306 2.3 4.34 2212.3 2.5Concrete 255.0 2.38 103356 8.5 0.18 7630.7 8.5Brickwork 70.4 5.44 65096 5.4 0.38 4556.3 5.1Timber 23.2 22.61 89178 7.3 1.81 7138.6 8.0Drains 0.3 121.48 5673 0.5 9.95 464.7 0.5
05 Roof Framing Timber 170 Timber 16.8 22.61 64539 5.3 1.81 5166.3 5.8Steel Steel 16.3 55.50 4.34
Cladding Concrete Tile 170 Concrete Tile 52.6 4.51 50855 4.2 0.35 3891.7 4.3Clay Tile Clay Tile 48.1 17.34 1.20Steel Sheet Steel sheet 4.4 192.10 15.55Asbestos cement Corrugated 13.3 19.30 1.48AC Shingles Painted 25.2 19.30 1.48
Eaves soffit 1.6 19.30 5306 0.4 1.48 406.1 0.5Insulation(R2) 144 Insulation 1.0 107.57 15103 1.2 8.42 1182.2 1.3Reflec. Insul. Aluminium Foil 0.4 302.96 24.35Ceiling Plasterboard 7.6 13.31 17196 1.4 1.00 1292.0 1.4Guttering Steel 0.5 192.10 14808 1.2 15.55 1198.4 1.3
06 External Walls Double Brick 104 Brick(Standard) 352.0 5.44 198640 16.4 0.38 13903.3 15.5DPC 0.1 59.20 330 0.0 4.85 27.0 0.0Mortar 48.6 2.38 12022 1.0 0.18 887.6 1.0Plaster 14.0 8.94 12989 1.1 0.68 994.0 1.1Dressed stone 920.0 5.11 0.40Mortar 10.0 2.59 0.18Plaster 14.0 8.94 0.68
Brick Veneer Standard brick Brick(Standard) 176.0 5.44 0.38Mortar 23.4 2.38 0.18
Modular brick Brick(Modular) 143.0 5.44 0.38Mortar 16.2 2.38 0.18
Stone (veneer construction) Dressed stone 345.0 5.11 0.40Mortar 4.0 2.59 0.18
Timber framing Timber Framing 7.1 22.61 1.81Steel framing Steel Framing 6.2 55.50 4.34Insulation(R1.5) Insulation (R1.5) 1.0 107.57 8.42
DPC 0.1 59.20 4.85Plaster Board 7.6 13.31 1.00
AAC Block 200mm thick AAC Block 100.0 6.78 0.524mm Render 8.0 2.38 0.18Coating 0.1 194.25 15.47Plaster Board 7.6 13.31 1.00
Timber clad Cladding Cladding 10.0 22.61 1.81Paint Paint 0.2 194.25 15.47Timber framing Timber framing 7.1 22.61 1.81Insulation(R1.5) Insulation(R1.5) 1.0 107.57 8.42
DPC 0.1 59.20 4.85Plaster Board 7.6 13.31 1.00
07 Windows Frames Timber 28 Timber 16.3 22.61 10320 0.8 1.81 826.1 0.9Aluminium Aluminium 6.0 378.47 31.45
Glass 7.5 83.59 17554 1.4 6.23 1308.3 1.509 Internal Walls Brick Brick 123 Brick(Standard) 176.0 5.44 117365 9.7 0.38 8214.7 9.2
Mortar 25.2 2.38 7366 0.6 0.18 543.8 0.6Plaster 28.0 8.94 30699 2.5
Frame Timber Timber 7.1 22.61 1.81Steel Steel 4.6 55.50 4.34Insulation (R1.5) Insulation (R1.5) 1.0 107.57 8.42
Plaster Board 15.2 13.31 1.00AAC Block 100mm thick AAC Block 50.0 8.02 0.61
Plaster Board 15.2 13.3111 Doors Doors Solid 1 Solid 36.0 74.34 2676 0.2 6.12 220.3 0.2
Hollow 8 Hollow 14.0 48.33 5413 0.4 3.98 445.5 0.5Frames Timber 9 Timber 12.0 22.61 2442 0.2 1.81 195.5 0.2
Steel Steel 6.0 192.10 15.5512 Finishes Tiles Ceramic Tiles 21 14.3 31.70 15234 1.3 2.38 1215.0 1.4
Floor cover. Carpet 123 2.4 212.30 61627 5.1 16.78 4870.9 5.4Paint (Enter 1) 1 0.2 194.25 10591 0.9 15.47 843.6 0.9
15 Fitments Cabinets Kitchen 10 89.2 28.34 8595 0.7 2.34 709.7 0.8Oven/hob 1 60.0 301.09 18065 1.5 24.18 1450.6 1.6Air Con. 1 58.0 301.09 17463 1.4 24.18 1402.3 1.6
17 Plumbing Piping 17.1 384.56 6558 0.5 30.91 527.2 0.6Steel Sinks 2 6.0 216.15 2594 0.2 17.49 209.8 0.2WCs 1 12.0 31.70 380 0.0 2.38 28.6 0.0Handbasins 1 13.0 31.70 412 0.0 2.38 30.9 0.0Taps/fittings 3.6 47.00 169 0.0 4.70 16.9 0.0Baths 1 Acrylic 6.8 64.23 434 0.0 5.26 35.5 0.0Water Service 1 Gas fired 70.0 301.09 21076 1.7 24.18 1692.4 1.9
26 Wiring Wire 23.5 136.03 3192 0.3 11.07 259.8 0.3Fittings 40 0.1 64.23 193 0.0 5.26 15.8 0.0
34 External Pavers 120 80.6 3.21 31047 2.6 0.25 2376.6 2.7Driveway 40 Concrete 240.0 2.38 22888 1.9 0.18 1689.8 1.9Fences (lin.m.) Timber 85 8.4 22.61 16144 1.3 1.81 1292.3 1.4
Steel 3.6 192.10 15.55Pergola 40 10.7 22.61 9632 0.8 1.81 771.1 0.9Carport 15 10.3 192.10 91163 7.5 15.55 7377.5 8.2
Total Embodied Energy(MJ) 1214690 CO2(kg) 89522
Stone (solid construction)
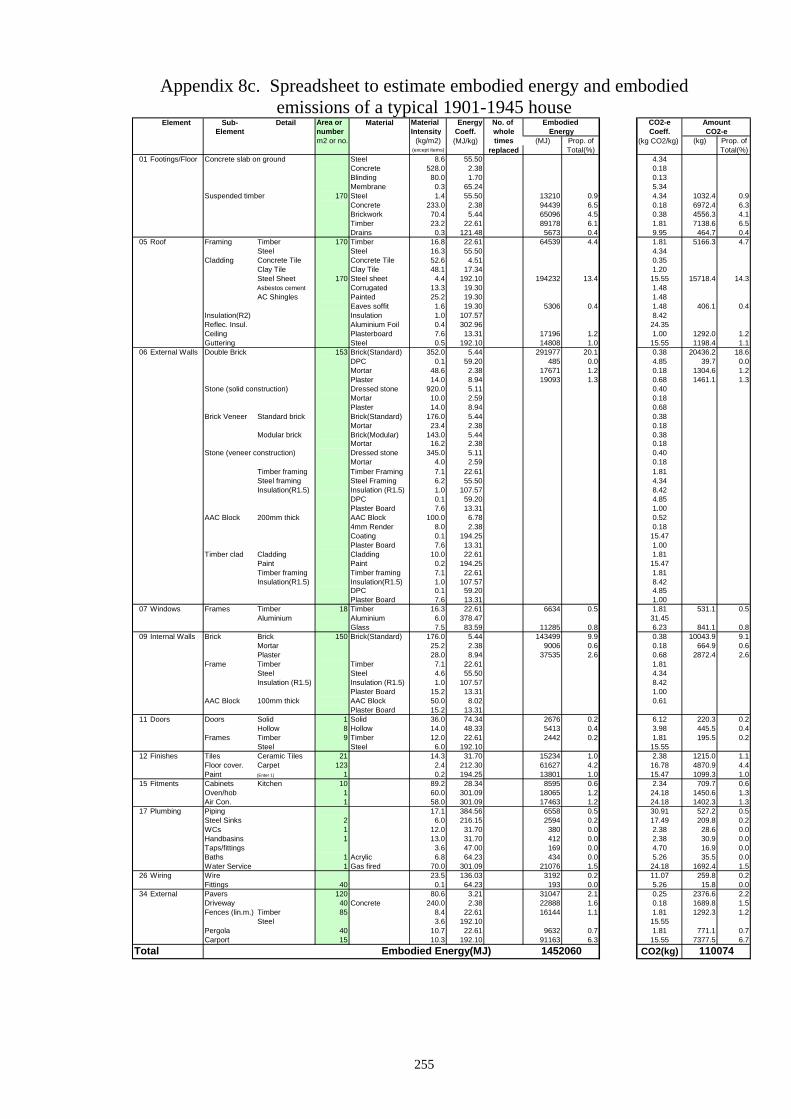
255
Appendix 8c. Spreadsheet to estimate embodied energy and embodied emissions of a typical 1901-1945 house
Element Sub- Detail Area or Material Material Energy No. of Embodied CO2-e AmountElement number Intensity Coeff. whole Energy Coeff. CO2-e
m2 or no. (kg/m2) (MJ/kg) times (MJ) Prop. of (kg CO2/kg) (kg) Prop. of(except items) replaced Total(%) Total(%)
01 Footings/Floor Concrete slab on ground Steel 8.6 55.50 4.34Concrete 528.0 2.38 0.18Blinding 80.0 1.70 0.13Membrane 0.3 65.24 5.34
Suspended timber 170 Steel 1.4 55.50 13210 0.9 4.34 1032.4 0.9Concrete 233.0 2.38 94439 6.5 0.18 6972.4 6.3Brickwork 70.4 5.44 65096 4.5 0.38 4556.3 4.1Timber 23.2 22.61 89178 6.1 1.81 7138.6 6.5Drains 0.3 121.48 5673 0.4 9.95 464.7 0.4
05 Roof Framing Timber 170 Timber 16.8 22.61 64539 4.4 1.81 5166.3 4.7Steel Steel 16.3 55.50 4.34
Cladding Concrete Tile Concrete Tile 52.6 4.51 0.35Clay Tile Clay Tile 48.1 17.34 1.20Steel Sheet 170 Steel sheet 4.4 192.10 194232 13.4 15.55 15718.4 14.3Asbestos cement Corrugated 13.3 19.30 1.48AC Shingles Painted 25.2 19.30 1.48
Eaves soffit 1.6 19.30 5306 0.4 1.48 406.1 0.4Insulation(R2) Insulation 1.0 107.57 8.42Reflec. Insul. Aluminium Foil 0.4 302.96 24.35Ceiling Plasterboard 7.6 13.31 17196 1.2 1.00 1292.0 1.2Guttering Steel 0.5 192.10 14808 1.0 15.55 1198.4 1.1
06 External Walls Double Brick 153 Brick(Standard) 352.0 5.44 291977 20.1 0.38 20436.2 18.6DPC 0.1 59.20 485 0.0 4.85 39.7 0.0Mortar 48.6 2.38 17671 1.2 0.18 1304.6 1.2Plaster 14.0 8.94 19093 1.3 0.68 1461.1 1.3Dressed stone 920.0 5.11 0.40Mortar 10.0 2.59 0.18Plaster 14.0 8.94 0.68
Brick Veneer Standard brick Brick(Standard) 176.0 5.44 0.38Mortar 23.4 2.38 0.18
Modular brick Brick(Modular) 143.0 5.44 0.38Mortar 16.2 2.38 0.18
Stone (veneer construction) Dressed stone 345.0 5.11 0.40Mortar 4.0 2.59 0.18
Timber framing Timber Framing 7.1 22.61 1.81Steel framing Steel Framing 6.2 55.50 4.34Insulation(R1.5) Insulation (R1.5) 1.0 107.57 8.42
DPC 0.1 59.20 4.85Plaster Board 7.6 13.31 1.00
AAC Block 200mm thick AAC Block 100.0 6.78 0.524mm Render 8.0 2.38 0.18Coating 0.1 194.25 15.47Plaster Board 7.6 13.31 1.00
Timber clad Cladding Cladding 10.0 22.61 1.81Paint Paint 0.2 194.25 15.47Timber framing Timber framing 7.1 22.61 1.81Insulation(R1.5) Insulation(R1.5) 1.0 107.57 8.42
DPC 0.1 59.20 4.85Plaster Board 7.6 13.31 1.00
07 Windows Frames Timber 18 Timber 16.3 22.61 6634 0.5 1.81 531.1 0.5Aluminium Aluminium 6.0 378.47 31.45
Glass 7.5 83.59 11285 0.8 6.23 841.1 0.809 Internal Walls Brick Brick 150 Brick(Standard) 176.0 5.44 143499 9.9 0.38 10043.9 9.1
Mortar 25.2 2.38 9006 0.6 0.18 664.9 0.6Plaster 28.0 8.94 37535 2.6 0.68 2872.4 2.6
Frame Timber Timber 7.1 22.61 1.81Steel Steel 4.6 55.50 4.34Insulation (R1.5) Insulation (R1.5) 1.0 107.57 8.42
Plaster Board 15.2 13.31 1.00AAC Block 100mm thick AAC Block 50.0 8.02 0.61
Plaster Board 15.2 13.3111 Doors Doors Solid 1 Solid 36.0 74.34 2676 0.2 6.12 220.3 0.2
Hollow 8 Hollow 14.0 48.33 5413 0.4 3.98 445.5 0.4Frames Timber 9 Timber 12.0 22.61 2442 0.2 1.81 195.5 0.2
Steel Steel 6.0 192.10 15.5512 Finishes Tiles Ceramic Tiles 21 14.3 31.70 15234 1.0 2.38 1215.0 1.1
Floor cover. Carpet 123 2.4 212.30 61627 4.2 16.78 4870.9 4.4Paint (Enter 1) 1 0.2 194.25 13801 1.0 15.47 1099.3 1.0
15 Fitments Cabinets Kitchen 10 89.2 28.34 8595 0.6 2.34 709.7 0.6Oven/hob 1 60.0 301.09 18065 1.2 24.18 1450.6 1.3Air Con. 1 58.0 301.09 17463 1.2 24.18 1402.3 1.3
17 Plumbing Piping 17.1 384.56 6558 0.5 30.91 527.2 0.5Steel Sinks 2 6.0 216.15 2594 0.2 17.49 209.8 0.2WCs 1 12.0 31.70 380 0.0 2.38 28.6 0.0Handbasins 1 13.0 31.70 412 0.0 2.38 30.9 0.0Taps/fittings 3.6 47.00 169 0.0 4.70 16.9 0.0Baths 1 Acrylic 6.8 64.23 434 0.0 5.26 35.5 0.0Water Service 1 Gas fired 70.0 301.09 21076 1.5 24.18 1692.4 1.5
26 Wiring Wire 23.5 136.03 3192 0.2 11.07 259.8 0.2Fittings 40 0.1 64.23 193 0.0 5.26 15.8 0.0
34 External Pavers 120 80.6 3.21 31047 2.1 0.25 2376.6 2.2Driveway 40 Concrete 240.0 2.38 22888 1.6 0.18 1689.8 1.5Fences (lin.m.) Timber 85 8.4 22.61 16144 1.1 1.81 1292.3 1.2
Steel 3.6 192.10 15.55Pergola 40 10.7 22.61 9632 0.7 1.81 771.1 0.7Carport 15 10.3 192.10 91163 6.3 15.55 7377.5 6.7
Total Embodied Energy(MJ) 1452060 CO2(kg) 110074
Stone (solid construction)
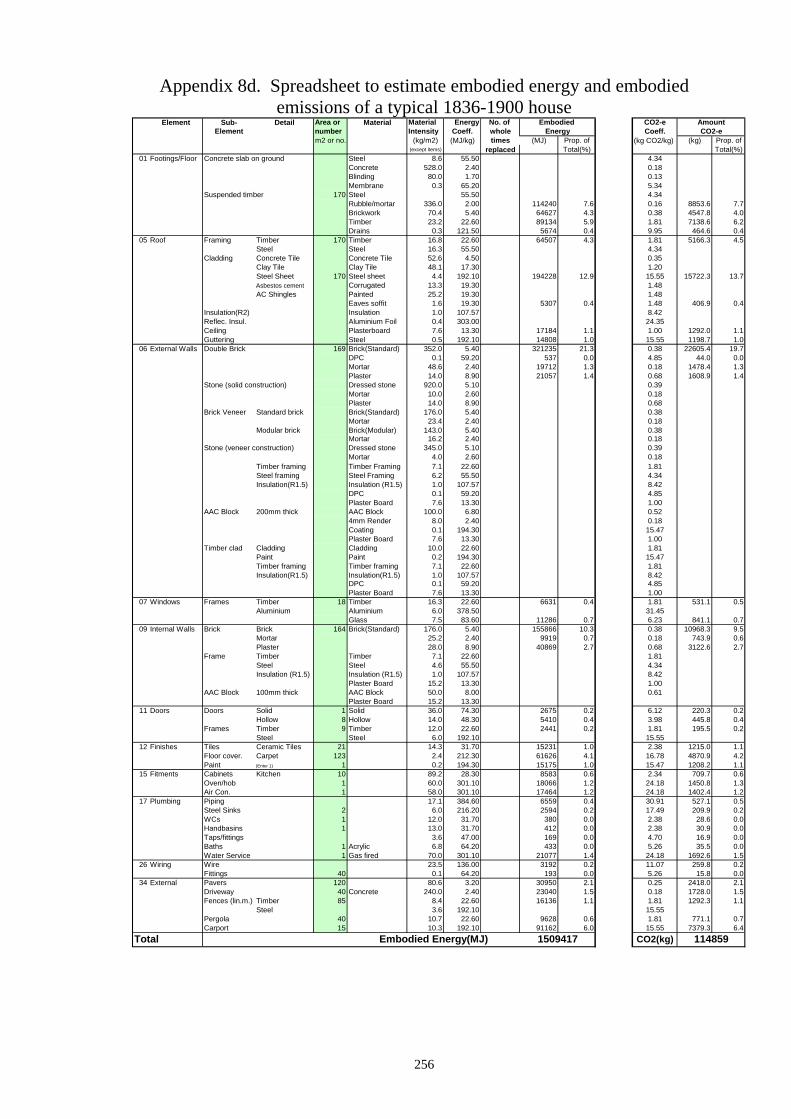
256
Appendix 8d. Spreadsheet to estimate embodied energy and embodied emissions of a typical 1836-1900 house
Element Sub- Detail Area or Material Material Energy No. of Embodied CO2-e AmountElement number Intensity Coeff. whole Energy Coeff. CO2-e
m2 or no. (kg/m2) (MJ/kg) times (MJ) Prop. of (kg CO2/kg) (kg) Prop. of(except items) replaced Total(%) Total(%)
01 Footings/Floor Concrete slab on ground Steel 8.6 55.50 4.34Concrete 528.0 2.40 0.18Blinding 80.0 1.70 0.13Membrane 0.3 65.20 5.34
Suspended timber 170 Steel 55.50 4.34Rubble/mortar 336.0 2.00 114240 7.6 0.16 8853.6 7.7Brickwork 70.4 5.40 64627 4.3 0.38 4547.8 4.0Timber 23.2 22.60 89134 5.9 1.81 7138.6 6.2Drains 0.3 121.50 5674 0.4 9.95 464.6 0.4
05 Roof Framing Timber 170 Timber 16.8 22.60 64507 4.3 1.81 5166.3 4.5Steel Steel 16.3 55.50 4.34
Cladding Concrete Tile Concrete Tile 52.6 4.50 0.35Clay Tile Clay Tile 48.1 17.30 1.20Steel Sheet 170 Steel sheet 4.4 192.10 194228 12.9 15.55 15722.3 13.7Asbestos cement Corrugated 13.3 19.30 1.48AC Shingles Painted 25.2 19.30 1.48
Eaves soffit 1.6 19.30 5307 0.4 1.48 406.9 0.4Insulation(R2) Insulation 1.0 107.57 8.42Reflec. Insul. Aluminium Foil 0.4 303.00 24.35Ceiling Plasterboard 7.6 13.30 17184 1.1 1.00 1292.0 1.1Guttering Steel 0.5 192.10 14808 1.0 15.55 1198.7 1.0
06 External Walls Double Brick 169 Brick(Standard) 352.0 5.40 321235 21.3 0.38 22605.4 19.7DPC 0.1 59.20 537 0.0 4.85 44.0 0.0Mortar 48.6 2.40 19712 1.3 0.18 1478.4 1.3Plaster 14.0 8.90 21057 1.4 0.68 1608.9 1.4Dressed stone 920.0 5.10 0.39Mortar 10.0 2.60 0.18Plaster 14.0 8.90 0.68
Brick Veneer Standard brick Brick(Standard) 176.0 5.40 0.38Mortar 23.4 2.40 0.18
Modular brick Brick(Modular) 143.0 5.40 0.38Mortar 16.2 2.40 0.18
Stone (veneer construction) Dressed stone 345.0 5.10 0.39Mortar 4.0 2.60 0.18
Timber framing Timber Framing 7.1 22.60 1.81Steel framing Steel Framing 6.2 55.50 4.34Insulation(R1.5) Insulation (R1.5) 1.0 107.57 8.42
DPC 0.1 59.20 4.85Plaster Board 7.6 13.30 1.00
AAC Block 200mm thick AAC Block 100.0 6.80 0.524mm Render 8.0 2.40 0.18Coating 0.1 194.30 15.47Plaster Board 7.6 13.30 1.00
Timber clad Cladding Cladding 10.0 22.60 1.81Paint Paint 0.2 194.30 15.47Timber framing Timber framing 7.1 22.60 1.81Insulation(R1.5) Insulation(R1.5) 1.0 107.57 8.42
DPC 0.1 59.20 4.85Plaster Board 7.6 13.30 1.00
07 Windows Frames Timber 18 Timber 16.3 22.60 6631 0.4 1.81 531.1 0.5Aluminium Aluminium 6.0 378.50 31.45
Glass 7.5 83.60 11286 0.7 6.23 841.1 0.709 Internal Walls Brick Brick 164 Brick(Standard) 176.0 5.40 155866 10.3 0.38 10968.3 9.5
Mortar 25.2 2.40 9919 0.7 0.18 743.9 0.6Plaster 28.0 8.90 40869 2.7 0.68 3122.6 2.7
Frame Timber Timber 7.1 22.60 1.81Steel Steel 4.6 55.50 4.34Insulation (R1.5) Insulation (R1.5) 1.0 107.57 8.42
Plaster Board 15.2 13.30 1.00AAC Block 100mm thick AAC Block 50.0 8.00 0.61
Plaster Board 15.2 13.3011 Doors Doors Solid 1 Solid 36.0 74.30 2675 0.2 6.12 220.3 0.2
Hollow 8 Hollow 14.0 48.30 5410 0.4 3.98 445.8 0.4Frames Timber 9 Timber 12.0 22.60 2441 0.2 1.81 195.5 0.2
Steel Steel 6.0 192.10 15.5512 Finishes Tiles Ceramic Tiles 21 14.3 31.70 15231 1.0 2.38 1215.0 1.1
Floor cover. Carpet 123 2.4 212.30 61626 4.1 16.78 4870.9 4.2Paint (Enter 1) 1 0.2 194.30 15175 1.0 15.47 1208.2 1.1
15 Fitments Cabinets Kitchen 10 89.2 28.30 8583 0.6 2.34 709.7 0.6Oven/hob 1 60.0 301.10 18066 1.2 24.18 1450.8 1.3Air Con. 1 58.0 301.10 17464 1.2 24.18 1402.4 1.2
17 Plumbing Piping 17.1 384.60 6559 0.4 30.91 527.1 0.5Steel Sinks 2 6.0 216.20 2594 0.2 17.49 209.9 0.2WCs 1 12.0 31.70 380 0.0 2.38 28.6 0.0Handbasins 1 13.0 31.70 412 0.0 2.38 30.9 0.0Taps/fittings 3.6 47.00 169 0.0 4.70 16.9 0.0Baths 1 Acrylic 6.8 64.20 433 0.0 5.26 35.5 0.0Water Service 1 Gas fired 70.0 301.10 21077 1.4 24.18 1692.6 1.5
26 Wiring Wire 23.5 136.00 3192 0.2 11.07 259.8 0.2Fittings 40 0.1 64.20 193 0.0 5.26 15.8 0.0
34 External Pavers 120 80.6 3.20 30950 2.1 0.25 2418.0 2.1Driveway 40 Concrete 240.0 2.40 23040 1.5 0.18 1728.0 1.5Fences (lin.m.) Timber 85 8.4 22.60 16136 1.1 1.81 1292.3 1.1
Steel 3.6 192.10 15.55Pergola 40 10.7 22.60 9628 0.6 1.81 771.1 0.7Carport 15 10.3 192.10 91162 6.0 15.55 7379.3 6.4
Total Embodied Energy(MJ) 1509417 CO2(kg) 114859
Stone (solid construction)
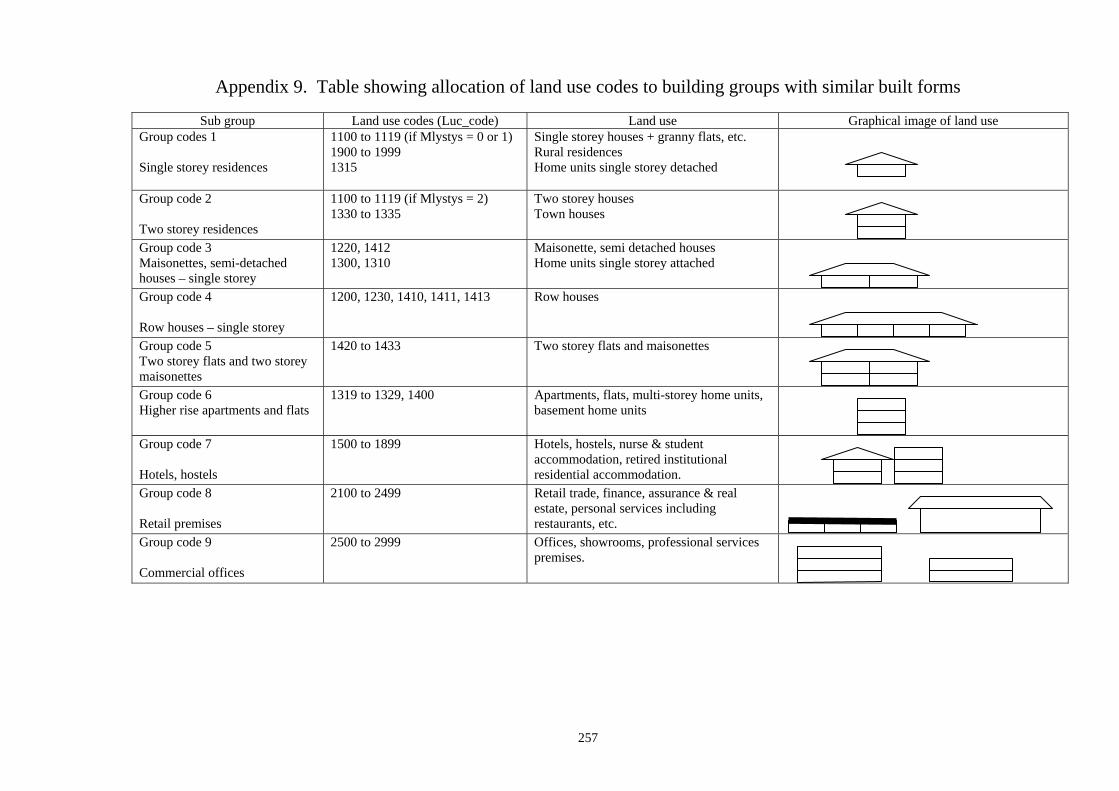
257
Appendix 9. Table showing allocation of land use codes to building groups with similar built forms
Sub group Land use codes (Luc_code) Land use Graphical image of land use Group codes 1 Single storey residences
1100 to 1119 (if Mlystys = 0 or 1) 1900 to 1999 1315
Single storey houses + granny flats, etc. Rural residences Home units single storey detached
Group code 2 Two storey residences
1100 to 1119 (if Mlystys = 2) 1330 to 1335
Two storey houses Town houses
Group code 3 Maisonettes, semi-detached houses – single storey
1220, 1412 1300, 1310
Maisonette, semi detached houses Home units single storey attached
Group code 4 Row houses – single storey
1200, 1230, 1410, 1411, 1413 Row houses
Group code 5 Two storey flats and two storey maisonettes
1420 to 1433 Two storey flats and maisonettes
Group code 6 Higher rise apartments and flats
1319 to 1329, 1400 Apartments, flats, multi-storey home units, basement home units
Group code 7 Hotels, hostels
1500 to 1899 Hotels, hostels, nurse & student accommodation, retired institutional residential accommodation.
Group code 8 Retail premises
2100 to 2499 Retail trade, finance, assurance & real estate, personal services including restaurants, etc.
Group code 9 Commercial offices
2500 to 2999 Offices, showrooms, professional services premises.
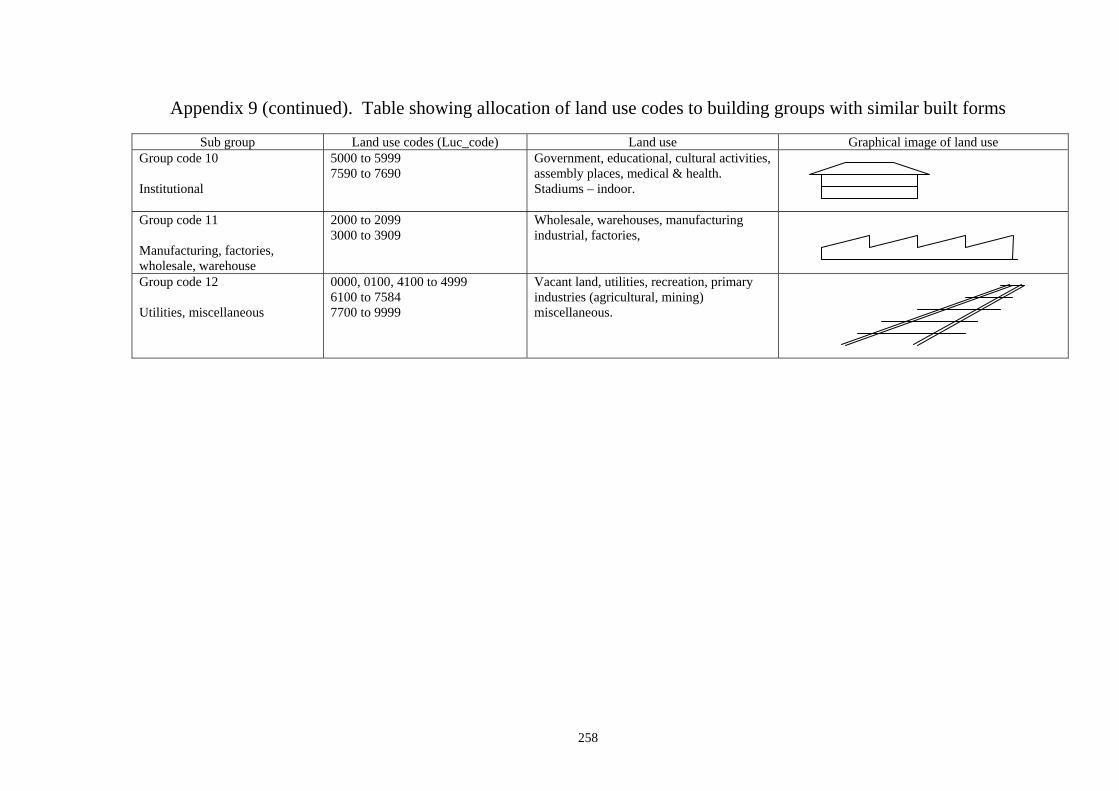
258
Appendix 9 (continued). Table showing allocation of land use codes to building groups with similar built forms
Sub group Land use codes (Luc_code) Land use Graphical image of land use
Group code 10 Institutional
5000 to 5999 7590 to 7690
Government, educational, cultural activities, assembly places, medical & health. Stadiums – indoor.
Group code 11 Manufacturing, factories, wholesale, warehouse
2000 to 2099 3000 to 3909
Wholesale, warehouses, manufacturing industrial, factories,
Group code 12 Utilities, miscellaneous
0000, 0100, 4100 to 4999 6100 to 7584 7700 to 9999
Vacant land, utilities, recreation, primary industries (agricultural, mining) miscellaneous.
259
Appendix 10. Inventory of spatial and data files and method for deriving ArcView Adelaide Metro Lots
Part 1. Inventory of critical files in 2006 Data
Folder File name Purpose 2006 Property sub files
code1_ee.dbf, code1a_ee, code1a, code1b, code1c, code2, code3 to code12.
Mainly excel files for 12 Luc groups subdivided from Land Services Group Property Register data with Lookup tables for Group 1 to determine embodied energy assembled in code1_ee.dbf file (254165 records) for use in Arcview metro lots. 21 files in total.
Arcview metro lots
Adelaide metro lots.shp, adelaide_metro_data1_with id.dbf, SA-CCD.shp, etc. files
All shape and data files necessary for spatially depicting the theme of embodied energy in ArcView environment known as ArcView Adelaide Metro Lots (see Part 2 method below). 19 files in total covering six LGA areas.
Val_2001 Val_2001.dbf, Val_2001_metro_asd.dbf, Val_2001_metro_lgas.dbf, asd_group1_1836_1900.dbf, and other historical periods, asd_group1.dbf and other Luc groups
Derivation of statistics for analysing proportions of different groups, age distribution and floor areas in Adelaide Statistical Division. 764751 records in Val_2001.dbf and 496341 records in Val_2001_metro_asd.dbf file. 18 files in total.
PhD Proportion of titles in different building type groups
Excel file analyses proportions of different groups, age distribution and floor areas in Adelaide Statistical Division
Part 2. method for deriving ArcView Adelaide Metro Lots
1. Create folder on C drive for all files relevant to ArcView Adelaide metro lots. 2. Call folder ‘ArcView metro lots’. 3. Move DEH ‘aduni_val’ files into this folder and rename ‘Adelaide metro lots’. This provides the shape
files and XY coordinates for the six LGA areas. 4. Move ‘adelaide_metro_data1_with id.dbf’ into this folder. (This file is in ‘Land Serv Group data 1’
which is in the ‘Adelaide_metro_data’ folder). This provides the property register data for the six LGA areas.
5. Move ‘code1_ee.dbf’ file into this folder. This is in the ‘2006 Property sub files’ folder which is in the ‘2006 Data’ folder. This provides the embodied energy data for the Group 1 dwellings ie single storey houses.
6. In ArcView, Add Theme of ‘Adelaide metro lots’. 7. Add table ‘adelaide_metro_data1_with id.dbf’ and merge with ‘Adelaide metro lots’ to provide
comprehensive data base for six LGA areas. 8. Add table ‘code1_ee.dbf’ and merge with ‘Adelaide metro lots’ to provide embodied energy data for
Group1 single storey houses in six LGA areas. 9. Repeat a further version of ‘Adelaide metro lots’ using Add Theme. 10. Depict embodied energy of Group1 single storey houses in six LGA areas by clicking on this theme and
selecting ‘Graduated colour’ 11. Save as project called ‘Adelaide metro lots’. 12. Customize theme by changing embodied energy ranges, hiding unwanted fields in data outline for lot
boundaries only. 13. Add census collectors districts boundaries by moving the CCD shape files to the ‘ArcView metro lots’
folder and adding theme and providing a thick coloured line for CCD boundaries only
Appendix 11. Conference Paper Describing Estimation of Potential Errors in the SEED Spreadsheet Proceedings of the Embodied Energy Seminar: The Current State of Play. Deakin University, Woolstores Campus, Geelong, Australia Thursday 28th - Friday 29th November, 1996. Data Quality of Embodied Energy Methods S.F. Pullen
NOTE: Appendix 11 is included in the print copy of the thesis held in the University of Adelaide Library.
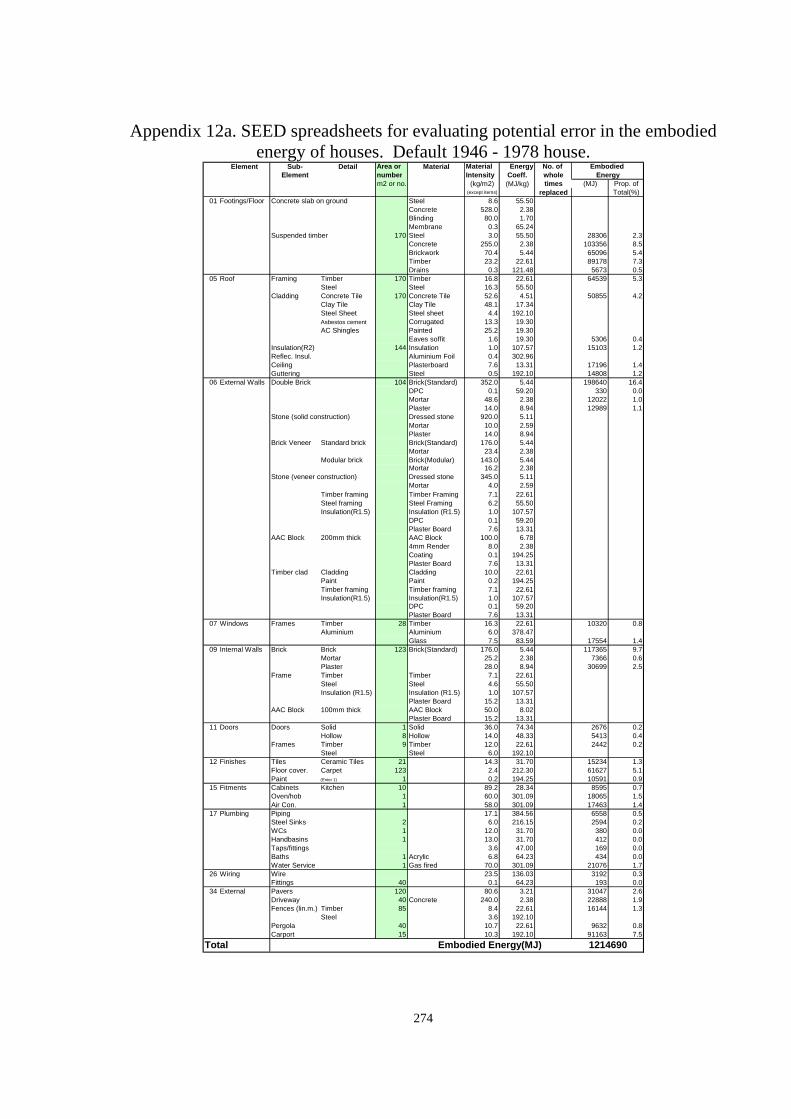
274
Appendix 12a. SEED spreadsheets for evaluating potential error in the embodied energy of houses. Default 1946 - 1978 house.
Element Sub- Detail Area or Material Material Energy No. of Embodied Element number Intensity Coeff. whole Energy
m2 or no. (kg/m2) (MJ/kg) times (MJ) Prop. of(except items) replaced Total(%)
01 Footings/Floor Concrete slab on ground Steel 8.6 55.50Concrete 528.0 2.38Blinding 80.0 1.70Membrane 0.3 65.24
Suspended timber 170 Steel 3.0 55.50 28306 2.3Concrete 255.0 2.38 103356 8.5Brickwork 70.4 5.44 65096 5.4Timber 23.2 22.61 89178 7.3Drains 0.3 121.48 5673 0.5
05 Roof Framing Timber 170 Timber 16.8 22.61 64539 5.3Steel Steel 16.3 55.50
Cladding Concrete Tile 170 Concrete Tile 52.6 4.51 50855 4.2Clay Tile Clay Tile 48.1 17.34Steel Sheet Steel sheet 4.4 192.10Asbestos cement Corrugated 13.3 19.30AC Shingles Painted 25.2 19.30
Eaves soffit 1.6 19.30 5306 0.4Insulation(R2) 144 Insulation 1.0 107.57 15103 1.2Reflec. Insul. Aluminium Foil 0.4 302.96Ceiling Plasterboard 7.6 13.31 17196 1.4Guttering Steel 0.5 192.10 14808 1.2
06 External Walls Double Brick 104 Brick(Standard) 352.0 5.44 198640 16.4DPC 0.1 59.20 330 0.0Mortar 48.6 2.38 12022 1.0Plaster 14.0 8.94 12989 1.1Dressed stone 920.0 5.11Mortar 10.0 2.59Plaster 14.0 8.94
Brick Veneer Standard brick Brick(Standard) 176.0 5.44Mortar 23.4 2.38
Modular brick Brick(Modular) 143.0 5.44Mortar 16.2 2.38
Stone (veneer construction) Dressed stone 345.0 5.11Mortar 4.0 2.59
Timber framing Timber Framing 7.1 22.61Steel framing Steel Framing 6.2 55.50Insulation(R1.5) Insulation (R1.5) 1.0 107.57
DPC 0.1 59.20Plaster Board 7.6 13.31
AAC Block 200mm thick AAC Block 100.0 6.784mm Render 8.0 2.38Coating 0.1 194.25Plaster Board 7.6 13.31
Timber clad Cladding Cladding 10.0 22.61Paint Paint 0.2 194.25Timber framing Timber framing 7.1 22.61Insulation(R1.5) Insulation(R1.5) 1.0 107.57
DPC 0.1 59.20Plaster Board 7.6 13.31
07 Windows Frames Timber 28 Timber 16.3 22.61 10320 0.8Aluminium Aluminium 6.0 378.47
Glass 7.5 83.59 17554 1.409 Internal Walls Brick Brick 123 Brick(Standard) 176.0 5.44 117365 9.7
Mortar 25.2 2.38 7366 0.6Plaster 28.0 8.94 30699 2.5
Frame Timber Timber 7.1 22.61Steel Steel 4.6 55.50Insulation (R1.5) Insulation (R1.5) 1.0 107.57
Plaster Board 15.2 13.31AAC Block 100mm thick AAC Block 50.0 8.02
Plaster Board 15.2 13.3111 Doors Doors Solid 1 Solid 36.0 74.34 2676 0.2
Hollow 8 Hollow 14.0 48.33 5413 0.4Frames Timber 9 Timber 12.0 22.61 2442 0.2
Steel Steel 6.0 192.1012 Finishes Tiles Ceramic Tiles 21 14.3 31.70 15234 1.3
Floor cover. Carpet 123 2.4 212.30 61627 5.1Paint (Enter 1) 1 0.2 194.25 10591 0.9
15 Fitments Cabinets Kitchen 10 89.2 28.34 8595 0.7Oven/hob 1 60.0 301.09 18065 1.5Air Con. 1 58.0 301.09 17463 1.4
17 Plumbing Piping 17.1 384.56 6558 0.5Steel Sinks 2 6.0 216.15 2594 0.2WCs 1 12.0 31.70 380 0.0Handbasins 1 13.0 31.70 412 0.0Taps/fittings 3.6 47.00 169 0.0Baths 1 Acrylic 6.8 64.23 434 0.0Water Service 1 Gas fired 70.0 301.09 21076 1.7
26 Wiring Wire 23.5 136.03 3192 0.3Fittings 40 0.1 64.23 193 0.0
34 External Pavers 120 80.6 3.21 31047 2.6Driveway 40 Concrete 240.0 2.38 22888 1.9Fences (lin.m.) Timber 85 8.4 22.61 16144 1.3
Steel 3.6 192.10Pergola 40 10.7 22.61 9632 0.8Carport 15 10.3 192.10 91163 7.5
Total Embodied Energy(MJ) 1214690
Stone (solid construction)

275
Appendix 12b. SEED spreadsheets for evaluating potential error in the embodied energy of houses. Higher energy 1946 – 1978 house. Element Sub- Detail Area or Material Material Energy No. of Embodied
Element number Intensity Coeff. whole Energym2 or no. (kg/m2) (MJ/kg) times (MJ) Prop. of
(except items) replaced Total(%)01 Footings/Floor Concrete slab on ground Steel 8.6 55.50
Concrete 528.0 2.38Blinding 80.0 1.70Membrane 0.3 65.24
Suspended timber 170 Steel 3.0 55.50 28306 2.2Concrete 255.0 2.38 103356 8.1Brickwork 70.4 5.44 65096 5.1Timber 23.2 22.61 89178 7.0Drains 0.3 121.48 5673 0.4
05 Roof Framing Timber 170 Timber 16.8 22.61 64539 5.1Steel Steel 16.3 55.50
Cladding Concrete Tile 170 Concrete Tile 52.6 4.51 50855 4.0Clay Tile Clay Tile 48.1 17.34Steel Sheet Steel sheet 4.4 192.10Asbestos cement Corrugated 13.3 19.30AC Shingles Painted 25.2 19.30
Eaves soffit 1.6 19.30 5306 0.4Insulation(R2) 144 Insulation 1.0 107.57 15103 1.2Reflec. Insul. Aluminium Foil 0.4 302.96Ceiling Plasterboard 7.6 13.31 17196 1.4Guttering Steel 0.5 192.10 14808 1.2
06 External Walls Double Brick 116 Brick(Standard) 352.0 5.44 222094 17.5DPC 0.1 59.20 369 0.0Mortar 48.6 2.38 13441 1.1Plaster 14.0 8.94 14523 1.1Dressed stone 920.0 5.11Mortar 10.0 2.59Plaster 14.0 8.94
Brick Veneer Standard brick Brick(Standard) 176.0 5.44Mortar 23.4 2.38
Modular brick Brick(Modular) 143.0 5.44Mortar 16.2 2.38
Stone (veneer construction) Dressed stone 345.0 5.11Mortar 4.0 2.59
Timber framing Timber Framing 7.1 22.61Steel framing Steel Framing 6.2 55.50Insulation(R1.5) Insulation (R1.5) 1.0 107.57
DPC 0.1 59.20Plaster Board 7.6 13.31
AAC Block 200mm thick AAC Block 100.0 6.784mm Render 8.0 2.38Coating 0.1 194.25Plaster Board 7.6 13.31
Timber clad Cladding Cladding 10.0 22.61Paint Paint 0.2 194.25Timber framing Timber framing 7.1 22.61Insulation(R1.5) Insulation(R1.5) 1.0 107.57
DPC 0.1 59.20Plaster Board 7.6 13.31
07 Windows Frames Timber 28 Timber 16.3 22.61 10320 0.8Aluminium Aluminium 6.0 378.47
Glass 7.5 83.59 17554 1.409 Internal Walls Brick Brick 137 Brick(Standard) 176.0 5.44 131150 10.3
Mortar 25.2 2.38 8231 0.6Plaster 28.0 8.94 34305 2.7
Frame Timber Timber 7.1 22.61Steel Steel 4.6 55.50Insulation (R1.5) Insulation (R1.5) 1.0 107.57
Plaster Board 15.2 13.31AAC Block 100mm thick AAC Block 50.0 8.02
Plaster Board 15.2 13.3111 Doors Doors Solid 1 Solid 36.0 74.34 2676 0.2
Hollow 8 Hollow 14.0 48.33 5413 0.4Frames Timber 9 Timber 12.0 22.61 2442 0.2
Steel Steel 6.0 192.1012 Finishes Tiles Ceramic Tiles 21 14.3 31.70 15234 1.2
Floor cover. Carpet 123 2.4 212.30 61627 4.9Paint (Enter 1) 1 0.2 194.25 11837 0.9
15 Fitments Cabinets Kitchen 10 89.2 28.34 8595 0.7Oven/hob 1 60.0 301.09 18065 1.4Air Con. 1 58.0 301.09 17463 1.4
17 Plumbing Piping 17.1 384.56 6558 0.5Steel Sinks 2 6.0 216.15 2594 0.2WCs 1 12.0 31.70 380 0.0Handbasins 1 13.0 31.70 412 0.0Taps/fittings 3.6 47.00 169 0.0Baths 1 Acrylic 6.8 64.23 434 0.0Water Service 1 Gas fired 70.0 301.09 21076 1.7
26 Wiring Wire 23.5 136.03 3192 0.3Fittings 40 0.1 64.23 193 0.0
34 External Pavers 150 80.6 3.21 38809 3.1Driveway 40 Concrete 240.0 2.38 22888 1.8Fences (lin.m.) Timber 85 8.4 22.61 16144 1.3
Steel 3.6 192.10Pergola 40 10.7 22.61 9632 0.8Carport 15 10.3 192.10 91163 7.2
Total Embodied Energy(MJ) 1268400
Stone (solid construction)
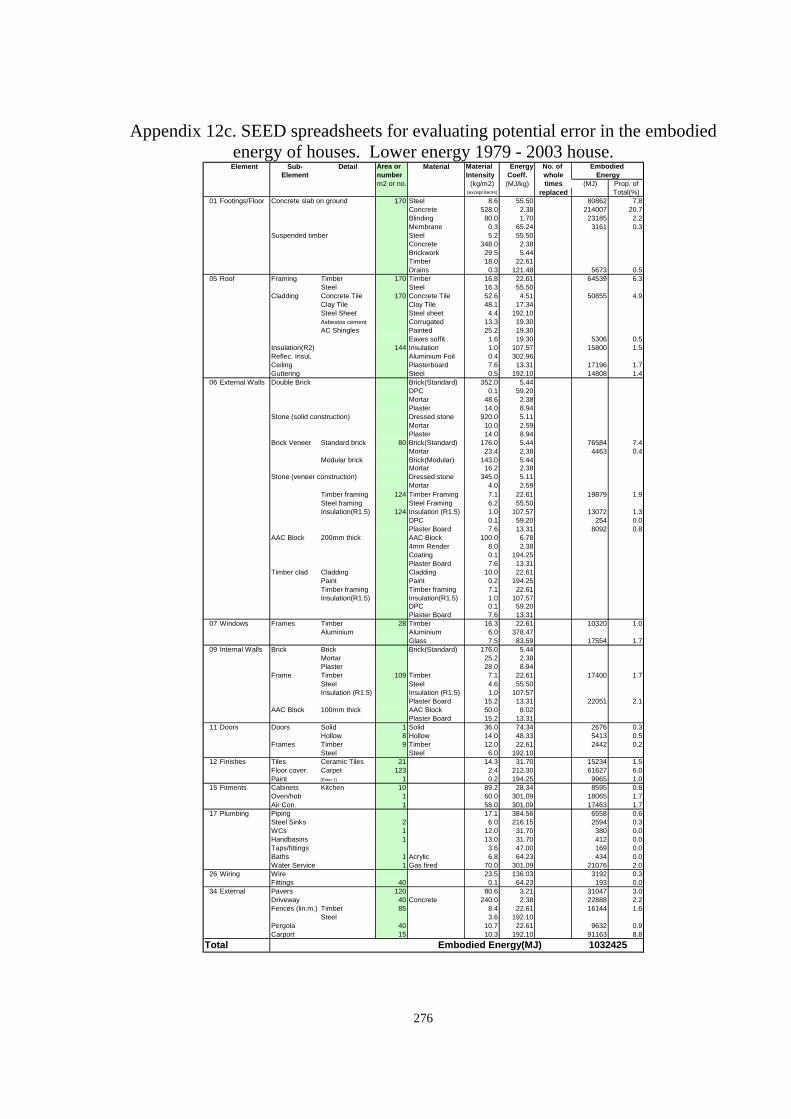
276
Appendix 12c. SEED spreadsheets for evaluating potential error in the embodied energy of houses. Lower energy 1979 - 2003 house.
Element Sub- Detail Area or Material Material Energy No. of Embodied Element number Intensity Coeff. whole Energy
m2 or no. (kg/m2) (MJ/kg) times (MJ) Prop. of(except items) replaced Total(%)
01 Footings/Floor Concrete slab on ground 170 Steel 8.6 55.50 80862 7.8Concrete 528.0 2.38 214007 20.7Blinding 80.0 1.70 23185 2.2Membrane 0.3 65.24 3161 0.3
Suspended timber Steel 5.2 55.50Concrete 348.0 2.38Brickwork 29.5 5.44Timber 18.0 22.61Drains 0.3 121.48 5673 0.5
05 Roof Framing Timber 170 Timber 16.8 22.61 64539 6.3Steel Steel 16.3 55.50
Cladding Concrete Tile 170 Concrete Tile 52.6 4.51 50855 4.9Clay Tile Clay Tile 48.1 17.34Steel Sheet Steel sheet 4.4 192.10Asbestos cement Corrugated 13.3 19.30AC Shingles Painted 25.2 19.30
Eaves soffit 1.6 19.30 5306 0.5Insulation(R2) 144 Insulation 1.0 107.57 15800 1.5Reflec. Insul. Aluminium Foil 0.4 302.96Ceiling Plasterboard 7.6 13.31 17196 1.7Guttering Steel 0.5 192.10 14808 1.4
06 External Walls Double Brick Brick(Standard) 352.0 5.44DPC 0.1 59.20Mortar 48.6 2.38Plaster 14.0 8.94Dressed stone 920.0 5.11Mortar 10.0 2.59Plaster 14.0 8.94
Brick Veneer Standard brick 80 Brick(Standard) 176.0 5.44 76584 7.4Mortar 23.4 2.38 4463 0.4
Modular brick Brick(Modular) 143.0 5.44Mortar 16.2 2.38
Stone (veneer construction) Dressed stone 345.0 5.11Mortar 4.0 2.59
Timber framing 124 Timber Framing 7.1 22.61 19879 1.9Steel framing Steel Framing 6.2 55.50Insulation(R1.5) 124 Insulation (R1.5) 1.0 107.57 13072 1.3
DPC 0.1 59.20 254 0.0Plaster Board 7.6 13.31 8092 0.8
AAC Block 200mm thick AAC Block 100.0 6.784mm Render 8.0 2.38Coating 0.1 194.25Plaster Board 7.6 13.31
Timber clad Cladding Cladding 10.0 22.61Paint Paint 0.2 194.25Timber framing Timber framing 7.1 22.61Insulation(R1.5) Insulation(R1.5) 1.0 107.57
DPC 0.1 59.20Plaster Board 7.6 13.31
07 Windows Frames Timber 28 Timber 16.3 22.61 10320 1.0Aluminium Aluminium 6.0 378.47
Glass 7.5 83.59 17554 1.709 Internal Walls Brick Brick Brick(Standard) 176.0 5.44
Mortar 25.2 2.38Plaster 28.0 8.94
Frame Timber 109 Timber 7.1 22.61 17400 1.7Steel Steel 4.6 55.50Insulation (R1.5) Insulation (R1.5) 1.0 107.57
Plaster Board 15.2 13.31 22051 2.1AAC Block 100mm thick AAC Block 50.0 8.02
Plaster Board 15.2 13.3111 Doors Doors Solid 1 Solid 36.0 74.34 2676 0.3
Hollow 8 Hollow 14.0 48.33 5413 0.5Frames Timber 9 Timber 12.0 22.61 2442 0.2
Steel Steel 6.0 192.1012 Finishes Tiles Ceramic Tiles 21 14.3 31.70 15234 1.5
Floor cover. Carpet 123 2.4 212.30 61627 6.0Paint (Enter 1) 1 0.2 194.25 9965 1.0
15 Fitments Cabinets Kitchen 10 89.2 28.34 8595 0.8Oven/hob 1 60.0 301.09 18065 1.7Air Con. 1 58.0 301.09 17463 1.7
17 Plumbing Piping 17.1 384.56 6558 0.6Steel Sinks 2 6.0 216.15 2594 0.3WCs 1 12.0 31.70 380 0.0Handbasins 1 13.0 31.70 412 0.0Taps/fittings 3.6 47.00 169 0.0Baths 1 Acrylic 6.8 64.23 434 0.0Water Service 1 Gas fired 70.0 301.09 21076 2.0
26 Wiring Wire 23.5 136.03 3192 0.3Fittings 40 0.1 64.23 193 0.0
34 External Pavers 120 80.6 3.21 31047 3.0Driveway 40 Concrete 240.0 2.38 22888 2.2Fences (lin.m.) Timber 85 8.4 22.61 16144 1.6
Steel 3.6 192.10Pergola 40 10.7 22.61 9632 0.9Carport 15 10.3 192.10 91163 8.8
Total Embodied Energy(MJ) 1032425
Stone (solid construction)
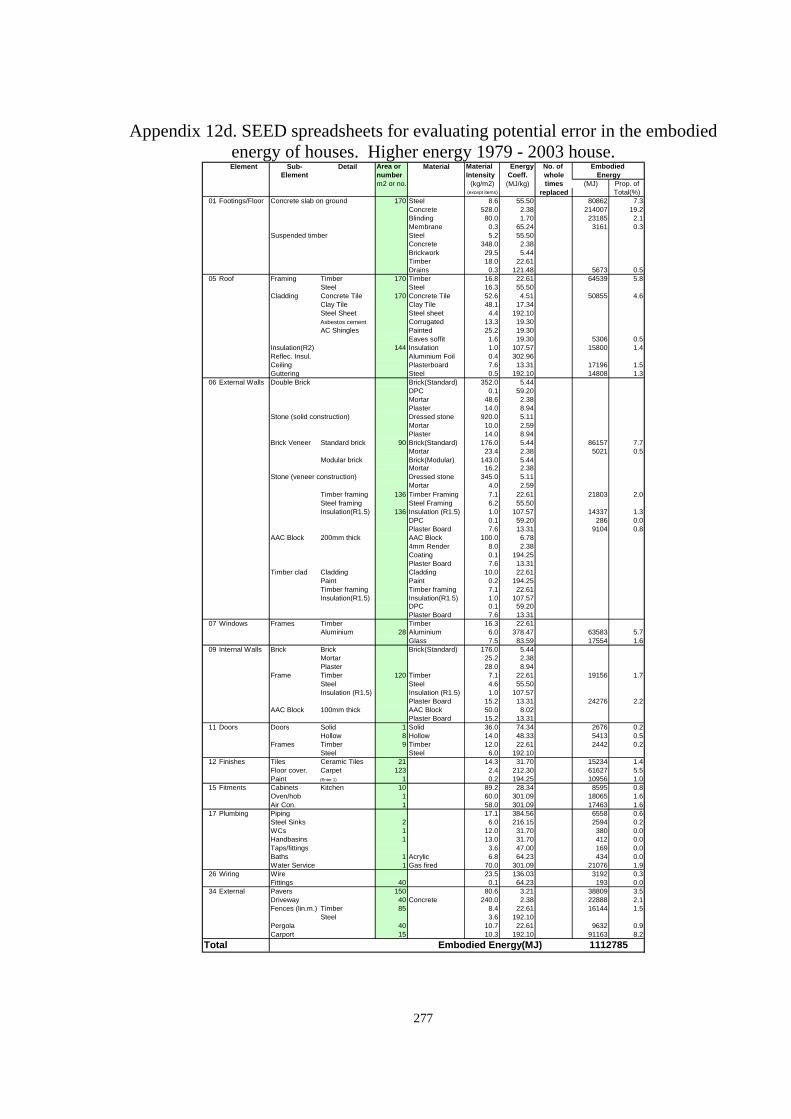
277
Appendix 12d. SEED spreadsheets for evaluating potential error in the embodied energy of houses. Higher energy 1979 - 2003 house. Element Sub- Detail Area or Material Material Energy No. of Embodied
Element number Intensity Coeff. whole Energym2 or no. (kg/m2) (MJ/kg) times (MJ) Prop. of
(except items) replaced Total(%)01 Footings/Floor Concrete slab on ground 170 Steel 8.6 55.50 80862 7.3
Concrete 528.0 2.38 214007 19.2Blinding 80.0 1.70 23185 2.1Membrane 0.3 65.24 3161 0.3
Suspended timber Steel 5.2 55.50Concrete 348.0 2.38Brickwork 29.5 5.44Timber 18.0 22.61Drains 0.3 121.48 5673 0.5
05 Roof Framing Timber 170 Timber 16.8 22.61 64539 5.8Steel Steel 16.3 55.50
Cladding Concrete Tile 170 Concrete Tile 52.6 4.51 50855 4.6Clay Tile Clay Tile 48.1 17.34Steel Sheet Steel sheet 4.4 192.10Asbestos cement Corrugated 13.3 19.30AC Shingles Painted 25.2 19.30
Eaves soffit 1.6 19.30 5306 0.5Insulation(R2) 144 Insulation 1.0 107.57 15800 1.4Reflec. Insul. Aluminium Foil 0.4 302.96Ceiling Plasterboard 7.6 13.31 17196 1.5Guttering Steel 0.5 192.10 14808 1.3
06 External Walls Double Brick Brick(Standard) 352.0 5.44DPC 0.1 59.20Mortar 48.6 2.38Plaster 14.0 8.94Dressed stone 920.0 5.11Mortar 10.0 2.59Plaster 14.0 8.94
Brick Veneer Standard brick 90 Brick(Standard) 176.0 5.44 86157 7.7Mortar 23.4 2.38 5021 0.5
Modular brick Brick(Modular) 143.0 5.44Mortar 16.2 2.38
Stone (veneer construction) Dressed stone 345.0 5.11Mortar 4.0 2.59
Timber framing 136 Timber Framing 7.1 22.61 21803 2.0Steel framing Steel Framing 6.2 55.50Insulation(R1.5) 136 Insulation (R1.5) 1.0 107.57 14337 1.3
DPC 0.1 59.20 286 0.0Plaster Board 7.6 13.31 9104 0.8
AAC Block 200mm thick AAC Block 100.0 6.784mm Render 8.0 2.38Coating 0.1 194.25Plaster Board 7.6 13.31
Timber clad Cladding Cladding 10.0 22.61Paint Paint 0.2 194.25Timber framing Timber framing 7.1 22.61Insulation(R1.5) Insulation(R1.5) 1.0 107.57
DPC 0.1 59.20Plaster Board 7.6 13.31
07 Windows Frames Timber Timber 16.3 22.61Aluminium 28 Aluminium 6.0 378.47 63583 5.7
Glass 7.5 83.59 17554 1.609 Internal Walls Brick Brick Brick(Standard) 176.0 5.44
Mortar 25.2 2.38Plaster 28.0 8.94
Frame Timber 120 Timber 7.1 22.61 19156 1.7Steel Steel 4.6 55.50Insulation (R1.5) Insulation (R1.5) 1.0 107.57
Plaster Board 15.2 13.31 24276 2.2AAC Block 100mm thick AAC Block 50.0 8.02
Plaster Board 15.2 13.3111 Doors Doors Solid 1 Solid 36.0 74.34 2676 0.2
Hollow 8 Hollow 14.0 48.33 5413 0.5Frames Timber 9 Timber 12.0 22.61 2442 0.2
Steel Steel 6.0 192.1012 Finishes Tiles Ceramic Tiles 21 14.3 31.70 15234 1.4
Floor cover. Carpet 123 2.4 212.30 61627 5.5Paint (Enter 1) 1 0.2 194.25 10956 1.0
15 Fitments Cabinets Kitchen 10 89.2 28.34 8595 0.8Oven/hob 1 60.0 301.09 18065 1.6Air Con. 1 58.0 301.09 17463 1.6
17 Plumbing Piping 17.1 384.56 6558 0.6Steel Sinks 2 6.0 216.15 2594 0.2WCs 1 12.0 31.70 380 0.0Handbasins 1 13.0 31.70 412 0.0Taps/fittings 3.6 47.00 169 0.0Baths 1 Acrylic 6.8 64.23 434 0.0Water Service 1 Gas fired 70.0 301.09 21076 1.9
26 Wiring Wire 23.5 136.03 3192 0.3Fittings 40 0.1 64.23 193 0.0
34 External Pavers 150 80.6 3.21 38809 3.5Driveway 40 Concrete 240.0 2.38 22888 2.1Fences (lin.m.) Timber 85 8.4 22.61 16144 1.5
Steel 3.6 192.10Pergola 40 10.7 22.61 9632 0.9Carport 15 10.3 192.10 91163 8.2
Total Embodied Energy(MJ) 1112785
Stone (solid construction)
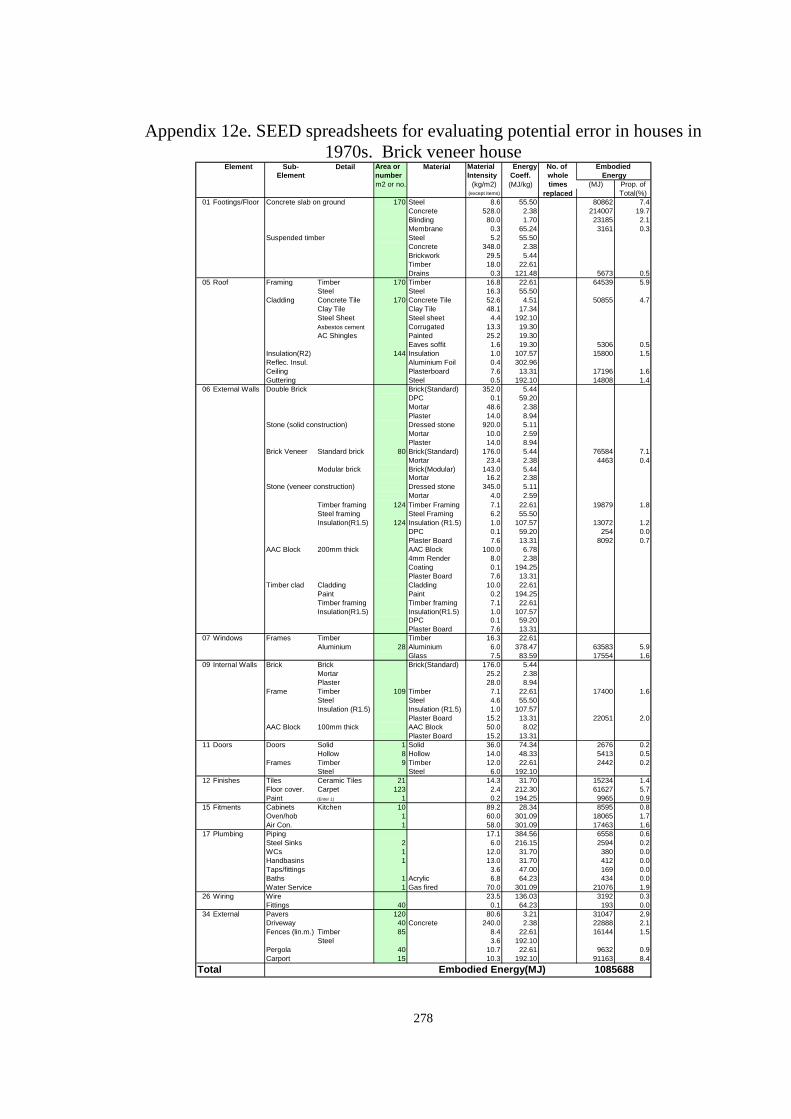
278
Appendix 12e. SEED spreadsheets for evaluating potential error in houses in 1970s. Brick veneer house
Element Sub- Detail Area or Material Material Energy No. of Embodied Element number Intensity Coeff. whole Energy
m2 or no. (kg/m2) (MJ/kg) times (MJ) Prop. of(except items) replaced Total(%)
01 Footings/Floor Concrete slab on ground 170 Steel 8.6 55.50 80862 7.4Concrete 528.0 2.38 214007 19.7Blinding 80.0 1.70 23185 2.1Membrane 0.3 65.24 3161 0.3
Suspended timber Steel 5.2 55.50Concrete 348.0 2.38Brickwork 29.5 5.44Timber 18.0 22.61Drains 0.3 121.48 5673 0.5
05 Roof Framing Timber 170 Timber 16.8 22.61 64539 5.9Steel Steel 16.3 55.50
Cladding Concrete Tile 170 Concrete Tile 52.6 4.51 50855 4.7Clay Tile Clay Tile 48.1 17.34Steel Sheet Steel sheet 4.4 192.10Asbestos cement Corrugated 13.3 19.30AC Shingles Painted 25.2 19.30
Eaves soffit 1.6 19.30 5306 0.5Insulation(R2) 144 Insulation 1.0 107.57 15800 1.5Reflec. Insul. Aluminium Foil 0.4 302.96Ceiling Plasterboard 7.6 13.31 17196 1.6Guttering Steel 0.5 192.10 14808 1.4
06 External Walls Double Brick Brick(Standard) 352.0 5.44DPC 0.1 59.20Mortar 48.6 2.38Plaster 14.0 8.94Dressed stone 920.0 5.11Mortar 10.0 2.59Plaster 14.0 8.94
Brick Veneer Standard brick 80 Brick(Standard) 176.0 5.44 76584 7.1Mortar 23.4 2.38 4463 0.4
Modular brick Brick(Modular) 143.0 5.44Mortar 16.2 2.38
Stone (veneer construction) Dressed stone 345.0 5.11Mortar 4.0 2.59
Timber framing 124 Timber Framing 7.1 22.61 19879 1.8Steel framing Steel Framing 6.2 55.50Insulation(R1.5) 124 Insulation (R1.5) 1.0 107.57 13072 1.2
DPC 0.1 59.20 254 0.0Plaster Board 7.6 13.31 8092 0.7
AAC Block 200mm thick AAC Block 100.0 6.784mm Render 8.0 2.38Coating 0.1 194.25Plaster Board 7.6 13.31
Timber clad Cladding Cladding 10.0 22.61Paint Paint 0.2 194.25Timber framing Timber framing 7.1 22.61Insulation(R1.5) Insulation(R1.5) 1.0 107.57
DPC 0.1 59.20Plaster Board 7.6 13.31
07 Windows Frames Timber Timber 16.3 22.61Aluminium 28 Aluminium 6.0 378.47 63583 5.9
Glass 7.5 83.59 17554 1.609 Internal Walls Brick Brick Brick(Standard) 176.0 5.44
Mortar 25.2 2.38Plaster 28.0 8.94
Frame Timber 109 Timber 7.1 22.61 17400 1.6Steel Steel 4.6 55.50Insulation (R1.5) Insulation (R1.5) 1.0 107.57
Plaster Board 15.2 13.31 22051 2.0AAC Block 100mm thick AAC Block 50.0 8.02
Plaster Board 15.2 13.3111 Doors Doors Solid 1 Solid 36.0 74.34 2676 0.2
Hollow 8 Hollow 14.0 48.33 5413 0.5Frames Timber 9 Timber 12.0 22.61 2442 0.2
Steel Steel 6.0 192.1012 Finishes Tiles Ceramic Tiles 21 14.3 31.70 15234 1.4
Floor cover. Carpet 123 2.4 212.30 61627 5.7Paint (Enter 1) 1 0.2 194.25 9965 0.9
15 Fitments Cabinets Kitchen 10 89.2 28.34 8595 0.8Oven/hob 1 60.0 301.09 18065 1.7Air Con. 1 58.0 301.09 17463 1.6
17 Plumbing Piping 17.1 384.56 6558 0.6Steel Sinks 2 6.0 216.15 2594 0.2WCs 1 12.0 31.70 380 0.0Handbasins 1 13.0 31.70 412 0.0Taps/fittings 3.6 47.00 169 0.0Baths 1 Acrylic 6.8 64.23 434 0.0Water Service 1 Gas fired 70.0 301.09 21076 1.9
26 Wiring Wire 23.5 136.03 3192 0.3Fittings 40 0.1 64.23 193 0.0
34 External Pavers 120 80.6 3.21 31047 2.9Driveway 40 Concrete 240.0 2.38 22888 2.1Fences (lin.m.) Timber 85 8.4 22.61 16144 1.5
Steel 3.6 192.10Pergola 40 10.7 22.61 9632 0.9Carport 15 10.3 192.10 91163 8.4
Total Embodied Energy(MJ) 1085688
Stone (solid construction)
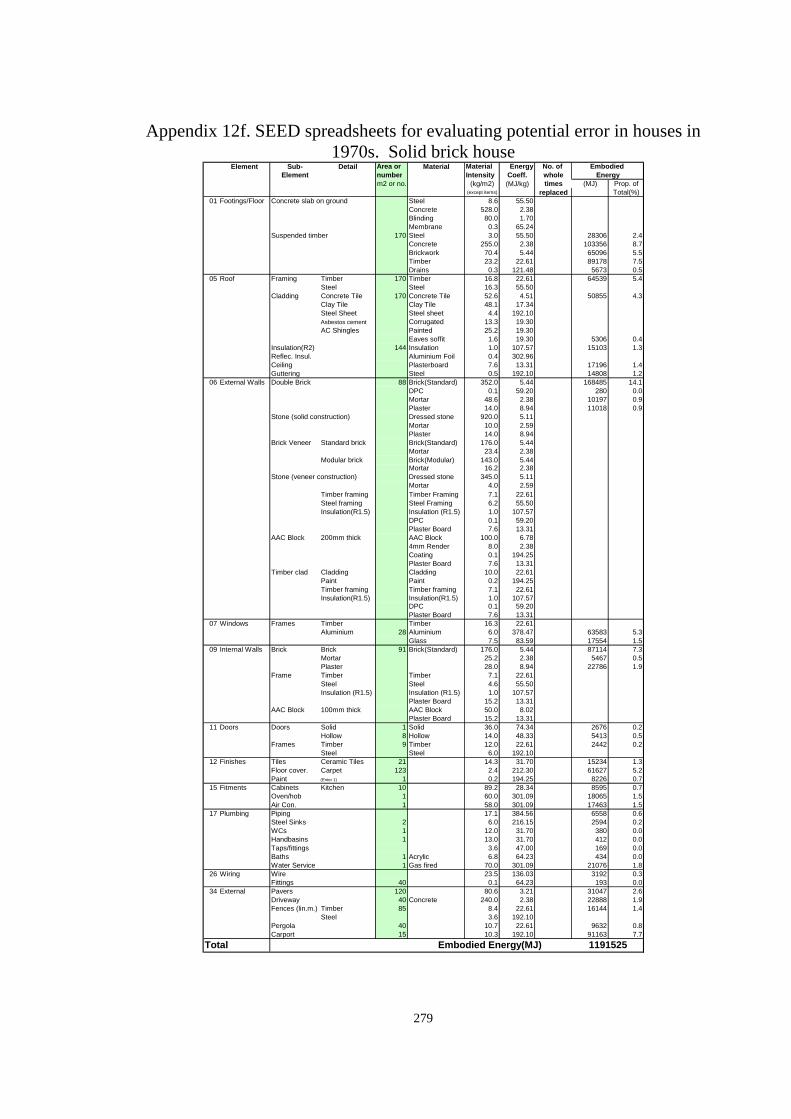
279
Appendix 12f. SEED spreadsheets for evaluating potential error in houses in 1970s. Solid brick house
Element Sub- Detail Area or Material Material Energy No. of Embodied Element number Intensity Coeff. whole Energy
m2 or no. (kg/m2) (MJ/kg) times (MJ) Prop. of(except items) replaced Total(%)
01 Footings/Floor Concrete slab on ground Steel 8.6 55.50Concrete 528.0 2.38Blinding 80.0 1.70Membrane 0.3 65.24
Suspended timber 170 Steel 3.0 55.50 28306 2.4Concrete 255.0 2.38 103356 8.7Brickwork 70.4 5.44 65096 5.5Timber 23.2 22.61 89178 7.5Drains 0.3 121.48 5673 0.5
05 Roof Framing Timber 170 Timber 16.8 22.61 64539 5.4Steel Steel 16.3 55.50
Cladding Concrete Tile 170 Concrete Tile 52.6 4.51 50855 4.3Clay Tile Clay Tile 48.1 17.34Steel Sheet Steel sheet 4.4 192.10Asbestos cement Corrugated 13.3 19.30AC Shingles Painted 25.2 19.30
Eaves soffit 1.6 19.30 5306 0.4Insulation(R2) 144 Insulation 1.0 107.57 15103 1.3Reflec. Insul. Aluminium Foil 0.4 302.96Ceiling Plasterboard 7.6 13.31 17196 1.4Guttering Steel 0.5 192.10 14808 1.2
06 External Walls Double Brick 88 Brick(Standard) 352.0 5.44 168485 14.1DPC 0.1 59.20 280 0.0Mortar 48.6 2.38 10197 0.9Plaster 14.0 8.94 11018 0.9Dressed stone 920.0 5.11Mortar 10.0 2.59Plaster 14.0 8.94
Brick Veneer Standard brick Brick(Standard) 176.0 5.44Mortar 23.4 2.38
Modular brick Brick(Modular) 143.0 5.44Mortar 16.2 2.38
Stone (veneer construction) Dressed stone 345.0 5.11Mortar 4.0 2.59
Timber framing Timber Framing 7.1 22.61Steel framing Steel Framing 6.2 55.50Insulation(R1.5) Insulation (R1.5) 1.0 107.57
DPC 0.1 59.20Plaster Board 7.6 13.31
AAC Block 200mm thick AAC Block 100.0 6.784mm Render 8.0 2.38Coating 0.1 194.25Plaster Board 7.6 13.31
Timber clad Cladding Cladding 10.0 22.61Paint Paint 0.2 194.25Timber framing Timber framing 7.1 22.61Insulation(R1.5) Insulation(R1.5) 1.0 107.57
DPC 0.1 59.20Plaster Board 7.6 13.31
07 Windows Frames Timber Timber 16.3 22.61Aluminium 28 Aluminium 6.0 378.47 63583 5.3
Glass 7.5 83.59 17554 1.509 Internal Walls Brick Brick 91 Brick(Standard) 176.0 5.44 87114 7.3
Mortar 25.2 2.38 5467 0.5Plaster 28.0 8.94 22786 1.9
Frame Timber Timber 7.1 22.61Steel Steel 4.6 55.50Insulation (R1.5) Insulation (R1.5) 1.0 107.57
Plaster Board 15.2 13.31AAC Block 100mm thick AAC Block 50.0 8.02
Plaster Board 15.2 13.3111 Doors Doors Solid 1 Solid 36.0 74.34 2676 0.2
Hollow 8 Hollow 14.0 48.33 5413 0.5Frames Timber 9 Timber 12.0 22.61 2442 0.2
Steel Steel 6.0 192.1012 Finishes Tiles Ceramic Tiles 21 14.3 31.70 15234 1.3
Floor cover. Carpet 123 2.4 212.30 61627 5.2Paint (Enter 1) 1 0.2 194.25 8226 0.7
15 Fitments Cabinets Kitchen 10 89.2 28.34 8595 0.7Oven/hob 1 60.0 301.09 18065 1.5Air Con. 1 58.0 301.09 17463 1.5
17 Plumbing Piping 17.1 384.56 6558 0.6Steel Sinks 2 6.0 216.15 2594 0.2WCs 1 12.0 31.70 380 0.0Handbasins 1 13.0 31.70 412 0.0Taps/fittings 3.6 47.00 169 0.0Baths 1 Acrylic 6.8 64.23 434 0.0Water Service 1 Gas fired 70.0 301.09 21076 1.8
26 Wiring Wire 23.5 136.03 3192 0.3Fittings 40 0.1 64.23 193 0.0
34 External Pavers 120 80.6 3.21 31047 2.6Driveway 40 Concrete 240.0 2.38 22888 1.9Fences (lin.m.) Timber 85 8.4 22.61 16144 1.4
Steel 3.6 192.10Pergola 40 10.7 22.61 9632 0.8Carport 15 10.3 192.10 91163 7.7
Total Embodied Energy(MJ) 1191525
Stone (solid construction)
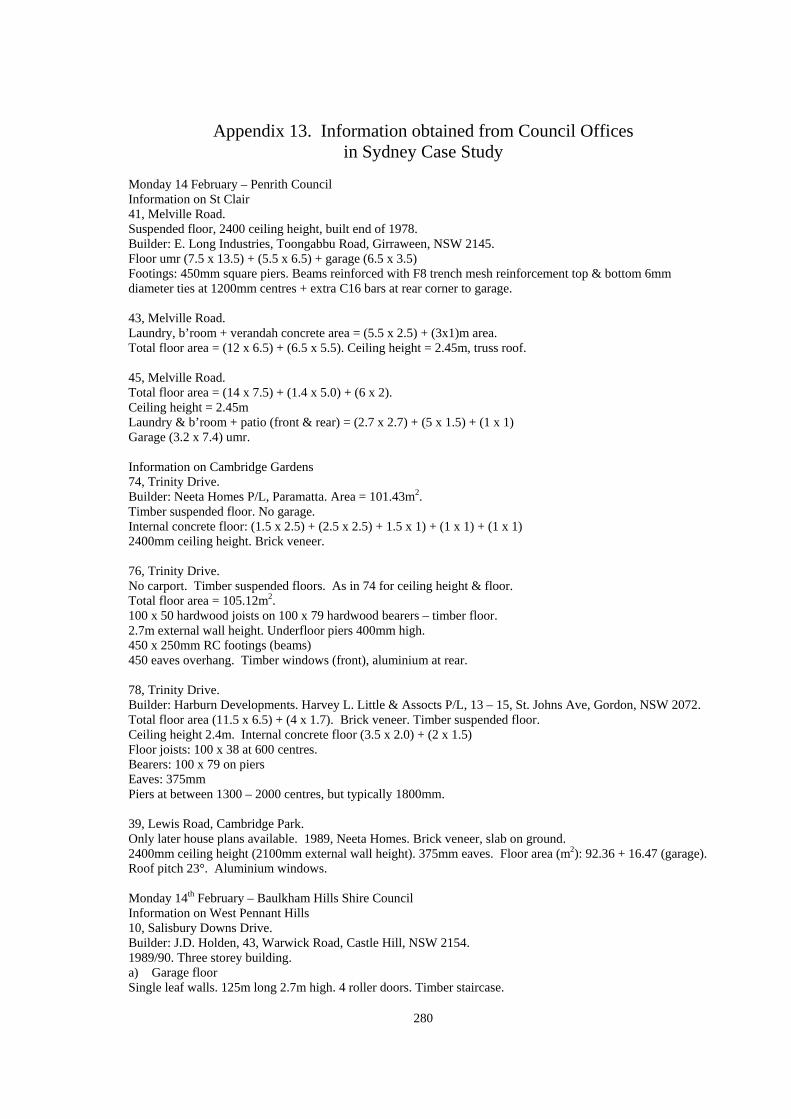
280
Appendix 13. Information obtained from Council Offices in Sydney Case Study
Monday 14 February – Penrith Council Information on St Clair 41, Melville Road. Suspended floor, 2400 ceiling height, built end of 1978. Builder: E. Long Industries, Toongabbu Road, Girraween, NSW 2145. Floor umr (7.5 x 13.5) + (5.5 x 6.5) + garage (6.5 x 3.5) Footings: 450mm square piers. Beams reinforced with F8 trench mesh reinforcement top & bottom 6mm diameter ties at 1200mm centres + extra C16 bars at rear corner to garage. 43, Melville Road. Laundry, b’room + verandah concrete area = (5.5 x 2.5) + (3x1)m area. Total floor area = (12 x 6.5) + (6.5 x 5.5). Ceiling height = 2.45m, truss roof. 45, Melville Road. Total floor area = (14 x 7.5) + (1.4 x 5.0) + (6 x 2). Ceiling height = 2.45m Laundry & b’room + patio (front & rear) = (2.7 x 2.7) + (5 x 1.5) + (1 x 1) Garage (3.2 x 7.4) umr. Information on Cambridge Gardens 74, Trinity Drive. Builder: Neeta Homes P/L, Paramatta. Area = 101.43m2. Timber suspended floor. No garage. Internal concrete floor: (1.5 x 2.5) + (2.5 x 2.5) + 1.5 x 1) + (1 x 1) + (1 x 1) 2400mm ceiling height. Brick veneer. 76, Trinity Drive. No carport. Timber suspended floors. As in 74 for ceiling height & floor. Total floor area = 105.12m2. 100 x 50 hardwood joists on 100 x 79 hardwood bearers – timber floor. 2.7m external wall height. Underfloor piers 400mm high. 450 x 250mm RC footings (beams) 450 eaves overhang. Timber windows (front), aluminium at rear. 78, Trinity Drive. Builder: Harburn Developments. Harvey L. Little & Assocts P/L, 13 – 15, St. Johns Ave, Gordon, NSW 2072. Total floor area (11.5 x 6.5) + (4 x 1.7). Brick veneer. Timber suspended floor. Ceiling height 2.4m. Internal concrete floor (3.5 x 2.0) + (2 x 1.5) Floor joists: 100 x 38 at 600 centres. Bearers: 100 x 79 on piers Eaves: 375mm Piers at between 1300 – 2000 centres, but typically 1800mm. 39, Lewis Road, Cambridge Park. Only later house plans available. 1989, Neeta Homes. Brick veneer, slab on ground. 2400mm ceiling height (2100mm external wall height). 375mm eaves. Floor area (m2): 92.36 + 16.47 (garage). Roof pitch 23°. Aluminium windows. Monday 14th February – Baulkham Hills Shire Council Information on West Pennant Hills 10, Salisbury Downs Drive. Builder: J.D. Holden, 43, Warwick Road, Castle Hill, NSW 2154. 1989/90. Three storey building. a) Garage floor Single leaf walls. 125m long 2.7m high. 4 roller doors. Timber staircase.
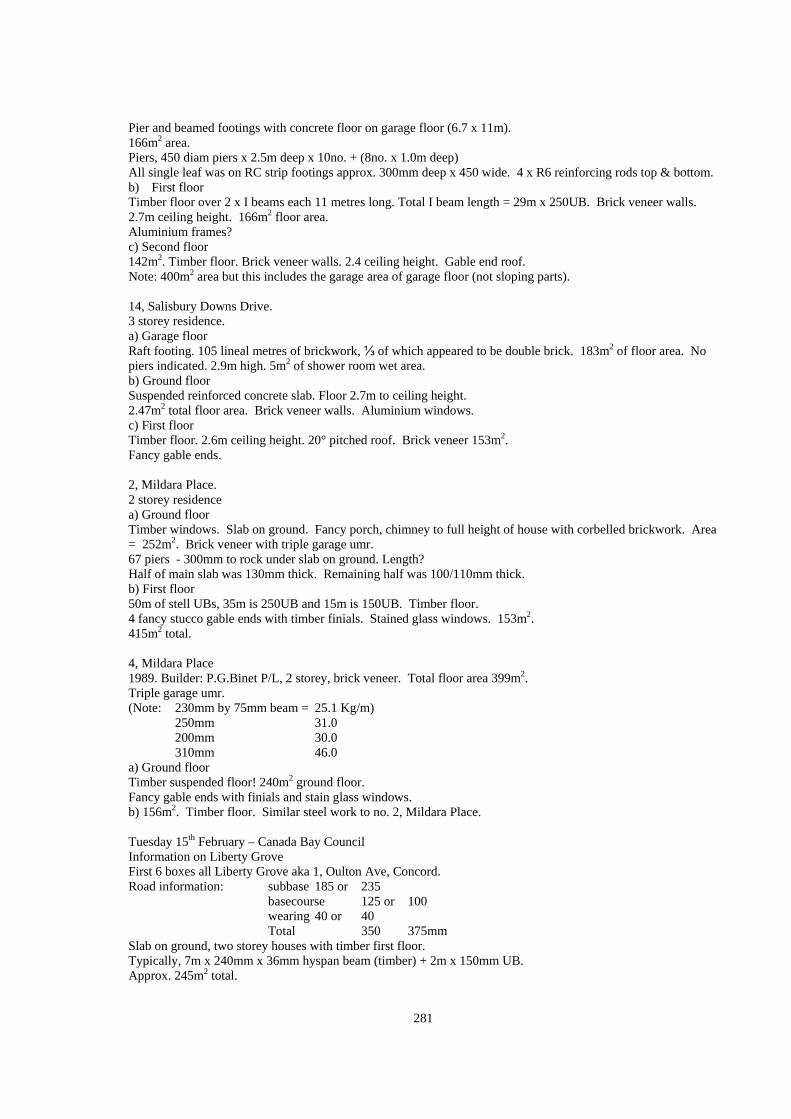
281
Pier and beamed footings with concrete floor on garage floor (6.7 x 11m). 166m2 area. Piers, 450 diam piers x 2.5m deep x 10no. + (8no. x 1.0m deep) All single leaf was on RC strip footings approx. 300mm deep x 450 wide. 4 x R6 reinforcing rods top & bottom. b) First floor Timber floor over 2 x I beams each 11 metres long. Total I beam length = 29m x 250UB. Brick veneer walls. 2.7m ceiling height. 166m2 floor area. Aluminium frames? c) Second floor 142m2. Timber floor. Brick veneer walls. 2.4 ceiling height. Gable end roof. Note: 400m2 area but this includes the garage area of garage floor (not sloping parts). 14, Salisbury Downs Drive. 3 storey residence. a) Garage floor Raft footing. 105 lineal metres of brickwork, ⅓ of which appeared to be double brick. 183m2 of floor area. No piers indicated. 2.9m high. 5m2 of shower room wet area. b) Ground floor Suspended reinforced concrete slab. Floor 2.7m to ceiling height. 2.47m2 total floor area. Brick veneer walls. Aluminium windows. c) First floor Timber floor. 2.6m ceiling height. 20° pitched roof. Brick veneer 153m2. Fancy gable ends. 2, Mildara Place. 2 storey residence a) Ground floor Timber windows. Slab on ground. Fancy porch, chimney to full height of house with corbelled brickwork. Area = 252m2. Brick veneer with triple garage umr. 67 piers - 300mm to rock under slab on ground. Length? Half of main slab was 130mm thick. Remaining half was 100/110mm thick. b) First floor 50m of stell UBs, 35m is 250UB and 15m is 150UB. Timber floor. 4 fancy stucco gable ends with timber finials. Stained glass windows. 153m2. 415m2 total. 4, Mildara Place 1989. Builder: P.G.Binet P/L, 2 storey, brick veneer. Total floor area 399m2. Triple garage umr. (Note: 230mm by 75mm beam = 25.1 Kg/m) 250mm 31.0 200mm 30.0 310mm 46.0 a) Ground floor Timber suspended floor! 240m2 ground floor. Fancy gable ends with finials and stain glass windows. b) 156m2. Timber floor. Similar steel work to no. 2, Mildara Place. Tuesday 15th February – Canada Bay Council Information on Liberty Grove First 6 boxes all Liberty Grove aka 1, Oulton Ave, Concord. Road information: subbase 185 or 235 basecourse 125 or 100 wearing 40 or 40 Total 350 375mm Slab on ground, two storey houses with timber first floor. Typically, 7m x 240mm x 36mm hyspan beam (timber) + 2m x 150mm UB. Approx. 245m2 total.
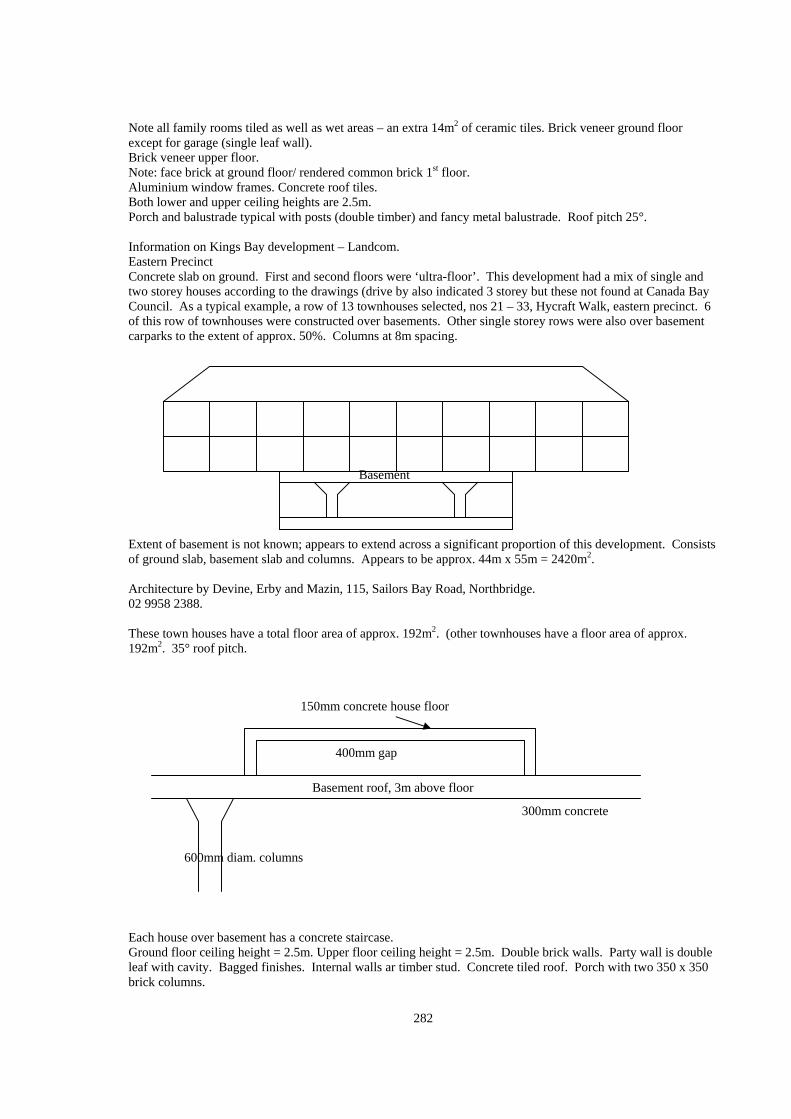
282
Note all family rooms tiled as well as wet areas – an extra 14m2 of ceramic tiles. Brick veneer ground floor except for garage (single leaf wall). Brick veneer upper floor. Note: face brick at ground floor/ rendered common brick 1st floor. Aluminium window frames. Concrete roof tiles. Both lower and upper ceiling heights are 2.5m. Porch and balustrade typical with posts (double timber) and fancy metal balustrade. Roof pitch 25°. Information on Kings Bay development – Landcom. Eastern Precinct Concrete slab on ground. First and second floors were ‘ultra-floor’. This development had a mix of single and two storey houses according to the drawings (drive by also indicated 3 storey but these not found at Canada Bay Council. As a typical example, a row of 13 townhouses selected, nos 21 – 33, Hycraft Walk, eastern precinct. 6 of this row of townhouses were constructed over basements. Other single storey rows were also over basement carparks to the extent of approx. 50%. Columns at 8m spacing. Extent of basement is not known; appears to extend across a significant proportion of this development. Consists of ground slab, basement slab and columns. Appears to be approx. 44m x 55m = 2420m2. Architecture by Devine, Erby and Mazin, 115, Sailors Bay Road, Northbridge. 02 9958 2388. These town houses have a total floor area of approx. 192m2. (other townhouses have a floor area of approx. 192m2. 35° roof pitch.
Each house over basement has a concrete staircase. Ground floor ceiling height = 2.5m. Upper floor ceiling height = 2.5m. Double brick walls. Party wall is double leaf with cavity. Bagged finishes. Internal walls ar timber stud. Concrete tiled roof. Porch with two 350 x 350 brick columns.
600mm diam. columns
150mm concrete house floor
400mm gap
Basement roof, 3m above floor
300mm concrete
Basement
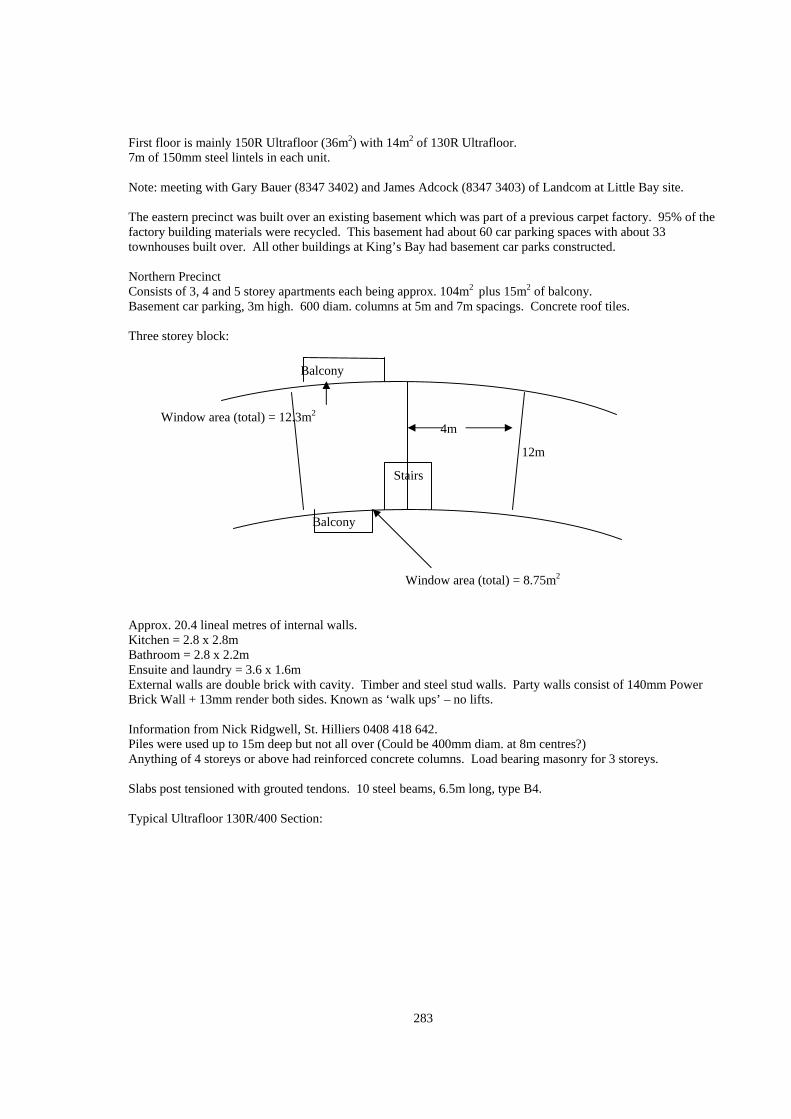
283
First floor is mainly 150R Ultrafloor (36m2) with 14m2 of 130R Ultrafloor. 7m of 150mm steel lintels in each unit. Note: meeting with Gary Bauer (8347 3402) and James Adcock (8347 3403) of Landcom at Little Bay site. The eastern precinct was built over an existing basement which was part of a previous carpet factory. 95% of the factory building materials were recycled. This basement had about 60 car parking spaces with about 33 townhouses built over. All other buildings at King’s Bay had basement car parks constructed. Northern Precinct Consists of 3, 4 and 5 storey apartments each being approx. 104m2 plus 15m2 of balcony. Basement car parking, 3m high. 600 diam. columns at 5m and 7m spacings. Concrete roof tiles. Three storey block:
Approx. 20.4 lineal metres of internal walls. Kitchen = 2.8 x 2.8m Bathroom = 2.8 x 2.2m Ensuite and laundry = 3.6 x 1.6m External walls are double brick with cavity. Timber and steel stud walls. Party walls consist of 140mm Power Brick Wall + 13mm render both sides. Known as ‘walk ups’ – no lifts. Information from Nick Ridgwell, St. Hilliers 0408 418 642. Piles were used up to 15m deep but not all over (Could be 400mm diam. at 8m centres?) Anything of 4 storeys or above had reinforced concrete columns. Load bearing masonry for 3 storeys. Slabs post tensioned with grouted tendons. 10 steel beams, 6.5m long, type B4. Typical Ultrafloor 130R/400 Section:
Balcony
Stairs
12m
4m
Window area (total) = 8.75m2
Window area (total) = 12.3m2
Balcony
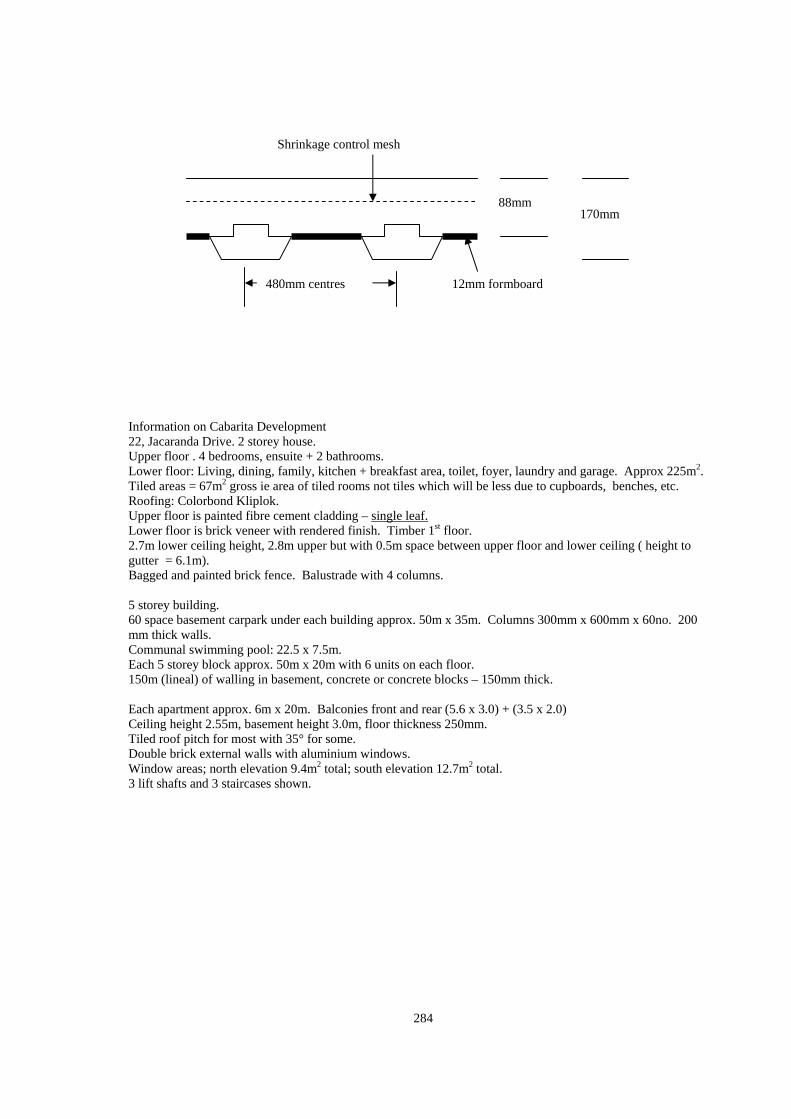
284
Information on Cabarita Development 22, Jacaranda Drive. 2 storey house. Upper floor . 4 bedrooms, ensuite + 2 bathrooms. Lower floor: Living, dining, family, kitchen + breakfast area, toilet, foyer, laundry and garage. Approx 225m2. Tiled areas = 67m2 gross ie area of tiled rooms not tiles which will be less due to cupboards, benches, etc. Roofing: Colorbond Kliplok. Upper floor is painted fibre cement cladding – single leaf. Lower floor is brick veneer with rendered finish. Timber 1st floor. 2.7m lower ceiling height, 2.8m upper but with 0.5m space between upper floor and lower ceiling ( height to gutter = 6.1m). Bagged and painted brick fence. Balustrade with 4 columns. 5 storey building. 60 space basement carpark under each building approx. 50m x 35m. Columns 300mm x 600mm x 60no. 200 mm thick walls. Communal swimming pool: 22.5 x 7.5m. Each 5 storey block approx. 50m x 20m with 6 units on each floor. 150m (lineal) of walling in basement, concrete or concrete blocks – 150mm thick. Each apartment approx. 6m x 20m. Balconies front and rear (5.6 x 3.0) + (3.5 x 2.0) Ceiling height 2.55m, basement height 3.0m, floor thickness 250mm. Tiled roof pitch for most with 35° for some. Double brick external walls with aluminium windows. Window areas; north elevation 9.4m2 total; south elevation 12.7m2 total. 3 lift shafts and 3 staircases shown.
88mm 170mm
480mm centres 12mm formboard
Shrinkage control mesh
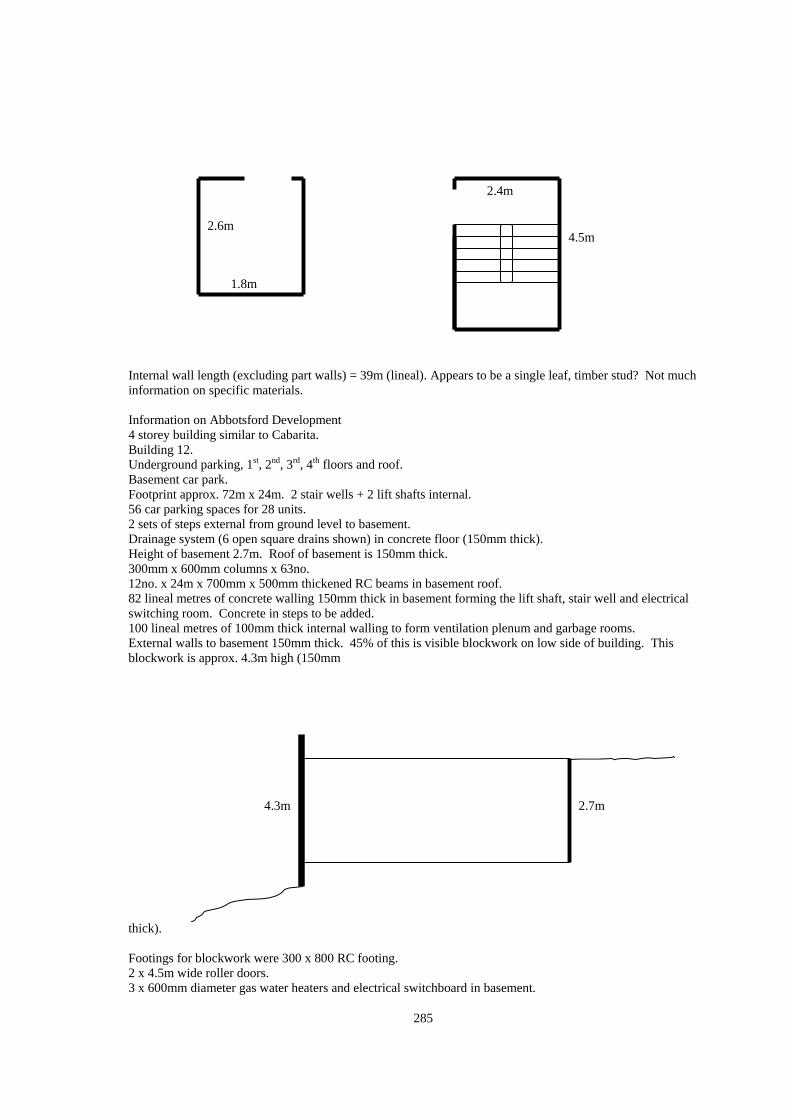
285
Internal wall length (excluding part walls) = 39m (lineal). Appears to be a single leaf, timber stud? Not much information on specific materials. Information on Abbotsford Development 4 storey building similar to Cabarita. Building 12. Underground parking, 1st, 2nd, 3rd, 4th floors and roof. Basement car park. Footprint approx. 72m x 24m. 2 stair wells + 2 lift shafts internal. 56 car parking spaces for 28 units. 2 sets of steps external from ground level to basement. Drainage system (6 open square drains shown) in concrete floor (150mm thick). Height of basement 2.7m. Roof of basement is 150mm thick. 300mm x 600mm columns x 63no. 12no. x 24m x 700mm x 500mm thickened RC beams in basement roof. 82 lineal metres of concrete walling 150mm thick in basement forming the lift shaft, stair well and electrical switching room. Concrete in steps to be added. 100 lineal metres of 100mm thick internal walling to form ventilation plenum and garbage rooms. External walls to basement 150mm thick. 45% of this is visible blockwork on low side of building. This blockwork is approx. 4.3m high (150mm
thick). Footings for blockwork were 300 x 800 RC footing. 2 x 4.5m wide roller doors. 3 x 600mm diameter gas water heaters and electrical switchboard in basement.
1.8m
2.6m 4.5m
2.4m
2.7m 4.3m
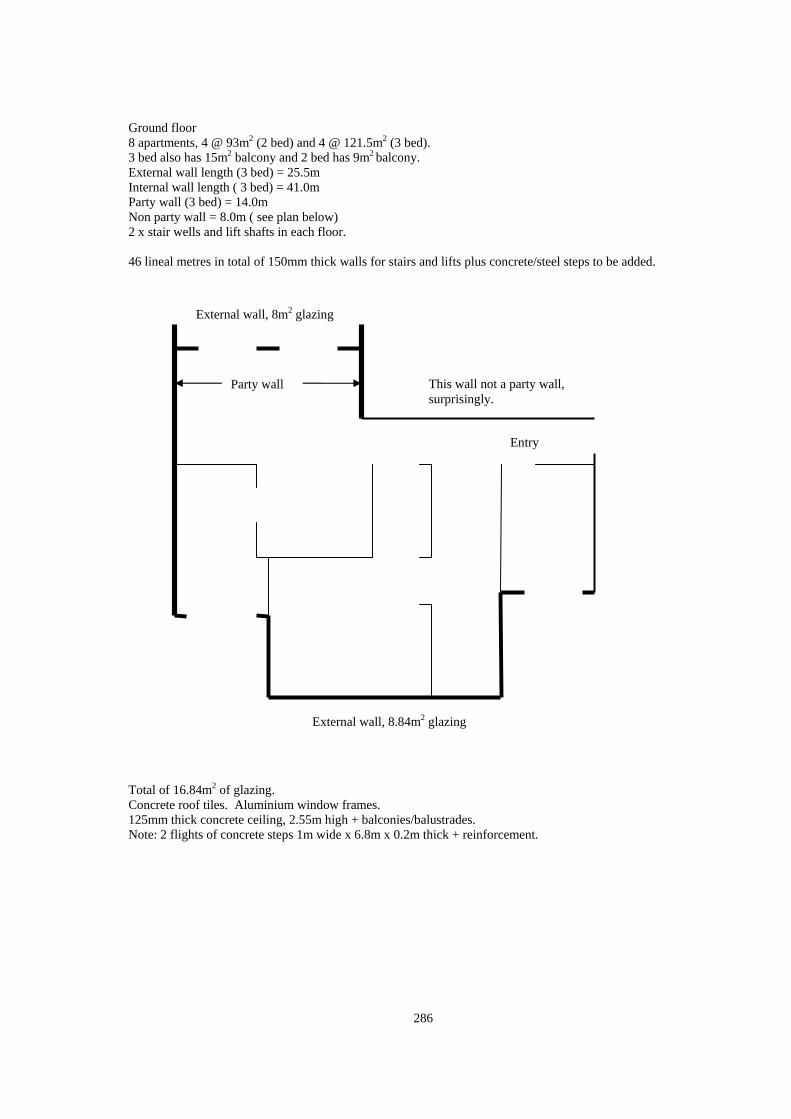
286
Ground floor 8 apartments, 4 @ 93m2 (2 bed) and 4 @ 121.5m2 (3 bed). 3 bed also has 15m2 balcony and 2 bed has 9m2 balcony. External wall length (3 bed) = 25.5m Internal wall length ( 3 bed) = 41.0m Party wall (3 bed) = 14.0m Non party wall = 8.0m ( see plan below) 2 x stair wells and lift shafts in each floor. 46 lineal metres in total of 150mm thick walls for stairs and lifts plus concrete/steel steps to be added.
Total of 16.84m2 of glazing. Concrete roof tiles. Aluminium window frames. 125mm thick concrete ceiling, 2.55m high + balconies/balustrades. Note: 2 flights of concrete steps 1m wide x 6.8m x 0.2m thick + reinforcement.
Entry
This wall not a party wall, surprisingly.
Party wall
External wall, 8.84m2 glazing
External wall, 8m2 glazing
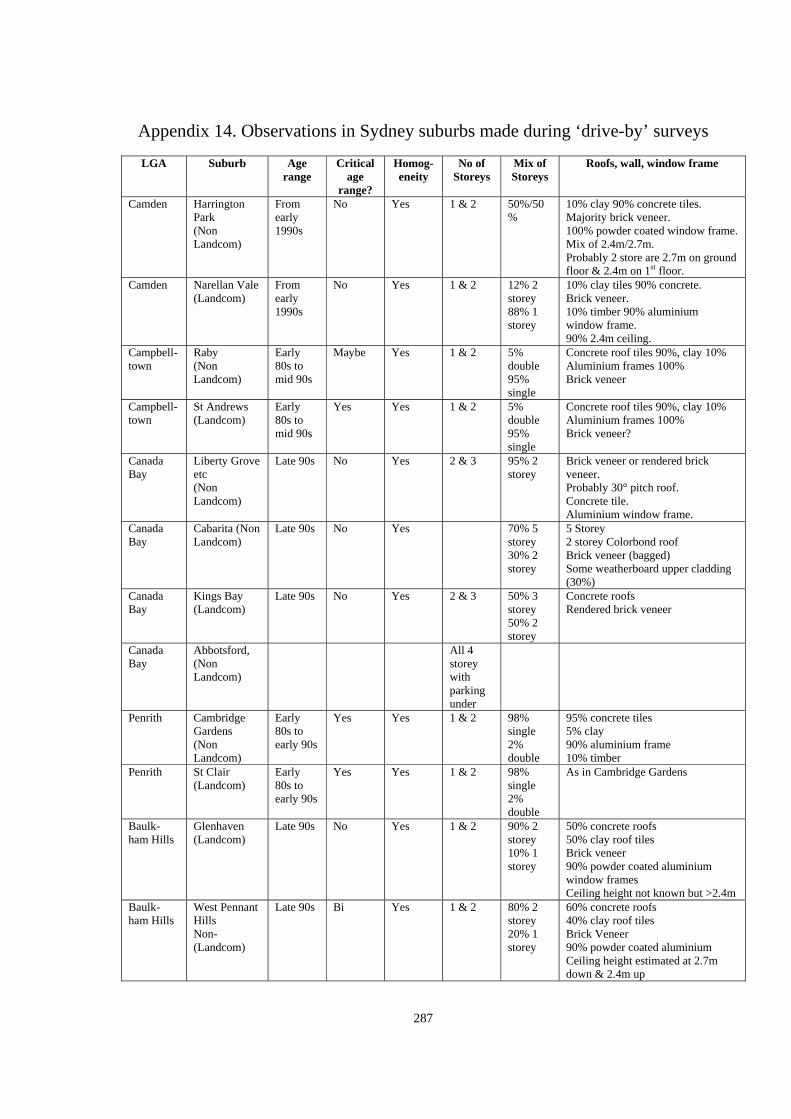
287
Appendix 14. Observations in Sydney suburbs made during ‘drive-by’ surveys
LGA Suburb Age range
Critical age
range?
Homog-eneity
No of Storeys
Mix of Storeys
Roofs, wall, window frame
Camden Harrington Park (Non Landcom)
From early 1990s
No Yes 1 & 2 50%/50%
10% clay 90% concrete tiles. Majority brick veneer. 100% powder coated window frame. Mix of 2.4m/2.7m. Probably 2 store are 2.7m on ground floor & 2.4m on 1st floor.
Camden Narellan Vale (Landcom)
From early 1990s
No Yes 1 & 2 12% 2 storey 88% 1 storey
10% clay tiles 90% concrete. Brick veneer. 10% timber 90% aluminium window frame. 90% 2.4m ceiling.
Campbell-town
Raby (Non Landcom)
Early 80s to mid 90s
Maybe Yes 1 & 2 5% double 95% single
Concrete roof tiles 90%, clay 10% Aluminium frames 100% Brick veneer
Campbell-town
St Andrews (Landcom)
Early 80s to mid 90s
Yes Yes 1 & 2 5% double 95% single
Concrete roof tiles 90%, clay 10% Aluminium frames 100% Brick veneer?
Canada Bay
Liberty Grove etc (Non Landcom)
Late 90s No Yes 2 & 3 95% 2 storey
Brick veneer or rendered brick veneer. Probably 30° pitch roof. Concrete tile. Aluminium window frame.
Canada Bay
Cabarita (Non Landcom)
Late 90s No Yes 70% 5 storey 30% 2 storey
5 Storey 2 storey Colorbond roof Brick veneer (bagged) Some weatherboard upper cladding (30%)
Canada Bay
Kings Bay (Landcom)
Late 90s No Yes 2 & 3 50% 3 storey 50% 2 storey
Concrete roofs Rendered brick veneer
Canada Bay
Abbotsford, (Non Landcom)
All 4 storey with parking under
Penrith Cambridge Gardens (Non Landcom)
Early 80s to early 90s
Yes Yes 1 & 2 98% single 2% double
95% concrete tiles 5% clay 90% aluminium frame 10% timber
Penrith
St Clair (Landcom)
Early 80s to early 90s
Yes Yes 1 & 2 98% single 2% double
As in Cambridge Gardens
Baulk-ham Hills
Glenhaven (Landcom)
Late 90s No Yes 1 & 2 90% 2 storey 10% 1 storey
50% concrete roofs 50% clay roof tiles Brick veneer 90% powder coated aluminium window frames Ceiling height not known but >2.4m
Baulk-ham Hills
West Pennant Hills Non-(Landcom)
Late 90s Bi Yes 1 & 2 80% 2 storey 20% 1 storey
60% concrete roofs 40% clay roof tiles Brick Veneer 90% powder coated aluminium Ceiling height estimated at 2.7m down & 2.4m up
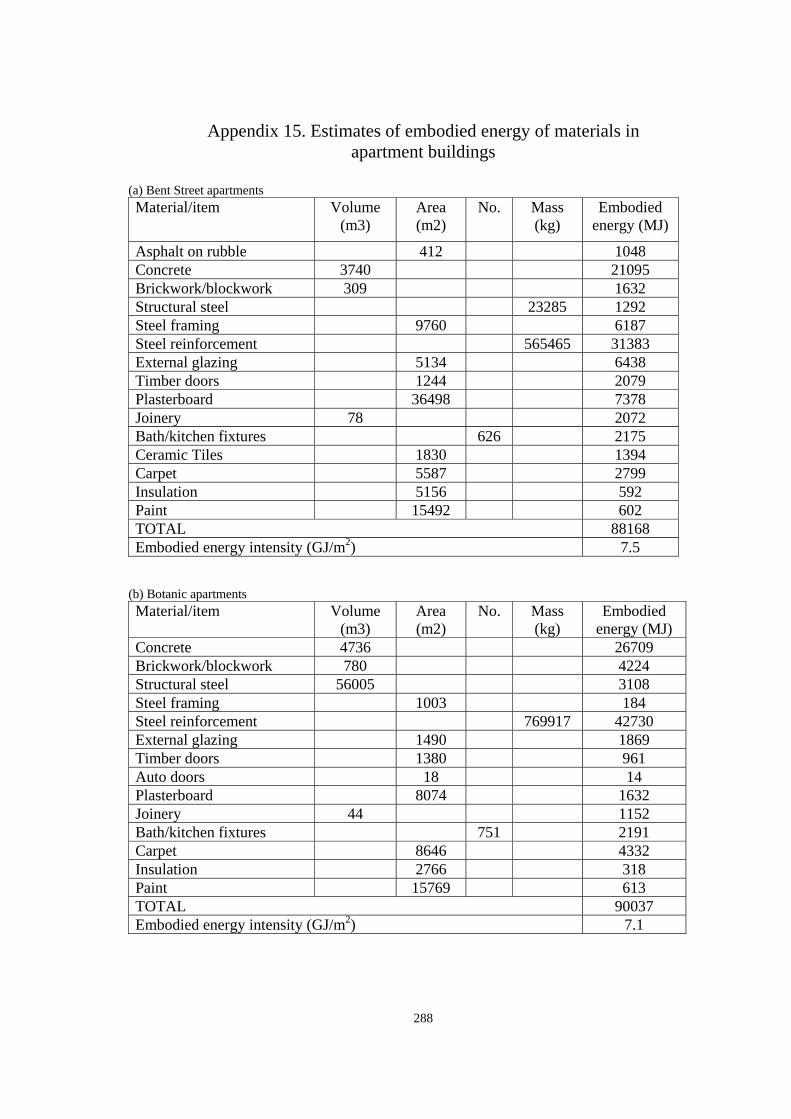
288
Appendix 15. Estimates of embodied energy of materials in apartment buildings
(a) Bent Street apartments Material/item Volume
(m3) Area (m2)
No. Mass (kg)
Embodied energy (MJ)
Asphalt on rubble 412 1048 Concrete 3740 21095 Brickwork/blockwork 309 1632 Structural steel 23285 1292 Steel framing 9760 6187 Steel reinforcement 565465 31383 External glazing 5134 6438 Timber doors 1244 2079 Plasterboard 36498 7378 Joinery 78 2072 Bath/kitchen fixtures 626 2175 Ceramic Tiles 1830 1394 Carpet 5587 2799 Insulation 5156 592 Paint 15492 602 TOTAL 88168 Embodied energy intensity (GJ/m2) 7.5
(b) Botanic apartments Material/item Volume
(m3) Area (m2)
No. Mass (kg)
Embodied energy (MJ)
Concrete 4736 26709 Brickwork/blockwork 780 4224 Structural steel 56005 3108 Steel framing 1003 184 Steel reinforcement 769917 42730 External glazing 1490 1869 Timber doors 1380 961 Auto doors 18 14 Plasterboard 8074 1632 Joinery 44 1152 Bath/kitchen fixtures 751 2191 Carpet 8646 4332 Insulation 2766 318 Paint 15769 613 TOTAL 90037 Embodied energy intensity (GJ/m2) 7.1
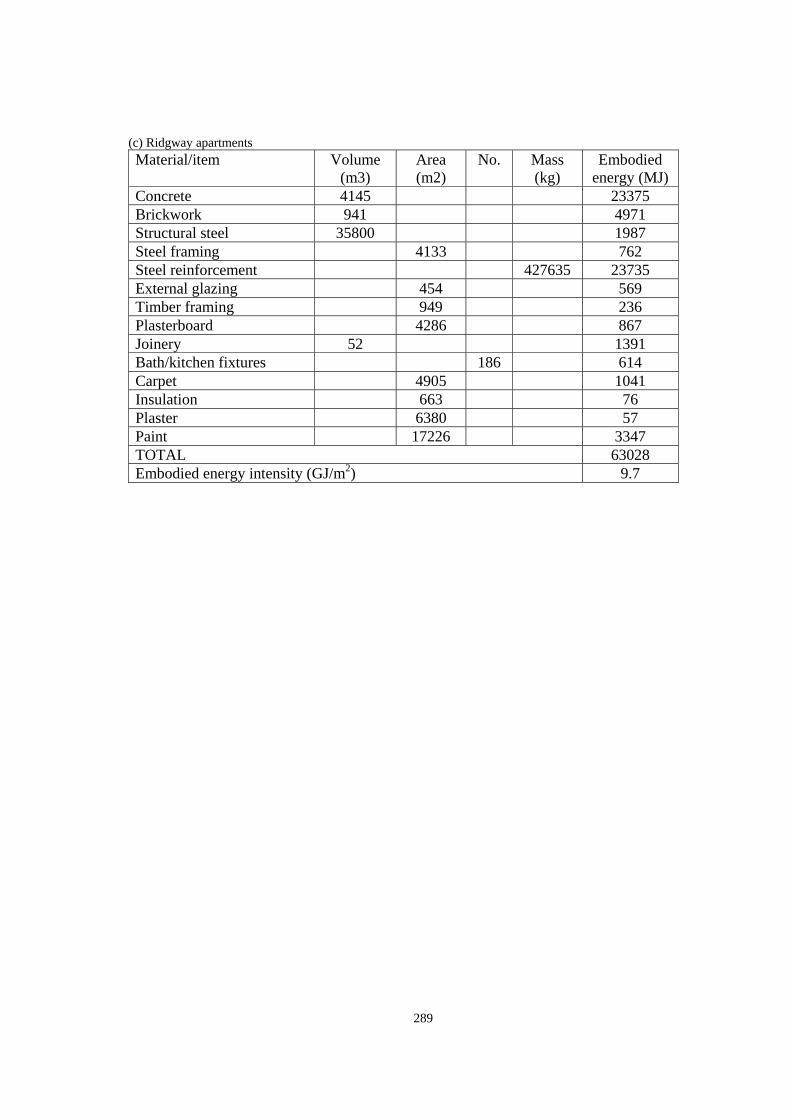
289
(c) Ridgway apartments Material/item Volume
(m3) Area (m2)
No. Mass (kg)
Embodied energy (MJ)
Concrete 4145 23375 Brickwork 941 4971 Structural steel 35800 1987 Steel framing 4133 762 Steel reinforcement 427635 23735 External glazing 454 569 Timber framing 949 236 Plasterboard 4286 867 Joinery 52 1391 Bath/kitchen fixtures 186 614 Carpet 4905 1041 Insulation 663 76 Plaster 6380 57 Paint 17226 3347 TOTAL 63028 Embodied energy intensity (GJ/m2) 9.7
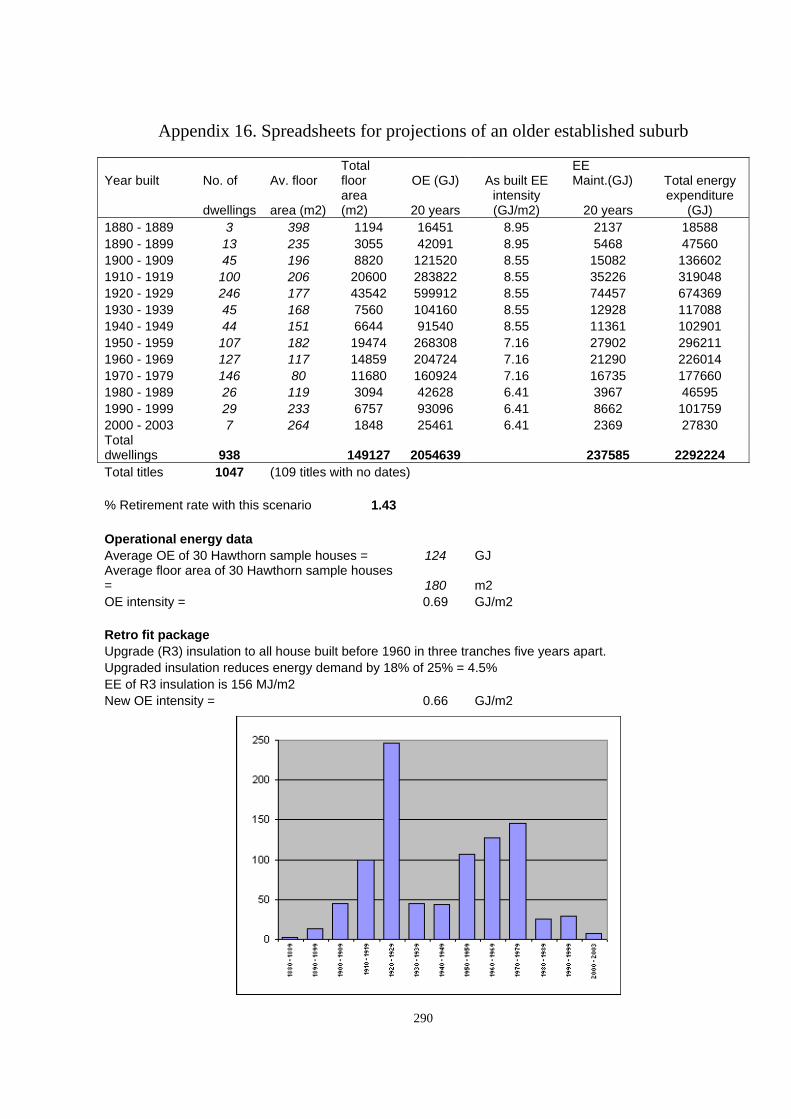
290
Appendix 16. Spreadsheets for projections of an older established suburb
Year built No. of Av. floor Total floor OE (GJ) As built EE
EE Maint.(GJ) Total energy
dwellings area (m2) area (m2) 20 years
intensity (GJ/m2) 20 years
expenditure (GJ)
1880 - 1889 3 398 1194 16451 8.95 2137 18588 1890 - 1899 13 235 3055 42091 8.95 5468 47560 1900 - 1909 45 196 8820 121520 8.55 15082 136602 1910 - 1919 100 206 20600 283822 8.55 35226 319048 1920 - 1929 246 177 43542 599912 8.55 74457 674369 1930 - 1939 45 168 7560 104160 8.55 12928 117088 1940 - 1949 44 151 6644 91540 8.55 11361 102901 1950 - 1959 107 182 19474 268308 7.16 27902 296211 1960 - 1969 127 117 14859 204724 7.16 21290 226014 1970 - 1979 146 80 11680 160924 7.16 16735 177660 1980 - 1989 26 119 3094 42628 6.41 3967 46595 1990 - 1999 29 233 6757 93096 6.41 8662 101759 2000 - 2003 7 264 1848 25461 6.41 2369 27830 Total dwellings 938 149127 2054639 237585 2292224 Total titles 1047 (109 titles with no dates) % Retirement rate with this scenario 1.43 Operational energy data Average OE of 30 Hawthorn sample houses = 124 GJ Average floor area of 30 Hawthorn sample houses = 180 m2 OE intensity = 0.69 GJ/m2 Retro fit package Upgrade (R3) insulation to all house built before 1960 in three tranches five years apart. Upgraded insulation reduces energy demand by 18% of 25% = 4.5% EE of R3 insulation is 156 MJ/m2 New OE intensity = 0.66 GJ/m2
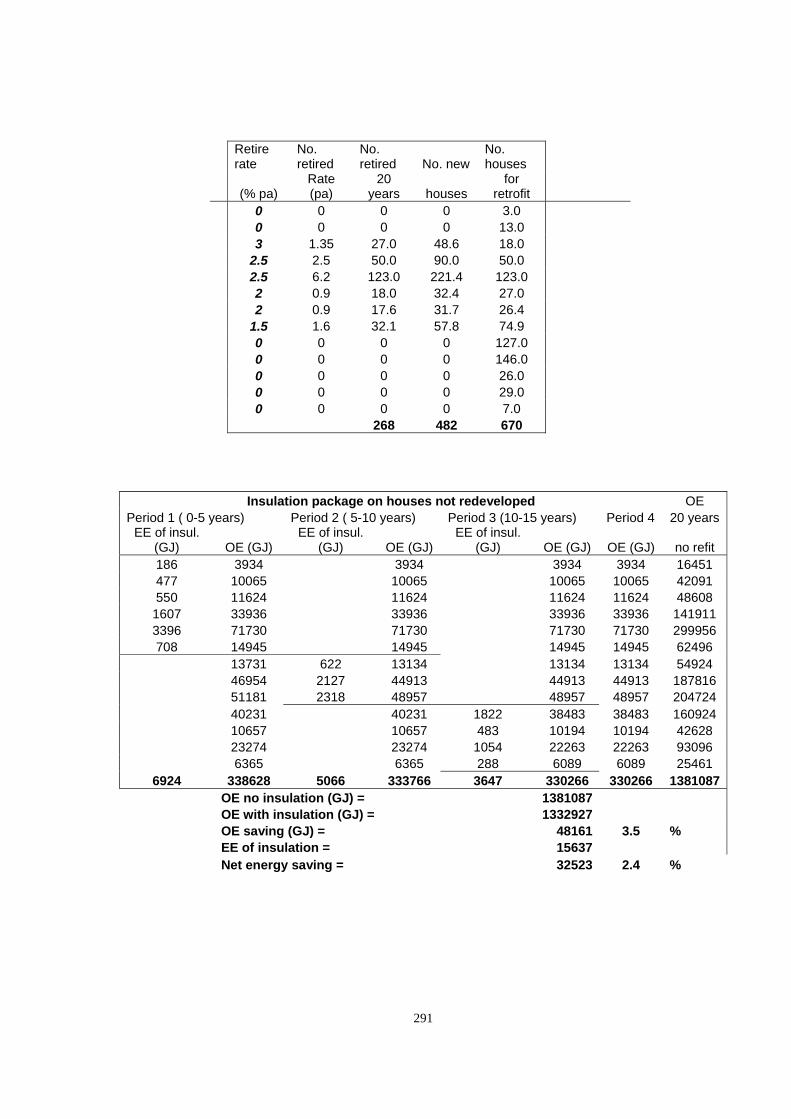
291
Retire rate
No. retired
No. retired No. new
No. houses
(% pa) Rate (pa)
20 years houses
for retrofit
0 0 0 0 3.0 0 0 0 0 13.0 3 1.35 27.0 48.6 18.0 2.5 2.5 50.0 90.0 50.0 2.5 6.2 123.0 221.4 123.0 2 0.9 18.0 32.4 27.0 2 0.9 17.6 31.7 26.4 1.5 1.6 32.1 57.8 74.9 0 0 0 0 127.0 0 0 0 0 146.0 0 0 0 0 26.0 0 0 0 0 29.0 0 0 0 0 7.0 268 482 670
Insulation package on houses not redeveloped OE Period 1 ( 0-5 years) Period 2 ( 5-10 years) Period 3 (10-15 years) Period 4 20 years
EE of insul. (GJ) OE (GJ)
EE of insul. (GJ) OE (GJ)
EE of insul. (GJ) OE (GJ) OE (GJ) no refit
186 3934 3934 3934 3934 16451 477 10065 10065 10065 10065 42091 550 11624 11624 11624 11624 48608 1607 33936 33936 33936 33936 141911 3396 71730 71730 71730 71730 299956 708 14945 14945 14945 14945 62496
13731 622 13134 13134 13134 54924 46954 2127 44913 44913 44913 187816 51181 2318 48957 48957 48957 204724 40231 40231 1822 38483 38483 160924 10657 10657 483 10194 10194 42628 23274 23274 1054 22263 22263 93096 6365 6365 288 6089 6089 25461
6924 338628 5066 333766 3647 330266 330266 1381087 OE no insulation (GJ) = 1381087 OE with insulation (GJ) = 1332927 OE saving (GJ) = 48161 3.5 % EE of insulation = 15637 Net energy saving = 32523 2.4 %
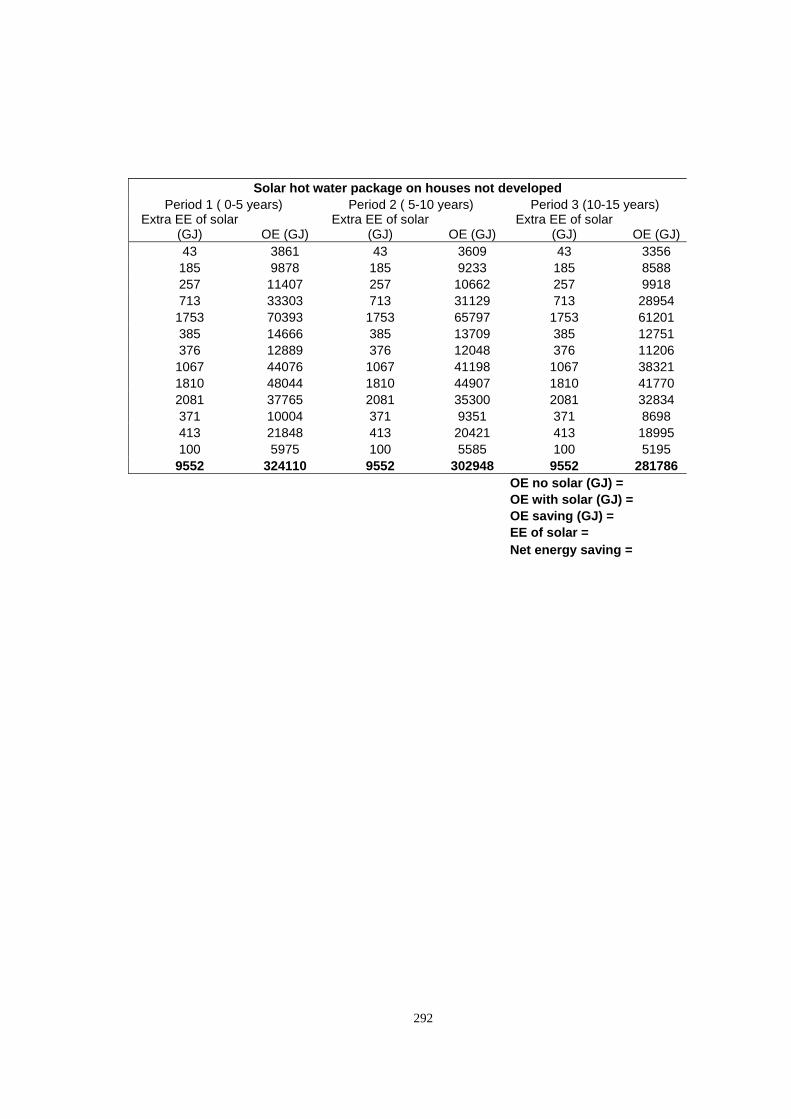
292
Solar hot water package on houses not developed
Period 1 ( 0-5 years) Period 2 ( 5-10 years) Period 3 (10-15 years) Extra EE of solar
(GJ) OE (GJ) Extra EE of solar
(GJ) OE (GJ)Extra EE of solar
(GJ) OE (GJ)43 3861 43 3609 43 3356 185 9878 185 9233 185 8588 257 11407 257 10662 257 9918 713 33303 713 31129 713 28954
1753 70393 1753 65797 1753 61201 385 14666 385 13709 385 12751 376 12889 376 12048 376 11206
1067 44076 1067 41198 1067 38321 1810 48044 1810 44907 1810 41770 2081 37765 2081 35300 2081 32834 371 10004 371 9351 371 8698 413 21848 413 20421 413 18995 100 5975 100 5585 100 5195
9552 324110 9552 302948 9552 281786 OE no solar (GJ) = OE with solar (GJ) = OE saving (GJ) = EE of solar = Net energy saving =
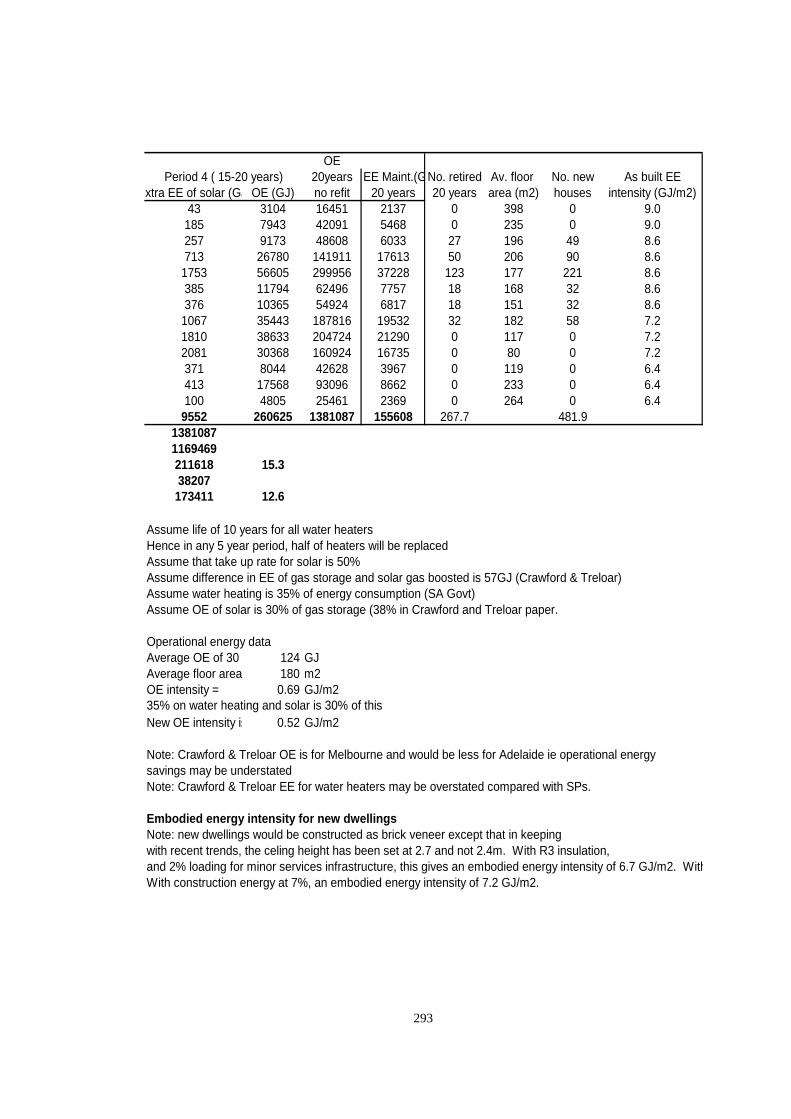
293
OE20years EE Maint.(GNo. retired Av. floor No. new As built EE
xtra EE of solar (GJ OE (GJ) no refit 20 years 20 years area (m2) houses intensity (GJ/m2)43 3104 16451 2137 0 398 0 9.0185 7943 42091 5468 0 235 0 9.0257 9173 48608 6033 27 196 49 8.6713 26780 141911 17613 50 206 90 8.6
1753 56605 299956 37228 123 177 221 8.6385 11794 62496 7757 18 168 32 8.6376 10365 54924 6817 18 151 32 8.6
1067 35443 187816 19532 32 182 58 7.21810 38633 204724 21290 0 117 0 7.22081 30368 160924 16735 0 80 0 7.2371 8044 42628 3967 0 119 0 6.4413 17568 93096 8662 0 233 0 6.4100 4805 25461 2369 0 264 0 6.4
9552 260625 1381087 155608 267.7 481.913810871169469211618 15.338207173411 12.6
Assume life of 10 years for all water heatersHence in any 5 year period, half of heaters will be replacedAssume that take up rate for solar is 50%Assume difference in EE of gas storage and solar gas boosted is 57GJ (Crawford & Treloar)Assume water heating is 35% of energy consumption (SA Govt)Assume OE of solar is 30% of gas storage (38% in Crawford and Treloar paper.
Operational energy dataAverage OE of 30 124 GJAverage floor area 180 m2OE intensity = 0.69 GJ/m235% on water heating and solar is 30% of thisNew OE intensity is 0.52 GJ/m2
Note: Crawford & Treloar OE is for Melbourne and would be less for Adelaide ie operational energy savings may be understatedNote: Crawford & Treloar EE for water heaters may be overstated compared with SPs.
Embodied energy intensity for new dwellingsNote: new dwellings would be constructed as brick veneer except that in keeping with recent trends, the celing height has been set at 2.7 and not 2.4m. With R3 insulation,and 2% loading for minor services infrastructure, this gives an embodied energy intensity of 6.7 GJ/m2. WithWith construction energy at 7%, an embodied energy intensity of 7.2 GJ/m2.
Period 4 ( 15-20 years)
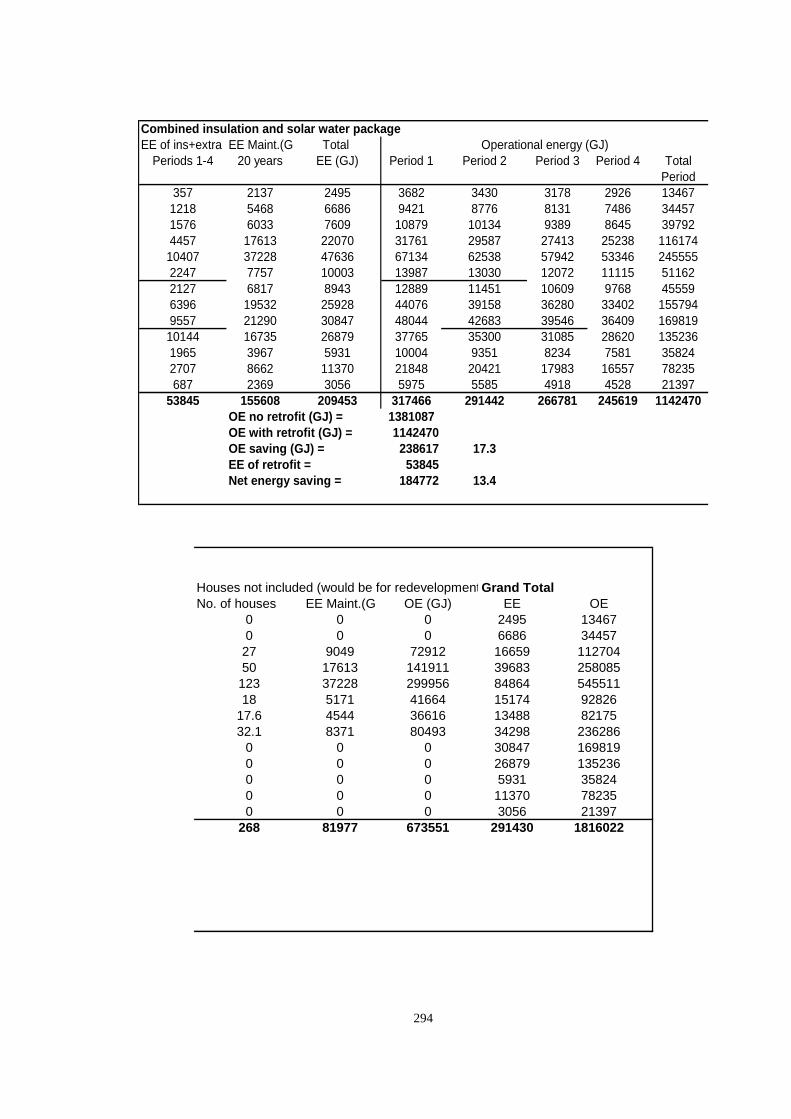
294
Combined insulation and solar water packageEE of ins+extra sEE Maint.(G Total
Periods 1-4 20 years EE (GJ) Period 1 Period 2 Period 3 Period 4 TotalPeriod
357 2137 2495 3682 3430 3178 2926 134671218 5468 6686 9421 8776 8131 7486 344571576 6033 7609 10879 10134 9389 8645 397924457 17613 22070 31761 29587 27413 25238 11617410407 37228 47636 67134 62538 57942 53346 2455552247 7757 10003 13987 13030 12072 11115 511622127 6817 8943 12889 11451 10609 9768 455596396 19532 25928 44076 39158 36280 33402 1557949557 21290 30847 48044 42683 39546 36409 16981910144 16735 26879 37765 35300 31085 28620 1352361965 3967 5931 10004 9351 8234 7581 358242707 8662 11370 21848 20421 17983 16557 78235687 2369 3056 5975 5585 4918 4528 21397
53845 155608 209453 317466 291442 266781 245619 1142470OE no retrofit (GJ) = 1381087OE with retrofit (GJ) = 1142470OE saving (GJ) = 238617 17.3EE of retrofit = 53845Net energy saving = 184772 13.4
Operational energy (GJ)
Houses not included (would be for redevelopmentGrand Total No. of houses EE Maint.(G OE (GJ) EE OE
0 0 0 2495 134670 0 0 6686 34457
27 9049 72912 16659 11270450 17613 141911 39683 258085
123 37228 299956 84864 54551118 5171 41664 15174 92826
17.6 4544 36616 13488 8217532.1 8371 80493 34298 236286
0 0 0 30847 1698190 0 0 26879 1352360 0 0 5931 358240 0 0 11370 782350 0 0 3056 21397
268 81977 673551 291430 1816022
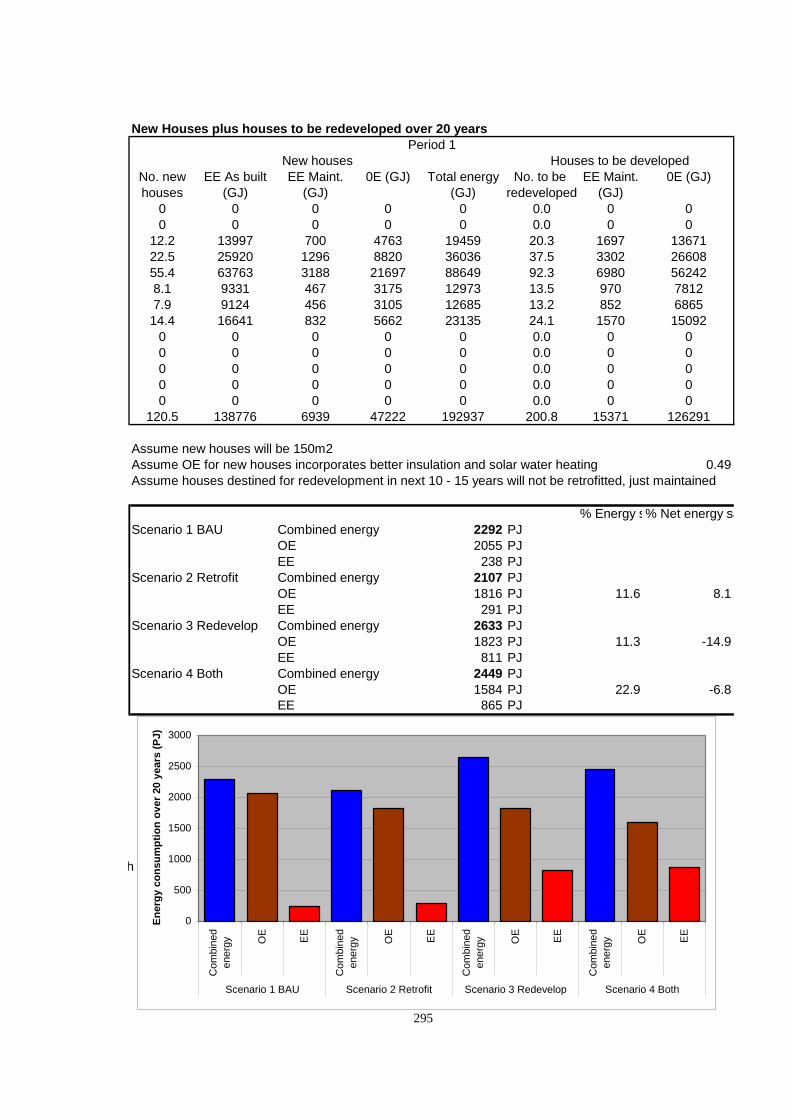
295
New Houses plus houses to be redeveloped over 20 years
No. new EE As built EE Maint. 0E (GJ) Total energy No. to be EE Maint. 0E (GJ)houses (GJ) (GJ) (GJ) redeveloped (GJ)
0 0 0 0 0 0.0 0 00 0 0 0 0 0.0 0 0
12.2 13997 700 4763 19459 20.3 1697 1367122.5 25920 1296 8820 36036 37.5 3302 2660855.4 63763 3188 21697 88649 92.3 6980 562428.1 9331 467 3175 12973 13.5 970 78127.9 9124 456 3105 12685 13.2 852 686514.4 16641 832 5662 23135 24.1 1570 15092
0 0 0 0 0 0.0 0 00 0 0 0 0 0.0 0 00 0 0 0 0 0.0 0 00 0 0 0 0 0.0 0 00 0 0 0 0 0.0 0 0
120.5 138776 6939 47222 192937 200.8 15371 126291
Assume new houses will be 150m2Assume OE for new houses incorporates better insulation and solar water heating 0.49Assume houses destined for redevelopment in next 10 - 15 years will not be retrofitted, just maintained
% Energy s% Net energy saScenario 1 BAU Combined energy 2292 PJ
OE 2055 PJEE 238 PJ
Scenario 2 Retrofit Combined energy 2107 PJOE 1816 PJ 11.6 8.1EE 291 PJ
Scenario 3 Redevelop Combined energy 2633 PJOE 1823 PJ 11.3 -14.9EE 811 PJ
Scenario 4 Both Combined energy 2449 PJOE 1584 PJ 22.9 -6.8EE 865 PJ
h construction energy at 7%, an
New houses Houses to be developedPeriod 1
0
500
1000
1500
2000
2500
3000
Com
bine
den
ergy O
E
EE
Com
bine
den
ergy O
E
EE
Com
bine
den
ergy O
E
EE
Com
bine
den
ergy O
E
EE
Scenario 1 BAU Scenario 2 Retrofit Scenario 3 Redevelop Scenario 4 Both
Ener
gy c
onsu
mpt
ion
over
20
year
s (P
J)
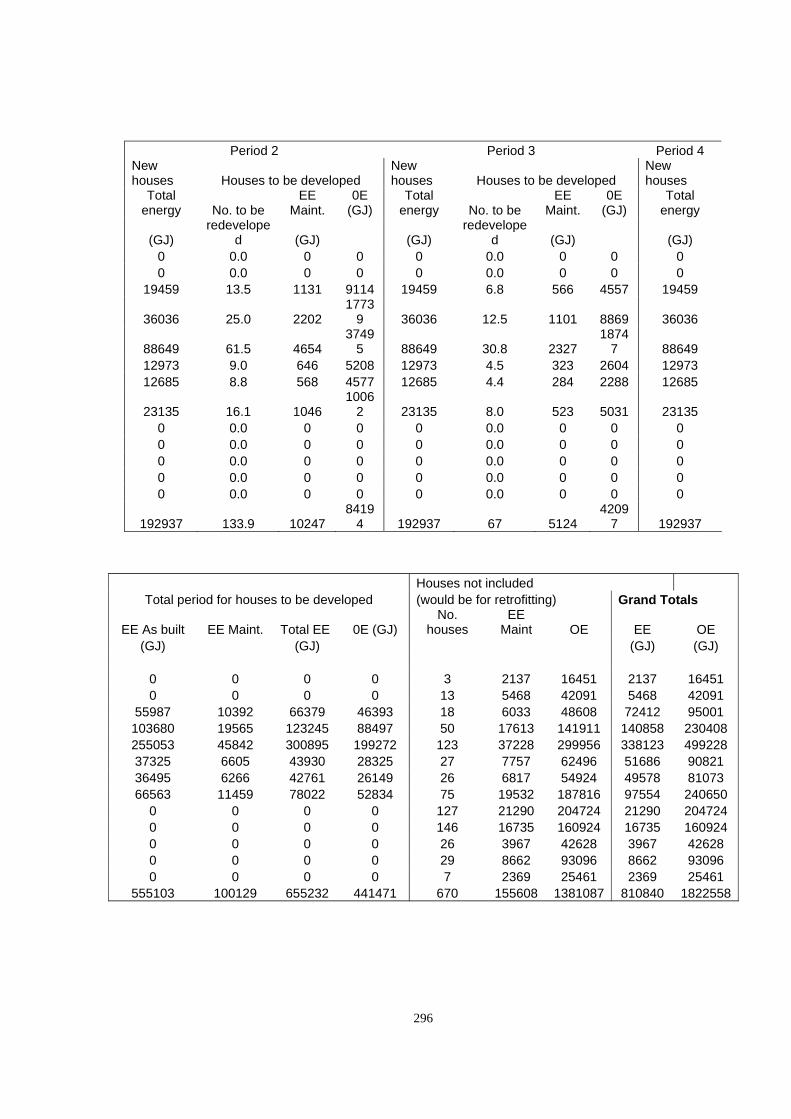
296
Period 2 Period 3 Period 4
New houses Houses to be developed
New houses Houses to be developed
New houses
Total energy No. to be
EE Maint.
0E (GJ)
Total energy No. to be
EE Maint.
0E (GJ)
Total energy
(GJ) redevelope
d (GJ) (GJ) redevelope
d (GJ) (GJ) 0 0.0 0 0 0 0.0 0 0 0 0 0.0 0 0 0 0.0 0 0 0
19459 13.5 1131 9114 19459 6.8 566 4557 19459
36036 25.0 2202 1773
9 36036 12.5 1101 8869 36036
88649 61.5 4654 3749
5 88649 30.8 2327 1874
7 88649 12973 9.0 646 5208 12973 4.5 323 2604 12973 12685 8.8 568 4577 12685 4.4 284 2288 12685
23135 16.1 1046 1006
2 23135 8.0 523 5031 23135 0 0.0 0 0 0 0.0 0 0 0 0 0.0 0 0 0 0.0 0 0 0 0 0.0 0 0 0 0.0 0 0 0 0 0.0 0 0 0 0.0 0 0 0 0 0.0 0 0 0 0.0 0 0 0
192937 133.9 10247 8419
4 192937 67 5124 4209
7 192937
Houses not included Total period for houses to be developed (would be for retrofitting) Grand Totals
EE As built EE Maint. Total EE 0E (GJ) No.
houses EE
Maint OE EE OE (GJ) (GJ) (GJ) (GJ)
0 0 0 0 3 2137 16451 2137 16451 0 0 0 0 13 5468 42091 5468 42091
55987 10392 66379 46393 18 6033 48608 72412 95001 103680 19565 123245 88497 50 17613 141911 140858 230408 255053 45842 300895 199272 123 37228 299956 338123 499228 37325 6605 43930 28325 27 7757 62496 51686 90821 36495 6266 42761 26149 26 6817 54924 49578 81073 66563 11459 78022 52834 75 19532 187816 97554 240650
0 0 0 0 127 21290 204724 21290 204724 0 0 0 0 146 16735 160924 16735 160924 0 0 0 0 26 3967 42628 3967 42628 0 0 0 0 29 8662 93096 8662 93096 0 0 0 0 7 2369 25461 2369 25461
555103 100129 655232 441471 670 155608 1381087 810840 1822558
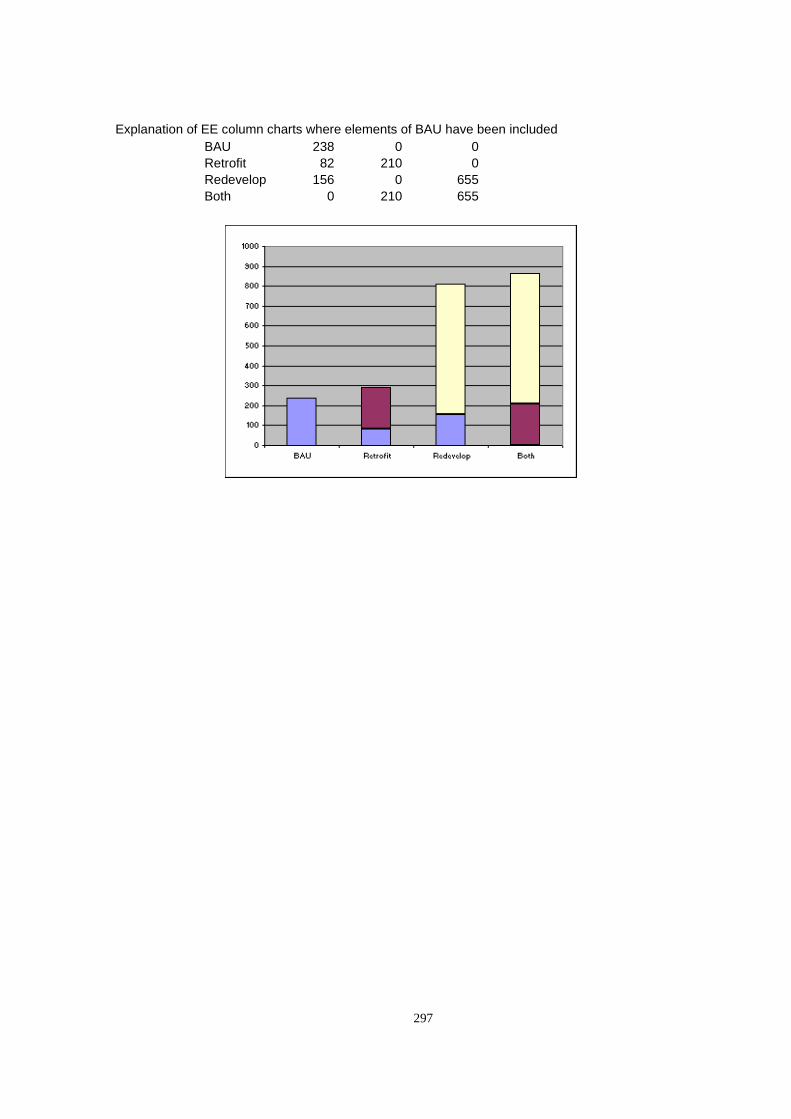
297
Explanation of EE column charts where elements of BAU have been included BAU 238 0 0 Retrofit 82 210 0 Redevelop 156 0 655 Both 0 210 655