Embed Size (px)
Citation preview

DMD # 81539
1
Complete substrate inhibition of cytochrome P450 2C8 by AZD9496,
an oral selective estrogen receptor degrader
Tashinga E. Bapiro, Andy Sykes, Scott Martin, Michael Davies, James W. T. Yates, Matthias
Hoch, Helen E. Rollison and Barry Jones
Oncology, IMED Biotech Unit, AstraZeneca, Cambridge, UK (T.E.B, A.S, S.M, M.D,
J.W.T.Y, B.J)
Quantitative Clinical Pharmacology, Early Clinical Development, IMED Biotech Unit,
AstraZeneca, Cambridge, UK (M.H)
Drug Safety and Metabolism, IMED Biotech Unit, AstraZeneca, Cambridge, UK (H.E.R)
This article has not been copyedited and formatted. The final version may differ from this version.DMD Fast Forward. Published on June 19, 2018 as DOI: 10.1124/dmd.118.081539
at ASPE
T Journals on M
arch 26, 2020dm
d.aspetjournals.orgD
ownloaded from

DMD # 81539
2
Running title: Complete substrate inhibition of CYP2C8 by AZD9496
Corresponding Author:
Dr. Tashinga E. Bapiro
Oncology IMED Biotech Unit, AstraZeneca
Hodgkin Building c/o B310, Cambridge Science Park, Milton Road, Cambridge
CB4 0WG, UK
Email: [email protected]
Phone: +44 1625237218
Word count
Number of text pages: 31
Number of tables: 2
Number of figures: 8
Number of references: 33
Number of words in abstract: 241
Number of words in introduction: 744
Number of words in discussion: 1325
Abbreviations: AQN, amodiaquine; AUC, Area under the concentration time curve; CLint, Intrinsic
clearance; CYP, Cytochrome P450; ER, estrogen receptor; HLM, Human liver microsomes; Ki,
Inhibitor constant; Km, Michaelis constant; M-M, Michaelis-Menten; rCYP, recombinant cytochrome
P450; SERD selective estrogen receptor degrader
This article has not been copyedited and formatted. The final version may differ from this version.DMD Fast Forward. Published on June 19, 2018 as DOI: 10.1124/dmd.118.081539
at ASPE
T Journals on M
arch 26, 2020dm
d.aspetjournals.orgD
ownloaded from

DMD # 81539
3
Abstract
AZD9496 is an oral selective estrogen receptor degrader currently in clinical development for
treatment of estrogen receptor positive breast cancer. In a first-in-human Phase 1 study,
AZD9496 exhibited dose non-linear pharmacokinetics whose mechanistic basis was
investigated in this study. The metabolism kinetics of AZD9496 were studied using human
liver microsomes (HLM), recombinant cytochrome P450s (rCYPs) and hepatocytes. In
addition, modelling approaches were used to gain further mechanistic insights. CYP2C8 was
predominantly responsible for biotransformation of AZD9496 to its two main metabolites
whose rate of formation with increasing AZD9496 concentrations exhibited complete
substrate inhibition in HLM, rCYP2C8 and hepatocytes. Total inhibition by AZD9496 of
amodiaquine N-deethylation, a specific probe of CYP2C8 activity confirmed the
completeness of this inhibition. The commonly used substrate inhibition model analogous to
uncompetitive inhibition, fitted poorly to the data. However, using the same model but
without constraints on the number of molecules occupying the inhibitory binding site (i.e.
nS1ES) provided a significantly better fit (F test, P<0.005). With the improved model, up to
three AZD9496 molecules were predicted to bind the inhibitory site of CYP2C8. In contrast
to previous studies showing substrate inhibition of CYPs to be partial, our results demonstrate
complete substrate inhibition of CYP2C8 via binding of more than one molecule of
AZD9496 to the inhibitory site. As CYP2C8 appears to be the sole isoform catalysing
formation of the main metabolites, the substrate inhibition might explain the observed dose
non-linearity in the clinic at higher doses.
This article has not been copyedited and formatted. The final version may differ from this version.DMD Fast Forward. Published on June 19, 2018 as DOI: 10.1124/dmd.118.081539
at ASPE
T Journals on M
arch 26, 2020dm
d.aspetjournals.orgD
ownloaded from

DMD # 81539
4
Introduction
The cytochrome P450 (CYP) superfamily of enzymes is one of the best characterised enzyme
systems with a diverse list of substrates that includes over 75% of currently used drugs whose
pharmacokinetics they may thus impact (Rendic and Guengerich, 2015). The utility of the
drug-CYP interaction knowledge such as avoidance of drug combinations likely to cause
adverse effects due to altered pharmacokinetics is now well documented (Pelkonen et al.,
2005). Indeed potential drug-CYP interaction studies are an important part of modern drug
development programs and one of the aims of such studies is to provide an understanding of
the kinetics of metabolism which in turn can be used to predict the clearance (Obach et al.,
1997; Obach and Reed-Hagen, 2002).
The rates of most CYP-catalysed reactions can be described by the Michaelis-Menten (M-M)
model in which the rate of product formation increases with increasing substrate
concentration to a maximum (Venkatakrishnan et al., 2001). The key kinetic parameters Km
and Vmax can be determined in vitro (Houston, 1994), however, the data needs to be carefully
examined to ascertain whether fitting to the M-M equation provides the best estimates of the
parameters. For some CYP-catalysed reactions, the apparent maximum rate of product
formation is not maintained with further increase in substrate but decreases due to enzyme
inhibition by the substrate itself (Spracklin et al., 1997; Tang et al., 2000).
Substrate inhibition of CYPs is generally considered partial and not complete as product
formation, although reduced, remains measurable with increasing substrate concentration
(Tang et al., 2000; Lin et al., 2001). The basis for substrate inhibition of CYPs is generally
thought to involve binding to a productive and inhibitory site (Korzekwa et al., 1998) with
binding to the inhibitory site thought to cause a conformational change that affects binding to
This article has not been copyedited and formatted. The final version may differ from this version.DMD Fast Forward. Published on June 19, 2018 as DOI: 10.1124/dmd.118.081539
at ASPE
T Journals on M
arch 26, 2020dm
d.aspetjournals.orgD
ownloaded from

DMD # 81539
5
the productive site (Williams et al., 2004). For CYPs that have large active sites, it is not
inconceivable for both sites to be located in close proximity within the active site with
possible steric interactions between substrate molecules modifying reaction rates (Lin et al.,
2001; Torimoto et al., 2003). Indeed non-M-M kinetics have been rationalised on the basis of
simultaneous binding of multiple ligands within active sites (Atkins, 2005). CYPs with large-
enough active sites relative to their substrates, would likely figure in such interactions and
include CYPs 3A4 and 2C8 (Ma et al., 2017).
CYP2C8 is a CYP2C subfamily member that metabolises about 5% of therapeutic drugs
(Rendic and Guengerich, 2015) with most of the substrates possessing an anionic moiety
(Totah and Rettie, 2005). The first crystal structure of CYP2C8 showed a relatively large
active site (Schoch et al., 2004) and additional crystal structures of the enzyme bound to
different substrates showed the active site to be T- or Y- shaped (reviewed by (Gay et al.,
2010). The size and shape of the CYP2C8 structure seem to allow compounds to adopt
different orientations that can impact the rate of metabolism (Ma et al., 2017). Additionally,
more than one molecule of a compound can fit in the active site (Schoch et al., 2008) making
it possible for interactions involving molecules of the same substrate to modify reaction rates.
AZD9496 (Fig 1A) is an oral non-steroidal selective estrogen receptor (ER) degrader (SERD)
currently in clinical development for treatment of ER-positive breast cancer (De Savi et al.,
2015; Weir et al., 2016). A Phase 1 study showed AZD9496 to be metabolised to two main
metabolites M3 and M5 (Fig 1B) detected in plasma (Hamilton et al., 2018). The area under
the concentration-time curve (AUC) of AZD9496 increased in reasonable proportion to
increasing AZD9496 following single doses from 20 to 400mg. However, a more than dose-
proportional increase in AUC and Cmax was observed following a single dose of 600 mg. The
more than dose-proportional increase in AUC at the single 600 mg dose was diminished after
multiple doses that correlated with an over-proportional increase in the 4β-
This article has not been copyedited and formatted. The final version may differ from this version.DMD Fast Forward. Published on June 19, 2018 as DOI: 10.1124/dmd.118.081539
at ASPE
T Journals on M
arch 26, 2020dm
d.aspetjournals.orgD
ownloaded from

DMD # 81539
6
hydroxycholesterol to cholesterol ratio. The possible contribution of substrate inhibition to
the dose non-linear pharmacokinetics of AZD9496 was therefore, investigated in this study.
In contrast to previous reports on substrate inhibition of CYPs being partial (Lin et al., 2001),
complete substrate inhibition of CYP2C8 by AZD9496 was observed in vitro. Modelling of
the inhibition kinetics suggested a mechanism that involves binding of at least two molecules
of AZD9496 to an inhibitor site. Additionally, amodiaquine deethylation, a high affinity
probe of CYP2C8 activity in vitro (Li et al., 2002) was used to confirm the completeness of
the inhibition.
This article has not been copyedited and formatted. The final version may differ from this version.DMD Fast Forward. Published on June 19, 2018 as DOI: 10.1124/dmd.118.081539
at ASPE
T Journals on M
arch 26, 2020dm
d.aspetjournals.orgD
ownloaded from
DMD # 81539
7
Materials and Methods
Chemicals and reagents
AZD9496 and its metabolites M3 and M5 (Fig 1B) were synthesised in-house at AstraZeneca
(De Savi et al., 2015). Amodiaquine hydrochloride, desethylamodiaquine, reduced
nicotinamide adenine dinucleotide phosphate (NADPH) and rifampicin were purchased from
Sigma-Aldrich (Poole, UK). Cryopreserved human hepatocytes, pool of 10 male and female
donors were purchased from Bioreclamation IVT (Baltimore, MD, USA). Pooled human liver
microsomes (HLM), ultra-pool of 150 male and female donors (catalog No. 452117), was
obtained from Corning (Woburn MA, USA). Male and female individual donor HLMs were
obtained from Corning (Woburn MA, USA). Recombinant CYP2C8 and control insect cell
microsomes were purchased from Corning (Woburn MA, USA). All rCYPs were obtained
from Corning (Woburn MA, USA). Methanol and acetonitrile were obtained from Thermo
Fisher Scientific (Hemel Hempstead, UK). Lebovitz media was purchased from Life
Technologies (Hemel Hempstead, UK). Cryopreserved HepaRG cells, HepaRG media
supplements, CYP2C8-specific primer and probe mix, Dulbecco’s Phosphate-buffered Saline
and Williams’ Media E were purchased from Thermo Fisher Scientific (Carlsbad, CA, USA).
Fastlane Cell Multiplex NR kit was purchased from Qiagen (Manchester, UK). GAPDH-
specific primer and probe mix was purchased from Eurogentec (Liege, Belgium).
Incubation conditions for recombinant human CYPs and HLM
The reaction mixture consisted of the appropriate amount of enzyme, potassium phosphate
buffer pH 7.4 (final concentration 0.1 M), NADPH (final concentration 1 mM), appropriate
concentration of compound (AZD9496 or amodiaquine). After a pre-incubation period of 5
minutes at 37oC, the reaction was started by adding NADPH followed by incubation for the
appropriate time. The reaction was stopped using ice-cold acetonitrile (100%, v/v) containing
This article has not been copyedited and formatted. The final version may differ from this version.DMD Fast Forward. Published on June 19, 2018 as DOI: 10.1124/dmd.118.081539
at ASPE
T Journals on M
arch 26, 2020dm
d.aspetjournals.orgD
ownloaded from

DMD # 81539
8
a different AZ compound as internal standard. The mixture was centrifuged at 3000 x g, 4oC
for 10 minutes and the supernatant was transferred to a clean 96-well plate for injection into
the mass spectrometer.
Substrate inhibition kinetics
Linearity of formation of the metabolites M3 and M5 was established with respect to protein
concentration (HLM and r CYP2C8) and time. The incubation times were 20 and 30 minutes
for HLM and rCYP2C8, respectively. The reaction rate with increasing concentrations of
AZD9496 (0.05 to 200 µM) was determined as described above (incubation conditions for
recombinant human CYPs and HLM). Standard curves were prepared by adding known
concentrations (5 nM – 1000 nM) of M3 and M5 to reaction mixtures (without AZD9496 or
NADPH) and the samples were processed for analysis by mass spectrometry as stated above.
Recombinant human CYP screen for formation of M3 and M5
A total of nine recombinant human CYP isoforms were screened for their contribution to
formation of the major metabolites of AZD9496, M3 and M5. Each rCYP (20 pmols) was
incubated with 2 µM of AZD9496 for 25 min at 37oC. No standard curves were prepared and
the amounts of M3 and M5 formed were expressed as the ratio of peak area of metabolite/
peak area of internal standard.
Effect of AZD9496 on amodiaquine deethylation
The effect of AZD9496 on amodiaquine deethylation was determined by adding AZD9496
(final concentration 100 µM) and amodiaquine (final concentration 50 µM) to the reaction
mixture. Control experiments were included in which NADPH was added after stopping the
reaction using ice-cold acetonitrile containing internal standard. The amount of
This article has not been copyedited and formatted. The final version may differ from this version.DMD Fast Forward. Published on June 19, 2018 as DOI: 10.1124/dmd.118.081539
at ASPE
T Journals on M
arch 26, 2020dm
d.aspetjournals.orgD
ownloaded from

DMD # 81539
9
desethylamodiaquine was quantified as the response ratio (peak area of desethylamodiaquine:
peak area of internal standard).
Intrinsic clearance of AZD9496 and amodiaquine
Amodiaquine and AZD9496 were incubated separately at a final concentration of 1 µM with
human liver microsomes from 8 different donors (final concentration of 1 mg/ml HLM). The
reaction was started by adding NADPH and aliquots were taken at 0, 2, 4, 6, 8 and 10
minutes for amodiaquine and at 0, 5, 10, 20 , 40 and 60 minutes for AZD9496 and added to
acetonitrile (100% v/v, containing internal standard). The amount of amodiaquine or
AZD9496 remaining (peak area: peak area of internal standard) at each time point was
calculated as a percentage of the amount at the zero time point and the intrinsic clearance
(CLint) was determined as described previously (Obach et al., 1997).
Metabolism of AZD9496 by human hepatocytes
Cryopreserved human hepatocytes (Bioreclamation IVT, Baltimore, MA, USA) were rapidly
thawed in a 37oC water bath and added to pre-warmed Lebovitz media. After gentle mixing,
the cell suspension was centrifuged at 40 x g for 4 min at room temperature. After removing
excess media, the cells were resuspended in about 5 ml of media. An aliquot (100 µl) of the
cell suspension was added to trypan blue (0.1 % v/v) solution and the mixture was used for
manual counting of cells using the improved Neubauer counting chamber. Cells with greater
than 80% viability were used. Cells (247.5 µl) were added to a 96-well plate and pre-warmed
to 37oC on a Hamilton Robot. The reaction was started by adding AZD9496 (2.5 µl) to
achieve final concentrations (0-200 µM). The final concentration of organic solvent was
0.75%. An aliquot was taken after a 20 minutes incubation and added to acetonitrile (100%
This article has not been copyedited and formatted. The final version may differ from this version.DMD Fast Forward. Published on June 19, 2018 as DOI: 10.1124/dmd.118.081539
at ASPE
T Journals on M
arch 26, 2020dm
d.aspetjournals.orgD
ownloaded from

DMD # 81539
10
v/v, containing internal standard). After centrifugation, the supernatant was injected into the
mass spectrometer.
Non-specific Binding of AZD9496 to human liver microsomes
Non-specific binding of AZD9496 to human liver microsomes was assessed using the rapid
equilibrium dialysis 96-well kit from Thermo Fisher Scientific (Rockford, IL, USA).
AZD9496 (at different concentrations covering those used for determining kinetic constants)
was mixed with the appropriate concentration of human liver microsomes (0.025, 0.25 or 1
mg/ml) and potassium phosphate buffer (0.1 M, pH 7.4). The mixture was dialysed against
buffer (potassium phosphate 0.1 M, pH 7.4) at 37oC with shaking for 4 hours. An equal
volume was taken from the buffer-only and human liver microsomal-containing chambers. A
corresponding volume of human microsomal mixture was added to the buffer-only sample
and similarly, a corresponding volume of buffer was added to the sample taken from the
human liver microsomal-containing chamber. After adding acetonitrile (100% containing
internal standard), the mixture was vortex-mixed and centrifuged at 3000 xg for 10 min. The
supernatant was transferred to a fresh 96-well plate and 3 µl was injected into the mass
spectrometer. The concentration of compound was calculated as the ratio of the peak area of
compound: peak area of internal standard. The percentage free was calculated as (the
concentration in buffer chamber/concentration in HLM chamber) x 100%.
Effect of AZD9496 on CYP2C8 mRNA in HepaRG cells
Cryopreserved HepaRG cells were thawed and plated at a density of 100,000 viable cells per
well in collagen 1 coated 96-well plates as per manufacturer’s instructions. Approximately
72 hours after seeding cells were incubated with 0.0091 – 20 µM AZD9496 or rifampicin
(positive control inducer) or vehicle control for 48 hours, with compound solutions replaced
This article has not been copyedited and formatted. The final version may differ from this version.DMD Fast Forward. Published on June 19, 2018 as DOI: 10.1124/dmd.118.081539
at ASPE
T Journals on M
arch 26, 2020dm
d.aspetjournals.orgD
ownloaded from
DMD # 81539
11
after 24 hours. All compound solutions were prepared in Williams’ Media E with serum-free
induction supplement and a final concentration of 0.1% DMSO. After 48 hours treatment,
cells were washed with Dulbecco’s phosphate buffered saline and then assessed for induction
of CYP mRNA. mRNA was prepared from the plated cells according to the FastLane Cell
Multiplex NR kit protocol and relative expression levels evaluated by quantitative RT-PCR
using CYP2C8 specific primers and probes and GAPDH as a housekeeping gene. Fold
induction of CYP2C8 mRNA was calculated for each well relative to vehicle control wells
and plotted against test item concentration.
Liquid chromatography with mass spectrometric detection
Chromatography of AZD9496 and its two metabolites was performed on a Waters Acquity
UPLC pump (Waters, Milford, MA, USA) fitted with a C-18 Kinetex column (50 x 2.1 ID,
2.6 µm) maintained at a temperature of 50oC with A) 0.1% formic acid in water and B) 0.1%
formic acid in methanol (100%, v/v) as mobile phases. The gradient elution program at a
flow rate of 0.6 ml/min started with 95% A for 1.5 minutes, a decrease to 25% in 3.3 minutes,
held at 25% for 0.5 minutes, back to 95% in 0.1 minutes and held for 0.1 minutes to give a
total run time of 5.5 minutes. Mass spectrometric detection was done in positive mode on the
Waters TQD (Waters, Milford, MA) with data acquisition done using MassLynx V4.1. The
gas flow was set at 600 L/hourr (desolvation) and 50 L/hourr (cone). The desolvation and
source temperatures were set at 350 and 120oC, respectively. The capillary voltage was
3.27kV and the analytes were monitored by multiple reaction monitoring with the details of
the scan parameters shown in Table 1.
This article has not been copyedited and formatted. The final version may differ from this version.DMD Fast Forward. Published on June 19, 2018 as DOI: 10.1124/dmd.118.081539
at ASPE
T Journals on M
arch 26, 2020dm
d.aspetjournals.orgD
ownloaded from

DMD # 81539
12
Chromatography of amodiaquine and its metabolite desethylamodiaquine, was also
performed on a Waters Acquity UPLC pump fitted with a C-18 Kinetex column (50 x 2.1 ID,
2.6 µm) maintained at a temperature of 50oC with A) 0.1% formic acid in water and B) 0.1%
formic acid in methanol (100%, v/v) as mobile phases. The gradient elution program at a
flow rate of 0.6 ml/minute started with 95% A for 0.3 minutes, a decrease to 5% in 2.5
minutes, held at 5% for 0.2 minutes, back to 95% in 0.2 minutes and held for 0.3 minutes to
give a total run time of 3.5 minutes. Mass spectrometric detection was done in positive mode
on the Waters Xevo TQS (Waters, Milford, MA, USA) with data acquisition done using
MassLynx V4.1 (Waters, Milford, MA, USA). The capillary voltage was set at 0.71kV and
desolvation temperature was set at 600oC. Gas flows were set at: desolvation (1000 L/hour)
and cone (150 L/hour). Amodiaquine and desethylamodiaquine were monitored by multiple
reaction monitoring at cone and collision voltages of 20 and 22, respectively. The transitions
for amodiaquine were 356.5 > 284.5 and for desethylamodiaquine,328.6 > 283.4.
Data and statistical analysis
The inhibition data generated in this study was fitted to the generally accepted model for
substrate inhibition analogous to uncompetitive inhibition (Yoshino and Murakami, 2015)
(model (1)) in GraphPad Prism Version 7.02 (GraphPad Software Inc., La Jolla, CA, USA).
V = Vmax/(Km + [S](1 + [S]/Ki) 1.
New models of substrate inhibition essentially similar to model 1 with the exception of an
additional substrate molecule, added to try and explain the greater extent of inhibition that
model 1 failed to describe were considered . The binding of an additional two molecules
(forming an S1S2ES complex) was assumed taking into account proposals by others
(Korzekwa et al., 1998) in which some atypical reactions may involve binding of two
This article has not been copyedited and formatted. The final version may differ from this version.DMD Fast Forward. Published on June 19, 2018 as DOI: 10.1124/dmd.118.081539
at ASPE
T Journals on M
arch 26, 2020dm
d.aspetjournals.orgD
ownloaded from

DMD # 81539
13
substrate molecules and an effector molecule. Model (2) assumed sequential binding of two
molecules with the first facilitating binding of the second as shown below.
k1 k3
E + S ES E + P
k2 +
S1
Ki
S1ES
+
S2
αKi
S2S1ES
This gives the equation (2):
V = Vmax[S]/(Km + [S](1 + [S]/ki + [S]2/αki2)) 2.
The third model assumed simultaneous binding of n (number determined from the data)
molecules of AZD9496 to the inhibitor site as shown below.
k1 k3
E + S ES E + P
K2 +
nS1
Ki
nS1ES
This article has not been copyedited and formatted. The final version may differ from this version.DMD Fast Forward. Published on June 19, 2018 as DOI: 10.1124/dmd.118.081539
at ASPE
T Journals on M
arch 26, 2020dm
d.aspetjournals.orgD
ownloaded from
DMD # 81539
14
V = Vmax/(Km + [S](1 + [S]n/Kin) 3.
Equations (2) and (3) were imported into GraphPad Prism and were tested for their ability to
describe the inhibition data in this study. Comparison of the models was done in GraphPad
Prism using the extra-sum-of-squares F test. An F ratio around 1 shows the simpler model (1)
to be the correct one but a ratio much greater than 1 supports use of the more complicated
one. A p value can then be used to show statistical significance – a p value less than 0.05
shows that the simpler model (less parameters and in this study, equation 1) is incorrect. The
data and statistical analysis comply with the recommendations on experimental design and
analysis in pharmacology (Motulsky and Christopoulos, 2004).
Concentration of AZD9496 available to interact with enzymes in vivo
The free concentration of AZD9496 likely to interact with enzymes in vivo after
administration of a 600 mg dose was estimated according to (Ito et al., 1998; Ito et al., 2002;
Rostami-Hodjegan and Tucker, 2004) assuming complete solubility and bioavailability. The
maximum intestinal concentration = molar dose/250 ml, the maximum liver inlet
concentration, Iin max = Fa.Ka.Dose/Qh, Iin free= Iin max.fu. I = total Cmax and Fa is the fraction
absorbed and this was assumed to be 1. Ka is the absorption rate constant which was assumed
to be 0.1 min-1. Qh is the hepatic blood flow (1500 ml/minute). A blood to plasma ratio of
0.66 (experimentally determined) was used and for the fraction unbound FDA guidance
value of 0.01 (FDA, 2017) for highly bound compounds was applied.
This article has not been copyedited and formatted. The final version may differ from this version.DMD Fast Forward. Published on June 19, 2018 as DOI: 10.1124/dmd.118.081539
at ASPE
T Journals on M
arch 26, 2020dm
d.aspetjournals.orgD
ownloaded from

DMD # 81539
15
Results
Metabolism of AZD9496 by human liver microsomes
The HLM protein concentrations and time that gave linear formation of the metabolites of
AZD9496 were established. The effect of increasing concentrations of AZD9496 on the rate
of metabolism in HLM was investigated using 0.025 and 0.25 mg/ml of HLM protein for 20
min. At both 0.025 mg/ml and 0.25 mg/ml HLM protein, the rate of formation of the major
metabolite M3 showed complete substrate inhibition (Fig 2A and 2B) that is the rate of
formation of the metabolite went down to zero at 200 µM of AZD9496. The minor
metabolite M5 also showed a similar pattern of substrate inhibition.
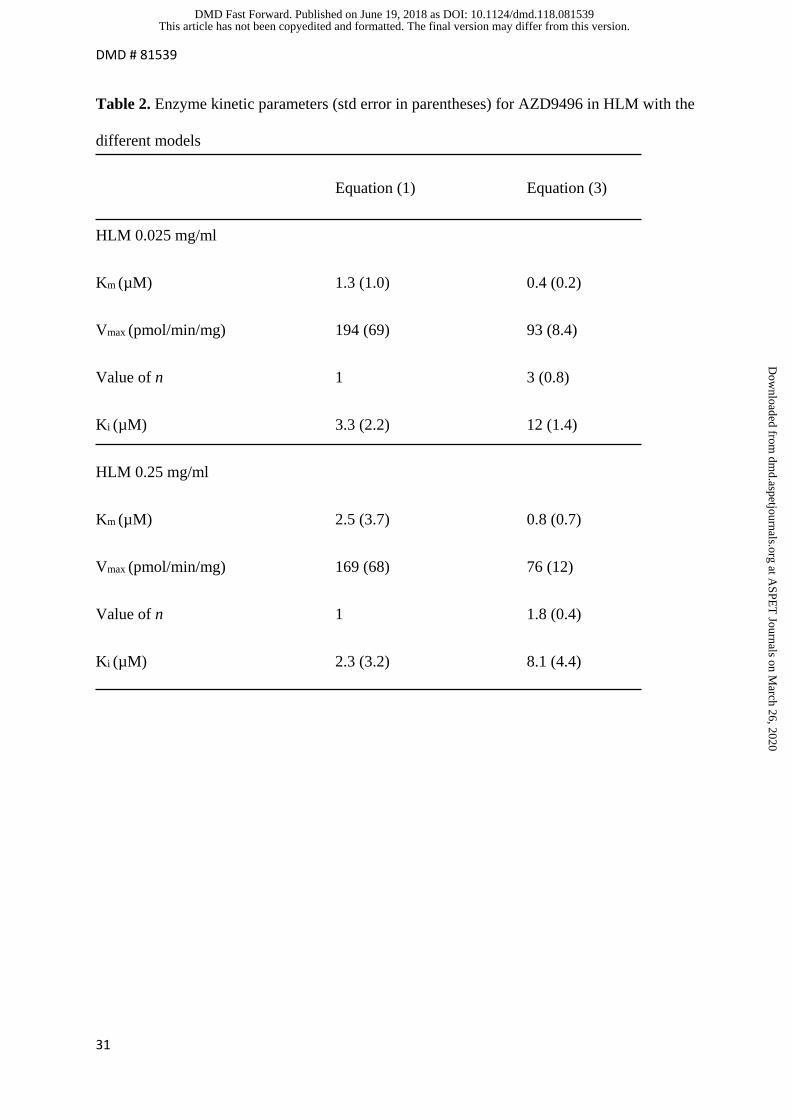
The data for formation of the major metabolite (M3) fitted poorly to the generally accepted
model of substrate inhibition analogous to uncompetitive inhibition (model 1) and the poor fit
was more pronounced when less enzyme (0.025 mg/ml HLM protein) was used (Fig 2A and
2B). Two additional models to the generally accepted substrate inhibition model were used to
fit the data as described in the materials and methods. Fitting the inhibition data to the second
model (2) gave visually better fits, however, these were deemed ambiguous by the program
and did not generate kinetic parameters. Model (3) was a modification of model (1) that did
not have any constraints on the number of [S] that could bind to the inhibitor site i.e. while
[S] is equal to one in model (1), this value was determined from the data by the program for
model (3). Modelling the data using equation (3) gave much better fits (Fig 2C and 2D). In
addition, the two models were compared using the extra-sum-of-squares F test. The F ratios
obtained were 22 (P<0.0001) and 10 (P = 0.0034) for 0.025 mg/ml and 0.25 mg/ml HLM,
respectively. The enzyme kinetic parameters obtained using models (1) and (3) are shown in
table 2 with Km and Ki values corrected for protein binding which is described below.
This article has not been copyedited and formatted. The final version may differ from this version.DMD Fast Forward. Published on June 19, 2018 as DOI: 10.1124/dmd.118.081539
at ASPE
T Journals on M
arch 26, 2020dm
d.aspetjournals.orgD
ownloaded from

DMD # 81539
16
Non-specific protein binding
The non-specific binding of AZD9496 to HLM in vitro was assessed using rapid equilibrium
dialysis at three different HLM concentrations of 0.025, 0.25 and 1 mg/ml. The percentage of
AZD9496 non-specifically bound to HLM increased with increase in HLM protein
concentration. At least 91% of AZD9496 was non-specifically bound to HLM matrix at the
highest HLM concentration of 1 mg/ml (Fig 3). At the four concentrations of AZD9496
tested (0.5-200 µM), there did not seem to be a significant difference in the extent of
nonspecific binding at each HLM concentration except at the 1.0 mg/ml HLM concentration
where 200 µM AZD9496 seems to result in a higher percentage of free drug (16% compared
to about 7% at the other concentrations).
CYP identification
A total of nine recombinant human CYP isoforms were screened for their contribution to
formation of the main metabolites of AZD9496, M3 and M5. The concentrations of M3 and
M5 were expressed as the response ratio (peak area of metabolite: peak area of internal
standard). M3 and M5 were detected in incubations containing CYP2C8 only (Fig 4A). In
order to confirm CYP2C8 as the major isoform responsible for metabolism of AZD9496, a
correlation analysis of the intrinsic clearance (CLint) of AZD9496 and the CYP2C8-specific
probe amodiaquine was done in human liver microsomes HLM from eight different donors.
A good correlation (r2 = 0.78) was observed between CLint values for AZD9496 and
amodiaquine (Fig 4B).
This article has not been copyedited and formatted. The final version may differ from this version.DMD Fast Forward. Published on June 19, 2018 as DOI: 10.1124/dmd.118.081539
at ASPE
T Journals on M
arch 26, 2020dm
d.aspetjournals.orgD
ownloaded from

DMD # 81539
17
Completeness of substrate inhibition
To check the completeness of the substrate inhibition and to rule out the possibility of
AZD9496-specific artefacts, the impact of AZD9496 on the formation of
desethylamodiaquine from amodiaquine in HLM was assessed. The concentration of
amodiaquine used (50 µM) while AZD9496 was incubated at 100 µM (the same
concentration that inhibited 100% of M3 formation at 0.025 mg/ml of HLM protein. The
amount of desethylamodiaquine formed was quantified by measuring the peak area to internal
standard ratio and this was expressed as a percentage with the amodiaquine only incubation
set at 100%. The control incubations for amodiaquine only and amodiaquine plus AZD9496
had NADPH (the cofactor required by CYPs) added to them after stopping the reaction.
These were compared to the reactions in which NADPH was present at the start. The controls
had similar levels of desethylamodiaquine as the AZD9496 plus amodiaquine incubation
showing that AZD9496 caused complete inhibition of desethylamodiaquine formation (Fig
5).
Significance of the value of n
Given the different numbers of n (number of AZD9496 molecules bound to the inhibitor site)
predicted by GraphPad Prism under different conditions (protein concentration), the effect of
enzyme concentration on the value of n was studied using recombinant CYP2C8 (0.4 pmols
and 4 pmols). Given the extensive non-specific protein binding of AZD9496, the protein
concentration was kept constant by adding control baculovirus microsomes (heterologous
expression system used to produce the recombinant human CYP2C8 used in this study). The
number of AZD9496 molecules predicted to bind to the inhibitor site was 2-fold higher when
less enzyme was used (Fig 6A and 6B). The Km values were the same (0.67 µM) but the Ki
value was higher when less enzyme was used (14 compared to 6 µM).
This article has not been copyedited and formatted. The final version may differ from this version.DMD Fast Forward. Published on June 19, 2018 as DOI: 10.1124/dmd.118.081539
at ASPE
T Journals on M
arch 26, 2020dm
d.aspetjournals.orgD
ownloaded from

DMD # 81539
18
Confirmation of substrate inhibition in human hepatocytes
Human hepatocytes were used to assess whether the substrate inhibition exhibited by
AZD9496 in HLM and rCYP2C8 was not a microsomal artefact. Human hepatocytes at 0.125
and 1 million cells/ml were incubated with increasing concentrations of AZD9496. A profile
of substrate inhibition similar to that in HLM and recombinant CYP2C8 was observed in
hepatocytes with almost complete inhibition observed when less cells were used (Fig 7A and
7B). Multiple AZD9496 molecules may also bind to the enzymes in hepatocytes as shown by
n values of 2.2 and 3 for 0.125 and 1 million cells/ml, respectively. Similar Km values of 7.8
and 8.7 µM were observed.
Induction of CYP2C8 mRNA in HepaRG cells
Plated HepaRG cells were used to assess whether AZD9496 induced CYP2C8 mRNA (Fig
8). The magnitude of CYP2C8 mRNA induction in plated HepaRG cells was observed to be
small, with the positive control inducer rifampicin demonstrating a calculated Emax of 1.8 ±
0.13 fold. AZD9496 also demonstrated a concentration dependent induction of CYP2C8
mRNA to a maximum at 20 µM that was 155% of the rifampicin control.
Free AZD9496 concentrations achieved after administration of a single 600 mg dose
After administration of a single 600 mg dose of AZD9496, the total plasma Cmax was 17.9
µM (Hamilton et al., 2018). This gave a predicted intestinal concentration of 5424 µM, Iin max
of 102 µM. The Iin free, estimated using the FDA guidance for highly bound compounds (fu of
0.01) was 1.0 µM.
This article has not been copyedited and formatted. The final version may differ from this version.DMD Fast Forward. Published on June 19, 2018 as DOI: 10.1124/dmd.118.081539
at ASPE
T Journals on M
arch 26, 2020dm
d.aspetjournals.orgD
ownloaded from
DMD # 81539
19
Discussion
Substrate inhibition is a common mechanism of enzyme inhibition however, many questions
have been raised concerning its relevance. Indeed some have dismissed it as an in vitro
artefact (Reed et al., 2010) as the majority of cases of substrate inhibition occur at very high
substrate concentrations that would almost never be achieved in vivo (Lin et al., 2001). In
addition to an in vitro microsomal system, others have suggested the use of other systems
such as hepatocytes to confirm any observed substrate inhibition (Houston and Galetin,
2005). In this study, HLM, recombinant human CYP2C8 and human hepatocytes were used
to show a similar profile of complete substrate inhibition of CYP2C8 by the oral selective
estrogen receptor degrader (SERD) AZD9496. In addition, the completeness of the inhibition
was demonstrated using the specific probe of CYP2C8 activity amodiaquine deethylation.
The substrate inhibition observed with AZD9496 did not conform to the generally accepted
model analogous to uncompetitive inhibition, model (1) (Yoshino & Mukarami, 2015) with
the data showing a greater degree of inhibition than could be described by the model.
Additionally, visual inspection of the data and kinetic parameters showed that this was not
the correct model to use - the Vmax values were much higher than was suggested by the data.
Mathematically, one of the ways in which the greater degree of inhibition could be accounted
for was an increase in the number of substrate molecules causing the inhibition i.e. increasing
the value of [S] in the denominator of equation 1. The fitting of two or more substrate
molecules in the active site that could theoretically include an inhibitory site, is suppported
by the large volume of the CYP2C8 active site (Schoch et al., 2004). Additional support for
multiple substrate binding comes from studies by others which show that a substrate can
adopt multiple binding orientations within the CYP2C8 active site (Kerdpin et al., 2004). It is
therefore, possible for at least two molecules of AZD9496 to bind to the active site of
This article has not been copyedited and formatted. The final version may differ from this version.DMD Fast Forward. Published on June 19, 2018 as DOI: 10.1124/dmd.118.081539
at ASPE
T Journals on M
arch 26, 2020dm
d.aspetjournals.orgD
ownloaded from

DMD # 81539
20
CYP2C8 in productive and non-productive orientations. Inhibition of the enzyme could
theoretically occur because of a molecule bound in a non-productive orientation interfering
with the productive binding thus reducing the rate of reaction or preventing the product from
leaving the active site.
Model (2) was derived based on the binding of two substrate molecules to an inhibitor site
with the first molecule facilitating binding of the next (equation 2). Visually, the model gave
a better fit compared to the generally accepted one (1), however, the program could not give
values of the parameters as this was deemed an ambiguous fit. The generally accepted model
(1) was modified to give model (3) by removing any constraints on the number of AZD9496
molecules occupying the inhibitor site with the number of [S] determined by the inhibition
data. Notably, model (3) gave the best fits of the data by assigning different numbers of
molecules bound to the inhibitory site based on the data. In addition, comparison of the two
models using the sum-of-squares F test and associated p values showed model 3 to be the
better model. The number (n) of molecules of AZD9496 predicted to interact with the
inhibitor site differed depending on the amount of protein used and this was investigated
further.
AZD9496 is extensively non-specifically bound to protein in vitro. Using different amounts
of protein in incubations would in turn mean different concentrations of AZD9496 available
to interact with the enzyme. There was up to a 10-fold difference in percentage free
AZD9496 at 0.025 mg/ml compared to 1 mg/ml HLM protein. In addition, the difference in
protein concentration would also mean a difference in the amount of enzyme. Given that the
impact of protein concentration was straightforward, i.e. it reduced the concentration of
AZD9496 available to interact with the enzyme, we investigated the impact of different
This article has not been copyedited and formatted. The final version may differ from this version.DMD Fast Forward. Published on June 19, 2018 as DOI: 10.1124/dmd.118.081539
at ASPE
T Journals on M
arch 26, 2020dm
d.aspetjournals.orgD
ownloaded from

DMD # 81539
21
enzyme concentrations on the enzyme kinetics using recombinant CYP2C8 (at 0.4 pmols and
4 pmols). Microsomes from control insect baculovirus (the heterologous expression system of
the human recombinant CYP2C8 utilised in the study) were used to maintain the same
protein concentration in both 0.4 and 4 pmols arms of the experiment. Interestingly, the
number of molecules of AZD9496 predicted to bind to the inhibitor site were higher when
less enzyme was used. The higher Ki value associated with less enzyme might seem counter-
intuitive but may simply reflect the binding of twice the number of AZD9496 molecules and
is not an indicator of the strength of binding when comparing the two protein concentrations.
The greater degree of inhibition when less enzyme is used likely comes from a “removal” of
the extra molecule through binding to the inhibitor site instead of contributing to the
increased rate of product formation that would occur when a higher concentration of enzyme
is used. Our hypothesis is that AZD9496 initially binds to the active site in a productive
orientation with involvement of an inhibitory site occurring as more substrate becomes
available. A high [S]:[E] ratio allows for the maximum number of AZD9496 molecules to
occupy the inhibitor site and is supported by the higher Ki values compared to Km values.
The possible in vivo relevance of the complete substrate inhibition observed in this study is
intriguing. The potential for dose nonlinearity from typical M-M kinetics can be assessed by
comparing the Km value to the expected in vivo free drug concentrations (Ludden, 1991). A
lower Km value compared to drug concentrations would lead to saturation of metabolism and
dose non-linearity. Another possible cause of dose-nonlinearity is time-dependent inhibition,
however, AZD9496 did not inhibit CYP2C8 in a time-dependent manner (data not shown).
For complete substrate inhibition, an increase in concentration of substrate would be expected
to result in an increase in the percentage inhibition of its own metabolism across all
concentrations up to Vmax. Each increase in dose would therefore, be expected to result in a
This article has not been copyedited and formatted. The final version may differ from this version.DMD Fast Forward. Published on June 19, 2018 as DOI: 10.1124/dmd.118.081539
at ASPE
T Journals on M
arch 26, 2020dm
d.aspetjournals.orgD
ownloaded from

DMD # 81539
22
higher than linear exposure with the greatest nonlinear exposure occurring at concentrations
where the rate of product formation goes down to zero. Added to this is the possible impact
of the amount of CYP2C8 enzyme an individual has on the extent of inhibition with
individuals expressing highest protein likely to experience the least amount of inhibition. A
wide range in extent of inhibition by AZD9496 is, therefore, expected as CYP2C8 is
polymorphic and has been shown to exhibit high interindividual variation in protein
expression of up to 33-fold(Naraharisetti et al., 2010). In the phase 1 study by (Hamilton et
al., 2018), single doses of AZD9496 from 20 mg to 400 mg exhibited reasonably proportional
increases in AUC and Cmax. However, a more than dose-proportional increase in AUC and
Cmax was observed after administration of the highest single dose (600 mg on day 1). After
the single 600 mg dose, the maximum unbound liver inlet concentration was estimated to be
1 µM which would be higher than the Km of 0.4 µM (in HLM) for CYP2C8. The extent of
substrate inhibition likely to occur at this dose is not clear but could explain the apparent
dose-nonlinearity. While formation of M3 and M5 was mediated mainly by CYP2C8,
depletion of AZD9496 was observed in incubations with CYP3A4 and CYP3A5 (data not
shown). Upon multiple 600 mg twice daily dosing, the observed more-than dose proportional
decrease in AUC on day 15 vs day 1 would be consistent with induction of CYP3A and
CYP2C8 at these concentrations.
In conclusion and in contrast to previous reports (Lin et al., 2001), substrate inhibition of
CYP2C8 by AZD9496 was shown to be complete and not just partial. The inhibition likely
involves binding of at least two molecules of AZD9496 to the inhibitor site which may be in
the active site of the enzyme. Given that CYP2C8 is the major isoform catalysing formation
of the two major metabolites of AZD9496, our results suggest substrate inhibition as the
This article has not been copyedited and formatted. The final version may differ from this version.DMD Fast Forward. Published on June 19, 2018 as DOI: 10.1124/dmd.118.081539
at ASPE
T Journals on M
arch 26, 2020dm
d.aspetjournals.orgD
ownloaded from

DMD # 81539
23
cause of the observed dose non-linearity at the highest single dose of AZD9496 tested in the
clinic (i.e. 600 mg).
This article has not been copyedited and formatted. The final version may differ from this version.DMD Fast Forward. Published on June 19, 2018 as DOI: 10.1124/dmd.118.081539
at ASPE
T Journals on M
arch 26, 2020dm
d.aspetjournals.orgD
ownloaded from
DMD # 81539
24
Acknowledgements
We thank Dr. Dermot McGinnity for useful discussions.
Authorship contributions
Participated in research design: Bapiro, Sykes and Jones.
Conducted the experiments: Bapiro, Rollison
Performed data analysis: Bapiro, Sykes, Martin, Davies, Yates, Hoch, Rollison, Jones
Wrote or contributed to the writing of the manuscript: Bapiro, Sykes, Martin, Davies, Yates,
Hoch, Rollison, Jones.
This article has not been copyedited and formatted. The final version may differ from this version.DMD Fast Forward. Published on June 19, 2018 as DOI: 10.1124/dmd.118.081539
at ASPE
T Journals on M
arch 26, 2020dm
d.aspetjournals.orgD
ownloaded from
DMD # 81539
25
References
Atkins WM (2005) Non-Michaelis-Menten kinetics in cytochrome P450-catalyzed reactions. Annu Rev Pharmacol Toxicol 45:291-310.
De Savi C, Bradbury RH, Rabow AA, Norman RA, de Almeida C, Andrews DM, Ballard P, Buttar D, Callis RJ, Currie GS, Curwen JO, Davies CD, Donald CS, Feron LJ, Gingell H, Glossop SC, Hayter BR, Hussain S, Karoutchi G, Lamont SG, MacFaul P, Moss TA, Pearson SE, Tonge M, Walker GE, Weir HM, and Wilson Z (2015) Optimization of a Novel Binding Motif to (E)-3-(3,5-Difluoro-4-((1R,3R)-2-(2-fluoro-2-methylpropyl)-3-methyl-2,3,4,9-tetra hydro-1H-pyrido[3,4-b]indol-1-yl)phenyl)acrylic Acid (AZD9496), a Potent and Orally Bioavailable Selective Estrogen Receptor Downregulator and Antagonist. J Med Chem 58:8128-8140.
FDA (2017) In Vitro Metabolism- and Transporter-Mediated Drug-Drug Interaction Studies Guidance for Industry.
Gay SC, Roberts AG, and Halpert JR (2010) Structural features of cytochromes P450 and ligands that affect drug metabolism as revealed by X-ray crystallography and NMR. Future Med Chem 2:1451-1468.
Hamilton EP, Patel MR, Armstrong AC, Baird RD, Jhaveri K, Hoch M, Klinowska T, Lindemann JPO, Morgan S, Schiavon G, Weir HM, and Im SA (2018) A first in human study of the new oral selective estrogen receptor degrader AZD9496 for HR+/HER2- advanced breast cancer. Clin Cancer Res.
Houston JB (1994) Relevance of in vitro kinetic parameters to in vivo metabolism of xenobiotics. Toxicol In Vitro 8:507-512.
Houston JB and Galetin A (2005) Modelling atypical CYP3A4 kinetics: principles and pragmatism. Arch Biochem Biophys 433:351-360.
Ito K, Chiba K, Horikawa M, Ishigami M, Mizuno N, Aoki J, Gotoh Y, Iwatsubo T, Kanamitsu S, Kato M, Kawahara I, Niinuma K, Nishino A, Sato N, Tsukamoto Y, Ueda K, Itoh T, and Sugiyama Y (2002) Which concentration of the inhibitor should be used to predict in vivo drug interactions from in vitro data? AAPS PharmSci 4:E25.
Ito K, Iwatsubo T, Kanamitsu S, Ueda K, Suzuki H, and Sugiyama Y (1998) Prediction of pharmacokinetic alterations caused by drug-drug interactions: metabolic interaction in the liver. Pharmacol Rev 50:387-412.
Kerdpin O, Elliot DJ, Boye SL, Birkett DJ, Yoovathaworn K, and Miners JO (2004) Differential contribution of active site residues in substrate recognition sites 1 and 5 to cytochrome P450 2C8 substrate selectivity and regioselectivity. Biochemistry 43:7834-7842.
Korzekwa KR, Krishnamachary N, Shou M, Ogai A, Parise RA, Rettie AE, Gonzalez FJ, and Tracy TS (1998) Evaluation of atypical cytochrome P450 kinetics with two-substrate models: evidence that multiple substrates can simultaneously bind to cytochrome P450 active sites. Biochemistry 37:4137-4147.
Li XQ, Bjorkman A, Andersson TB, Ridderstrom M, and Masimirembwa CM (2002) Amodiaquine clearance and its metabolism to N-desethylamodiaquine is mediated by CYP2C8: a new high affinity and turnover enzyme-specific probe substrate. J Pharmacol Exp Ther 300:399-407.
Lin Y, Lu P, Tang C, Mei Q, Sandig G, Rodrigues AD, Rushmore TH, and Shou M (2001) Substrate inhibition kinetics for cytochrome P450-catalyzed reactions. Drug Metab Dispos 29:368-374.
Ludden TM (1991) Nonlinear pharmacokinetics: clinical Implications. Clin Pharmacokinet 20:429-446. Ma Y, Fu Y, Khojasteh SC, Dalvie D, and Zhang D (2017) Glucuronides as Potential Anionic Substrates
of Human Cytochrome P450 2C8 (CYP2C8). J Med Chem. Motulsky H and Christopoulos A (2004) Fitting models to biological data using linear and nonlinear
regression. A practical guide to curve fitting. . Oxford University Press, New York. Naraharisetti SB, Lin YS, Rieder MJ, Marciante KD, Psaty BM, Thummel KE, and Totah RA (2010)
Human liver expression of CYP2C8: gender, age, and genotype effects. Drug Metab Dispos 38:889-893.
This article has not been copyedited and formatted. The final version may differ from this version.DMD Fast Forward. Published on June 19, 2018 as DOI: 10.1124/dmd.118.081539
at ASPE
T Journals on M
arch 26, 2020dm
d.aspetjournals.orgD
ownloaded from
DMD # 81539
26
Obach RS, Baxter JG, Liston TE, Silber BM, Jones BC, MacIntyre F, Rance DJ, and Wastall P (1997) The prediction of human pharmacokinetic parameters from preclinical and in vitro metabolism data. J Pharmacol Exp Ther 283:46-58.
Obach RS and Reed-Hagen AE (2002) Measurement of Michaelis constants for cytochrome P450-mediated biotransformation reactions using a substrate depletion approach. Drug Metab Dispos 30:831-837.
Pelkonen O, Turpeinen M, Uusitalo J, Rautio A, and Raunio H (2005) Prediction of drug metabolism and interactions on the basis of in vitro investigations. Basic Clin Pharmacol Toxicol 96:167-175.
Reed MC, Lieb A, and Nijhout HF (2010) The biological significance of substrate inhibition: a mechanism with diverse functions. Bioessays 32:422-429.
Rendic S and Guengerich FP (2015) Survey of Human Oxidoreductases and Cytochrome P450 Enzymes Involved in the Metabolism of Xenobiotic and Natural Chemicals. Chem Res Toxicol 28:38-42.
Rostami-Hodjegan A and Tucker G (2004) 'In silico' simulations to assess the 'in vivo' consequences of 'in vitro' metabolic drug-drug interactions. Drug Discov Today Technol 1:441-448.
Schoch GA, Yano JK, Sansen S, Dansette PM, Stout CD, and Johnson EF (2008) Determinants of cytochrome P450 2C8 substrate binding: structures of complexes with montelukast, troglitazone, felodipine, and 9-cis-retinoic acid. J Biol Chem 283:17227-17237.
Schoch GA, Yano JK, Wester MR, Griffin KJ, Stout CD, and Johnson EF (2004) Structure of human microsomal cytochrome P450 2C8. Evidence for a peripheral fatty acid binding site. J Biol Chem 279:9497-9503.
Spracklin DK, Hankins DC, Fisher JM, Thummel KE, and Kharasch ED (1997) Cytochrome P450 2E1 is the principal catalyst of human oxidative halothane metabolism in vitro. J Pharmacol Exp Ther 281:400-411.
Tang C, Shou M, Mei Q, Rushmore TH, and Rodrigues AD (2000) Major role of human liver microsomal cytochrome P450 2C9 (CYP2C9) in the oxidative metabolism of celecoxib, a novel cyclooxygenase-II inhibitor. J Pharmacol Exp Ther 293:453-459.
Torimoto N, Ishii I, Hata M, Nakamura H, Imada H, Ariyoshi N, Ohmori S, Igarashi T, and Kitada M (2003) Direct interaction between substrates and endogenous steroids in the active site may change the activity of cytochrome P450 3A4. Biochemistry 42:15068-15077.
Totah RA and Rettie AE (2005) Cytochrome P450 2C8: substrates, inhibitors, pharmacogenetics, and clinical relevance. Clin Pharmacol Ther 77:341-352.
Venkatakrishnan K, Von Moltke LL, and Greenblatt DJ (2001) Human drug metabolism and the cytochromes P450: application and relevance of in vitro models. J Clin Pharmacol 41:1149-1179.
Weir HM, Bradbury RH, Lawson M, Rabow AA, Buttar D, Callis RJ, Curwen JO, de Almeida C, Ballard P, Hulse M, Donald CS, Feron LJ, Karoutchi G, MacFaul P, Moss T, Norman RA, Pearson SE, Tonge M, Davies G, Walker GE, Wilson Z, Rowlinson R, Powell S, Sadler C, Richmond G, Ladd B, Pazolli E, Mazzola AM, D'Cruz C, and De Savi C (2016) AZD9496: An Oral Estrogen Receptor Inhibitor That Blocks the Growth of ER-Positive and ESR1-Mutant Breast Tumors in Preclinical Models. Cancer Res 76:3307-3318.
Williams PA, Cosme J, Vinkovic DM, Ward A, Angove HC, Day PJ, Vonrhein C, Tickle IJ, and Jhoti H (2004) Crystal structures of human cytochrome P450 3A4 bound to metyrapone and progesterone. Science 305:683-686.
Yoshino M and Murakami K (2015) Analysis of the substrate inhibition of complete and partial types. Springerplus 4:292.
This article has not been copyedited and formatted. The final version may differ from this version.DMD Fast Forward. Published on June 19, 2018 as DOI: 10.1124/dmd.118.081539
at ASPE
T Journals on M
arch 26, 2020dm
d.aspetjournals.orgD
ownloaded from
DMD # 81539
27
Footnotes
Financial support was provided by AstraZeneca.
This article has not been copyedited and formatted. The final version may differ from this version.DMD Fast Forward. Published on June 19, 2018 as DOI: 10.1124/dmd.118.081539
at ASPE
T Journals on M
arch 26, 2020dm
d.aspetjournals.orgD
ownloaded from
DMD # 81539
28
Figure Legends
Figure 1.
The chemical structures of (A) AZD9496, its metabolites (B) M3 (the major metabolite) and
M5 (minor metabolite) - a single structure has been used to represent the two metabolites as
they are diastereoisomers but whose configuration is not known. The metabolite standards
used in the study were, however, isomerically pure.
Figure 2.
The rate of formation of M3, the major metabolite of AZD9496 with increase in AZD9496
concentration in pooled human liver microsomes (HLM) at a concentration of A) 0.025
mg/ml and B) 0.25 mg/ml microsomal protein. Each point represents duplicate
determinations and these were repeated on three separate occasions (n = 3). The data in Figs
2A and B were fit to the generally accepted substrate inhibition model (1). Figs 2C and D
were fit using the new model in this study (model (3)). (C) is a fit of the data with 0.025
mg/ml HLM and (D) is 0.25 mg/ml HLM.
Figure 3.
The extent of non-specific binding of AZD9496 at different concentrations (0.5 – 200 µM) to
3 different concentrations of HLM (0.025, 0.25 and 1 mg/ml) measured by rapid equilibrium
dialysis. A single experiment was done at each concentration in triplicate.
Figure 4.
A screen for formation of the two main metabolites of AZD9496 in a panel of recombinant
human CYPs (A). Incubations, in duplicate (with the average shown from a single
experiment), were done using 20 pmols of enzyme and 2 µM of AZD9496 for 25 minutes.
(B) The relationship between AZD9496 and amodiaquine intrinsic clearance (CLint) values
This article has not been copyedited and formatted. The final version may differ from this version.DMD Fast Forward. Published on June 19, 2018 as DOI: 10.1124/dmd.118.081539
at ASPE
T Journals on M
arch 26, 2020dm
d.aspetjournals.orgD
ownloaded from

DMD # 81539
29
in human liver microsomes from eight different donors. The results are the average of
duplicate determinations repeated on 3 separate occasions (n = 3).
Figure 5.
The effect of AZD9496 (100 µM) on formation of desethylamodiaquine (measured as a
percentage, with the amodiaquine only incubation set at 100%) after incubation of
amodiaquine (50 µM) with 0.025 mg/ml of human liver microsomes for 20 minutes. The
reaction in the samples was started by adding NADPH while the controls had NADPH added
after stopping the reaction with ice-cold acetonitrile. Each point represents the average of
triplicate determinations and these were done on 3 separate occasions (n=3).
Figure 6.
Substrate inhibition of formation of the major metabolite (M3) of AZD9496 by recombinant
human CYP2C8 (A) 0.4 pmols of CYP2C8 and (B) 4 pmols of CYP2C8. The protein
concentrations in the 2 incubations were kept constant using control baculovirus microsomes.
Each point represents duplicate determinations repeated on 3 separate occasions (n = 3).
Figure 7.
The substrate inhibition of formation of the main metabolite (M3) of AZD9496 by
cryopreserved human hepatocytes (A) 0.125 million cells/ml and (B) 1 million cells/ml. The
results are the average of duplicate determinations from a single experiment.
Figure 8
Fold induction of CYP2C8 mRNA in cultured HepaRG cells by AZD9496 and rifampicin.
Each data point represents an individual determination in a single experiment.
This article has not been copyedited and formatted. The final version may differ from this version.DMD Fast Forward. Published on June 19, 2018 as DOI: 10.1124/dmd.118.081539
at ASPE
T Journals on M
arch 26, 2020dm
d.aspetjournals.orgD
ownloaded from

DMD # 81539
30
Tables
Table 1. Mass spectrometry scan parameters
Analyte Parent ion Product ion Cone (V) Collision energy (V)
AZD9496 443.4 117.9 25 28
M3 459.4 133.8 30 18
M5 459.4 133.8 25 28
This article has not been copyedited and formatted. The final version may differ from this version.DMD Fast Forward. Published on June 19, 2018 as DOI: 10.1124/dmd.118.081539
at ASPE
T Journals on M
arch 26, 2020dm
d.aspetjournals.orgD
ownloaded from
DMD # 81539
31
Table 2. Enzyme kinetic parameters (std error in parentheses) for AZD9496 in HLM with the
different models
Equation (1) Equation (3)
HLM 0.025 mg/ml
Km (µM) 1.3 (1.0) 0.4 (0.2)
Vmax (pmol/min/mg) 194 (69) 93 (8.4)
Value of n 1 3 (0.8)
Ki (µM) 3.3 (2.2) 12 (1.4)
HLM 0.25 mg/ml
Km (µM) 2.5 (3.7) 0.8 (0.7)
Vmax (pmol/min/mg) 169 (68) 76 (12)
Value of n 1 1.8 (0.4)
Ki (µM) 2.3 (3.2) 8.1 (4.4)
This article has not been copyedited and formatted. The final version may differ from this version.DMD Fast Forward. Published on June 19, 2018 as DOI: 10.1124/dmd.118.081539
at ASPE
T Journals on M
arch 26, 2020dm
d.aspetjournals.orgD
ownloaded from

Figure 1
A B
This article has not been copyedited and formatted. The final version may differ from this version.DMD Fast Forward. Published on June 19, 2018 as DOI: 10.1124/dmd.118.081539
at ASPE
T Journals on M
arch 26, 2020dm
d.aspetjournals.orgD
ownloaded from

Figure 2
A B
C D
This article has not been copyedited and formatted. The final version may differ from this version.DMD Fast Forward. Published on June 19, 2018 as DOI: 10.1124/dmd.118.081539
at ASPE
T Journals on M
arch 26, 2020dm
d.aspetjournals.orgD
ownloaded from

0.5
2.0
10.0
200.0
0.5
2.0
10.0
200.0
0.5
2.0
10.0
200.0
0
2 0
4 0
6 0
8 0
1 0 0
1 2 0
[A Z D 9 4 9 6 ] M
AZ
D9
49
6 (
% f
ree
)
0 .0 2 5 m g /m l
0 .2 5 m g /m l
1 .0 m g /m l
Figure 3
This article has not been copyedited and formatted. The final version may differ from this version.DMD Fast Forward. Published on June 19, 2018 as DOI: 10.1124/dmd.118.081539
at ASPE
T Journals on M
arch 26, 2020dm
d.aspetjournals.orgD
ownloaded from
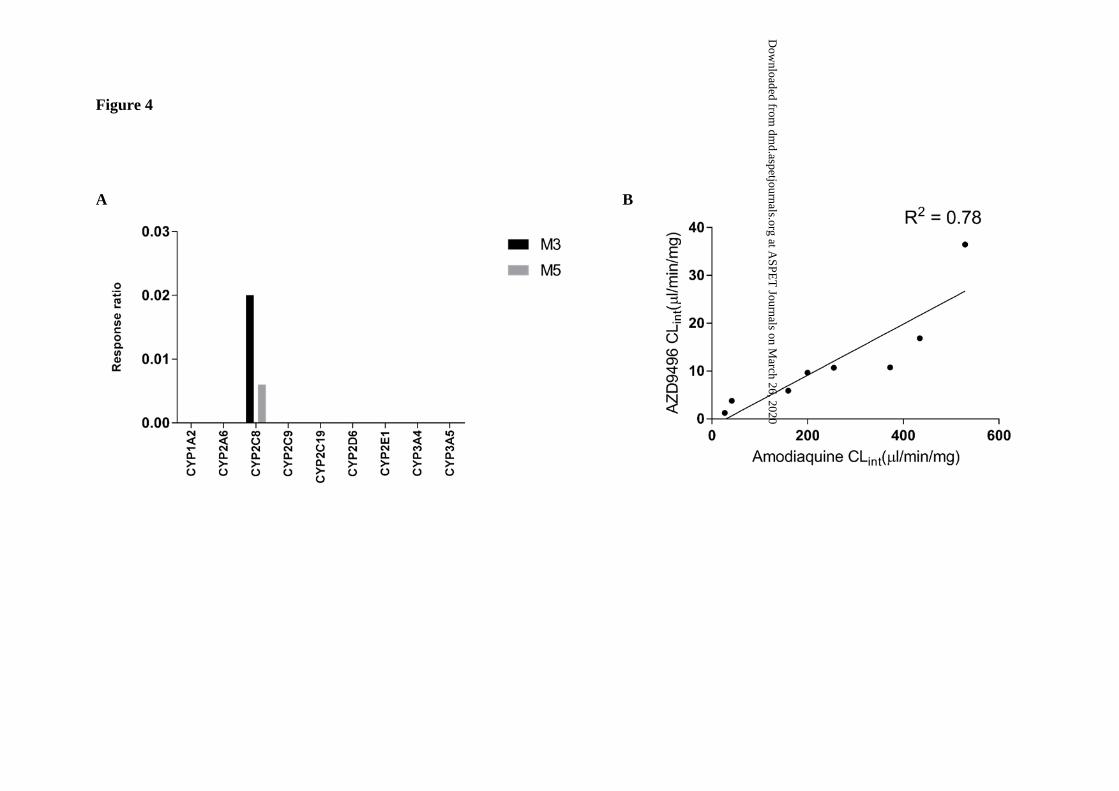
Figure 4
A B
This article has not been copyedited and formatted. The final version may differ from this version.DMD Fast Forward. Published on June 19, 2018 as DOI: 10.1124/dmd.118.081539
at ASPE
T Journals on M
arch 26, 2020dm
d.aspetjournals.orgD
ownloaded from

9496+A
QN
_co
ntr
ol
AQ
N_o
nly
_co
ntr
ol
9496+A
QN
AQ
N_o
nly
0
2 5
5 0
7 5
1 0 0
de
se
thy
lAQ
N (
% o
f A
QN
_o
nly
)
Figure 5
This article has not been copyedited and formatted. The final version may differ from this version.DMD Fast Forward. Published on June 19, 2018 as DOI: 10.1124/dmd.118.081539
at ASPE
T Journals on M
arch 26, 2020dm
d.aspetjournals.orgD
ownloaded from

Figure 6
A B
This article has not been copyedited and formatted. The final version may differ from this version.DMD Fast Forward. Published on June 19, 2018 as DOI: 10.1124/dmd.118.081539
at ASPE
T Journals on M
arch 26, 2020dm
d.aspetjournals.orgD
ownloaded from

Figure 7
A B
Km = 8.7
Ki = 31
n = 2.2
Km = 7.8
Ki = 118
n = 3.0
This article has not been copyedited and formatted. The final version may differ from this version.DMD Fast Forward. Published on June 19, 2018 as DOI: 10.1124/dmd.118.081539
at ASPE
T Journals on M
arch 26, 2020dm
d.aspetjournals.orgD
ownloaded from

Figure 8
C o n c e n t r a t i o n u M
Fo
ld
i
nd
uc
ti
on
(
CY
P2
C8
m
RN
A)
0 . 0 0 1 0 . 0 1 0 . 1 1 1 0 1 0 0
0
1
2
3
A Z D 9 4 9 6
R i f a m p i c i n
This article has not been copyedited and formatted. The final version may differ from this version.DMD Fast Forward. Published on June 19, 2018 as DOI: 10.1124/dmd.118.081539
at ASPE
T Journals on M
arch 26, 2020dm
d.aspetjournals.orgD
ownloaded from