Embed Size (px)
Citation preview

1. INTRODUCTION
Continuous monitoring of rock mechanical and reservoir
properties along the wellbore in unconventional
horizontal wells demands convenient and efficient
logging techniques. The conventional logging techniques
involve laboratory core analysis and well logging using
sonic and resistivity image logs which are not readily
available for all unconventional wells (1 in 10 or 1 in 20)
mainly due to associated cost, data uncertainity and time
consuming to process. Moreover there are possible risks
and concerns of trapping logging tools downhole in highly
deviated and horizontal wells drilled in unconventional
reservoirs. For many years, researchers and engineers have
been investigating several models and techniques to obtain
geomechanical property logs for the successful
development of unconventional resrvoirs and stimulation
design for maximum hydrocarbon production. The
Artificial Intelligence and Data Mining (AI&DM) or data-
driven models were developed to generate synthetic
geomechanical information from the conventional logs in
shale plays (Eshkalak et al., 2013). The conventional log
data from a shale well was used for training and calibration
during neural network model development to generate the
synthelic logs for other wells. This model provides better
performance for the wells in proximity of the training well
with actual geomechanical properties. A convenient ROP
model was developed to calculate rock mechanical
properties such as, confined compressive strength (CCS),
unconfined compressive strength (UCS) and Young’s
modulus (E) at each drilled depth from the routinely
collected drilling data such as rate of penetration (ROP),
weight on bit (WOB) and RPM (Hareland and Nygaard,
2007). In horizontal drilling, the actual downhole weight
on bit differs from the measured surface WOB (obtained
from on and off bottom hook load difference readings)
due to the friction caused by drill string movement,
rotation within the wellbore and wellbore geometry. A
previously developed 3D wellbore friction model (torque
and drag (T&D) model) was used to estimate the
coefficient of friction and effective downhole weight on
bit (DWOB) from the surface measurements of WOB,
hook load, surface applied RPM along with the wellbore
survey measurement, standpipe pressure and drill string
information (Fazalizadeh et al., 2010).
ARMA 17-591
Complete Geomechanical Property Log from Drilling
Data in Unconventional Horizontal Wells
Tahmeen, M.
Rocsol Technologies Inc., Calgary, Alberta, Canada
Love, J.
Oklahoma State University, Stillwater, Oklahoma, USA
Rashidi, B.
Rocsol Technologies Inc., Calgary, Alberta, Canada
Hareland, G.
Oklahoma State University, Stillwater, Oklahoma, USA
Copyright 2017 ARMA, American Rock Mechanics Association
This paper was prepared for presentation at the 51st US Rock Mechanics / Geomechanics Symposium held in San Francisco, California, USA, 25-28 June 2017. This paper was selected for presentation at the symposium by an ARMA Technical Program Committee based on a technical and critical review of the paper by a minimum of two technical reviewers. The material, as presented, does not necessarily reflect any position of ARMA, its officers, or members. Electronic reproduction, distribution, or storage of any part of this paper for commercial purposes without the written consent of ARMA is prohibited. Permission to reproduce in print is restricted to an abstract of not more than 200 words; illustrations may not be copied. The abstract must contain conspicuous acknowledgement of where and by whom the paper was presented.
ABSTRACT: Geomechanical properties are important for reservoir characterization and optimal stimulation design in the oil and gas
industry. The conventional techniques, such as laboratory core analysis and downhole acoustic/wireline logging can be expensive and
sometimes uncertain to process for unconventional reservoirs. In this study, a convenient and cost-effective technology is presented
that uses routinely available drilling data to calculate the geomechanical properties without the need for downhole logging operations.
A wellbore friction model is used to estimate the coefficient of friction and effective downhole weight on bit (DWOB) from the
routinely collected drilling data. The inverted rate of penetration (ROP) models use the estimated downhole weight on bit and
formation lithology constants to calculate the geomechanical properties throughout the horizontal reservoir formations such as confined
compressive strength (CCS), unconfined compressive strength (UCS), Young’s modulus, permeability, porosity and Poisson’s ratio. In
this article, the field case study is presented for a sample North American well applied to the lower Eagle Ford formation. The calculated
geomechanical property log is also verified with tests performed on cores in reservoir rock formations.

In this article, a convenient data-driven logging
technology is presented that uses the wellbore friction and
inverted ROP models to calculate rock mechanical
properties, such as confined compressive strength (CCS),
unconfined compressive strength (UCS) and Young’s
modulus. In addition, the geomechanical reservoir
properties which include permeability, porosity and
Poisson’s ratio are obtained from the calculated rock
strenghts and lithology specific constants. The logging
technology is basically composed of two applications, D-
WOB and D-ROCK as illustrated in Figure 1.
Fig. 1. Overview of data-driven logging technology
The routinely acquired time- and depth-based drilling
data along with drill string information and survey data
are the inputs D-WOB software. The outputs from the D-
WOB, drill bit data, mud information and formation
lithology are the inputs to the D-ROCK software to obtain
the geomechanical property log. The mathematical
models and other correlations are discussed in the
following sections.
2. MATHEMATICAL MODELS
The wellbore friction model (T&D model) is used to
calculate coefficient of friction and DWOB in rotary
drilling mode and a sliding model is used when the
drilling is performed in a sliding mode. The inverted ROP
models and other correlations are then used to generate
geomechanical property logs.
2.1. Wellbore Friction Model The wellbore friction models (Fazalizadeh et al., 2010)
were developed by considering an element of the drill
string in the wellbore filled with drilling fluid and
wellbore geometry. The forces considered on the drill
string element are buoyed weight, axial tension, friction
force and normal force perpendicular to the contact
surface of the wellbore as shown in Fig. 2 (Tahmeen et
al., 2014).
Fig. 2. Force balance on drill string elements
Figure 2 (a) and Figure 2 (b) represent the drill string
element with straight inclined section and curved section
respectively. The buoyed weight of drill string element is
calculated as:
LwW (1)
For a straight inclined section, the force balance on a
drill string element when the bit is off-bottom is:
bt FLwF sincos (2)
For a curved section in tension, the force balance on a
drill string element is:
eFLwF b
bt
bt
bt
bt
tcoscos
sinsin
(3)
where,
btbtbt coscoscossinsincos (4)
For a curved section in compression, the force balance
on a drill string element (Johancsik et al., 1984) is:
bnbt
t FFLwF
2cos (5)
▪ Downhole WOB
(DWOB) in
DRILL File
▪ Friction
Coefficient
Drill bit data, Mud
information,
Laboratory
Triaxial Data
D-WOB Software
Time- and Depth-based Drilling data, Drill
string and Survey data
▪ Rock Strengths (CCS & UCS)
▪ Young’s Modulus
▪ Porosity
▪ Permeability
▪ Poisson’s Ratio
Wellbore
Friction
(T&D) Model
and Sliding
Model
D-ROCK Software
Inverted ROP
Model and
other
correlations
Ftop
Fbottom
W
(a)
Fn Fbottom
W
2
Ftop
(b)
Ftop
Fbottom
W
(a)
Ftop
Fbottom
W
Ftop
Fbottom
W
(a)
Fn Fbottom
W
2
Ftop
(b)
Fn Fbottom
W
2
Ftop
Fn Fbottom
W
2
Ftop
Fn Fbottom
W
2
Ftop
(b)

where,
21
2
2
2sin
2sin
bt
btb
btbtb
n
Lw
F
F
F
(6)
The above equations are used to calculate the coefficient
of friction when the drill bit is off-bottom as well as
DWOB when the drill bit is on-bottom, respectively.
2.2. Inverted ROP Models and Other Correlations The developed ROP models for PDC and Rollercone drill
bits take into account the effects of bit wear, drilling
parameters, such as pump flow rate and RPM, and drill
bit cutting structure (Hareland and Nygaard, 2007)
(Rashidi et al., 2015) (Kerkar et al., 2014). By inverting
and rearranging the ROP models, the rock confined
compressive strength (CCS) can be defined as follows:
1
11
1
a
xfxcb
BWhRPMDWOBK
ROPCCS
(7)
The unconfined compressive strength (UCS) and Young’s
modulus (E) are defined as,
SbcS Pa
CCSUCS
1 (8)
EbcE PaCCSE 1 (9)
Here, 𝑎𝑆, 𝑏𝑆, 𝑎𝐸 and 𝑏𝐸 are formation constants calculated
using laboratory triaxial test data on reservoir core
samples.
The porosity and UCS correlation for shale formation was
obtained from various shale cores and cuttings analysis
(Cedola et al., 2017a) as:
2
1k
UCSk
(10)
The permeability and porosity correlation for the lower
Eagle Ford shale formation was obtained from trendline
analysis as given below:
4
3k
P kK (11)
The values of 𝑘1, 𝑘2, 𝑘3 and 𝑘4 calculated for the lower
Eagle Ford formation are 92.529, 0.63, 4.0302 and
2.5313, respectively. Eq. (7) to Eq. (11) are used to
generate a complete geomechanical property log for
horizontal wells drilled in the lower Eagle Ford reservoir
only. The formation constants used in Eq. (8) to Eq. (11)
need to be calculated for different formations and
reservoirs.
3. INPUTS FOR ROCK STRENGTH ANALYSIS
The following inputs are required for the D-WOB software
to estimate coefficient of friction and downhole WOB:
• Drilling data: date & time, measured/hole depth,
bit depth, weight on bit (WOB), hook load, rate of
penetration (ROP), rotary RPM, stand pipe
pressure (SPP), flow rate, differential pressure and
pore pressure
• Survey data: measured depth, true vertical depth
(TVD), inclination and azimuth
• Drill string configuration: lengths, inner diameter,
outer diameter and unit weights of drill string
sections such as, bit and bottom hole assembly
(BHA) components, drill pipes (DP) and heavy
weight drill pipes (HWDP)
• Additional data: weight of travelling block,
number of lines, single sheave efficiency and mud
weight
The D-ROCK software uses the following inputs to
calculate rock strengths and rock geomechanical ptoperties
including porosity, permeability and Poisson’s ratio:
• Drill data: output data file from D-WOB including
measured/hole depth, TVD, downhole weight on
bit, ROP, RPM, SPP, flow rate, pore pressure and
mud weight
• Drill bit data: type of drill bit (PDC or Rollercone),
bit diamater, IADC code, bit wear in and wear out,
number and diameter of bit nozzles
• Mud and formation data: drilling mud type (water
or oil), mud motor constants and type of formation
• Laboratory triaxial data: confining pressure, CCS,
average UCS and Young’s modulus
In this article, the field case study is presented for a sample
North American well applied to the lower Eagle Ford
formation. A well with doglegs up to 10 degrees per 30m
and heel at around 2580m is presented and the analysis was
performed for the depth interval from 2640m to 3460m in
the horizontal section. The wellbore geometry used for
this rock strength analysis was identified from the
directional survey measurements of this horizontal well
and is depicted in Figure 3.
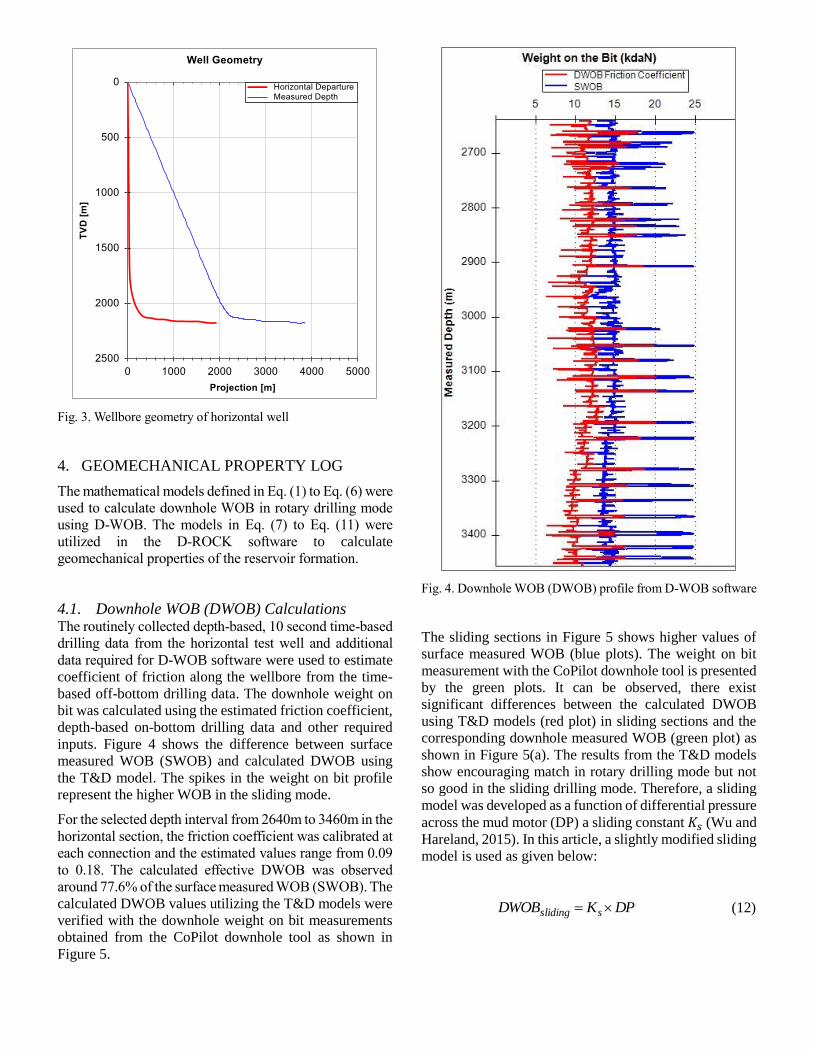
Fig. 3. Wellbore geometry of horizontal well
4. GEOMECHANICAL PROPERTY LOG
The mathematical models defined in Eq. (1) to Eq. (6) were
used to calculate downhole WOB in rotary drilling mode
using D-WOB. The models in Eq. (7) to Eq. (11) were
utilized in the D-ROCK software to calculate geomechanical properties of the reservoir formation.
4.1. Downhole WOB (DWOB) Calculations The routinely collected depth-based, 10 second time-based
drilling data from the horizontal test well and additional
data required for D-WOB software were used to estimate
coefficient of friction along the wellbore from the time-
based off-bottom drilling data. The downhole weight on
bit was calculated using the estimated friction coefficient,
depth-based on-bottom drilling data and other required
inputs. Figure 4 shows the difference between surface
measured WOB (SWOB) and calculated DWOB using
the T&D model. The spikes in the weight on bit profile
represent the higher WOB in the sliding mode.
For the selected depth interval from 2640m to 3460m in the
horizontal section, the friction coefficient was calibrated at
each connection and the estimated values range from 0.09
to 0.18. The calculated effective DWOB was observed
around 77.6% of the surface measured WOB (SWOB). The
calculated DWOB values utilizing the T&D models were
verified with the downhole weight on bit measurements
obtained from the CoPilot downhole tool as shown in
Figure 5.
Fig. 4. Downhole WOB (DWOB) profile from D-WOB software
The sliding sections in Figure 5 shows higher values of
surface measured WOB (blue plots). The weight on bit
measurement with the CoPilot downhole tool is presented
by the green plots. It can be observed, there exist
significant differences between the calculated DWOB
using T&D models (red plot) in sliding sections and the
corresponding downhole measured WOB (green plot) as
shown in Figure 5(a). The results from the T&D models
show encouraging match in rotary drilling mode but not
so good in the sliding drilling mode. Therefore, a sliding
model was developed as a function of differential pressure
across the mud motor (DP) a sliding constant 𝐾𝑠 (Wu and
Hareland, 2015). In this article, a slightly modified sliding
model is used as given below:
DPKDWOB ssliding (12)

Fig. 5. Comparison of calculated DWOB with the measurement
from CoPilot downhole tool
The sliding constant 𝐾𝑠, is obtained from the relationship
of differential pressure (DP) and the corresponding T&D
model based DWOB estimated during the immediate
rotary drilling process. In the sliding mode, the calculated
DWOB using the sliding model (𝐷𝑊𝑂𝐵𝑠𝑙𝑖𝑑𝑖𝑛𝑔) showed
better agreement with the downhole measured WOB data
as presented in Figure 5(b). In Figure 5(b), the red plot
(DWOB-Sliding Model) represents the DWOB calculated
from the T&D model and sliding model for rotary drilling
and sliding drilling mode in the horizontal section of the
well, respectively.
4.2. Rock Strength Log Generation The output from the D-WOB software was applied to the
PDC or Rollercone inverted ROP drill bit models with
several bit parameters and used in the D-ROCK software
to generate rock strength log. In this paper, the drilling
data of a sample horizontal well in the lower Eagle Ford
formation was used and the outputs were analyzed to
illustrate the capabilities of the D-ROCK software. The
formation constants required to obtain the geomechanical
properties were calculated from the laboratory test data on
lower Eagle Ford formation cores. In Figure 6, the
unconfined compressive strength (UCS) and Young’s
modulus logs were generated utilizing DWOB calculated
from the combined models for both rotary drilling and
sliding mode.
Fig. 6. UCS and Young’s modulus logs from D-ROCK software
The decreasing UCS profile after 2900 m indicates softer
formation towards the toe of the wellbore in horizontal
section. In this case study, the average values of UCS and
Young’s modulus were found to be 102.48 MPa and 28.21
GPa, respectively. Sone reports Young’s modulus values
for the lower Eagle Ford in the range from 25 to 34 GPa
(Sone, 2012).
In this study, the geomechanical properties of Eagle Ford
shale formation including porosity, permeability and
Poisson’s ratio were investigated to verify the D-ROCK
models as defined in Eq. (10) and Eq. (11). The rock
failure envelope for the lithology specific to lower Eagle
Ford constants was used to calculate the rock failure angle
and Poisson’s ratio (Hareland and Hoberock, 1993). The
regression analysis of Eq. (8) and Eq. (9) were performed
to calculate the formation constants utilizing the
(a) (b)
Sliding
Sliding
Sliding

mechanical test data for the Eagle Ford formation (Hu et
al., 2014) as shown in Figure 7.
The porosity vs. permeability relationships obtained from
the D-ROCK software were verified with the reported
upper and lower bound trends of the Eagle Ford formation
(Ramirez and Aguilera, 2016) (Aguilera, 2014) as depicted
in Figure 8.
Fig. 7. Laboratory data analysis to obtain constants for the Eagle
Ford formation
Fig. 8. Porosity and permeabilty relationships for Eagle Ford
formation
In Figure 8, the permeability vs. porosity relationship
generated from the D-ROCK models (blue triangles)
indicated the location of the horizontal well near the lower
Eagle Ford formation. A shale formation in Columbia is
also plotted for comparison purposes.
The porosity, permeability and Poisson’s ratio vs.
measured depth for the lower Eagle Ford formation are
also shown in Figure 9 and Figure 10, respectively.
Fig. 9. Permeabilty and porosity vs. measured depth for Eagle
Ford formation
The higher porosity was observed at several depth intervals
and indicates possible sweet spots in the lower Eagle Ford
shale reservoir.
In future studies, the porosity model in D-ROCK for shale
formation will be improved by incorporating gamma ray
porosity correlations (Cedola et al., 2017b) for more
accurate analysis of the geomechanical properties in
unconventional shale reservoirs.

Fig. 10. Poisson’s ratio vs. depth for Eagle Ford formation
5. CONCLUSIONS
In this article, a convenient and cost effective logging
technology was presented to obtain complete
geomechanical property log from the routinely acquired
drilling data in a sample horizontal well drilled through
unconventional shale reservoir. The wellbore friction
model and inverted ROP models were utilized to calculate
the coefficient of friction along the wellbore, effective
downhole weight on bit and rock geomechanical
properties, respectively. A good agreement was observerd
between the estimated downhole weight on bit and the
weight on bit obtained using a downhole measuring tool
(CoPilot). The calculated geomechanical property log was
compared to actual laboratory determined rock properties
and therefore reveals the validation of this convenient well
logging technique.
The information in the rock property logs can be used as
inputs to map sweet spots and optimize the hydraulic
fracturing process for maximize well productivity and NPV
(Net Present Value). The geomechanical property logs
generated from this data-driven technology can potentially
lead to optimized completion and stimulation design of
the shale reservoir, using only drilling data collected
during normal drilling operations at no additional cost.
6. NOMENCLATURE
𝑎1, 𝑏1, 𝑐1: drill bit constants
𝑎𝑆, 𝑏𝑆, 𝑎𝐸 , 𝑏𝐸: formation constants obtained from
regression analysis
𝐵𝑥: function of drill bit properties
𝐷𝑏: diameter of bit
𝐸: Young’s modulus
𝐹𝑡, 𝐹𝑏: force or hook load at top and bottom, respectively
𝐹𝑛: net normal force acting on the drill string element
ℎ𝑥: hydraulic efficiency function
𝐾: empirical constant in ROP model
𝐾𝑝: permeability
𝐾𝑠: sliding model constant
∆𝐿: element length of drill string
𝑃𝑐: confining pressure
w: unit weight of drill string element
W: buoyed weight
𝑊𝑓: bit wear function
𝛼𝑡, 𝛼𝑏: inclination at top and bottom, respectively
𝛽: buoyancy factor
𝜇: coefficient of friction
𝜑𝑡, 𝜑𝑏: azimuth at top and bottom, respectively
𝜃: dogleg angle
𝜙: porosity
REFERENCES
1. Aguilera, R. 2014. Flow units: from conventional to
tight-gas to shale-gas to tight-oil to shale-oil reservoirs.
SPE Reservoir Evaluation & Engineering, May,
University of Calgary, Calgary, Canada, 2014.
2. Cedola, A. E., Atashnezhad, A. and Hareland, G. 2017a.
Evaluating multiple methods to determine porosity
from drilling data. SPE Oklahoma City Oil and Gas
Symposium, 27-30 March, Oklahoma City, Oklahoma,
USA, 2017.
3. Cedola, A. E., Atashnezhad, A. and Hareland, G. 2017b.
Real-time porosity from surface drilling data prediction

and verification. AADE-17-NTCE-134, 2017 AADE
National Technical Conference and Exhibition, 11-12
April, Houston, Texas, USA, 2017.
4. Eshkalak, M.O., Mohaghegh, S. D. and Esmaili, S.
2013. Synthetic, geomechanical logs for Marcellus
shale. 2013 SPE Digital Energy Conference and
Exhibition, Woodlands, Texas, USA, 5-7 March, 2013.
5. Fazaelizadeh, M., Hareland, G. and Aadnoy, B. S. 2010.
Application of new 3-D analytical model for directional
wellbore friction. Modern Applied Science, 4: 2, 2-22
6. Hareland, G. and Nygaard, R. 2007. Calculating
unconfined rock strength from drilling data. ARMA-07-
214, 1st Canada-US Rock Mechanics Symposium, 27-31
May, Vancouver, Canada, 2007.
7. Hareland, G. and Hoberock, L. 1993. Use of drilling
parameters to predict in-situ stress bounds. SPE 25727,
SPE/IADC Drilling Conference, Amsterdam,
Netherlands, 1993.
8. Hu, D., Matzar, L. and Martysevich, V. 2014. Effect of
natural fractures on Eagle Ford shale mechanical
properties. SPE-170651-MS, SPE Annual Technical
Conference and Exhibition, 27-29 October, Amsterdam,
The Netherlands, 2014.
9. Johancsik, C. A., Friesen, D. B. and Dawson, R. 1984.
Torque and drag in directional wells – prediction and
measurement. J. of Petroleum Technology, SPE 11380,
987-992.
10. Kerkar, P., Hareland, G., Fonseca, E., Hackbarth, C.,
2014. Estimation of Rock Compressive Strength Using
Downhole Weight-On-Bit and Drilling Models. IPTC
17447, International Petroleum Technology
Conference, 20-22 January, Doha, Qatar, 2014.
11. Ramirez, J. F. and Aguilera, R. 2016. Factors
controlling fluid migration and distribution in the Eagle
Ford shale. SPE Reservoir Evaluation & Engineering,
August, University of Calgary, Calgary, Canada, 2016.
12. Rashidi, B., Hareland, G., Wu, Z., 2015. Performance,
Simulation and Field Application Modeling of
Rollercone Bits. J. of Petroleum Science and
Engineering, 133-(2015) 507-517
13. Sone, H., 2012, Mechanical properties of shale gas
reservoir rocks and its relation to the in-situ stress
variation observed in shale gas reservoirs: Ph.D. thesis,
Stanford University.
14. Tahmeen, M., Hareland, G. and Aadnoy, B. S. 2014.
Real-time software to estimate friction coefficient and
downhole weight on bit during drilling of horizontal
wells. ASME 2014 33rd International Conference on
Ocean, Offshore and Arctic Engineering, OMAE2014,
June 8-13, San Francisco, California, USA, 2014.
15. Wu, Z. A. and Hareland, G. 2015. Real-time downhole
weight on bit (DWOB) automation in directional
drilling. ASME 2015 34th International Conference on
Ocean, Offshore and Arctic Engineering, OMAE2015,
May 31-June 5, St. John’s, Newfoundland, Canada,
2015.