Embed Size (px)
Citation preview

Complete CollegeOCCC
OCCC Course Success Overview Fall 2013 Highlights
Office of Institutional EffectivenessFebruary 12, 2014
Presentation By:Matt Eastwood

2
What is success?
- Adopting definitions used by Achieving the Dream, course success is defined as a student earning a(n) A, B, C or S as their final grade in a course.
What is a success rate?- The number of students in a given population that received an A, B, C or S as percent of the entire population. Students receiving an Incomplete grade or Auditing the course were not included in the aggregate.

2
2006 2007 2008 2009 2010 2011 2012 201360.0%62.0%64.0%66.0%68.0%70.0%72.0%74.0%76.0%78.0%80.0%
0
50,000
100,000
150,000
200,000
250,000
300,000
350,000
68.5% 69.2% 70.0% 69.7%68.5%
67.2% 68.1% 68.8%
238,929 234,092 236,502 240,448277,062 291,072 286,378
263,068
Campus Wide Success Rates and Credit Hours Generated by Fiscal Year(FY 2006 through FY 2013)
Success Rate Total Credit Hours
A B C S D F W U
33.2%
22.4%
12.6%
0.6%4.2%
13.2% 13.5%
0.3%
Fiscal Year 2013 Grade Distribution- Year over year percent change in credit hours was -8.1%.
- OCCC course success increased by .7 percentage points since last year.
- Since 2006, the percentage of F grades has increased 3 percentage points and the percentage of W grades has decreased by the same amount.

4
2005 2006 2007 2008 2009 2010 2011 2012 201360.0%
62.0%
64.0%
66.0%
68.0%
70.0%
72.0%
74.0%
76.0%
78.0%
80.0%
67.1% 67.1% 67.8% 68.2%67.1%
65.8% 65.8%66.7%
68.3%67.5% 68.2%
69.7% 69.2%
67.0%65.8%
67.8%68.6%
78.5% 78.2% 78.3% 77.6% 78.3%
75.3% 75.9% 75.9%
79.4%
Campus Wide Success Rates by Semester(FY 2006 through FY 2013 so far)
Fall Success Rates Spring Success Rates Summer Success Rates
5
2009 2010 2011 2012 201360.0%61.0%62.0%63.0%64.0%65.0%66.0%67.0%68.0%69.0%70.0%
35,00036,00037,00038,00039,00040,00041,00042,00043,00044,00045,000
67.1%
65.8% 65.8%
66.7%
68.3%
41,400
43,618 43,312
39,317
36,519
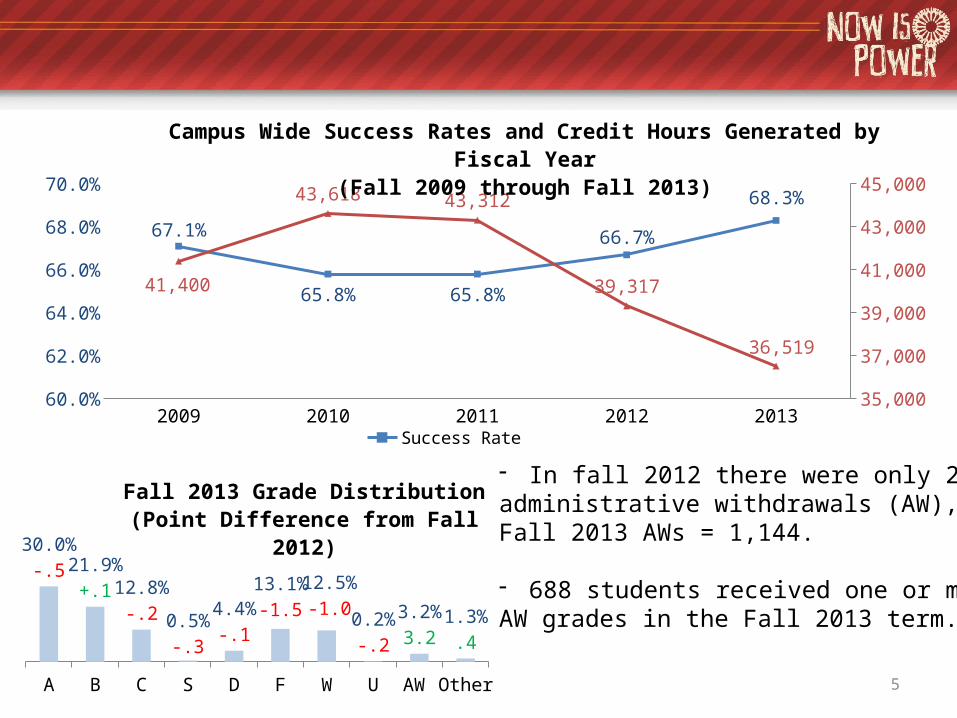
Campus Wide Success Rates and Credit Hours Generated by Fiscal Year(Fall 2009 through Fall 2013)
Success Rate Total Credit Hours
A B C S D F W U AW Other
30.0%-.5
21.9%+.1
12.8%-.2
0.5%-.3
4.4%-.1
13.1%-1.5
12.5%-1.0
0.2%-.2
3.2%3.2
1.3%.4
Fall 2013 Grade Distribution (Point Dif-ference from Fall 2012)
- In fall 2012 there were only 2 administrative withdrawals (AW), forFall 2013 AWs = 1,144.
- 688 students received one or more AW grades in the Fall 2013 term.

6
10633; 27%
3619; 9%
2824; 7%
2424; 6%
11687; 30%
8130; 21%
Division Level Breakdown of Enrollment Distributions - Fall 2012
Arts-Hum Business Health IT Sci and MathSocial Sci
4112; 11%
3007; 8%
4031; 11%6064; 17%
2888; 8%
1922; 5%
6944; 19%
7551; 21%
Division Level Breakdown of Enrollment Distributions - Fall 2013
Arts Business Chem & Bio Sci. English Health ITMEPS Social Sci.
Division Fall 2013 - Success RateArts 73.4%Business 72.1%Chemistry and Biological Sciences 62.1%English and Humanities 66.8%Health Professions 84.7%Information Technologies 69.0%Math-Engineering and Physical Sciences 63.5%Social Sciences 67.2%
Division Level Success Rates and Enrollment Distributions

7
2009 2010 2011 2012 201350%
55%
60%
65%
70%
75%
80%
50.5% 51.5% 58.5%60.7% 60.6%
68.2%66.5%
65.0%
65.6%67.6%
72.3% 71.2% 71.4% 72.8% 73.4%
Campus Wide Success Rates by Course Level (FY 2006 through FY 2013)
Developmental 1000 Level 2000 Level
11%
65%
24%
Campus Breakdown of Enrollments by Course Level - Fall 2013
Developmental 1000 Level 2000 Level
Course Level
Fall 2009 Fall 2013 Percent Difference
0000 Level 13.0 10.8 -2.21000 Level 63.2 65.4 2.22000 Level 26.8 23.9 +0.1
Campus Breakdown of Enrollments by Course Level - FY 2013 vs. FY 2006
8
2009 2010 2011 2012 201340%
45%
50%
55%
60%
65%
70%
47.1%
53.5%62.5% 63.6% 63.5%
58.3%
51.4% 51.3%
54.8%52.3%
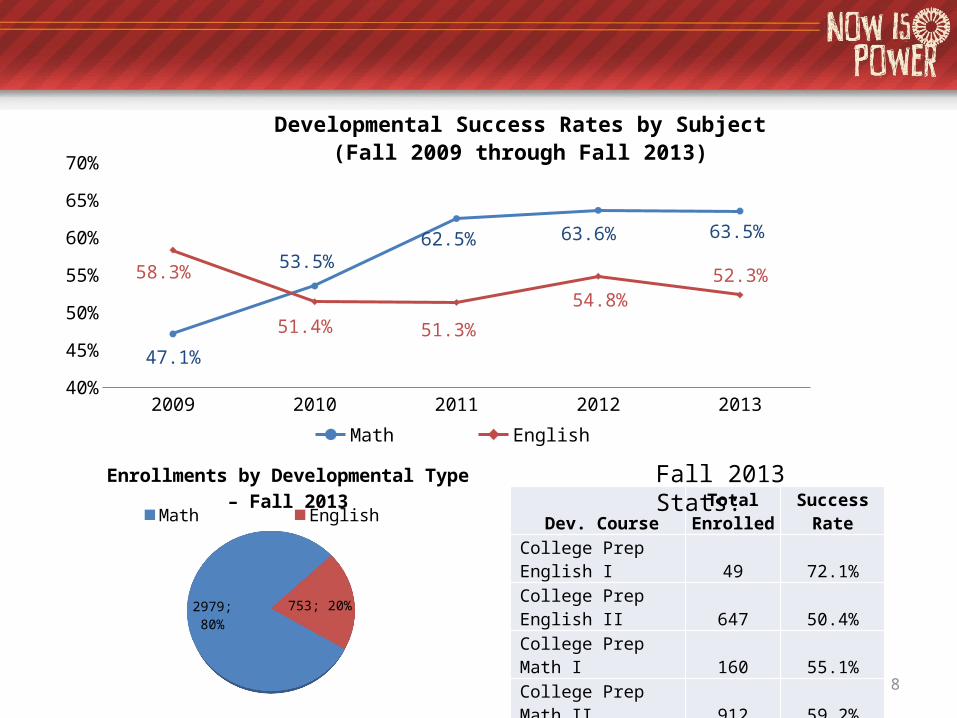
Developmental Success Rates by Subject(Fall 2009 through Fall 2013)
Math English
2979; 80% 753; 20%
Enrollments by Developmental Type – Fall 2013
Math English Dev. CourseTotal
Enrolled Success RateCollege Prep English I 49 72.1%College Prep English II 647 50.4%College Prep Math I 160 55.1%College Prep Math II 912 59.2%College Prep Math III 915 62.5%College Prep Math IV 809 69.2%
Fall 2013 Stats:

9
2009 2010 2011 2012 201340%45%50%55%60%65%70%75%80%
65.5% 67.7%63.7% 64.1%
74.6%
0.494
0.572 0.569
SCL-1001 SCL-1003
- Between fall 2009 and fall 2013, SCL online enrollment as a percent of total SCL enrollment has essentiallyRemained flat (29% versus 30%).
2009 2010 2011 2012 201340%45%50%55%60%65%70%75%80%
61.9% 64.5%60.0% 57.5%
63.4%
66.8% 69.0%63.0%
66.3%
75.1%
SCL - Online SCL Traditional
Success in College and Life - Success Rates(Fall 2009 through Fall 2013)
Fall - All Enrollments2009 2,1772010 2,1712011 2,2632012 1,7292013 1,502
Fall - Online Enrollments2009 6202010 6442011 6402012 6082013 447

10
2009 2010 2011 2012 201350%
55%
60%
65%
70%
75%
80%
60.3% 60.7%59.1% 59.6% 65.1%
68.2% 66.7% 67.1% 68.3% 69.1%
Campus Success Rates by Online and Traditional Courses(Fall 2009 through Fall 2013)
Online Traditional
2009 2010 2011 2012 201310%20%30%40%50%60%70%80%90%
16.2% 17.3% 19.0% 19.3% 21.8%
83.8% 82.7% 81.0% 80.7% 78.2%
Campus Enrollment Rates by Online and Traditional Courses(Fall 2009 through Fall 2013)
Online Traditional
15.0%
24.2%
60.8%
Fall 2013 – Course DistributionOnline Mixed Traditional
11
2009 2010 2011 2012 201350%
60%
70%
80%
90%
100%
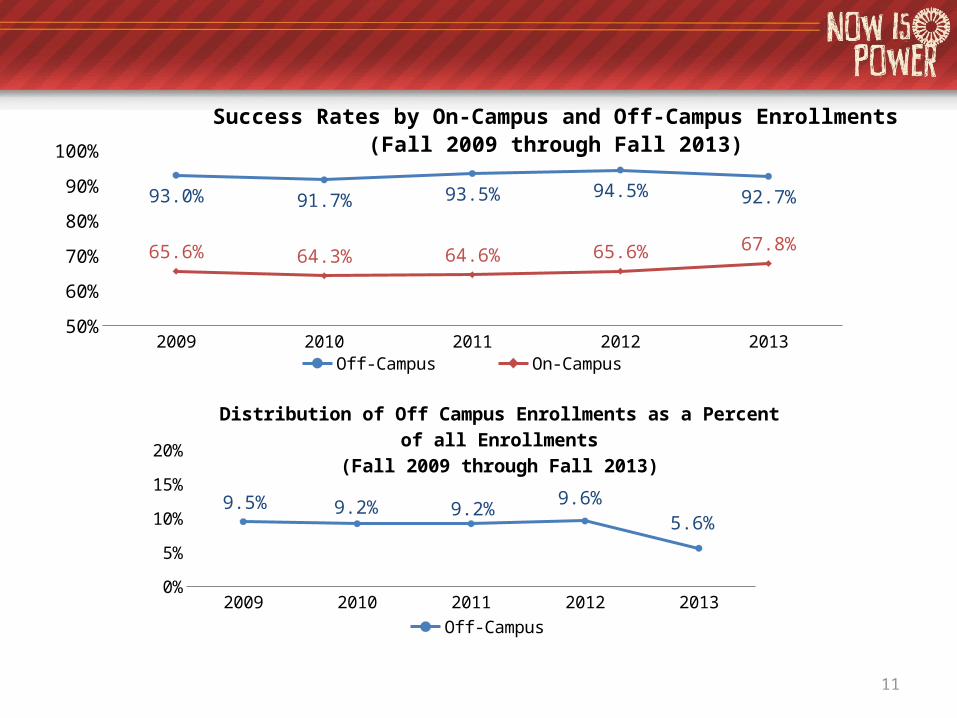
93.0% 91.7% 93.5% 94.5% 92.7%
65.6% 64.3% 64.6% 65.6% 67.8%
Success Rates by On-Campus and Off-Campus Enrollments(Fall 2009 through Fall 2013)
Off-Campus On-Campus
2009 2010 2011 2012 20130%
5%
10%
15%
20%
9.5% 9.2% 9.2% 9.6%5.6%
Distribution of Off Campus Enrollments as a Percent of all Enrollments(Fall 2009 through Fall 2013)
Off-Campus

12
2009 2010 2011 2012 201360%
65%
70%
75%
80%
85%
90%
95%
100%
85.6% 86.5%84.4%
86.5%
93.6%
85.8% 80.5%
74.0%78.1%
84.8%
65.3% 65.1% 65.8% 67.0%69.7%
66.6% 65.3% 65.4% 66.2% 67.5%
Campus Success Rates by Course Duration(Fall 2009 through Fall 2013)
Two Weeks Five Weeks Eight Weeks Sixteen Weeks
0.8%1.6%
14.2%83.4%
Enrollments by Course Duration – Fall 2013Two Five Eight Sixteen

13
2009 2010 2011 2012 201360%62%64%66%68%70%72%74%76%78%80%
63.9%62.2% 62.9%
64.2%
66.9%64.0%63.1%
64.8%65.9%
67.0%
69.6%68.4% 68.3% 67.9%
70.3%
Campus Success Rates by Time of Day(Fall 2009 through Fall 2013)
Morning Afternoon Evening
Afternoon Evening Morning Online Weekend Unknown0.0%5.0%
10.0%15.0%20.0%25.0%30.0%35.0%40.0%
19.1% 18.5%
35.3%
21.8%
1.7% 4.0%
19.5% 18.6%
35.1%
16.0%
3.0% 7.8%
Enrollments by Time of Day – Fall 20132013 2009

14
2009 2010 2011 2012 201350%
55%
60%
65%
70%
75%
80%
63.7%60.7% 65.1%
65.1%65.1%
61.1%58.5% 59.4% 60.8%
64.9%
63.9% 64.0% 64.3%64.9%
67.0%
Campus Success Rates by Days Each Week(Fall 2009 through Fall 2013)
MW MWF TTH
6.6% 5.4% 5.6% 4.2% 2.2% 2.3% 0.5%
27.6% 34.9%
0.2%9.8%
0.5% 0.5%
73.3% 74.2% 72.0% 70.7% 64.6%75.5% 82.1%
65.1% 67.0%
87.4%
64.9%80.9%
95.5%Fall 2013 Days of Week Enrollment Distribution and Success (Traditional only)

15
2009 2010 2011 2012 201330%35%40%45%50%55%60%65%70%75%80%
63.7%60.8% 60.3% 60.5%
64.0%
34.0% 34.7% 35.3% 35.1% 37.8%
All Large General Education Courses - Enrollments and Success Rates(Fall 2013 through Fall 2013)
Overall Success Percent of all Campus Enrollments
- These courses consist of any general education course with more than 800 enrollments during last fiscal year. 14 courses met this threshold.

16
2009 2010 2011 2012 20130
1,000
2,000
3,000
4,000
5,000
6,000
50.0%
55.0%
60.0%
65.0%
70.0%
75.0%
80.0%
2,169
2,433 2,358 2,035 1,880
65.1%
57.2% 58.2%
65.2%67.3%
Gateway Course – U.S. History Pre/Post Civil War - Enrollments and Success Rates(Fall 2009 though Fall 2013)
Enrollments Overall Success
Course Success Summary – Fall 2013
All Traditional Online 8 Week 16 Week
Success: 67.3% 67.7% 66.2% 52.5% 67.3%
# of Enrollments 1,880 1,474 406 48 1,775

17
2009 2010 2011 2012 20130
500
1,000
1,500
2,000
2,500
3,000
50.0%
55.0%
60.0%
65.0%
70.0%
75.0%
80.0%
2,114 2,325 2,3371,957 2,111
61.8%
60.1% 60.7% 59.6%
63.8%
Gateway Course – English Composition I - Enrollments and Success Rates(Fall 2009 though Fall 2013)
Enrollments Overall Success
Course Success Summary – Fall 2013
All Traditional Online 8 Week 16 Week
Success: 63.8% 65.2% 56.7% 59.2% 63.7%
# of Enrollments 2,111 1,672 394 124 1,947

18
2009 2010 2011 2012 20130
500
1,000
1,500
2,000
2,500
3,000
50.0%
55.0%
60.0%
65.0%
70.0%
75.0%
80.0%
1,250 1,255 1,1881,025 1,080
66.1%69.2%
64.5%66.5%
70.5%
Gateway Course – English Composition II - Enrollments and Success Rates(Fall 2009 though Fall 2013)
Enrollments Overall Success
Course Success Summary – Fall 2013
All Traditional Online 8 Week 16 Week
Success: 70.5% 69.3% 70.3% 59.2% 63.7%
# of Enrollments 1,080 706 281 124 1,947
19
2009 2010 2011 2012 20130
500
1,000
1,500
2,000
2,500
3,000
50.0%
55.0%
60.0%
65.0%
70.0%
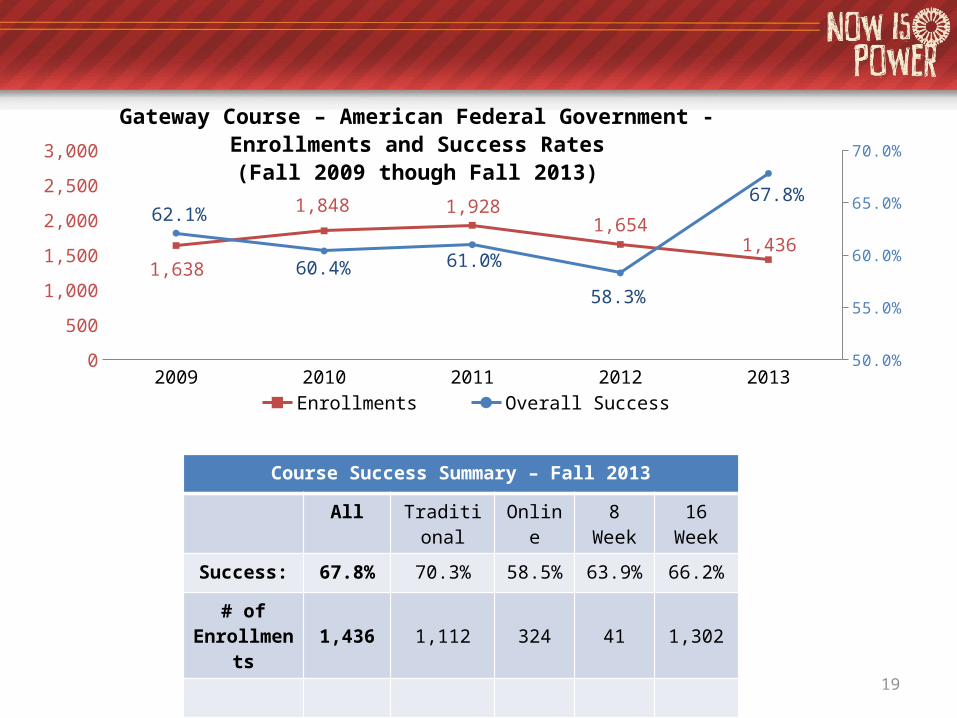
1,638
1,848 1,9281,654
1,436
62.1%
60.4% 61.0%
58.3%
67.8%
Gateway Course – American Federal Government - Enrollments and Success Rates(Fall 2009 though Fall 2013)
Enrollments Overall Success
Course Success Summary – Fall 2013
All Traditional Online 8 Week 16 Week
Success: 67.8% 70.3% 58.5% 63.9% 66.2%
# of Enrollments 1,436 1,112 324 41 1,302

20
2009 2010 2011 2012 20130
200400600800
1,0001,2001,4001,6001,8002,000
50.0%
55.0%
60.0%
65.0%
70.0%
1,109
1,061 1,081
1,219 1,233
59.5%
61.2% 61.6%
60.6% 60.9%
Gateway Course – College Algebra - Enrollments and Success Rates(Fall 2009 though Fall 2013)
Enrollments Overall Success
Course Success Summary – Fall 2013
All Traditional Online 8 Week 16 Week
Success: 60.9% 62.8% 51.1% 57.2% 61.4%
# of Enrollments 1,233 1,034 199 139 1,094

21
2009 2010 2011 2012 20130
200400600800
1,0001,2001,4001,6001,8002,000
50.0%
55.0%
60.0%
65.0%
70.0%
1,409 1,5191,692
1,457 1,408
64.7%58.2%
55.2%
56.2%57.5%
Gateway Course – Introduction to Psychology - Enrollments and Success Rates(Fall 2009 though Fall 2013)
Enrollments Overall Success
Course Success Summary – Fall 2013
All Traditional Online 8 Week 16 Week
Success: 57.5% 56.8% 60.3% 63.9% 66.2%
# of Enrollments 1,408 1,097 311 41 1,302
22
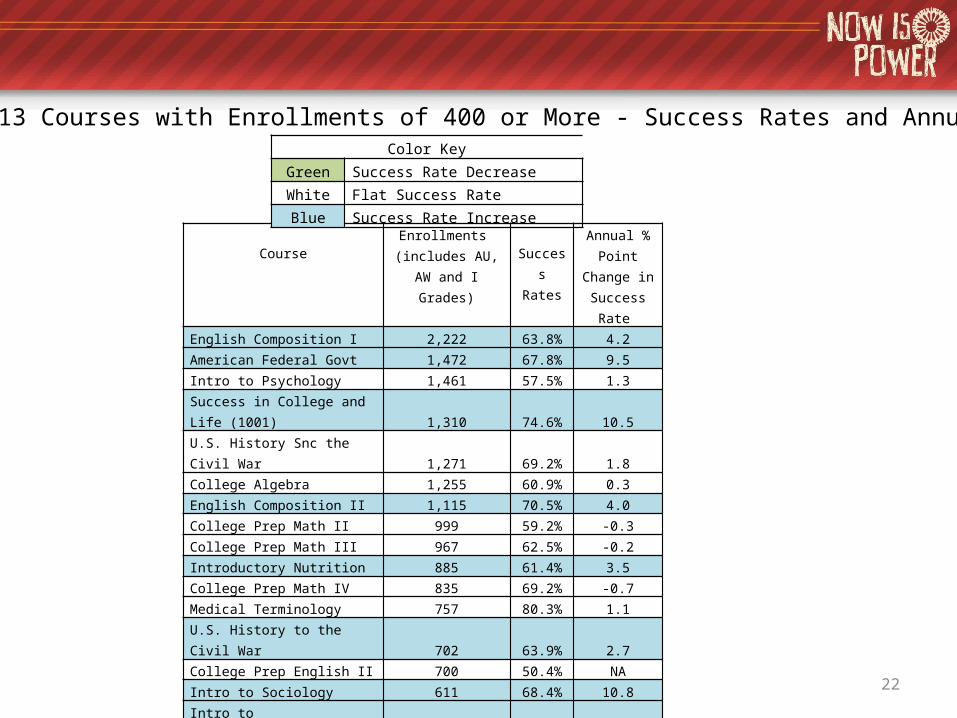
CourseEnrollments
(includes AU, AW and I Grades)
SuccessRates
Annual % Point Change
in Success Rate
English Composition I 2,222 63.8% 4.2American Federal Govt 1,472 67.8% 9.5Intro to Psychology 1,461 57.5% 1.3Success in College and Life (1001) 1,310 74.6% 10.5U.S. History Snc the Civil War 1,271 69.2% 1.8College Algebra 1,255 60.9% 0.3English Composition II 1,115 70.5% 4.0College Prep Math II 999 59.2% -0.3College Prep Math III 967 62.5% -0.2Introductory Nutrition 885 61.4% 3.5College Prep Math IV 835 69.2% -0.7Medical Terminology 757 80.3% 1.1U.S. History to the Civil War 702 63.9% 2.7College Prep English II 700 50.4% NAIntro to Sociology 611 68.4% 10.8Intro to Computers/Application 590 58.6% 4.0General Biology (non-Majors) 530 59.1% -0.3Developmental Psychology 510 80.6% 5.8Intro to Public Speaking 432 71.1% -3.1General Chemistry I 432 53.8% -5.2Music Appreciation 403 76.6% 5.4Mythology 400 80.5% 6.1
Color KeyGreen Success Rate DecreaseWhite Flat Success RateBlue Success Rate Increase
All Fall 2013 Courses with Enrollments of 400 or More - Success Rates and Annual Changes